Exemplar Examination Papers and Memorandums for...
114
Mathematics and Mathematical Literacy Exemplar Examination Papers and Memorandums for Grades 10 to 12 (NCS) These materials have been made possible through the kind support of Old Mutual
Transcript of Exemplar Examination Papers and Memorandums for...
Mathematics and
Mathematical Literacy
Exemplar Examination Papers and Memorandums for
Grades 10 to 12 (NCS)
These materials have been made possible through the kind support of Old Mutual
Mathematics and Mathematical Literacy Exemplar Examination Papers and Memorandums for Grades 10 to 12 (NCS) This guide has been developed for the Department of Education and Old Mutual by a team of Mathematics and Mathematical Literacy teachers. The project was co-ordinated by Brombacher and Associates.
Brombacher and Associates cc 94 Myburgh Road (021) 715-6161 (tel) Diepriver, 7800 (021) 715-4529 (fax) [email protected] 073-244-6488 (cell) www.brombacher.co.za
Department of Education Sol Plaatje House 123 Schoeman Street Private Bag X895 Pretoria 0001 South Africa Tel: +27 12 312-5911 Fax: +27 12 321-6770 120 Plein Street Private Bag X9023 Cape Town 8000 South Africa Tel: +27 21 465-1701 Fax: +27 21 461 8110 http://education.pwv.gov.za © 2007 Department of Education
i
The Department of Education has received many requests for examples of examinations for Grade 10, 11 and 12 Mathematics and Mathematical Literacy. This book is a response to those requests. The Department of Education wishes to thank Old Mutual for their generous support for this project. The Department would also like to thank the South African teachers and subject advisors who contributed to this valuable resource for our teachers.

ii
iii
TABLE OF CONTENTS
Page About this booklet ................................................................................................................ v Mathematics Examinations Grade 10 Paper 1......................................................................................................1 Grade 10 Paper 2......................................................................................................6 Grade 11 Paper 1....................................................................................................11 Grade 11 Paper 2....................................................................................................19 Grade 12 Paper 1....................................................................................................28 Grade 12 Paper 2....................................................................................................33 Mathematical Literacy Examinations Grade 10 ................................................................................................................44 Grade 11 Paper 1....................................................................................................51 Grade 11 Paper 2....................................................................................................58 Grade 12 Paper 1....................................................................................................64 Grade 12 Paper 2....................................................................................................72 Mathematics Memorandums Grade 10 Paper 1....................................................................................................81 Grade 10 Paper 2....................................................................................................82 Grade 11 Paper 1....................................................................................................84 Grade 11 Paper 2....................................................................................................86 Grade 12 Paper 1....................................................................................................89 Grade 12 Paper 2....................................................................................................92 Mathematical Literacy Memorandums Grade 10 ................................................................................................................95 Grade 11 Paper 1....................................................................................................97 Grade 11 Paper 2....................................................................................................99 Grade 12 Paper 1..................................................................................................101 Grade 12 Paper 2..................................................................................................103

iv
v
MATHEMATICS AND MATHEMATICAL LITERACY EXEMPLAR EXAMINATION PAPERS AND MEMORANDUMS
FOR GRADES 10 TO 12 (NCS)
ABOUT THIS BOOKLET The examination papers in this booklet are exemplar end-of-year examination papers. These papers have been developed by teachers of Mathematics and Mathematical Literacy in line with the requirements for the examinations as set out in the following documents: Subject Assessment Guideline: Mathematics (DoE, January 2007) Subject Assessment Guideline: Mathematical LIteracy (DoE, January 2007)
All of the papers are based on the Core Assessment Standards for the subjects as detailed in the Subject Assessment Guideline Documents. In developing the booklet the team of teachers have used the following as points of departure: 1. The lower-order questions asked for by the guidelines on examination setting in the
Subject Assessment Guidelines should be clearly visible to students writing the examinations. You will find that: Both of the Mathematics papers (paper 1 and Paper 2) have as Question 1 a
collection of short knowledge and basic application questions covering the full curriculum – all students should as a minimum be able to answer all of these questions.
The Grade 11 and Grade 12 Mathematical Literacy Paper 1 have a clearly marked Section A which consists of the knowledge and basic application questions that all students should find accessible.
The early questions in the Grade 10 Mathematical Literacy examination paper are all knowledge and basic application questions.
2. The use of language in developing context – especially in Mathematical Literacy – should be kept to a minimum so that students do not spend more time reading than they do answering the examination questions.
The following have not been included in the booklet and teachers who use these papers in their teaching may need to develop and include these for the papers: Cover pages and instructions sheets Diagram sheets (if necessary) Formulae sheets
Although every effort has been taken to minimise errors, it is possible that there are some. If you are working with the booklet and happen to come across any errors then please write to the developers ([email protected]) so that we can rectify these for future editions. It is hoped that you will find these papers useful as you prepare your students for examinations in Mathematics and Mathematical Literacy and also as you attempt to make sense of the curriculum statements for both subjects.

vi
Mathematics(NSC) /Grade 10/P1 1 Exemplar
Grade 10 Mathematics: Question Paper 1
MARKS: 100 TIME: 2 hours QUESTION 1
1.1 Write 111 as a decimal fraction.
(1) 1.2 Without the use of a calculator and showing all working, determine between
which two integers 39 lies.
(2) 1.3 A set of numbers is represented on the number line below:
1.3.1
-3 -2 -1 0 1 2 3 4
Use inequalities to describe the set of numbers. (2) 1.3.2 What is the smallest integer in this set of numbers? (1) 1.4 Factorise the following: 1.4.1 xx 32 − (2) 1.4.2 352 2 −− xx (2) 1.4.3 12 −−− xyyx (4) 1.4.4 83 +x (2) 1.5 Alongside is the graph of
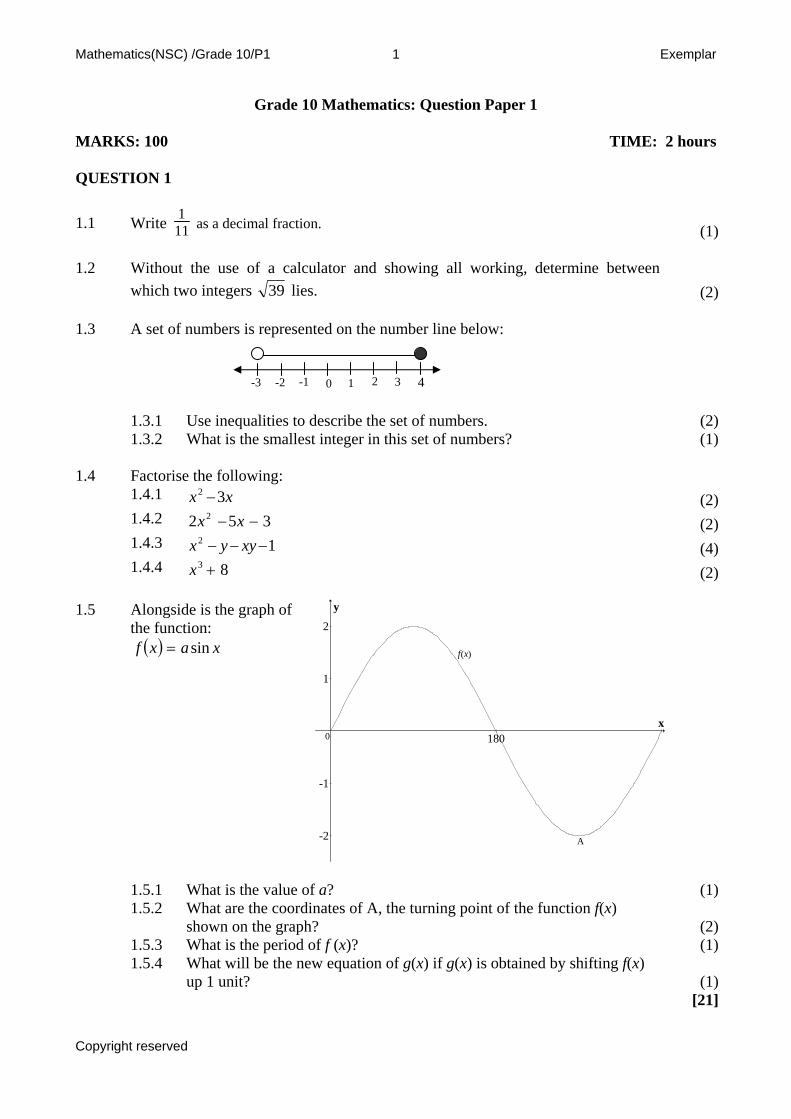
the function: ( ) xaxf sin=
1.5.1
180
-2
-1
1
2
x
y
0
A
f(x)
What is the value of a? (1) 1.5.2 What are the coordinates of A, the turning point of the function f(x)
shown on the graph?
(2) 1.5.3 What is the period of f (x)? (1) 1.5.4 What will be the new equation of g(x) if g(x) is obtained by shifting f(x)
up 1 unit?
(1) [21]
Copyright reserved
Mathematics(NSC) /Grade 10/P1 2 Exemplar
QUESTION 2 2.1 Simplify the following: 2.1.1 ( ) ( )22 2 +− xx (3) 2.1.2
512
23 +−
− xx
(4) 2.1.3
x
xx
183.2 121 −+
Answer must have positive indices only.
(4) 2.2 Solve the following equations: 2.2.1 ( )( ) 632 =−+ xx (5) 2.2.2 322 12 =+x (3) [19] QUESTION 3 3.1 The table below shows the Currency Cross Rates for 20/08/2007.
Currency $ R € £ ¥ 1 US ($) = 1 7,3597 0,7412 0,5036 113,7100 1 Rand = 0,1359 1 0,1007 0,0684 15,4504 1 Euro(€) = 1,3492 9,9297 1 0,6795 153,4175 1 UK(£) = 1,9857 14,6142 1,4718 1 225,7939 1 Japan(¥) = 0,0088 0,06472 0,0065 0,0044 1
3.1.1 How many South African rand will you get for 1$? (1) 3.1.2
If an item you chose to buy while in Paris cost €30, what factor would you multiply by to get an approximate cost in rand?
(1)
3.1.3 Calculate how many Japanese Yen you would receive if you converted
R600 to Yen? Answer to the nearest Yen.
(2) 3.1.4 Calculate how many pounds you would receive if you converted R600
to pounds?
(2) 3.2 R5 000 is invested for 3 years at 5,6% p.a. compound interest. The interest is
compounded monthly. Calculate the amount earned at the end of the investment period.
(6) [12]
Copyright reserved
Mathematics(NSC) /Grade 10/P1 3 Exemplar
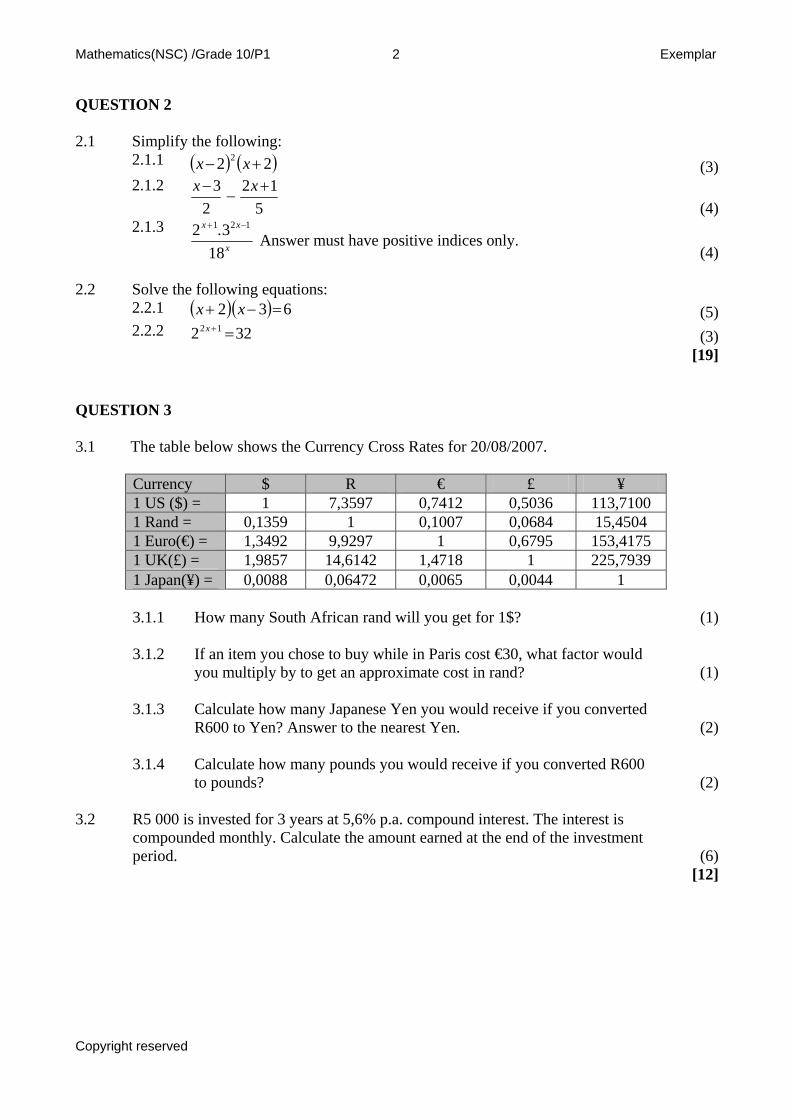
QUESTION 4 Two businessmen, A and B, travel by car from their hometowns towards Johannesburg.
Below is a graph showing the distance of their cars from Johannesburg and the time of day.
Time of the day
A
B
08:00 08:30 09:00 09:30 10:00
Dis
tanc
e fr
om Jo
hann
esbu
rg
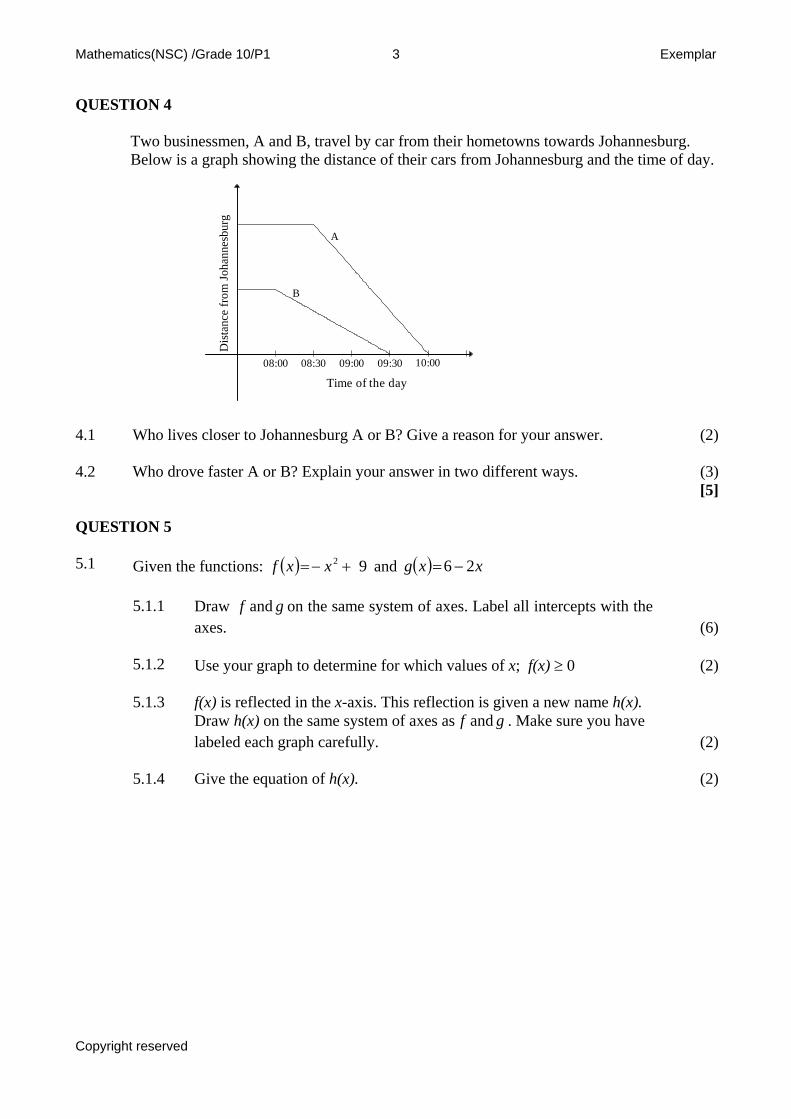
4.1 Who lives closer to Johannesburg A or B? Give a reason for your answer. (2) 4.2 Who drove faster A or B? Explain your answer in two different ways. (3) [5] QUESTION 5 5.1 Given the functions: and ( ) 92 +−= xxf ( ) xxg 26 −= 5.1.1 Draw on the same system of axes. Label all intercepts with the
axes. gf and
(6) 5.1.2 Use your graph to determine for which values of x; f(x) ≥ 0 (2) 5.1.3 f(x) is reflected in the x-axis. This reflection is given a new name h(x).
Draw h(x) on the same system of axes as . Make sure you have labeled each graph carefully.
gf and
(2) 5.1.4 Give the equation of h(x). (2)
Copyright reserved
Mathematics(NSC) /Grade 10/P1 4 Exemplar
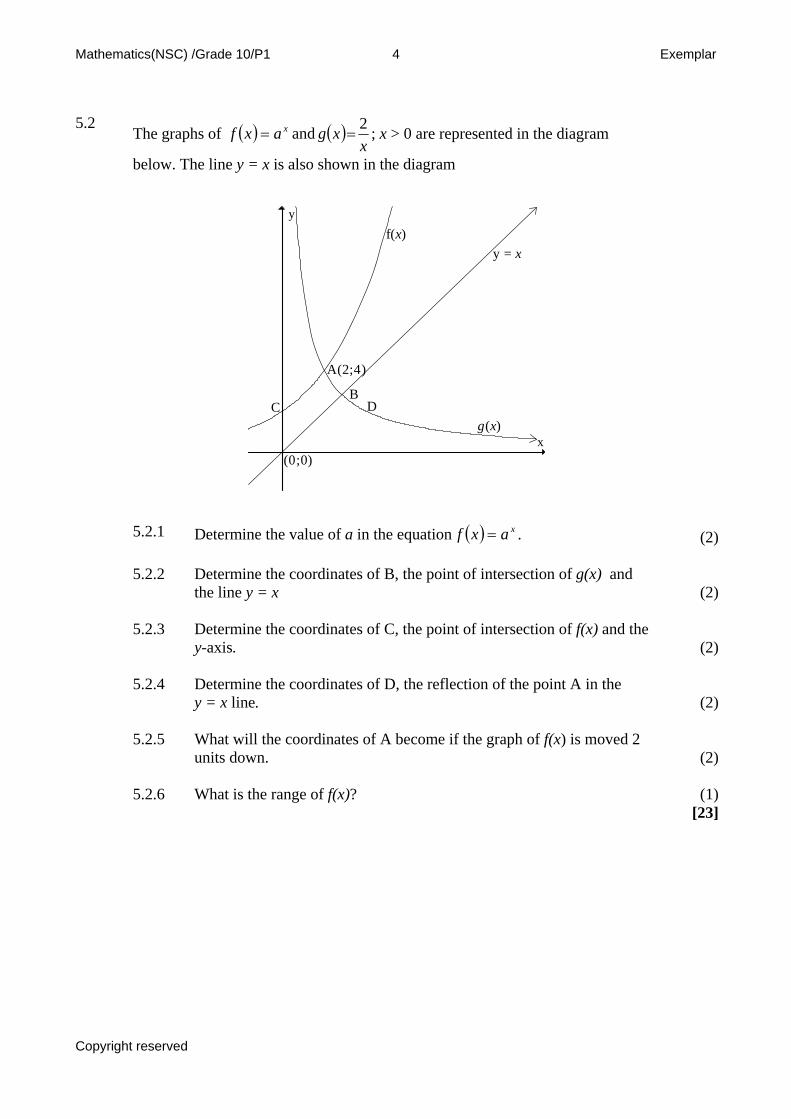
5.2
The graphs of ( ) ( )x
xgaxf x 2and == ; x > 0 are represented in the diagram
below. The line y = x is also shown in the diagram
x
y
A(2;4)
y = xf(x)
g(x)C
BD
(0;0)
5.2.1 Determine the value of a in the equation ( ) xaxf = . (2) 5.2.2 Determine the coordinates of B, the point of intersection of g(x) and
the line y = x
(2) 5.2.3 Determine the coordinates of C, the point of intersection of f(x) and the
y-axis.
(2) 5.2.4 Determine the coordinates of D, the reflection of the point A in the
y = x line.
(2) 5.2.5 What will the coordinates of A become if the graph of f(x) is moved 2
units down.
(2) 5.2.6 What is the range of f(x)? (1) [23]
Copyright reserved
Mathematics(NSC) /Grade 10/P1 5 Exemplar
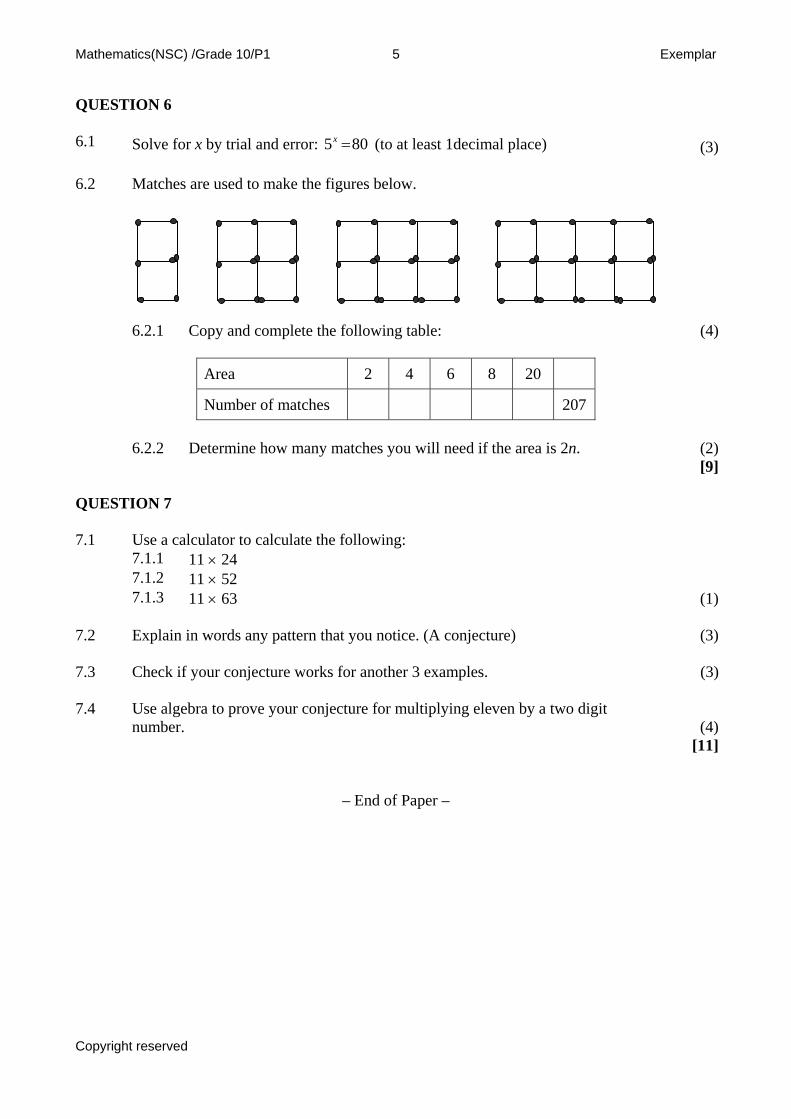
QUESTION 6 6.1 Solve for x by trial and error: (to at least 1decimal place) 805 =x (3) 6.2 Matches are used to make the figures below. 6.2.1 Copy and complete the following table: (4)
Area 2 4 6 8 20
Number of matches 207 6.2.2 Determine how many matches you will need if the area is 2n. (2) [9] QUESTION 7 7.1 Use a calculator to calculate the following: 7.1.1 11 × 24 7.1.2 11 × 52 7.1.3 11 × 63 (1) 7.2 Explain in words any pattern that you notice. (A conjecture) (3) 7.3 Check if your conjecture works for another 3 examples. (3) 7.4 Use algebra to prove your conjecture for multiplying eleven by a two digit
number.
(4) [11]
– End of Paper –
Copyright reserved
Mathematics(NSC)/Grade 10/ P2 6 Exemplar
Grade 10 Mathematics: Question Paper 2
MARKS: 100 TIME: 2 hours QUESTION 1 1.1 Give the co-coordinates of A′, the new co-ordinates of the point A(-2; 5) if: 1.1.1 It is reflected about the x-axis (1) 1.1.2 It is reflected about the y-axis (1) 1.1.3 It is reflected about the line y = x (2)
Given the points A(-3; 2), B(5; -1) and C(2; p), calculate: 1.2 1.2.1 The length of the line segment AB. (2) 1.2.2 The co-ordinates of M, the midpoint of the line segment AB. (2)
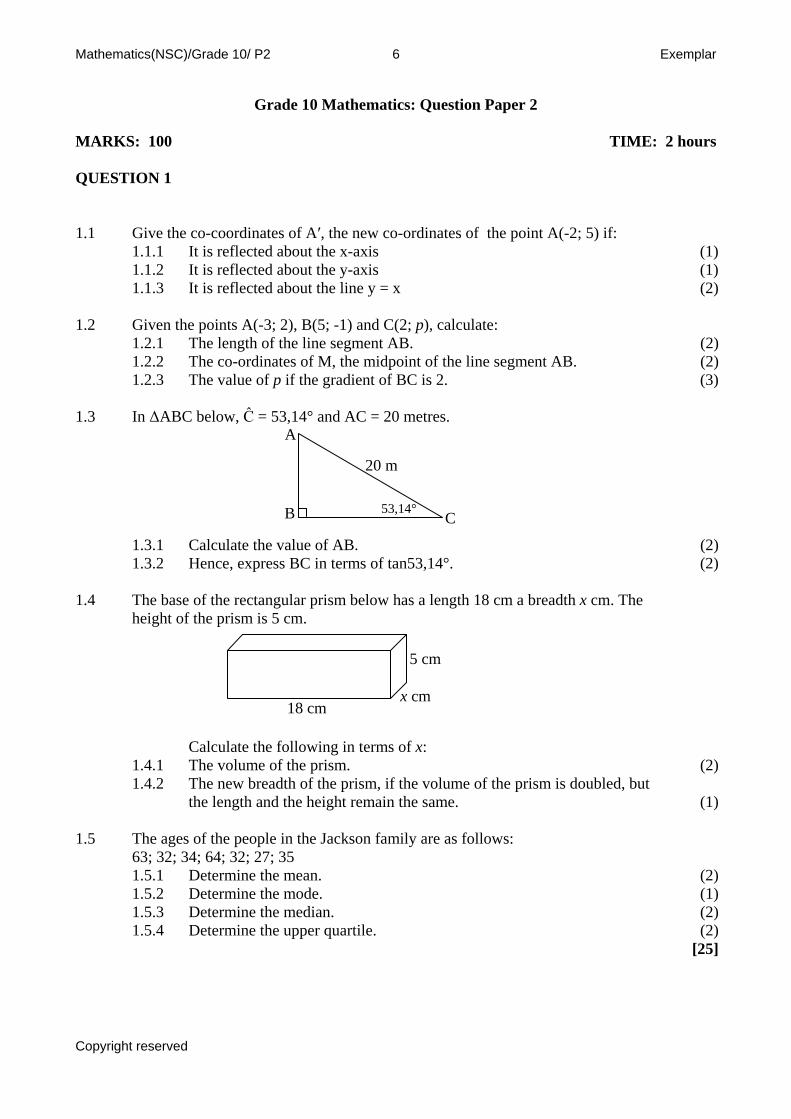
The value of p if the gradient of BC is 2. 1.2.3 (3) 1.3 In ΔABC below, Ĉ = 53,14° and AC = 20 metres.
20 m
A
B
53,14° C 1.3.1 Calculate the value of AB. (2) 1.3.2 Hence, express BC in terms of tan53,14°. (2)
The base of the rectangular prism below has a length 18 cm a breadth x cm. The height of the prism is 5 cm.
1.4
18 cm x cm
5 cm
Calculate the following in terms of x: 1.4.1 The volume of the prism. (2) 1.4.2 The new breadth of the prism, if the volume of the prism is doubled, but
the length and the height remain the same.
(1) 1.5 The ages of the people in the Jackson family are as follows:
63; 32; 34; 64; 32; 27; 35 1.5.1 Determine the mean. (2) 1.5.2 Determine the mode. (1) 1.5.3 Determine the median. (2) 1.5.4 Determine the upper quartile. (2) [25]
Copyright reserved
Mathematics(NSC)/Grade 10/ P2 7 Exemplar
QUESTION 2 ΔABC has co-ordinates A(-4; 2), B(1; 2) and C(-1; 6), and AC = 5 units 2.1 Determine the lengths of AB and BC (3)2.2 What kind of triangle is ΔABC. Give a reason for your answer. (2)2.3 Explain why ΔABC cannot be right angled. (5)
If D is the point (x; y) such that E(214
2.4 ; 7) is the midpoint of CD. Determine the
co-ordinates of D. (3)2.5 Show that the quadrilateral ABCD is a trapezium. (5)
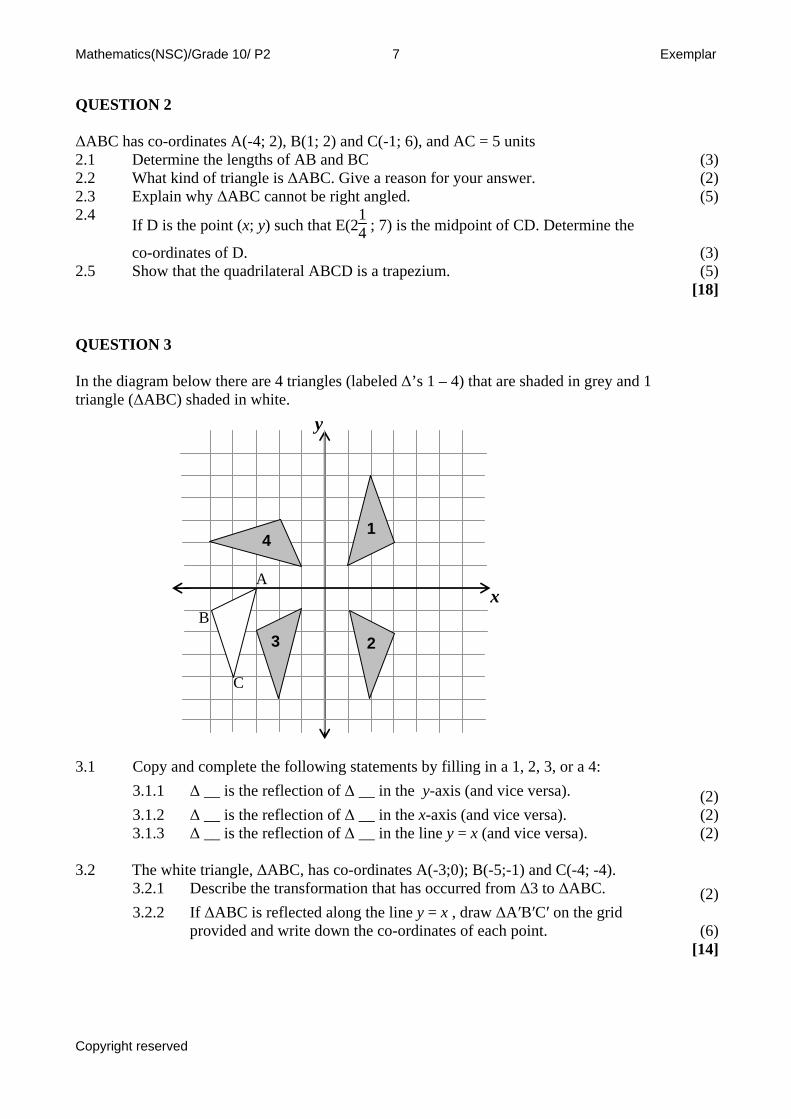
[18] QUESTION 3 In the diagram below there are 4 triangles (labeled Δ’s 1 – 4) that are shaded in grey and 1 triangle (ΔABC) shaded in white.
x
y
1
2 3
4
A
B
C
3.1 Copy and complete the following statements by filling in a 1, 2, 3, or a 4: 3.1.1 Δ __ is the reflection of Δ __ in the y-axis (and vice versa). (2) 3.1.2 Δ __ is the reflection of Δ __ in the x-axis (and vice versa). (2) 3.1.3 Δ __ is the reflection of Δ __ in the line y = x (and vice versa). (2) 3.2 The white triangle, ΔABC, has co-ordinates A(-3;0); B(-5;-1) and C(-4; -4). 3.2.1 Describe the transformation that has occurred from Δ3 to ΔABC. (2) 3.2.2 If ΔABC is reflected along the line y = x , draw ΔA′B′C′ on the grid
provided and write down the co-ordinates of each point.
(6) [14]
Copyright reserved
Mathematics(NSC)/Grade 10/ P2 8 Exemplar
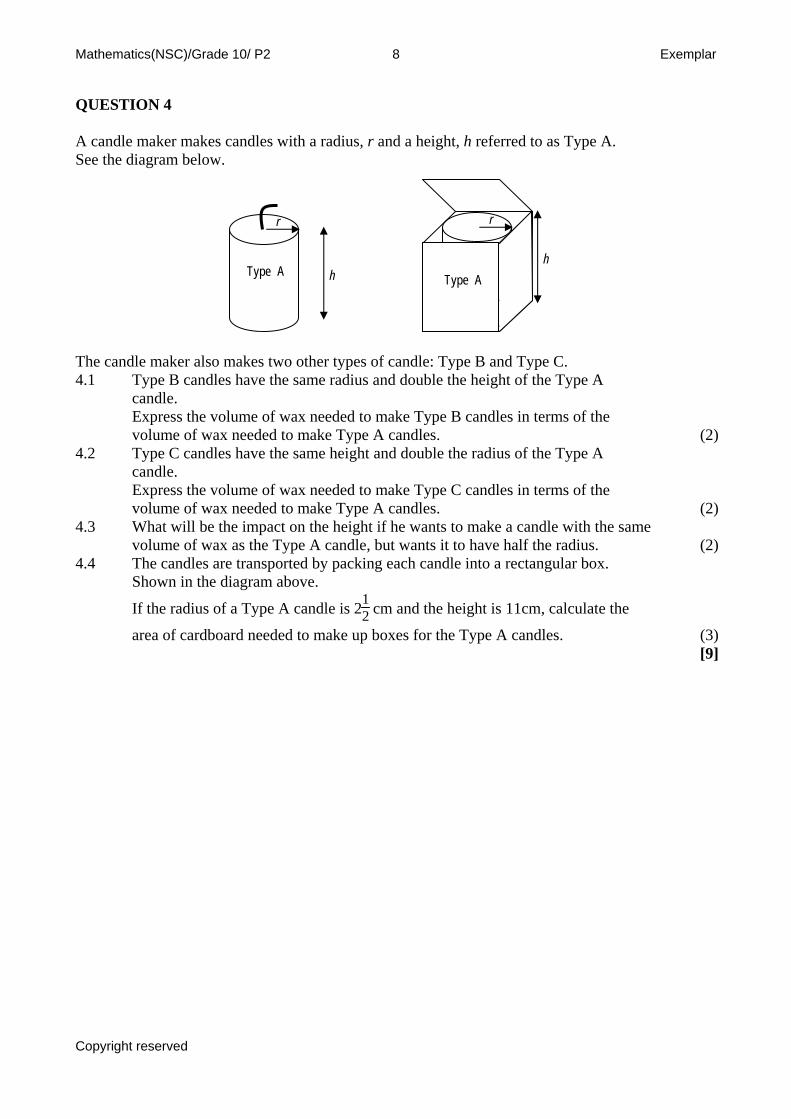
QUESTION 4 A candle maker makes candles with a radius, r and a height, h referred to as Type A. See the diagram below.
h
r
Type A h
r
Type A
The candle maker also makes two other types of candle: Type B and Type C. 4.1 Type B candles have the same radius and double the height of the Type A
candle.
Express the volume of wax needed to make Type B candles in terms of the volume of wax needed to make Type A candles. (2)
4.2 Type C candles have the same height and double the radius of the Type A candle.
Express the volume of wax needed to make Type C candles in terms of the volume of wax needed to make Type A candles. (2)
4.3 What will be the impact on the height if he wants to make a candle with the same volume of wax as the Type A candle, but wants it to have half the radius.
(2)
4.4 The candles are transported by packing each candle into a rectangular box. Shown in the diagram above.
If the radius of a Type A candle is 212 cm and the height is 11cm, calculate the
area of cardboard needed to make up boxes for the Type A candles. (3)[9]
Copyright reserved
Mathematics(NSC)/Grade 10/ P2 9 Exemplar
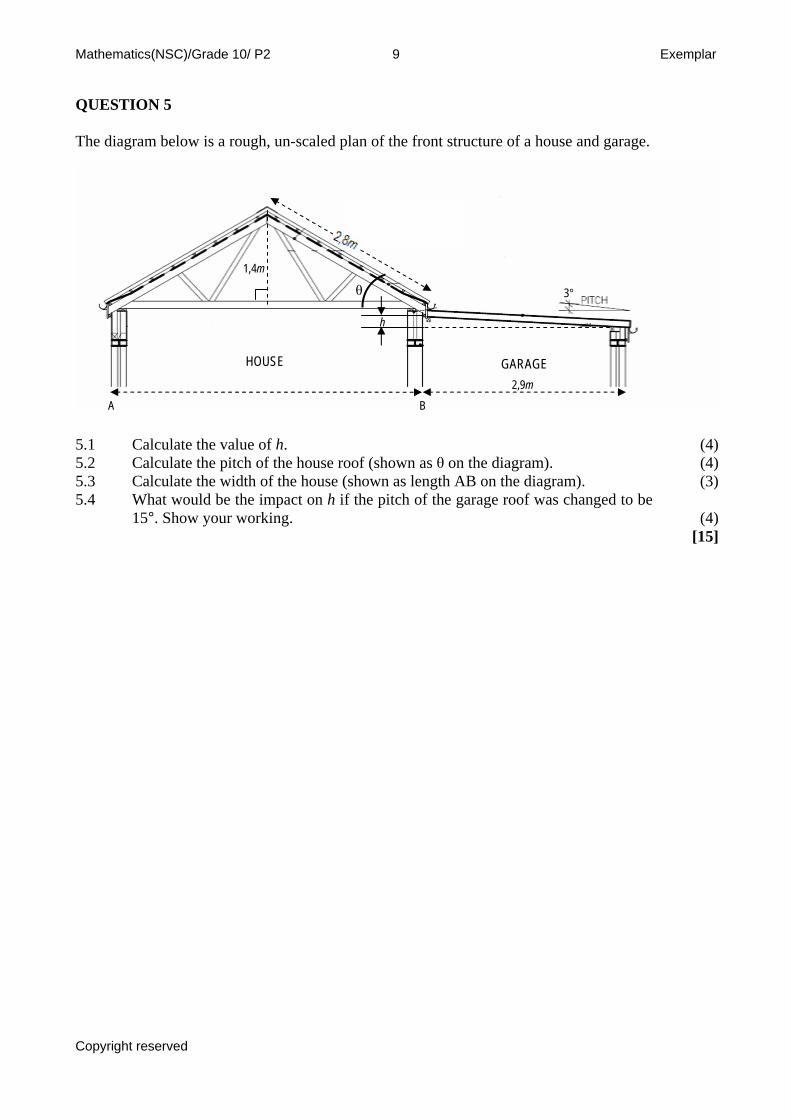
QUESTION 5 The diagram below is a rough, un-scaled plan of the front structure of a house and garage.
1,4m
HOUSE GARAGE
A B 2,9m
3°
h
θ
Calculate the value of h. 5.1 (4)
5.2 Calculate the pitch of the house roof (shown as θ on the diagram). (4)5.3 Calculate the width of the house (shown as length AB on the diagram). (3)
What would be the impact on h if the pitch of the garage roof was changed to be 15°. Show your working.
5.4 (4)
[15]
Copyright reserved
Mathematics(NSC)/Grade 10/ P2 10 Exemplar
QUESTION 6 Skype is a free Voip (voice over internet protocol) solution which allows you to instant message or talk to people all over the world. Skype has experienced rapid growth since its launch in August 2003. The table below shows the “Real” Skype Users (approx 10% of those registered on skype) in 9 sub-regions.
Real Users: Sub-Regional
W. Europe E. Europe/Mid East Africa Subtotal Europe/Mid East/Africa
2,054,568 3,467,114 2,311,409 7,833,108 USA Canada S. America Subtotal
Americas (North/South) 2,801,348 916,817 4,706,325 8,424,525
Aus/NZ/Jap/Tal/S.Kor China India/Other Subtotal Asia/ Pacific 1,760,401 2,112,482 1,267,489 5,140,372 Total “real” users 21,398,007
www.homepage.mac.com/hhbv/blog/skypegrowth/skypegrowth.html
6.1 Draw a pie chart to illustrate usage by sub-regions in the “Asia/Pacific” region. (5)6.2 Calculate the number of degrees required to draw the “Africa” section of a pie
chart showing all of the “Total real users”.
(2)
Which sub-region makes up approximately 29
6.3 of the “Total real users”? (2)
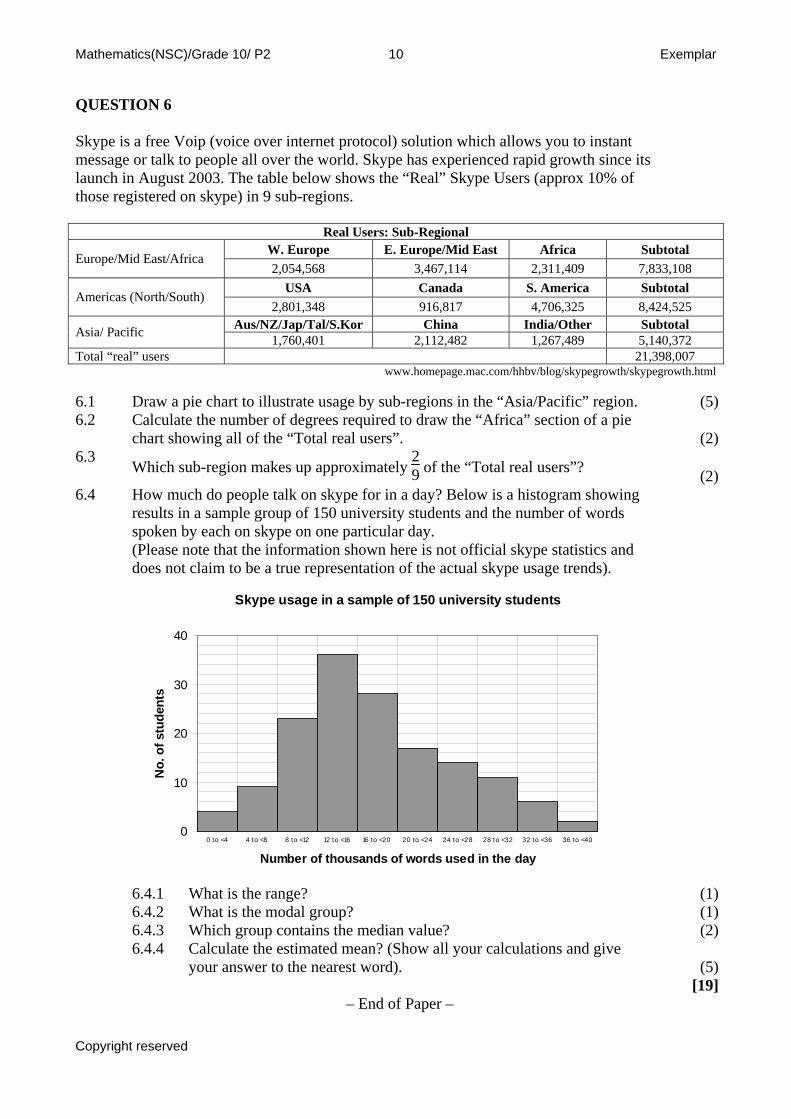
6.4 How much do people talk on skype for in a day? Below is a histogram showing results in a sample group of 150 university students and the number of words spoken by each on skype on one particular day.
(Please note that the information shown here is not official skype statistics and does not claim to be a true representation of the actual skype usage trends).
Skype usage in a sample of 150 university students
0
10
20
30
40
0 to <4 4 to <8 8 to <12 12 to <16 16 to <20 20 to <24 24 to <28 28 to <32 32 to <36 36 to <40
Number of thousands of words used in the day
No.
of s
tude
nts
6.4.1 What is the range? (1) 6.4.2 What is the modal group? (1) 6.4.3 Which group contains the median value? (2) 6.4.4 Calculate the estimated mean? (Show all your calculations and give
your answer to the nearest word).
(5) [19]
– End of Paper –
Copyright reserved
Mathematics(NSC)/Grade11/P1 11 Exemplar
Grade 11 Mathematics: Question Paper 1
MARKS: 150 TIME: 3 hours QUESTION 1 1.1 1.1.1 Which of the following numbers is non-real? 3 or 9− (1) 1.1.2 Determine the value of a: 33
221
)( xx = xa (2) 1.1.3 Simplify: 4875 − . Leave answer in surd form. (2) 1.1.4 Will the product of two irrational numbers always be irrational? Support
you answer with an example.
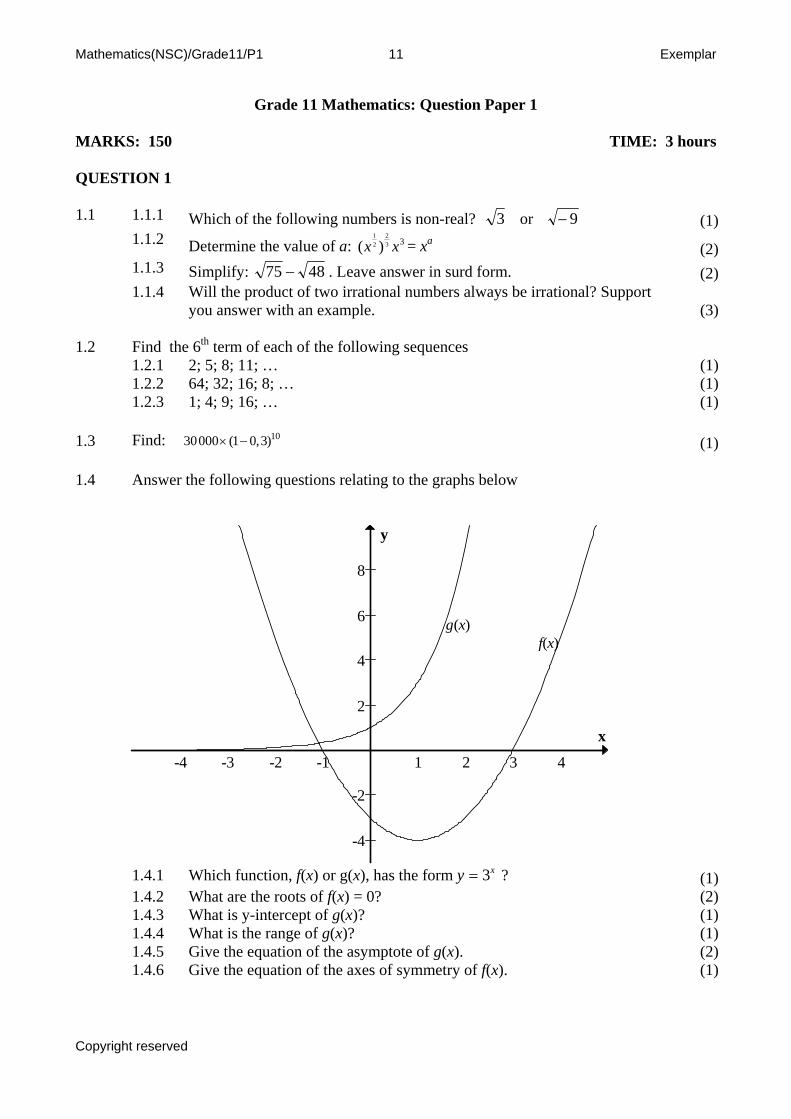
(3) 1.2 Find the 6th term of each of the following sequences 1.2.1 2; 5; 8; 11; … (1) 1.2.2 64; 32; 16; 8; … (1) 1.2.3 1; 4; 9; 16; … (1) 1.3 Find: 1030000 (1 0,3)× − (1) 1.4 Answer the following questions relating to the graphs below
-4 -3 -2 -1 1 2 3 4
-4
-2
2
4
6
8
x
y
f(x)g(x)
1.4.1 Which function, f(x) or g(x), has the form ? xy 3= (1) 1.4.2 What are the roots of f(x) = 0? (2) 1.4.3 What is y-intercept of g(x)? (1) 1.4.4 What is the range of g(x)? (1) 1.4.5 Give the equation of the asymptote of g(x). (2) 1.4.6 Give the equation of the axes of symmetry of f(x). (1)
Copyright reserved
Mathematics(NSC)/Grade11/P1 12 Exemplar
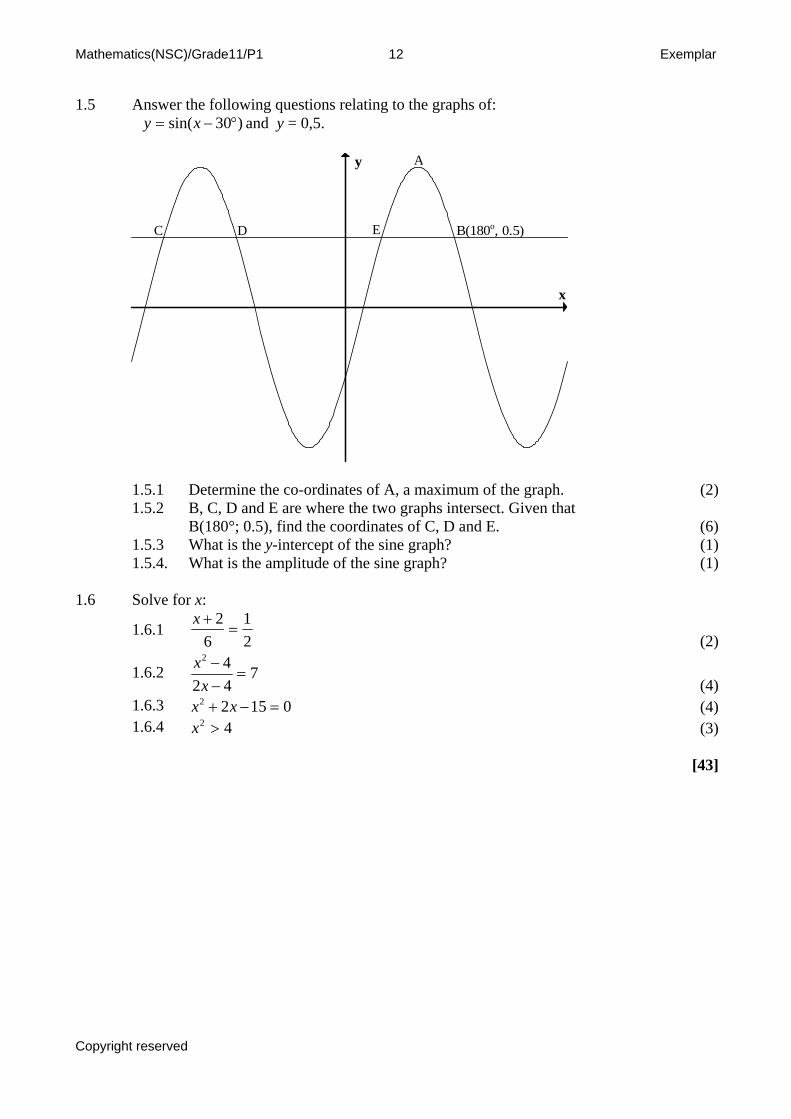
1.5 Answer the following questions relating to the graphs of: and y = 0,5. )30sin( °−= xy
x
y A
B(180o, 0.5)C D E
1.5.1 Determine the co-ordinates of A, a maximum of the graph. (2) 1.5.2 B, C, D and E are where the two graphs intersect. Given that
B(180°; 0.5), find the coordinates of C, D and E.
(6) 1.5.3 What is the y-intercept of the sine graph? (1) 1.5.4. What is the amplitude of the sine graph? (1) 1.6 Solve for x:
1.6.1 21
62=
+x
(2)
1.6.2 74242
=−−
xx
(4)
1.6.3 01522 =−+ xx (4) 1.6.4 42 >x (3) [43]
Copyright reserved
Mathematics(NSC)/Grade11/P1 13 Exemplar
QUESTION 2 2.1 Given the sequence:
Sequence 3 6 11 18 27 p
1st difference
3 5 x y z
2nd difference
2
2.1.1
Determine the values of x and y.
(2)
2.1.2 Hence, or otherwise, predict the value of z. (1) 2.1.3 Determine the value of p. (2) 2.1.4 What do you notice about the 2nd differences? (2) 2.1.5 Determine the 10th term of the sequence (4) 2.2 The Fibonacci sequence has T1 = 1 and T2 = 1.
T3 = T1 + T2; T4 = T2 + T3; and T5 = T3 + T4 and so on
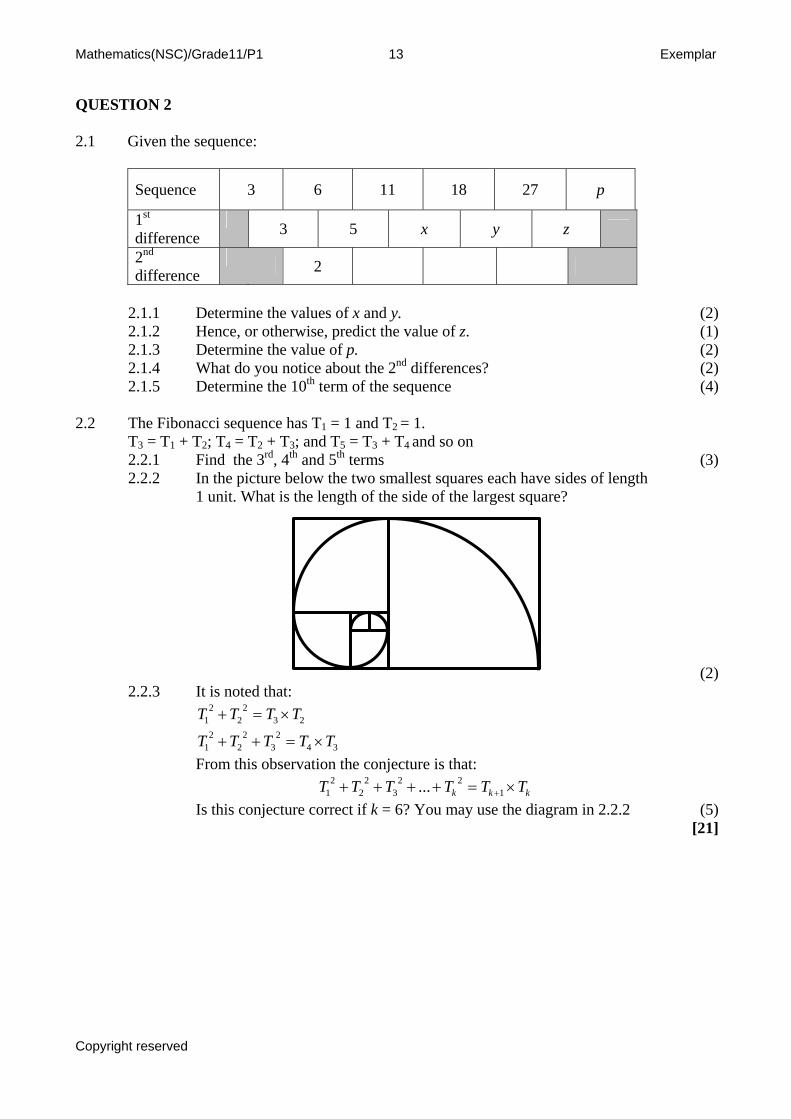
2.2.1 Find the 3rd, 4th and 5th terms (3) 2.2.2 In the picture below the two smallest squares each have sides of length
1 unit. What is the length of the side of the largest square?
(2) 2.2.3 It is noted that:
232
22
1 TTTT ×=+
342
32
22
1 TTTTT ×=++ From this observation the conjecture is that:
kkk TTTTTT ×=++++ +122
32
22
1 ... Is this conjecture correct if k = 6? You may use the diagram in 2.2.2
(5) [21]
Copyright reserved
Mathematics(NSC)/Grade11/P1 14 Exemplar
QUESTION 3 3.1 You purchase a car for R100 000 and the depreciation rate will be 13% per annum
on a reducing balance. Inflation is expected to be 8% per annum for the next 5 years.
3.1.1 In which year will your car lose the greatest value? (1) 3.1.2 What will the value of your car be after 5 years? (3) 3.1.3 What would the cost of a new car be in 5 years time? (3) 3.1.4 If you used your old car as a trade in 5 years time, how much more
will you need to buy a similar new car?
(1) 3.2 A bank offers two account options
A) 14,5 % per annum simple interest? B) 14 % per annum compounded monthly?
3.2.1 You have R10 000 to invest for one year. Which option would be the best for you? Show your working.
(4)
3.2.2 Would your choice be different if you were investing for 6 months? Show your working.
(5)
[17]
Copyright reserved
Mathematics(NSC)/Grade11/P1 15 Exemplar
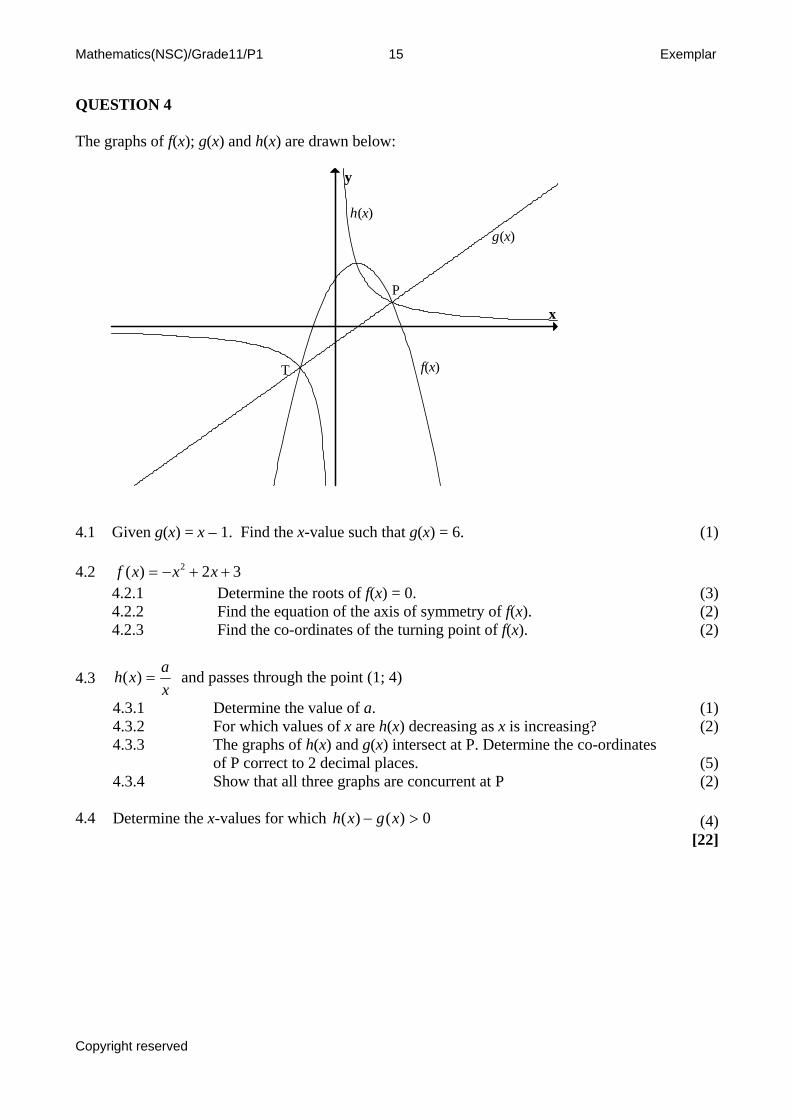
QUESTION 4 The graphs of f(x); g(x) and h(x) are drawn below:
x
y
f(x)
g(x)
h(x)
P
T
4.1 Given g(x) = x – 1. Find the x-value such that g(x) = 6. (1) 4.2 32)( 2 ++−= xxxf 4.2.1 Determine the roots of f(x) = 0. (3) 4.2.2 Find the equation of the axis of symmetry of f(x). (2) 4.2.3 Find the co-ordinates of the turning point of f(x). (2)
4.3 xaxh =)( and passes through the point (1; 4)
4.3.1 Determine the value of a. (1) 4.3.2 For which values of x are h(x) decreasing as x is increasing? (2) 4.3.3 The graphs of h(x) and g(x) intersect at P. Determine the co-ordinates
of P correct to 2 decimal places.
(5) 4.3.4 Show that all three graphs are concurrent at P (2) 4.4 Determine the x-values for which 0)()( >− xgxh (4) [22]
Copyright reserved
Mathematics(NSC)/Grade11/P1 16 Exemplar
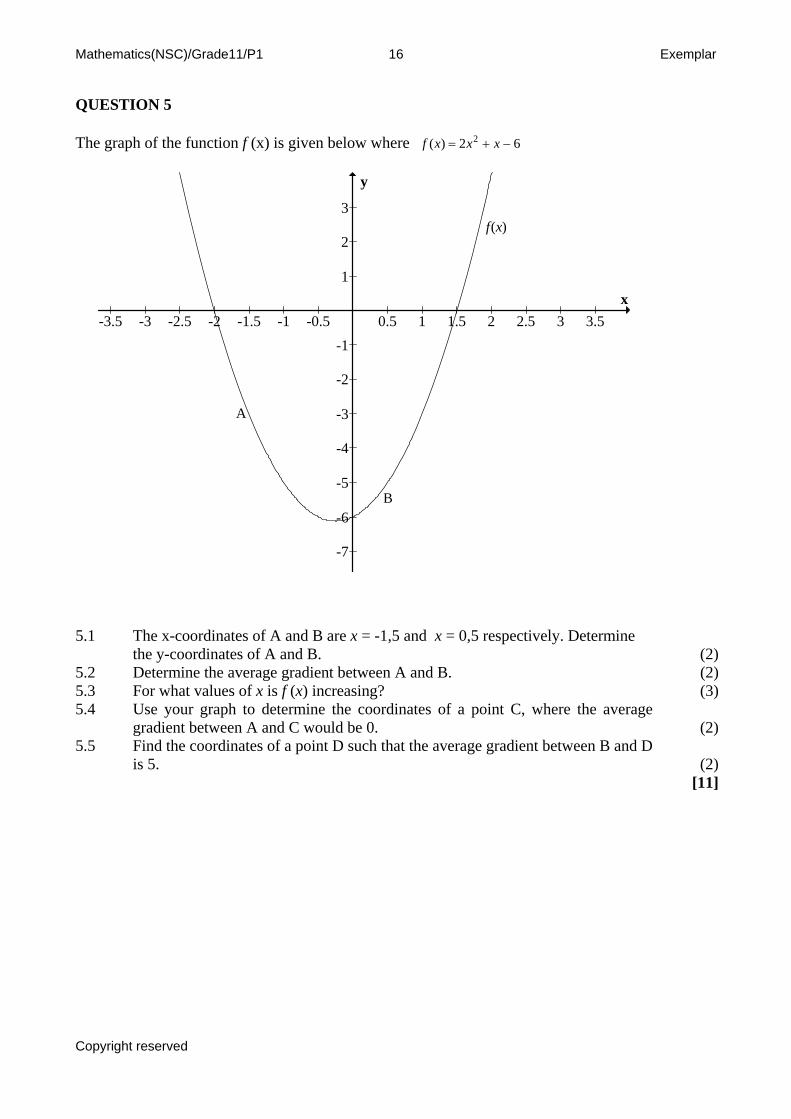
QUESTION 5 The graph of the function f (x) is given below where 62)( 2 −+= xxxf
5.1 The x-coordinates of A and B are x = -1,5 and x = 0,5 respectively. Determine the y-coordinates of A and B.
(2)
5.2 Determine the average gradient between A and B. (2)5.3 For what values of x is f (x) increasing? (3)5.4 Use your graph to determine the coordinates of a point C, where the average
gradient between A and C would be 0.
(2)5.5 Find the coordinates of a point D such that the average gradient between B and D
is 5.
(2) [11]
-3.5 -3 -2.5 -2 -1.5 -1 -0.5 0.5 1 1.5 2 2.5 3 3.5
-7
-6
-5
-4
-3
-2
-1
1
2
3
x
y
A
B
f(x)
Copyright reserved
Mathematics(NSC)/Grade11/P1 17 Exemplar
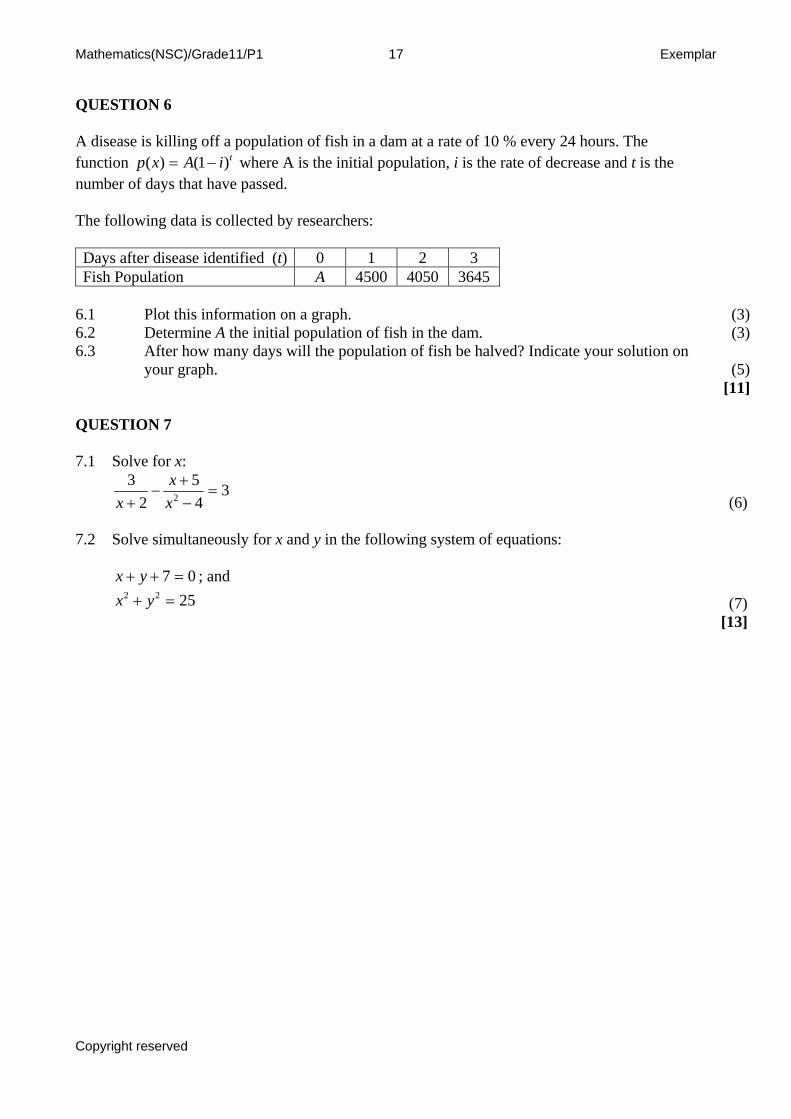
QUESTION 6 A disease is killing off a population of fish in a dam at a rate of 10 % every 24 hours. The function where A is the initial population, i is the rate of decrease and t is the number of days that have passed.
tiAxp )1()( −=
The following data is collected by researchers: Days after disease identified (t) 0 1 2 3 Fish Population A 4500 4050 3645
6.1 Plot this information on a graph. (3)6.2 Determine A the initial population of fish in the dam. (3)6.3 After how many days will the population of fish be halved? Indicate your solution on
your graph.
(5) [11] QUESTION 7 7.1 Solve for x:
345
23
2 =−+
−+ x
xx
(6) 7.2 Solve simultaneously for x and y in the following system of equations:
07 =++ yx ; and 2522 =+ yx
(7) [13]
Copyright reserved
Mathematics(NSC)/Grade11/P1 18 Exemplar
QUESTION 8
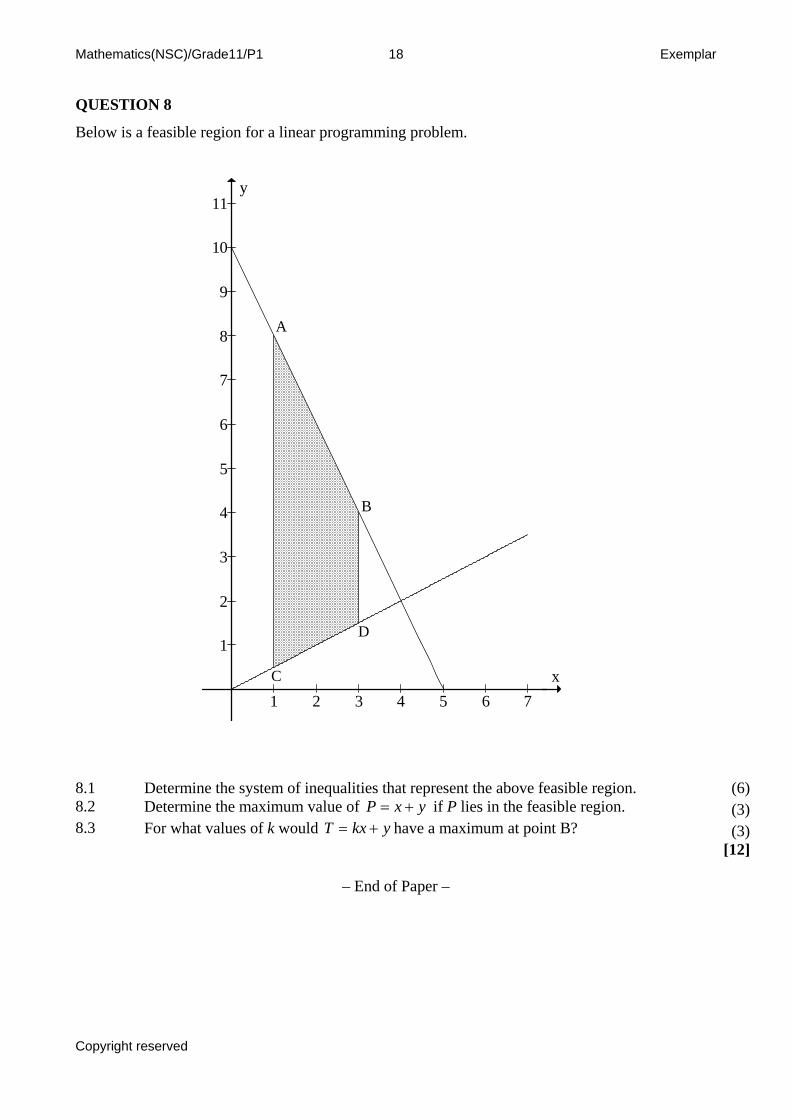
Below is a feasible region for a linear programming problem.
1 2 3 4 5 6 7
1
2
3
4
5
6
7
8
9
10
11y
– End of Paper –
8.1 Determine the system of inequalities that represent the above feasible region. (6)8.2
A
B
C
D
x
Determine the maximum value of yxP += if P lies in the feasible region. (3)8.3 For what values of k would ykxT += have a maximum at point B? (3) [12]
Copyright reserved
Mathematics(NSC)/Grade 11/ P2 19 Exemplar
Grade 11 Mathematics: Question Paper 2
MARKS: 150 TIME: 3 hours QUESTION 1 1.1 A triangle is drawn with vertices A (0;2) ; B (4;5) and C (4;-4). 1.1.1 Find the length of AB. (2) 1.1.2 Find the equation of the line through B and C. (1) 1.1.3 Find the equation of the line through A and B. (2) 1.1.4 Find the inclination of the line through A and B. (2) 1.2 What will be the gradient of the line perpendicular to 0723 =−+ yx ? (2) 1.3 Using a calculator find the values of the following if and : 42=x 8,127=y 1.3.1 x3sin (1) 1.3.2 2)3(cos2 −+ yx (2)
1.4 Simplify: ( )( )A
A−+
90sin180sin
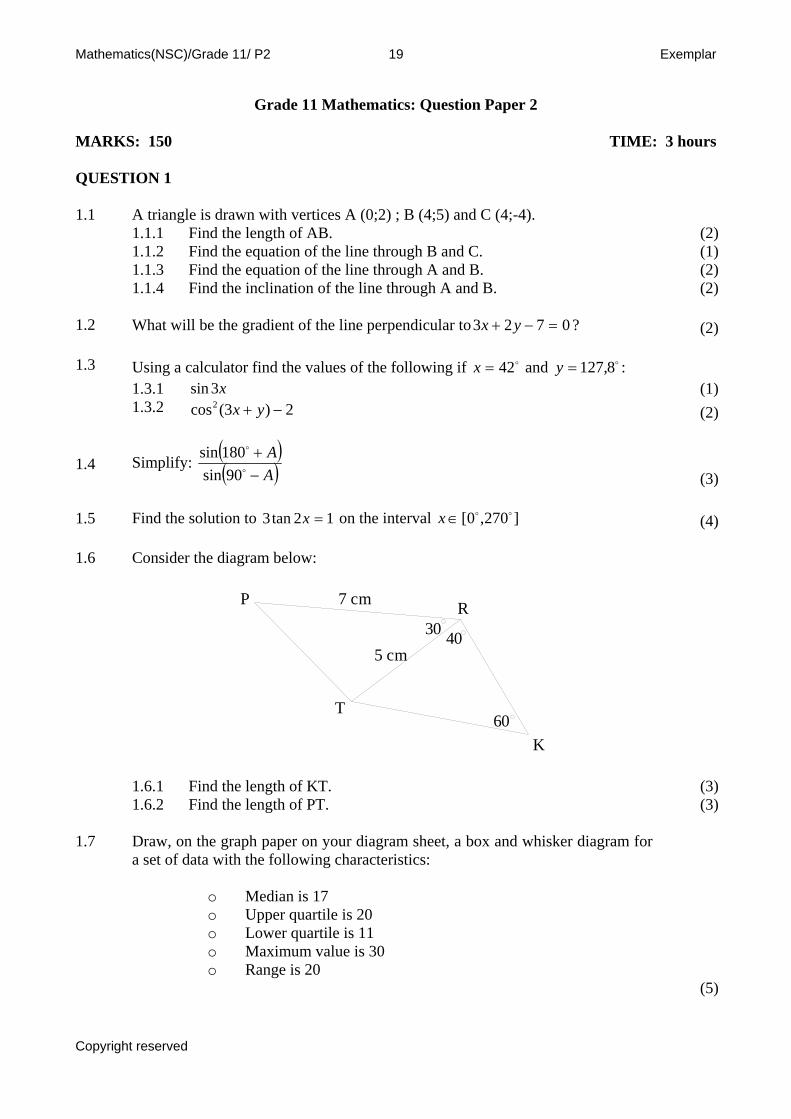
(3) 1.5 Find the solution to on the interval 12tan3 =x ]270,0[∈x (4) 1.6 Consider the diagram below:
R
T
K
5 cm40
60
P 7 cm
30
1.6.1 Find the length of KT. (3) 1.6.2 Find the length of PT. (3) 1.7 Draw, on the graph paper on your diagram sheet, a box and whisker diagram for
a set of data with the following characteristics:
o Median is 17 o Upper quartile is 20 o Lower quartile is 11 o Maximum value is 30 o Range is 20
(5)
Copyright reserved
Mathematics(NSC)/Grade 11/ P2 20 Exemplar
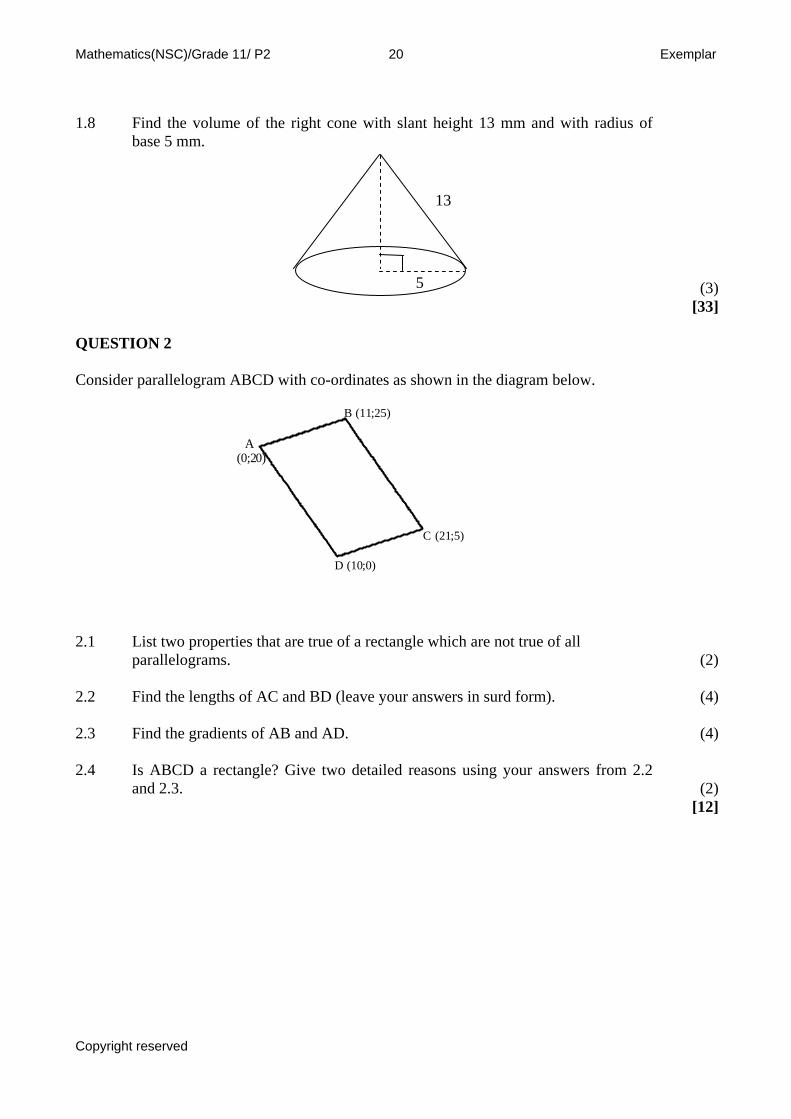
1.8 Find the volume of the right cone with slant height 13 mm and with radius of
base 5 mm.
(3) [33]
13
5
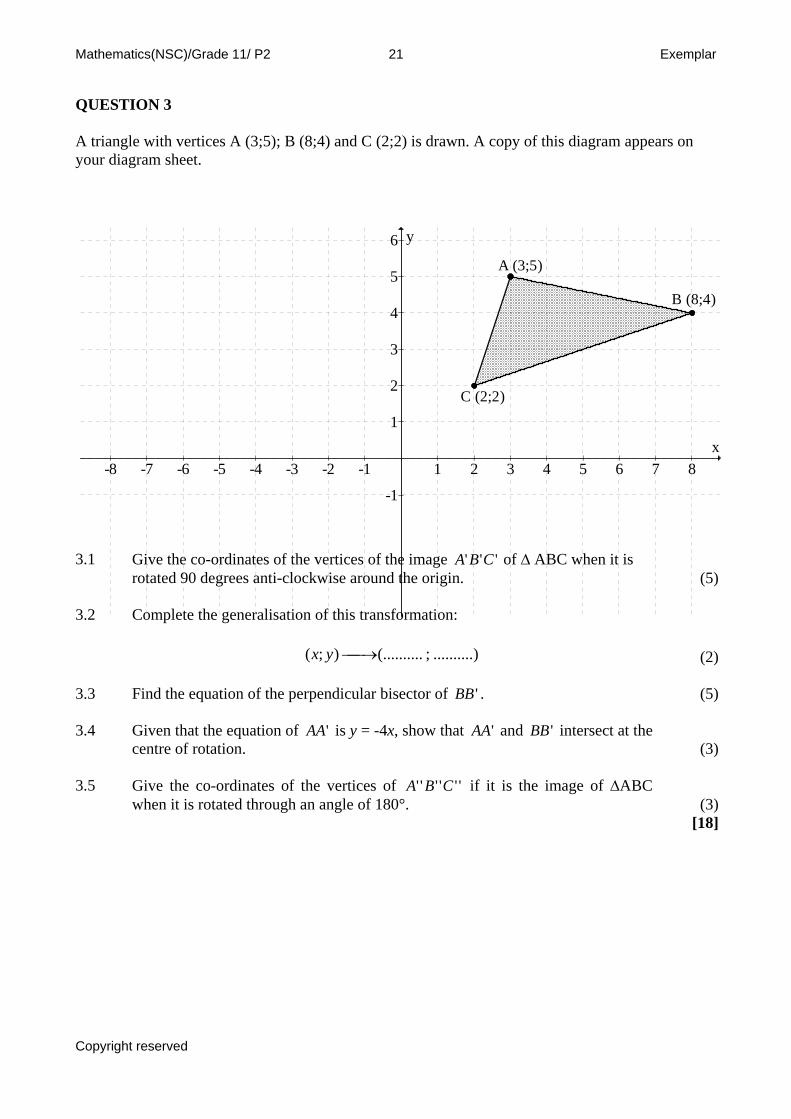
QUESTION 2 Consider parallelogram ABCD with co-ordinates as shown in the diagram below.
2.1 List two properties that are true of a rectangle which are not true of all
parallelograms.
(2) 2.2 Find the lengths of AC and BD (leave your answers in surd form). (4) 2.3 Find the gradients of AB and AD. (4) 2.4 Is ABCD a rectangle? Give two detailed reasons using your answers from 2.2
and 2.3.
(2) [12]
B (11;25)
C (21;5)
D (10;0)
A (0;20)
Copyright reserved
Mathematics(NSC)/Grade 11/ P2 21 Exemplar
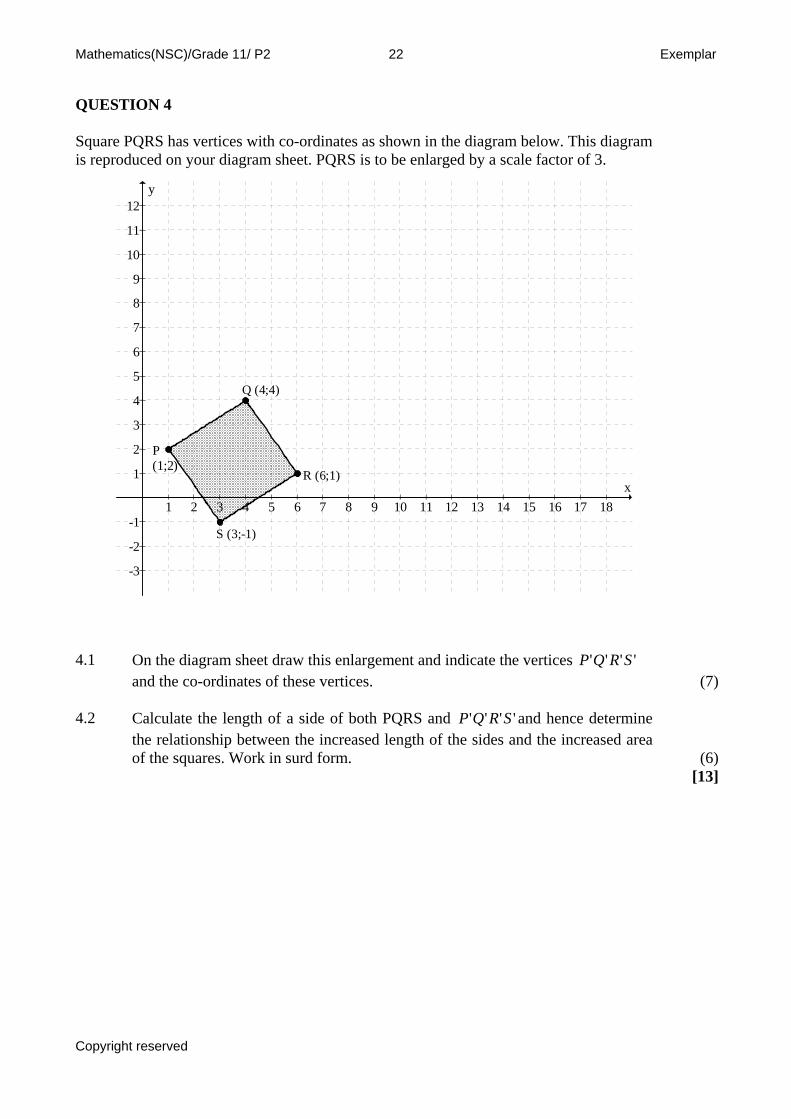
QUESTION 3 A triangle with vertices A (3;5); B (8;4) and C (2;2) is drawn. A copy of this diagram appears on your diagram sheet.
3.1 Give the co-ordinates of the vertices of the image ' of ∆ ABC when it is rotated 90 degrees anti-clockwise around the origin.
'' CBA (5)
3.2 Complete the generalisation of this transformation:
)..........;.(.........);( ⎯→⎯yx
-8 -7 -6 -5 -4 -3 -2 -1 1 2 3 4 5 6 7 8
-1
1
2
3
4
5
6
x
y
C (2;2)
A (3;5)
B (8;4)
(2) 3.3 Find the equation of the perpendicular bisector of 'BB . (5) 3.4 Given that the equation of 'AA is y = -4x, show that 'AA and 'BB intersect at the
centre of rotation.
(3)
3.5 Give the co-ordinates of the vertices of if it is the image of ∆ABC when it is rotated through an angle of 180°.
'''''' CBA
(3) [18]
Copyright reserved
Mathematics(NSC)/Grade 11/ P2 22 Exemplar
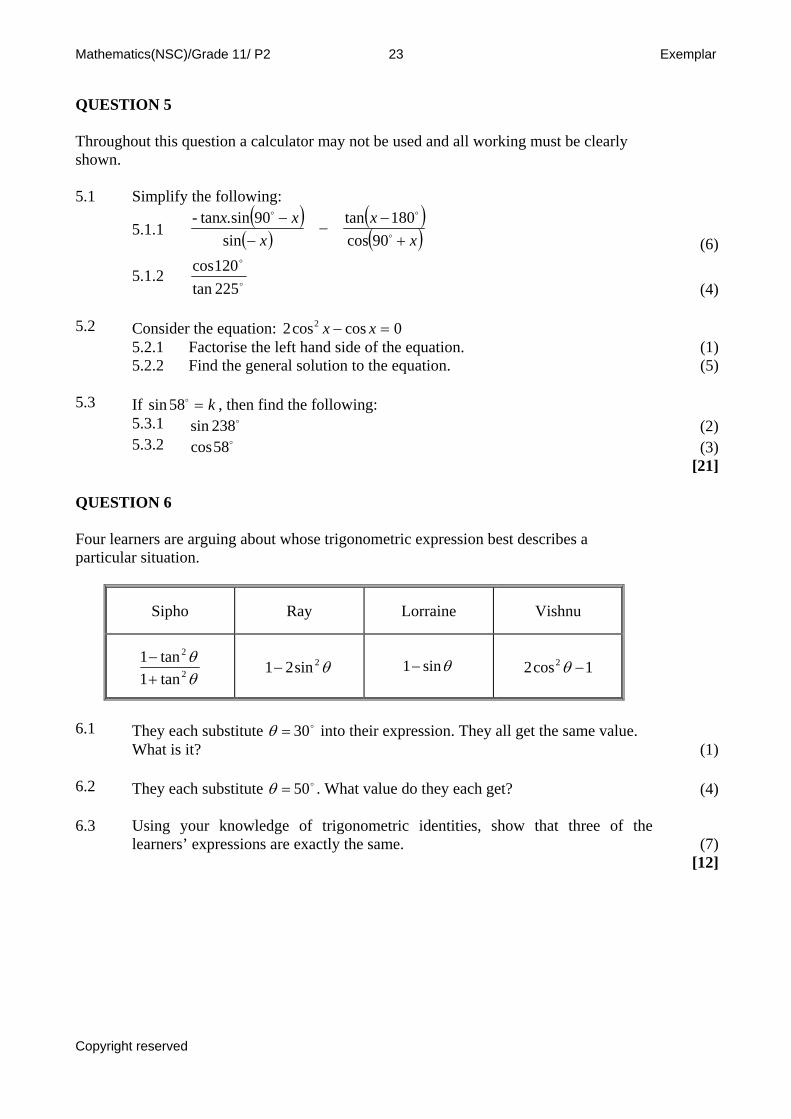
QUESTION 4 Square PQRS has vertices with co-ordinates as shown in the diagram below. This diagram is reproduced on your diagram sheet. PQRS is to be enlarged by a scale factor of 3.
1 2 3 4 5 6 7 8 9 10 11 12 13 14 15 16 17 18
-3
-2
-1
1
2
3
4
5
6
7
8
9
10
11
12
x
y
Q (4;4)
R (6;1)
S (3;-1)
P (1;2)
4.1 On the diagram sheet draw this enlargement and indicate the vertices and the co-ordinates of these vertices.
'''' SRQP (7)
4.2 Calculate the length of a side of both PQRS and and hence determine
the relationship between the increased length of the sides and the increased area of the squares. Work in surd form.
'''' SRQP
(6) [13]
Copyright reserved
Mathematics(NSC)/Grade 11/ P2 23 Exemplar
QUESTION 5 Throughout this question a calculator may not be used and all working must be clearly shown.
5.1 Simplify the following:
5.1.1 ( )( )
( )( )xx
xxx
+−
−−
−90cos
180tansin
90sin.tan-
(6)
5.1.2 225tan120cos
(4) 5.2 Consider the equation: 0coscos2 2 =− xx 5.2.1 Factorise the left hand side of the equation. (1) 5.2.2 Find the general solution to the equation. (5) 5.3 If , then find the following: k=58sin 5.3.1 238sin (2) 5.3.2 58cos (3) [21] QUESTION 6 Four learners are arguing about whose trigonometric expression best describes a particular situation.
Sipho Ray Lorraine Vishnu
θθ
2
2
tan1tan1
+−
θ2sin21− sin1 θ− 1cos2 2 −θ
6.1 They each substitute into their expression. They all get the same value. 30=θWhat is it? (1)
6.2 They each substitute . What value do they each get?50=θ (4) 6.3 Using your knowledge of trigonometric identities, show that three of the
learners’ expressions are exactly the same.
(7) [12]
Copyright reserved
Mathematics(NSC)/Grade 11/ P2 24 Exemplar
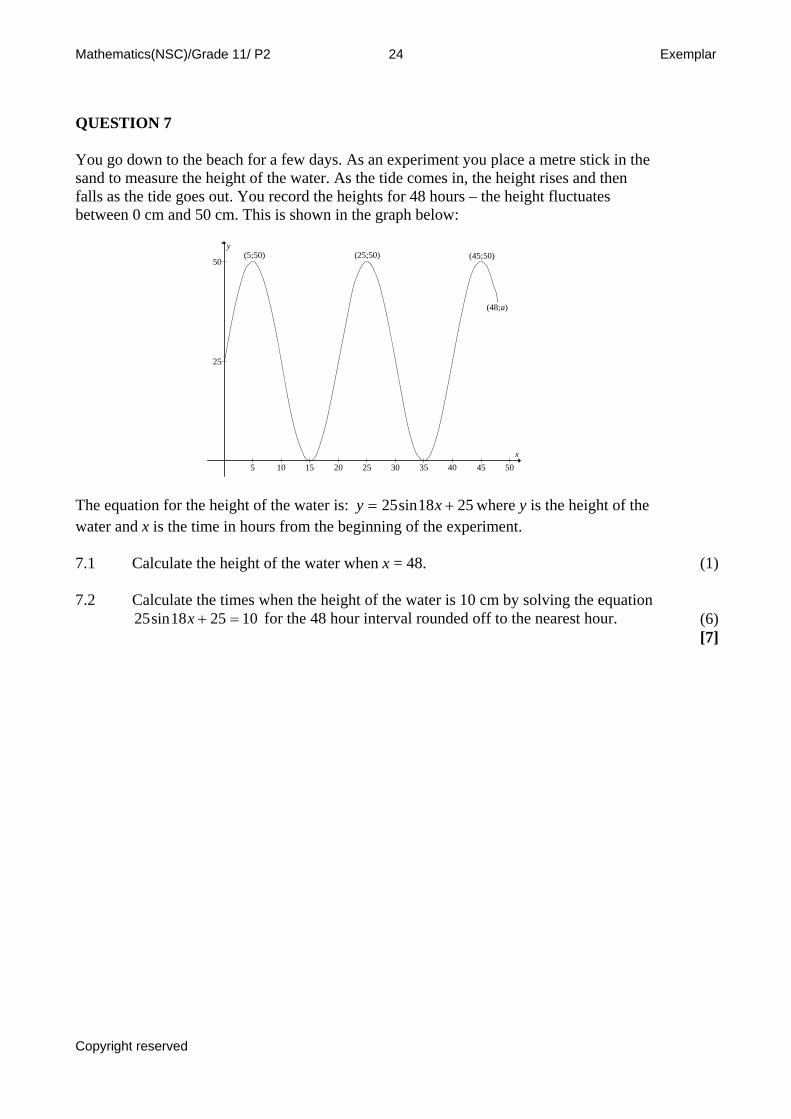
QUESTION 7 You go down to the beach for a few days. As an experiment you place a metre stick in the sand to measure the height of the water. As the tide comes in, the height rises and then falls as the tide goes out. You record the heights for 48 hours – the height fluctuates between 0 cm and 50 cm. This is shown in the graph below:
5 10 15 20 25 30 35 40 45 50
25
50(5;50) (25;50) (45;50)
(48;a)
y
x
The equation for the height of the water is: 2518sin25 += xy where y is the height of the water and x is the time in hours from the beginning of the experiment.
7.1 Calculate the height of the water when x = 48. (1) 7.2 Calculate the times when the height of the water is 10 cm by solving the equation
for the 48 hour interval rounded off to the nearest hour. 102518sin25 =+x
(6) [7]
Copyright reserved
Mathematics(NSC)/Grade 11/ P2 25 Exemplar
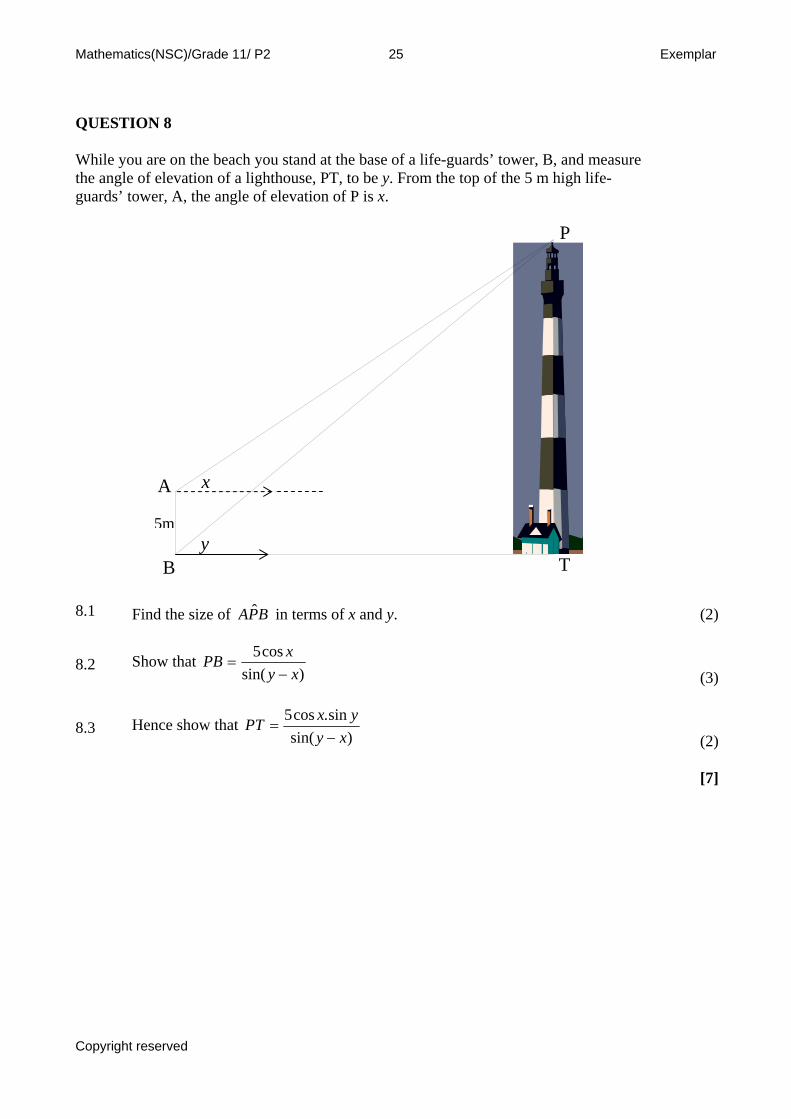
QUESTION 8 While you are on the beach you stand at the base of a life-guards’ tower, B, and measure the angle of elevation of a lighthouse, PT, to be y. From the top of the 5 m high life-guards’ tower, A, the angle of elevation of P is x.
8.1 Find the size of BPA ˆ in terms of x and y. (2)
8.2 Show that )sin(
cos5xy
xPB−
=
(3)
8.3 Hence show that )sin(
sin.cos5xy
yxPT−
=
(2) [7]
5m
A
B
P
Ty
x
Copyright reserved
Mathematics(NSC)/Grade 11/ P2 26 Exemplar
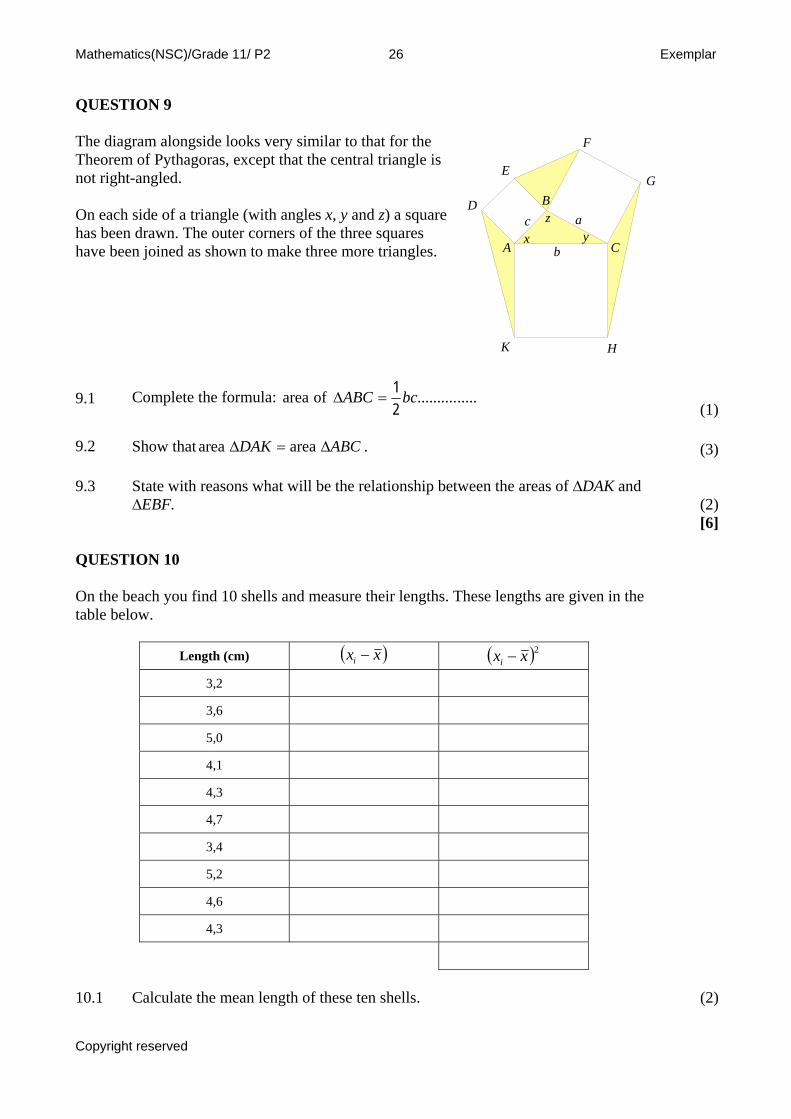
QUESTION 9 The diagram alongside looks very similar to that for the Theorem of Pythagoras, except that the central triangle is not right-angled. On each side of a triangle (with angles x, y and z) a square has been drawn. The outer corners of the three squares have been joined as shown to make three more triangles.
A
B
C
D
E
F
G
HK
a
b
cx y
z
Complete the formula: ...............ofarea bcABC21
=Δ (1)
9.1
9.2 Show that . ABCDAK Δ=Δ areaarea (3) 9.3 State with reasons what will be the relationship between the areas of ∆DAK and
∆EBF.
(2) [6] QUESTION 10 On the beach you find 10 shells and measure their lengths. These lengths are given in the table below.
Length (cm) ( )xxi (− )2xxi −
3,2
3,6
5,0
4,1
4,3
4,7
3,4
5,2
4,6
4,3
10.1 Calculate the mean length of these ten shells. (2)
Copyright reserved
Mathematics(NSC)/Grade 11/ P2 27 Exemplar
10.2 Complete the copy of your table on your diagram sheet and use it to calculate the
standard deviation of the length of your sample of shells.
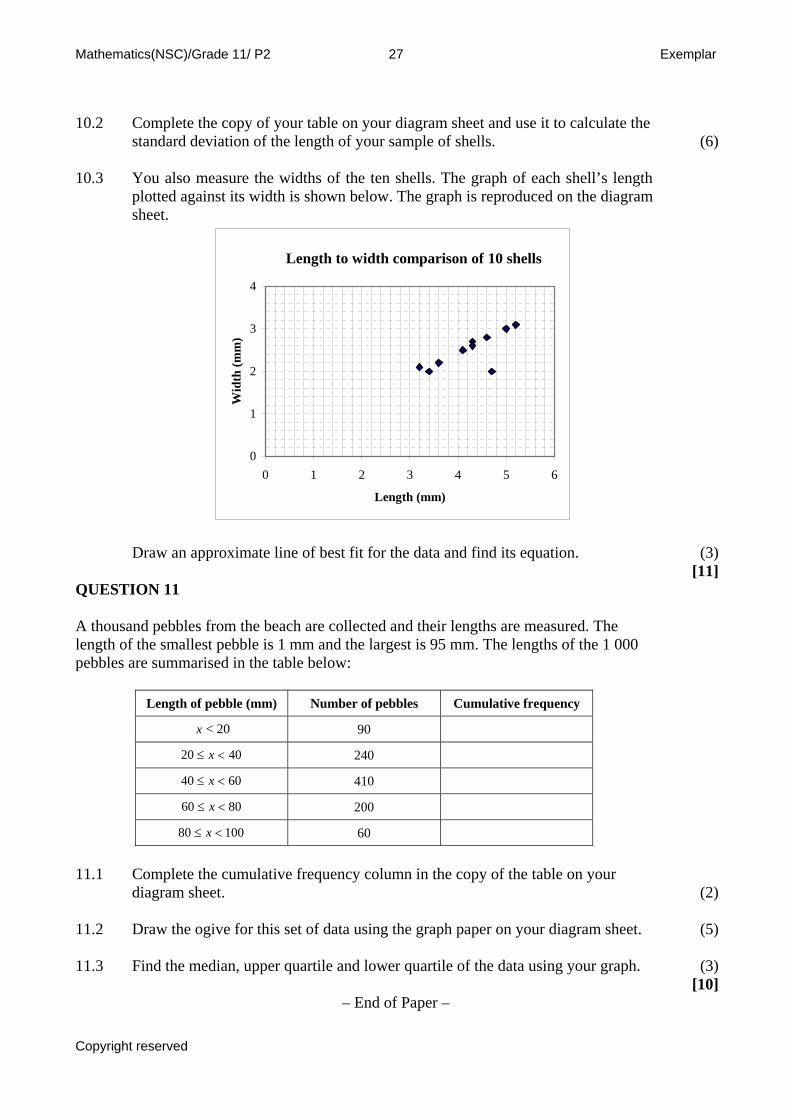
(6) 10.3 You also measure the widths of the ten shells. The graph of each shell’s length
plotted against its width is shown below. The graph is reproduced on the diagram sheet.
Length to width comparison of 10 shells
0
1
2
3
4
0 1 2 3 4 5 6
Length (mm)
Wid
th (m
m)
Draw an approximate line of best fit for the data and find its equation. (3) [11]QUESTION 11 A thousand pebbles from the beach are collected and their lengths are measured. The length of the smallest pebble is 1 mm and the largest is 95 mm. The lengths of the 1 000 pebbles are summarised in the table below:
Length of pebble (mm) Number of pebbles Cumulative frequency
< 20 90 x
240 4020 <≤ x
410 6040 <≤ x
200 8060 <≤ x
10080 <≤ x 60
11.1 Complete the cumulative frequency column in the copy of the table on your
diagram sheet.
(2) 11.2 Draw the ogive for this set of data using the graph paper on your diagram sheet. (5) 11.3 Find the median, upper quartile and lower quartile of the data using your graph. (3) [10]
– End of Paper –
Copyright reserved
Mathematics(NSC)/Grade 12/ P1 28 Exemplar
Grade 12 Mathematics: Question Paper 1
MARKS: 150 TIME: 3 hours QUESTION 1 1.1 Solve for x: 1.1.1 2log3 =x (1) 1.1.2 x=27log10 (1) 1.1.3 1212 273 −− = xx (2)
1.2 Determine the value of the following expression: ∑ =
7
3
2i
i
(2)
1.3 The sum of n terms is given by )1(2
nnSn += find . 5T (3)
1.4 Determine the 7th term of the following sequence: 64 ; 323 ;
169 ;
827
(3) 1.5 If inflation is expected to be 8.7% per annum for the next 10 years. During which
year will prices be double what they are today? (3) 1.6 Given that f(1) = 0; solve for 44)( 23 −−−= xxxxf (4)
1.7 Given : 5
1)(−
=x
xf
1.7.1 Determine the equation of the vertical asymptote of f(x) (1) 1.7.2 Determine the y-intercept of f(x) (1) 1.7.3 Determine x if f(x) = -1 (2) 1.7.4 Determine the equation of one of the axes of symmetry of f(x). (2) 1.8 The inverse of a function is , what is the function f(x)? 42)(1 −=− xxf (3) 1.9 Which of the following functions does no increase over the interval (0;10)?
A) B) C)xy log= xy 10=x
y 10=
(2) 1.10 Determine a function f(x) such that 23)( xxf =′ (2) 1.11 A car travelled for 1 hour. The average speed for the first 15 minutes was 60
km/h and for the remaining 45 minutes the average speed was 80km/h. How far did the car travel? (3)
[35]
Copyright reserved
Mathematics(NSC)/Grade 12/ P1 29 Exemplar
QUESTION 2 2.1 The population of a certain bacteria in a body is expected to grow exponentially
at a rate of 15 % every hour. If the initial population is 5 000. How long will it take for the population to reach 100 000?
(4) 2.2 If the first term a geometric series is 10 and the common ratio is 0,5: 2.2.1 Find the sum of the first 8 terms. (3) 2.2.2 For what value of n is 010,<−∞ nSS ? (4) 2.3 The first, second and third terms and an arithmetic series are a; b and a – b
respectively (a > 0). The first, second and third terms and a geometric series are a; a – b and 1 respectively. Show that a = 9 and determine the value of b.
(6) 2.4 n! is defined as 12...)2()1(! ×××−×−×= nnnn e.g. 4!=4 x 3 x 2 x 1 = 24
Evaluate the following: ∑=
5
3!
ii
(3) [20] QUESTION 3 3.1 You wish to purchase your first home. The bank will only allow bond
repayments that are no greater than 30 % of your net monthly salary. Your gross salary is R 8 250 per month and you have deductions of 25 % per month from your salary.
3.1.1 What is your net salary? (how much do you take home after deductions) (1) 3.1.2 What is the maximum bond repayment you can afford? (1) 3.1.3 The bank offers a fixed bond rate of 13,5% per annum compounded
monthly, over a 20 year period. There is a flat that costs R 150 000. Can you afford the flat? (Show all working)
(6) 3.2 A bank is offering a saving account with an interest rate of 10% per annum
compounded monthly. You can afford to save R 300 per month. How long will it take you to save up R 20 000? (to the nearest month)
(5) [13]
Copyright reserved
Mathematics(NSC)/Grade 12/ P1 30 Exemplar
QUESTION 4 4.1 The following data were collected. From the graph of this data, is would appear as if
the output is an exponential function of the input: xbaxf ×=)( Input -1 0 1 2 2,3 6 Output 0,67 2 6 17 24,9 1465
4.1.1 Kate used the input values of 0 and 1 and the corresponding output
values to determine the function variables a and b. Write the function that Kate determined in the form ( ) ...f x =
(3) 4.1.2 Dolly used the input values of 0 and 2 and the corresponding output
values to determine the function variables a and b. Write the function that Dolly determined in the form ( ) ...g x =
(3) 4.1.3 Determine ; (2,3)f (6)f ; ; and (2,3)g (6)g (2) 4.1.4 State, with reasons, which of the two functions is the better
approximation of the relationship between input and output?
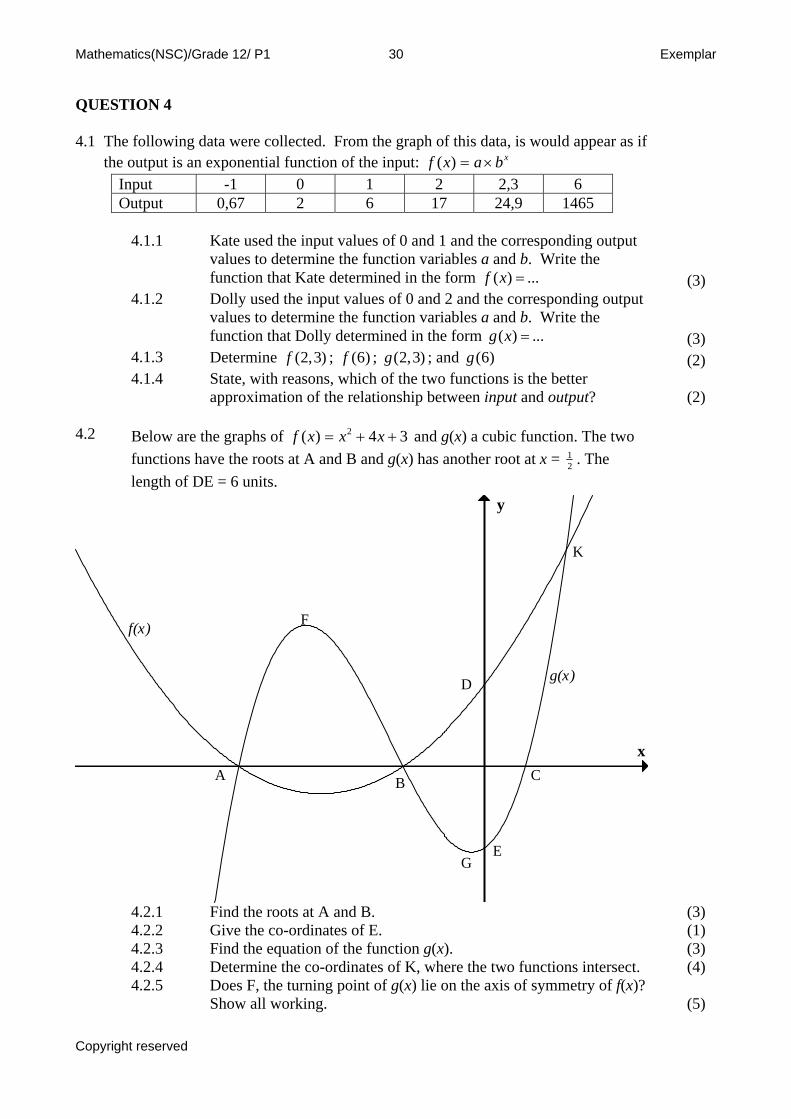
(2) 4.2 Below are the graphs of and g(x) a cubic function. The two
functions have the roots at A and B and g(x) has another root at x = 34)( 2 ++= xxxf
21 . The
length of DE = 6 units.
-4.5 -4 -3.5 -3 -2.5 -2 -1.5 -1 -0.5 0.5 1 1.5
-4
-2
2
4
6
8
x
y
A B C
D
E
F
G
K
f(x)
g(x)
4.2.1 Find the roots at A and B. (3) 4.2.2 Give the co-ordinates of E. (1) 4.2.3 Find the equation of the function g(x). (3) 4.2.4 Determine the co-ordinates of K, where the two functions intersect. (4) 4.2.5 Does F, the turning point of g(x) lie on the axis of symmetry of f(x)?
Show all working.
(5)
Copyright reserved
Mathematics(NSC)/Grade 12/ P1 31 Exemplar
4.2.6 There are two x values where the two functions are increasing at the same rate. Find these values correct to two decimal places.
(6)
[32] QUESTION 5 5.1 The following seems to show that 2 = 1. Explain where and why the error
occurred.
bby divide
afor b substitute so b ab-aby divide
factorisebsubtract
aby multiply
122
)()())((
8 line 7 line 6 line 5 line 4 line 3 line
2 line1 line
2222
2
=
===+=+
−=+−−=−
==
bbbbbbba
babbabababba
ababa
(3) 5.2 Given 672)( 23 −−+= xxxxf 5.2.1 Determine all values of x such that f(x) = 0. (5) 5.2.2 Hence of otherwise solve: 6)2(7)2()2(2 23 =−−−+− xxx (3) [11] QUESTION 6 6.1 Determine the derivative of
21)(−
=x
xf using first principles (5)
6.2
Determine dxdy if
xxxy 323 −+
=
(5) 6.3 For a given function f(x) the derivative is 2)( 2 +−−=′ xxxf 6.3.1 What is the gradient of the tangent to the function f(x) at x = 0? (1) 6.3.2 Where is f(x) increasing? (4)
Copyright reserved
Mathematics(NSC)/Grade 12/ P1 32 Exemplar
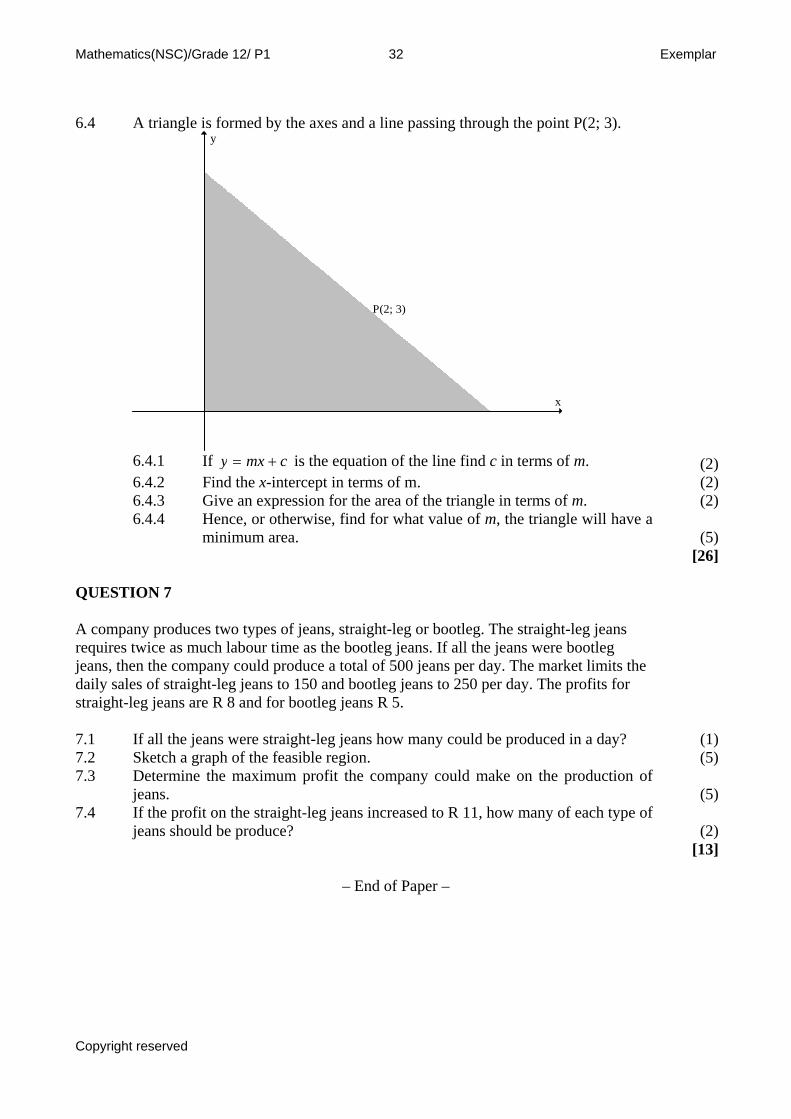
6.4 A triangle is formed by the axes and a line passing through the point P(2; 3).
x
y
P(2; 3)
6.4.1 If cmxy += is the equation of the line find c in terms of m. (2) 6.4.2 Find the x-intercept in terms of m. (2) 6.4.3 Give an expression for the area of the triangle in terms of m. (2) 6.4.4 Hence, or otherwise, find for what value of m, the triangle will have a
minimum area.
(5) [26] QUESTION 7 A company produces two types of jeans, straight-leg or bootleg. The straight-leg jeans requires twice as much labour time as the bootleg jeans. If all the jeans were bootleg jeans, then the company could produce a total of 500 jeans per day. The market limits the daily sales of straight-leg jeans to 150 and bootleg jeans to 250 per day. The profits for straight-leg jeans are R 8 and for bootleg jeans R 5.
7.1 If all the jeans were straight-leg jeans how many could be produced in a day? (1)7.2 Sketch a graph of the feasible region. (5)7.3 Determine the maximum profit the company could make on the production of
jeans.
(5)7.4 If the profit on the straight-leg jeans increased to R 11, how many of each type of
jeans should be produce?
(2) [13]
– End of Paper –
Copyright reserved
Mathematics(NSC)/Grade 12/ P2 33 Exemplar
Grade 12 Mathematics: Question Paper 2
MARKS: 150 marks TIME: 3 hours QUESTION 1
A(0;1) ; B(-2;-3); C(8;2); D(d;6) are the vertices of the parallelogram ABCD. 1.1 1.1.1 Calculate the gradient of BC (2) 1.1.2 Hence, determine the equation of AD and use it to calculate the value of
d.
(4) 1.1.3 Calculate the equation of the altitude AE of ABC with E on BC. (2)Δ 1.1.4 Determine the coordinates of F, the point of intersection of the
diagonals.
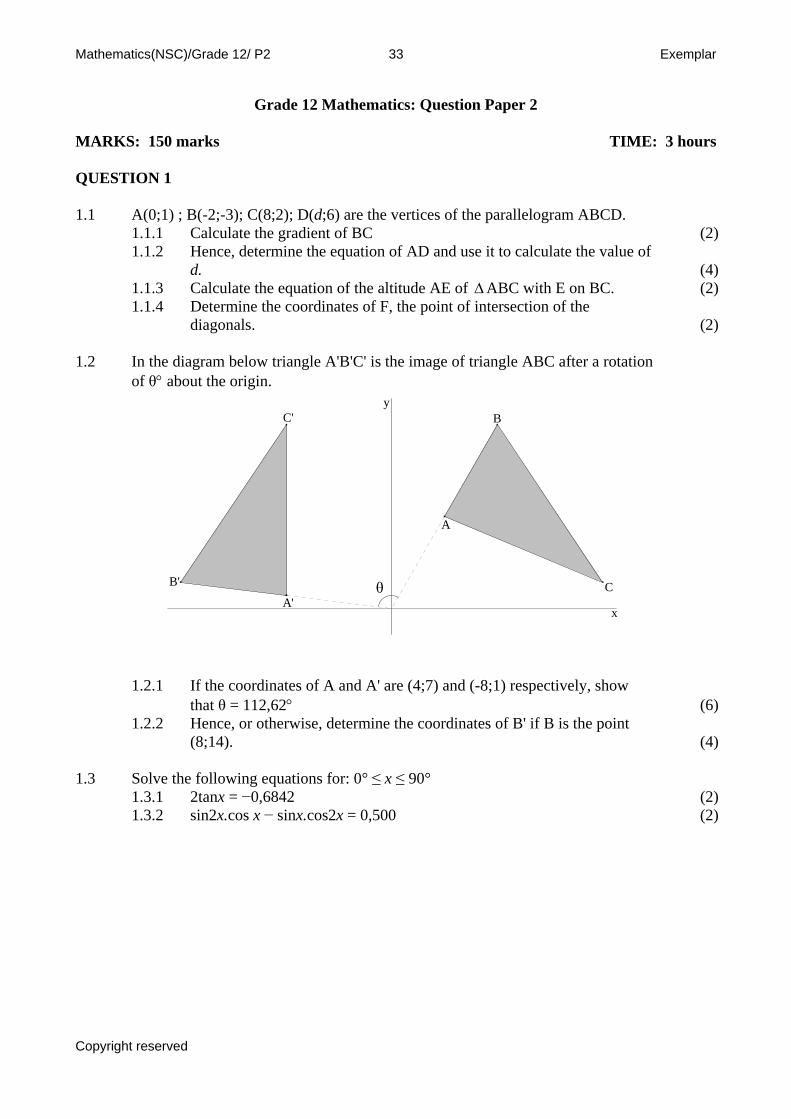
(2) 1.2 In the diagram below triangle A'B'C' is the image of triangle ABC after a rotation
of θ° about the origin.
x
yC'
B'
A'C
B
A
θ
1.2.1 If the coordinates of A and A' are (4;7) and (-8;1) respectively, show that θ = 112,62°
(6)
1.2.2 Hence, or otherwise, determine the coordinates of B' if B is the point (8;14).
(4)
Solve the following equations for: 0° ≤ x ≤ 90° 1.3
1.3.1 2tanx = −0,6842 (2) 1.3.2 sin2x.cos x − sinx.cos2x = 0,500 (2)
Copyright reserved
Mathematics(NSC)/Grade 12/ P2 34 Exemplar
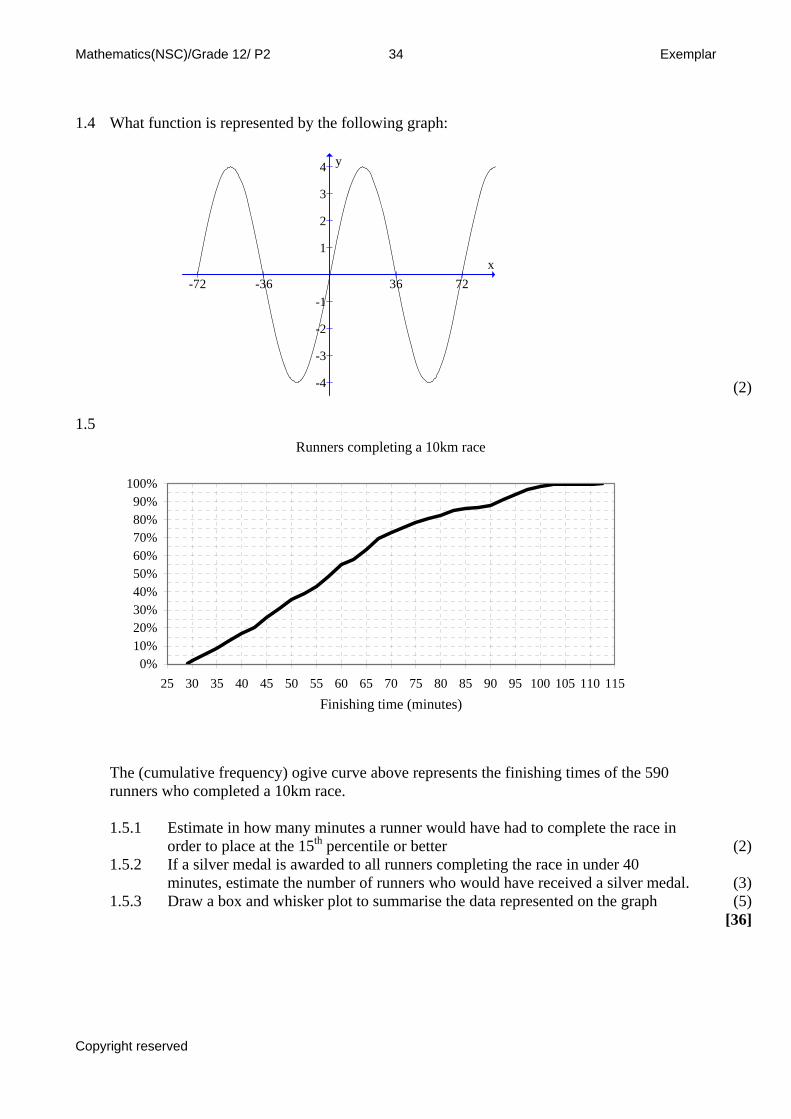
1.4 What function is represented by the following graph:
-72 -36 36 72
-4
-3
-2
-1
1
2
3
4
x
y
(2) 1.5
Runners completing a 10km race
0%10%20%30%40%50%60%70%80%90%
100%
25 30 35 40 45 50 55 60 65 70 75 80 85 90 95 100 105 110 115Finishing time (minutes)
The (cumulative frequency) ogive curve above represents the finishing times of the 590 runners who completed a 10km race.
1.5.1 Estimate in how many minutes a runner would have had to complete the race in
order to place at the 15
th percentile or better (2) 1.5.2 If a silver medal is awarded to all runners completing the race in under 40
minutes, estimate the number of runners who would have received a silver medal.
(3) 1.5.3 Draw a box and whisker plot to summarise the data represented on the graph (5)
[36]
Copyright reserved
Mathematics(NSC)/Grade 12/ P2 35 Exemplar
QUESTION 2 2.1
A(2;0)
M
B(4;-6)
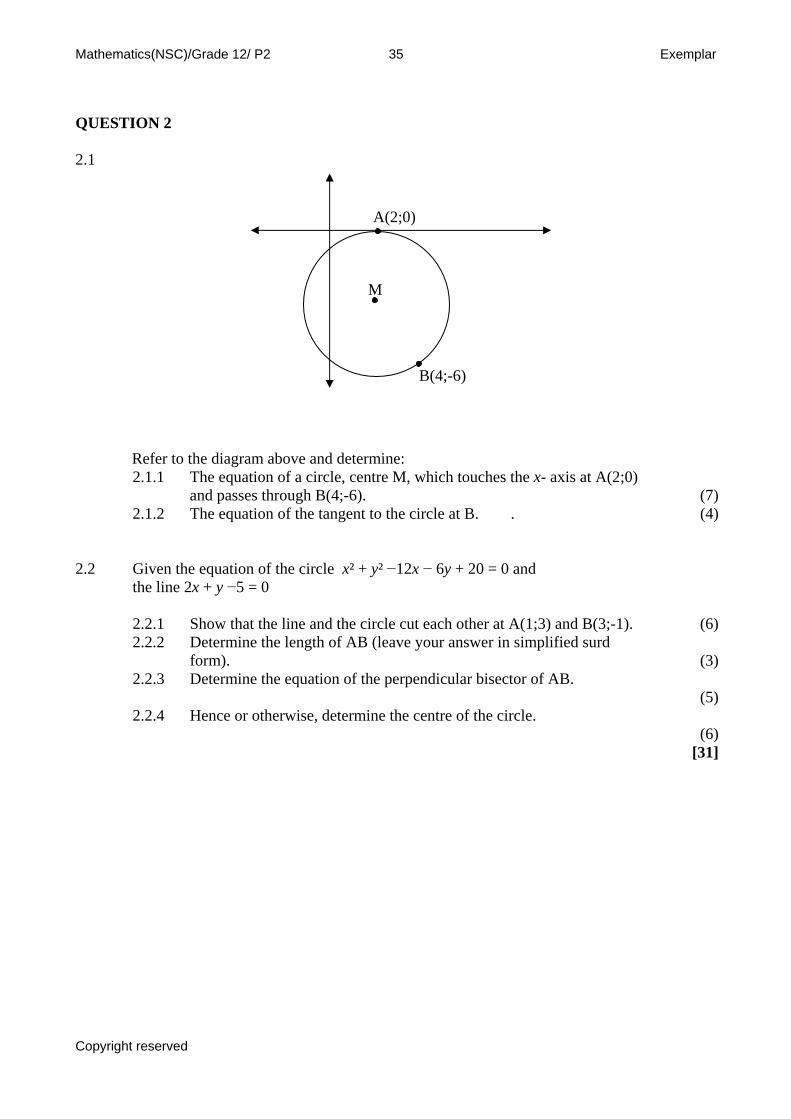
Refer to the diagram above and determine:
The equation of a circle, centre M, which touches the x- axis at A(2;0) and passes through B(4;-6).
2.1.1 (7)
2.1.2 The equation of the tangent to the circle at B. . (4)
Given the equation of the circle x² + y² −12x − 6y + 20 = 0 and 2.2 the line 2x + y −5 = 0
2.2.1 Show that the line and the circle cut each other at A(1;3) and B(3;-1). (6) 2.2.2 Determine the length of AB (leave your answer in simplified surd
form).
(3) 2.2.3 Determine the equation of the perpendicular bisector of AB.
(5) 2.2.4 Hence or otherwise, determine the centre of the circle.
(6) [31]
Copyright reserved
Mathematics(NSC)/Grade 12/ P2 36 Exemplar
QUESTION 3 3.1
x = 4 x = 9
y
x
B'' (r;s)
A'' (11;3)
C''
B' (6;4)
A' (7;3)
C' (p;q)
B (2;4)
A (1;3)
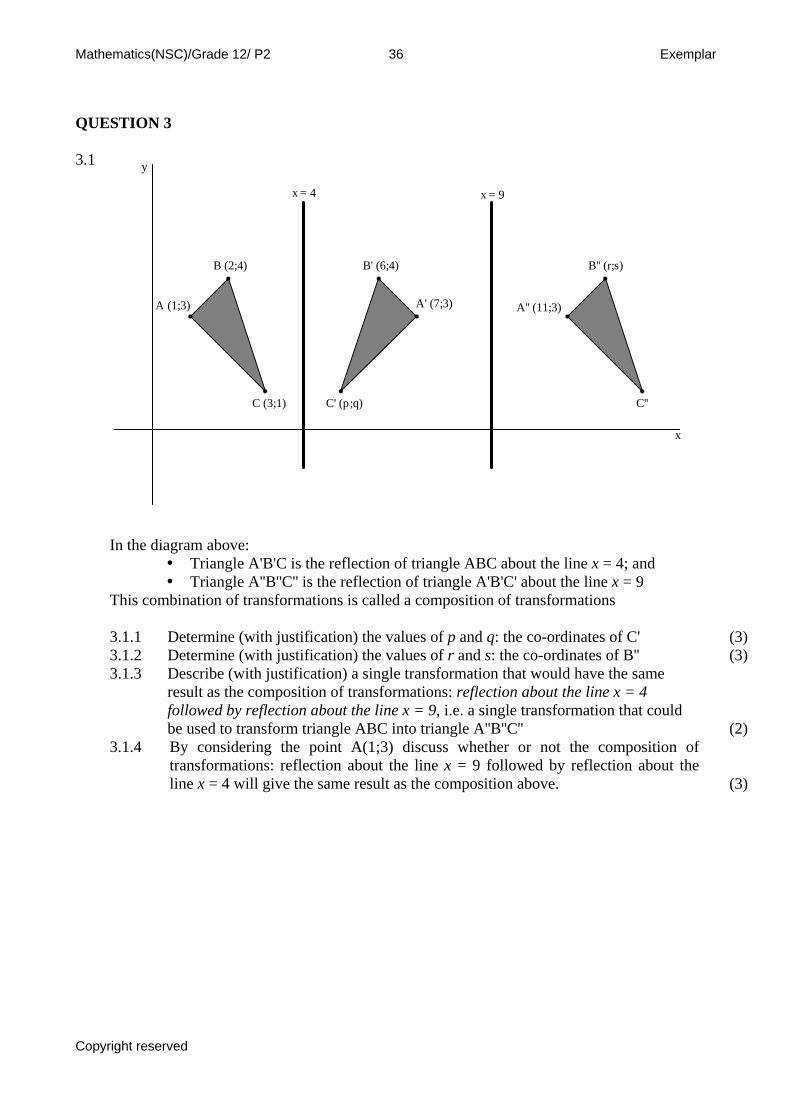
C (3;1)
In the diagram above:
Triangle A'B'C is the reflection of triangle ABC about the line x = 4; and Triangle A''B''C'' is the reflection of triangle A'B'C' about the line x = 9
This combination of transformations is called a composition of transformations
3.1.1 DeteDeteDescresufollo be uBy transline
rmine (with justification) the values of p and q: the co-ordinates of C' (3)rmine (with justification) the values of r and s: the co-ordinates of B'' 3.1.2 (3)
3.1.3 ribe (with justification) a single transformation that would have the same lt as the composition of transformations: reflection about the line x = 4 wed by reflection about the line x = 9, i.e. a single transformation that couldsed to transform triangle ABC into triangle A''B''C''
(2) 3.1.4 considering the point A(1;3) discuss whether or not the composition of
formations: reflection about the line x = 9 followed by reflection about the x = 4 will give the same result as the composition above.
(3)
Copyright reserved
Mathematics(NSC)/Grade 12/ P2 37 Exemplar
3.2
y = x
y
x
F''
E''D''
C''B''
A'' F'
E' D'
C' B'
A'
F E
D C
BA
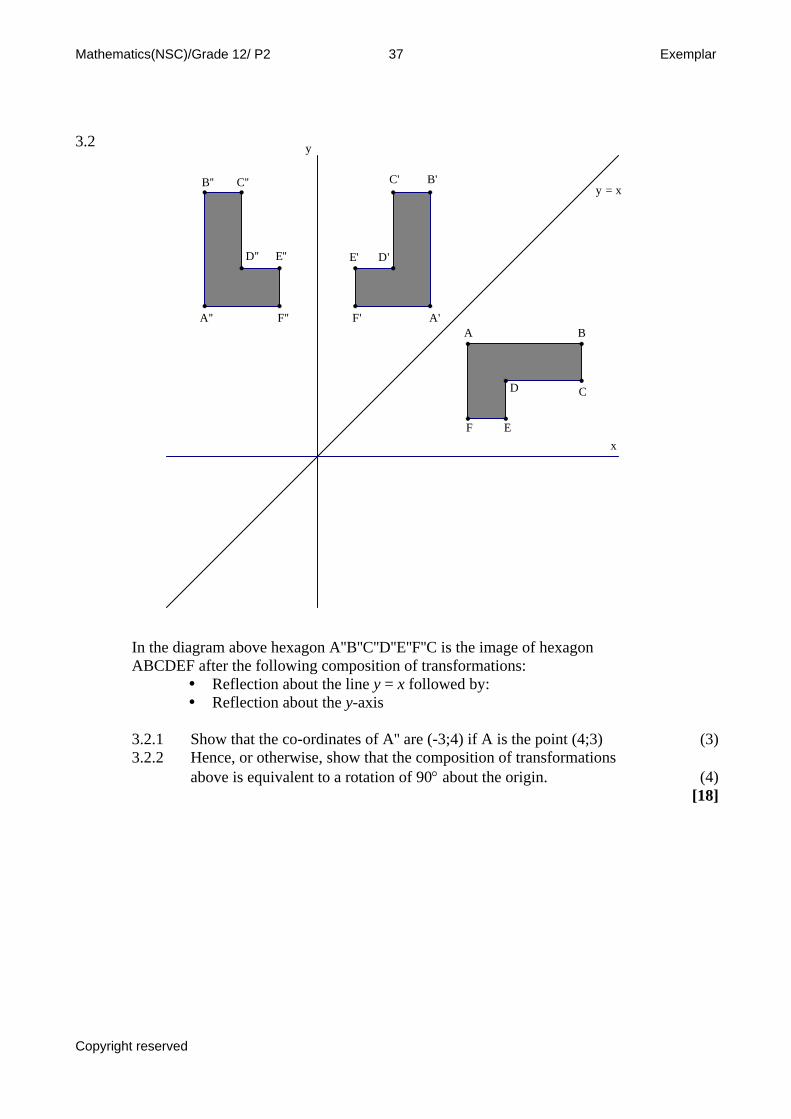
In the diagram above hexagon A''B''C''D''E''F''C is the image of hexagon
ABCDEF after the following composition of transformations:
Reflection about the line y = x followed by: Reflection about the y-axis
3.2.1 Show that the co-ordinates of A'' are (-3;4) if A is the point (4;3) (3) 3.2.2 Hence, or otherwise, show that the composition of transformations
above is equivalent to a rotation of 90° about the origin.
(4) [18]
Copyright reserved
Mathematics(NSC)/Grade 12/ P2 38 Exemplar
QUESTION 4
θθ
θ sincos
sin=
+ 22134.1
4.1.1 Prove the above identity. (6) 4.1.2 Why is the identity not valid for θ = 60° (2) 4.1.3 Without any further calculations, determine another value of θ for
which the identity will not be valid. (1)
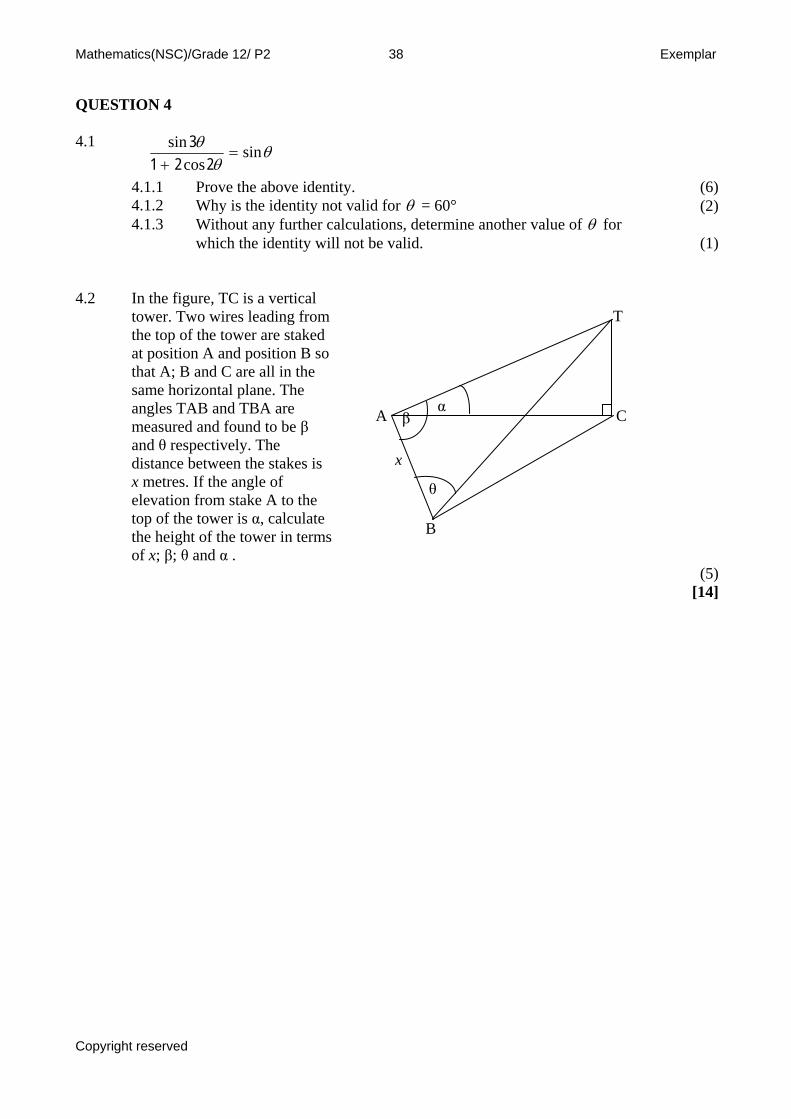
4.2 In the figure, TC is a vertical
tower. Two wires leading from the top of the tower are staked at position A and position B so that A; B and C are all in the same horizontal plane. The angles TAB and TBA are measured and found to be β and θ respectively. The distance between the stakes is x metres. If the angle of elevation from stake A to the top of the tower is α, calculate the height of the tower in terms of x; β; θ and α .
(5) [14]
B
C A
T
α
x
β
θ
Copyright reserved
Mathematics(NSC)/Grade 12/ P2 39 Exemplar
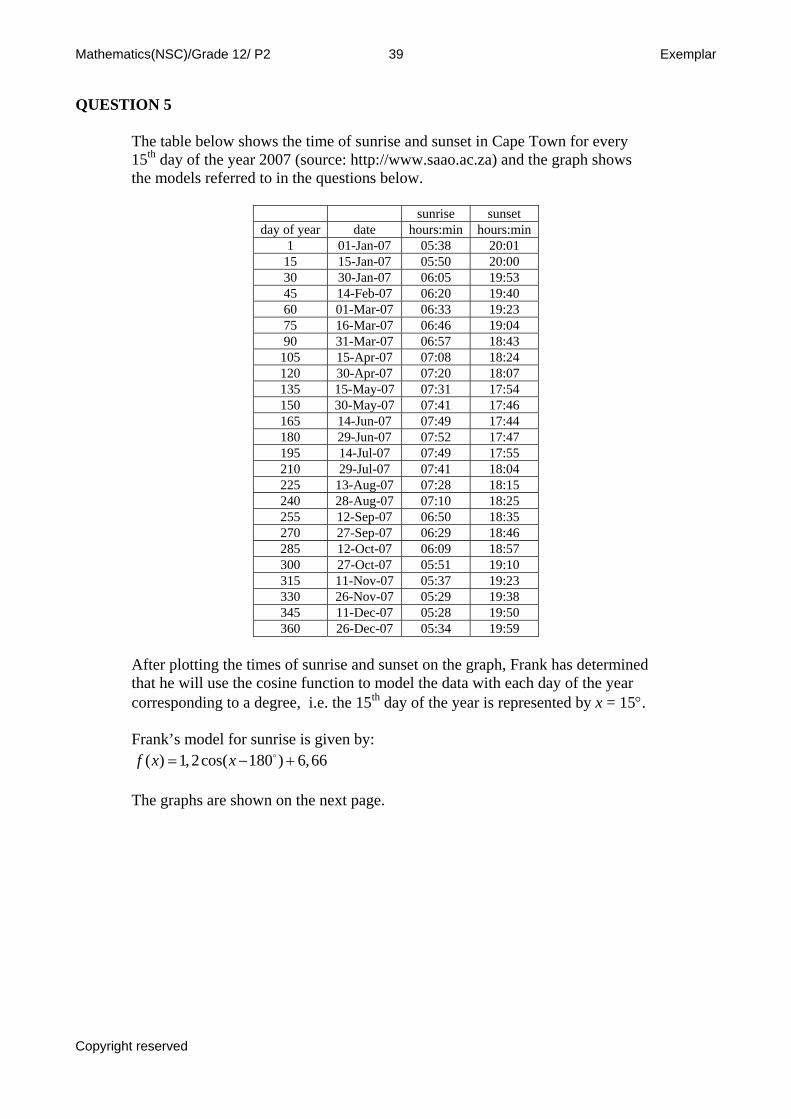
QUESTION 5 The table below shows the time of sunrise and sunset in Cape Town for every
15
th day of the year 2007 (source: http://www.saao.ac.za) and the graph shows the models referred to in the questions below.
sunrise sunset
day of year date hours:min hours:min 1 01-Jan-07 05:38 20:01
15 15-Jan-07 05:50 20:00 30 30-Jan-07 06:05 19:53 45 14-Feb-07 06:20 19:40 60 01-Mar-07 06:33 19:23 75 16-Mar-07 06:46 19:04 90 31-Mar-07 06:57 18:43
105 15-Apr-07 07:08 18:24 120 30-Apr-07 07:20 18:07 135 15-May-07 07:31 17:54 150 30-May-07 07:41 17:46 165 14-Jun-07 07:49 17:44 180 29-Jun-07 07:52 17:47 195 14-Jul-07 07:49 17:55 210 29-Jul-07 07:41 18:04 225 13-Aug-07 07:28 18:15 240 28-Aug-07 07:10 18:25 255 12-Sep-07 06:50 18:35 270 27-Sep-07 06:29 18:46 285 12-Oct-07 06:09 18:57 300 27-Oct-07 05:51 19:10 315 11-Nov-07 05:37 19:23 330 26-Nov-07 05:29 19:38 345 11-Dec-07 05:28 19:50 360 26-Dec-07 05:34 19:59
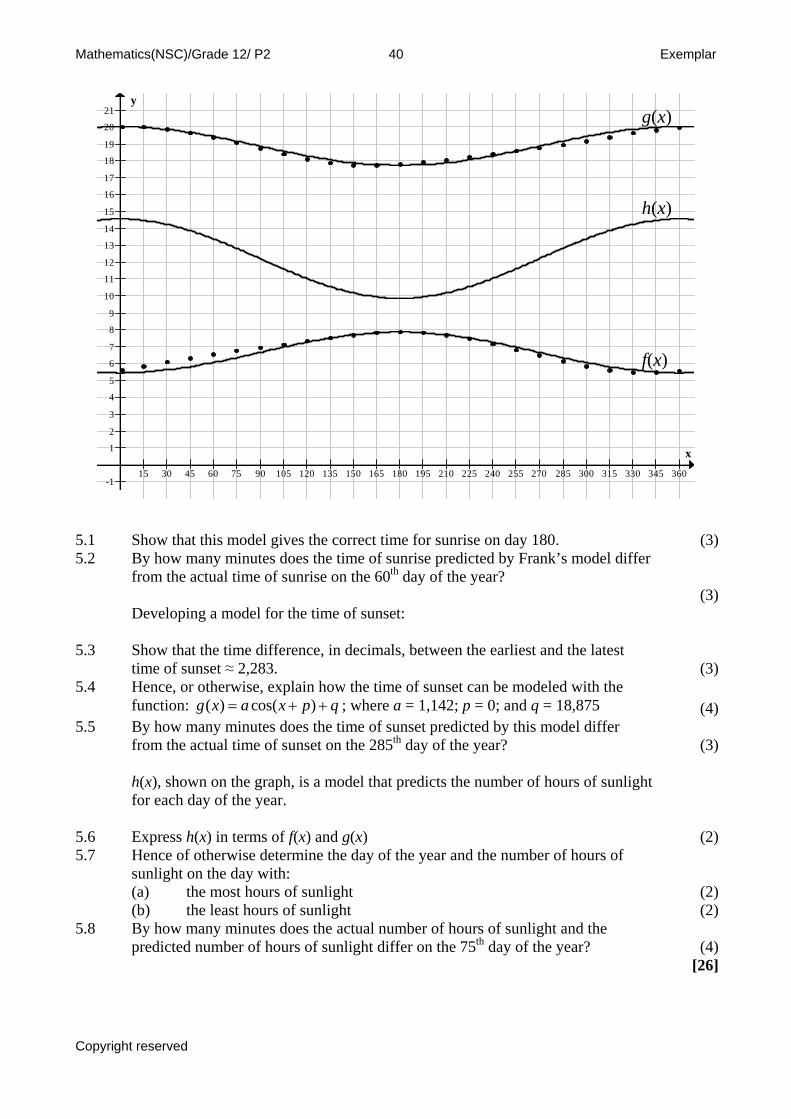
After plotting the times of sunrise and sunset on the graph, Frank has determined
that he will use the cosine function to model the data with each day of the year corresponding to a degree, i.e. the 15
th day of the year is represented by x = 15°. Frank’s model for sunrise is given by:
( ) 1,2cos( 180 ) 6,66f x x= − + The graphs are shown on the next page.
Copyright reserved
Mathematics(NSC)/Grade 12/ P2 40 Exemplar
Copyright reserved
15 30 45 60 75 90 105 120 135 150 165 180 195 210 225 240 255 270 285 300 315 330 345 360-1
1
2
3
4
5
6
7
8
9
10
11
12
13
14
15
16
17
18
19
20
21
x
y
f(x)
h(x)
g(x)
5.1 Show that this model gives the correct time for sunrise on day 180. (3)5.2 By how many minutes does the time of sunrise predicted by Frank’s model differ
from the actual time of sunrise on the 60
th day of the year? (3)
Developing a model for the time of sunset:
5.3 Show that the time difference, in decimals, between the earliest and the latest time of sunset ≈ 2,283.
(3)
5.4 Hence, or otherwise, explain how the time of sunset can be modeled with the function: ; where a = 1,142; p = 0; and q = 18,875
( ) cos( )g x a x p q= + + (4)
5.5 By how many minutes does the time of sunset predicted by this model differ from the actual time of sunset on the 285
th day of the year? (3)
h(x), shown on the graph, is a model that predicts the number of hours of sunlight for each day of the year.
5.6 Express h(x) in terms of f(x) and g(x) (2)5.7 Hence of otherwise determine the day of the year and the number of hours of
sunlight on the day with:
the most hours of sunlight (a) (2)the least hours of sunlight (b) (2)
5.8 By how many minutes does the actual number of hours of sunlight and the predicted number of hours of sunlight differ on the 75
th day of the year? (4)
[26]
Mathematics(NSC)/Grade 12/ P2 41 Exemplar
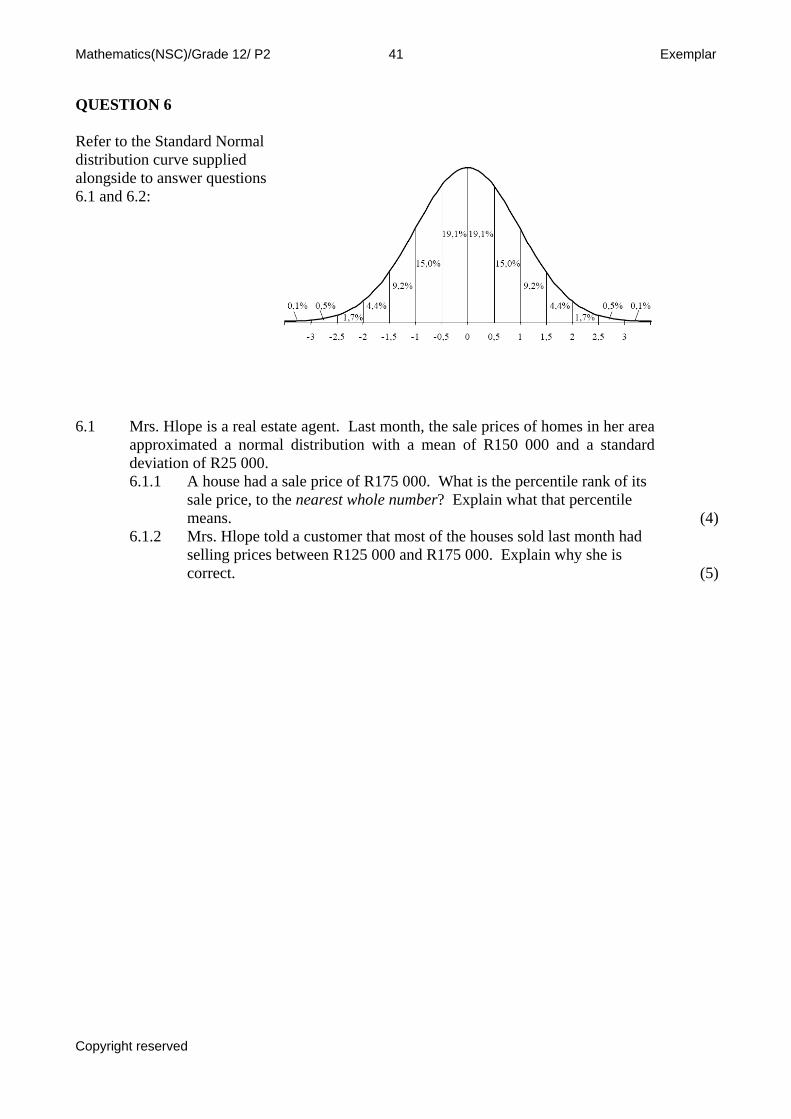
QUESTION 6 Refer to the Standard Normal distribution curve supplied alongside to answer questions 6.1 and 6.2:
6.1 Mrs. Hlope is a real estate agent. Last month, the sale prices of homes in her area approximated a normal distribution with a mean of R150 000 and a standard deviation of R25 000.
6.1.1 A house had a sale price of R175 000. What is the percentile rank of its sale price, to the nearest whole number? Explain what that percentile means.
(4) 6.1.2 Mrs. Hlope told a customer that most of the houses sold last month had
selling prices between R125 000 and R175 000. Explain why she is correct.
(5)
Copyright reserved
Mathematics(NSC)/Grade 12/ P2 42 Exemplar
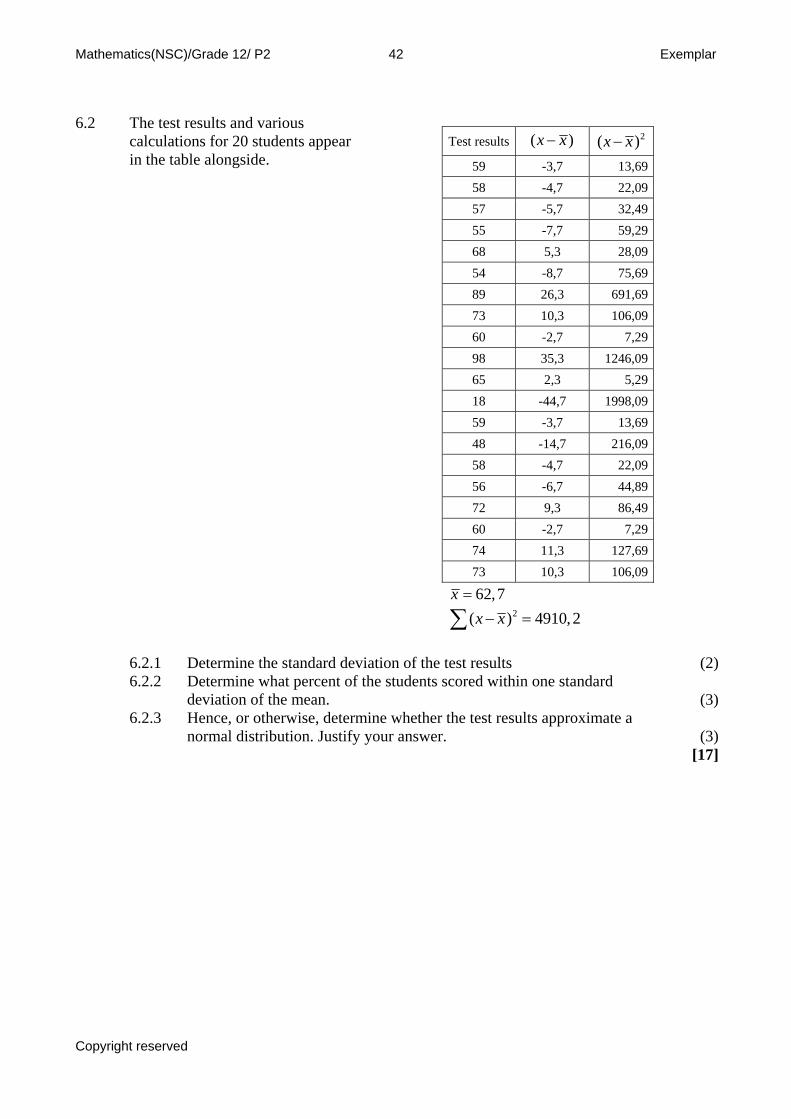
6.2 The test results and various
calculations for 20 students appear in the table alongside.
Test results ( )x x− 2( )
x x−
59 -3,7 13,69 58 -4,7 22,09 57 -5,7 32,49 55 -7,7 59,29 68 5,3 28,09 54 -8,7 75,69 89 26,3 691,69 73 10,3 106,09 60 -2,7 7,29 98 35,3 1246,09 65 2,3 5,29 18 -44,7 1998,09 59 -3,7 13,69 48 -14,7 216,09 58 -4,7 22,09 56 -6,7 44,89 72 9,3 86,49 60 -2,7 7,29 74 11,3 127,69 73 10,3 106,09
62,7x = ∑ 2( ) 4910,2x x− =
6.2.1 Determine the standard deviation of the test results (2) 6.2.2 Determine what percent of the students scored within one standard
deviation of the mean.
(3) 6.2.3 Hence, or otherwise, determine whether the test results approximate a
normal distribution. Justify your answer.
(3)[17]
Copyright reserved
Mathematics(NSC)/Grade 12/ P2 43 Exemplar
QUESTION 7
– End of Paper –
Egg weight and new-born chicken weight
30
35
40
45
50
40 45 50 55 60 65 70 75
Egg weight (g)
Wei
ght (
g)
A B C D
E
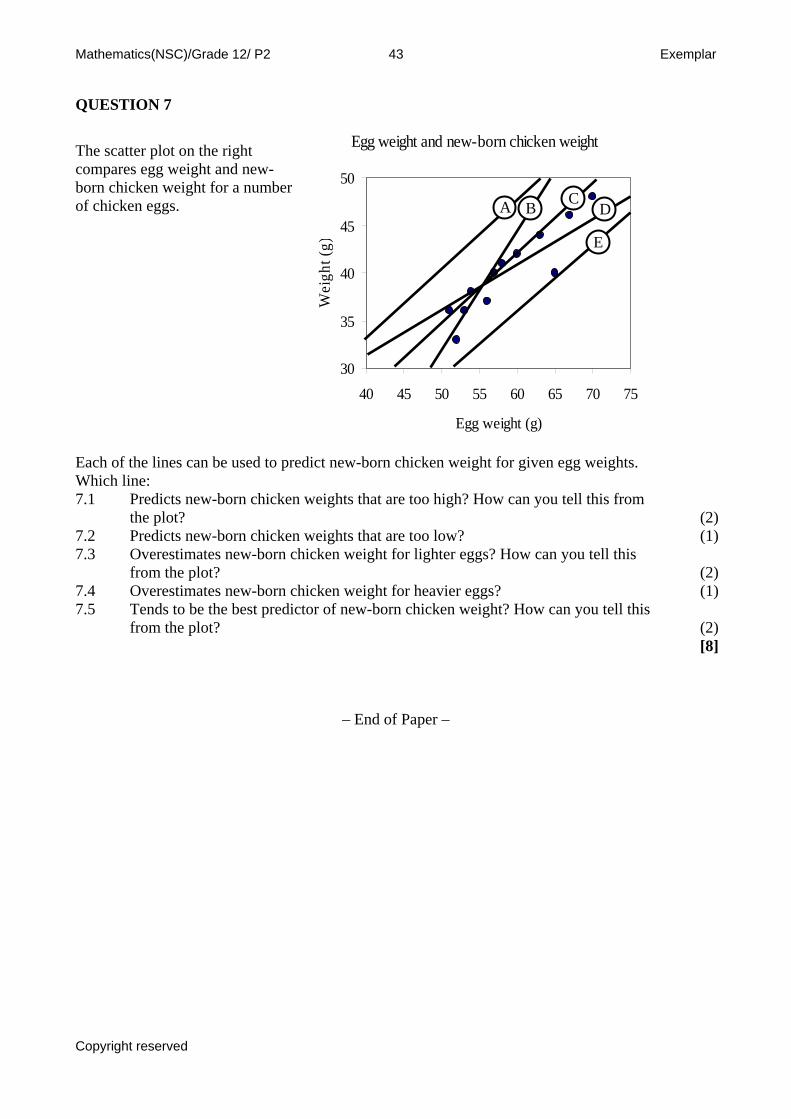
The scatter plot on the right compares egg weight and new-born chicken weight for a number of chicken eggs.
Each of the lines can be used to predict new-born chicken weight for given egg weights. Which line:
7.1 Predicts new-born chicken weights that are too high? How can you tell this from the plot?
(2)
7.2 Predicts new-born chicken weights that are too low? (1)7.3 Overestimates new-born chicken weight for lighter eggs? How can you tell this
from the plot?
(2)7.4 Overestimates new-born chicken weight for heavier eggs? (1)7.5 Tends to be the best predictor of new-born chicken weight? How can you tell this
from the plot?
(2)[8]
Copyright reserved
Mathematical Literacy(NSC)/Grade 10 44 Exemplar
Grade 10 Mathematical Literacy
MARKS: 150 TIME: 3 hours QUESTION 1 1.1 Calculate the following: 1.1.1. 3,5(7,45 − 2,98) (1) 1.1.2 35 + 12 × 4 (1) 1.1.3 3
4 of R375 (2)
1.1.4 34 + 1
12
(1)
1.2 A pair of jeans costs R299. How much will you pay for them if you get a 3313 %
discount?
(2) 1.3 The dilution instructions on an energy sports drink concentrate are:
dilution ratio (concentrate and water) 1 + 4.
1.3.1 Explain what is meant by this instruction. (2) 1.3.2 How many ml of concentrate and how many ml of water do you need to
make up 1litre of energy drink?
(2) 1.3.3 If your friend mixes 31
2 cups concentrate with 15 cups of water, will his
energy drink taste the same as yours? Explain your answer.
(3) 1.4 Vusi works at a car-wash. He earns R55 a day plus R10 for every car he washes.
Calculate how much he earned if he:
1.4.1 washed 5 cars. (2) 1.4.2 washed 7 cars (2) 1.4.3 washed n cars. (2) 1.5 Fatimah is getting a 5,5% increase in salary and Ali is getting an increase in salary
of R292,50 more per month. Fatimah earns R4 575 per month and Ali earns R6 500 per month.
1.5.1 Determine Fatimah’s new salary per month. (2) 1.5.2 Who received the greater increase in terms of actual money? (1) 1.5.3 Who received the greater percentage increase? Show your working. (2) 1.6 Prisilla earned R1 725 for 15 days work. Determine how much she would earn if
she worked for 20 days.
(3) 1.7 The scale on a map is 1:50 000. If the distance between two towns on the map is
3,7cm, determine the distance between the towns in kilometers.
(4)
Copyright reserved
Mathematical Literacy(NSC)/Grade 10 45 Exemplar
1.8 Bongani sells small wire and bead items at the side of the road. He records his
earnings for a week. Use the information below to answer the questions that follow:
Earnings Monday R49,50 Tuesday R172,00 Wednesday R185,50 Thursday R113,50 Friday R139,00 Saturday R405,00 Sunday R54,50
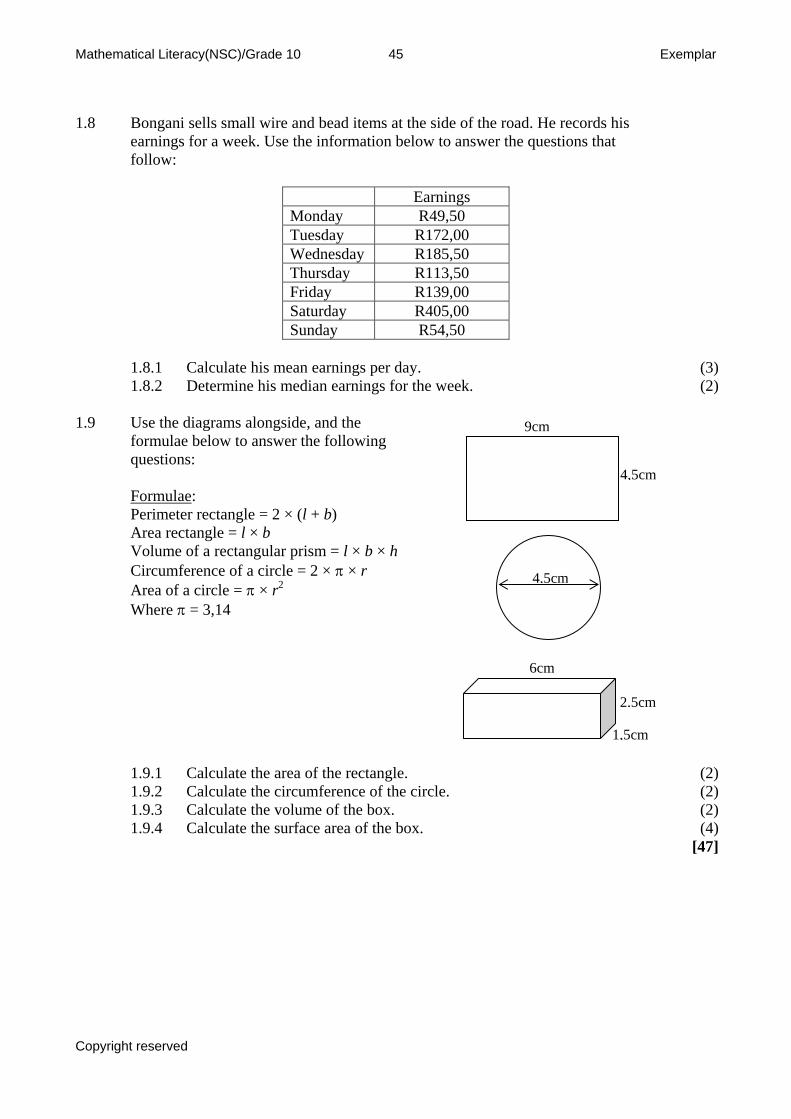
1.8.1 Calculate his mean earnings per day. (3) 1.8.2 Determine his median earnings for the week. (2) 1.9 Use the diagrams alongside, and the
formulae below to answer the following questions: Formulae: Perimeter rectangle = 2 × (l + b) Area rectangle = l × b Volume of a rectangular prism = l × b × h Circumference of a circle = 2 × π × r Area of a circle = π × r2
Where π = 3,14
1.9.1 Calculate the area of the rectangle. (2) 1.9.2 Calculate the circumference of the circle. (2) 1.9.3 Calculate the volume of the box. (2) 1.9.4 Calculate the surface area of the box. (4) [47]
4
9cm
,5cm
4,5cm
2
6cm
,5cm
1,5cm
Copyright reserved
Mathematical Literacy(NSC)/Grade 10 46 Exemplar
QUESTION 2 2.1 A bank offers 12% interest per annum. Describe, in your own words, what is
meant by word interest in this context.
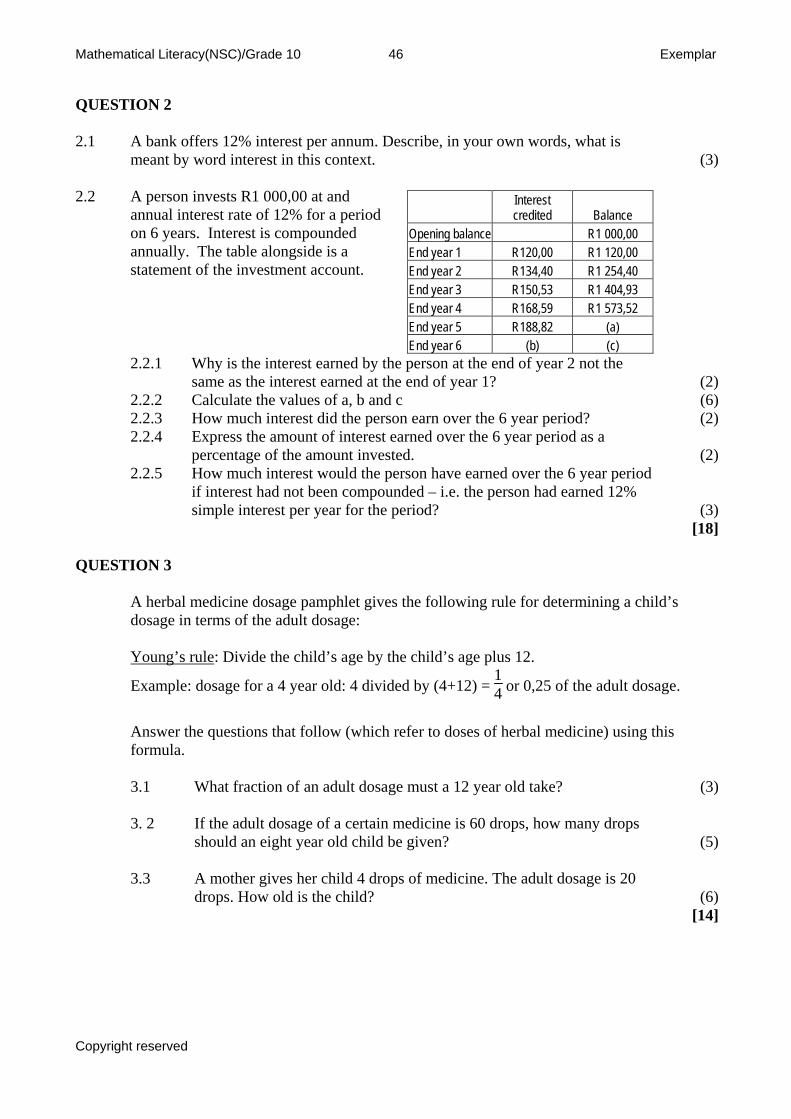
(3) 2.2 A person invests R1 000,00 at and
annual interest rate of 12% for a period on 6 years. Interest is compounded annually. The table alongside is a statement of the investment account.
Interest credited Balance
Opening balance R1 000,00 End year 1 R120,00 R1 120,00 End year 2 R134,40 R1 254,40 End year 3 R150,53 R1 404,93 End year 4 R168,59 R1 573,52 End year 5 R188,82 (a) End year 6 (b) (c)
2.2.1 Why is the interest earned by the person at the end of year 2 not the same as the interest earned at the end of year 1?
(2)
2.2.2 Calculate the values of a, b and c (6) 2.2.3 How much interest did the person earn over the 6 year period? (2) 2.2.4 Express the amount of interest earned over the 6 year period as a
percentage of the amount invested.
(2) 2.2.5 How much interest would the person have earned over the 6 year period
if interest had not been compounded – i.e. the person had earned 12% simple interest per year for the period?
(3) [18] QUESTION 3 A herbal medicine dosage pamphlet gives the following rule for determining a child’s
dosage in terms of the adult dosage: Young’s rule: Divide the child’s age by the child’s age plus 12.
Example: dosage for a 4 year old: 4 divided by (4+12) = 14 or 0,25 of the adult dosage.
Answer the questions that follow (which refer to doses of herbal medicine) using this formula.
3.1 What fraction of an adult dosage must a 12 year old take? (3) 3. 2
If the adult dosage of a certain medicine is 60 drops, how many drops should an eight year old child be given?
(5)
3.3 A mother gives her child 4 drops of medicine. The adult dosage is 20
drops. How old is the child?
(6) [14]
Copyright reserved
Mathematical Literacy(NSC)/Grade 10 47 Exemplar
QUESTION 4 A school counselor conducted a survey among a group of high school students using the
following survey slip:
Survey (please tick the correct boxes) Sex: Male Female Age: 13 -14 15 - 16 17 – 18 How much pressure do you feel to achieve at school?
None A little A lot An unbearable amount
4.1 Show, by completing the survey slip on the answer sheet, how Samantha – a 14
year old girl who feels a lot of pressure to achieve at school – would complete the survey form.
(3) 4.2
The counselor has summarised the data from all of the completed survey forms in the table below. Use this summary to answer the questions that follow:
Male Female 13 – 14 15 – 16 17 – 18 13 – 14 15 – 16 17 – 18 None 4 1 - 5 4 4 A little 9 4 3 7 4 6 A lot 1 3 1 3 6 8 An unbearable amount 3 4 2 2 4 7
4.2.1 How many males and how many females participated in the survey? (2) 4.2.2 The counselor wrote in his report: “more than two out of every five
teenagers feel either a lot or an unbearable amount of pressure to achieve at school”. Show how the counselor could have come to this conclusion.
(4) 4.2.3 Do boys and girls experience this pressure equally or differently?
Substantiate your answer using the information in the table?
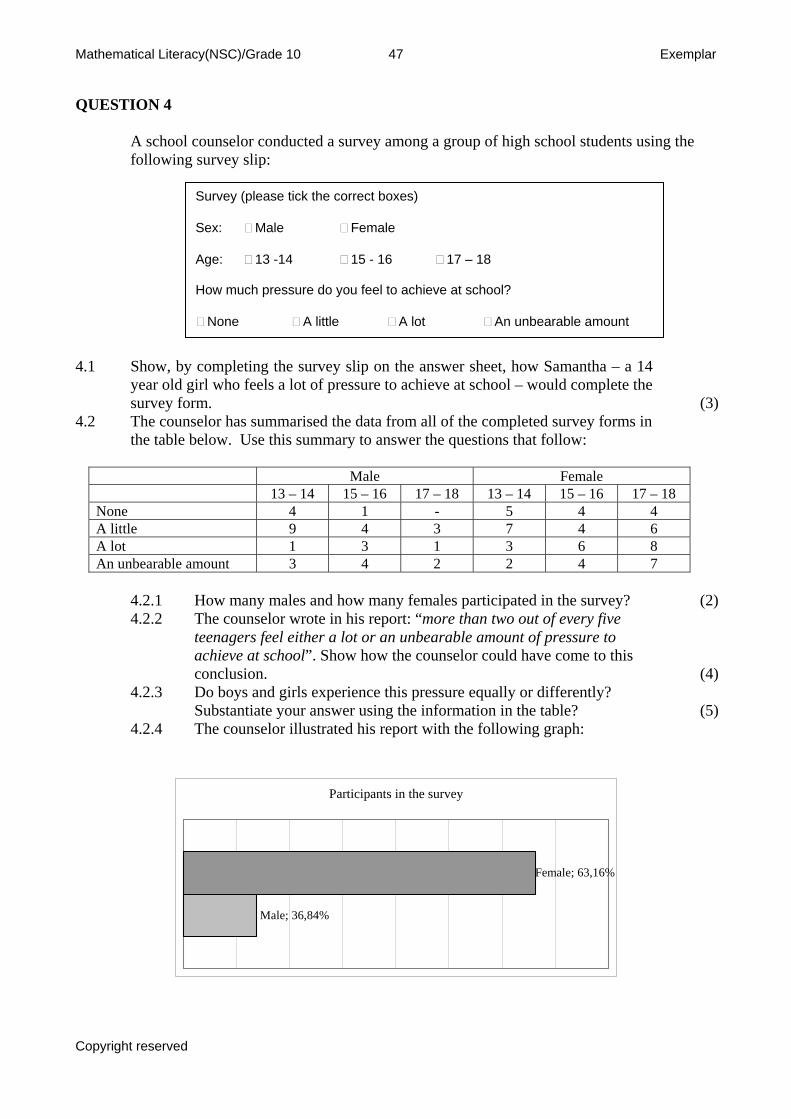
(5) 4.2.4 The counselor illustrated his report with the following graph:
Participants in the survey
Male; 36,84%
Female; 63,16%
Copyright reserved
Mathematical Literacy(NSC)/Grade 10 48 Exemplar
(a) What impression does the graph create about the number of male and female participants?
(2)
(b) Is this impression correct? Substantiate your response (3) (c) What has the counselor done in developing the graph to create
that impression?
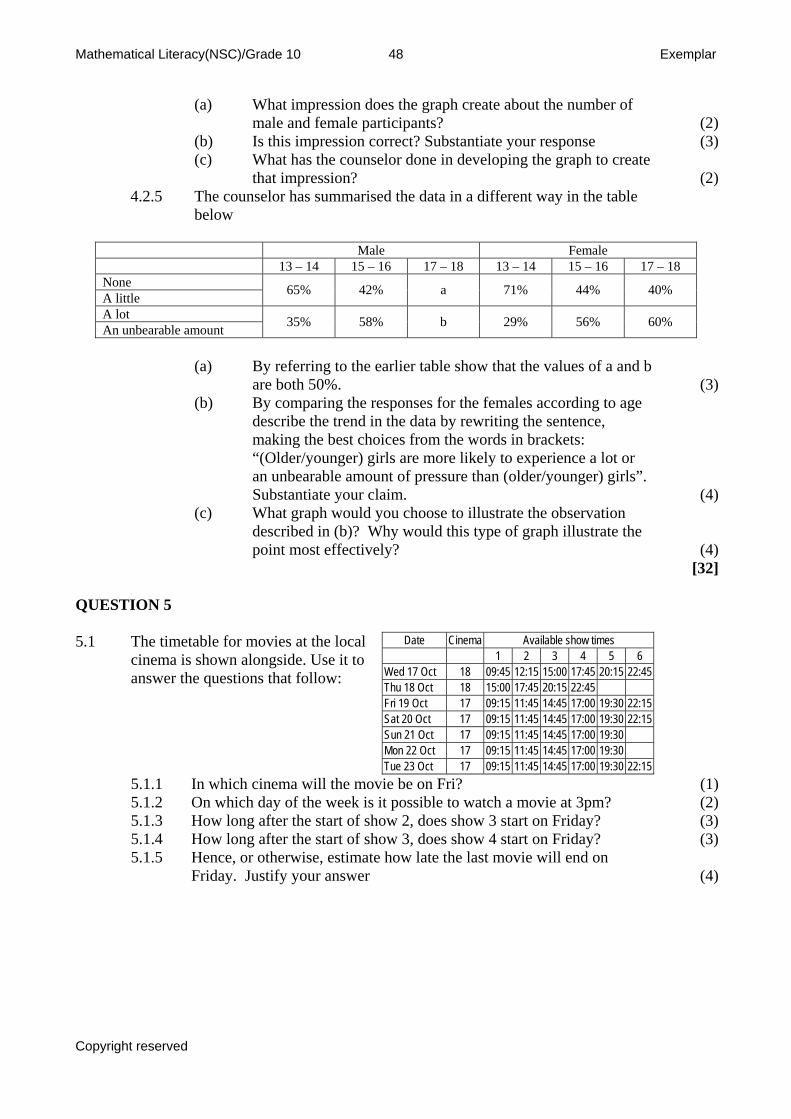
(2) 4.2.5 The counselor has summarised the data in a different way in the table
below
Male Female 13 – 14 15 – 16 17 – 18 13 – 14 15 – 16 17 – 18 None A little 65% 42% a 71% 44% 40%
A lot An unbearable amount 35% 58% b 29% 56% 60%
(a) By referring to the earlier table show that the values of a and b
are both 50%.
(3) (b) By comparing the responses for the females according to age
describe the trend in the data by rewriting the sentence, making the best choices from the words in brackets: “(Older/younger) girls are more likely to experience a lot or an unbearable amount of pressure than (older/younger) girls”. Substantiate your claim.
(4) (c) What graph would you choose to illustrate the observation
described in (b)? Why would this type of graph illustrate the point most effectively?
(4) [32] QUESTION 5 5.1 The timetable for movies at the local
cinema is shown alongside. Use it to answer the questions that follow:
Date Cinema Available show times
1 2 3 4 5 6 Wed 17 Oct 18 09:45 12:15 15:00 17:45 20:15 22:45 Thu 18 Oct 18 15:00 17:45 20:15 22:45 Fri 19 Oct 17 09:15 11:45 14:45 17:00 19:30 22:15 Sat 20 Oct 17 09:15 11:45 14:45 17:00 19:30 22:15 Sun 21 Oct 17 09:15 11:45 14:45 17:00 19:30 Mon 22 Oct 17 09:15 11:45 14:45 17:00 19:30 Tue 23 Oct 17 09:15 11:45 14:45 17:00 19:30 22:15
5.1.1 In which cinema will the movie be on Fri? (1) 5.1.2 On which day of the week is it possible to watch a movie at 3pm? (2) 5.1.3 How long after the start of show 2, does show 3 start on Friday? (3) 5.1.4 How long after the start of show 3, does show 4 start on Friday? (3) 5.1.5 Hence, or otherwise, estimate how late the last movie will end on
Friday. Justify your answer
(4)
Copyright reserved
Mathematical Literacy(NSC)/Grade 10 49 Exemplar
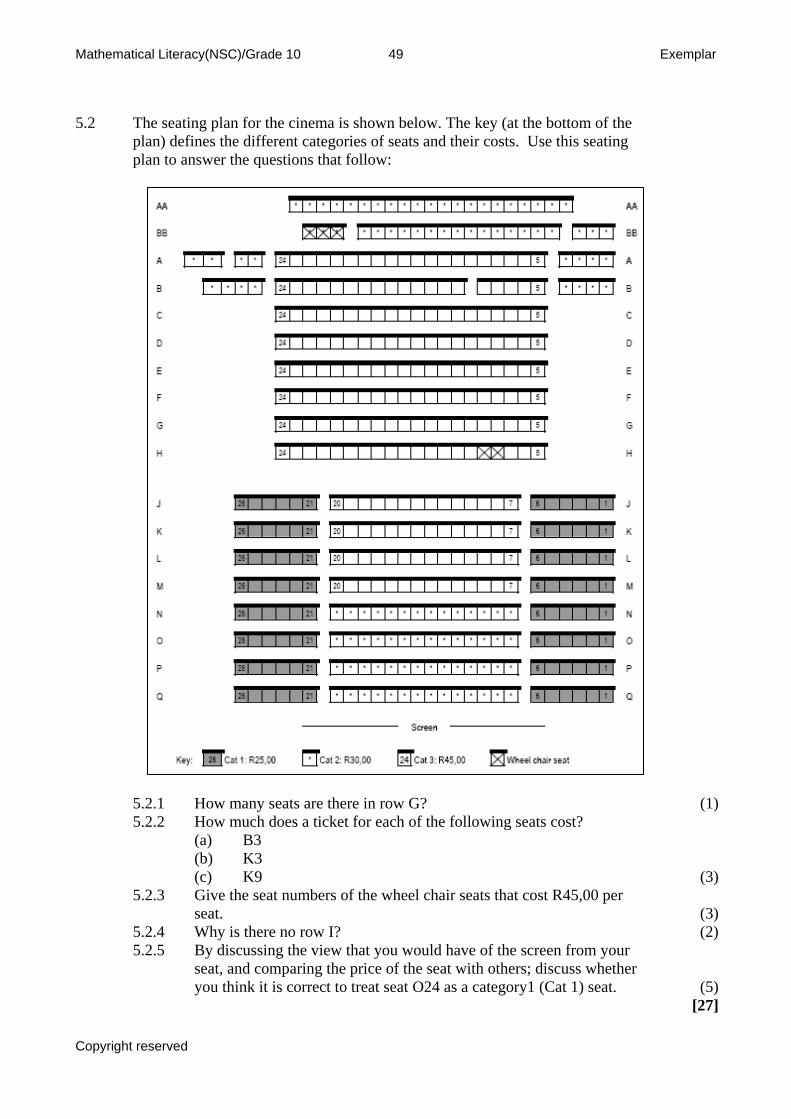
5.2 The seating plan for the cinema is shown below. The key (at the bottom of the
plan) defines the different categories of seats and their costs. Use this seating plan to answer the questions that follow:
5.2.1 How many seats are there in row G? (1) 5.2.2 How much does a ticket for each of the following seats cost? (a) B3 (b) K3 (c) K9 (3) 5.2.3 Give the seat numbers of the wheel chair seats that cost R45,00 per
seat.
(3) 5.2.4 Why is there no row I? (2) 5.2.5 By discussing the view that you would have of the screen from your
seat, and comparing the price of the seat with others; discuss whether you think it is correct to treat seat O24 as a category1 (Cat 1) seat.
(5) [27]
Copyright reserved
Mathematical Literacy(NSC)/Grade 10 50 Exemplar
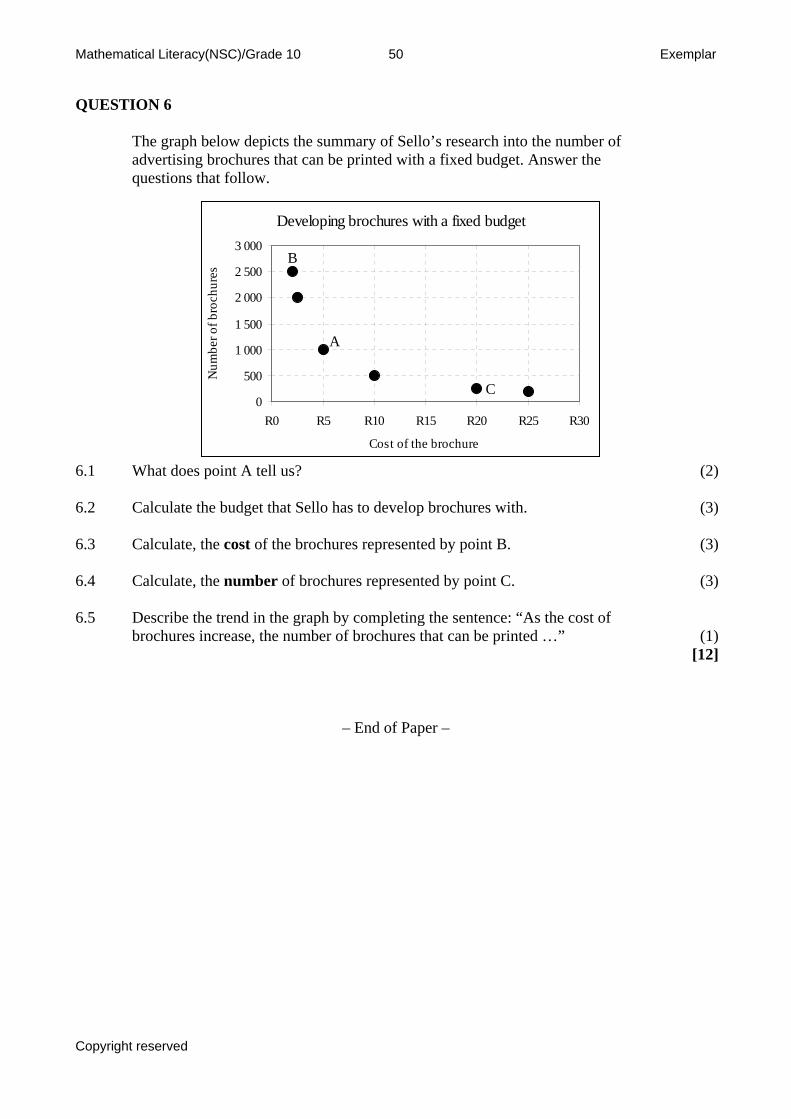
QUESTION 6 The graph below depicts the summary of Sello’s research into the number of
advertising brochures that can be printed with a fixed budget. Answer the questions that follow.
6.1 What does point A tell us?
Developing brochures with a fixed budget
0
500
1 000
1 500
2 000
2 500
3 000
R0 R5 R10 R15 R20 R25 R30
Cost of the brochure
Num
ber o
f bro
chur
es
A
B
C
(2) 6.2 Calculate the budget that Sello has to develop brochures with. (3) 6.3 Calculate, the cost of the brochures represented by point B. (3) 6.4 Calculate, the number of brochures represented by point C. (3) 6.5 Describe the trend in the graph by completing the sentence: “As the cost of
brochures increase, the number of brochures that can be printed …”
(1) [12]
– End of Paper –
Copyright reserved
Mathematical Literacy (NSC)/Grade 11/ P1 51 Exemplar
Grade 11 Mathematical Literacy: Question Paper 1
MARKS: 100 TIME: 2 12 hours SECTION A
QUESTION 1 1.1 Notice that this examination paper is 2 and a half hours long and is out of a total
of 100 marks.
1.1.1 How many minutes do you have in which to complete the paper? (1) 1.1.2 At what rate must you work to ensure that you finish the examination
within the time allowed?
(2) 1.1.3 Using your answer to 1.1.2 above, which question should you be
working on 15 minutes after the examination has started?
(2) 1.2 Calculate each of the following (you need only write down the answer): 1.2.1 275260 ×+ (1) 1.2.2
3115
326 ×+×
(2)
1.2.3 ( ) 6,07,33,2 ÷+ (1) 1.3 There are 11 people in a soccer team. If there are 49 boys in Grade 11 at your
school who play soccer.
1.3.1 What is the maximum number of soccer teams that can be made? (2) 1.3.2 The ratio of soccer players to non-soccer players in Grade 11 is 1:3.
What is the total number of learners in Grade 11?
(2) 1.4 A soccer team practices for 4 hours a week. Their coach increases their practice
time by 8 %. For how long will they practice now?
(2) 1.5 Express 50 as a percentage of 196. (2) 1.6 Your favourite shop is offering a discount of 20% on an item of clothing which
costs R180. How much does it cost now?
(2) 1.7 Bananas are sold at R5,95 per kilogram. How much would you have to pay 0,4kg
of bananas?
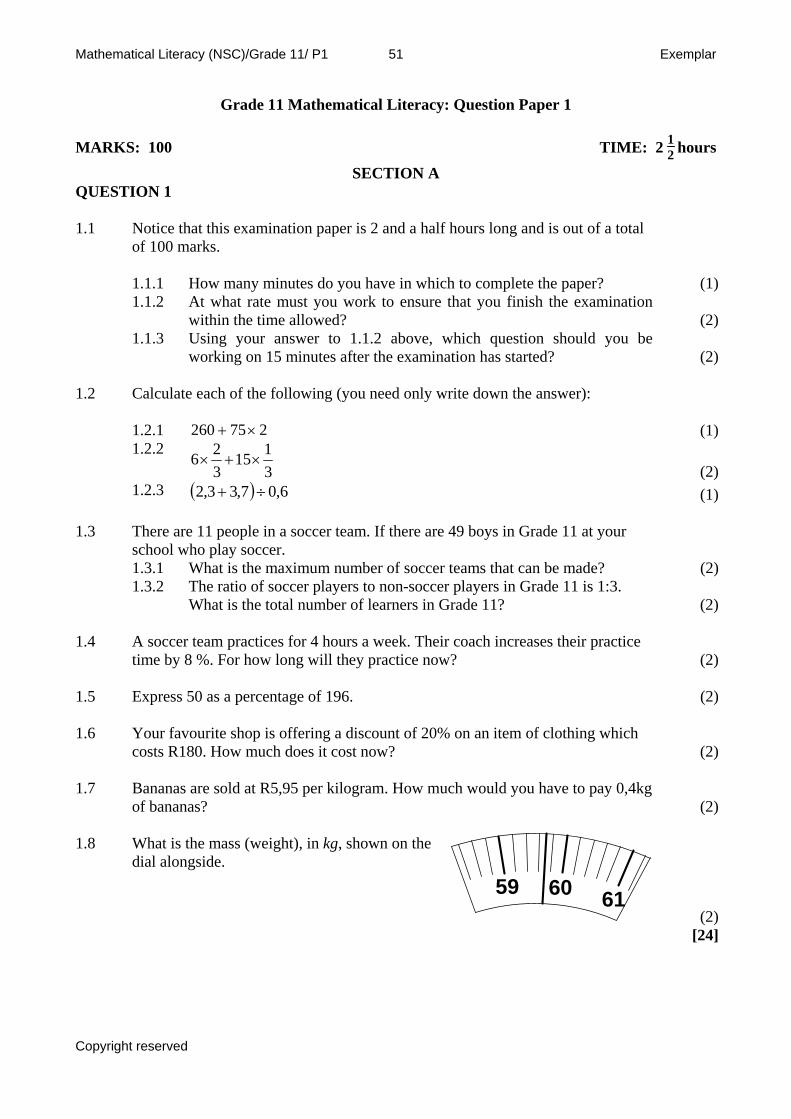
(2) 1.8 What is the mass (weight), in kg, shown on the
dial alongside.
59 60 61 (2)
[24]
Copyright reserved
Mathematical Literacy (NSC)/Grade 11/ P1 52 Exemplar
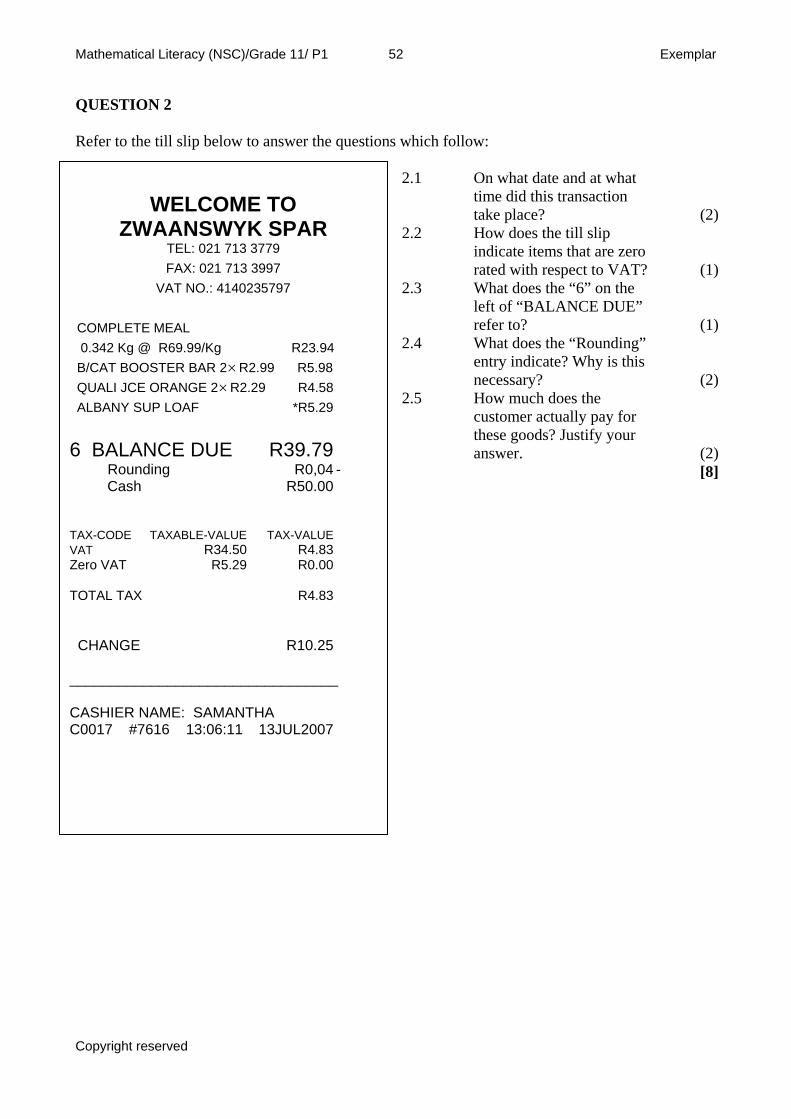
QUESTION 2 Refer to the till slip below to answer the questions which follow: 2.1 On what date and at what
time did this transaction take place?
(2) 2.2 How does the till slip
indicate items that are zero rated with respect to VAT?
(1) 2.3 What does the “6” on the
left of “BALANCE DUE” refer to?
(1) 2.4 What does the “Rounding”
entry indicate? Why is this necessary?
(2) 2.5 How much does the
customer actually pay for these goods? Justify your answer.
(2) [8]
COMPLETE MEAL 0.342 Kg @ R69.99/Kg R23.94 B/CAT BOOSTER BAR 2×R2.99 R5.98 QUALI JCE ORANGE 2 R2.29 R4.58 × ALBANY SUP LOAF *R5.29 6 BALANCE DUE R39.79
Rounding R0,04 - Cash R50.00 TAX-CODE TAXABLE-VALUE TAX-VALUE VAT R34.50 R4.83 Zero VAT R5.29 R0.00 TOTAL TAX R4.83 CHANGE R10.25 _________________________________ CASHIER NAME: SAMANTHA C0017 #7616 13:06:11 13JUL2007
VAT NO.: 4140235797 FAX: 021 713 3997
WELCOME TO
ZWAANSWYK SPAR TEL: 021 713 3779
Copyright reserved
Mathematical Literacy (NSC)/Grade 11/ P1 53 Exemplar
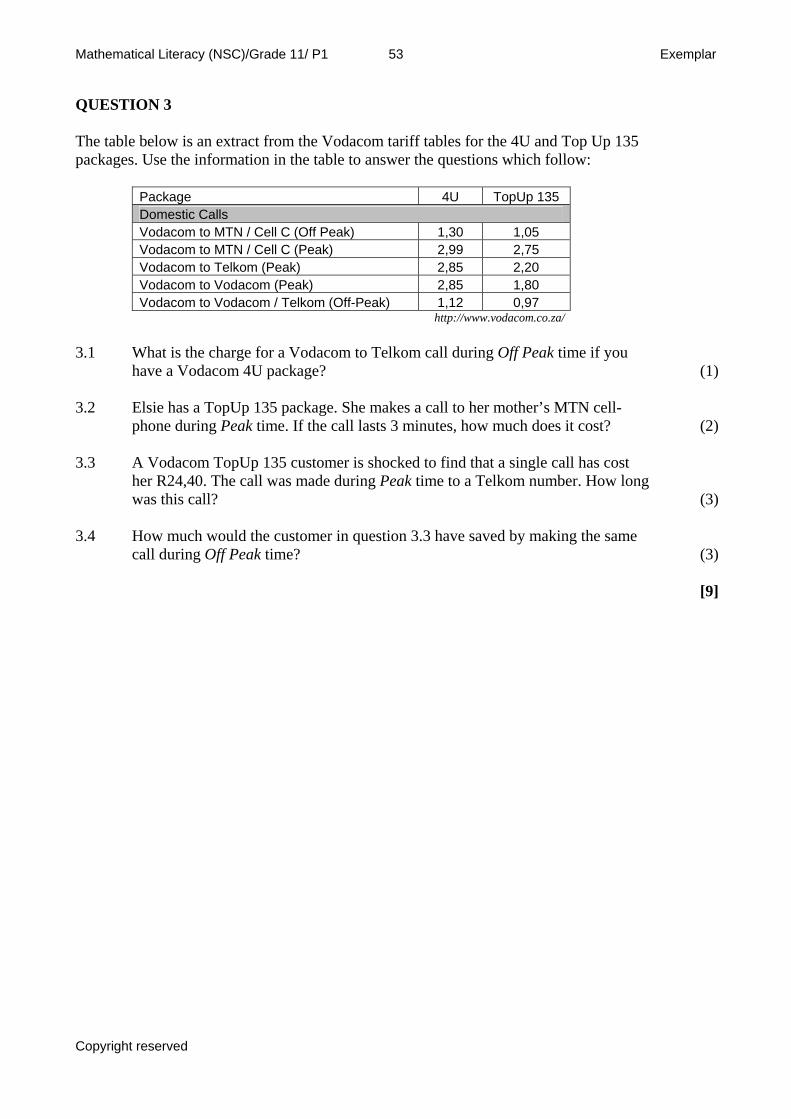
QUESTION 3 The table below is an extract from the Vodacom tariff tables for the 4U and Top Up 135 packages. Use the information in the table to answer the questions which follow:
Package 4U TopUp 135 Domestic Calls Vodacom to MTN / Cell C (Off Peak) 1,30 1,05 Vodacom to MTN / Cell C (Peak) 2,99 2,75 Vodacom to Telkom (Peak) 2,85 2,20 Vodacom to Vodacom (Peak) 2,85 1,80 Vodacom to Vodacom / Telkom (Off-Peak) 1,12 0,97
http://www.vodacom.co.za/
3.1 What is the charge for a Vodacom to Telkom call during Off Peak time if you
have a Vodacom 4U package?
(1) 3.2 Elsie has a TopUp 135 package. She makes a call to her mother’s MTN cell-
phone during Peak time. If the call lasts 3 minutes, how much does it cost?
(2) 3.3 A Vodacom TopUp 135 customer is shocked to find that a single call has cost
her R24,40. The call was made during Peak time to a Telkom number. How long was this call?
(3) 3.4 How much would the customer in question 3.3 have saved by making the same
call during Off Peak time?
(3) [9]
Copyright reserved
Mathematical Literacy (NSC)/Grade 11/ P1 54 Exemplar
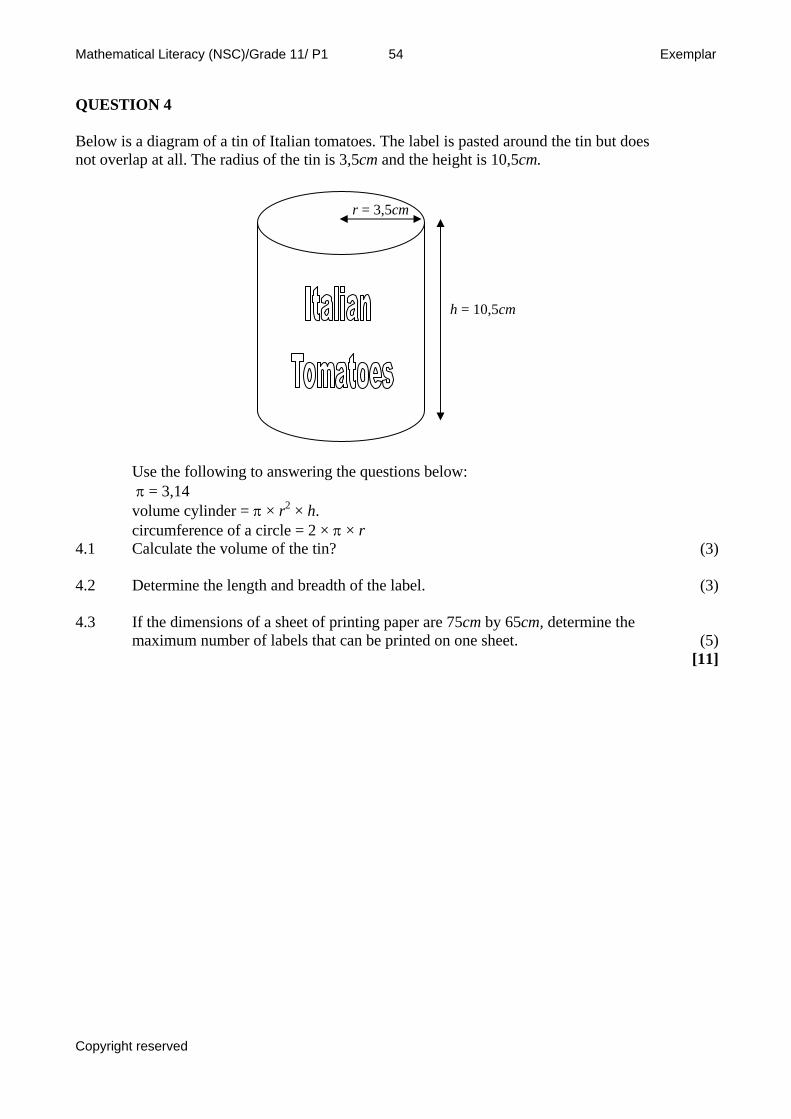
QUESTION 4 Below is a diagram of a tin of Italian tomatoes. The label is pasted around the tin but does not overlap at all. The radius of the tin is 3,5cm and the height is 10,5cm.
r = 3,5cm
h = 10,5cm Use the following to answering the questions below:
π = 3,14 volume cylinder = π × r2 × h. circumference of a circle = 2 × π × r
4.1 Calculate the volume of the tin? (3) 4.2 Determine the length and breadth of the label. (3) 4.3 If the dimensions of a sheet of printing paper are 75cm by 65cm, determine the
maximum number of labels that can be printed on one sheet.
(5) [11]
Copyright reserved
Mathematical Literacy (NSC)/Grade 11/ P1 55 Exemplar
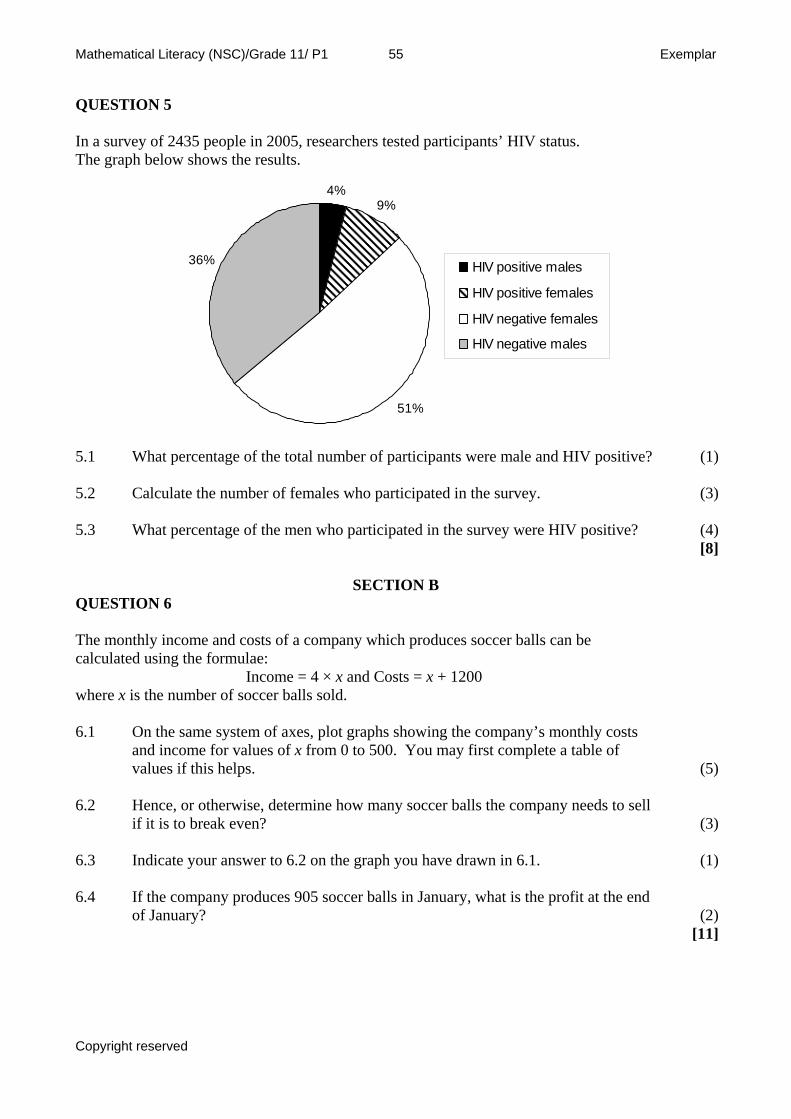
QUESTION 5 In a survey of 2435 people in 2005, researchers tested participants’ HIV status. The graph below shows the results.
4%9%
36%
51%
HIV positive males
HIV positive females
HIV negative females
HIV negative males
5.1 What percentage of the total number of participants were male and HIV positive? (1) 5.2 Calculate the number of females who participated in the survey. (3) 5.3 What percentage of the men who participated in the survey were HIV positive? (4)
[8]
SECTION B QUESTION 6 The monthly income and costs of a company which produces soccer balls can be calculated using the formulae:
Income = 4 × x and Costs = x + 1200 where x is the number of soccer balls sold.
6.1 On the same system of axes, plot graphs showing the company’s monthly costs
and income for values of x from 0 to 500. You may first complete a table of values if this helps.
(5) 6.2 Hence, or otherwise, determine how many soccer balls the company needs to sell
if it is to break even?
(3) 6.3 Indicate your answer to 6.2 on the graph you have drawn in 6.1. (1) 6.4 If the company produces 905 soccer balls in January, what is the profit at the end
of January?
(2)[11]
Copyright reserved
Mathematical Literacy (NSC)/Grade 11/ P1 56 Exemplar
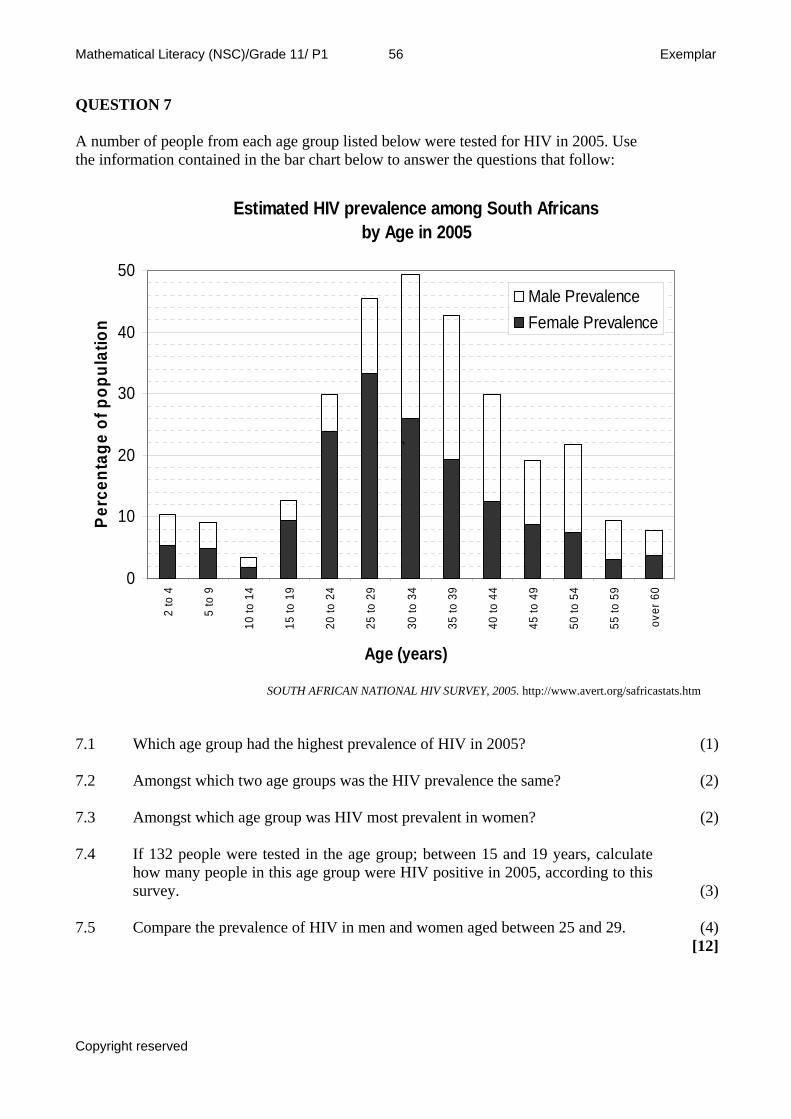
QUESTION 7 A number of people from each age group listed below were tested for HIV in 2005. Use the information contained in the bar chart below to answer the questions that follow:
Estimated HIV prevalence among South Africans by Age in 2005
0
10
20
30
40
50
2 to
4
5 to
9
10 to
14
15 to
19
20 to
24
25 to
29
30 to
34
35 to
39
40 to
44
45 to
49
50 to
54
55 to
59
over
60
Age (years)
Perc
enta
ge o
f pop
ulat
ion
Male PrevalenceFemale Prevalence
`
SOUTH AFRICAN NATIONAL HIV SURVEY, 2005. http://www.avert.org/safricastats.htm
7.1 Which age group had the highest prevalence of HIV in 2005? (1) 7.2 Amongst which two age groups was the HIV prevalence the same? (2) 7.3 Amongst which age group was HIV most prevalent in women? (2) 7.4 If 132 people were tested in the age group; between 15 and 19 years, calculate
how many people in this age group were HIV positive in 2005, according to this survey.
(3) 7.5 Compare the prevalence of HIV in men and women aged between 25 and 29. (4)
[12]
Copyright reserved
Mathematical Literacy (NSC)/Grade 11/ P1 57 Exemplar
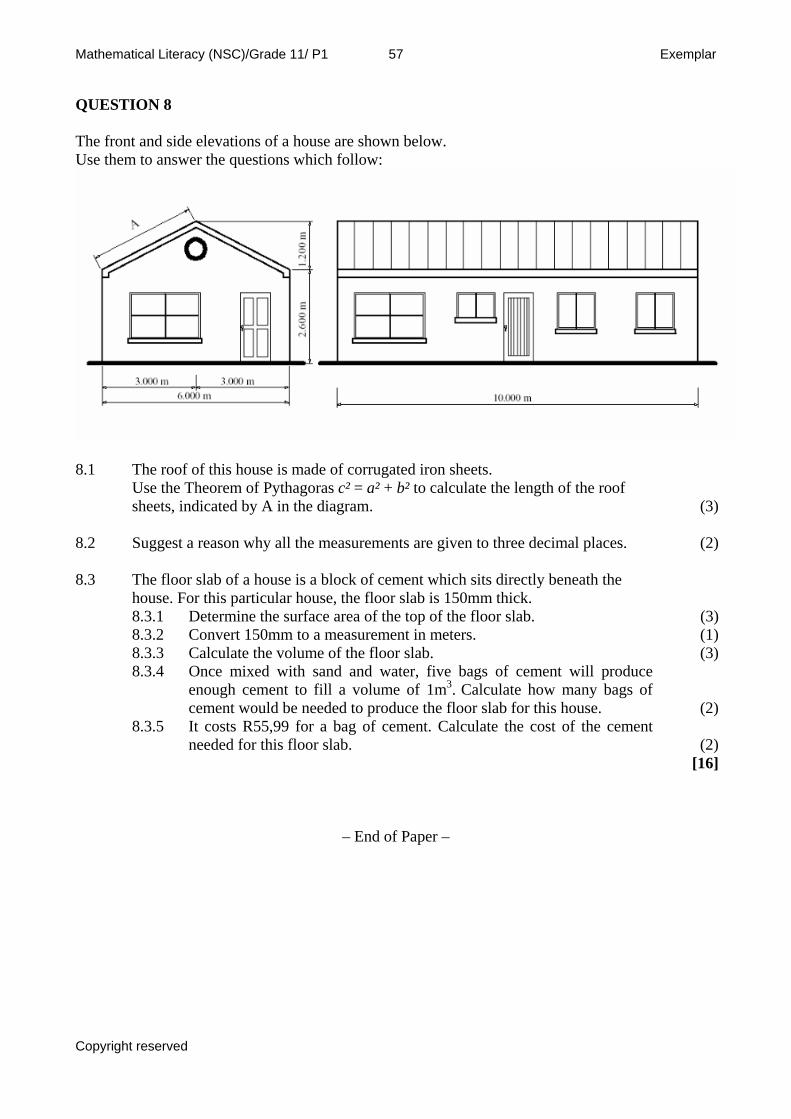
QUESTION 8 The front and side elevations of a house are shown below. Use them to answer the questions which follow:
8.1 The roof of this house is made of corrugated iron sheets. Use the Theorem of Pythagoras c² = a² + b² to calculate the length of the roof sheets, indicated by A in the diagram.
(3) 8.2 Suggest a reason why all the measurements are given to three decimal places. (2) 8.3 The floor slab of a house is a block of cement which sits directly beneath the
house. For this particular house, the floor slab is 150mm thick.
8.3.1 Determine the surface area of the top of the floor slab. (3) 8.3.2 Convert 150mm to a measurement in meters. (1) 8.3.3 Calculate the volume of the floor slab. (3) 8.3.4 Once mixed with sand and water, five bags of cement will produce
enough cement to fill a volume of 1m3. Calculate how many bags of cement would be needed to produce the floor slab for this house.
(2) 8.3.5 It costs R55,99 for a bag of cement. Calculate the cost of the cement
needed for this floor slab.
(2) [16]
– End of Paper –
Copyright reserved
Mathematical Literacy (NSC)/ Grade 11/P2 58 Exemplar
Grade11 Mathematical Literacy: Question Paper 2
MARKS: 100 TIME: 212 hours
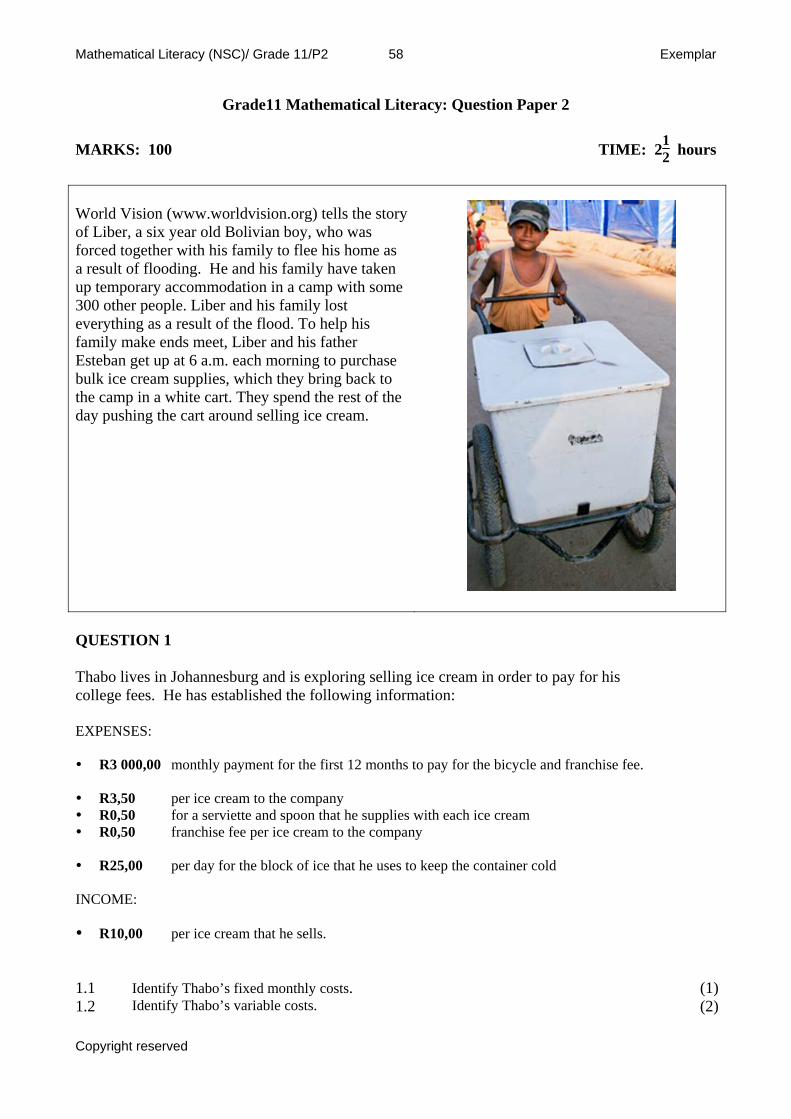
World Vision (www.worldvision.org) tells the story of Liber, a six year old Bolivian boy, who was forced together with his family to flee his home as a result of flooding. He and his family have taken up temporary accommodation in a camp with some 300 other people. Liber and his family lost everything as a result of the flood. To help his family make ends meet, Liber and his father Esteban get up at 6 a.m. each morning to purchase bulk ice cream supplies, which they bring back to the camp in a white cart. They spend the rest of the day pushing the cart around selling ice cream.
QUESTION 1 Thabo lives in Johannesburg and is exploring selling ice cream in order to pay for his college fees. He has established the following information: EXPENSES: R3 000,00 monthly payment for the first 12 months to pay for the bicycle and franchise fee.
R3,50 per ice cream to the company R0,50 for a serviette and spoon that he supplies with each ice cream R0,50 franchise fee per ice cream to the company
R25,00 per day for the block of ice that he uses to keep the container cold
INCOME: R10,00 per ice cream that he sells.
1.1 Identify Thabo’s fixed monthly costs. (1)1.2 Identify Thabo’s variable costs. (2)
Copyright reserved
Mathematical Literacy (NSC)/ Grade 11/P2 59 Exemplar
1.3 Identify Thabo’s source(s) of income and classify it as fixed or variable (2) The company has told Thabo that salesmen typically sell a minimum of 30 ice creams
and a maximum of 60 ice creams per day.
1.4 Show that Thabo’s variable expenses for a day on which he sells 30 ice creams is: R160,00
(3)
1.5 Hence, or otherwise, complete the table below (only write down the values of a, b and c
and your working for each value in your answer book)
(6)
Monthly expenses No of days worked in the month 4 8 15 30 30 ice creams sold per day R3 640,00 a b c 60 ice creams sold per day R4 180,00 R5 360,00 R7 425,00 R11 850,00
1.6 Complete the following table (only write down the values of a, b and c and your
working for each value in your answer book)
(6)
Monthly income No of days worked in the month 4 8 15 30 30 ice creams sold per day R1 200,00 a b c 60 ice creams sold per day R2 400,00 R4 800,00 R9 000,00 R18 000,00
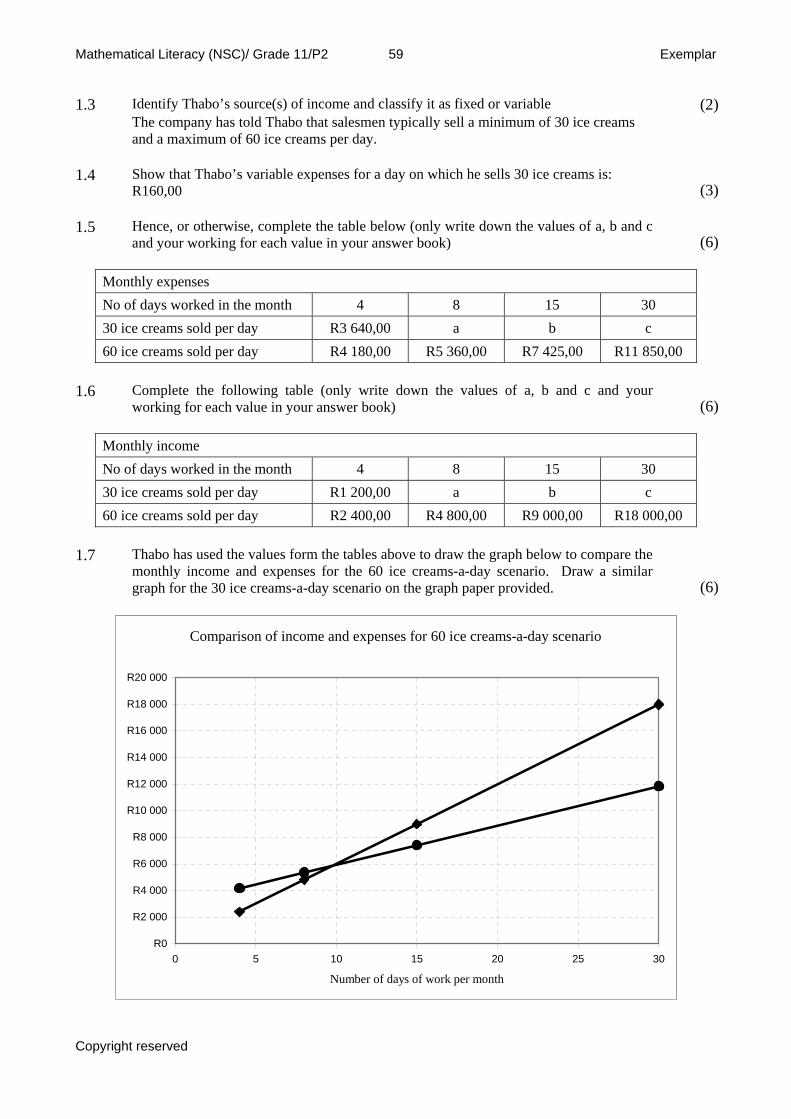
1.7 Thabo has used the values form the tables above to draw the graph below to compare the
monthly income and expenses for the 60 ice creams-a-day scenario. Draw a similar graph for the 30 ice creams-a-day scenario on the graph paper provided.
(6)
Comparison of income and expenses for 60 ice creams-a-day scenario
R0
R2 000
R4 000
R6 000
R8 000
R10 000
R12 000
R14 000
R16 000
R18 000
R20 000
0 5 10 15 20 25 30
Number of days of work per month
Comparison of income and expenses for 60 ice creams-a-day scenario
R0
R2 000
R4 000
R6 000
R8 000
R10 000
R12 000
R14 000
R16 000
R18 000
R20 000
0 5 10 15 20 25 30
Number of days of work per month
Copyright reserved
Mathematical Literacy (NSC)/ Grade 11/P2 60 Exemplar
1.8 Use your graph and Thabo’s graph above to answer the following questions:
(2)
(2)
[30]
2.1
2.2
he ice creams that are sold by the company come in with
U e f olume of de
show tha0m
de of th tub. Use
1.8.1 Roughly how many days should Thabo work in order to cover his expenses in each scenario?
1.8.2 Roughly how many days should Thabo work for each scenario in order to make a profit of at least R2 000,00 per month?
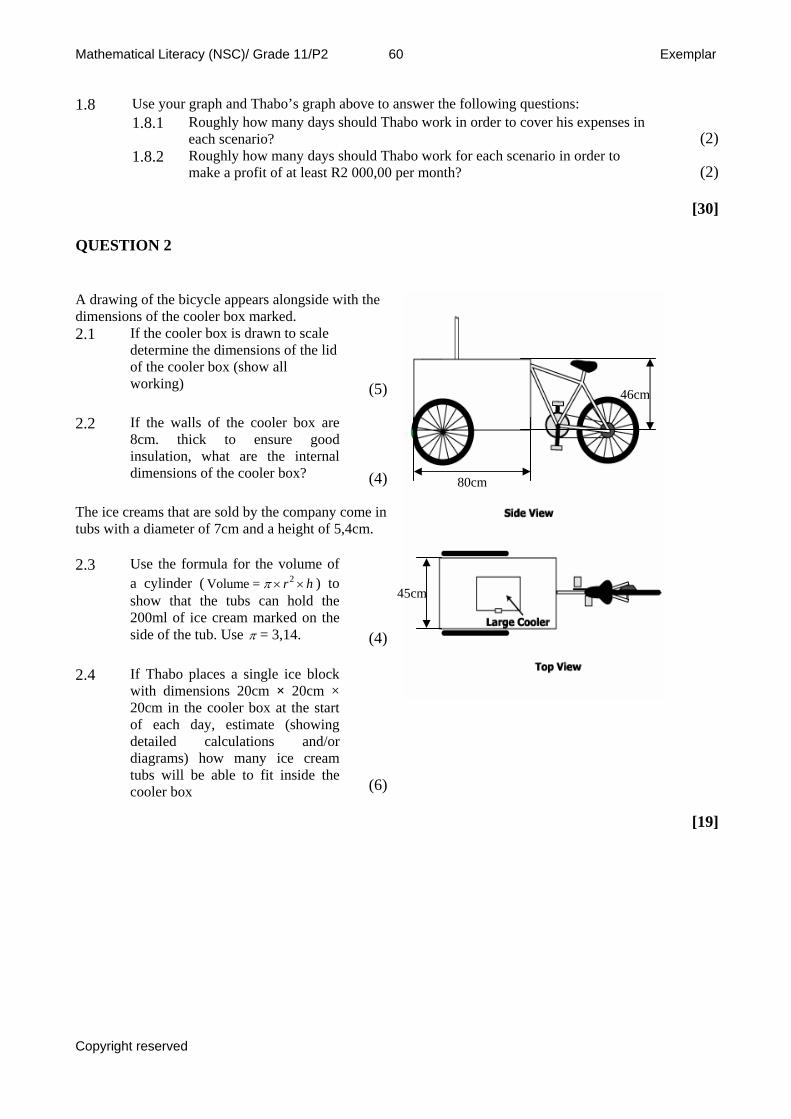
QUESTION 2
A drawing of the bicycle appears alongside with the dimensions of the cooler box marked.
If the cooler box is drawn to scale determine the dimensions of the lid of the cooler box (show all working)
(5)
If the walls of the cooler box are 8cm. thick to ensure good insulation, what are the internal dimensions of the cooler box?
(4)
Ttubs a diameter of 7cm and a height of 5,4cm. 2.3 se th ormula for the v
a cylin r ( 2Volume = r hπ × × ) to t the tubs can hold the
20 l of ice cream marked on thesi e π = 3,14. (4)
places a single ice block with dimensions 20cm × 20cm × 20cm in the cooler box at the start
(6)
[19]
80cm
46cm
45cm
2.4 If Thabo
of each day, estimate (showing detailed calculations and/or diagrams) how many ice creamtubs will be able to fit inside the cooler box
Copyright reserved
Mathematical Literacy (NSC)/ Grade 11/P2 61 Exemplar
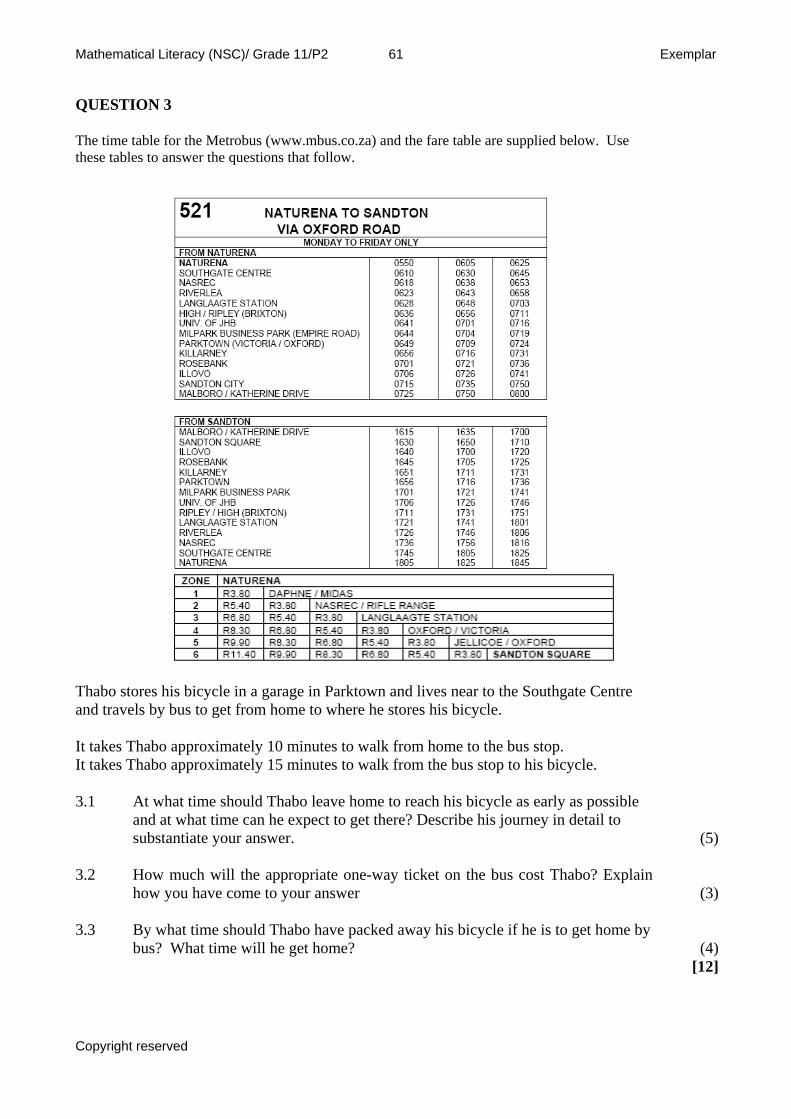
QUEST The time .za) and the fare table are supplied below. Use these tab .
Thabo stores his bicycle in a garage in Parktown and lives near to the Southgate Centre and travels by bus to get from home to where he stores his bicycle. It takes Thabo approximately 10 minutes to walk from home to the bus stop. It takes Thabo approximately 15 minutes to walk from the bus stop to his bicycle.
3.1 At what time should Thabo leave home to reach his bicycle as early as possible and at what time can he expect to get there? Describe his journey in detail to substantiate your answer.
(5) 3.2 How much will the appropriate one-way ticket on the bus cost Thabo? Explain
how you have come to your answer
(3) 3.3 By what time should Thabo have packed away his bicycle if he is to get home by
bus? What time will he get home?
(4) [12]
ION 3
table for the Metrobus (www.mbus.coles to answer the questions that follow
Copyright reserved
Mathematical Literacy (NSC)/ Grade 11/P2 62 Exemplar
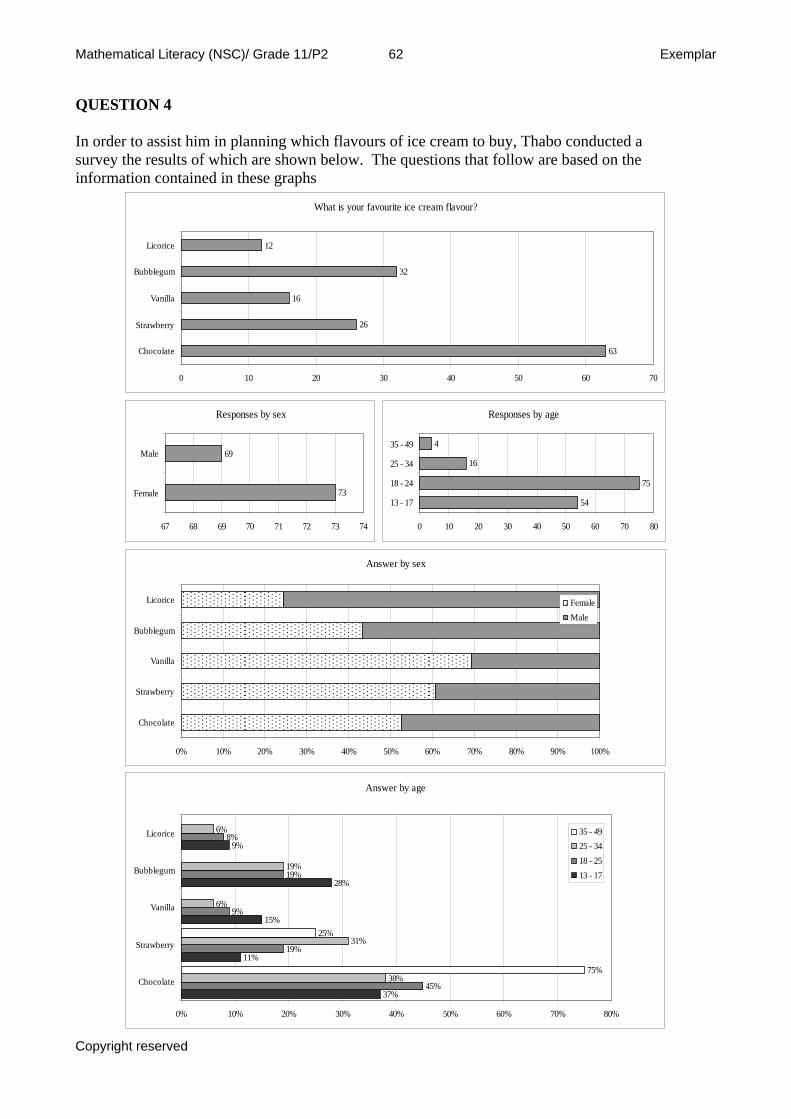
QUESTION 4 In order to assist him in planning which flavours of ice cream to buy, Thabo conducted survey the results of which are shown below.
a The questions that follow are based on the
form
in ation contained in these graphs
What is your favourite ice cream flavour?
63
26
16
32
12
0 10 20 30 40 50 60 70
Chocolate
Strawberry
Vanilla
Bubblegum
Licorice
Responses by sex
73
69
67 68 69 70 71 72 73 74
Female
Male
Responses by age
54
75
16
4
0 10 20 30 40 50 60 70 80
13 - 17
18 - 24
25 - 34
35 - 49
Answer by sex
Vanilla
Bubblegum
Licorice FemaleMale
0% 10% 20% 30% 40% 50% 60% 70% 80% 90% 100%
Chocolate
Strawberry
Answer by age
37%45%
9%
38%75%
0% 10% 20% 30% 40% 50% 60% 70% 80%
Chocolate
11%
15%
19%31%
25%Strawberry
28%19%
6%
19%
Vanilla
Bubblegum
9%8%
6%Licorice 35 - 4925 - 3418 - 2513 - 17
Copyright reserved
Mathematical Literacy (NSC)/ Grade 11/P2 63 Exemplar
4.1 How many people participated in the survey according to the following graphs above:
(3)
.2 Suggest a possible reason for the discrepancy between the number of participants
in these graphs.
(1) 4.3 Why is the “Response by sex” graph misleading? What impression does it create
and what is this the result of?
(4) 4.4 From the survey it would appear that 35+ year olds do not like bubble gum
flavoured ice cream. By referring to the sample size comment on how reliable you think this observation is?
(2) 4.5 Thabo has used a compound bar graph to represent the “Answer by sex” data.
What has he gained and what has he lost by doing this instead of using a bar graph as he has in the other graphs?
(2) 4.6 Use the information provided to determine the actual number of respondents by
age for chocolate and strawberry ice cream and hence draw a bar graph of “Answer by age” based on actual numbers.
(8) 4.7 Compare the two representations of “Answer by age” and identify an advantage
or disadvantage of each representation.
(4) 4.8 Thabo buys the ice creams in boxes of 24 ice creams. He has enough money to
buy 20 boxes which he keeps in a freezer at his home. Use the data collected in the survey to help him decide on how many boxes of each flavour he should buy.
(6) [29]QUESTION 5 Dry-ice is sold in half-kilogram blocks. The people who sell the ice cream have
developed the following rule of thumb to guide them when deciding how many half-kilogram blocks to buy: To keep the food frozen for 4 hours:
Kilogram of dry-ice needed = kilograms of food5
4.1.1 “What is your favourite ice cream” 4.1.2 “Responses by sex” 4.1.3 “Responses by age”
4
+ 12
To keep the food frozen for 12 hours:
Kilogram of dry-ice needed = kilograms of food4 + 1
12
5.1 If Thabo wants to keep 45 ice-creams (200g each) frozen for 12 hours, how
many half-kilogram blocks should he buy?
(6) 5.2 How many ice creams can Thabo keep frozen for 4 hours if he brought 7 half-
kilogram blocks of dry-ice?
(4) [10]
– End of Paper –
Copyright reserved
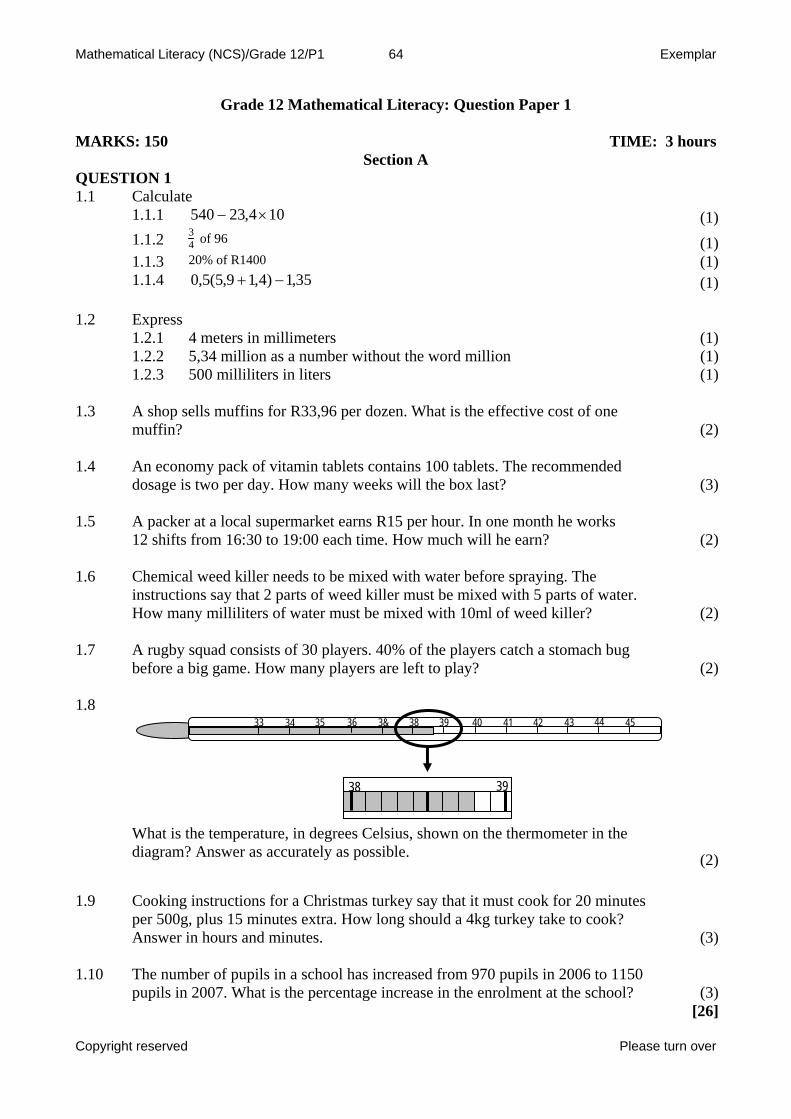
Mathematical Literacy (NCS)/Grade 12/P1 64 Exemplar
Grade 12 Mathematical Literacy: Question Paper 1
MARKS: 150 TIME: 3 hours Section A
QUESTION 1 1.1 Calculate 1.1.1 104,23540 ×− (1) 1.1.2 3
4 of 96 (1) 1.1.3 20% of R1400 (1) 1.1.4 35,1)4,19,5(5,0 −+ (1) 1.2 Express 1.2.1 4 meters in millimeters (1) 1.2.2 5,34 million as a number without the word million (1) 1.2.3 500 milliliters in liters (1) 1.3 A shop sells muffins for R33,96 per dozen. What is the effective cost of one
muffin?
(2) 1.4 An economy pack of vitamin tablets contains 100 tablets. The recommended
dosage is two per day. How many weeks will the box last?
(3) 1.5 A packer at a local supermarket earns R15 per hour. In one month he works
12 shifts from 16:30 to 19:00 each time. How much will he earn?
(2) 1.6 Chemical weed killer needs to be mixed with water before spraying. The
instructions say that 2 parts of weed killer must be mixed with 5 parts of water. How many milliliters of water must be mixed with 10ml of weed killer?
(2) 1.7 A rugby squad consists of 30 players. 40% of the players catch a stomach bug
before a big game. How many players are left to play?
(2) 1.8
33 36 35 39 38 3& 40 41 42 43 45
What is the temperature, in degrees Celsius, shown on the thermometer in the diagram? Answer as accurately as possible.
44 34
38 39
(2) 1.9 Cooking instructions for a Christmas turkey say that it must cook for 20 minutes
per 500g, plus 15 minutes extra. How long should a 4kg turkey take to cook? Answer in hours and minutes.
(3) 1.10 The number of pupils in a school has increased from 970 pupils in 2006 to 1150
pupils in 2007. What is the percentage increase in the enrolment at the school?
(3) [26]
Copyright reserved Please turn over
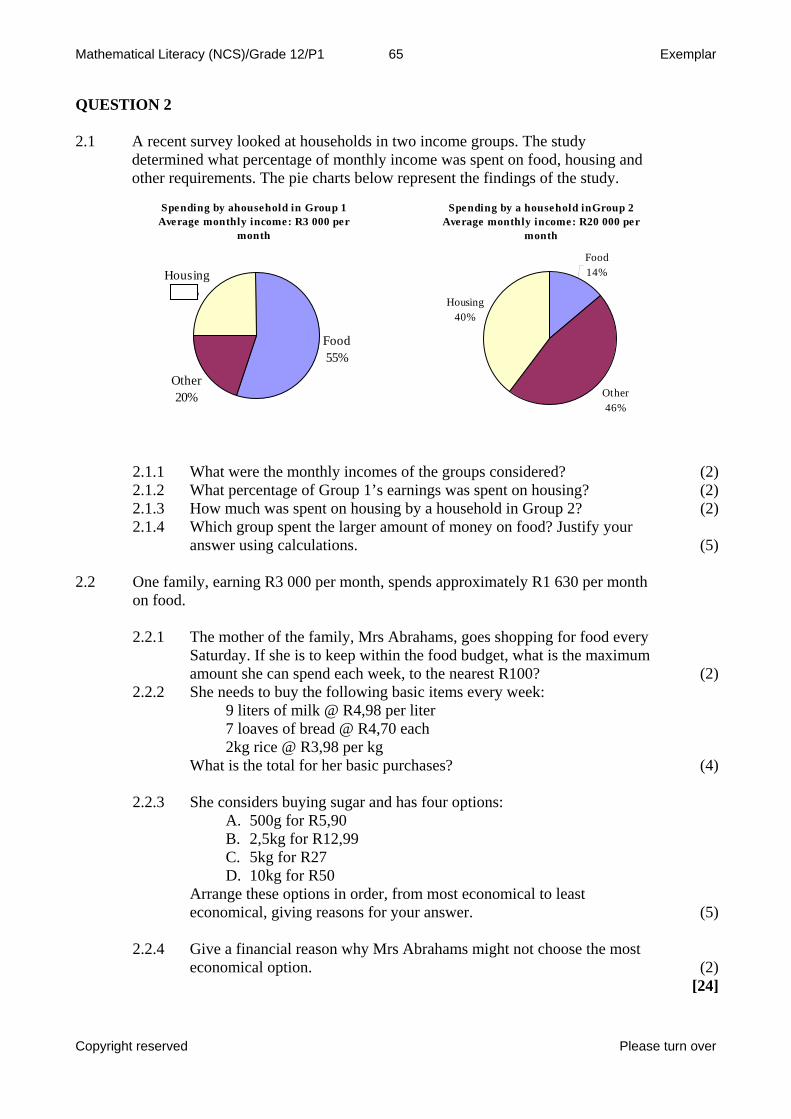
Mathematical Literacy (NCS)/Grade 12/P1 65 Exemplar
QUESTION 2 2.1 A recent survey looked at households in two income groups. The study
determined what percentage of monthly income was spent on food, housing and other requirements. The pie charts below represent the findings of the study.
2.1.1 What were the monthly incomes of the groups considered? (2) 2.1.2 What percentage of Group 1’s earnings was spent on housing? (2)2.1.3 How much was spent on housing by a household in Group 2? (2)2.1.4 Which group spent the larger amount of money on food? Justify your
answer using calculations.
(5)
.2 One family, earning R3 000 per month, spends approximately R1 630 per month on food.
2.2.1 The mother of the family, Mrs Abrahams, goes shopping for food every
Saturday. If she is to keep within the food budget, what is the maximum amount she can spend each week, to the nearest R100?
(2)2.2.2 She needs to buy the following basic items every week:
.2.3 and has four options:
C. 5kg for R27
oose the most (2)
[
Spending by ahousehold in Group 1Average monthly income: R3 000 per
month
Food 55%
Other 20%
Housing25%
Spending by a household inGroup 2Average monthly income: R20 000 per
month
Other 46%
Housing40%
Food 14%
2
9 liters of milk @ R4,98 per liter 7 loaves of bread @ R4,70 each 2kg rice @ R3,98 per kg What is the total for her basic purchases?
(4)
he considers buying sugar
2 SA. 500g for R5,90 B. 2,5kg for R12,99
D. 10kg for R50 Arrange these options in order, from most economical to least economical, giving reasons for your answer.
(5)
2.2.4
Give a financial reason why Mrs Abrahams might not ch
economical option. 24]
Copyright reserved Please turn over
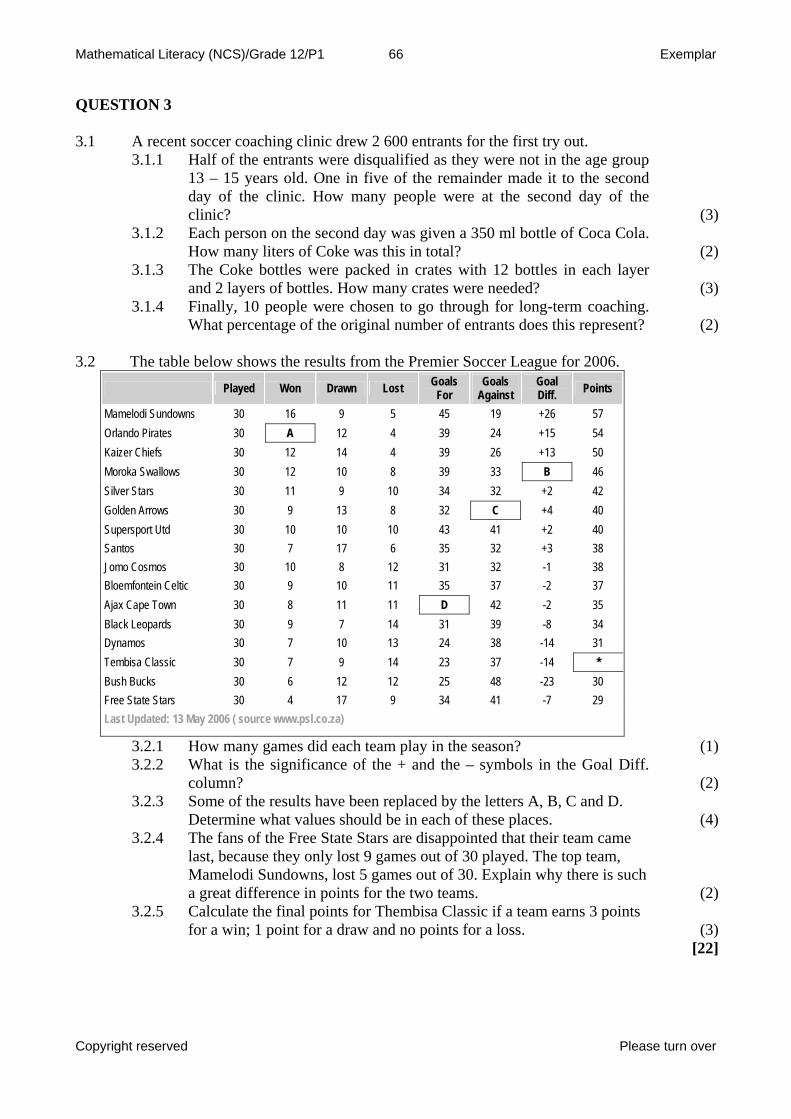
Mathematical Literacy (NCS)/Grade 12/P1 66 Exemplar
QUESTION 3
.1 nt first try out. 3.1.1 Half of the entrants were disqualified as they were not in the age group
13 – 15 years old. One in five of the remainder made it to the second day of the clinic. How many people were at the second day of the clinic
(3) 3.1.2 ca Cola.
.1.3 he Coke bottles were packed in crates with 12 bottles in each layer (3)
3.1.4 ere chosen to go through for long-term coaching. hat percentage of the original number of entrants does this represent?
le below shows the results from the Premier Soccer League for 2006.
3 A rece soccer coaching clinic drew 2 600 entrants for the
? Each person on the second day was given a 350 ml bottle of CoHow many liters of Coke was this in total? (2)
3 Tand 2 layers of bottles. How many crates were needed? Finally, 10 people w
W (2) 3.2 The tab
Played Won Drawn Lost Goals For
Goals Goal Against Diff. Points
Mame owlodi Sund ns 30 16 9 5 45 19 +26 57 30 A 12 4 39 24 +15 54 Orlando Pirates
Kaizer Chiefs 30 12 14 4 39 26 +13 50 Moroka Swallows 8 39 33 B 46 30 12 10 Silver Stars 30 11 9 10 34 32 +2 42 Golden Arrows C +4 40 30 9 13 8 32 Supersport Utd 30 10 10 10 43 41 +2 40 Santos 38 30 7 17 6 35 32 +3 Jomo Cosmos 30 10 8 12 31 32 -1 38 Bloemfontein Celtic 30 9 10 11 35 37 -2 37 Ajax Cape Town 30 8 11 11 42 -2 35 D Black Leopards 30 9 7 14 31 39 -8 34 Dynamos 30 7 10 13 24 38 -14 31 Tembisa Classic 30 7 9 14 23 37 -14 * Bush Bucks 30 6 12 12 25 48 -23 30 Free State Stars 30 4 17 9 34 41 -7 29 Last Updated: 13 May 2006 ( source www.psl.co.za)
How m y gam did e h tea lay i e sea n? (1) What is the significance of the + and – sy bols he G l Diff.
column
(2) .2.3 Some o he res ts hav een r laced the l rs A , C an .
Determ wha alues ould in ea f the place
(4) he fa f the ee St Stars e disappointed that their team came
last, be se th only t 9 g es out of 30 played. The top team, Mame i Sund wns, l t 5 ga s out 30. E lain w ther such a great difference in points for the two teams.
(2) Calcul the fi l poin for T bisa assic a tea arns 3 oints
for a win; 1 point for a draw and no points for a loss.
(3) [22]
3.2.1 an es ac m p n th so3.2.2 the m in t oa
? 3 f t ul e b ep by ette , B d D
ine t v sh be ch o se s. 3.2.4 T ns o Fr ate ar
cau ey los amlod o os me of xp hy e is
3.2.5 ate na ts hem Cl if m e p
Copyright reserved Please turn over
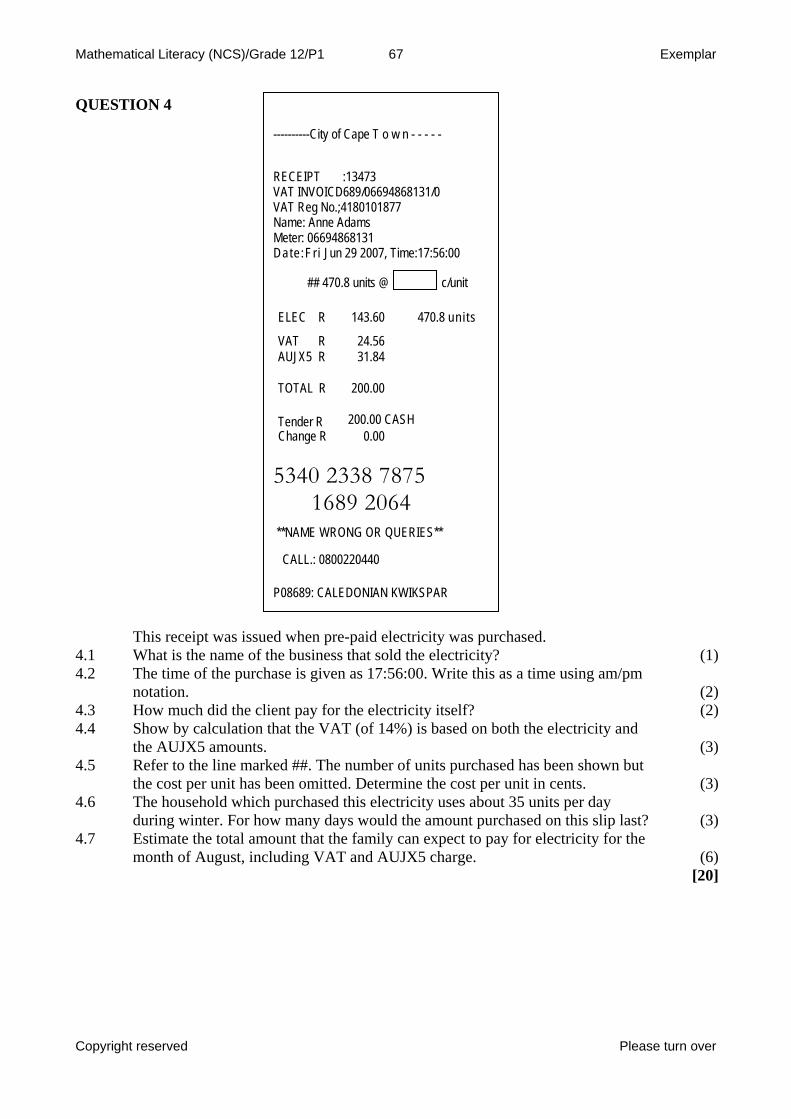
Mathematical Literacy (NCS)/Grade 12/P1 67 Exemplar
QUEST
This receipt was issued when pre-pa ctricity was purchased. 4.1 What is the name of the business that sold the electricity? (1)4.2 The time of the purch rite this as a time using am/pm
notation.
(2)4.3 How much did the client pa ty itself? (2)4.4 Show by calculation t ed on both the electricity and
the AUJX5 amounts.
(3)4.5 Refer to the line marked ##. The number of units purchased has been shown but
the cost per unit has b it in cents.
(3)4.6 The household which s about 35 units per day
uring w nter. For how many days would the amount purchased on this slip last?
e the total amount that the family can expect to pay for electricity for the month of August, including VAT and AUJX5 charge.
(6)
[20]
ION 4
----------City of Cape T o w n - - - - -
RECEIPT :13473 VAT INVOICD689/06694868131/0 VAT Reg No.;4180101877 Name: Anne Adams Meter: 06694868131
Date:Fr i Jun 29 2007, Time:17:56:00
## 470.8 units @ c/unit
ELEC R 143.60 470.8 uni ts
VAT R 24.56
id ele
ase is given as 17:56:00. W
y for the electricihat the VAT (of 14%) is bas
een omitted. Determine the cost per un purchased this electricity use
d i (3)4.7 Estimat
AUJX5 R 31.84
TOTAL R 200.00
Tender R 200.00 CASH Change R 0.00
5341689 2064
**NAME WRONG OR QUERIES**
022 P08689: CALEDONIAN KWIKSPAR
0 2338 7875
0440 CALL.: 080
Copyright reserved Please turn over
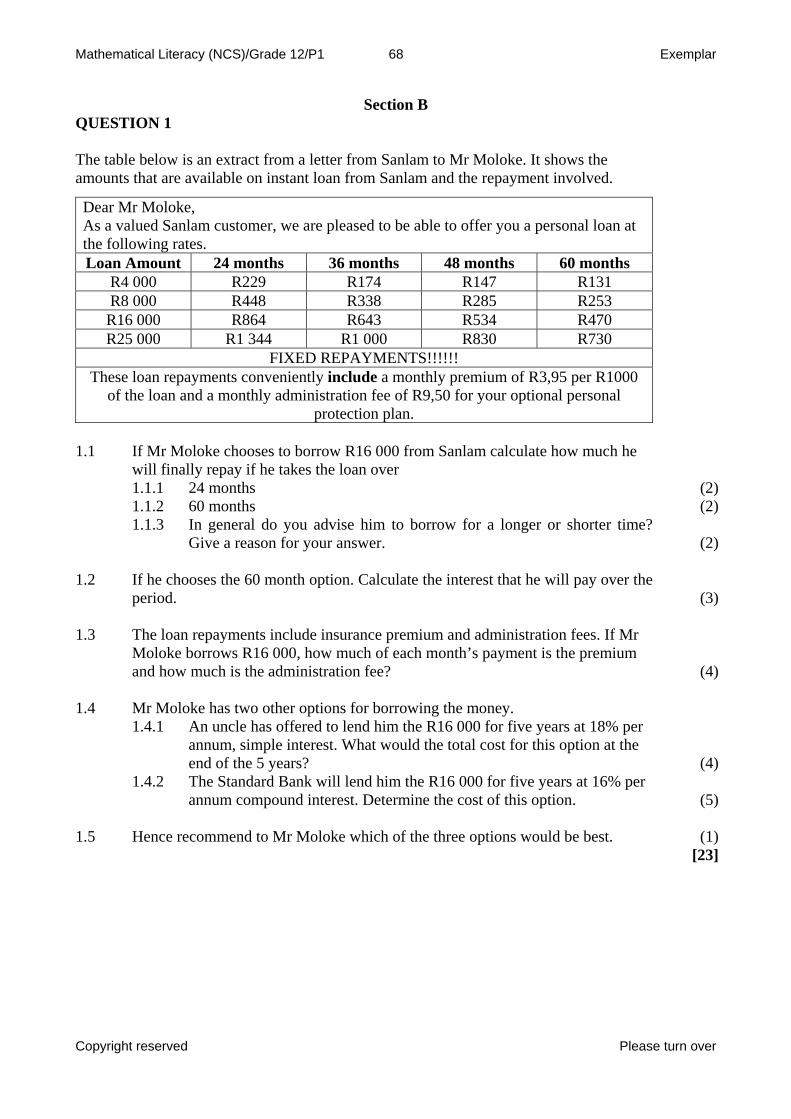
Mathematical Literacy (NCS)/Grade 12/P1 68 Exemplar
Section B UESTION 1
he table below is an extract from a letter from Sanlam to Mr Moloke. It shows the mounts that are available on instant loan from Sanlam and the repayment involved.
Dear Mr Moloke, As a valued Sanlam customer, we are pleased to be able to offer you a personal loan at the following rates.
Q
Ta
Loan Amount 24 months 36 months 48 months 60 months R4 000 R229 R174 R147 R131 R8 000 R448 R338 R285 R253 R16 000 R864 R643 R534 R470 R25 000 R1 344 R1 000 R830 R730
FIXED REPAYMENTS!!!!!! These loan repayments conveniently include a monthly premium of R3,95 per R1000
of the loan and a monthly administration fee of R9,50 for your optional personal protection plan.
.1 ow much he
(2)
1.1.2 0 months a longer or shorter time?
(2)
1.3
.4 Mr Moloke has two other options for borrowing the money. 1.4.1 An uncle has offered to lend him the R16 000 for five years at 18% per
annum, simple interest. What would the total cost for this option at the end of the 5 years?
(4) 1.4.2 The Standard Bank will lend him e R16 000 for five years at 16% per
annum compound interest. Determine the cost of this option.
(5) 1.5 Hence recommend to Mr Moloke w hree options would be best. (1)
[23]
1 If Mr Moloke chooses to borrow R16 000 from Sanlam calculate h
will finally repay if he takes the loan over 1.1.1 24 months
6
(2) 1.1.3 In general do you advise him to borrow for
Give a reason for your answer.
1.2 If he chooses the 60 month option. Calculate the interest that he will pay over theperiod.
(3)
The loan repayments include insurance premium and administration fees. If Mr
Moloke borrows R16 000, how much of each month’s payment is the premium and how much is the administration fee? (4)
1
th
hich of the t
Copyright reserved Please turn over
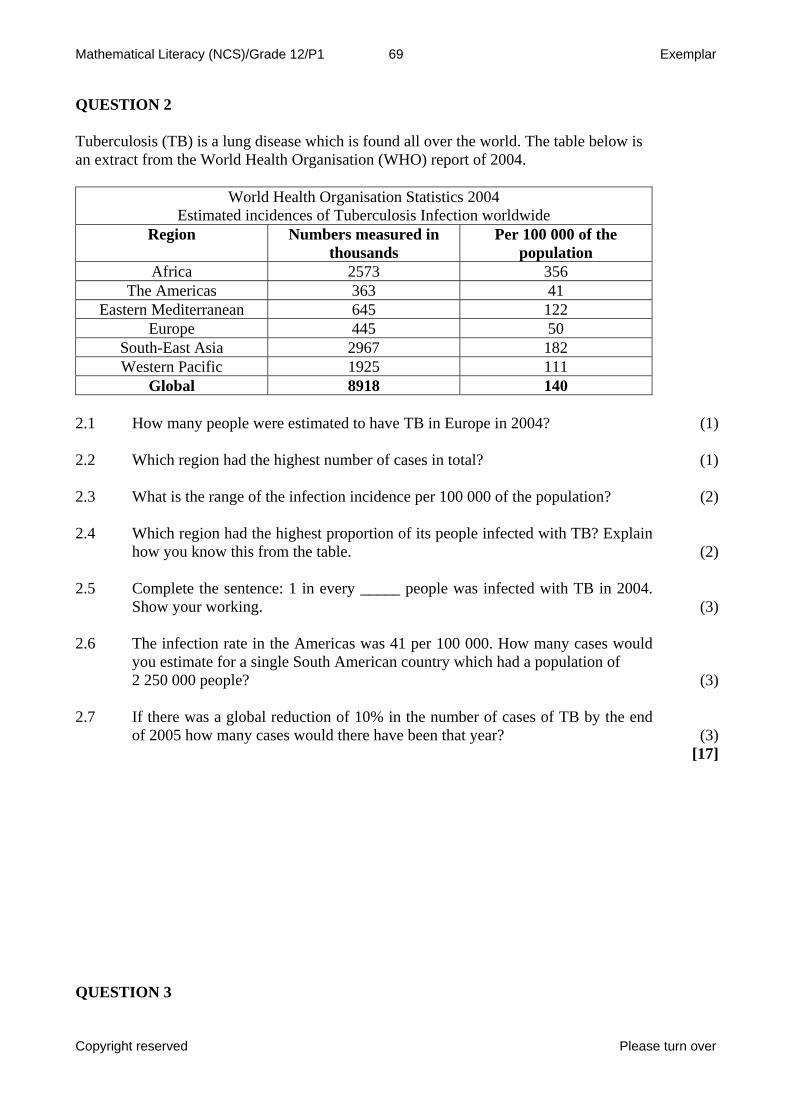
Mathematical Literacy (NCS)/Grade 12/P1 69 Exemplar
QUESTION 2 Tub TB) is a lu ease which d all over t ld. The tab is an extract from the Wo h Organisation (WHO) report of 2004.
erculosis ( ng dis is foun he wor le belowrld Healt
World Health Organisation Statistics 2004 Estimated incidences of Tuberculosis Infection worldwide
Region Numbers measured in thousands
Per 100 000 of the population
Africa 2573 356 T 41 he Americas 363
Easte di 645 122 rn Me terranean Europ 445 50 e
S asouth-E t Asia 2967 182 Western P 111 acific 1925
Global 8918 140
2.1 ny people were estimated to have TB in Europe in 2004?
(1) 2.3 ce per 100 000 of the population?
d with TB? Explain ou (2)
2.5 Complete the sentence: 1 in every _____ people was infected with TB in 2004.
yo
(3) .6 he infe ion rate in the Americas was 41 per 100 000. How many cases would
250 00 people?
.7 If there was a global reduction of 10% in the number of cases of TB by the end
of 2005 how many cases would there have been that year?
(3) [17] QUESTION 3
How ma
(1)
2.2 Which region had the highest number of cases in total?
What is the range of the infection inciden
(2) 2.4 Which region had the highest proportion of its people infecte
how y know this from the table.
Show ur working.
2 T ct you estimate for a single South American country which had a population of2 0 (3)
2
Copyright reserved Please turn over
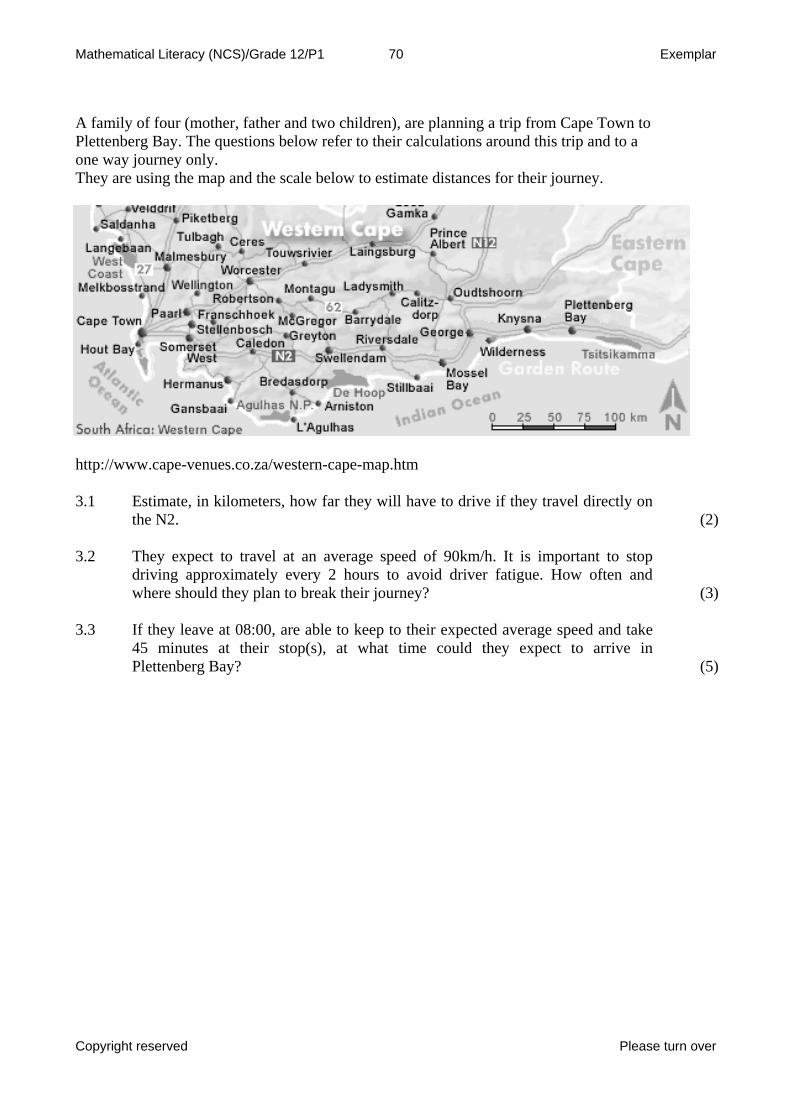
Mathematical Literacy (NCS)/Grade 12/P1 70 Exemplar
A family of four (mother, father and two children), are planning a trip from Cape Town to
hey are using the map and the scale below to estimate distances for their journey.
//ww
ly on e N2. (2)
ge speed of 90km/h. It is important to stop
.3 they leave at 08:00, are able to keep to their expected average speed and take
Plettenberg Bay. The questions below refer to their calculations around this trip and to a one way journey only. T
http: w.cape-venues.co.za/western-cape-map.htm 3.1 Estimate, in kilometers, how far they will have to drive if they travel direct
th
They expect to travel at an avera
3.2 driving approximately every 2 hours to avoid driver fatigue. How often and where should they plan to break their journey?
(3)
3 If 45 minutes at their stop(s), at what time could they expect to arrive in Plettenberg Bay? (5)
Copyright reserved Please turn over
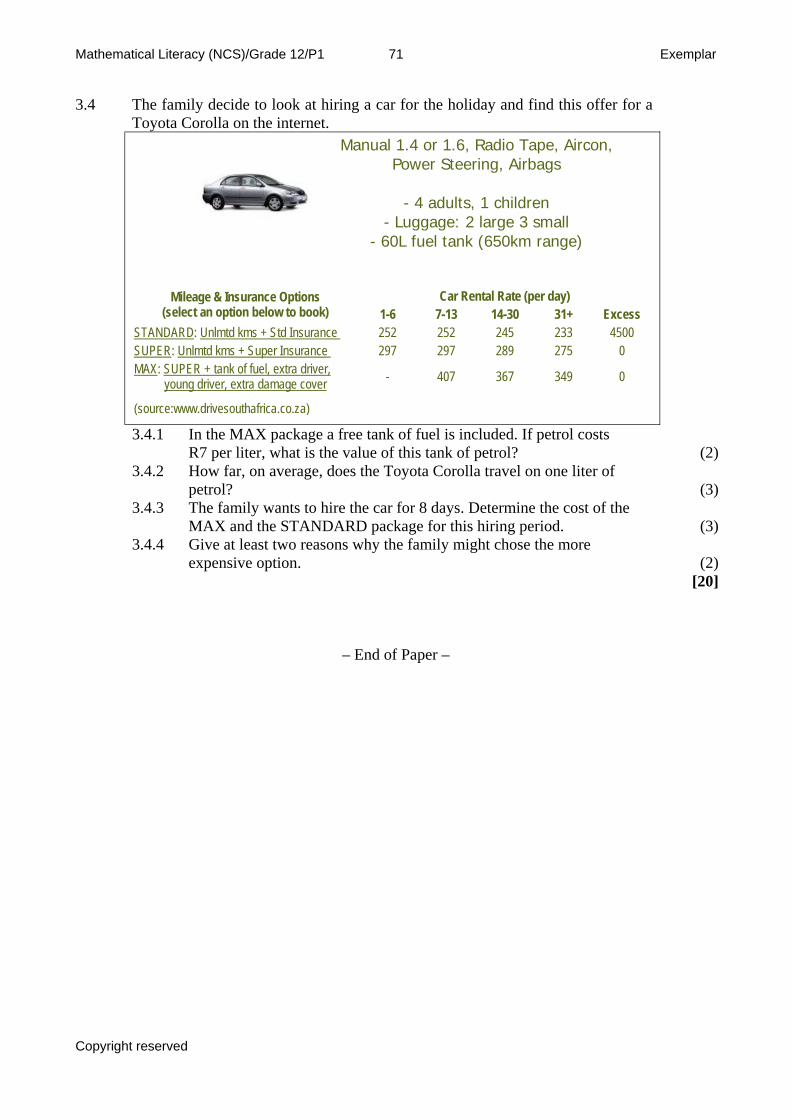
Mathematical Literacy (NCS)/Grade 12/P1 71 Exemplar
3.4 The fam for the holiday and find this offer for a
Group B - Toyota Corolla or similar
ily decide to look at hiring a carToyota Corolla on the internet.
Manual 1.4 or 1.6, Radio Tape, Aircon,
Car Rental Rate (per day) Mileage & Insurance Options
(select an option below to book) 1-6 7-13 14-30 31+ Excess STANDARD: Unlmtd kms + Std Insurance 252 252 245 233 4500 SUPER: Unlmtd kms + Super Insurance 297 297 289 275 0 MAX: SUPER + tank of fuel, extra driver, young driver, extra damage cover - 407 367 349 0
(source:www.drivesouthafrica.co.za)
Power Steering, Airbags
- 4 adults, 1 children - Luggage: 2 large 3 small
- 60L fuel tank (650km range)
3.4.1 In the MAX package a free tank of fuel is included. If petrol costs
R7 per liter, what is the value of this tank of petrol?
(2) 3.4.2 How far, on average, does the Toyota Corolla travel on one liter of
(3)
MAX and the STANDARD package for this hiring period. .4.4 Give at least two reasons why the family might chose the more
(2) [20]
petrol?
3.4.3 The family wants to hire the car for 8 days. Determine the cost of the (3)
3 expensive option.
– End of Paper –
Copyright reserved
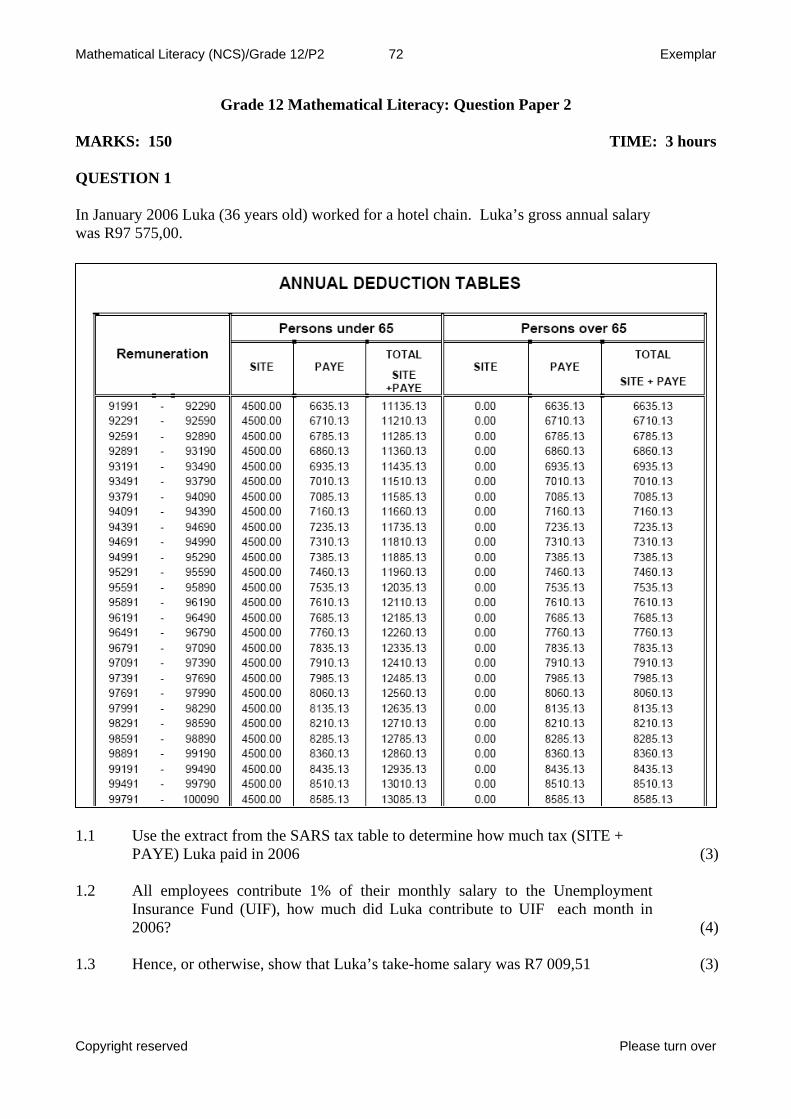
Mathematical Literacy (NCS)/Grade 12/P2 72 Exemplar
Grade 12 Mathematical Literacy: Question Paper 2
MARKS: 150 TIME: 3 hours QUESTION 1 In January 2006 Luka (36 years old) worked for a hotel chain. Luka’s gross annual salary was R97 575,00.
1.1 Use the extract from the SARS tax table to determine how much tax (SITE +
PAYE) Luka paid in 2006
(3) 1.2 All employees contribute 1% of their monthly salary to the Unemployment
Insurance Fund (UIF), how much did Luka contribute to UIF each month in 2006?
(4) 1.3 Hence, or otherwise, show that Luka’s take-home salary was R7 009,51 (3)
Copyright reserved Please turn over
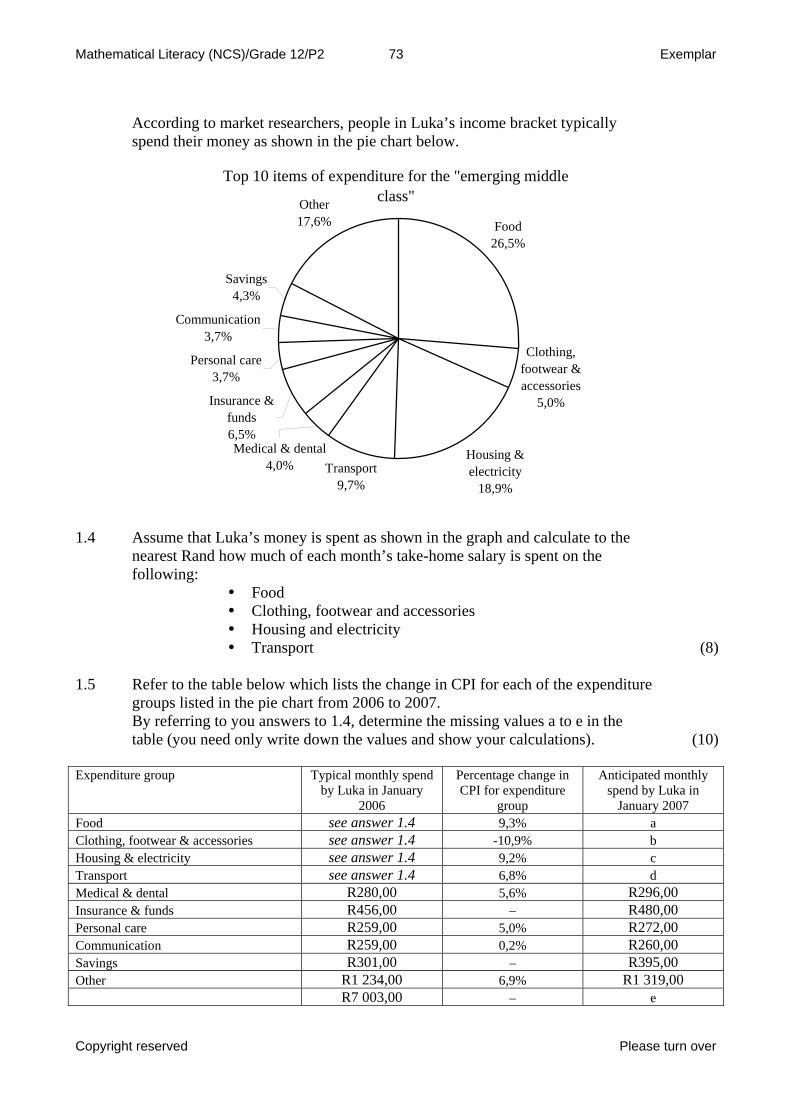
Mathematical Literacy (NCS)/Grade 12/P2 73 Exemplar
According to market researchers, people in Luka’s income bracket typically
spend their money as shown in the pie chart below.
Top 10 items of expenditure for the "emerging middle class"
Food26,5%
Clothing, footwear & accessories
5,0%
Housing & electricity
18,9%
Insurance & funds6,5%
Personal care3,7%
Communication3,7%
Savings4,3%
Other17,6%
Medical & dental4,0% Transport
9,7%
1.4 Assume that Luka’s money is spent as shown in the graph and calculate to the
nearest Rand how much of each month’s take-home salary is spent on the following:
Food Clothing, footwear and accessories Housing and electricity Transport (8)
1.5 Refer to the table below which lists the change in CPI for each of the expenditure
groups listed in the pie chart from 2006 to 2007.
By referring to you answers to 1.4, determine the missing values a to e in the table (you need only write down the values and show your calculations). (10)
Expenditure group Typical monthly spend
by Luka in January 2006
Percentage change in CPI for expenditure
group
Anticipated monthly spend by Luka in
January 2007 see answer 1.4 Food 9,3% a see answer 1.4 Clothing, footwear & accessories -10,9% b see answer 1.4 Housing & electricity 9,2% c see answer 1.4 Transport 6,8% d
R280,00 R296,00 Medical & dental 5,6% R456,00 R480,00 Insurance & funds – R259,00 R272,00 Personal care 5,0% R259,00 R260,00 Communication 0,2% R301,00 R395,00 Savings –
R1 234,00 R1 319,00 Other 6,9% R7 003,00 – e
Copyright reserved Please turn over
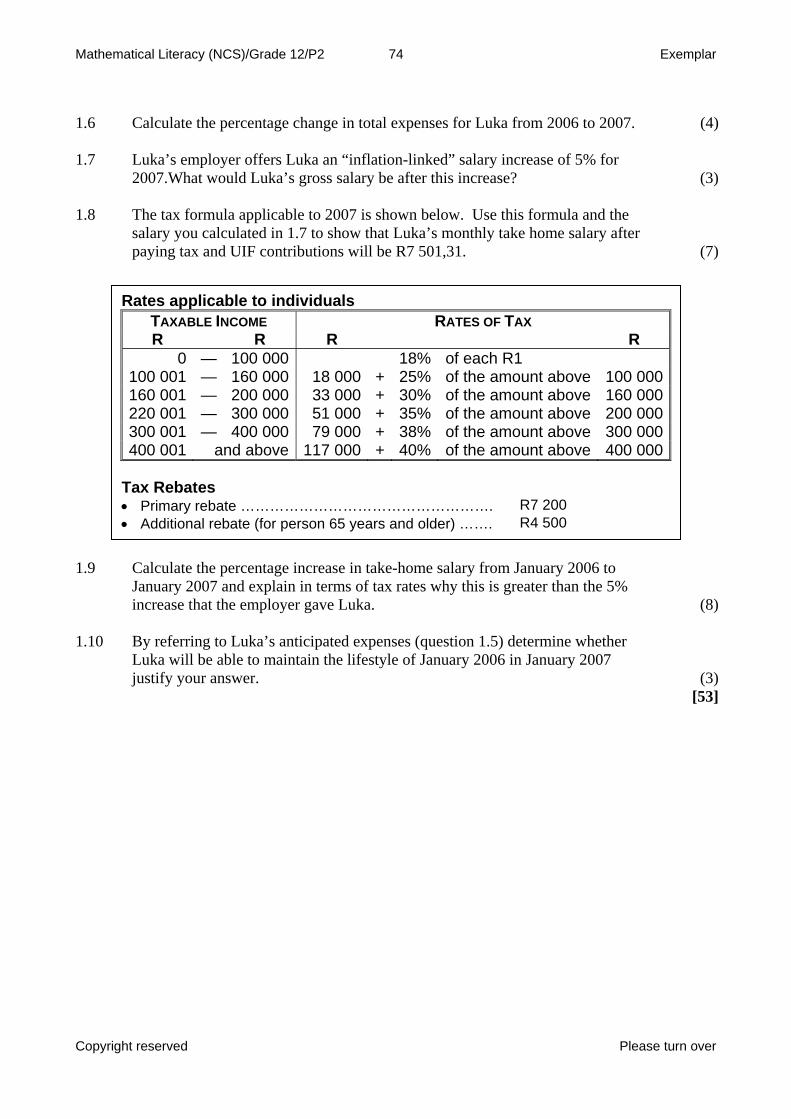
Mathematical Literacy (NCS)/Grade 12/P2 74 Exemplar
1.6 Calculate the percentage change in total expenses for Luka from 2006 to 2007. (4) 1.7 Luka’s employer offers Luka an “inflation-linked” salary increase of 5% for
2007.What would Luka’s gross salary be after this increase?
(3)
1.8 The tax formula applicable to 2007 is shown below. Use this formula and the salary you calculated in 1.7 to show that Luka’s monthly take home salary after paying tax and UIF contributions will be R7 501,31. (7)
Rates applicable to individuals TAXABLE INCOME RATES OF TAX R R R R
0 — 100 000 18% of each R1 100 001 — 160 000 18 000 + 25% of the amount above 100 000160 001 — 200 000 33 000 + 30% of the amount above 160 000220 001 — 300 000 51 000 + 35% of the amount above 200 000300 001 — 400 000 79 000 + 38% of the amount above 300 000400 001 and above 117 000 + 40% of the amount above 400 000
Tax Rebates
R7 200 • Primary rebate ……………………………………………. R4 500 • Additional rebate (for person 65 years and older) …….
1.9 Calculate the percentage increase in take-home salary from January 2006 to
January 2007 and explain in terms of tax rates why this is greater than the 5% increase that the employer gave Luka. (8)
1.10 By referring to Luka’s anticipated expenses (question 1.5) determine whether
Luka will be able to maintain the lifestyle of January 2006 in January 2007 justify your answer. (3)
[53]
Copyright reserved Please turn over
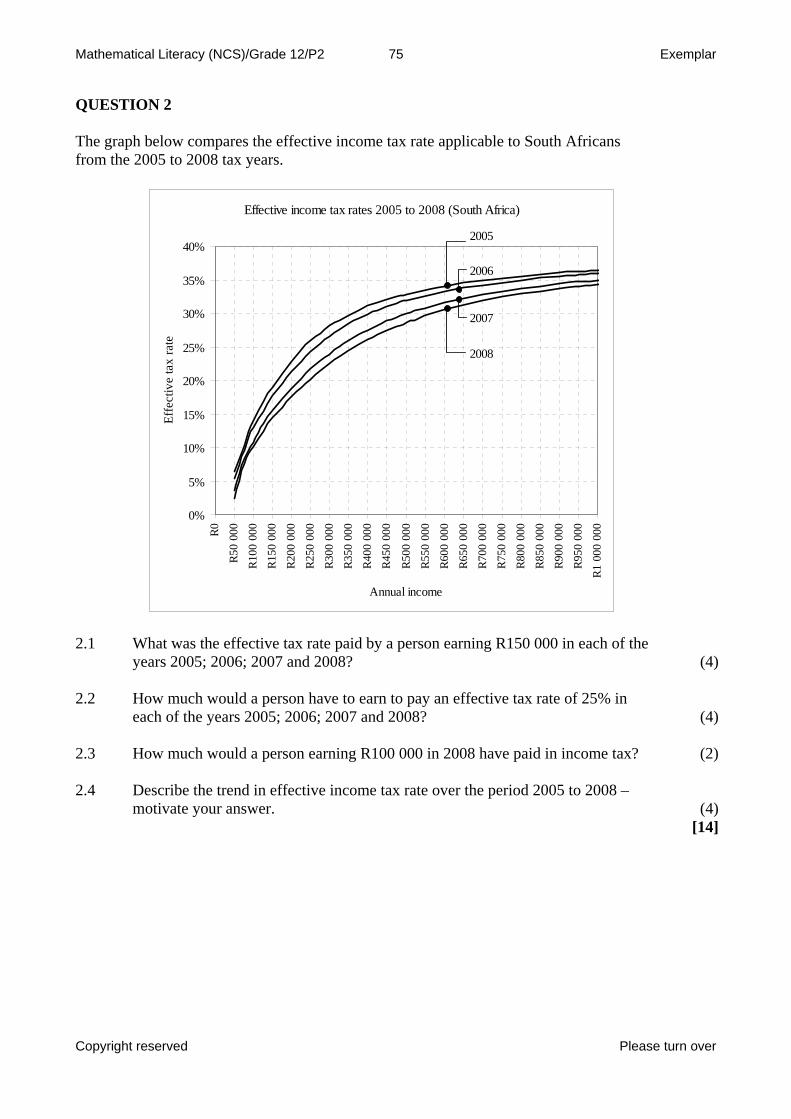
Mathematical Literacy (NCS)/Grade 12/P2 75 Exemplar
QUESTION 2 The graph below compares the effective income tax rate applicable to South Africans from the 2005 to 2008 tax years.
Effective income tax rates 2005 to 2008 (South Africa)
0%
5%
10%
15%
20%
25%
30%
35%
40%
R0
R50
000
R100
000
R150
000
R200
000
R250
000
R300
000
R350
000
R400
000
R450
000
R500
000
R550
000
R600
000
R650
000
R700
000
R750
000
R800
000
R850
000
R900
000
R950
000
R1 0
00 0
00Annual income
Effe
ctiv
e ta
x ra
te
2005
2006
2007
2008
2.1 What was the effective tax rate paid by a person earning R150 000 in each of the
years 2005; 2006; 2007 and 2008?
(4) 2.2 How much would a person have to earn to pay an effective tax rate of 25% in
each of the years 2005; 2006; 2007 and 2008?
(4) 2.3 How much would a person earning R100 000 in 2008 have paid in income tax? (2) 2.4 Describe the trend in effective income tax rate over the period 2005 to 2008 –
motivate your answer.
(4)[14]
Copyright reserved Please turn over
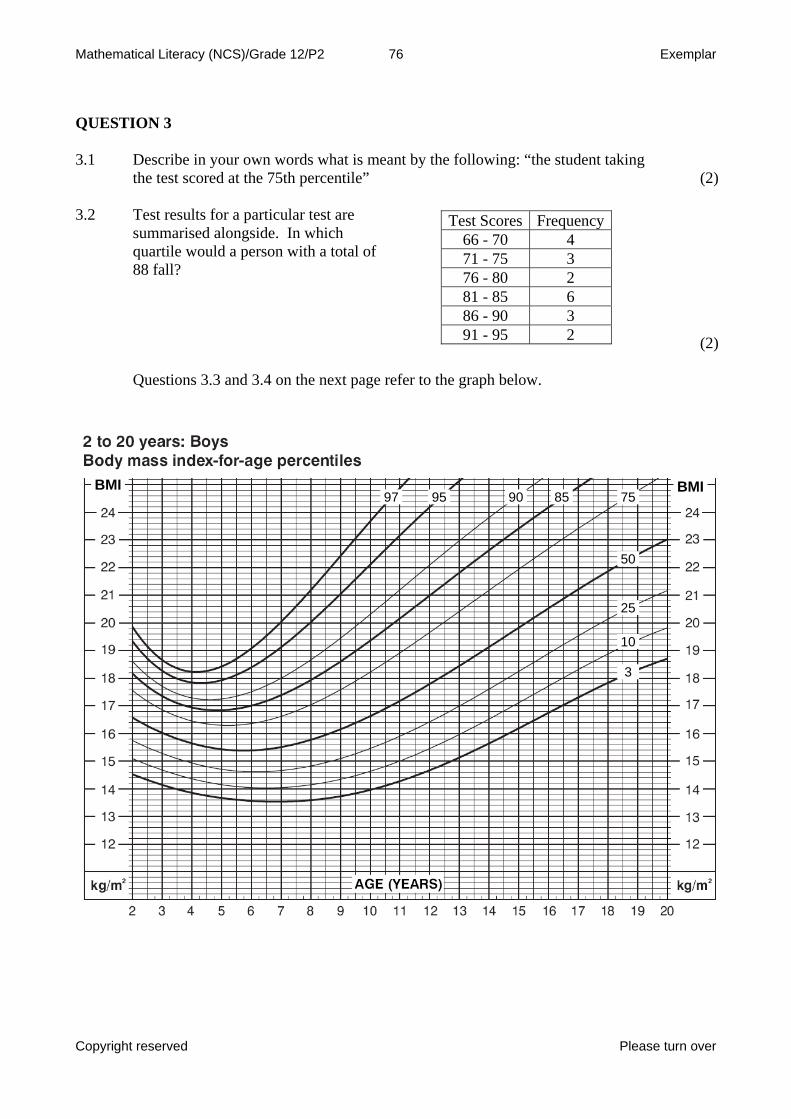
Mathematical Literacy (NCS)/Grade 12/P2 76 Exemplar
QUESTION 3 3.1 Describe in your own words what is meant by the following: “the student taking
the test scored at the 75th percentile”
(2)
3.2 Test results for a particular test are summarised alongside. In which quartile would a person with a total of 88 fall?
Test Scores Frequency 66 - 70 4 71 - 75 3 76 - 80 2 81 - 85 6 86 - 90 3 91 - 95 2 (2)
Questions 3.3 and 3.4 on the next page refer to the graph below.
BMI BMI85 909597 75
50
25
10
3
Copyright reserved Please turn over
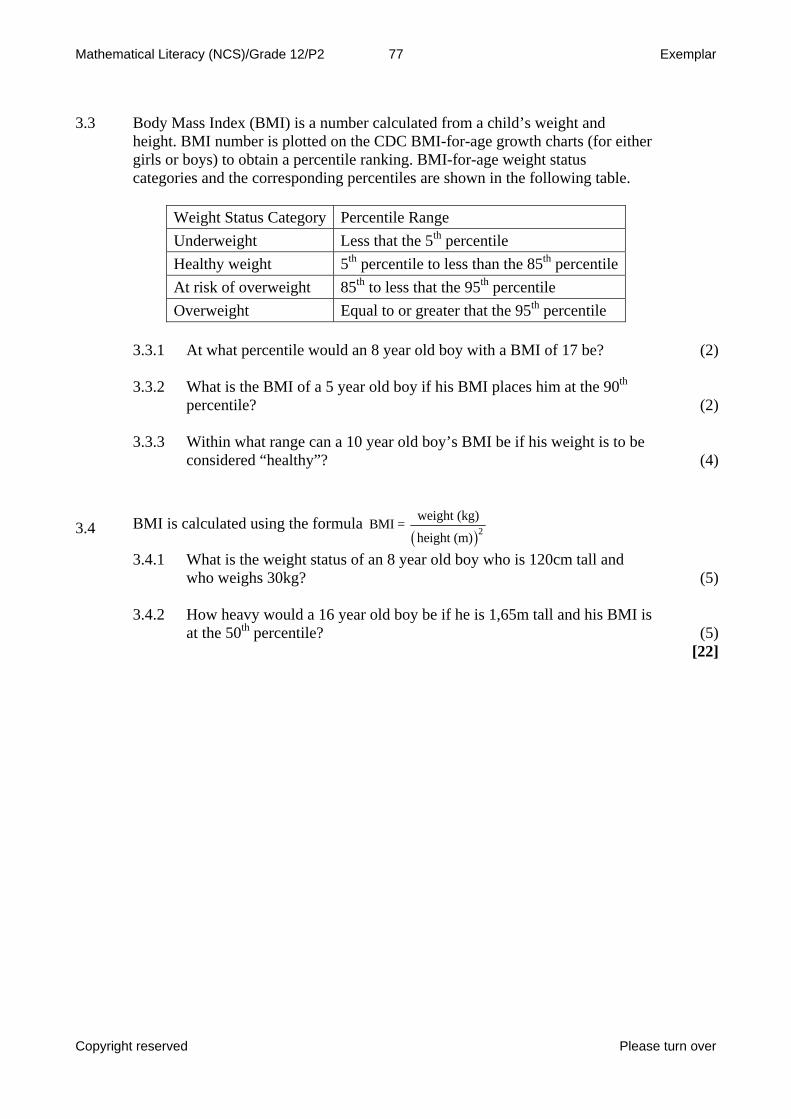
Mathematical Literacy (NCS)/Grade 12/P2 77 Exemplar
3.3 Body Mass Index (BMI) is a number calculated from a child’s weight and
height. BMI number is plotted on the CDC BMI-for-age growth charts (for either girls or boys) to obtain a percentile ranking. BMI-for-age weight status categories and the corresponding percentiles are shown in the following table.
Weight Status Category Percentile Range
thUnderweight Less that the 5 percentile Healthy weight 5th percentile to less than the 85th percentile
thAt risk of overweight 85 to less that the 95th percentile thOverweight Equal to or greater that the 95 percentile
3.3.1 At what percentile would an 8 year old boy with a BMI of 17 be? (2) 3.3.2 What is the BMI of a 5 year old boy if his BMI places him at the 90th
percentile?
(2) 3.3.3 Within what range can a 10 year old boy’s BMI be if his weight is to be
considered “healthy”?
(4)
( )2weight (kg)BMI = height (m)
BMI is calculated using the formula 3.4
3.4.1 What is the weight status of an 8 year old boy who is 120cm tall and who weighs 30kg?
(5)
3.4.2 How heavy would a 16 year old boy be if he is 1,65m tall and his BMI is
at the 50
th percentile? (5)[22]
Copyright reserved Please turn over
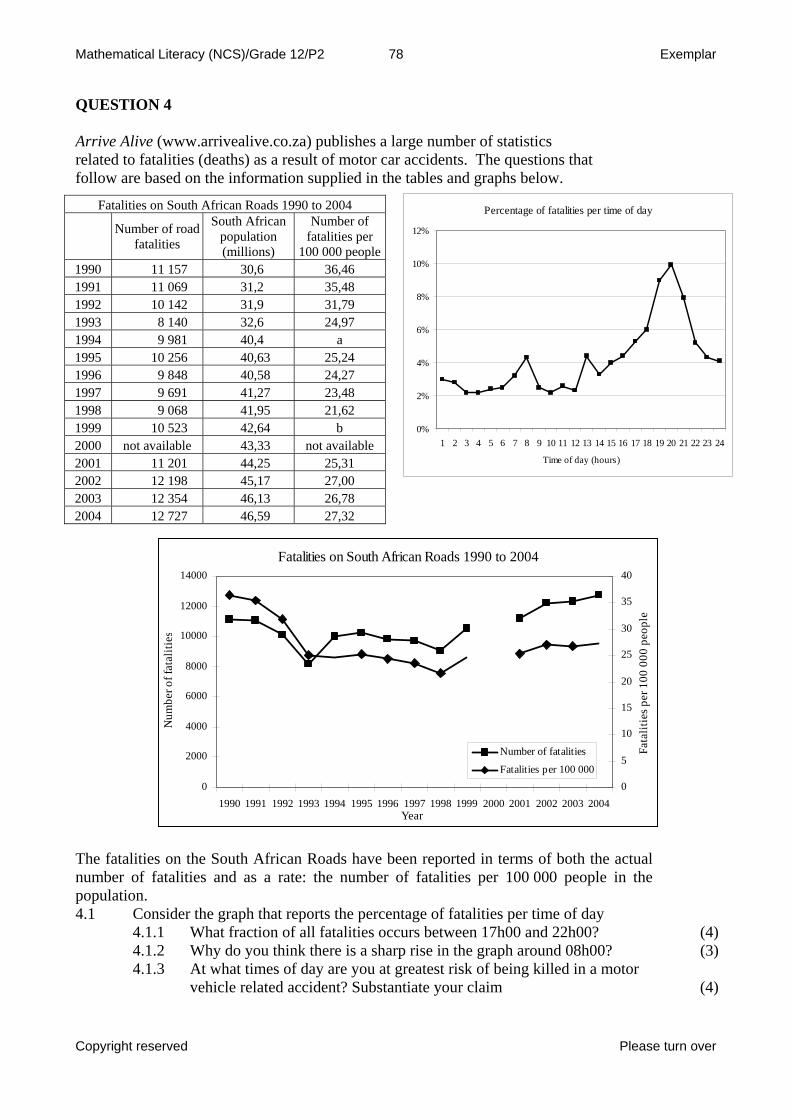
Mathematical Literacy (NCS)/Grade 12/P2 78 Exemplar
QUESTION 4 Arrive Alive (www.arrivealive.co.za) publishes a large number of statistics related to fatalities (deaths) as a result of motor car accidents. The questions that follow are based on the information supplied in the tables and graphs below.
The fatalities on the South African Roads have been reported in terms of both the actual number of fatalities and as a rate: the number of fatalities per 100 000 people in the population.
4.1 Consider the graph that reports the percentage of fatalities per time of day 4.1.1 What fraction of all fatalities occurs between 17h00 and 22h00? (4) 4.1.2 Why do you think there is a sharp rise in the graph around 08h00? (3) 4.1.3 At what times of day are you at greatest risk of being killed in a motor
vehicle related accident? Substantiate your claim
(4)
Fatalities on South African Roads 1990 to 2004
0
2000
4000
6000
8000
10000
12000
14000
1990 1991 1992 1993 1994 1995 1996 1997 1998 1999 2000 2001 2002 2003 2004Year
Num
ber o
f fat
aliti
es
0
5
10
15
20
25
30
35
40
Fata
litie
s per
100
000
peo
ple
Number of fatalities
Fatalities per 100 000
Percentage of fatalities per time of day
0%
2%
4%
6%
8%
10%
12%
1 2 3 4 5 6 7 8 9 10 11 12 13 14 15 16 17 18 19 20 21 22 23 24
Time of day (hours)
Fatalities on South African Roads 1990 to 2004
umber of road fatalities
South African population (millions)
Number of fatalities per
100 000 people
N
1990 11 157 30,6 36,46 1991 11 069 31,2 35,48 1992 10 142 31,9 31,79 1993 8 140 32,6 24,97 1994 9 981 40,4 a 1995 10 256 40,63 25,24 1996 9 848 40,58 24,27 1997 9 691 41,27 23,48 1998 9 068 41,95 21,62 1999 10 523 42,64 b 2000 not available 43,33 not available 2001 11 201 44,25 25,31 2002 12 198 45,17 27,00 2003 12 354 46,13 26,78 2004 12 727 46,59 27,32
Copyright reserved Please turn over
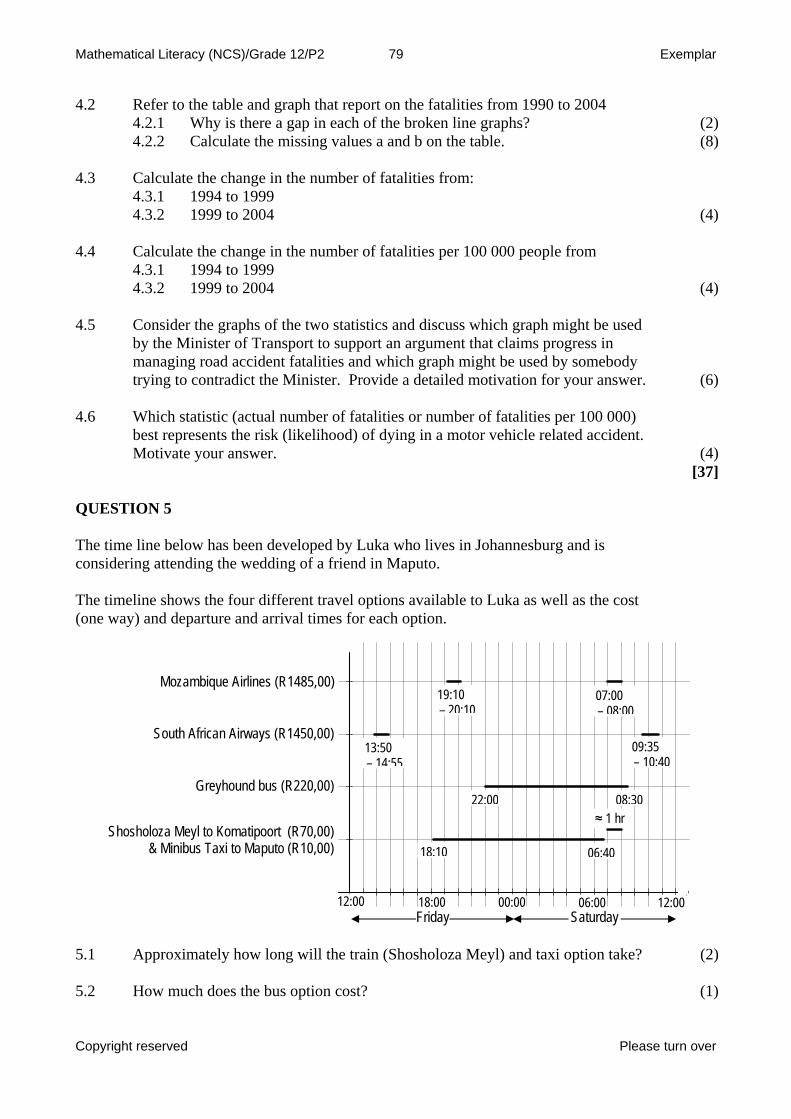
Mathematical Literacy (NCS)/Grade 12/P2 79 Exemplar
Copyright reserved Please turn over
4.2 Refer to the table and graph that report on the fatalities from 1990 to 2004 4.2.1 Why is there a gap in each of the broken line graphs? (2) 4.2.2 Calculate the missing values a and b on the table. (8) 4.3 Calculate the change in the number of fatalities from: 4.3.1 1994 to 1999 4.3.2 1999 to 2004 (4) 4.4 Calculate the change in the number of fatalities per 100 000 people from 4.3.1 1994 to 1999 4.3.2 1999 to 2004 (4)
4.5 Consider the graphs of the two statistics and discuss which graph might be used by the Minister of Transport to support an argument that claims progress in managing road accident fatalities and which graph might be used by somebody trying to contradict the Minister. Provide a detailed motivation for your answer. (6)
4.6 Which statistic (actual number of fatalities or number of fatalities per 100 000)
best represents the risk (likelihood) of dying in a motor vehicle related accident. Motivate your answer. (4)
Shosholoza Meyl to Komatipoort (R70,00) & Minibus Taxi to Maputo (R10,00)
Greyhound bus (R220,00)
South African Airways (R1450,00)
Mozambique Airlines (R1485,00)
12:00 18:00 00:00 06:00 12:00 Friday Saturday
18:10 06:40
≈ 1 hr 22:00 08:30
13:50 – 14:55
09:35 – 10:40
19:10 – 20:10
07:00 – 08:00
[37] QUESTION 5
The time line below has been developed by Luka who lives in Johannesburg and is considering attending the wedding of a friend in Maputo. The timeline shows the four different travel options available to Luka as well as the cost (one way) and departure and arrival times for each option.
5.1 Approximately how long will the train (Shosholoza Meyl) and taxi option take? (2) 5.2 How much does the bus option cost? (1)
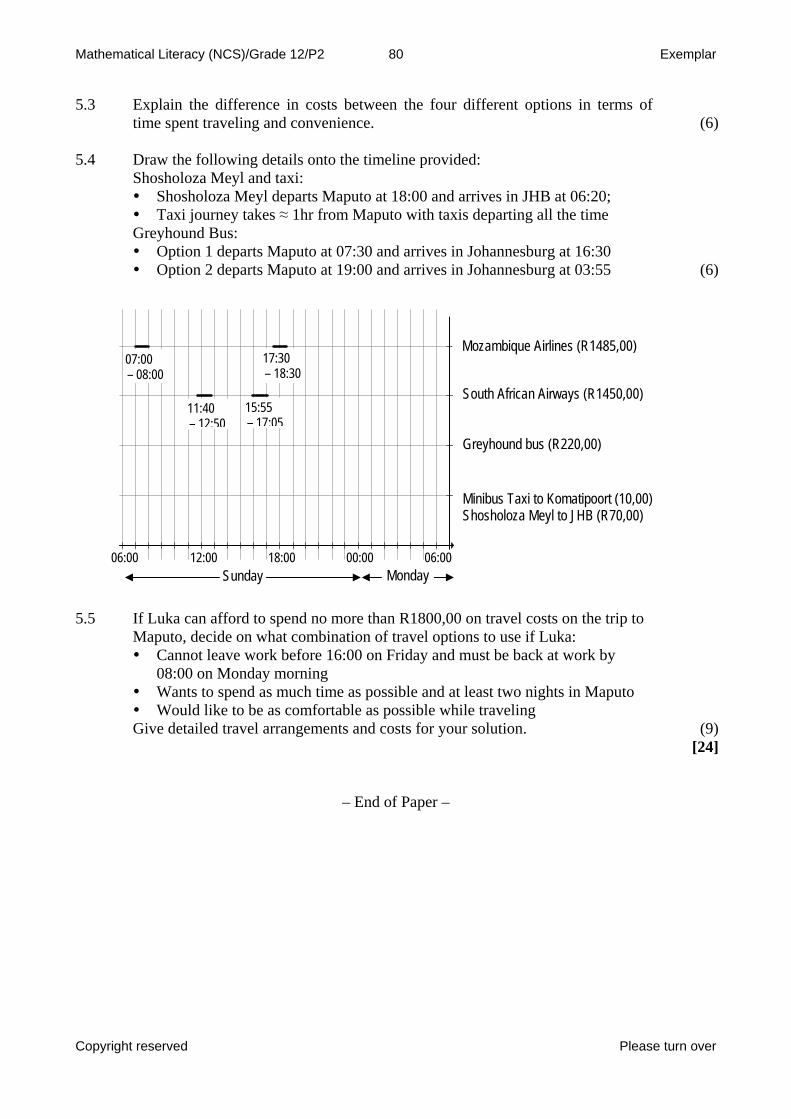
Mathematical Literacy (NCS)/Grade 12/P2 80 Exemplar
Copyright reserved Please turn over
5.3 Explain the difference in costs between the four different options in terms of time spent traveling and convenience.
(6)
5.4 Draw the following details onto the timeline provided:
Shosholoza Meyl and taxi: Shosholoza Meyl departs Maputo at 18:00 and arrives in JHB at 06:20; Taxi journey takes ≈ 1hr from Maputo with taxis departing all the time
Greyhound Bus: Option 1 departs Maputo at 07:30 and arrives in Johannesburg at 16:30 Option 2 departs Maputo at 19:00 and arrives in Johannesburg at 03:55 (6)
06:00 12:00 18:00 00:00 06:00 Sunday Monday
11:40 – 12:50
15:55 – 17:05
07:00 – 08:00
17:30 – 18:30
Minibus Taxi to Komatipoort (10,00) Shosholoza Meyl to JHB (R70,00)
Greyhound bus (R220,00)
South African Airways (R1450,00)
Mozambique Airlines (R1485,00) 5.5 If Luka can afford to spend no more than R1800,00 on travel costs on the trip to
Maputo, decide on what combination of travel options to use if Luka:
Cannot leave work before 16:00 on Friday and must be back at work by 08:00 on Monday morning
Wants to spend as much time as possible and at least two nights in Maputo Would like to be as comfortable as possible while traveling
Give detailed travel arrangements and costs for your solution. (9)[24]
– End of Paper –
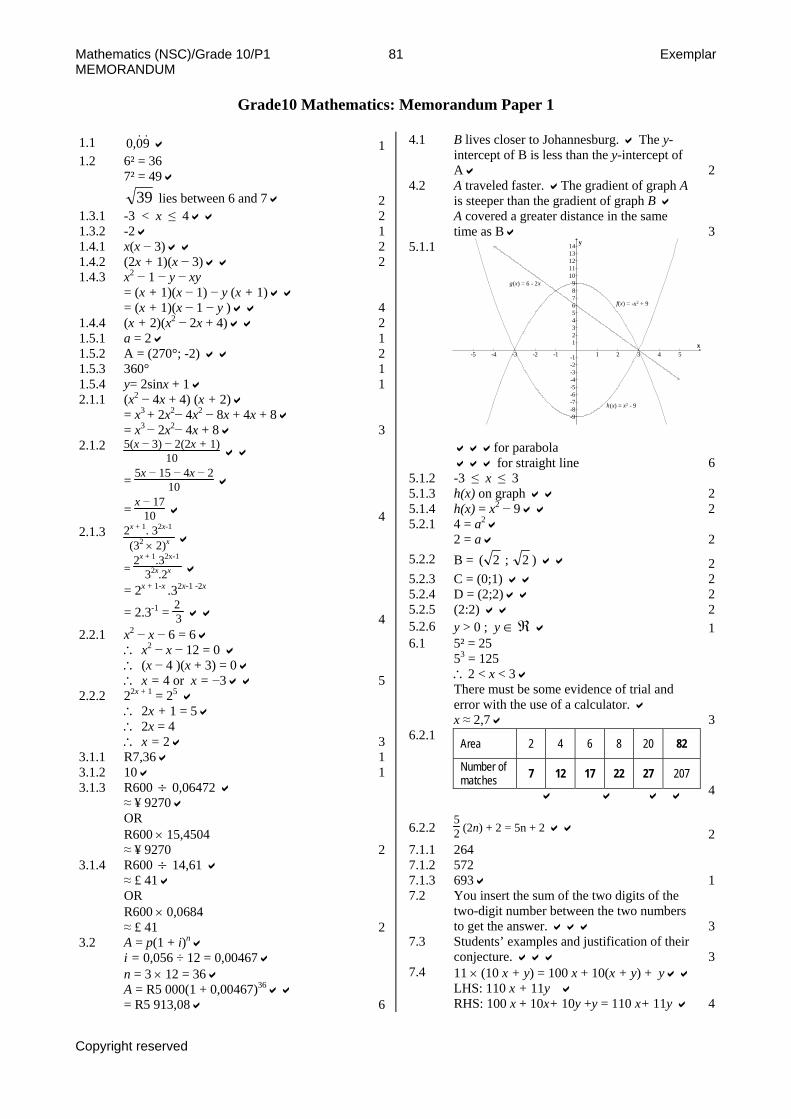
Mathematics (NSC)/Grade 10/P1 81 Exemplar MEMORANDUM
Grade10 Mathematics: Memorandum Paper 1 1.1 90,0 11.2 6² = 36
7² = 49
39 lies between 6 and 7 21.3.1 -3 < x ≤ 4 21.3.2 -2 11.4.1 x(x − 3) 21.4.2 (2x + 1)(x − 3) 21.4.3 x2 − 1 − y − xy
= (x + 1)(x − 1) − y (x + 1) = (x + 1)(x − 1 − y ) 4
1.4.4 (x + 2)(x2 − 2x + 4) 21.5.1 a = 2 11.5.2 A = (270°; -2) 21.5.3 360° 11.5.4 y= 2sinx + 1 12.1.1 (x2 − 4x + 4) (x + 2)
= x3 + 2x2− 4x2 − 8x + 4x + 8 = x3 − 2x2− 4x + 8 3
2.1.2 5(x − 3) − 2(2x + 1)10
= 5x − 15 − 4x − 210
= x − 1710 4
2.1.3 2x + 1. 32x-1
(32 × 2)x
= 2x + 1.32x-1
32x.2x
= 2x + 1-x .32x-1 -2x
= 2.3-1 = 2
3 42.2.1 x2 − x − 6 = 6
∴ x2 − x − 12 = 0 ∴ (x − 4 )(x + 3) = 0 ∴ x = 4 or x = −3 5
2.2.2 22x + 1 = 25 ∴ 2x + 1 = 5 ∴ 2x = 4 ∴ x = 2 3
3.1.1 R7,36 13.1.2 10 13.1.3 R600 0,06472 ÷
≈ ¥ 9270 OR R600 × 15,4504 ≈ ¥ 9270 2
3.1.4 R600 14,61 ÷≈ £ 41 OR R600 × 0,0684 ≈ £ 41 2
3.2 A = p(1 + i)n i = 0,056 ÷ 12 = 0,00467 n = 3 × 12 = 36 A = R5 000(1 + 0,00467)36 = R5 913,08 6
4.1 B lives closer to Johannesburg. The y-intercept of B is less than the y-intercept of A 2
4.2 A traveled faster. The gradient of graph A is steeper than the gradient of graph B A covered a greater distance in the same time as B 3
5.1.1
for parabola for straight line
-5 -4 -3 -2 -1 1 2 3 4 5
-9-8-7-6-5-4-3-2-1
123456789
1011121314
x
y
f(x) = -x2 + 9
g(x) = 6 - 2x
h(x) = x2 - 9
65.1.2 -3 ≤ x ≤ 3 5.1.3 h(x) on graph 25.1.4 h(x) = x2 − 9 25.2.1 4 = a2
2 = a 25.2.2 B = )2;2( 25.2.3 C = (0;1) 25.2.4 D = (2;2) 25.2.5 (2:2) 25.2.6 y > 0 ; y ∈ℜ 16.1 5² = 25
53 = 125 ∴2 < x < 3 There must be some evidence of trial and error with the use of a calculator. x ≈ 2,7 3
6.2.1
Area 2 4 6 8 20 82
Number of matches 7 12 17 22 27 207
4
6.2.2 52 (2n) + 2 = 5n + 2 2
7.1.1 264 7.1.2 572 7.1.3 693 17.2 You insert the sum of the two digits of the
two-digit number between the two numbers to get the answer. 3
7.3 Students’ examples and justification of their conjecture. 3
7.4 11 × (10 x + y) = 100 x + 10(x + y) + y LHS: 110 x + 11y RHS: 100 x + 10x+ 10y +y = 110 x+ 11y 4
Copyright reserved
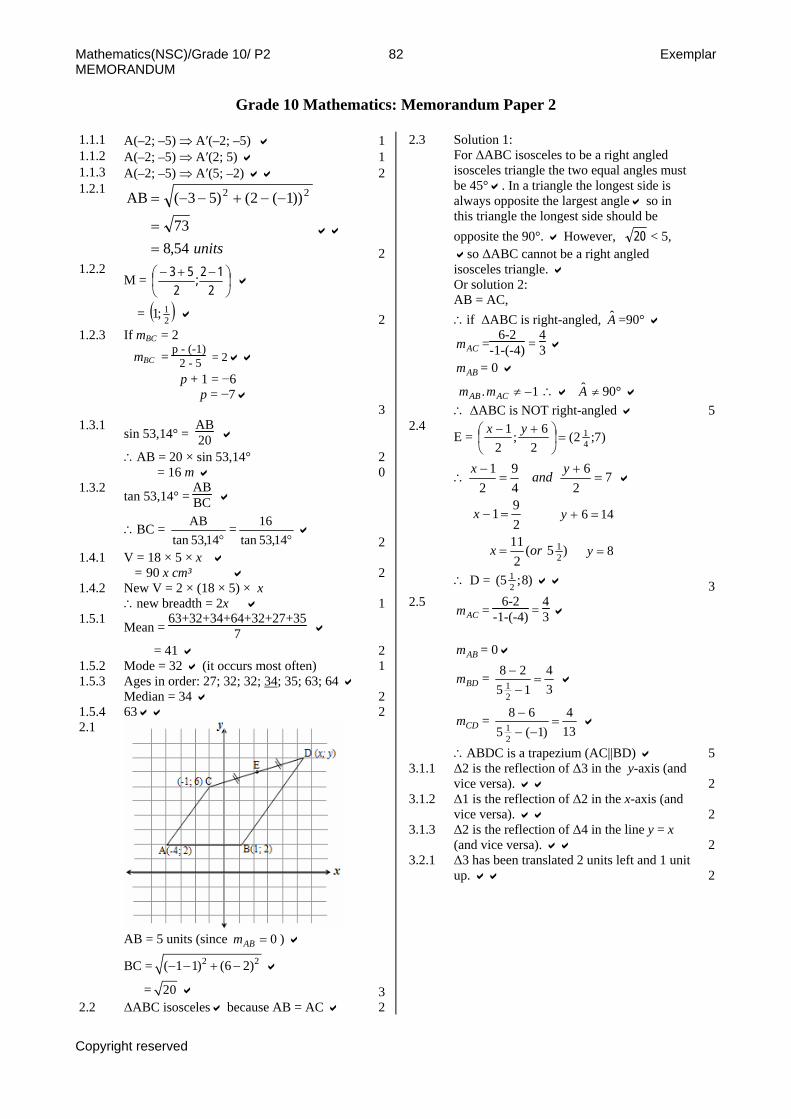
Mathematics(NSC)/Grade 10/ P2 82 Exemplar MEMORANDUM
Grade 10 Mathematics: Memorandum Paper 2 1.1.1 A(–2; –5) ⇒ A′(–2; –5) 11.1.2 A(–2; –5) ⇒ A′(2; 5) 11.1.3 A(–2; –5) ⇒ A′(5; –2) 21.2.1
units54,873
))1(2()53(AB 22
==
−−+−−=
21.2.2
M = ⎟⎠⎞
⎜⎝⎛ −+−
212;
253
= ( )21;1 2
1.2.3 If mBC = 2 mBC = p - (-1)
2 - 5 = 2
p + 1 = −6 p = −7 3
1.3.1 sin 53,14° = AB20
∴AB = 20 × sin 53,14° = 16 m
20
1.3.2 tan 53,14° = ABBC
∴BC = °14,53tan
AB =°14,53tan
16 2
1.4.1 V = 18 × 5 × x = 90 x cm³ 2
1.4.2 New V = 2 × (18 × 5) × x ∴new breadth = 2x 1
1.5.1 Mean = 63+32+34+64+32+27+35
7
= 41 21.5.2 Mode = 32 (it occurs most often) 11.5.3 Ages in order: 27; 32; 32; 34; 35; 63; 64
Median = 34 21.5.4 63 22.1
AB = 5 units (since ) 0=ABm
BC = 2 2( 1 1) (6 2)− − + −
= 20
32.2 ΔABC isosceles because AB = AC 2
2.3 Solution 1: For ΔABC isosceles to be a right angled isosceles triangle the two equal angles must be 45° . In a triangle the longest side is always opposite the largest angle so in this triangle the longest side should be opposite the 90°. However, 20 < 5,
so ΔABC cannot be a right angled isosceles triangle. Or solution 2: AB = AC, ∴if ΔABC is right-angled, A =90°
ACm =6-2
-1-(-4) = 43
ABm = 0
1. −≠ACAB mm ∴ A ≠ 90° ∴ ΔABC is NOT right-angled 5
2.4 E = )7;2(
26;
21
41=⎟
⎠⎞
⎜⎝⎛ +− yx
∴ 72
649
21
=+
=− yandx
291=−x 146 =+y
)5(2
1121orx = 8=y
∴ D = )8;5( 21 3
2.5 ACm =
6-2-1-(-4) =
43
ABm = 0
BDm = 34
1528
21 =−−
CDm = 134
)1(568
21 =
−−−
∴ABDC is a trapezium (AC||BD) 53.1.1 Δ2 is the reflection of Δ3 in the y-axis (and
vice versa). 23.1.2 Δ1 is the reflection of Δ2 in the x-axis (and
vice versa). 23.1.3 Δ2 is the reflection of Δ4 in the line y = x
(and vice versa). 23.2.1 Δ3 has been translated 2 units left and 1 unit
up. 2
Copyright reserved
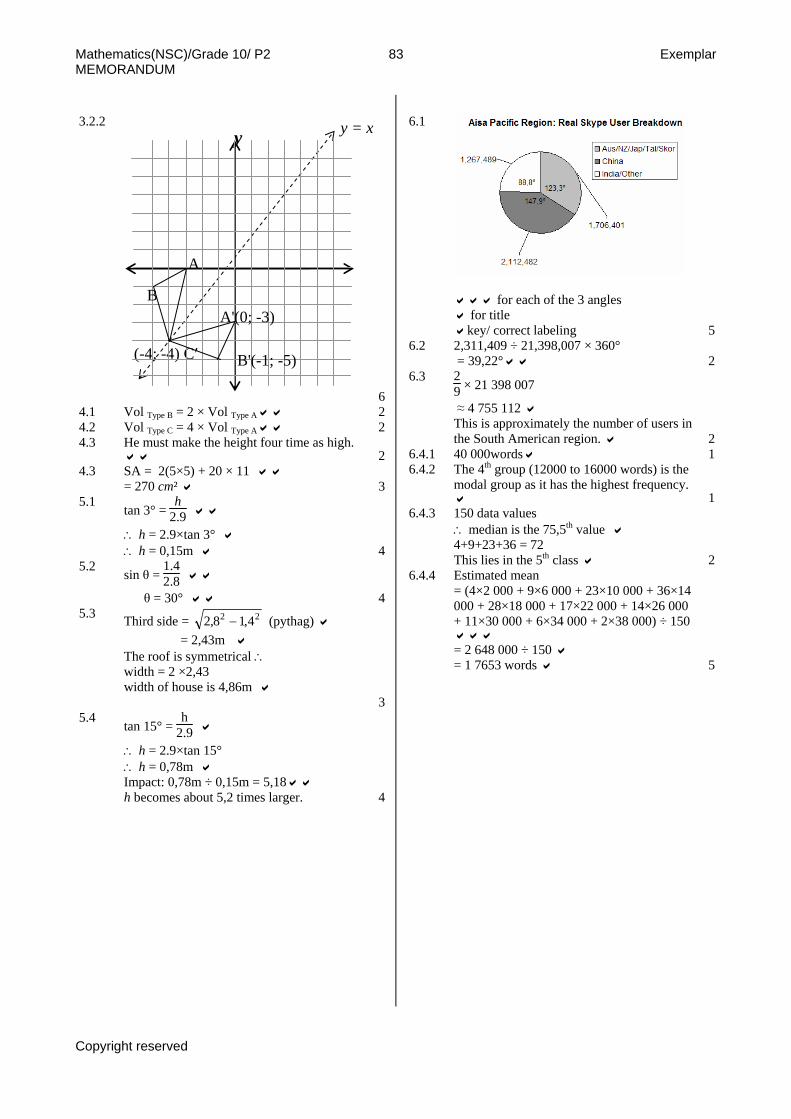
Mathematics(NSC)/Grade 10/ P2 83 Exemplar MEMORANDUM
3.2.2
6
4.1 Vol Type B = 2 × Vol Type A 24.2 Vol Type C = 4 × Vol Type A 24.3 He must make the height four time as high.
24.3 SA = 2(5×5) + 20 × 11
= 270 cm² 35.1 tan 3° =
h2.9
∴ h = 2.9×tan 3° ∴ h = 0,15m 4
5.2 sin θ = 1.42.8
θ = 30° 45.3 Third side = 22 4,18,2 − (pythag)
= 2,43m The roof is symmetrical ∴ width = 2 ×2,43 width of house is 4,86m 3
5.4 tan 15° = h
2.9
∴ h = 2.9×tan 15° ∴ h = 0,78m Impact: 0,78m ÷ 0,15m = 5,18 h becomes about 5,2 times larger. 4
6.1
for each of the 3 angles for title
y = x y
key/ correct labeling 56.2 2,311,409 ÷ 21,398,007 × 360°
= 39,22° (-4; -4) C′ 2
A
B A'(0; -3)
B'(-1; -5) 6.3 2
9 × 21 398 007
≈ 4 755 112 This is approximately the number of users in the South American region. 2
6.4.1 40 000words 16.4.2 The 4th group (12000 to 16000 words) is the
modal group as it has the highest frequency. 1
6.4.3 150 data values ∴ median is the 75,5th value 4+9+23+36 = 72 This lies in the 5th class 2
6.4.4 Estimated mean = (4×2 000 + 9×6 000 + 23×10 000 + 36×14 000 + 28×18 000 + 17×22 000 + 14×26 000 + 11×30 000 + 6×34 000 + 2×38 000) ÷ 150
= 2 648 000 ÷ 150 = 1 7653 words 5
Copyright reserved
Mathematics(NSC) /Grade 11/P1 84 Exemplar MEMORANDUM
Grade 11 Mathematics: Memorandum Paper 1
x = 7 and y = 9 2.1.1 21.1.1 9− 1
1.1.2 310
31
3133 xxxx ==. 2
1.1.3 33435 =− 21.1.4 No
33.3 =
3 is irrational but 3 is rational 31.2.1 176 =T Arithmetic sequence 11.2.2 26 =T Geometric sequence 11.2.3 366 =T Squares 11.3 847,43 11.4.1 g(x) 11.4.2 x = -1 or x = 3 21.4.3 y = 1 11.4.4 y > 0 11.4.5 x –axis (only 1 mark) y = 0
Asks for an equation 21.4.6 x = 1 11.5.1 A (120° ; 1) 21.5.2 D (-180°; 0,5)
Using periodicity E(60° ; 0,5) Using symmetry about x = 120° C(-300°; 0,5) Using periodicity 6
1.5.3 y = -0,5 11.5.4 Amplitude = 1 1
z = 11 2.1.2 1 zp += 272.1.3
38=∴ p 22.1.4 All = 2 2
1.6.1
132
21
62
=∴=+∴
=+
xx
x
21.6.2
7)2(2
)2)(2(=
−+−
xxx
142 =+∴ x 12=∴ x 4
1.6.3 0)3)(5( =−+ xx 5−=∴ x or 3=x 4
1.6.4
-2.5 -2 -1.5 -1 -0.5 0.5 1 1.5 2 2.5
-8
-6
-4
-2
2
4
6
8
x
y
y = x2
y = 4
Sketch not necessary
2−<∴ x or 2>x 3
2.1.5 2nd diff constant therefore quadratic canTn +=∴ 2 (by inspection)
22 += n 10210 =∴T 4
2.2.1 211123 =+=+= TTT 312234 =+=+= TTT 523345 =+=+= TTT 3
2.2.2 Largest square = T6 = 8 22.2.3 =2
kT area of the kth square
=+++∴ 26
22
21 ... TTT area of rectangle
Width of rectangle = T6 Length of rectangle = 756 TTT =+
672
62
22
1 ... TTTTT ×=+++∴ 53.1.1 The 1st year 1
09,84249)13,01(000100 5 RV =−=
3.1.2 3
81,932146)08,01(000100 5 RA =+= 3.1.3 3
3.1.4 Amount needed = A – V = R 97 090,72 13.2.1 Option A: I = 0,145 x 10 000 = R 1 450
1214,0 12 Option B: I = 10 000(1 + ) ─ 10 000
= R 1 493, 42 Thus Option B is better OR
%93,14
)1214,01(1 12
=∴
+=+
e
e
i
i
43.2.2 Option A: I = 0,075 x 10 000 = R 750
1214,0 6 Option B: I = 10 000(1 + ) ─ 10 000 =
R 720,69 Yes, option A is better OR
%25,7%2
5,14==iOption A:
Option B:
%21,7
)1214,01()1(
6
66
=∴
+=+
i
i
Yes, option A is better 5x = 7 14.1
4.2.1 )1)(3()32()( 2 +−−=−−−= xxxxxf 3
Copyright reserved
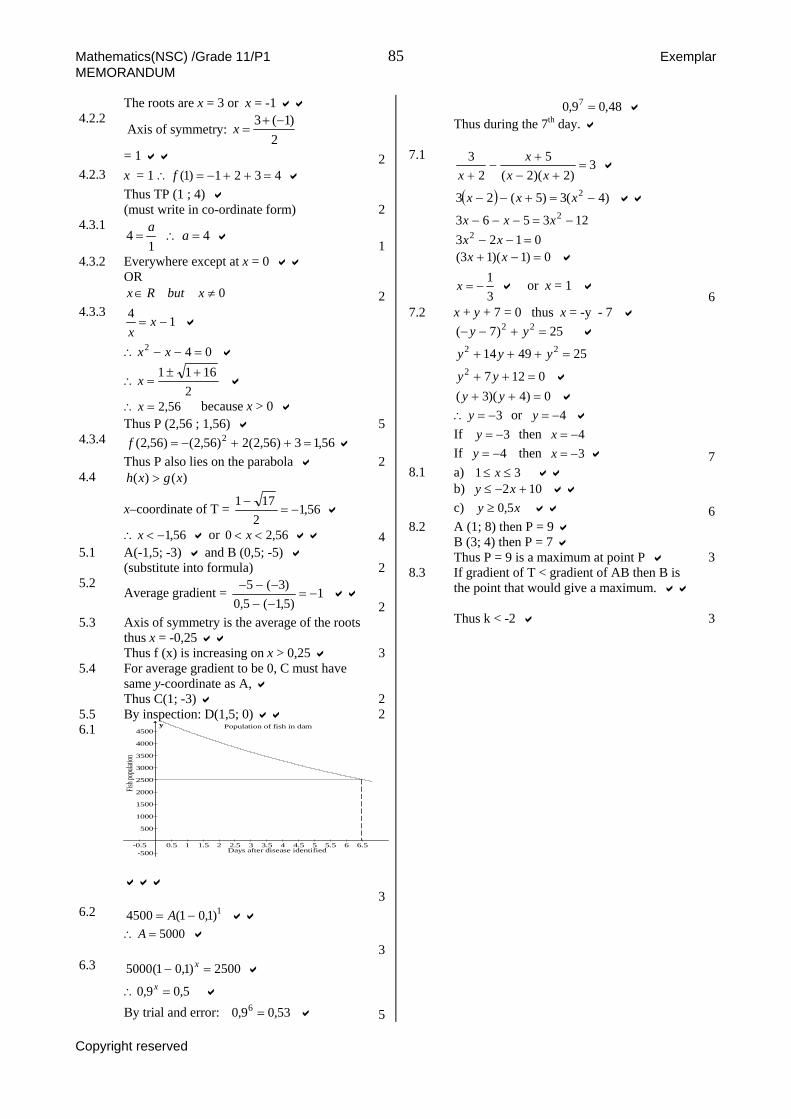
Mathematics(NSC) /Grade 11/P1 85 Exemplar MEMORANDUM
The roots are x = 3 or x = -1 4.2.2
Axis of symmetry: 2
)1(3 −+=x
= 1 24.2.3 x = 1 4321)1( =++−=∴ f
Thus TP (1 ; 4) (must write in co-ordinate form) 2
4.3.1 4
14 =∴= aa
1
4.3.2 Everywhere except at x = 0 OR
0≠∈ xbutRx 24.3.3
14−= x
x
042 =−−∴ xx
21611 +±
=∴ x
56,2=∴ x because x > 0 Thus P (2,56 ; 1,56) 5
4.3.4 56,13)56,2(2)56,2()56,2( 2 =++−=f Thus P also lies on the parabola 2
4.4 )()( xgxh >
x–coordinate of T = 56,12
171−=
−
56,1−<∴ x or 56,20 << x 45.1 A(-1,5; -3) and B (0,5; -5)
(substitute into formula) 25.2
Average gradient = 1)5,1(5,0
)3(5−=
−−−−−
25.3 Axis of symmetry is the average of the roots
thus x = -0,25 Thus f (x) is increasing on x > 0,25 3
5.4 For average gradient to be 0, C must have same y-coordinate as A, Thus C(1; -3) 2
5.5 By inspection: D(1,5; 0) 26.1
-0.5 0.5 1 1.5 2 2.5 3 3.5 4 4.5 5 5.5 6 6.5-500
500
1000
1500
2000
2500
3000
3500
4000
4500y Population of fish in dam
Days after disease identified
Fish p
opula
tion
3
48,09,0 7 =
6.2 1)1,01(4500 −= A 5000=∴ A
36.3 2500)1,01(5000 =− x
5,09,0 =∴ x By trial and error: 53,09,0 6 = 5
Thus during the 7th day.
7.1 3
)2)(2(5
23
=+−
+−
+ xxx
x
( ) )4(3)5(23 2 −=+−− xxx
123563 2 −=−−− xxx 0123 2 =−− xx
0)1)(13( =−+ xx
31
−=x or x = 1 6
x + y + 7 = 0 thus x = -y - 7 7.2 25)7( 22 =+−− yy
254914 22 =+++ yyy
01272 =++ yy 0)4)(3( =++ yy
or 3−=∴ y 4−=yIf then 3−=y 4−=xIf then 4−=y 3−=x 7
8.1 a) 31 ≤≤ x b) 102 +−≤ xy
c) xy 5,0≥ 6A (1; 8) then P = 9 8.2 B (3; 4) then P = 7
3Thus P = 9 is a maximum at point P 8.3 If gradient of T < gradient of AB then B is
the point that would give a maximum. Thus k < -2 3
Copyright reserved
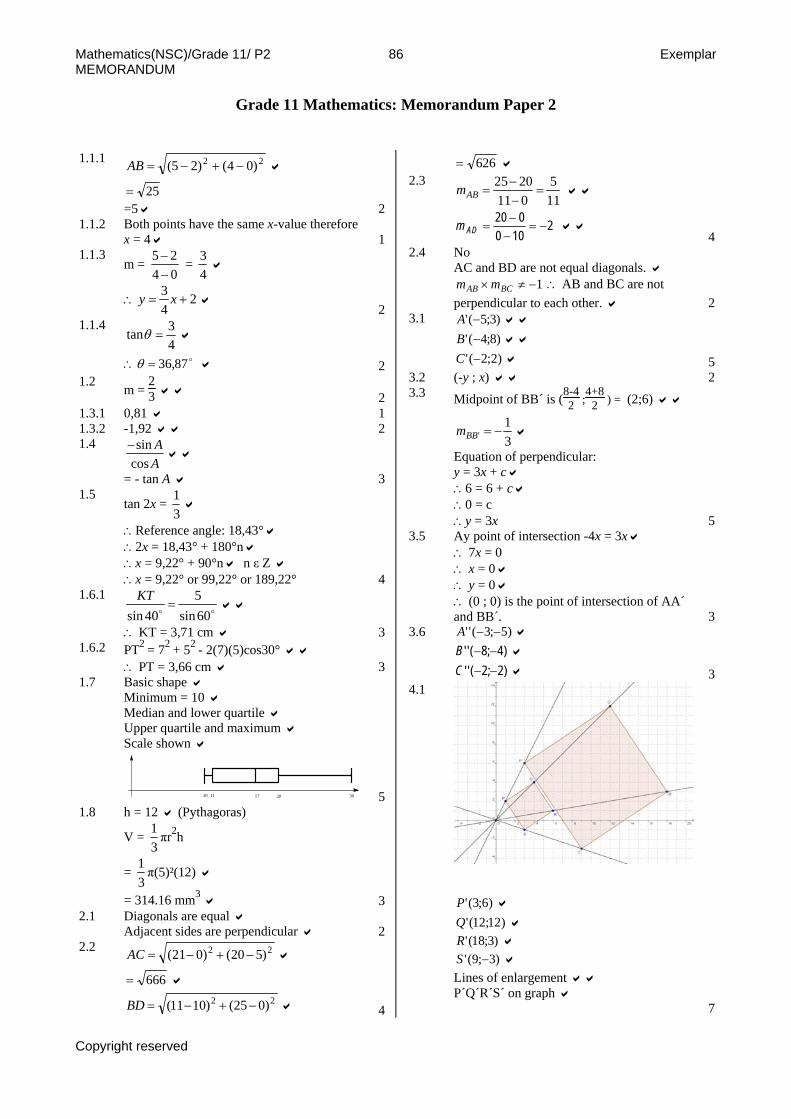
Mathematics(NSC)/Grade 11/ P2 86 Exemplar MEMORANDUM
Grade 11 Mathematics: Memorandum Paper 2
1.1.1 22 )04()25( −+−=AB
25= =5 2
1.1.2 Both points have the same x-value therefore x = 4 1
1.1.3 m =
0425
−− =
43
∴ 243
+= xy 2
1.1.4 43tan =θ
∴ 87,36=θ 21.2 m =
23 2
1.3.1 0,81 11.3.2 -1,92 21.4
AA
cossin−
= - tan A 31.5
tan 2x = 31
∴Reference angle: 18,43° ∴2x = 18,43° + 180°n ∴x = 9,22° + 90°n n ε Z ∴x = 9,22° or 99,22° or 189,22° 4
1.6.1 60sin5
40sin=
KT
∴ KT = 3,71 cm 31.6.2 PT2 = 72 + 52 - 2(7)(5)cos30°
∴ PT = 3,66 cm 31.7 Basic shape
Minimum = 10 Median and lower quartile Upper quartile and maximum Scale shown
3020171110 51.8 h = 12 (Pythagoras)
V = 31 πr2h
= 31 π(5)²(12)
= 314.16 mm3 32.1 Diagonals are equal
Adjacent sides are perpendicular 22.2 22 )520()021( −+−=AC
666= 22 )025()1011( −+−=BD 4
626= 2.3
115
0112025
=−−
=ABm
2100020
−=−−
=ADm 4
2.4 No AC and BD are not equal diagonals.
1−≠× BCAB mm ∴ AB and BC are not perpendicular to each other. 2
3.1 )3;5(' −A )8;4(' −B )2;2(' −C 5
3.2 (-y ; x) 23.3 Midpoint of BB´ is (8-4
2 ;4+8
2 ) = (2;6)
31
' −=BBm
Equation of perpendicular: y = 3x + c ∴6 = 6 + c ∴0 = c ∴y = 3x 5
3.5 Ay point of intersection -4x = 3x ∴ 7x = 0 ∴ x = 0 ∴ y = 0 ∴ (0 ; 0) is the point of intersection of AA´ and BB´. 3
3.6 )5;3('' −−A )4;8('' −−B )2;2('' −−C 3
4.1
)6;3('P )12;12('Q
)3;18('R )3;9(' −S
Lines of enlargement P´Q´R´S´ on graph 7
Copyright reserved
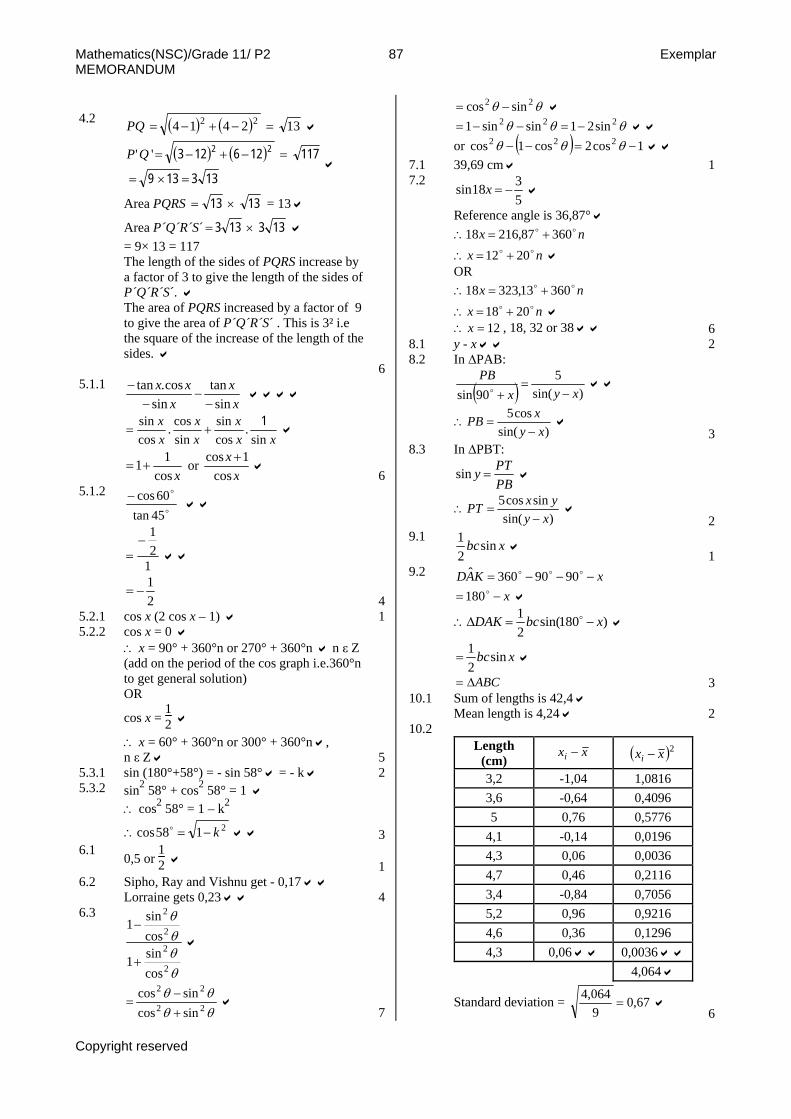
Mathematics(NSC)/Grade 11/ P2 87 Exemplar MEMORANDUM
4.2 ( ) ( ) 132414 22 =−+−=PQ
( ) ( )133139
117126123 22
=×=
=−+−=''QP
Area PQRS 1313 ×= = 13
Area P´Q´R´S´ 133133 ×= = 9× 13 = 117 The length of the sides of PQRS increase by a factor of 3 to give the length of the sides of P´Q´R´S´. The area of PQRS increased by a factor of 9 to give the area of P´Q´R´S´ . This is 3² i.e the square of the increase of the length of the sides. 6
5.1.1 x
xx
xxsin
tansin
cos.tan−
−−
−
xxx
xx
xx
sin.
cossin
sincos.
cossin 1
+=
xcos11+= or
xx
cos1cos +
65.1.2
45tan60cos−
121
−=
21
−= 4
5.2.1 cos x (2 cos x – 1) 15.2.2 cos x = 0
∴ x = 90° + 360°n or 270° + 360°n n ε Z (add on the period of the cos graph i.e.360°n to get general solution) OR
cos x = 12
∴ x = 60° + 360°n or 300° + 360°n , n ε Z 5
5.3.1 sin (180°+58°) = - sin 58° = - k 25.3.2 sin2 58° + cos2 58° = 1
∴ cos2 58° = 1 – k2
2158cos k−=∴ 36.1 0,5 or
12 1
6.2 Sipho, Ray and Vishnu get - 0,17 Lorraine gets 0,23 4
6.3
θθθθ
2
2
2
2
cossin1
cossin1
+
−
θθθθ
22
22
sincossincos
+−
= 7
θθ 22 sincos −= θθθ 222 sin21sinsin1 −=−−=
or ( ) 1cos2cos1cos 222 −=−− θθθ 7.1 39,69 cm 17.2
5318sin −=x
Reference angle is 36,87° nx 36087,21618 +=∴
nx 2012 +=∴ OR
nx 36013,32318 +=∴ nx 2018 +=∴
12=∴ x , 18, 32 or 38 68.1 y - x 28.2 In ∆PAB:
( ) )sin(5
90sin xyxPB
−=
+
)sin(cos5
xyxPB−
=∴ 3
8.3 In ∆PBT:
PBPTy =sin
)sin(sincos5
xyyxPT
−=∴
29.1
xbcsin21
19.2 xKAD −−−= 9090360ˆ
x−=180
)180sin(21 xbcDAK −=Δ∴
xbcsin21
=
ABCΔ= 310.1 Sum of lengths is 42,4
Mean length is 4,24 210.2
Length (cm)
xxi − ( )2xxi −
3,2 -1,04 1,0816 3,6 -0,64 0,4096 5 0,76 0,5776
4,1 -0,14 0,0196 4,3 0,06 0,0036 4,7 0,46 0,2116 3,4 -0,84 0,7056 5,2 0,96 0,9216 4,6 0,36 0,1296 4,3 0,06 0,0036
4,064
Standard deviation = 67,09064,4
= 6
Copyright reserved
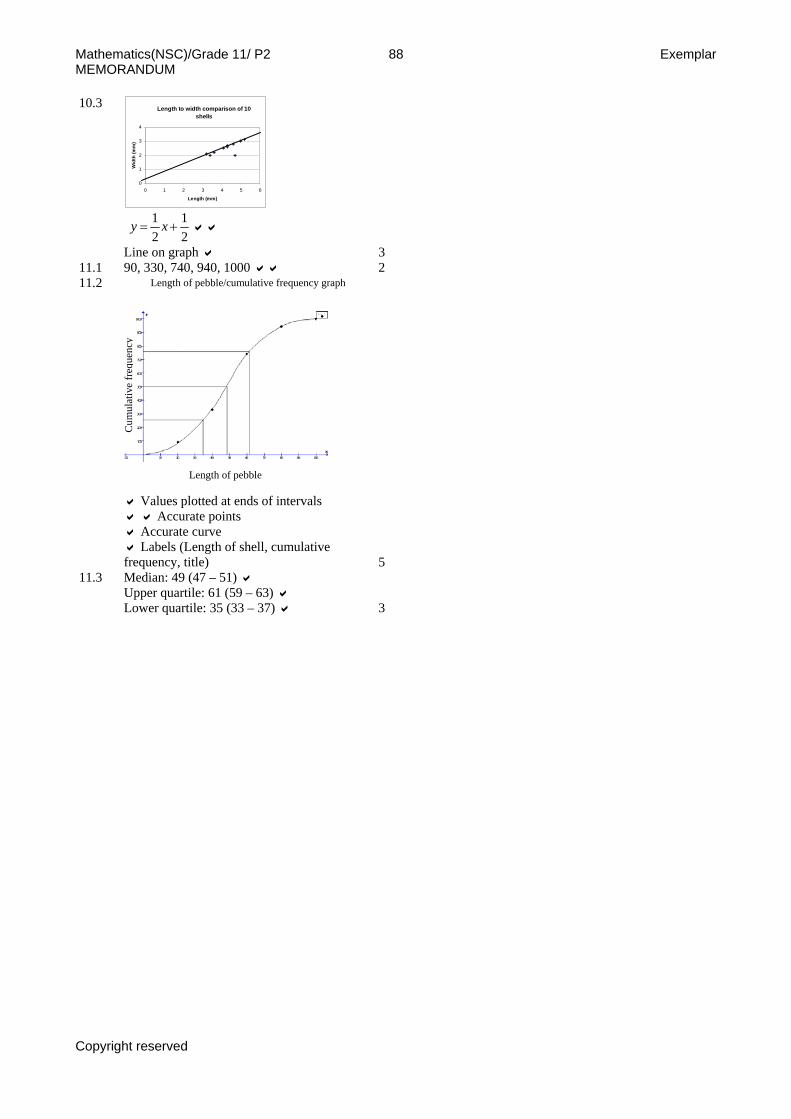
Mathematics(NSC)/Grade 11/ P2 88 Exemplar MEMORANDUM
10.3 Length to width comparison of 10 shells
0
1
2
3
4
0 1 2 3 4 5 6
Length (mm)
Wid
th (m
m)
21
21
+= xy
Line on graph 311.1 90, 330, 740, 940, 1000 211.2
Values plotted at ends of intervals Accurate points Accurate curve Labels (Length of shell, cumulative
frequency, title)
Cum
ulat
ive
freq
uenc
y
Length of pebble/cumulative frequency graph
Length of pebble
511.3 Median: 49 (47 – 51)
Upper quartile: 61 (59 – 63) Lower quartile: 35 (33 – 37) 3
Copyright reserved
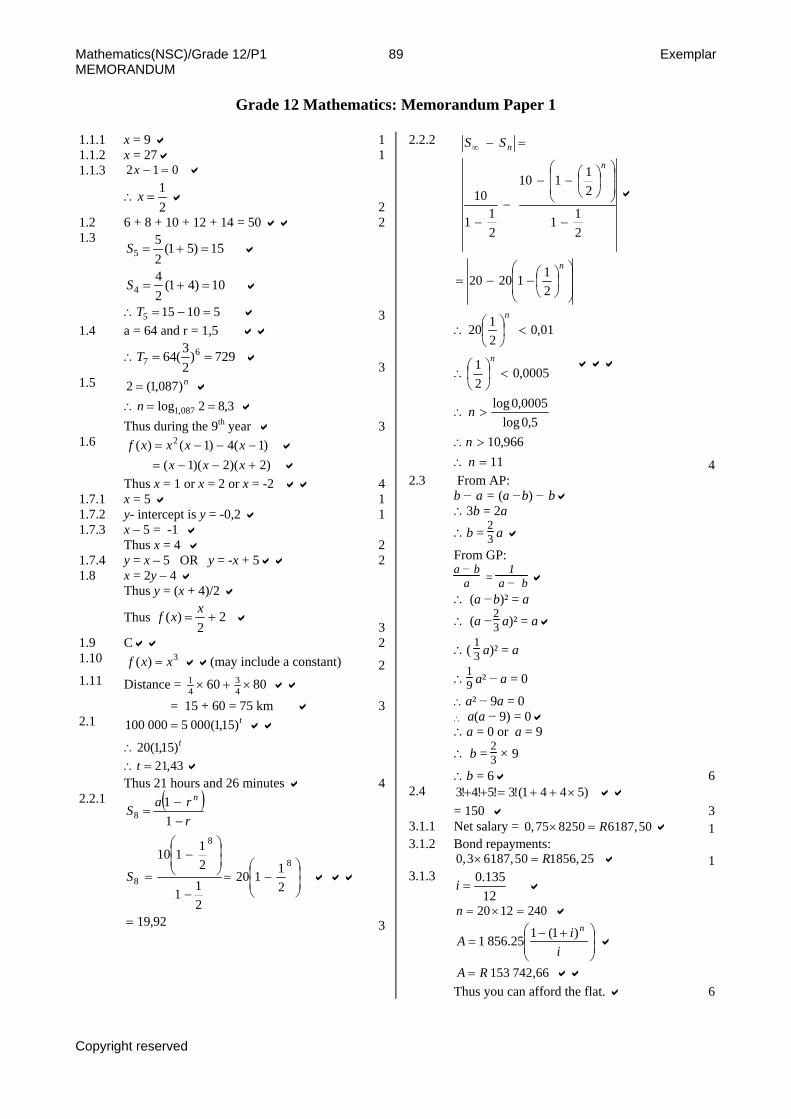
Mathematics(NSC)/Grade 12/P1 89 Exemplar MEMORANDUM
Grade 12 Mathematics: Memorandum Paper 1
1.1.1 x = 9 11.1.2 x = 27 11.1.3 012 =−x
21
=∴x 2
1.2 6 + 8 + 10 + 12 + 14 = 50 21.3
15)51(25
5 =+=S
10)41(24
4 =+=S
510155 =−=∴T 31.4 a = 64 and r = 1,5
729)23(64 6
7 ==∴T 3
1.5 n)087,1(2 = 3,82log 087,1 ==∴n
Thus during the 9th year 31.6 )1(4)1()( 2 −−−= xxxxf
)2)(2)(1( +−−= xxx Thus x = 1 or x = 2 or x = -2 4
1.7.1 x = 5 11.7.2 y- intercept is y = -0,2 11.7.3 x – 5 = -1
Thus x = 4 21.7.4 y = x – 5 OR y = -x + 5 21.8 x = 2y – 4
Thus y = (x + 4)/2
Thus 22
)( +=xxf
31.9 C 21.10 3)( xxf = (may include a constant) 21.11 Distance = 8060 4
341 ×+×
= 15 + 60 = 75 km 32.1 t)15,1(0005000100 =
t)15,1(20∴ 43,21=∴ t
Thus 21 hours and 26 minutes 42.2.1 ( )
92,19
21120
211
21110
11
8
8
8
8
=
⎟⎟⎠
⎞⎜⎜⎝
⎛−=
−
⎟⎟⎠
⎞⎜⎜⎝
⎛−
=
−−
=
S
rra
Sn
3
2.2.2
211
21110
211
10
−
⎟⎟
⎠
⎞
⎜⎜
⎝
⎛⎟⎠⎞
⎜⎝⎛−−
−−
=−∞
n
nSS
11966,10
5,0log0005,0log
0005,021
01,02120
2112020
=∴>∴
>∴
<⎟⎠⎞
⎜⎝⎛∴
<⎟⎠⎞
⎜⎝⎛∴
⎟⎟
⎠
⎞
⎜⎜
⎝
⎛⎟⎠⎞
⎜⎝⎛−−=
nn
n
n
n
n
42.3 From AP:
b − a = (a −b) − b ∴3b = 2a ∴b = 23 a
From GP: a − b
a = 1
a − b
∴ (a −b)² = a ∴ (a −2
3 a)² = a
∴( 13 a)² = a
∴19 a² − a = 0
∴ a² − 9a = 0 ∴ a(a − 9) = 0 ∴a = 0 or a = 9 ∴ b = 23 × 9
∴b = 6 62.4 )5441(!3!5!4!3 ×++=++
= 150 33.1.1 Net salary = 0,75 8250 6187,50R× = 13.1.2 Bond repayments:
0,3 6187,50 1856, 25R× = 13.1.3
12135.0
=i
2401220 =×=n
⎟⎟⎠
⎞⎜⎜⎝
⎛ +−=
iiA
n)1(125.8561
66,742153RA = Thus you can afford the flat. 6
Copyright reserved
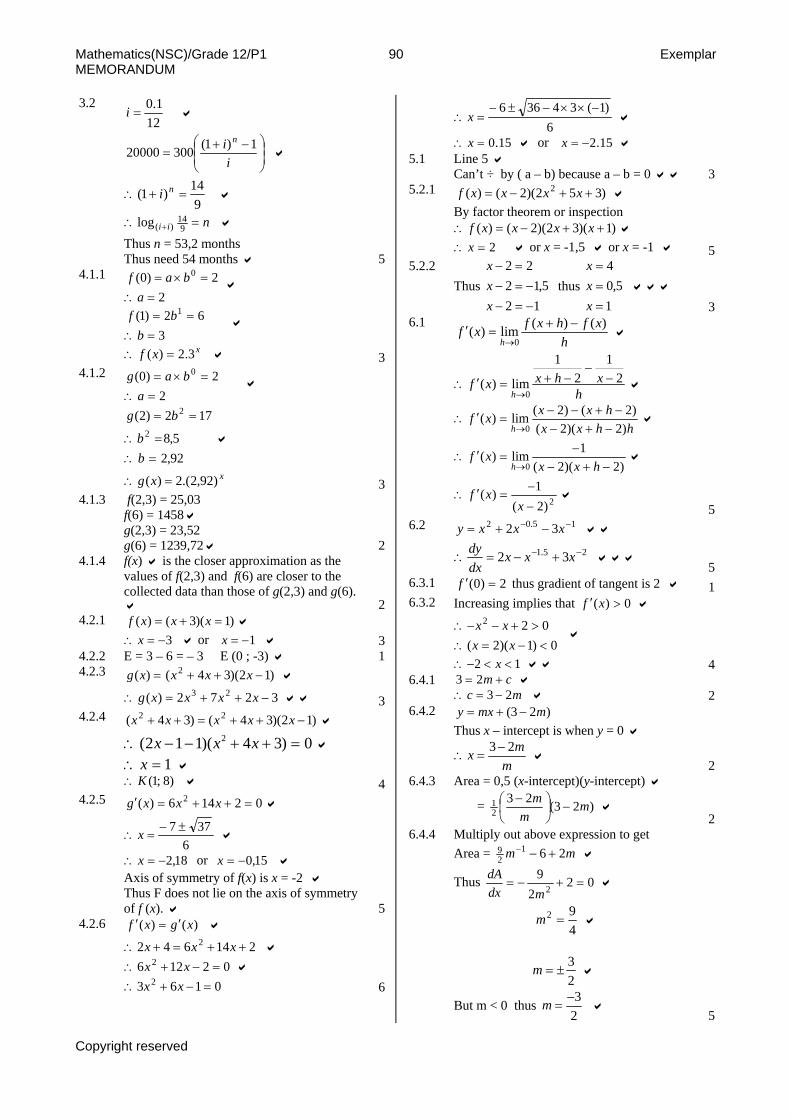
Mathematics(NSC)/Grade 12/P1 90 Exemplar MEMORANDUM
3.2 12
1.0=i
⎟⎟⎠
⎞⎜⎜⎝
⎛ −+=
ii n 1)1(30020000
914)1( =+∴ ni
nii =∴ + 914
)(log Thus n = 53,2 months Thus need 54 months 5
4.1.1
22)0( 0
=∴=×=
abaf
362)1( 1
=∴==
bbf
xxf 3.2)( =∴ 34.1.2
22)0( 0
=∴=×=
abag
92,25,8
172)2(2
2
=∴=∴
==
bb
bg
xxg )92,2.(2)( =∴ 34.1.3 f(2,3) = 25,03
f(6) = 1458 g(2,3) = 23,52 g(6) = 1239,72 2
4.1.4 f(x) is the closer approximation as the values of f(2,3) and f(6) are closer to the collected data than those of g(2,3) and g(6).
24.2.1 )1)(3()( =+= xxxf
3−=∴ x or 1−=x 34.2.2 E = 3 – 6 = – 3 E (0 ; -3) 14.2.3 =)(xg )12)(34( 2 −++ xxx
3272)( 23 −++=∴ xxxxg 34.2.4 )12)(34()34( 22 −++=++ xxxxx
0)34)(112( 2 =++−−∴ xxx 1=∴ x )8;1(K∴ 4
4.2.5 02146)( 2 =++=′ xxxg
6377 ±−
=∴ x
18,2−=∴ x or 15,0−=x Axis of symmetry of f(x) is x = -2 Thus F does not lie on the axis of symmetry of f (x). 5
4.2.6 )()( xgxf ′=′
214642 2 ++=+∴ xxx 02126 2 =−+∴ xx
0163 2 =−+∴ xx 6
6)1(34366 −××−±−
=∴ x
15.0=∴ x or 15.2−=x5.1 Line 5
Can’t ÷ by ( a – b) because a – b = 0 35.2.1 )352)(2()( 2 ++−= xxxxf
By factor theorem or inspection )1)(32)(2()( ++−=∴ xxxxf
2=∴ x or x = -1,5 or x = -1 55.2.2
Thus 12
5,1222
−=−−=−
=−
xxx
thus 1
5,04
===
xxx
36.1
hxfhxfxf
h
)()(lim)(0
−+=′
→
hxhxxf
h2
12
1
lim)(0
−−
−+=′∴→
hhxxhxxxf
h )2)(2()2()2(lim)(
0 −+−−+−−
=′∴→
)2)(2(1lim)(
0 −+−−
=′∴→ hxx
xfh
2)2(1)(
−
−=′∴
xxf
56.2 15.02 32 −− −+= xxxy
25.1 32 −− +−=∴ xxxdxdy
56.3.1 2)0( =′f thus gradient of tangent is 2 16.3.2 Increasing implies that 0)( >′ xf
0)1)(2(022
<−=∴>+−−∴
xxxx
12 <<−∴ x 46.4.1 cm += 23
mc 23 −=∴ 26.4.2 )23( mmxy −+=
Thus x – intercept is when y = 0
mmx 23−
=∴ 2
6.4.3 Area = 0,5 (x-intercept)(y-intercept)
= )23(2321 m
mm
−⎟⎠⎞
⎜⎝⎛ −
26.4.4 Multiply out above expression to get
Area = mm 26129 +−−
Thus 022
92 =+−=
mdxdA
492 =m
23
±=m
But m < 0 thus 23−
=m 5
Copyright reserved

Mathematics(NSC)/Grade 12/P1 91 Exemplar MEMORANDUM
7.1 Twice as much labour as bootleg, thus 500 ÷ 2 = 250 straight leg jeans. 1
7.2
150≤x 250≤y
5002 ≤+ yx Correct feasible region 5
7.3 yxP 58 += Point A (125; 250) and B(150 ; 200) By substituting points into profit function get maximum profit at A = R 2 250 5
7.4 yxP 511 += Thus to maximize profit now use point B (by substitution) Thus 150 straight leg and 200 bootleg 2
20 40 60 80 100 120 140 160 180 200 220 240 260 280 300
100 200 300 400 500
x
y
Feasible region is not shaded A
B
Copyright reserved
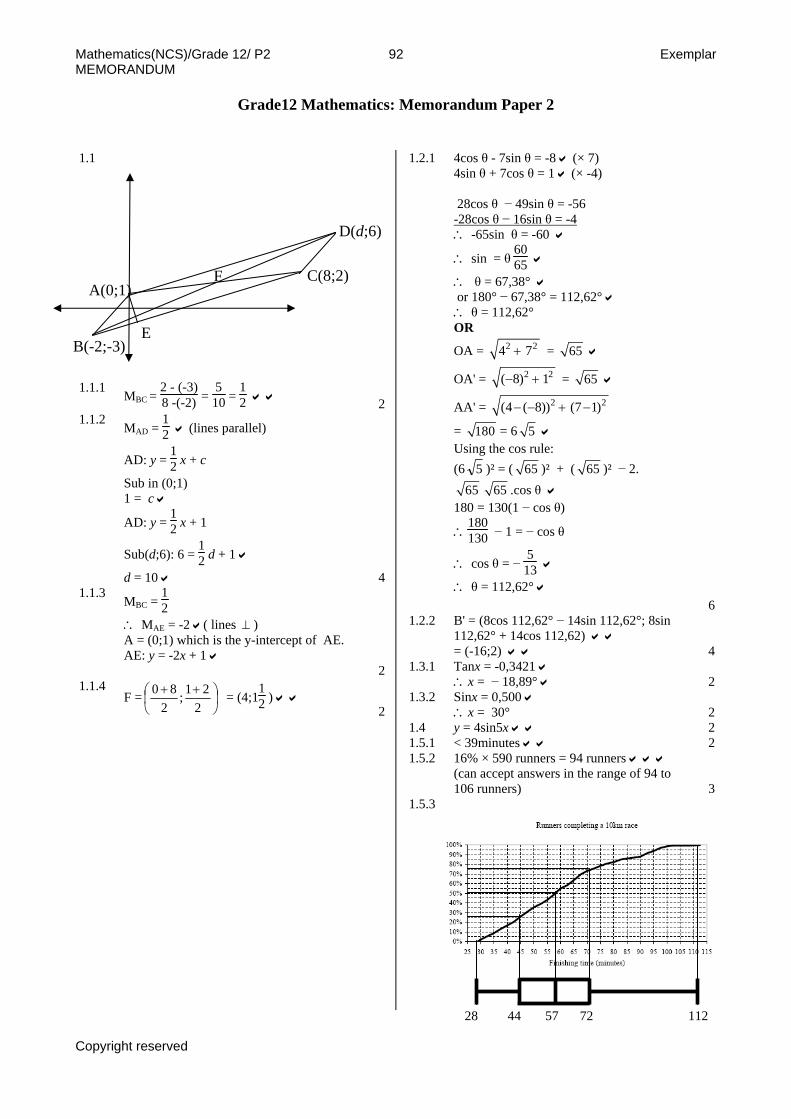
Mathematics(NCS)/Grade 12/ P2 92 Exemplar MEMORANDUM
Grade12 Mathematics: Memorandum Paper 2
1.1
1.1.1 MBC = 2 - (-3)8 -(-2) =
510 =
12 2
1.1.2 MAD = 12 (lines parallel)
AD: y = 12 x + c
Sub in (0;1) 1 = c
AD: y = 12 x + 1
Sub(d;6): 6 = 12 d + 1
d = 10 41.1.3 MBC =
12
∴ MAE = -2 ( lines ⊥ ) A = (0;1) which is the y-intercept of AE. AE: y = -2x + 1 2
1.1.4 F = ⎟
⎠⎞
⎜⎝⎛ ++
221;
280 = (4;1
12 )
2
1.2.1 4cos θ - 7sin θ = -8 (× 7) 4sin θ + 7cos θ = 1 (× -4) 28cos θ − 49sin θ = -56 -28cos θ − 16sin θ = -4
D(d;6) ∴ -65sin θ = -60
∴ sin = θ 6065
∴ θ = 67,38° or 180° − 67,38° = 112,62° ∴ θ = 112,62° OR
OA = 2 24 7+ = 65
OA' = 2 2( 8) 1− + = 65
AA' = 2 2(4 ( 8)) (7 1)− − + −
= 180 = 6 5 Using the cos rule: (6 5 )² = ( 65 )² + ( 65 )² − 2.
65 65 .cos θ 180 = 130(1 − cos θ)
∴180130 − 1 = − cos θ
∴ cos θ = − 5
13
∴ θ = 112,62°
C(8;2)
6
1.2.2 B' = (8cos 112,62° − 14sin 112,62°; 8sin 112,62° + 14cos 112,62) = (-16;2) 4
1.3.1 Tanx = -0,3421 ∴x = − 18,89° 2
1.3.2 Sinx = 0,500 ∴x = 30° 2
1.4 y = 4sin5x 21.5.1 < 39minutes 21.5.2 16% × 590 runners = 94 runners
(can accept answers in the range of 94 to 106 runners) 3
1.5.3
A(0;1)
B(-2;-3)
F
E
28 44 57 72 112
Copyright reserved
Mathematics(NCS)/Grade 12/ P2 93 Exemplar MEMORANDUM
Appropriate scale Correct drawing Correct min and max values for the range Correct values for the median etc The values can be out by 1unit on either side. 5
2.1.1 Let the centre = (a; b) a = 2 ( ) ( ) 2222 rbyx =−+− Sub in (2;0) ( ) ( ) 222 022 rb =−+−
∴ 22 rb = Sub in (4; -6) ( ) ( ) 222 624 bb =−−+−
∴4 + 36 + 12b + 22 bb =∴40 + 12b = 0
∴ b = −103
Centre = ⎟⎠⎞
⎜⎝⎛ −
310;2
( ) 43
1022
2 =⎟⎠⎞
⎜⎝⎛ ++− yx
72.1.2
mMB =( )42
6313
−
−−− = -
43
∴Mtangent = 34
Tangent: y = 34 x + c
Sub in (4;-6)
-6 = 34 (4) + c
-9 = c
Tangent: y = 43
x − 9 4
2.2.1 y = 5 − 2x ( ) ( ) 0202561225 22 =+−−−−+ xxxx
02012301242025 22 =++−−+−+ xxxxx
015205 2 =+− xx
0342 =+− xx ∴( )( 13 −− xx )= 0 ∴ 13 == xx
( )325−=y ( )125−=y∴ 31 =−= yy ∴Points of intersection are: (3;-1) and (1:3) 6
2.2.2 AB = ( ) ( )22 3113 −−+− 3
AB = 614+
AB = 20
AB = 52 2.2.3 mBC =
-1 - 33 -1 =
-42 = -2
mperp = 12
Midpoint of AB = ⎟⎠
⎞⎜⎝
⎛ −+2
13;
231 = (2;1)
Perpendicular bisector: y = 12 x + c
Sub (2;1): 1= 12 (2) + c
∴c = 0
∴ y = 12 x 5
2.2.4 The x-intercepts of the circle are found by: 020122 =+− xx
∴( )( )210 −− xx = 0 ∴x = 10 or x = 2 ∴ x = 6 is the perpendicular bisector of the x-intercepts ∴ the x value of the centre = 6 ∴ y = 3 The centre of the circle = (6;3) 6
3.1.1 (5;1) p is 1 unit from C to the line x = 4, so the point C' will be 1 unit from x = 4 on the other side i.e. 5. The y-value (q) remains the same. 3
3.1.2 (12;4) r is 3 units from C' to the line x = 9, so the point C″ will be 3 units from x = 9 on the other side i.e. 12. The y-value (s) remains the same. 3
3.1.3 A translation 10 units right. Triangle ABC has remained in the same horizontal plane but has moved 10 units along. 2
3.1.4 If point A (1;3) is reflected about the x = 9, it will become A' = (17;3). If A’ is then reflected about the x = 4 line, it will become A″ = (-9;3). This is not the same result as above. 3
3.2.1 If A = (4;3) then A' = (3;4) and A″ = (-3;4) 3
3.2.2 Rotation of 90° : A″ = (4cos 90°− 3sin 90°; 4sin 90° + 3cos 90°) A″ = (4 × 0 − 3 × 1; 4 × 1 + 3 × 0) A″ = (-3;4) 4
4.1.1
( )1cos221sin2coscos2sin
2 −+
+
θθθθθ
1cos4sin)1cos2(coscossin2
2
2
−
−+
θθθθθθ
1cos4)1cos2cos2(sin
2
22
−
−+
θθθθ
6
Copyright reserved
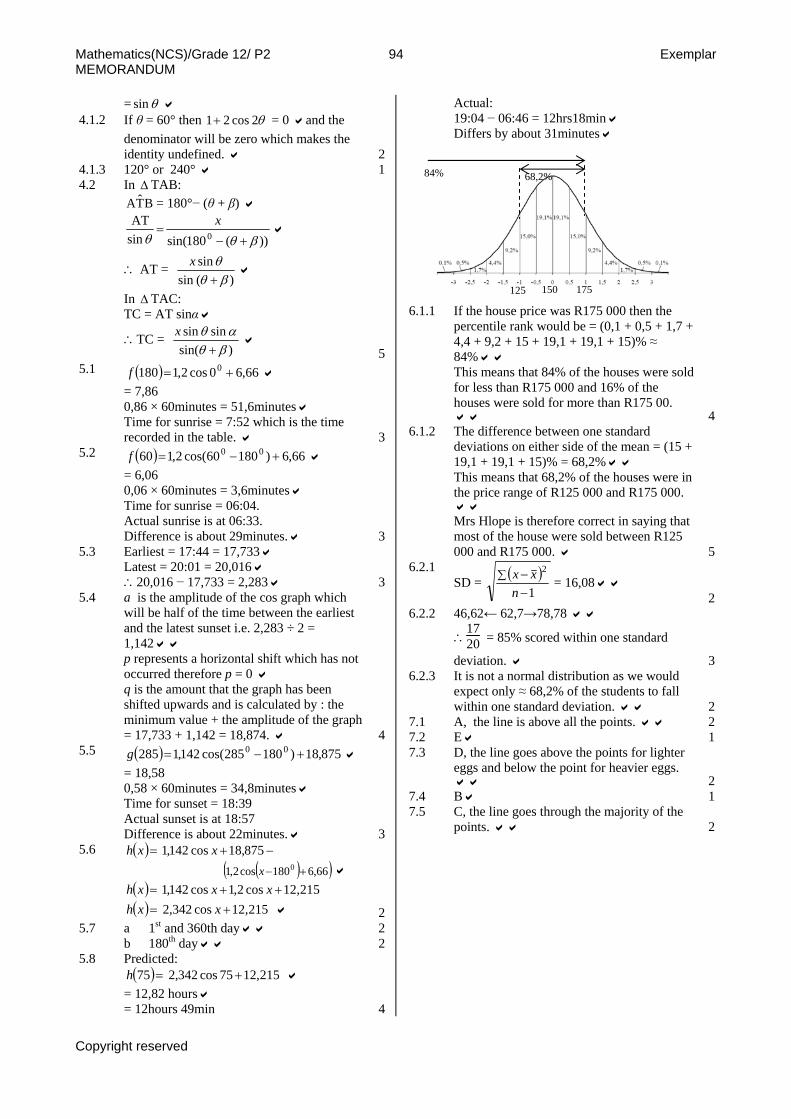
Mathematics(NCS)/Grade 12/ P2 94 Exemplar MEMORANDUM
= θsin 4.1.2 If θ = 60° then θ2cos21+ = 0 and the
denominator will be zero which makes the identity undefined. 2
4.1.3 120° or 240° 14.2 In TAB: Δ
BTA = 180°− (θ + β)
))(180sin(sinAT
0 βθθ +−=
x
∴ AT = )(sin
sinβθθ+
x
In TAC: ΔTC = AT sinα
∴TC = )sin(
sinsinβθαθ
+x
55.1 ( ) 66,60cos2,1180 0 +=f
= 7,86 0,86 × 60minutes = 51,6minutes Time for sunrise = 7:52 which is the time recorded in the table. 3
5.2 ( ) 66,6)18060cos(2,160 00 +−=f = 6,06 0,06 × 60minutes = 3,6minutes Time for sunrise = 06:04. Actual sunrise is at 06:33. Difference is about 29minutes. 3
5.3 Earliest = 17:44 = 17,733 Latest = 20:01 = 20,016 ∴20,016 − 17,733 = 2,283 3
5.4 a is the amplitude of the cos graph which will be half of the time between the earliest and the latest sunset i.e. 2,283 ÷ 2 = 1,142 p represents a horizontal shift which has not occurred therefore p = 0 q is the amount that the graph has been shifted upwards and is calculated by : the minimum value + the amplitude of the graph = 17,733 + 1,142 = 18,874. 4
5.5 ( ) 875,18)180285cos(142,1285 00 +−=g = 18,58 0,58 × 60minutes = 34,8minutes Time for sunset = 18:39 Actual sunset is at 18:57 Difference is about 22minutes. 3
5.6 ( ) −+= 875,18cos142,1 xxh ( )( )66,6180cos2,1 0 +−x ( ) 215,12cos2,1cos142,1 ++= xxxh ( ) 215,12cos342,2 += xxh 2
5.7 a 1st and 360th day 2 b 180th day 25.8 Predicted:
( ) 215,1275cos342,275 +=h = 12,82 hours = 12hours 49min 4
Actual: 19:04 − 06:46 = 12hrs18min Differs by about 31minutes
6.1.1 If the house price was R175 000 then the
percentile rank would be = (0,1 + 0,5 + 1,7 + 4,4 + 9,2 + 15 + 19,1 + 19,1 + 15)% ≈ 84% This means that 84% of the houses were sold for less than R175 000 and 16% of the houses were sold for more than R175 00.
46.1.2 The difference between one standard
deviations on either side of the mean = (15 + 19,1 + 19,1 + 15)% = 68,2% This means that 68,2% of the houses were in the price range of R125 000 and R175 000.
Mrs Hlope is therefore correct in saying that most of the house were sold between R125 000 and R175 000. 5
6.2.1 SD = ( )
1
2
−−∑
nxx = 16,08
26.2.2 46,62← 62,7→78,78
∴1720 = 85% scored within one standard
deviation. 36.2.3 It is not a normal distribution as we would
expect only ≈ 68,2% of the students to fall within one standard deviation. 2
7.1 A, the line is above all the points. 27.2 E 17.3 D, the line goes above the points for lighter
eggs and below the point for heavier eggs. 2
7.4 B 17.5 C, the line goes through the majority of the
points. 2
84% 68,2%
125 150 175
Copyright reserved
Mathematical Literacy(NSC)/Grade 10 95 Exemplar MEMORANDUM
Grade10 Mathematical Literacy: Memorandum
1.1.1 15,645 11.1.2 83 11.1.3 R281,25 21.1.4 21
4 11.2 33
13 % of R299 = R99,66
R299 − R99,66 = R199,34 OR
6623 % of R299 = R199,34 2
1.3.1 It means that to every 1 measure of concentrate, you must add 4 measures of water. 2
1.3.2 200ml of concentrate and 800ml of water 2
1.3.3 312 cups × 4 = 14 cups
My friend did not mix it in the correct ratio but added too much water so it will not taste the same. OR 15 cups ÷ 4 = 31
4 cups My friend did not have enough concentrate in the mixture to make it taste the same. 3
1.4.1 R55 + 5 × R10 = R105 21.4.2 R55 + 7 × R10 = R135 21.4.3 R55 + n × R10 = R55 + R10n 21.5.1 5,5% of R4 575 = R251,63
R4 575 + R251,63 = R4 826,63 OR 105,5% of R4 575 = R4 826,63 2
1.5.2 Ali 11.5.3 Ali’s % increase = R292.50
R6 500 × 100 = 4,5%
Fatimah gets the bigger percentage increase. 2
1.6 Daily wage: R1 72515 days = R115 per day
Earnings for 20 days: 20 × R115 = R2 300 31.7 1cm = 50 000cm
3,7cm = 185 000cm There are 100cm in 1m and 1 000m in 1km ∴1km = 100 000cm ∴185 000cm ÷ 100 000 = 1,85km 4
1.8.1 x = (R49,50 + R172,00 + R185,50 + R113,50 + R139 00 + R405,00 + R54,50) ÷ 7 = R1 119 ÷ 7 = R159,86 3
1.8.2 R49,50; R54,50; R113,50; R139 00; R172,00; R185,50; R405,00 Median = R139,00 2
1.9.1 Area of rectangle: 9cm × 4,5cm = 40,5cm² 2
1.9.2 Circumference of the circle: C = 3,14 × 4,5cm = 14,13cm 2
1.9.3 Volume of box: 6cm × 1,5cm × 2,5cm = 22,5cm³ 2
1.9.4 Surface area of box: 2 × 1,5cm × 2,5cm + 2 × 6cm × 2,5cm + 2 × 1,5cm × 6cm = 55,5cm² 4
2.1 Interest is the fee paid by a borrower to a lender for the use of borrowed money
32.2.1 Interest is calculated based on the new
balance – in other words interest has been paid on interest 2
2.2.2 (a) = R1 762,34 (b) = R211,48 (c) = R1 973,82 6
2.2.3 R1 973,82 − R1 000 = R973,82 2.2.4 R973.82
R1 000 × 100 = 97,38% 2.2.5 6 × 12% = 72% ⇒ R720,00 33.1 12 ÷ (12 + 12) =
12 or 0,5 3
3.2 8 ÷ (8 + 12) = 0,4 0,4 of 60 drops = 24 drops 5
3.3 4 ÷ 60 = 0,0667 ∴a ÷ (a + 12) = 0,0667 ∴a = 0,0667 × (a + 12) ∴a = 0,0667 a + 0,799 ∴a − 0,0667 a = 0,799 ∴0,933 a = 0,799 ∴ a = 0,856 The child is approximately one year old. 6
4.1 Female ticked Age: 13-14 ticked A lot ticked 3
4.2.1 35 males and 60 females 24.2.2 Total number of students taking part in
survey = 95 Number of students felt a lot or an unbearable amount of pressure = 44 The counselor could have argued that 4495 ≈
40100 ≈ 2 out of every 5. 4
4.2.3 % of boys feeling pressured : 1435 as a percentage = 40% % of girls feeling pressured : 3060 as a percentage = 50% The data seems to show that girls feel the pressure more than boys. 5
4.2.4 (a) It creates the impression that there were a lot more girls participating in the survey than there were boys. 2
Copyright reserved
Mathematical Literacy(NSC)/Grade 10 96 Exemplar MEMORANDUM
(b) No. The actual ratio of boys to girls is 63:36 ≈ 2:1 and the graph creates the impression that the ratio is ≈ 5:1 (Length of female bar: length of male bar) 3
(c) The counselor has not started the x-axis at zero. This tends to emphasise the difference between the boys and girls. 2
4.2.5 (a) a = 36 = 50% b = 100% − 50% 3
(b) “Older girls are more likely to experience a lot or an unbearable amount of pressure than younger girls” 60% of older girls experience a lot or an unbearable amount of pressure compared to 29% of younger girls. 4
(c) A double bar graph. It would be easy to compare both age groups to each other and the two categories within the age groups. 4
5.1.1 17 15.1.2 Wednesday 25.1.3 14:45 − 11:45 = 3 hours 35.1.4 17:00 − 14:45 = 2 hours 15 minutes 35.1.5 The movie will take at least 2 hours and 15
minutes. Therefore the movie will end at 22:15 plus 2 hours and 15 minutes which means it will end at half past twelve or 00:30 4
5.2.1 20 seats 15.2.2 (a)R30,00
(b) R25,00 (c) R45,00 3
5.2.3 H8 and H9 25.2.4 L7 25.2.5 Category 1 tickets are the least expensive
tickets. This seat is close to the screen but is off to the side of the room which
means you do not get as good a view as you would if you were further back from the screen and in the centre of the room.
Therefore it should be in the least expensive category. 5
6.1 If you print 1 000 brochures it will cost you R5 per brochure 2
6.2 1 000 × R5 = R5 000 3
6.3 2 500 × cost = R5 000 cost = R5 000 ÷ 2 500 cost = R2,00 3
6.4 Number of brochures × R20 = R5 000 Number of brochures = R5 000 ÷ R20 Number of brochures = 250 3
6.5 Decreases. 1
Copyright reserved
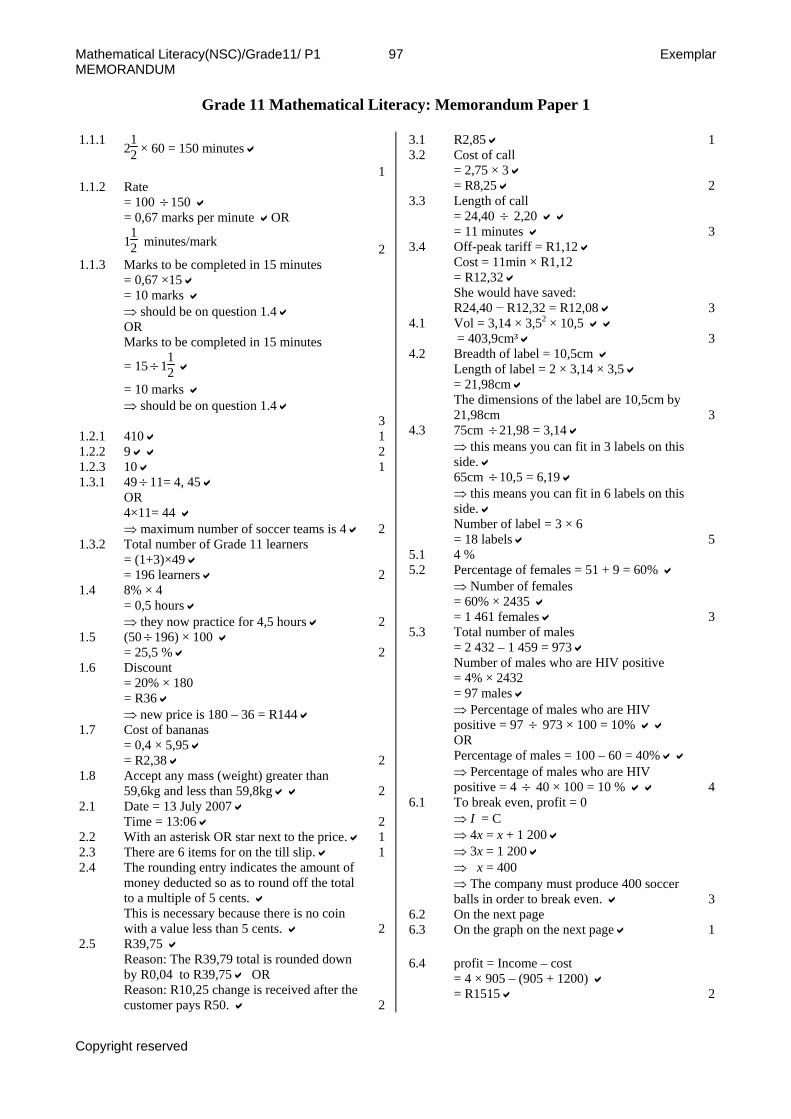
Mathematical Literacy(NSC)/Grade11/ P1 97 Exemplar MEMORANDUM
Grade 11 Mathematical Literacy: Memorandum Paper 1
1.1.1 212 × 60 = 150 minutes
11.1.2 Rate
= 100 150 ÷= 0,67 marks per minute OR
112 minutes/mark 2
1.1.3 Marks to be completed in 15 minutes = 0,67 ×15 = 10 marks ⇒ should be on question 1.4 OR Marks to be completed in 15 minutes
= 15÷ 112
= 10 marks ⇒ should be on question 1.4 3
1.2.1 410 11.2.2 9 21.2.3 10 11.3.1 49÷ 11= 4, 45
OR 4×11= 44 ⇒ maximum number of soccer teams is 4 2
1.3.2 Total number of Grade 11 learners = (1+3)×49 = 196 learners 2
1.4 8% × 4 = 0,5 hours ⇒ they now practice for 4,5 hours 2
1.5 (50 196) × 100 ÷= 25,5 % 2
1.6 Discount = 20% × 180 = R36 ⇒ new price is 180 – 36 = R144
1.7 Cost of bananas = 0,4 × 5,95 = R2,38 2
1.8 Accept any mass (weight) greater than 59,6kg and less than 59,8kg 2
2.1 Date = 13 July 2007 Time = 13:06 2
2.2 With an asterisk OR star next to the price. 12.3 There are 6 items for on the till slip. 12.4 The rounding entry indicates the amount of
money deducted so as to round off the total to a multiple of 5 cents. This is necessary because there is no coin with a value less than 5 cents. 2
2.5 R39,75 Reason: The R39,79 total is rounded down by R0,04 to R39,75 OR Reason: R10,25 change is received after the customer pays R50. 2
3.1 R2,85 13.2 Cost of call
= 2,75 × 3 = R8,25 2
3.3 Length of call = 24,40 ÷ 2,20 = 11 minutes 3
3.4 Off-peak tariff = R1,12 Cost = 11min × R1,12 = R12,32 She would have saved: R24,40 − R12,32 = R12,08 3
4.1 Vol = 3,14 × 3,52 × 10,5 = 403,9cm³ 3
4.2 Breadth of label = 10,5cm Length of label = 2 × 3,14 × 3,5 = 21,98cm The dimensions of the label are 10,5cm by 21,98cm 3
4.3 75cm ÷ 21,98 = 3,14 ⇒ this means you can fit in 3 labels on this side. 65cm ÷10,5 = 6,19 ⇒ this means you can fit in 6 labels on this side. Number of label = 3 × 6 = 18 labels 5
5.1 4 % 5.2 Percentage of females = 51 + 9 = 60%
⇒ Number of females = 60% × 2435 = 1 461 females 3
5.3 Total number of males = 2 432 – 1 459 = 973 Number of males who are HIV positive = 4% × 2432 = 97 males ⇒ Percentage of males who are HIV positive = 97 ÷ 973 × 100 = 10% OR Percentage of males = 100 – 60 = 40% ⇒ Percentage of males who are HIV positive = 4 ÷ 40 × 100 = 10 % 4
6.1 To break even, profit = 0 ⇒ I = C ⇒ 4x = x + 1 200 ⇒ 3x = 1 200 ⇒ x = 400 ⇒ The company must produce 400 soccer balls in order to break even. 3
6.2 On the next page 6.3 On the graph on the next page 1 6.4 profit = Income – cost
= 4 × 905 – (905 + 1200) = R1515 2
Copyright reserved
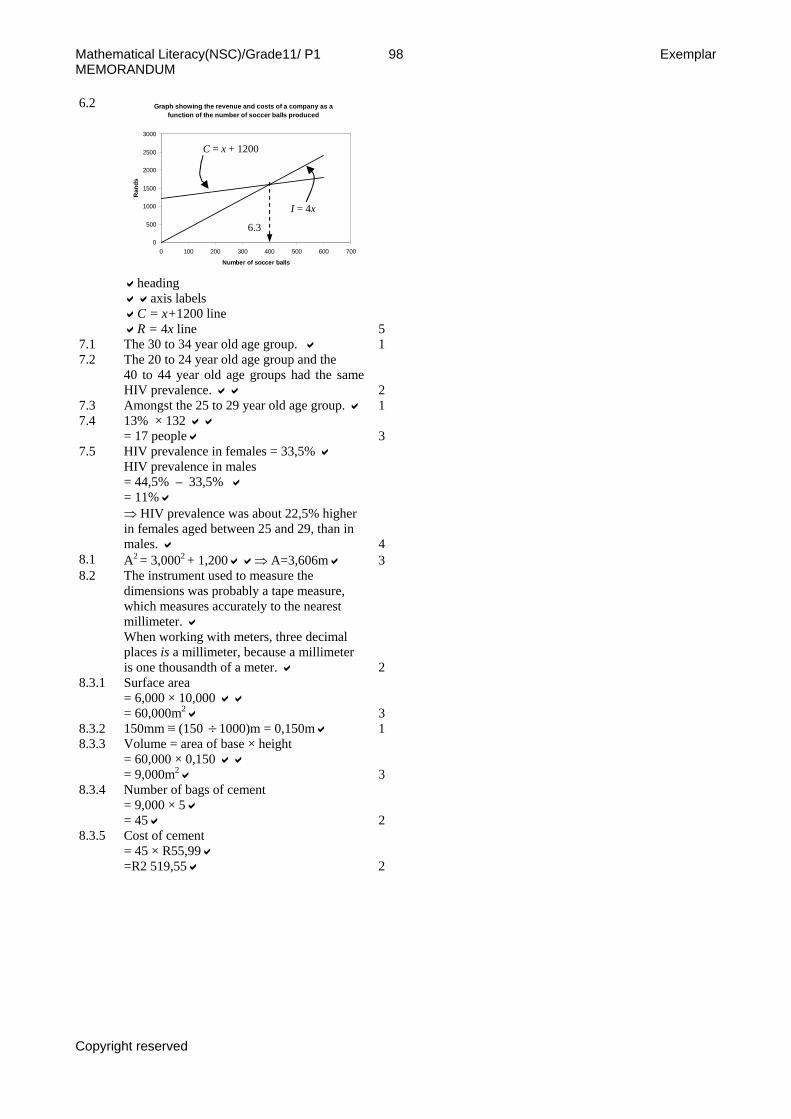
Mathematical Literacy(NSC)/Grade11/ P1 98 Exemplar MEMORANDUM
6.2 Graph showing the revenue and costs of a company as a function of the number of soccer balls produced
0
500
1000
1500
2000
2500
3000
0 100 200 300 400 500 600 700
Number of soccer balls
Ran
ds
C = x + 1200
I = 4x
6.3
heading axis labels
C = x+1200 line R = 4x line 5
7.1 The 30 to 34 year old age group. 17.2 The 20 to 24 year old age group and the
40 to 44 year old age groups had the same HIV prevalence. 2
7.3 Amongst the 25 to 29 year old age group. 17.4 13% × 132
= 17 people 37.5 HIV prevalence in females = 33,5%
HIV prevalence in males = 44,5% – 33,5% = 11% ⇒ HIV prevalence was about 22,5% higher in females aged between 25 and 29, than in males. 4
8.1 A2 = 3,0002 + 1,200 ⇒ A=3,606m 38.2 The instrument used to measure the
dimensions was probably a tape measure, which measures accurately to the nearest millimeter. When working with meters, three decimal places is a millimeter, because a millimeter is one thousandth of a meter. 2
8.3.1 Surface area = 6,000 × 10,000 = 60,000m2 3
8.3.2 150mm ≡ (150 ÷ 1000)m = 0,150m 18.3.3 Volume = area of base × height
= 60,000 × 0,150 = 9,000m2 3
8.3.4 Number of bags of cement = 9,000 × 5 = 45 2
8.3.5 Cost of cement = 45 × R55,99
2=R2 519,55
Copyright reserved
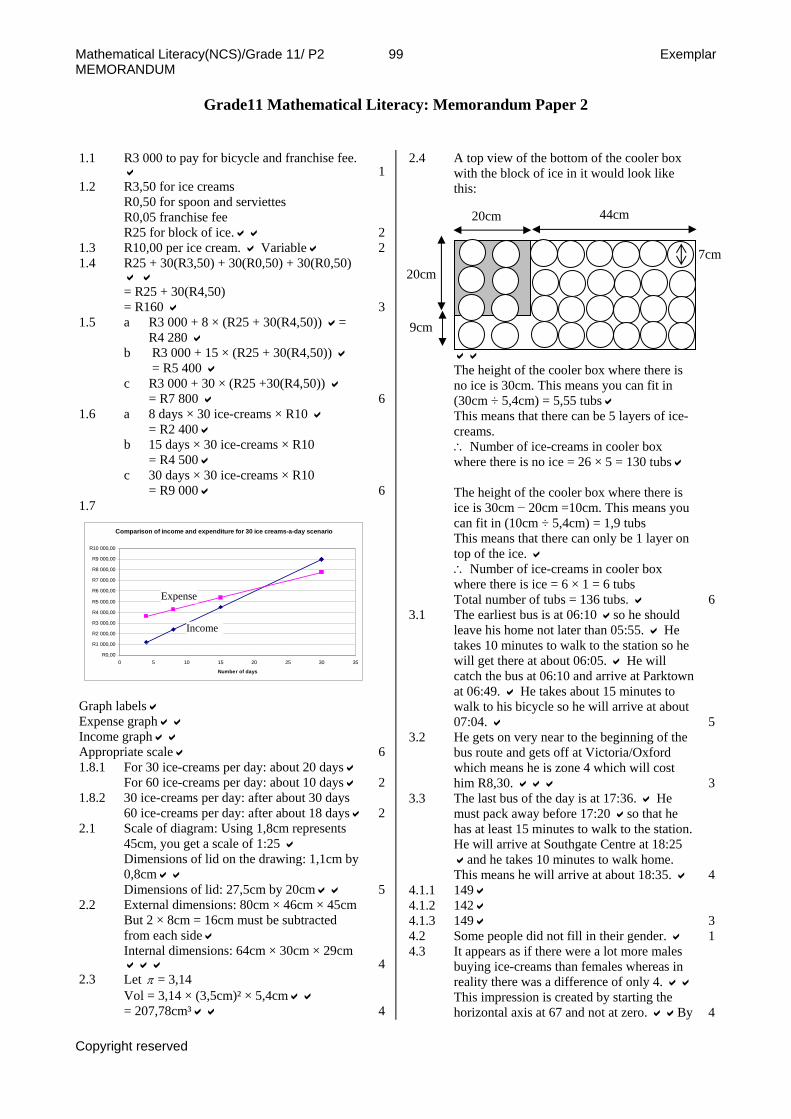
Mathematical Literacy(NCS)/Grade 11/ P2 99 Exemplar MEMORANDUM
Grade11 Mathematical Literacy: Memorandum Paper 2
1.1 R3 000 to pay for bicycle and franchise fee.
11.2 R3,50 for ice creams
R0,50 for spoon and serviettes R0,05 franchise fee R25 for block of ice. 2
1.3 R10,00 per ice cream. Variable 21.4 R25 + 30(R3,50) + 30(R0,50) + 30(R0,50)
= R25 + 30(R4,50) = R160 3
1.5 a R3 000 + 8 × (R25 + 30(R4,50)) = R4 280
b
R3 000 + 15 × (R25 + 30(R4,50)) = R5 400
c R3 000 + 30 × (R25 +30(R4,50)) = R7 800 6
1.6 a 8 days × 30 ice-creams × R10 = R2 400
b 15 days × 30 ice-creams × R10 = R4 500
c 30 days × 30 ice-creams × R10 = R9 000 6
1.7
Graph labels Expense graph Income graph Appropriate scale 61.8.1 For 30 ice-creams per day: about 20 days
For 60 ice-creams per day: about 10 days 21.8.2 30 ice-creams per day: after about 30 days
60 ice-creams per day: after about 18 days 22.1 Scale of diagram: Using 1,8cm represents
45cm, you get a scale of 1:25 Dimensions of lid on the drawing: 1,1cm by 0,8cm Dimensions of lid: 27,5cm by 20cm 5
2.2 External dimensions: 80cm × 46cm × 45cm But 2 × 8cm = 16cm must be subtracted from each side Internal dimensions: 64cm × 30cm × 29cm
42.3 Let π = 3,14
Vol = 3,14 × (3,5cm)² × 5,4cm = 207,78cm³ 4
2.4 A top view of the bottom of the cooler box with the block of ice in it would look like this:
The height of the cooler box where there is no ice is 30cm. This means you can fit in (30cm ÷ 5,4cm) = 5,55 tubs This means that there can be 5 layers of ice-creams. ∴ Number of ice-creams in cooler box where there is no ice = 26 × 5 = 130 tubs
44cm 20cm
7cm 20cm
9cm
The height of the cooler box where there is ice is 30cm − 20cm =10cm. This means you can fit in (10cm ÷ 5,4cm) = 1,9 tubs
Comparison of income and expenditure for 30 ice creams-a-day scenario
R0,00
R1 000,00
R2 000,00
R3 000,00
R4 000,00
R5 000,00
R6 000,00
R7 000,00
R8 000,00
R9 000,00
R10 000,00
0 5 10 15 20 25 30 35
Number of days
This means that there can only be 1 layer on top of the ice. ∴ Number of ice-creams in cooler box where there is ice = 6 × 1 = 6 tubs Total number of tubs = 136 tubs.
Income
Expense 63.1 The earliest bus is at 06:10 so he should
leave his home not later than 05:55. He takes 10 minutes to walk to the station so he will get there at about 06:05. He will catch the bus at 06:10 and arrive at Parktown at 06:49. He takes about 15 minutes to walk to his bicycle so he will arrive at about 07:04. 5
3.2 He gets on very near to the beginning of the bus route and gets off at Victoria/Oxford which means he is zone 4 which will cost him R8,30. 3
3.3 The last bus of the day is at 17:36. He must pack away before 17:20 so that he has at least 15 minutes to walk to the station. He will arrive at Southgate Centre at 18:25
and he takes 10 minutes to walk home. This means he will arrive at about 18:35. 4
4.1.1 149 4.1.2 142 4.1.3 149 34.2 Some people did not fill in their gender. 14.3 It appears as if there were a lot more males
buying ice-creams than females whereas in reality there was a difference of only 4. This impression is created by starting the horizontal axis at 67 and not at zero. By 4
Copyright reserved
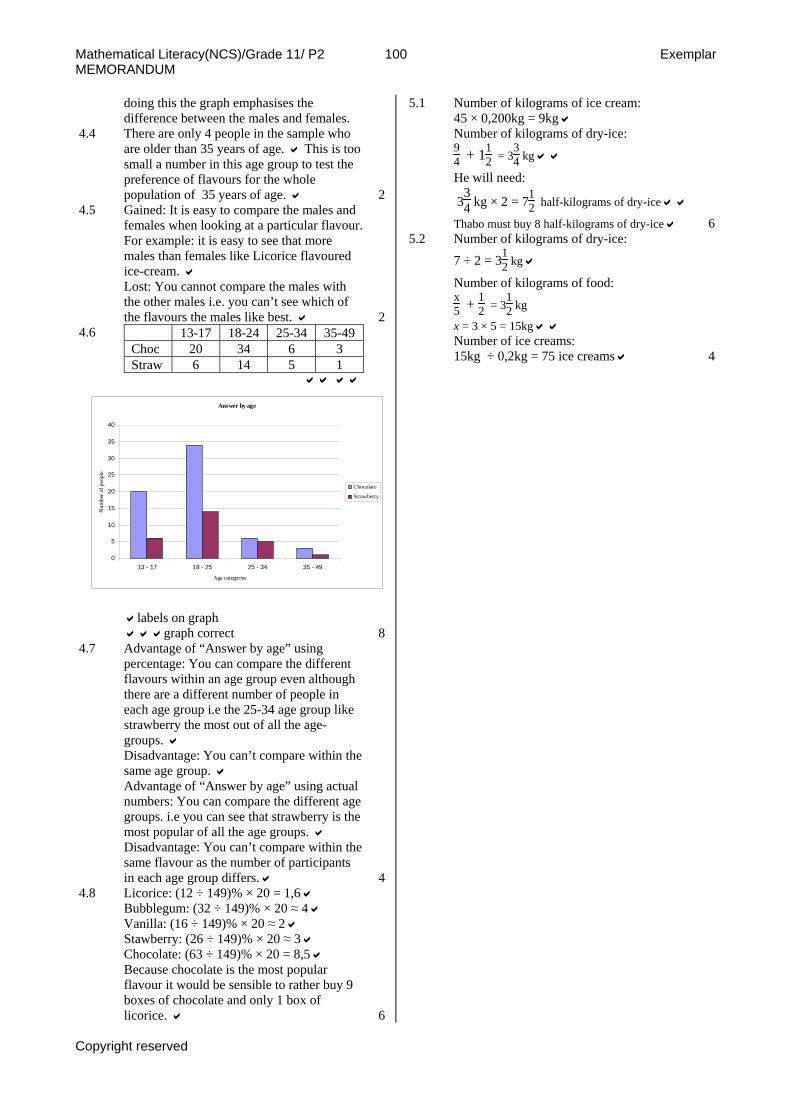
Mathematical Literacy(NCS)/Grade 11/ P2 100 Exemplar MEMORANDUM
doing this the graph emphasises the difference between the males and females.
4.4 There are only 4 people in the sample who are older than 35 years of age. This is too small a number in this age group to test the preference of flavours for the whole population of 35 years of age. 2
4.5 Gained: It is easy to compare the males and females when looking at a particular flavour. For example: it is easy to see that more males than females like Licorice flavoured ice-cream. Lost: You cannot compare the males with the other males i.e. you can’t see which of the flavours the males like best. 2
4.6
13-17 18-24 25-34 35-49 Choc 20 34 6 3 Straw 6 14 5 1
labels on graph
graph correct 84.7 Advantage of “Answer by age” using
percentage: You can compare the different flavours within an age group even although there are a different number of people in each age group i.e the 25-34 age group like strawberry the most out of all the age-groups. Disadvantage: You can’t compare within the same age group. Advantage of “Answer by age” using actual numbers: You can compare the different age groups. i.e you can see that strawberry is the most popular of all the age groups. Disadvantage: You can’t compare within the same flavour as the number of participants in each age group differs. 4
4.8 Licorice: (12 ÷ 149)% × 20 = 1,6 Bubblegum: (32 ÷ 149)% × 20 ≈ 4 Vanilla: (16 ÷ 149)% × 20 ≈ 2 Stawberry: (26 ÷ 149)% × 20 ≈ 3 Chocolate: (63 ÷ 149)% × 20 = 8,5 Because chocolate is the most popular flavour it would be sensible to rather buy 9 boxes of chocolate and only 1 box of
Number of k
licorice. 6
5.1 ilograms of ice cream:
f dry-ice: 45 × 0,200kg = 9kg Number of kilograms o94 + 11
2 = 334 kg
He will need:
334 kg × 2 = 71
2 half-kilogr
Thabo must buy 8 half-kilograms of dry-ice
ams of dry-ice
65.2 Number of kilograms of dry-ice:
7 ÷ 2 = 312 kg
Number of kilograms of food: x5 + 12 = 3
12 kg
x = 3 × 5 = 15kg s:
reams 4
Number of ice cream15kg ÷ 0,2kg = 75 ice c
Answer by age
0
5
10
15
20
25
30
35
40
13 - 17 18 - 25 25 - 34 35 - 49
Age categories
Num
ber o
f peo
ple
Chocolate
Strawberry
Copyright reserved
Mathematical Literacy(NCS)/Grade 12/P1 101 Exemplar MEMORANDUM
Grade 12 Mathematical Literacy: Memorandum Paper 1 Section A 1.1.1 306 11.1.2 72 11.1.3 R280 11.1.4 2,3 11.2.1 4m = 4000mm 11.2.2 5,34million = 5 340 000 11.2.3 500ml = 0,5l 11.3 R33,96÷12
= R2,83 21.4 100÷2 = 50 days
50÷7 = 7,142… ≈ 7 weeks 3
1.5 19:00 – 16:30 = 2h 30 m 12×2h 30 m = 30h 30×15 = R450 2
1.6 2:5 = 10:25 ∴25ml of water 2
1.7 (60÷ 100)×30 = 18 ∴18 players left 2
1.8 38,8 degrees (accuracy) 21.9 4kg = 4000g
4000g÷500g = 8 ∴8×20+15 = 175minutes = 2h 55m
3
1.10 (180÷970)×100 = 18,6% 32.1.1 R3000 and R20 000 22.1.2 100 -75
= 25% 22.1.3 (40÷100)×20 000
= R8 000 22.1.4 1. Food (55÷100)×3 000
= R1 650 2. Food (14÷100)×20 000 = R2 800 ∴ 2 spent more 5
2.2.1 R1 630÷4 = R407,50 = R400 to nearest R100 2
2.2.2 ( 9 ×4,98) + ( 7×4.70) + (2×3,98) = R85,68 4
2.2.3 A. 2×R5,90 = R11,80 per kg B.R12,99÷2,5 = R5,20 per kg C. R27÷5 = R5,40 per kg D R50 ÷10 = R5 per kg ∴D B C A 5
2.2.4 It will use up too much of her budget on one item.(or similar answer) 2
3.1.1 2600÷2÷5 = 260 people 3
3.1.2 350×260 = 91 000ml = 91liters 2
3.1.3 260÷(12×2) = 10,8 ∴ 11 crates 3
3.1.4 910÷26000×100 2
= 0,38% 3.2.1 30 games 13.2.2 + Goal Diff means more goals scored for
than against - Goal Diff means more goals scored against than for. 2
3.2.3 A. 30 – (12+4) = 14 B. (39 – 33) = +6 C. 32 – C = 4 ⇒ C = 28 D. (D–42) = –2 ⇒ D = 40 4
3.2.4 Free State Stars drew most of the games that they did not lose. Mamelodi Sundowns won most of the games they did not lose. Wins score 3 points whereas draws only score one point. Or any other valid solution. 2
3.2.5 From the table we see that a win is worth 3 point and a draw 1 point. So the final points for Thembisa Classic will be (7×3) + (9×1) = 30 points 3
4.1 Caledonian Kwikspar 14.2 17:56:00 = 5:56pm 24.3 R143,60 24.4 R143,60 +R31,84 = R175,44
(R24,56÷R175,44)×100 = 13,999 ≈ 14% 3
4.5 R143,60÷470,88unit = R0,30496 per unit = 30,50 cents per unit 3
4.6 470,88 ÷ 35 = 13,45 days approx. 13 days 3
4.7 August has 31 days 31×35 = 1085 units 1085×30,50 cents = 33092,5 cents≈ R331 R331 + R31,84 = R362,84 VAT = 14% of R362,84 = R50,80 Final total = R413,64 OR If the learner used 30 days: 30×35 = 1050 units 1050×30,50 cents = 32025cents ≈ R320 R320 +R31,84 = R351,84 VAT = 14% of R351,84 = R49,26 Final total = R401,10 6
Copyright reserved
Mathematical Literacy(NCS)/Grade 12/P1 102 Exemplar MEMORANDUM
Section B 1.1.1 24×864
= R20 736 21.1.2 60×470
= R28 200 21.13 Borrowing for a shorter time involves less
interest 21.2 R470×60 – R16 000
= R12 200 31.3 Premium = 16 × 3,95
= R63,20 Admin fee = R9,50 4
1.4.1 One year interest = (18÷100)×16 000 = R2 880 ∴5 years interest = R14 400 Total = R16 000 + R14 400 = R30 400 OR I = p×i×t = R16 000×18%×5 = R14 400 Total = R16 000 + R14 400 = R30 400
41.4.2 5
5
16 000(1 0,16)
16000(1,16)33605
A
R
= +
==
OR End of: Interest Amount 1st year R2 560 R18 560 2nd year R2 969,60 R21 529,60 3rd year R3 444,74 R24 974,34 4th year R3 995,89 R28 970,23 5th year R4 635,24 R33 605,47 5
1.5 SANLAM is the best option 12.1 445 000 people 12.2 South East Asia 12.3 41 to 356 per 100 000 22.4 Africa because it has the highest rate per
100 000 22.5 100 000÷140
≈ 714 1 in every 714 people was infected with TB in 2004 3
2.6 2 250 000 ÷ 100 000 = 22,5 22,5×41 = 922,5 anywhere between 900 and 950 people
3
2.7 8 918 000 × 10 ÷ 100 = 891 800 8 918 000 – 891 800 = 8 026 20 cases 3
3.1 6,5 × 80 = 520km 2
3.2 Need to stop twice. Possibly at Swellendam and Mossel Bay. (or similar sensible ideas) 3
3.3 520 km at 90km/h = 5,78 hours 0,78hours = 0,78× 60min = 46,8 min ≈ 45min ∴ total time = 5h 45 min + 1h 30min 5
= 7h 15 min ∴arrival time ≈ 15:15
3.4.1 60×R7 = R420 2
3.4.2 650km ÷ 60liters = 10,8km/litre 3
3.4.3 Max: R407×8 = R3 256 Std: R252 × 8 = R2 016 3
3.4.4 Any two of these answers: They get a tank of petrol worth R420. Can have an extra driver for the car. The driver can be young. There is extra damage control. 2
Copyright reserved
Mathematical Literacy(NCS)/Grade12/P2 103 Exemplar MEMORANDUM
Grade12 Mathematical Literacy: Memorandum Paper 2
1.1 R4 500 + R7 985,13 = R12 485,13 3 1.2 Monthly salary : R97 575,00 ÷ 12
= R8 131,25 UIF = 1% of R8 131,25 = R81,31 OR Yearly UIF: 1% of R97 575,00 = R975,75 Monthly UIF = R975,75 ÷ 12 = R81,31 4
1.3 Tax paid per month: R12 485,13 ÷ 12 = R1 040,43 Take home salary: = R8 131,25 − (R1 040,43 + R81,31) = R7 009,51 3 Jan 2006 Food: 26,5% × R7 009,51 = R1 858 Jan 2006 Clothing etc: 5% × R7 009,51 = R350 Jan 2006 Housing etc: 18,9% × R7 009,51 = R1 325
1.4
Jan 2006 Transport: 9,7% × R7 009,51 = R680 8
1.5 a Jan 2007 Food:
(100 + 9,3)% × R1 858 = R2 031
b Jan 2007 Clothing etc: (100 − 10,9)% × R350 = R312
c Jan 2007 Housing etc: (100 + 9,2)% × R1 325 = R1 447
d Jan 2007 Transport: (100 + 6,8)% × R680 = R726
e Total = R 7 583 10 1.6 Total expenditure for January 2007:
= R7 541
% change = 7 538 − 7 0037 003 as a %
= 7,64% 4 1.7 Gross salary after increase:
(100 + 5)% × R97 575,00 = R102 453,75 3
1.8 2007 tax: = 18 000 + 25% of (R102 453,75 − R100 000) − R7 200 = R11 413,44 per year 2007 UIF: = 1% of R102 453,75 = R1 024,54 per year
7
Take home salary: = R102 453,75 − (R11 413,44 + R1 024,54) = R90 015,78 per year = R90 015,78 ÷ 12 per month = R7 501,31
1.9 % increase in take home salary: 7 501.31−7 009.51
7 009.51 as a %
= 7,02%
% tax in 2006 = 12 485.1397 575 as a %
= 12,8%
% tax in 2007 = 11 413.44102 453.75 as a %
=11,1% Luca’s tax decreased by 1,7% from 2006 to 2007 This meant that besides the increase in gross salary of 5% she was also paying less tax in 2007. This meant that her take home salary was more than 5%. 8
1.10 Anticipated expenses = R 7 583 Luca will be earning R7 501,31 which falls short by about R50. This means that she will have to look at ways to cut down on her expenses if she does not want to overspend. 3
2.1 2005: ≈ 19% 2006: ≈ 18% 2007: ≈ 16% 2008: ≈ 15% 4
2.2 2005: ≈ R230 000 2006: ≈ R260 000 2007: ≈ R330 000 2008: ≈ R370 000 4
2.3 Effective interest rate = 10% 10% of R100 000 = R10 000 2
2.4 The effective interest rate has decreased over the period 2005 to 2008. This is seen by the graph of 2006 being below the 2005 graph. Similarly for the 2007 and 2008 graphs. It can also be seen in the answers to 2.1 and 2.2 4
3.1 This means that 75% of the class scored a lower mark than he did and 25% of the class scored a mark higher than he did.
2 3.2 Total number of participants = 20.
Each quartile has 14 of 20 = 5 participants.
∴88 falls in the fourth quartile. 2 3.3.1 75 percentile 2 3.3.2 17,2 2 3.3.3 13,2 < BMI < 19,4 4
Copyright reserved
Mathematical Literacy(NCS)/Grade12/P2 104 Exemplar MEMORANDUM
3.4.1 BMI = 301.2² = 20,8
Falls above the 95 percentile and is therefore overweight. 5
3.4.2 BMI = 20,6
20,6 = w1.65²
20,6 × 1,65² = w w = 56 kg 5
4.1.1 5 + 6 + 9 + 10 + 8 + 5 = 43% of fatalities occur between 17h00 and 22h00 4
4.1.2 There would be many more cars on the road because people would be traveling to work and school at this time of the day.
3 4.1.3 Between 17h00 and 22h00
The graph shows a peak between those times. 4
4.2.1 That data was unavailable. 2 4.2.2 (a) 9 981 in 40 400 000.
∴9 981 ÷ 4 04 = 24,71 per 100 000. (b) 10 523 in 42 640 000. ∴10 523 ÷ 4 26,4 = 24,68 per 100 000. 8
4.3.1 10 523 – 9 981 = 542 4.3.2 12 727 – 11 201 = 1 526 4 4.4.1 24,68 – 24,71 = -3,03 4.4.2 27,32 – 25,31 = 2,01 4 4.5 The Minister would use the graph of
fatalities per 100 000 as it shows a steady decline in fatalities per 100 000 from 1990 to 1998. thereafter there has been a slow rate of increase in fatalities per 100 000. It shows that even though the number of actual deaths has increased, the ratio of deaths to population size has decreased. Somebody trying to contradict the minister would use the actual fatalities graph as it shows a steady increase in fatalities since 1993. It does not however indicate how the population has increased.
6 4.6 Fatalities per 100 000. This statistic gives
you a ratio of deaths per 100 000 of the population and therefore gives you an idea of the likelihood of you dying in a car crash no matter how large or small the population is. If you are only given the actual fatalities you are unable to compare it with the population size. A large number of fatalities could be a small percentage of a very large population or it could be a big percentage of a small population. It does not give you an idea of the risk factor. 4
5.1 From Friday 18:10 to Saturday 06:40 by
train which is 1712 hours.
It takes ≈ 1 hour by taxi
∴ trip takes approximately 1812 hours. 2
5.2 R220 1 5.3 Moz Airlines: Cost R1 485 and time 1
hour SAA: Cost R1 450 and time 1 hour and 5 minutes
Bus: Cost R220 and time 1012 hours
Train and taxi: Cost R80 and time 1812
hours. The least expensive option takes the most time to get there and you travel through the night. It also means a change of transport along the way which is inconvenient. The two most expensive options (flying) take the least time to get there and is the most convenient as Luka would get a good night’s sleep at home. 6
5.4 See completed diagram below 6 5.5 Take Mozambique airlines departing at
19:10 on Friday night and arriving at 20:10. Spend Friday and Saturday night in Mozambique. (2 nights) Return by bus on Sunday departing at 19h00 and arriving at 03h55. This would maximise her time in Maputo and still have her at work on time on Monday morning. Costs = R1 485 + R220 = R1 705 which is within her budget. 9
Copyright reserved
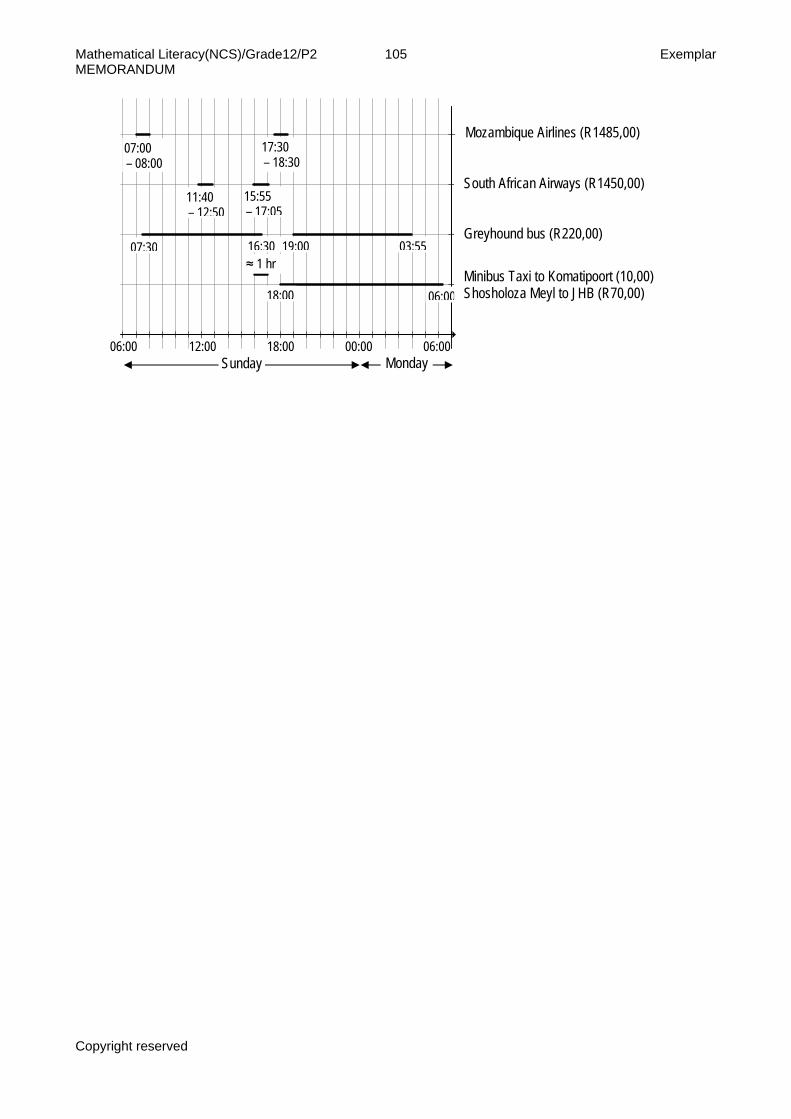
Mathematical Literacy(NCS)/Grade12/P2 105 Exemplar MEMORANDUM
06:00 12:00 18:00 00:00 06:00 Sunday Monday
18:00 06:00
Mozambique Airlines (R1485,00) 17:30 – 18:30
07:00 – 08:00
South African Airways (R1450,00) 15:55 11:40 – 17:05 – 12:50
Greyhound bus (R220,00)
≈ 1 hr 16:30 19:00 03:55 07:30
Minibus Taxi to Komatipoort (10,00) Shosholoza Meyl to JHB (R70,00)
Copyright reserved