
EXECUTIVEVIEW360 - Envisia...
60
EXECUTIVEVIEW360 ExecutiveView360 Profile for: Sally Sample Envisia Learning Feb 13 2015 © 2015 Envisia Learning, Inc.
Transcript of EXECUTIVEVIEW360 - Envisia...

EXECUTIVEVIEW360
ExecutiveView360 Profile for:Sally Sample
Envisia Learning
Feb 13 2015
© 2015 Envisia Learning, Inc.

Envisia LearningReport for Sally Sample
EXECUTIVEVIEW360Feb 13 2015 1
Summary Feedback Report
IntroductionThis Feedback Report provides you information about how you are perceived on the 22 job relevant competencies of ExecutiveView360.
This Feedback Report summarizes information from questionnaires completed by the following number and type of raters:
Self 1
Manager 1
Peer 2
Direct Report 2
Team Member 2
This Feedback Report gives you:
Competency DefinitionsSelf Awareness SummaryCompetency Group SummaryCompetency SummaryMost Frequent / Least Frequent BehaviorsBehavior SummaryOpen Ended CommentsDevelopment Planning Guide
Envisia LearningReport for Sally Sample
EXECUTIVEVIEW360Feb 13 2015 2
Competency Definitions
Performance Leadership
Visionary LeadershipDevelops a clear direction and "picture" for the future of the business. Creates a long term, big picture view of the business. Changes established thinking. Createsa climate that supports future based thinking, analysis, and decision-making.
Drive for ResultsFocuses on bottom-line results and achievement of goals. Sets and pursues aggressive business goals. Monitors and addresses team and organizationalperformance issues.
Technological LeadershipUnderstands and drives the strategy to use technological tools, instruments, and communications of the highest technological advances. Allocates financial andhuman resources to acquire and utilize the most appropriate technologies in information, communication and operational systems for competitive advantage.
Financial LeadershipUnderstands and applies key financial information in the development of strategy, allocation of resources, capital expenditures, and overall corporatedecision-making. Effectively allocates resources through the development and analysis of income and expense budgets. Able to analyze the numbers associatedwith financial statements and balance sheets.
Cross-Functional LeadershipMaximizes value by ensuring that all decisions and practices add superior value. Effectively builds cross-functional capabilities through strategic alliances.Effectively encourages cross-functional partnerships in achieving corporate goals.
Depth of Industry KnowledgeIs a consummate consumer of industry information. Frequently attends seminars, conferences, classes, and other educational opportunities to deepen industryknowledge. Teaches (shares) with others information, knowledge, and industry best practices.
Political LeadershipUnderstands the dynamics of political systems and power relationships within the organization. Strategically asserts political power and influence to achieveorganizational goals and objectives. Fosters a culture that minimizes the negative aspects of political infighting.
Strategic Problem AnalysisAnalyzes situations, identifies alternative solutions, and develops specific actions; Gathers and utilizes available information in order to understand and solveorganizational issues and problems.

Envisia LearningReport for Sally Sample
EXECUTIVEVIEW360Feb 13 2015 3
Competency Definitions Continued
Decision MakingMakes high quality decisions when required. Thinks and plans strategically.
Change Leadership
Entrepreneurial LeadershipSeeks opportunities to expand existing businesses. Take strategic risks in entering new markets, developing new products, and funding new business ventures.
Driving Strategic DirectionIdentifies and communicates achievable organizational strategies and initiatives. Identifies potential risks and opportunities to achieve business goals andobjectives.
Driving ChangeDrives innovation and change. Creates and inspires innovative ideas, technologies and processes. Values and creates opportunities for innovative thinking thatleads to the development of new products or services. Understands the need to allocate time, energy, and financial resources to creating a culture of innovation.
Interpersonal Leadership
Building Strategic RelationshipsInitiates and cultivates strategic internal and external networking relationships that foster both individual and organizational goals. Builds and maintains effectiveand collaborative relationships with diverse stakeholders.
Empowering OthersInspires extraordinary performance by fostering empowerment. Motivates others to achieve superior business performance by supporting autonomy andindependence. Supports risk taking and innovation.
Team BuildingCreates and develops motivated, cohesive, and high performance teams.
Interpersonal EffectivenessManages interpersonal relations in a cooperative, sensitive and collaborative manner. Seeks to listen and understand diverse viewpoints; Expresses sensitivityand empathy towards others.

Envisia LearningReport for Sally Sample
EXECUTIVEVIEW360Feb 13 2015 4
Competency Definitions Continued
Communication/ PresentationPresents individual and organizational viewpoints to groups in a clear and persuasive manner. Able to express written and oral thoughts in a clear and concisemanner.
Influence/NegotiationNegotiates and effectively resolves interpersonal differences with others. Utilizes appropriate interpersonal styles and approaches in facilitating a group towardstask achievement.
Coaching/Talent DevelopmentAttracts, selects, and retains talent. Effectively coaches, trains and develops others.
Personal Leadership
Self-DevelopmentManage one's own time, energy and abilities for continuous personal growth and maximum performance.
Adaptability/FlexibilityMaintains balance and performance under pressure and stress. Effectively copes with ambiguity and change in a constructive manner.
Engenders TrustActs with courage. Confronts difficult issues and takes constructive and responsible action. Acts with integrity. Displays honesty and candor.

Envisia LearningReport for Sally Sample
EXECUTIVEVIEW360Feb 13 2015 5
Competency Definitions Continued
RATING SCALE
1 To an Extremely Small Extent
2 To a Very Small Extent
3 To a Small Extent
4 To a Moderate Extent
5 To a Large Extent
6 To a Very Large Extent
7 To an Extremely Large Extent
NA Not Observable or Not Applicable

Envisia LearningReport for Sally Sample
EXECUTIVEVIEW360Feb 13 2015 6
Self-Awareness Index Introduction
INTRODUCTION
Research suggests that accurate self-awareness about one's strengths and potential areas of development is important for effective job performance andsuccess. The Self-Awareness Index provides a way for you to compare your own self-ratings to those of your raters (e.g. supervisor, direct reports,peers, etc.) on the critical competencies measured by ExecutiveView360.
The scores for all your raters have been averaged together and are compared to your own self-ratings and graphically displayed in one of the fourquadrants shown below. The Self-Awareness Index can be categorized in four distinct ways:
Potential Strengths - the competencies represented in this quadrant are those in which others rate you above average but you rate yourself belowaverage relative to the norms. Others recognize these as potential strengths, but you do notConfirmed Strengths - the competencies represented in this quadrant are those rated above average by both yourself and other rater groupsrelative to the norms. They represent confirmed strengths -- assets on which you can leverage and capitalize onPotential Development Areas - the competencies represented in this quadrant are those that were rated below average by your rater groups butyou rate yourself above average relative to the norms. You recognize these as potential strengths, but others do notConfirmed Development Areas - the competencies represented in this quadrant are those rated below average by both yourself and other ratergroups relative to the norms. They represent confirmed development areas -- opportunities to potentially focus on
High
Low
Potential Strengths Confirmed Strengths
Confirmed Development Areas Potential Development Areas
RA
TIN
GS
OTH
ER
Low HighSELF RATINGS
HOW TO USE YOUR SELF-AWARENESS INDEX
First, examine the specific competencies that fall into each of these four quadrantsNext, explore the themes of these competencies to see how they may or may not be logically related to each other. It's important to continue toleverage those competencies that are categorized as Confirmed or Potential StrengthsFinally, consider ways to enhance skills and effectiveness in those competencies categorized as Confirmed or Potential Development Areas

Envisia LearningReport for Sally Sample
EXECUTIVEVIEW360Feb 13 2015 7
Self-Awareness IndexSelf - All Raters (N = 7)
1 2 3 4 5 6 7
Low HighSelf Rating
1
2
3
4
5
6
7High
Low
All
Rat
ers
Rat
ing
Confirmed StrengthsPotential Strengths
Confirmed Development Areas Potential Development Areas
Average Scores
Self AllRaters
AB
C
D
EF GI
J
K
L
MN
O
P
Q R
S
TUV
Confirmed Development AreasA. Visionary Leadership 4.00 3.95B. Drive for Results 5.00 4.10C. Technological Leadership 4.00 3.38D. Financial Leadership 4.67 3.62E. Cross-Functional Leadership 4.00 4.19F. Depth of Industry Knowledge 3.00 4.14G. Political Leadership 3.33 4.24I. Decision Making 3.67 4.10J. Entrepreneurial Leadership 5.00 3.95K. Driving Strategic Direction 2.33 3.24L. Driving Change 3.33 3.62M. Building Strategic Relationships 4.00 4.43N. Empowering Others 3.33 4.48O. Team Building 4.33 3.71P. Interpersonal Effectiveness 3.67 4.38Q. Communication/ Presentation 2.67 3.76R. Influence/Negotiation 3.33 3.81S. Coaching/Talent Development 4.40 4.34T. Self-Development 5.00 3.95U. Adaptability/Flexibility 4.67 3.95V. Engenders Trust 3.33 3.86
H
Potential Development AreasH. Strategic Problem Analysis 6.00 4.05

Envisia LearningReport for Sally Sample
EXECUTIVEVIEW360Feb 13 2015 8
Self-Awareness IndexSelf - Manager (N = 1)
1 2 3 4 5 6 7
Low HighSelf Rating
1
2
3
4
5
6
7High
Low
Man
ager
Rat
ing
Confirmed StrengthsPotential Strengths
Confirmed Development Areas Potential Development Areas
Average Scores
Self Manager
O
Potential StrengthsO. Team Building 4.33 5.67
A
B
C DE
F
G
I
JK
L
MN
P
Q
R
S
T
U
V
Confirmed Development AreasA. Visionary Leadership 4.00 3.33B. Drive for Results 5.00 2.00C. Technological Leadership 4.00 4.00D. Financial Leadership 4.67 4.00E. Cross-Functional Leadership 4.00 4.33F. Depth of Industry Knowledge 3.00 3.67G. Political Leadership 3.33 2.67I. Decision Making 3.67 3.67J. Entrepreneurial Leadership 5.00 4.67K. Driving Strategic Direction 2.33 4.67L. Driving Change 3.33 2.67M. Building Strategic Relationships 4.00 4.33N. Empowering Others 3.33 4.33P. Interpersonal Effectiveness 3.67 5.00Q. Communication/ Presentation 2.67 2.67R. Influence/Negotiation 3.33 5.00S. Coaching/Talent Development 4.40 4.80T. Self-Development 5.00 4.33U. Adaptability/Flexibility 4.67 2.67V. Engenders Trust 3.33 3.67
H
Potential Development AreasH. Strategic Problem Analysis 6.00 3.00

Envisia LearningReport for Sally Sample
EXECUTIVEVIEW360Feb 13 2015 9
Self-Awareness IndexSelf - Peer (N = 2)
1 2 3 4 5 6 7
Low HighSelf Rating
1
2
3
4
5
6
7High
Low
Peer
Rat
ing
Confirmed StrengthsPotential Strengths
Confirmed Development Areas Potential Development Areas
Average Scores
Self Peer
A
B
C
DE
F
GI
J
K
L
M
N
O
P
Q
R
ST
U
V
Confirmed Development AreasA. Visionary Leadership 4.00 4.50B. Drive for Results 5.00 4.83C. Technological Leadership 4.00 2.50D. Financial Leadership 4.67 3.67E. Cross-Functional Leadership 4.00 3.83F. Depth of Industry Knowledge 3.00 4.17G. Political Leadership 3.33 5.00I. Decision Making 3.67 4.83J. Entrepreneurial Leadership 5.00 3.33K. Driving Strategic Direction 2.33 2.50L. Driving Change 3.33 3.33M. Building Strategic Relationships 4.00 5.00N. Empowering Others 3.33 3.67O. Team Building 4.33 3.83P. Interpersonal Effectiveness 3.67 4.50Q. Communication/ Presentation 2.67 5.00R. Influence/Negotiation 3.33 3.83S. Coaching/Talent Development 4.40 4.60T. Self-Development 5.00 4.50U. Adaptability/Flexibility 4.67 4.33V. Engenders Trust 3.33 3.67
H
Potential Development AreasH. Strategic Problem Analysis 6.00 3.50
Envisia LearningReport for Sally Sample
EXECUTIVEVIEW360Feb 13 2015 10
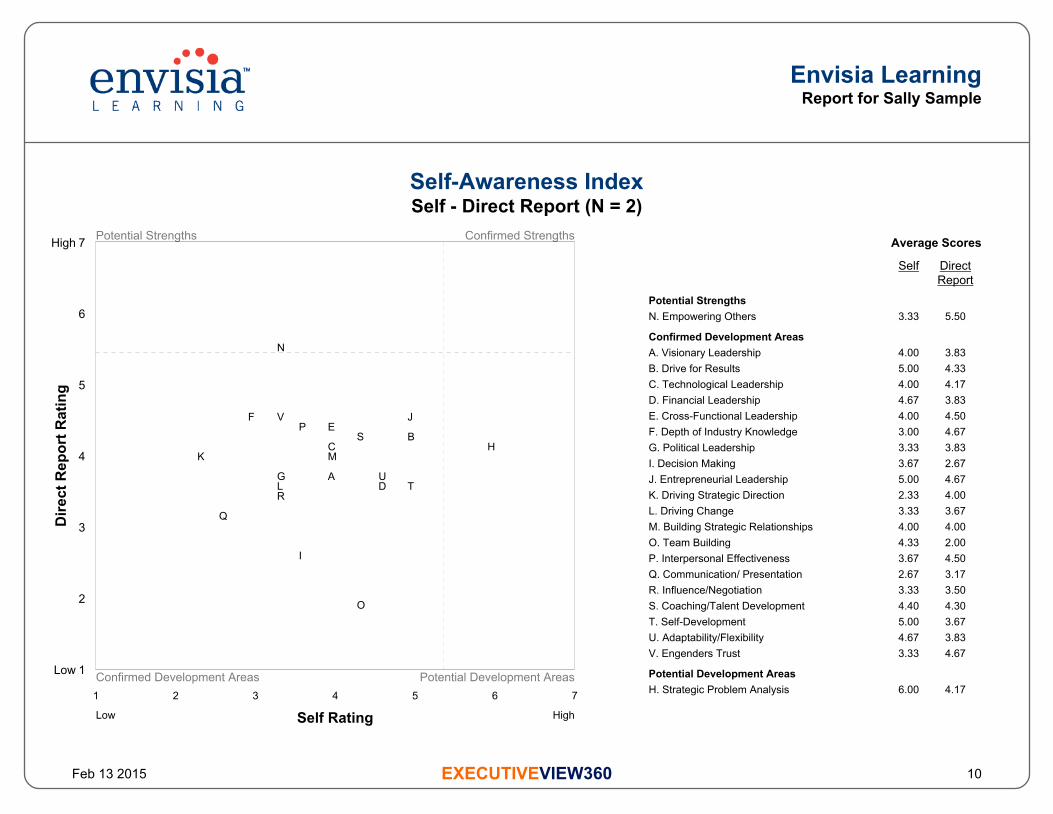
Self-Awareness IndexSelf - Direct Report (N = 2)
1 2 3 4 5 6 7
Low HighSelf Rating
1
2
3
4
5
6
7High
Low
Dire
ct R
epor
t Rat
ing
Confirmed StrengthsPotential Strengths
Confirmed Development Areas Potential Development Areas
Average Scores
Self DirectReport
N
Potential StrengthsN. Empowering Others 3.33 5.50
A
BC
D
EF
G
I
J
K
L
M
O
P
Q
R
S
TU
V
Confirmed Development AreasA. Visionary Leadership 4.00 3.83B. Drive for Results 5.00 4.33C. Technological Leadership 4.00 4.17D. Financial Leadership 4.67 3.83E. Cross-Functional Leadership 4.00 4.50F. Depth of Industry Knowledge 3.00 4.67G. Political Leadership 3.33 3.83I. Decision Making 3.67 2.67J. Entrepreneurial Leadership 5.00 4.67K. Driving Strategic Direction 2.33 4.00L. Driving Change 3.33 3.67M. Building Strategic Relationships 4.00 4.00O. Team Building 4.33 2.00P. Interpersonal Effectiveness 3.67 4.50Q. Communication/ Presentation 2.67 3.17R. Influence/Negotiation 3.33 3.50S. Coaching/Talent Development 4.40 4.30T. Self-Development 5.00 3.67U. Adaptability/Flexibility 4.67 3.83V. Engenders Trust 3.33 4.67
H
Potential Development AreasH. Strategic Problem Analysis 6.00 4.17

Envisia LearningReport for Sally Sample
EXECUTIVEVIEW360Feb 13 2015 11
Self-Awareness IndexSelf - Team Member (N = 2)
1 2 3 4 5 6 7
Low HighSelf Rating
1
2
3
4
5
6
7High
Low
Team
Mem
ber R
atin
g
Confirmed StrengthsPotential Strengths
Confirmed Development Areas Potential Development Areas
Average Scores
Self TeamMember
A
B
C D
E
F
G
I
J
K
L MN
O
PQ
R
S
T
U
V
Confirmed Development AreasA. Visionary Leadership 4.00 3.83B. Drive for Results 5.00 4.17C. Technological Leadership 4.00 3.17D. Financial Leadership 4.67 3.17E. Cross-Functional Leadership 4.00 4.17F. Depth of Industry Knowledge 3.00 3.83G. Political Leadership 3.33 4.67I. Decision Making 3.67 5.00J. Entrepreneurial Leadership 5.00 3.50K. Driving Strategic Direction 2.33 2.50L. Driving Change 3.33 4.33M. Building Strategic Relationships 4.00 4.33N. Empowering Others 3.33 4.33O. Team Building 4.33 4.33P. Interpersonal Effectiveness 3.67 3.83Q. Communication/ Presentation 2.67 3.67R. Influence/Negotiation 3.33 3.50S. Coaching/Talent Development 4.40 3.90T. Self-Development 5.00 3.50U. Adaptability/Flexibility 4.67 4.33V. Engenders Trust 3.33 3.33
H
Potential Development AreasH. Strategic Problem Analysis 6.00 5.00

Envisia LearningReport for Sally Sample
EXECUTIVEVIEW360Feb 13 2015 12
Competency Group Introduction
Competency Group Bar Graphs
Each ExecutiveView360 bar graph compares your self ratings to those of the other rater groups across 4 competency groups:
Performance LeadershipChange LeadershipInterpersonal LeadershipPersonal Leadership
How to Interpret Your Graphs
The bar graphs that follow compare your perceptions to those of other rater groups using average scores for each of the 4 ExecutiveView360 competencygroups. Each rater group category and scores will be shown separately on the graphs with the actual raw score averages and number of raters shown onthe right side. The thin line within each bar graph provides the range of scores for each rater group. The competency groups are presented in descendingorder based on the average scores of all raters.
Differences of one-half a point or more by the different rater groups might suggest important perceptual differences. Each ExecutiveView360 graph is easyto understand and interpret. You and your respondents were asked to rate the observed behaviors using the following 7-point scale:
On the bar graphs that follow, the ratings are indicated as shown below:
1 To an Extremely Small Extent2 To a Very Small Extent3 To a Small Extent4 To a Moderate Extent5 To a Large Extent6 To a Very Large Extent7 To an Extremely Large ExtentNA Not Observable or Not Applicable
Envisia LearningReport for Sally Sample
EXECUTIVEVIEW360Feb 13 2015 13
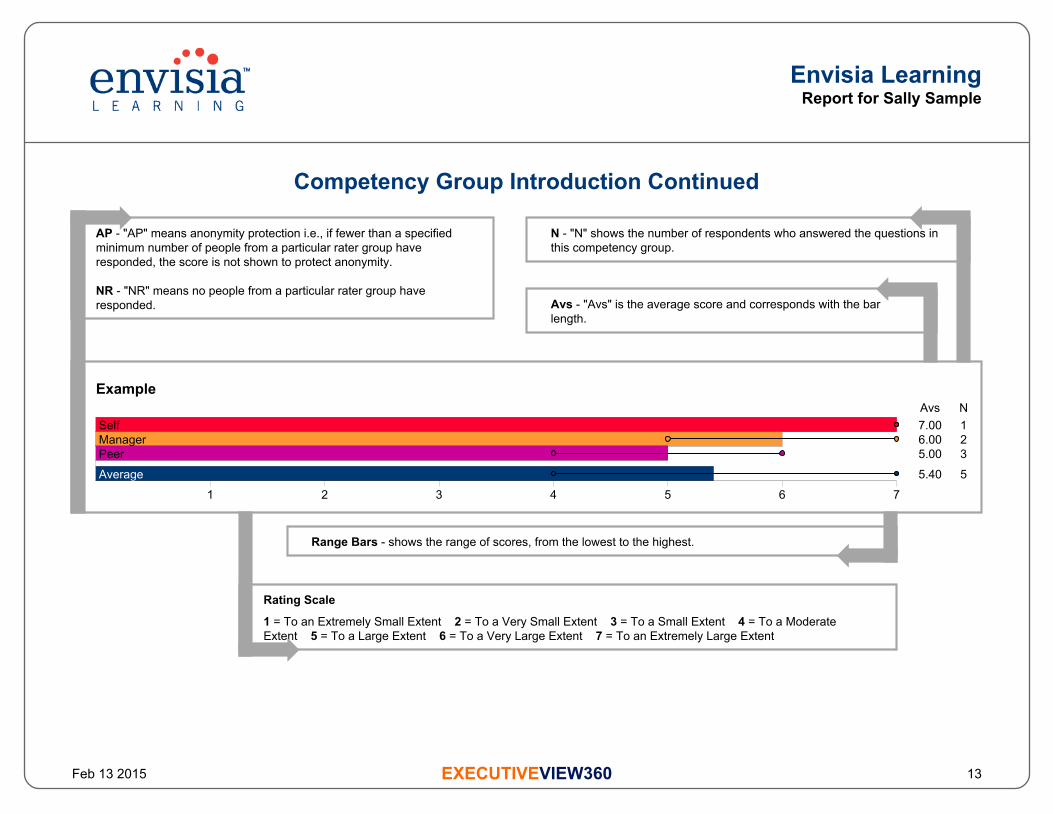
Competency Group Introduction Continued
Example Avs NSelf 7.00 1Manager 6.00 2Peer 5.00 3
Average 5.40 5
1 2 3 4 5 6 7
AP - "AP" means anonymity protection i.e., if fewer than a specifiedminimum number of people from a particular rater group haveresponded, the score is not shown to protect anonymity.
NR - "NR" means no people from a particular rater group haveresponded.
Range Bars - shows the range of scores, from the lowest to the highest.
Rating Scale
1 = To an Extremely Small Extent 2 = To a Very Small Extent 3 = To a Small Extent 4 = To a ModerateExtent 5 = To a Large Extent 6 = To a Very Large Extent 7 = To an Extremely Large Extent
Avs - "Avs" is the average score and corresponds with the barlength.
N - "N" shows the number of respondents who answered the questions inthis competency group.

Envisia LearningReport for Sally Sample
EXECUTIVEVIEW360Feb 13 2015 14
Competency Group Summary
Interpersonal Leadership Avs NSelf 3.74 1Manager 4.57 1Peer 4.37 2Direct Report 3.89 2Team Member 3.98 2
Average 4.15 7
1 2 3 4 5 6 7
Performance Leadership Avs NSelf 4.19 1Manager 3.41 1Peer 4.09 2Direct Report 4.00 2Team Member 4.11 2
Average 3.97 7
1 2 3 4 5 6 7
Personal Leadership Avs NSelf 4.33 1Manager 3.56 1Peer 4.17 2Direct Report 4.06 2Team Member 3.72 2
Average 3.92 7
1 2 3 4 5 6 7

Envisia LearningReport for Sally Sample
EXECUTIVEVIEW360Feb 13 2015 15
Competency Group Summary Continued
Change Leadership Avs NSelf 3.56 1Manager 4.00 1Peer 3.06 2Direct Report 4.11 2Team Member 3.44 2
Average 3.60 7
1 2 3 4 5 6 7

Envisia LearningReport for Sally Sample
EXECUTIVEVIEW360Feb 13 2015 16
Competency Summary
Empowering Others Avs NSelf 3.33 1Manager 4.33 1Peer 3.67 2Direct Report 5.50 2Team Member 4.33 2
Average 4.48 7
1 2 3 4 5 6 7
Building Strategic Relationships Avs NSelf 4.00 1Manager 4.33 1Peer 5.00 2Direct Report 4.00 2Team Member 4.33 2
Average 4.43 7
1 2 3 4 5 6 7
Interpersonal Effectiveness Avs NSelf 3.67 1Manager 5.00 1Peer 4.50 2Direct Report 4.50 2Team Member 3.83 2
Average 4.38 7
1 2 3 4 5 6 7
Envisia LearningReport for Sally Sample
EXECUTIVEVIEW360Feb 13 2015 17
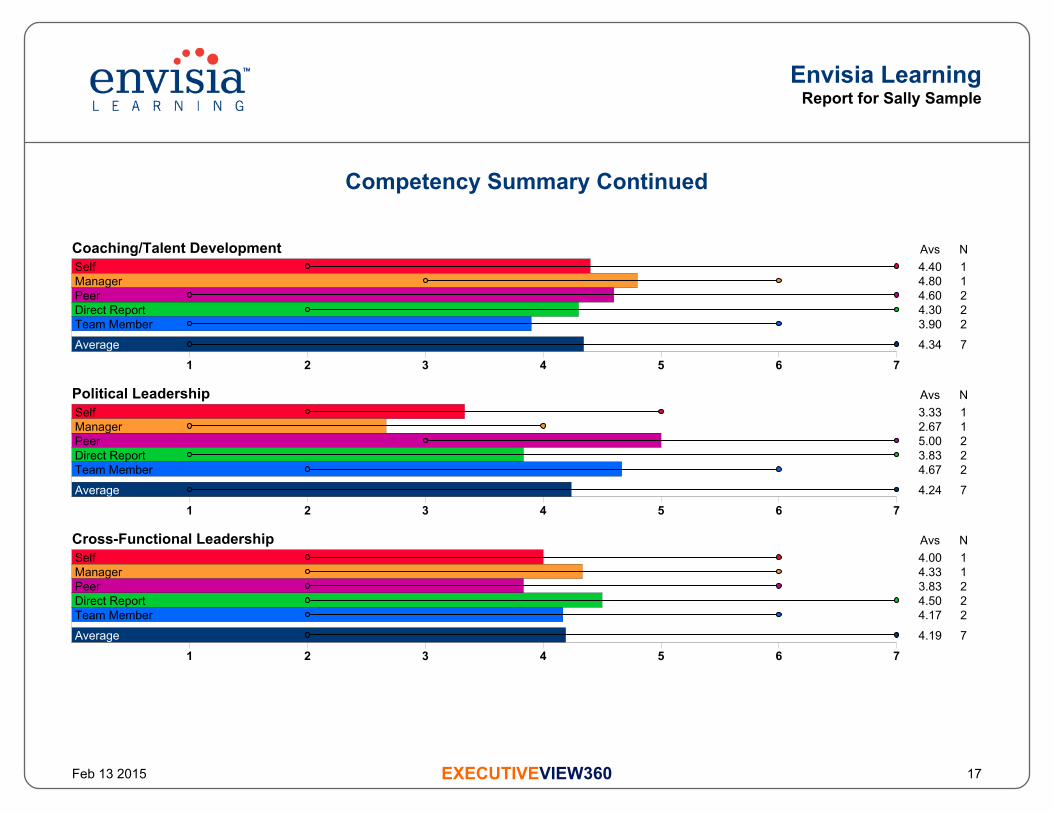
Competency Summary Continued
Coaching/Talent Development Avs NSelf 4.40 1Manager 4.80 1Peer 4.60 2Direct Report 4.30 2Team Member 3.90 2
Average 4.34 7
1 2 3 4 5 6 7
Political Leadership Avs NSelf 3.33 1Manager 2.67 1Peer 5.00 2Direct Report 3.83 2Team Member 4.67 2
Average 4.24 7
1 2 3 4 5 6 7
Cross-Functional Leadership Avs NSelf 4.00 1Manager 4.33 1Peer 3.83 2Direct Report 4.50 2Team Member 4.17 2
Average 4.19 7
1 2 3 4 5 6 7

Envisia LearningReport for Sally Sample
EXECUTIVEVIEW360Feb 13 2015 18
Competency Summary Continued
Depth of Industry Knowledge Avs NSelf 3.00 1Manager 3.67 1Peer 4.17 2Direct Report 4.67 2Team Member 3.83 2
Average 4.14 7
1 2 3 4 5 6 7
Drive for Results Avs NSelf 5.00 1Manager 2.00 1Peer 4.83 2Direct Report 4.33 2Team Member 4.17 2
Average 4.10 7
1 2 3 4 5 6 7
Decision Making Avs NSelf 3.67 1Manager 3.67 1Peer 4.83 2Direct Report 2.67 2Team Member 5.00 2
Average 4.10 7
1 2 3 4 5 6 7

Envisia LearningReport for Sally Sample
EXECUTIVEVIEW360Feb 13 2015 19
Competency Summary Continued
Strategic Problem Analysis Avs NSelf 6.00 1Manager 3.00 1Peer 3.50 2Direct Report 4.17 2Team Member 5.00 2
Average 4.05 7
1 2 3 4 5 6 7
Adaptability/Flexibility Avs NSelf 4.67 1Manager 2.67 1Peer 4.33 2Direct Report 3.83 2Team Member 4.33 2
Average 3.95 7
1 2 3 4 5 6 7
Self-Development Avs NSelf 5.00 1Manager 4.33 1Peer 4.50 2Direct Report 3.67 2Team Member 3.50 2
Average 3.95 7
1 2 3 4 5 6 7

Envisia LearningReport for Sally Sample
EXECUTIVEVIEW360Feb 13 2015 20
Competency Summary Continued
Visionary Leadership Avs NSelf 4.00 1Manager 3.33 1Peer 4.50 2Direct Report 3.83 2Team Member 3.83 2
Average 3.95 7
1 2 3 4 5 6 7
Entrepreneurial Leadership Avs NSelf 5.00 1Manager 4.67 1Peer 3.33 2Direct Report 4.67 2Team Member 3.50 2
Average 3.95 7
1 2 3 4 5 6 7
Engenders Trust Avs NSelf 3.33 1Manager 3.67 1Peer 3.67 2Direct Report 4.67 2Team Member 3.33 2
Average 3.86 7
1 2 3 4 5 6 7

Envisia LearningReport for Sally Sample
EXECUTIVEVIEW360Feb 13 2015 21
Competency Summary Continued
Influence/Negotiation Avs NSelf 3.33 1Manager 5.00 1Peer 3.83 2Direct Report 3.50 2Team Member 3.50 2
Average 3.81 7
1 2 3 4 5 6 7
Communication/ Presentation Avs NSelf 2.67 1Manager 2.67 1Peer 5.00 2Direct Report 3.17 2Team Member 3.67 2
Average 3.76 7
1 2 3 4 5 6 7
Team Building Avs NSelf 4.33 1Manager 5.67 1Peer 3.83 2Direct Report 2.00 2Team Member 4.33 2
Average 3.71 7
1 2 3 4 5 6 7

Envisia LearningReport for Sally Sample
EXECUTIVEVIEW360Feb 13 2015 22
Competency Summary Continued
Driving Change Avs NSelf 3.33 1Manager 2.67 1Peer 3.33 2Direct Report 3.67 2Team Member 4.33 2
Average 3.62 7
1 2 3 4 5 6 7
Financial Leadership Avs NSelf 4.67 1Manager 4.00 1Peer 3.67 2Direct Report 3.83 2Team Member 3.17 2
Average 3.62 7
1 2 3 4 5 6 7
Technological Leadership Avs NSelf 4.00 1Manager 4.00 1Peer 2.50 2Direct Report 4.17 2Team Member 3.17 2
Average 3.38 7
1 2 3 4 5 6 7

Envisia LearningReport for Sally Sample
EXECUTIVEVIEW360Feb 13 2015 23
Competency Summary Continued
Driving Strategic Direction Avs NSelf 2.33 1Manager 4.67 1Peer 2.50 2Direct Report 4.00 2Team Member 2.50 2
Average 3.24 7
1 2 3 4 5 6 7

Envisia LearningReport for Sally Sample
EXECUTIVEVIEW360Feb 13 2015 24
Most Frequent Behaviors - All Raters
The following behaviors were identified by your respondents as your most frequently demonstrated behaviors and grouped by relevant competency. Theyare rank ordered so that the first item is perceived to be your most frequently demonstrated behavior. The number of raters is shown for each rating levelof the behavior. A box indicates your own self-rating on this behavior (Note: If there is no box present for an item, it means that you did not provide ananswer between the scale 1 and 7).
These represent behaviors perceived by others as frequently practiced. As such, you should consider ways to continue leveraging these behaviors asstrengths.
Most Frequent Behaviors Competency Ave
rage
Sco
re
1- T
o an
Ext
rem
ely
Sm
all E
xten
t
2- T
o a
Ver
y S
mal
l Ext
ent
3- T
o a
Sm
all E
xten
t
4- T
o a
Mod
erat
e E
xten
t
5- T
o a
Larg
e E
xten
t
6- T
o a
Ver
y La
rge
Ext
ent
7- T
o an
Ext
rem
ely
Larg
e E
xten
t
Demonstrates awareness of the strengths, weaknesses, and strategies ofindustry competitors.
Depth of Industry Knowledge 5.43 0 0 2 0 0 3 2
Selects the best talent for key positions and assignments. Coaching/Talent Development 5.43 0 1 0 1 0 3 2
Transfers the necessary authority to others to ensure completion ofdelegated tasks, assignments, and projects.
Empowering Others 5.29 0 0 0 2 3 0 2
Demonstrates sensitivity towards and actively promotes diversity in theworkforce.
Coaching/Talent Development 5.14 0 0 1 2 0 3 1
Anticipates potential and future problems. Strategic Problem Analysis 5.00 0 0 0 4 0 2 1
Fosters internal negotiation and effective conflict resolution with others. Political Leadership 5.00 0 1 0 1 2 2 1
Envisia LearningReport for Sally Sample
EXECUTIVEVIEW360Feb 13 2015 25
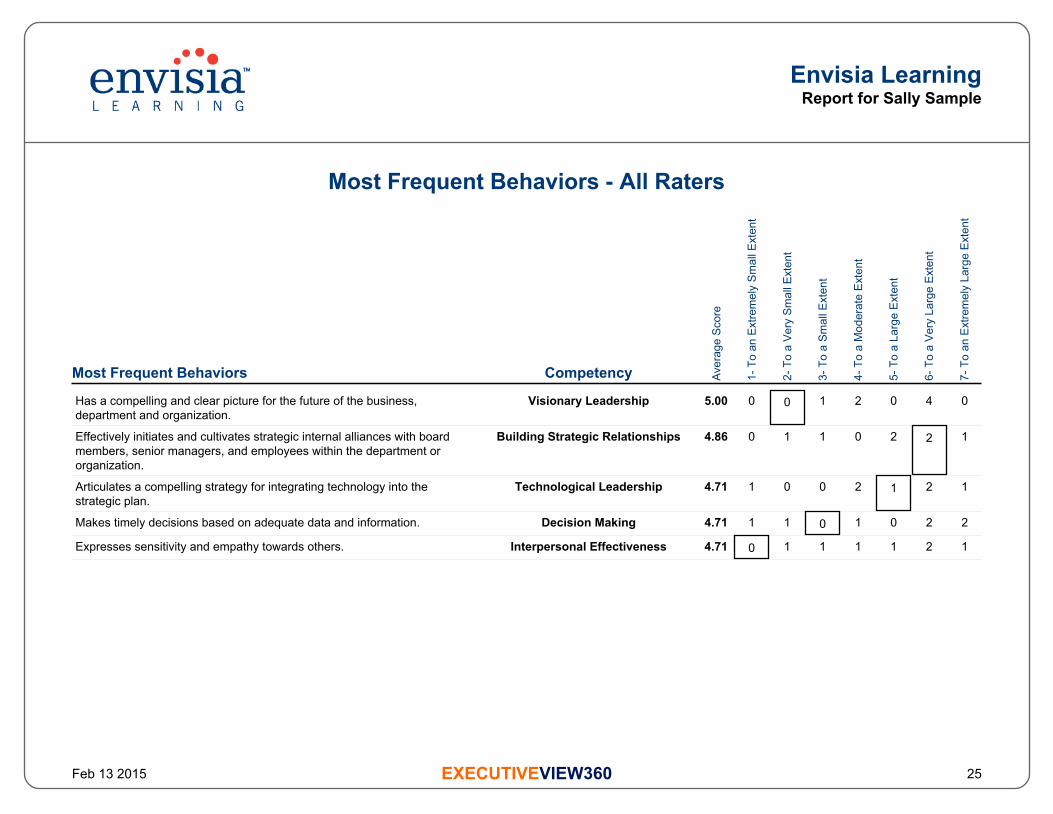
Most Frequent Behaviors - All Raters
Most Frequent Behaviors Competency Ave
rage
Sco
re
1- T
o an
Ext
rem
ely
Sm
all E
xten
t
2- T
o a
Ver
y S
mal
l Ext
ent
3- T
o a
Sm
all E
xten
t
4- T
o a
Mod
erat
e E
xten
t
5- T
o a
Larg
e E
xten
t
6- T
o a
Ver
y La
rge
Ext
ent
7- T
o an
Ext
rem
ely
Larg
e E
xten
t
Has a compelling and clear picture for the future of the business,department and organization.
Visionary Leadership 5.00 0 0 1 2 0 4 0
Effectively initiates and cultivates strategic internal alliances with boardmembers, senior managers, and employees within the department ororganization.
Building Strategic Relationships 4.86 0 1 1 0 2 2 1
Articulates a compelling strategy for integrating technology into thestrategic plan.
Technological Leadership 4.71 1 0 0 2 1 2 1
Makes timely decisions based on adequate data and information. Decision Making 4.71 1 1 0 1 0 2 2
Expresses sensitivity and empathy towards others. Interpersonal Effectiveness 4.71 0 1 1 1 1 2 1

Envisia LearningReport for Sally Sample
EXECUTIVEVIEW360Feb 13 2015 26
Most Frequent Behaviors - Manager
The following behaviors were identified by your respondents as your most frequently demonstrated behaviors and grouped by relevant competency. Theyare rank ordered so that the first item is perceived to be your most frequently demonstrated behavior. The number of raters is shown for each rating levelof the behavior. A box indicates your own self-rating on this behavior (Note: If there is no box present for an item, it means that you did not provide ananswer between the scale 1 and 7).
These represent behaviors perceived by others as frequently practiced. As such, you should consider ways to continue leveraging these behaviors asstrengths.
Most Frequent Behaviors Competency Ave
rage
Sco
re
1- T
o an
Ext
rem
ely
Sm
all E
xten
t
2- T
o a
Ver
y S
mal
l Ext
ent
3- T
o a
Sm
all E
xten
t
4- T
o a
Mod
erat
e E
xten
t
5- T
o a
Larg
e E
xten
t
6- T
o a
Ver
y La
rge
Ext
ent
7- T
o an
Ext
rem
ely
Larg
e E
xten
t
Demonstrates awareness of the strengths, weaknesses, and strategies ofindustry competitors.
Depth of Industry Knowledge 7.00 0 0 0 0 0 0 1
Articulates a compelling strategy for integrating technology into thestrategic plan.
Technological Leadership 7.00 0 0 0 0 0 0 1
Seeks and applies feedback and constructive criticism. Self-Development 7.00 0 0 0 0 0 0 1
Seeks to actively listen and understand diverse points of view. Interpersonal Effectiveness 7.00 0 0 0 0 0 0 1
Allows people to manage his or her own project, department, business unitor function with autonomy.
Empowering Others 6.00 0 0 0 0 0 1 0
Communicates a vision of the organizational future and inspirescommitment and support towards this vision from others.
Visionary Leadership 6.00 0 0 0 0 0 1 0

Envisia LearningReport for Sally Sample
EXECUTIVEVIEW360Feb 13 2015 27
Most Frequent Behaviors - Manager
Most Frequent Behaviors Competency Ave
rage
Sco
re
1- T
o an
Ext
rem
ely
Sm
all E
xten
t
2- T
o a
Ver
y S
mal
l Ext
ent
3- T
o a
Sm
all E
xten
t
4- T
o a
Mod
erat
e E
xten
t
5- T
o a
Larg
e E
xten
t
6- T
o a
Ver
y La
rge
Ext
ent
7- T
o an
Ext
rem
ely
Larg
e E
xten
t
Seeks and creates opportunities to add value within the marketplace. Entrepreneurial Leadership 6.00 0 0 0 0 0 1 0
Communicates and expresses ideas in a manner that persuades andinfluences others.
Influence/Negotiation 6.00 0 0 0 0 0 1 0
Anticipates potential and future problems. Strategic Problem Analysis 6.00 0 0 0 0 0 1 0
Attracts and builds a high performing team. Team Building 6.00 0 0 0 0 0 1 0
Promotes collaboration and removes obstacles to teamwork across thedepartment or organization.
Team Building 6.00 0 0 0 0 0 1 0
Effectively allocates financial resources to meet business objectives. Financial Leadership 6.00 0 0 0 0 0 1 0
Establishes a plan and process for developing successors. Coaching/Talent Development 6.00 0 0 0 0 0 1 0
Selects the best talent for key positions and assignments. Coaching/Talent Development 6.00 0 0 0 0 0 1 0
Effectively allocates human and financial resources necessary to achievestrategic objectives.
Driving Strategic Direction 6.00 0 0 0 0 0 1 0
Involves multiple departments and functions when developing strategicplans and implementing change initiatives.
Cross-Functional Leadership 6.00 0 0 0 0 0 1 0

Envisia LearningReport for Sally Sample
EXECUTIVEVIEW360Feb 13 2015 28
Most Frequent Behaviors - Peer
The following behaviors were identified by your respondents as your most frequently demonstrated behaviors and grouped by relevant competency. Theyare rank ordered so that the first item is perceived to be your most frequently demonstrated behavior. The number of raters is shown for each rating levelof the behavior. A box indicates your own self-rating on this behavior (Note: If there is no box present for an item, it means that you did not provide ananswer between the scale 1 and 7).
These represent behaviors perceived by others as frequently practiced. As such, you should consider ways to continue leveraging these behaviors asstrengths.
Most Frequent Behaviors Competency Ave
rage
Sco
re
1- T
o an
Ext
rem
ely
Sm
all E
xten
t
2- T
o a
Ver
y S
mal
l Ext
ent
3- T
o a
Sm
all E
xten
t
4- T
o a
Mod
erat
e E
xten
t
5- T
o a
Larg
e E
xten
t
6- T
o a
Ver
y La
rge
Ext
ent
7- T
o an
Ext
rem
ely
Larg
e E
xten
t
Demonstrates sensitivity towards and actively promotes diversity in theworkforce.
Coaching/Talent Development 6.50 0 0 0 0 0 1 1
Makes decisions confidently and quickly when necessary. Decision Making 6.50 0 0 0 0 0 1 1
Sets and pursues aggressive business goals and targets. Drive for Results 6.50 0 0 0 0 0 1 1
Handles questions in meetings and presentations in a responsive anddiplomatic manner.
Communication/ Presentation 6.50 0 0 0 0 0 1 1
Expresses sensitivity and empathy towards others. Interpersonal Effectiveness 6.00 0 0 0 0 1 0 1
Fosters internal negotiation and effective conflict resolution with others. Political Leadership 6.00 0 0 0 0 1 0 1
Envisia LearningReport for Sally Sample
EXECUTIVEVIEW360Feb 13 2015 29
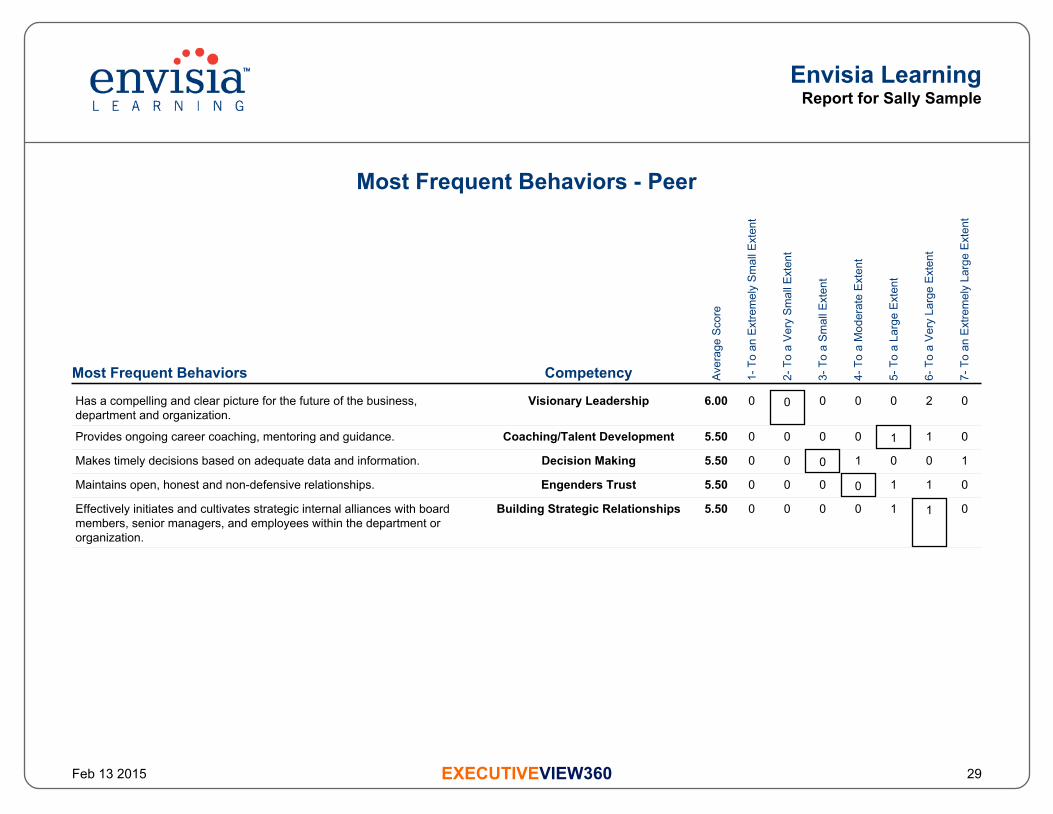
Most Frequent Behaviors - Peer
Most Frequent Behaviors Competency Ave
rage
Sco
re
1- T
o an
Ext
rem
ely
Sm
all E
xten
t
2- T
o a
Ver
y S
mal
l Ext
ent
3- T
o a
Sm
all E
xten
t
4- T
o a
Mod
erat
e E
xten
t
5- T
o a
Larg
e E
xten
t
6- T
o a
Ver
y La
rge
Ext
ent
7- T
o an
Ext
rem
ely
Larg
e E
xten
t
Has a compelling and clear picture for the future of the business,department and organization.
Visionary Leadership 6.00 0 0 0 0 0 2 0
Provides ongoing career coaching, mentoring and guidance. Coaching/Talent Development 5.50 0 0 0 0 1 1 0
Makes timely decisions based on adequate data and information. Decision Making 5.50 0 0 0 1 0 0 1
Maintains open, honest and non-defensive relationships. Engenders Trust 5.50 0 0 0 0 1 1 0
Effectively initiates and cultivates strategic internal alliances with boardmembers, senior managers, and employees within the department ororganization.
Building Strategic Relationships 5.50 0 0 0 0 1 1 0
Envisia LearningReport for Sally Sample
EXECUTIVEVIEW360Feb 13 2015 30
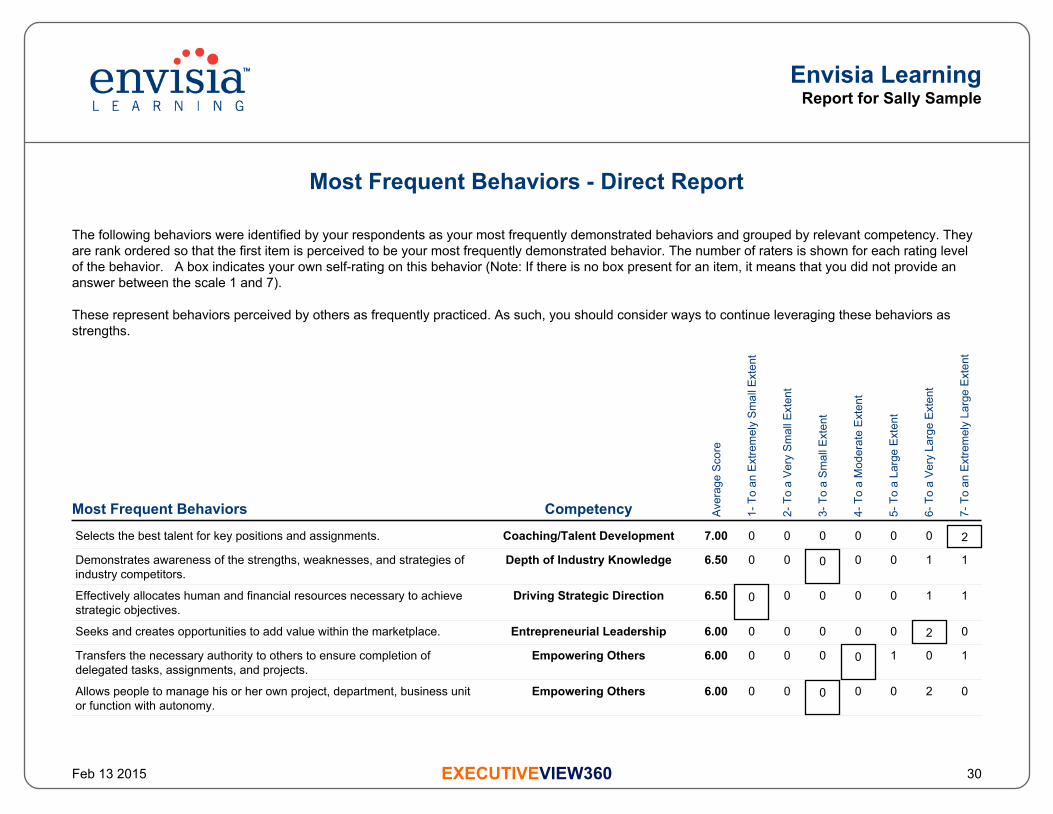
Most Frequent Behaviors - Direct Report
The following behaviors were identified by your respondents as your most frequently demonstrated behaviors and grouped by relevant competency. Theyare rank ordered so that the first item is perceived to be your most frequently demonstrated behavior. The number of raters is shown for each rating levelof the behavior. A box indicates your own self-rating on this behavior (Note: If there is no box present for an item, it means that you did not provide ananswer between the scale 1 and 7).
These represent behaviors perceived by others as frequently practiced. As such, you should consider ways to continue leveraging these behaviors asstrengths.
Most Frequent Behaviors Competency Ave
rage
Sco
re
1- T
o an
Ext
rem
ely
Sm
all E
xten
t
2- T
o a
Ver
y S
mal
l Ext
ent
3- T
o a
Sm
all E
xten
t
4- T
o a
Mod
erat
e E
xten
t
5- T
o a
Larg
e E
xten
t
6- T
o a
Ver
y La
rge
Ext
ent
7- T
o an
Ext
rem
ely
Larg
e E
xten
t
Selects the best talent for key positions and assignments. Coaching/Talent Development 7.00 0 0 0 0 0 0 2
Demonstrates awareness of the strengths, weaknesses, and strategies ofindustry competitors.
Depth of Industry Knowledge 6.50 0 0 0 0 0 1 1
Effectively allocates human and financial resources necessary to achievestrategic objectives.
Driving Strategic Direction 6.50 0 0 0 0 0 1 1
Seeks and creates opportunities to add value within the marketplace. Entrepreneurial Leadership 6.00 0 0 0 0 0 2 0
Transfers the necessary authority to others to ensure completion ofdelegated tasks, assignments, and projects.
Empowering Others 6.00 0 0 0 0 1 0 1
Allows people to manage his or her own project, department, business unitor function with autonomy.
Empowering Others 6.00 0 0 0 0 0 2 0

Envisia LearningReport for Sally Sample
EXECUTIVEVIEW360Feb 13 2015 31
Most Frequent Behaviors - Direct Report
Most Frequent Behaviors Competency Ave
rage
Sco
re
1- T
o an
Ext
rem
ely
Sm
all E
xten
t
2- T
o a
Ver
y S
mal
l Ext
ent
3- T
o a
Sm
all E
xten
t
4- T
o a
Mod
erat
e E
xten
t
5- T
o a
Larg
e E
xten
t
6- T
o a
Ver
y La
rge
Ext
ent
7- T
o an
Ext
rem
ely
Larg
e E
xten
t
Seeks to actively listen and understand diverse points of view. Interpersonal Effectiveness 5.50 0 0 0 0 1 1 0
Generates and considers multiple solutions to a problem. Strategic Problem Analysis 5.50 0 0 0 0 1 1 0
Aligns organizational structure, systems, processes and talent to achievedesired results across the department or organization.
Cross-Functional Leadership 5.50 0 0 0 1 0 0 1
Demonstrates high standards of personal and professional integrity. Engenders Trust 5.50 0 0 0 0 1 1 0
Maintains a realistic outlook in the face of challenge and change. Adaptability/Flexibility 5.50 0 0 0 0 1 1 0

Envisia LearningReport for Sally Sample
EXECUTIVEVIEW360Feb 13 2015 32
Most Frequent Behaviors - Team Member
The following behaviors were identified by your respondents as your most frequently demonstrated behaviors and grouped by relevant competency. Theyare rank ordered so that the first item is perceived to be your most frequently demonstrated behavior. The number of raters is shown for each rating levelof the behavior. A box indicates your own self-rating on this behavior (Note: If there is no box present for an item, it means that you did not provide ananswer between the scale 1 and 7).
These represent behaviors perceived by others as frequently practiced. As such, you should consider ways to continue leveraging these behaviors asstrengths.
Most Frequent Behaviors Competency Ave
rage
Sco
re
1- T
o an
Ext
rem
ely
Sm
all E
xten
t
2- T
o a
Ver
y S
mal
l Ext
ent
3- T
o a
Sm
all E
xten
t
4- T
o a
Mod
erat
e E
xten
t
5- T
o a
Larg
e E
xten
t
6- T
o a
Ver
y La
rge
Ext
ent
7- T
o an
Ext
rem
ely
Larg
e E
xten
t
Anticipates potential and future problems. Strategic Problem Analysis 6.50 0 0 0 0 0 1 1
Makes timely decisions based on adequate data and information. Decision Making 6.50 0 0 0 0 0 1 1
Selects the best talent for key positions and assignments. Coaching/Talent Development 6.00 0 0 0 0 0 2 0
Promotes collaboration and removes obstacles to teamwork across thedepartment or organization.
Team Building 6.00 0 0 0 0 1 0 1
Responds constructively to ambiguity, change, obstacles, and challenges. Adaptability/Flexibility 5.50 0 0 0 1 0 0 1
Demonstrates emotional control and patience under pressure and stress. Adaptability/Flexibility 5.50 0 0 0 1 0 0 1
Ability to effectively manage interpersonal relations in a cooperative,sensitive, and collaborative manner.
Interpersonal Effectiveness 5.50 0 0 0 1 0 0 1

Envisia LearningReport for Sally Sample
EXECUTIVEVIEW360Feb 13 2015 33
Most Frequent Behaviors - Team Member
Most Frequent Behaviors Competency Ave
rage
Sco
re
1- T
o an
Ext
rem
ely
Sm
all E
xten
t
2- T
o a
Ver
y S
mal
l Ext
ent
3- T
o a
Sm
all E
xten
t
4- T
o a
Mod
erat
e E
xten
t
5- T
o a
Larg
e E
xten
t
6- T
o a
Ver
y La
rge
Ext
ent
7- T
o an
Ext
rem
ely
Larg
e E
xten
t
Fosters internal negotiation and effective conflict resolution with others. Political Leadership 5.50 0 0 0 0 1 1 0
Demonstrates a depth and breadth of understanding of key operations anddepartments within the organization.
Cross-Functional Leadership 5.50 0 0 0 0 1 1 0
Gathers enough information and data before making a decision. Decision Making 5.50 0 0 0 0 1 1 0
Transfers the necessary authority to others to ensure completion ofdelegated tasks, assignments, and projects.
Empowering Others 5.50 0 0 0 1 0 0 1
Envisia LearningReport for Sally Sample
EXECUTIVEVIEW360Feb 13 2015 34
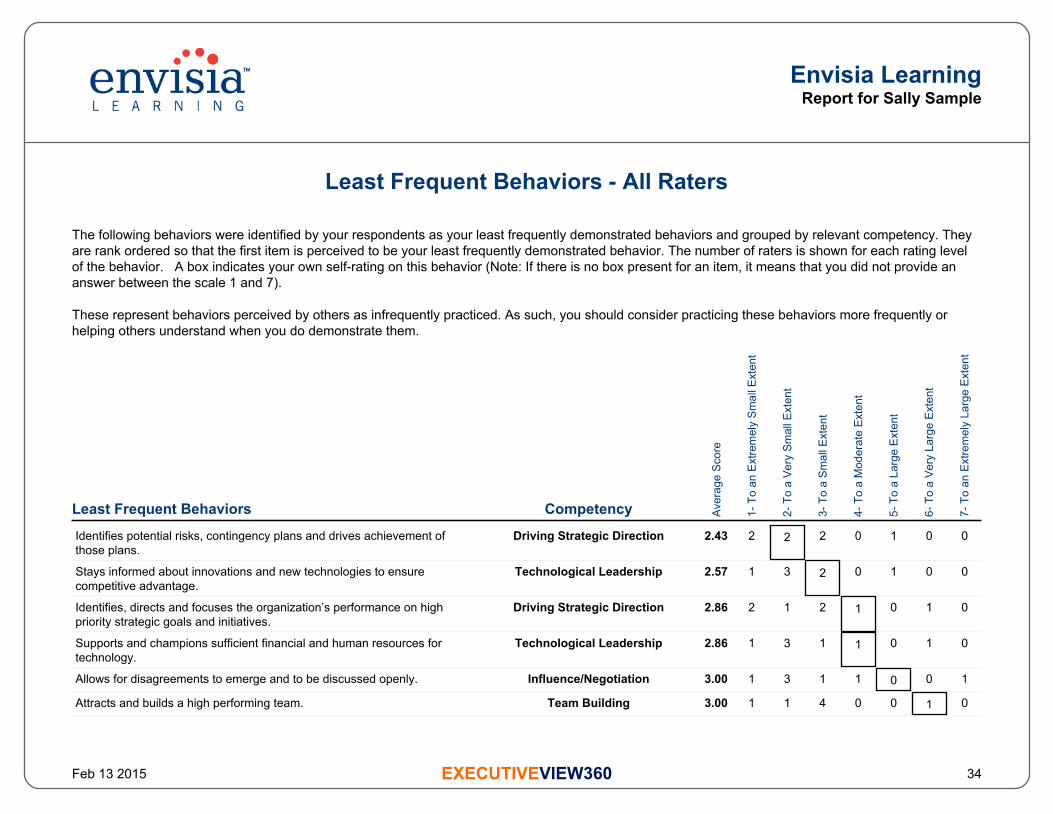
Least Frequent Behaviors - All Raters
The following behaviors were identified by your respondents as your least frequently demonstrated behaviors and grouped by relevant competency. Theyare rank ordered so that the first item is perceived to be your least frequently demonstrated behavior. The number of raters is shown for each rating levelof the behavior. A box indicates your own self-rating on this behavior (Note: If there is no box present for an item, it means that you did not provide ananswer between the scale 1 and 7).
These represent behaviors perceived by others as infrequently practiced. As such, you should consider practicing these behaviors more frequently orhelping others understand when you do demonstrate them.
Least Frequent Behaviors Competency Ave
rage
Sco
re
1- T
o an
Ext
rem
ely
Sm
all E
xten
t
2- T
o a
Ver
y S
mal
l Ext
ent
3- T
o a
Sm
all E
xten
t
4- T
o a
Mod
erat
e E
xten
t
5- T
o a
Larg
e E
xten
t
6- T
o a
Ver
y La
rge
Ext
ent
7- T
o an
Ext
rem
ely
Larg
e E
xten
t
Identifies potential risks, contingency plans and drives achievement ofthose plans.
Driving Strategic Direction 2.43 2 2 2 0 1 0 0
Stays informed about innovations and new technologies to ensurecompetitive advantage.
Technological Leadership 2.57 1 3 2 0 1 0 0
Identifies, directs and focuses the organization’s performance on highpriority strategic goals and initiatives.
Driving Strategic Direction 2.86 2 1 2 1 0 1 0
Supports and champions sufficient financial and human resources fortechnology.
Technological Leadership 2.86 1 3 1 1 0 1 0
Allows for disagreements to emerge and to be discussed openly. Influence/Negotiation 3.00 1 3 1 1 0 0 1
Attracts and builds a high performing team. Team Building 3.00 1 1 4 0 0 1 0

Envisia LearningReport for Sally Sample
EXECUTIVEVIEW360Feb 13 2015 35
Least Frequent Behaviors - All Raters
Least Frequent Behaviors Competency Ave
rage
Sco
re
1- T
o an
Ext
rem
ely
Sm
all E
xten
t
2- T
o a
Ver
y S
mal
l Ext
ent
3- T
o a
Sm
all E
xten
t
4- T
o a
Mod
erat
e E
xten
t
5- T
o a
Larg
e E
xten
t
6- T
o a
Ver
y La
rge
Ext
ent
7- T
o an
Ext
rem
ely
Larg
e E
xten
t
Communicates a vision of the organizational future and inspirescommitment and support towards this vision from others.
Visionary Leadership 3.00 1 2 2 1 0 1 0
Gathers and utilizes available information in order to understand and solveorganizational issues and problems.
Strategic Problem Analysis 3.14 2 0 3 0 1 1 0
Identifies key issues in budgets, profit and loss statements, and otherfinancial indicators.
Financial Leadership 3.14 1 0 3 3 0 0 0
Demonstrates high standards of personal and professional integrity. Engenders Trust 3.29 0 4 0 1 1 1 0
Initiates and promotes continuous learning and improvement effortsthroughout the department or organization.
Driving Change 3.29 0 3 1 1 2 0 0
Envisia LearningReport for Sally Sample
EXECUTIVEVIEW360Feb 13 2015 36
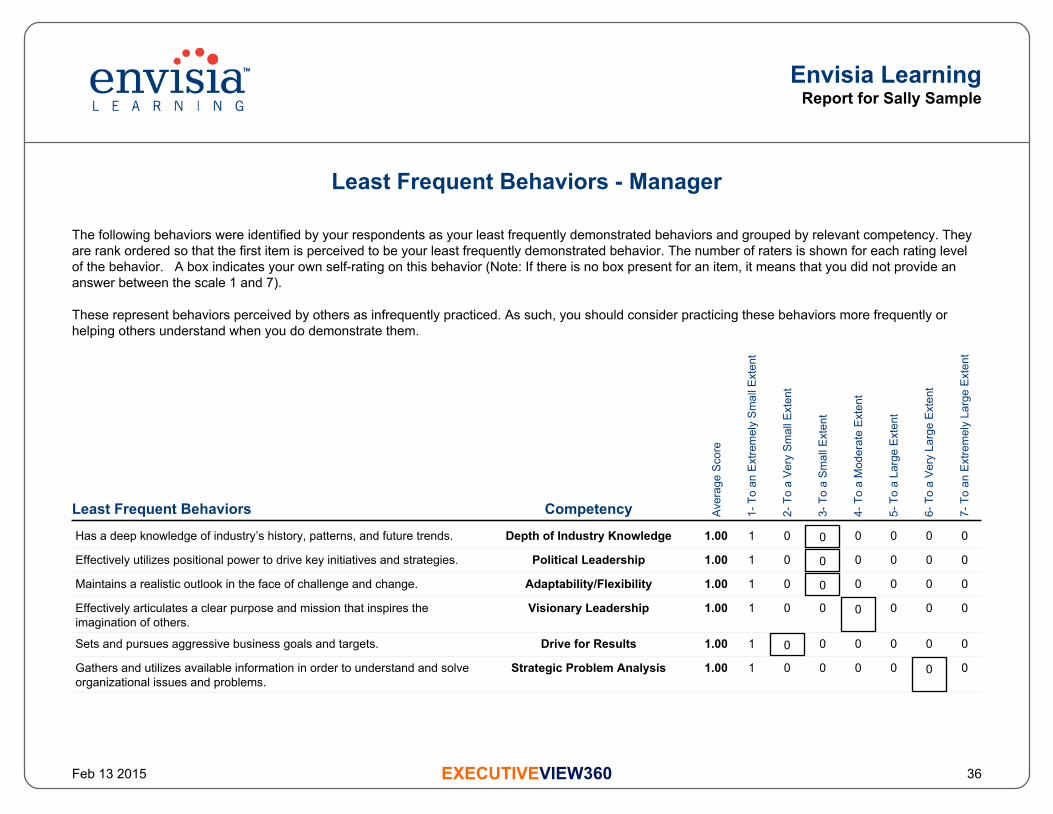
Least Frequent Behaviors - Manager
The following behaviors were identified by your respondents as your least frequently demonstrated behaviors and grouped by relevant competency. Theyare rank ordered so that the first item is perceived to be your least frequently demonstrated behavior. The number of raters is shown for each rating levelof the behavior. A box indicates your own self-rating on this behavior (Note: If there is no box present for an item, it means that you did not provide ananswer between the scale 1 and 7).
These represent behaviors perceived by others as infrequently practiced. As such, you should consider practicing these behaviors more frequently orhelping others understand when you do demonstrate them.
Least Frequent Behaviors Competency Ave
rage
Sco
re
1- T
o an
Ext
rem
ely
Sm
all E
xten
t
2- T
o a
Ver
y S
mal
l Ext
ent
3- T
o a
Sm
all E
xten
t
4- T
o a
Mod
erat
e E
xten
t
5- T
o a
Larg
e E
xten
t
6- T
o a
Ver
y La
rge
Ext
ent
7- T
o an
Ext
rem
ely
Larg
e E
xten
t
Has a deep knowledge of industry’s history, patterns, and future trends. Depth of Industry Knowledge 1.00 1 0 0 0 0 0 0
Effectively utilizes positional power to drive key initiatives and strategies. Political Leadership 1.00 1 0 0 0 0 0 0
Maintains a realistic outlook in the face of challenge and change. Adaptability/Flexibility 1.00 1 0 0 0 0 0 0
Effectively articulates a clear purpose and mission that inspires theimagination of others.
Visionary Leadership 1.00 1 0 0 0 0 0 0
Sets and pursues aggressive business goals and targets. Drive for Results 1.00 1 0 0 0 0 0 0
Gathers and utilizes available information in order to understand and solveorganizational issues and problems.
Strategic Problem Analysis 1.00 1 0 0 0 0 0 0
Envisia LearningReport for Sally Sample
EXECUTIVEVIEW360Feb 13 2015 37
Least Frequent Behaviors - Manager
Least Frequent Behaviors Competency Ave
rage
Sco
re
1- T
o an
Ext
rem
ely
Sm
all E
xten
t
2- T
o a
Ver
y S
mal
l Ext
ent
3- T
o a
Sm
all E
xten
t
4- T
o a
Mod
erat
e E
xten
t
5- T
o a
Larg
e E
xten
t
6- T
o a
Ver
y La
rge
Ext
ent
7- T
o an
Ext
rem
ely
Larg
e E
xten
t
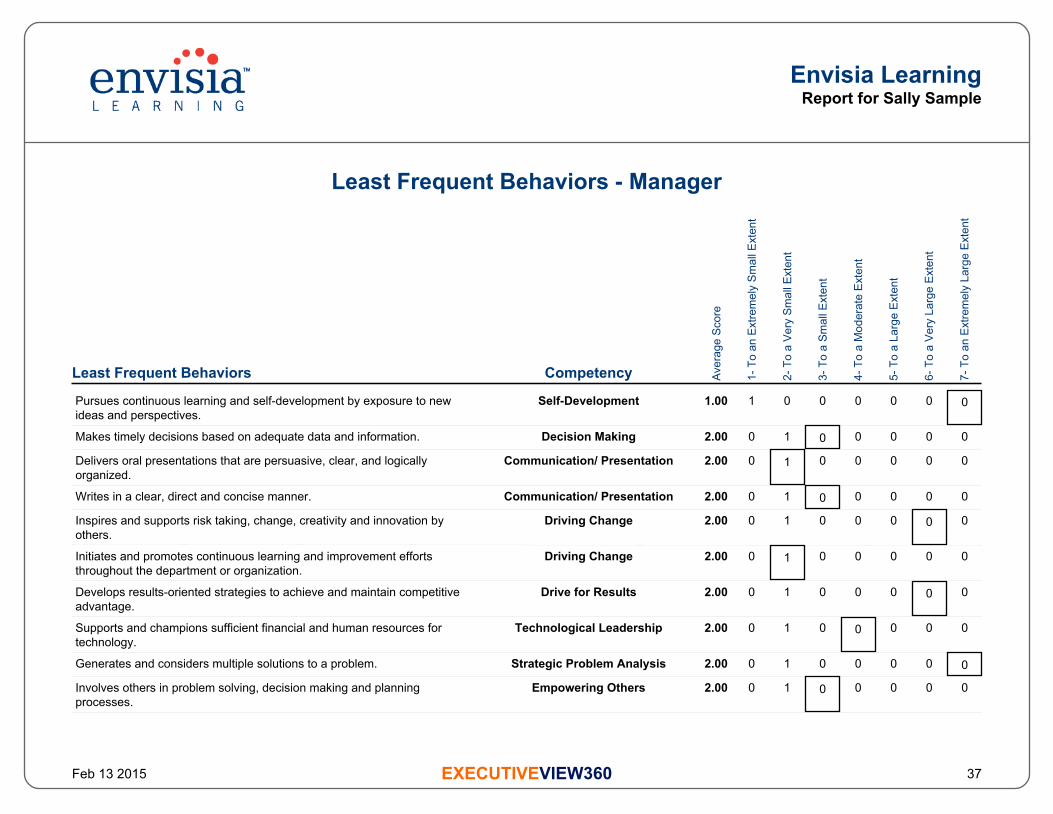
Pursues continuous learning and self-development by exposure to newideas and perspectives.
Self-Development 1.00 1 0 0 0 0 0 0
Makes timely decisions based on adequate data and information. Decision Making 2.00 0 1 0 0 0 0 0
Delivers oral presentations that are persuasive, clear, and logicallyorganized.
Communication/ Presentation 2.00 0 1 0 0 0 0 0
Writes in a clear, direct and concise manner. Communication/ Presentation 2.00 0 1 0 0 0 0 0
Inspires and supports risk taking, change, creativity and innovation byothers.
Driving Change 2.00 0 1 0 0 0 0 0
Initiates and promotes continuous learning and improvement effortsthroughout the department or organization.
Driving Change 2.00 0 1 0 0 0 0 0
Develops results-oriented strategies to achieve and maintain competitiveadvantage.
Drive for Results 2.00 0 1 0 0 0 0 0
Supports and champions sufficient financial and human resources fortechnology.
Technological Leadership 2.00 0 1 0 0 0 0 0
Generates and considers multiple solutions to a problem. Strategic Problem Analysis 2.00 0 1 0 0 0 0 0
Involves others in problem solving, decision making and planningprocesses.
Empowering Others 2.00 0 1 0 0 0 0 0

Envisia LearningReport for Sally Sample
EXECUTIVEVIEW360Feb 13 2015 38
Least Frequent Behaviors - Manager
Least Frequent Behaviors Competency Ave
rage
Sco
re
1- T
o an
Ext
rem
ely
Sm
all E
xten
t
2- T
o a
Ver
y S
mal
l Ext
ent
3- T
o a
Sm
all E
xten
t
4- T
o a
Mod
erat
e E
xten
t
5- T
o a
Larg
e E
xten
t
6- T
o a
Ver
y La
rge
Ext
ent
7- T
o an
Ext
rem
ely
Larg
e E
xten
t
Demonstrates a depth and breadth of understanding of key operations anddepartments within the organization.
Cross-Functional Leadership 2.00 0 1 0 0 0 0 0
Demonstrates consistency between actions and words. Engenders Trust 2.00 0 1 0 0 0 0 0

Envisia LearningReport for Sally Sample
EXECUTIVEVIEW360Feb 13 2015 39
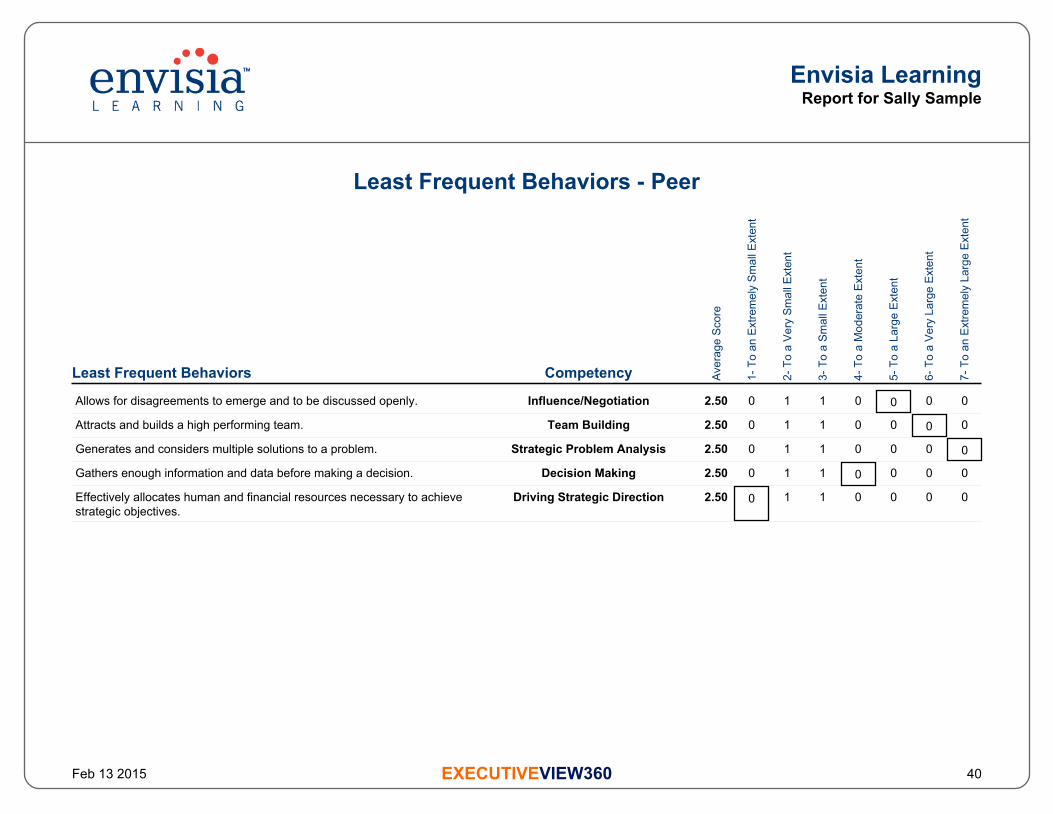
Least Frequent Behaviors - Peer
The following behaviors were identified by your respondents as your least frequently demonstrated behaviors and grouped by relevant competency. Theyare rank ordered so that the first item is perceived to be your least frequently demonstrated behavior. The number of raters is shown for each rating levelof the behavior. A box indicates your own self-rating on this behavior (Note: If there is no box present for an item, it means that you did not provide ananswer between the scale 1 and 7).
These represent behaviors perceived by others as infrequently practiced. As such, you should consider practicing these behaviors more frequently orhelping others understand when you do demonstrate them.
Least Frequent Behaviors Competency Ave
rage
Sco
re
1- T
o an
Ext
rem
ely
Sm
all E
xten
t
2- T
o a
Ver
y S
mal
l Ext
ent
3- T
o a
Sm
all E
xten
t
4- T
o a
Mod
erat
e E
xten
t
5- T
o a
Larg
e E
xten
t
6- T
o a
Ver
y La
rge
Ext
ent
7- T
o an
Ext
rem
ely
Larg
e E
xten
t
Identifies potential risks, contingency plans and drives achievement ofthose plans.
Driving Strategic Direction 1.50 1 1 0 0 0 0 0
Supports and champions sufficient financial and human resources fortechnology.
Technological Leadership 1.50 1 1 0 0 0 0 0
Identifies key issues in budgets, profit and loss statements, and otherfinancial indicators.
Financial Leadership 2.00 1 0 1 0 0 0 0
Allows people to manage his or her own project, department, business unitor function with autonomy.
Empowering Others 2.00 0 2 0 0 0 0 0
Demonstrates high standards of personal and professional integrity. Engenders Trust 2.00 0 2 0 0 0 0 0
Seeks and creates opportunities to add value within the marketplace. Entrepreneurial Leadership 2.50 0 1 1 0 0 0 0
Envisia LearningReport for Sally Sample
EXECUTIVEVIEW360Feb 13 2015 40
Least Frequent Behaviors - Peer
Least Frequent Behaviors Competency Ave
rage
Sco
re
1- T
o an
Ext
rem
ely
Sm
all E
xten
t
2- T
o a
Ver
y S
mal
l Ext
ent
3- T
o a
Sm
all E
xten
t
4- T
o a
Mod
erat
e E
xten
t
5- T
o a
Larg
e E
xten
t
6- T
o a
Ver
y La
rge
Ext
ent
7- T
o an
Ext
rem
ely
Larg
e E
xten
t
Allows for disagreements to emerge and to be discussed openly. Influence/Negotiation 2.50 0 1 1 0 0 0 0
Attracts and builds a high performing team. Team Building 2.50 0 1 1 0 0 0 0
Generates and considers multiple solutions to a problem. Strategic Problem Analysis 2.50 0 1 1 0 0 0 0
Gathers enough information and data before making a decision. Decision Making 2.50 0 1 1 0 0 0 0
Effectively allocates human and financial resources necessary to achievestrategic objectives.
Driving Strategic Direction 2.50 0 1 1 0 0 0 0

Envisia LearningReport for Sally Sample
EXECUTIVEVIEW360Feb 13 2015 41
Least Frequent Behaviors - Direct Report
The following behaviors were identified by your respondents as your least frequently demonstrated behaviors and grouped by relevant competency. Theyare rank ordered so that the first item is perceived to be your least frequently demonstrated behavior. The number of raters is shown for each rating levelof the behavior. A box indicates your own self-rating on this behavior (Note: If there is no box present for an item, it means that you did not provide ananswer between the scale 1 and 7).
These represent behaviors perceived by others as infrequently practiced. As such, you should consider practicing these behaviors more frequently orhelping others understand when you do demonstrate them.
Least Frequent Behaviors Competency Ave
rage
Sco
re
1- T
o an
Ext
rem
ely
Sm
all E
xten
t
2- T
o a
Ver
y S
mal
l Ext
ent
3- T
o a
Sm
all E
xten
t
4- T
o a
Mod
erat
e E
xten
t
5- T
o a
Larg
e E
xten
t
6- T
o a
Ver
y La
rge
Ext
ent
7- T
o an
Ext
rem
ely
Larg
e E
xten
t
Identifies potential risks, contingency plans and drives achievement ofthose plans.
Driving Strategic Direction 1.50 1 1 0 0 0 0 0
Encourages a climate of trust, honesty and openness with others. Team Building 2.00 1 0 1 0 0 0 0
Attracts and builds a high performing team. Team Building 2.00 1 0 1 0 0 0 0
Promotes collaboration and removes obstacles to teamwork across thedepartment or organization.
Team Building 2.00 0 2 0 0 0 0 0
Allows for disagreements to emerge and to be discussed openly. Influence/Negotiation 2.00 0 2 0 0 0 0 0
Gathers enough information and data before making a decision. Decision Making 2.00 0 2 0 0 0 0 0
Envisia LearningReport for Sally Sample
EXECUTIVEVIEW360Feb 13 2015 42
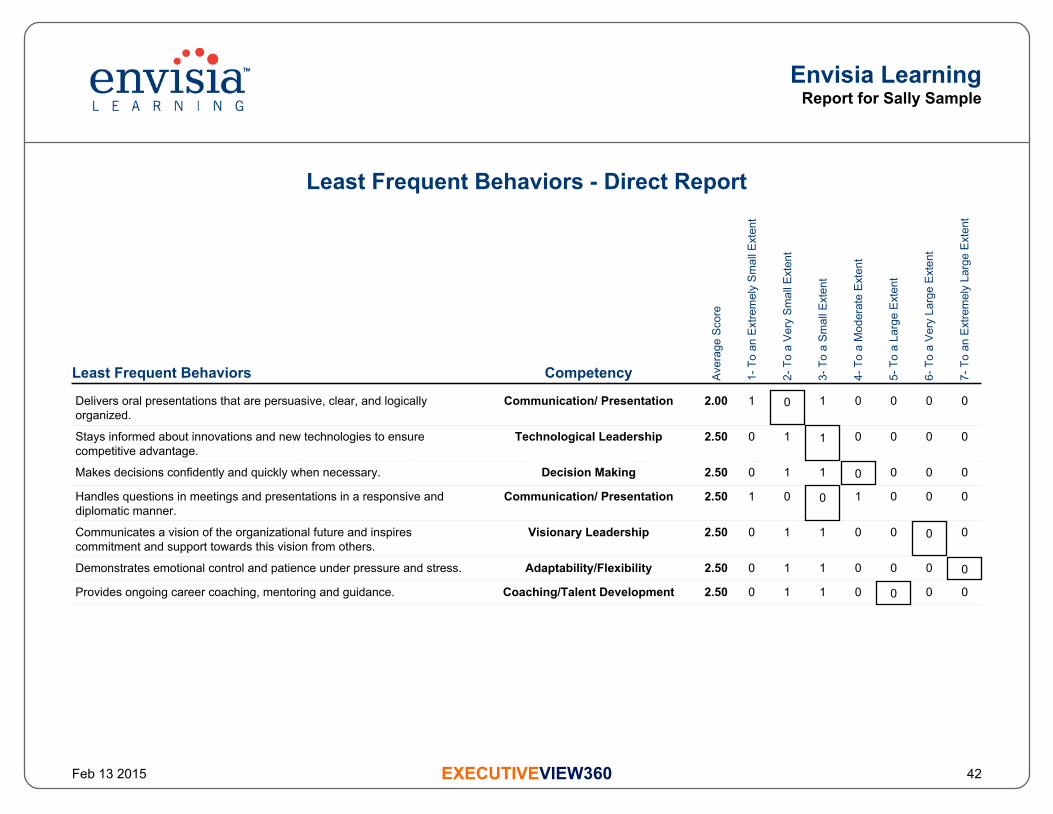
Least Frequent Behaviors - Direct Report
Least Frequent Behaviors Competency Ave
rage
Sco
re
1- T
o an
Ext
rem
ely
Sm
all E
xten
t
2- T
o a
Ver
y S
mal
l Ext
ent
3- T
o a
Sm
all E
xten
t
4- T
o a
Mod
erat
e E
xten
t
5- T
o a
Larg
e E
xten
t
6- T
o a
Ver
y La
rge
Ext
ent
7- T
o an
Ext
rem
ely
Larg
e E
xten
t
Delivers oral presentations that are persuasive, clear, and logicallyorganized.
Communication/ Presentation 2.00 1 0 1 0 0 0 0
Stays informed about innovations and new technologies to ensurecompetitive advantage.
Technological Leadership 2.50 0 1 1 0 0 0 0
Makes decisions confidently and quickly when necessary. Decision Making 2.50 0 1 1 0 0 0 0
Handles questions in meetings and presentations in a responsive anddiplomatic manner.
Communication/ Presentation 2.50 1 0 0 1 0 0 0
Communicates a vision of the organizational future and inspirescommitment and support towards this vision from others.
Visionary Leadership 2.50 0 1 1 0 0 0 0
Demonstrates emotional control and patience under pressure and stress. Adaptability/Flexibility 2.50 0 1 1 0 0 0 0
Provides ongoing career coaching, mentoring and guidance. Coaching/Talent Development 2.50 0 1 1 0 0 0 0

Envisia LearningReport for Sally Sample
EXECUTIVEVIEW360Feb 13 2015 43
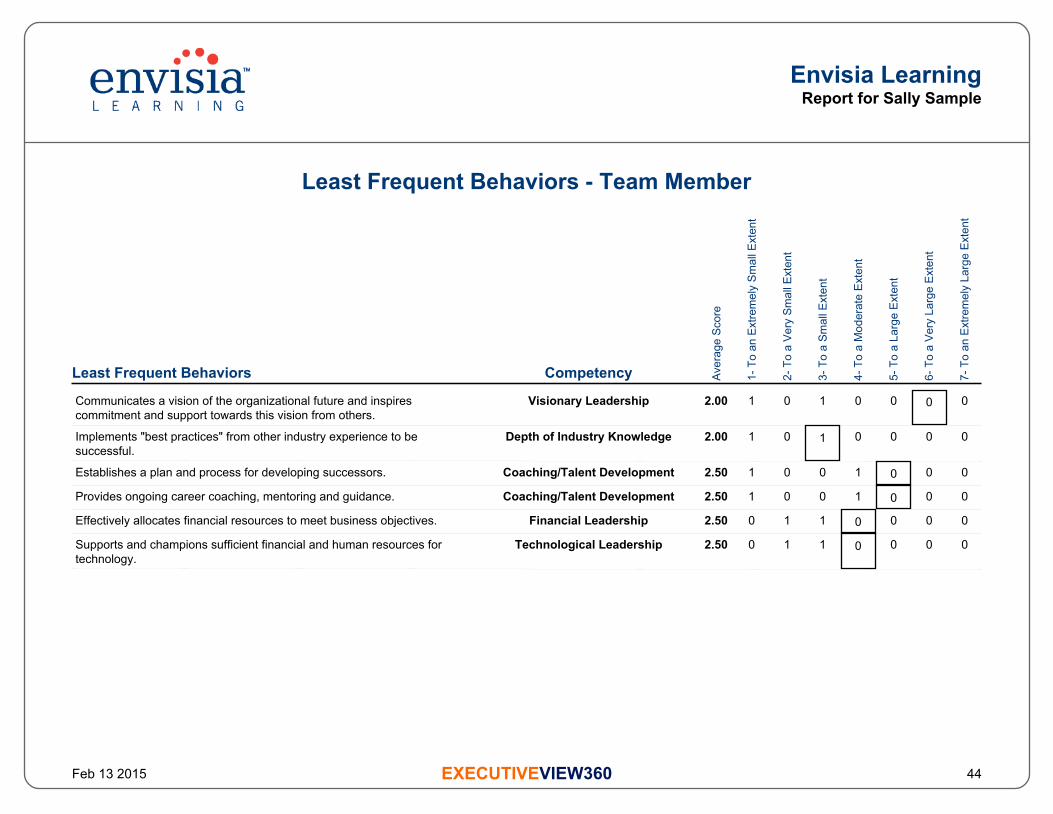
Least Frequent Behaviors - Team Member
The following behaviors were identified by your respondents as your least frequently demonstrated behaviors and grouped by relevant competency. Theyare rank ordered so that the first item is perceived to be your least frequently demonstrated behavior. The number of raters is shown for each rating levelof the behavior. A box indicates your own self-rating on this behavior (Note: If there is no box present for an item, it means that you did not provide ananswer between the scale 1 and 7).
These represent behaviors perceived by others as infrequently practiced. As such, you should consider practicing these behaviors more frequently orhelping others understand when you do demonstrate them.
Least Frequent Behaviors Competency Ave
rage
Sco
re
1- T
o an
Ext
rem
ely
Sm
all E
xten
t
2- T
o a
Ver
y S
mal
l Ext
ent
3- T
o a
Sm
all E
xten
t
4- T
o a
Mod
erat
e E
xten
t
5- T
o a
Larg
e E
xten
t
6- T
o a
Ver
y La
rge
Ext
ent
7- T
o an
Ext
rem
ely
Larg
e E
xten
t
Identifies, directs and focuses the organization’s performance on highpriority strategic goals and initiatives.
Driving Strategic Direction 1.00 2 0 0 0 0 0 0
Seeks to actively listen and understand diverse points of view. Interpersonal Effectiveness 1.50 1 1 0 0 0 0 0
Seeks and applies feedback and constructive criticism. Self-Development 2.00 0 2 0 0 0 0 0
Maintains a realistic outlook in the face of challenge and change. Adaptability/Flexibility 2.00 1 0 1 0 0 0 0
Demonstrates high standards of personal and professional integrity. Engenders Trust 2.00 0 2 0 0 0 0 0
Stays informed about innovations and new technologies to ensurecompetitive advantage.
Technological Leadership 2.00 0 2 0 0 0 0 0
Envisia LearningReport for Sally Sample
EXECUTIVEVIEW360Feb 13 2015 44
Least Frequent Behaviors - Team Member
Least Frequent Behaviors Competency Ave
rage
Sco
re
1- T
o an
Ext
rem
ely
Sm
all E
xten
t
2- T
o a
Ver
y S
mal
l Ext
ent
3- T
o a
Sm
all E
xten
t
4- T
o a
Mod
erat
e E
xten
t
5- T
o a
Larg
e E
xten
t
6- T
o a
Ver
y La
rge
Ext
ent
7- T
o an
Ext
rem
ely
Larg
e E
xten
t
Communicates a vision of the organizational future and inspirescommitment and support towards this vision from others.
Visionary Leadership 2.00 1 0 1 0 0 0 0
Implements "best practices" from other industry experience to besuccessful.
Depth of Industry Knowledge 2.00 1 0 1 0 0 0 0
Establishes a plan and process for developing successors. Coaching/Talent Development 2.50 1 0 0 1 0 0 0
Provides ongoing career coaching, mentoring and guidance. Coaching/Talent Development 2.50 1 0 0 1 0 0 0
Effectively allocates financial resources to meet business objectives. Financial Leadership 2.50 0 1 1 0 0 0 0
Supports and champions sufficient financial and human resources fortechnology.
Technological Leadership 2.50 0 1 1 0 0 0 0

Envisia LearningReport for Sally Sample
EXECUTIVEVIEW360Feb 13 2015 45
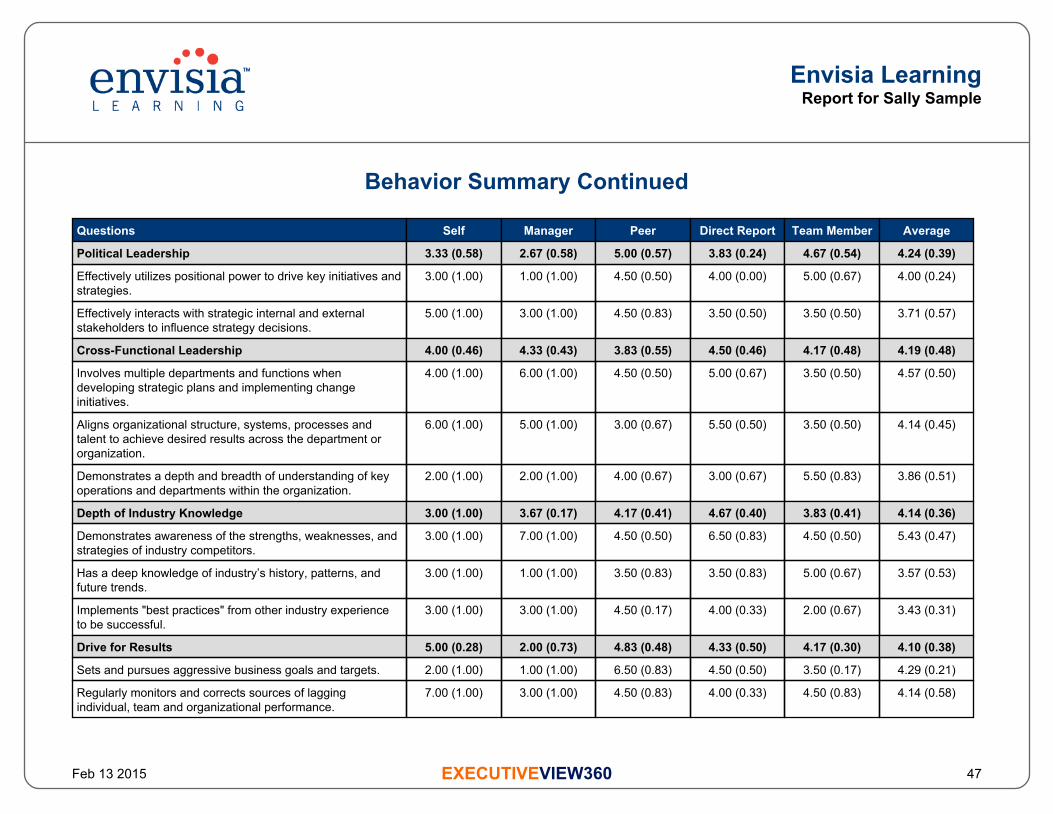
Behavior Summary
The average score for each ExecutiveView360 competency and specific questions are summarized below for each rater category (1 to 7 scale with higherscores corresponding to more frequently observed behavior). If the symbol AP appears instead of a score it means anonymity protection (i.e., fewer than aspecified minimum number of people from a particular rater group have responded, the score is not shown to protect anonymity). If the symbol NRappears instead of a score it means no people from a particular rater group have responded. The competencies are presented in descending order basedon the average scores of all raters. If the symbol AP appears instead of a score it means anonymity protection (i.e., fewer than a specified minimumnumber of people from a particular rater group have responded, the score is not shown to protect anonymity). If the symbol NR appears instead of a scoreit means no people from a particular rater group have responded. The competencies are presented in descending order based on the average scores of allraters.
The number in parentheses next to the average score is an index of or measure of rater agreement. The range of scores for this statistical measure ofrater agreement is 0 to 1 where "1" represents total agreement by all raters. A score closer to "0" suggests that there exists a wider level of disagreementamong raters in their perceptions of how frequently you demonstrate specific actions or behaviors. The higher the agreement score, the greater theconsistency and agreement among raters. An agreement score of less than .50 might suggest that you interpret the average score with caution as it mightnot truly represent an accurate indication of how you are perceived by all raters providing you with feedback.
Questions Self Manager Peer Direct Report Team Member Average
Empowering Others 3.33 (0.84) 4.33 (0.43) 3.67 (0.58) 5.50 (0.68) 4.33 (0.47) 4.48 (0.49)
Transfers the necessary authority to others to ensurecompletion of delegated tasks, assignments, and projects.
4.00 (1.00) 5.00 (1.00) 4.50 (0.83) 6.00 (0.67) 5.50 (0.50) 5.29 (0.61)
Allows people to manage his or her own project, department,business unit or function with autonomy.
3.00 (1.00) 6.00 (1.00) 2.00 (1.00) 6.00 (1.00) 3.50 (0.50) 4.14 (0.37)
Involves others in problem solving, decision making andplanning processes.
3.00 (1.00) 2.00 (1.00) 4.50 (0.83) 4.50 (0.83) 4.00 (0.67) 4.00 (0.64)
Building Strategic Relationships 4.00 (0.46) 4.33 (0.69) 5.00 (0.73) 4.00 (0.46) 4.33 (0.58) 4.43 (0.57)
Effectively initiates and cultivates strategic internal allianceswith board members, senior managers, and employeeswithin the department or organization.
6.00 (1.00) 5.00 (1.00) 5.50 (0.83) 4.00 (0.33) 5.00 (0.33) 4.86 (0.45)

Envisia LearningReport for Sally Sample
EXECUTIVEVIEW360Feb 13 2015 46
Behavior Summary Continued
Questions Self Manager Peer Direct Report Team Member Average
Building Strategic Relationships 4.00 (0.46) 4.33 (0.69) 5.00 (0.73) 4.00 (0.46) 4.33 (0.58) 4.43 (0.57)
Develops and maintains a broad base of support among keyinternal and external stakeholders.
4.00 (1.00) 5.00 (1.00) 5.00 (0.67) 4.00 (0.33) 4.00 (1.00) 4.43 (0.57)
Effectively builds relationships with key community membersand partnerships with others outside the organization.
2.00 (1.00) 3.00 (1.00) 4.50 (0.83) 4.00 (1.00) 4.00 (1.00) 4.00 (0.82)
Interpersonal Effectiveness 3.67 (0.32) 5.00 (0.53) 4.50 (0.43) 4.50 (0.40) 3.83 (0.30) 4.38 (0.38)
Expresses sensitivity and empathy towards others. 1.00 (1.00) 4.00 (1.00) 6.00 (0.67) 4.00 (0.33) 4.50 (0.50) 4.71 (0.44)
Ability to effectively manage interpersonal relations in acooperative, sensitive, and collaborative manner.
4.00 (1.00) 4.00 (1.00) 3.50 (0.83) 4.00 (0.33) 5.50 (0.50) 4.29 (0.47)
Seeks to actively listen and understand diverse points ofview.
6.00 (1.00) 7.00 (1.00) 4.00 (0.33) 5.50 (0.83) 1.50 (0.83) 4.14 (0.26)
Coaching/Talent Development 4.40 (0.42) 4.80 (0.61) 4.60 (0.40) 4.30 (0.40) 3.90 (0.38) 4.34 (0.41)
Selects the best talent for key positions and assignments. 7.00 (1.00) 6.00 (1.00) 3.00 (0.67) 7.00 (1.00) 6.00 (1.00) 5.43 (0.44)
Demonstrates sensitivity towards and actively promotesdiversity in the workforce.
3.00 (1.00) 3.00 (1.00) 6.50 (0.83) 5.00 (0.67) 5.00 (0.67) 5.14 (0.55)
Establishes a plan and process for developing successors. 5.00 (1.00) 6.00 (1.00) 4.50 (0.83) 4.00 (0.67) 2.50 (0.50) 4.00 (0.50)
Provides ongoing career coaching, mentoring and guidance. 5.00 (1.00) 4.00 (1.00) 5.50 (0.83) 2.50 (0.83) 2.50 (0.50) 3.57 (0.47)
Provides timely, clear and constructive performance anddevelopmental feedback.
2.00 (1.00) 5.00 (1.00) 3.50 (0.17) 3.00 (0.67) 3.50 (0.50) 3.57 (0.41)
Political Leadership 3.33 (0.58) 2.67 (0.58) 5.00 (0.57) 3.83 (0.24) 4.67 (0.54) 4.24 (0.39)
Fosters internal negotiation and effective conflict resolutionwith others.
2.00 (1.00) 4.00 (1.00) 6.00 (0.67) 4.00 (0.33) 5.50 (0.83) 5.00 (0.50)
Envisia LearningReport for Sally Sample
EXECUTIVEVIEW360Feb 13 2015 47
Behavior Summary Continued
Questions Self Manager Peer Direct Report Team Member Average
Political Leadership 3.33 (0.58) 2.67 (0.58) 5.00 (0.57) 3.83 (0.24) 4.67 (0.54) 4.24 (0.39)
Effectively utilizes positional power to drive key initiatives andstrategies.
3.00 (1.00) 1.00 (1.00) 4.50 (0.50) 4.00 (0.00) 5.00 (0.67) 4.00 (0.24)
Effectively interacts with strategic internal and externalstakeholders to influence strategy decisions.
5.00 (1.00) 3.00 (1.00) 4.50 (0.83) 3.50 (0.50) 3.50 (0.50) 3.71 (0.57)
Cross-Functional Leadership 4.00 (0.46) 4.33 (0.43) 3.83 (0.55) 4.50 (0.46) 4.17 (0.48) 4.19 (0.48)
Involves multiple departments and functions whendeveloping strategic plans and implementing changeinitiatives.
4.00 (1.00) 6.00 (1.00) 4.50 (0.50) 5.00 (0.67) 3.50 (0.50) 4.57 (0.50)
Aligns organizational structure, systems, processes andtalent to achieve desired results across the department ororganization.
6.00 (1.00) 5.00 (1.00) 3.00 (0.67) 5.50 (0.50) 3.50 (0.50) 4.14 (0.45)
Demonstrates a depth and breadth of understanding of keyoperations and departments within the organization.
2.00 (1.00) 2.00 (1.00) 4.00 (0.67) 3.00 (0.67) 5.50 (0.83) 3.86 (0.51)
Depth of Industry Knowledge 3.00 (1.00) 3.67 (0.17) 4.17 (0.41) 4.67 (0.40) 3.83 (0.41) 4.14 (0.36)
Demonstrates awareness of the strengths, weaknesses, andstrategies of industry competitors.
3.00 (1.00) 7.00 (1.00) 4.50 (0.50) 6.50 (0.83) 4.50 (0.50) 5.43 (0.47)
Has a deep knowledge of industry’s history, patterns, andfuture trends.
3.00 (1.00) 1.00 (1.00) 3.50 (0.83) 3.50 (0.83) 5.00 (0.67) 3.57 (0.53)
Implements "best practices" from other industry experienceto be successful.
3.00 (1.00) 3.00 (1.00) 4.50 (0.17) 4.00 (0.33) 2.00 (0.67) 3.43 (0.31)
Drive for Results 5.00 (0.28) 2.00 (0.73) 4.83 (0.48) 4.33 (0.50) 4.17 (0.30) 4.10 (0.38)
Sets and pursues aggressive business goals and targets. 2.00 (1.00) 1.00 (1.00) 6.50 (0.83) 4.50 (0.50) 3.50 (0.17) 4.29 (0.21)
Regularly monitors and corrects sources of laggingindividual, team and organizational performance.
7.00 (1.00) 3.00 (1.00) 4.50 (0.83) 4.00 (0.33) 4.50 (0.83) 4.14 (0.58)

Envisia LearningReport for Sally Sample
EXECUTIVEVIEW360Feb 13 2015 48
Behavior Summary Continued
Questions Self Manager Peer Direct Report Team Member Average
Drive for Results 5.00 (0.28) 2.00 (0.73) 4.83 (0.48) 4.33 (0.50) 4.17 (0.30) 4.10 (0.38)
Develops results-oriented strategies to achieve and maintaincompetitive advantage.
6.00 (1.00) 2.00 (1.00) 3.50 (0.50) 4.50 (0.83) 4.50 (0.17) 3.86 (0.40)
Decision Making 3.67 (0.84) 3.67 (0.58) 4.83 (0.35) 2.67 (0.47) 5.00 (0.46) 4.10 (0.35)
Makes timely decisions based on adequate data andinformation.
3.00 (1.00) 2.00 (1.00) 5.50 (0.50) 3.50 (0.17) 6.50 (0.83) 4.71 (0.25)
Makes decisions confidently and quickly when necessary. 4.00 (1.00) 4.00 (1.00) 6.50 (0.83) 2.50 (0.83) 3.00 (0.67) 4.00 (0.41)
Gathers enough information and data before making adecision.
4.00 (1.00) 5.00 (1.00) 2.50 (0.83) 2.00 (1.00) 5.50 (0.83) 3.57 (0.47)
Strategic Problem Analysis 6.00 (0.73) 3.00 (0.28) 3.50 (0.68) 4.17 (0.64) 5.00 (0.33) 4.05 (0.43)
Anticipates potential and future problems. 5.00 (1.00) 6.00 (1.00) 4.00 (1.00) 4.00 (1.00) 6.50 (0.83) 5.00 (0.60)
Generates and considers multiple solutions to a problem. 7.00 (1.00) 2.00 (1.00) 2.50 (0.83) 5.50 (0.83) 5.00 (0.67) 4.00 (0.47)
Gathers and utilizes available information in order tounderstand and solve organizational issues and problems.
6.00 (1.00) 1.00 (1.00) 4.00 (0.67) 3.00 (1.00) 3.50 (0.17) 3.14 (0.42)
Adaptability/Flexibility 4.67 (0.43) 2.67 (0.58) 4.33 (0.69) 3.83 (0.48) 4.33 (0.29) 3.95 (0.44)
Responds constructively to ambiguity, change, obstacles,and challenges.
4.00 (1.00) 3.00 (1.00) 5.00 (0.67) 3.50 (0.50) 5.50 (0.50) 4.43 (0.47)
Demonstrates emotional control and patience under pressureand stress.
7.00 (1.00) 4.00 (1.00) 4.00 (0.67) 2.50 (0.83) 5.50 (0.50) 4.00 (0.50)
Maintains a realistic outlook in the face of challenge andchange.
3.00 (1.00) 1.00 (1.00) 4.00 (1.00) 5.50 (0.83) 2.00 (0.67) 3.43 (0.41)
Self-Development 5.00 (0.53) 4.33 (0.17) 4.50 (0.26) 3.67 (0.63) 3.50 (0.37) 3.95 (0.35)
Realistically appraises own strengths and developmentareas.
4.00 (1.00) 5.00 (1.00) 4.50 (0.17) 4.50 (0.50) 4.00 (0.67) 4.43 (0.44)

Envisia LearningReport for Sally Sample
EXECUTIVEVIEW360Feb 13 2015 49
Behavior Summary Continued
Questions Self Manager Peer Direct Report Team Member Average
Self-Development 5.00 (0.53) 4.33 (0.17) 4.50 (0.26) 3.67 (0.63) 3.50 (0.37) 3.95 (0.35)
Seeks and applies feedback and constructive criticism. 4.00 (1.00) 7.00 (1.00) 4.50 (0.50) 3.50 (0.83) 2.00 (1.00) 3.86 (0.40)
Pursues continuous learning and self-development byexposure to new ideas and perspectives.
7.00 (1.00) 1.00 (1.00) 4.50 (0.17) 3.00 (1.00) 4.50 (0.17) 3.57 (0.25)
Visionary Leadership 4.00 (0.46) 3.33 (0.32) 4.50 (0.54) 3.83 (0.60) 3.83 (0.48) 3.95 (0.48)
Has a compelling and clear picture for the future of thebusiness, department and organization.
2.00 (1.00) 3.00 (1.00) 6.00 (1.00) 5.00 (0.67) 5.00 (0.67) 5.00 (0.60)
Effectively articulates a clear purpose and mission thatinspires the imagination of others.
4.00 (1.00) 1.00 (1.00) 4.50 (0.83) 4.00 (1.00) 4.50 (0.83) 3.86 (0.58)
Communicates a vision of the organizational future andinspires commitment and support towards this vision fromothers.
6.00 (1.00) 6.00 (1.00) 3.00 (0.67) 2.50 (0.83) 2.00 (0.67) 3.00 (0.50)
Entrepreneurial Leadership 5.00 (0.73) 4.67 (0.69) 3.33 (0.63) 4.67 (0.50) 3.50 (0.58) 3.95 (0.53)
Seeks and creates opportunities to add value within themarketplace.
6.00 (1.00) 6.00 (1.00) 2.50 (0.83) 6.00 (1.00) 3.00 (1.00) 4.14 (0.45)
Seeks and develops business opportunities and ventures. 5.00 (1.00) 4.00 (1.00) 4.50 (0.83) 3.00 (0.67) 4.50 (0.50) 4.00 (0.60)
Communicates a vision for realizing new business ventures. 4.00 (1.00) 4.00 (1.00) 3.00 (0.67) 5.00 (0.67) 3.00 (0.67) 3.71 (0.57)
Engenders Trust 3.33 (0.69) 3.67 (0.58) 3.67 (0.43) 4.67 (0.54) 3.33 (0.54) 3.86 (0.48)
Demonstrates consistency between actions and words. 2.00 (1.00) 2.00 (1.00) 3.50 (0.50) 5.00 (0.67) 5.00 (1.00) 4.14 (0.51)
Maintains open, honest and non-defensive relationships. 4.00 (1.00) 5.00 (1.00) 5.50 (0.83) 3.50 (0.50) 3.00 (0.67) 4.14 (0.51)
Demonstrates high standards of personal and professionalintegrity.
4.00 (1.00) 4.00 (1.00) 2.00 (1.00) 5.50 (0.83) 2.00 (1.00) 3.29 (0.47)

Envisia LearningReport for Sally Sample
EXECUTIVEVIEW360Feb 13 2015 50
Behavior Summary Continued
Questions Self Manager Peer Direct Report Team Member Average
Influence/Negotiation 3.33 (0.58) 5.00 (0.73) 3.83 (0.32) 3.50 (0.46) 3.50 (0.34) 3.81 (0.39)
Effectively negotiates "win-win" solutions. 3.00 (1.00) 5.00 (1.00) 5.00 (1.00) 4.50 (0.83) 3.00 (1.00) 4.29 (0.71)
Communicates and expresses ideas in a manner thatpersuades and influences others.
2.00 (1.00) 6.00 (1.00) 4.00 (0.00) 4.00 (0.33) 3.50 (0.50) 4.14 (0.26)
Allows for disagreements to emerge and to be discussedopenly.
5.00 (1.00) 4.00 (1.00) 2.50 (0.83) 2.00 (1.00) 4.00 (0.00) 3.00 (0.38)
Communication/ Presentation 2.67 (0.84) 2.67 (0.69) 5.00 (0.49) 3.17 (0.44) 3.67 (0.69) 3.76 (0.47)
Handles questions in meetings and presentations in aresponsive and diplomatic manner.
3.00 (1.00) 4.00 (1.00) 6.50 (0.83) 2.50 (0.50) 3.00 (0.67) 4.00 (0.36)
Writes in a clear, direct and concise manner. 3.00 (1.00) 2.00 (1.00) 3.50 (0.50) 5.00 (1.00) 3.50 (0.83) 3.71 (0.57)
Delivers oral presentations that are persuasive, clear, andlogically organized.
2.00 (1.00) 2.00 (1.00) 5.00 (1.00) 2.00 (0.67) 4.50 (0.83) 3.57 (0.50)
Team Building 4.33 (0.43) 5.67 (0.84) 3.83 (0.35) 2.00 (0.73) 4.33 (0.54) 3.71 (0.39)
Promotes collaboration and removes obstacles to teamworkacross the department or organization.
5.00 (1.00) 6.00 (1.00) 4.50 (0.17) 2.00 (1.00) 6.00 (0.67) 4.43 (0.27)
Encourages a climate of trust, honesty and openness withothers.
2.00 (1.00) 5.00 (1.00) 4.50 (0.50) 2.00 (0.67) 4.00 (1.00) 3.71 (0.51)
Attracts and builds a high performing team. 6.00 (1.00) 6.00 (1.00) 2.50 (0.83) 2.00 (0.67) 3.00 (1.00) 3.00 (0.53)
Driving Change 3.33 (0.37) 2.67 (0.69) 3.33 (0.29) 3.67 (0.58) 4.33 (0.69) 3.62 (0.48)
Inspires and supports risk taking, change, creativity andinnovation by others.
6.00 (1.00) 2.00 (1.00) 3.50 (0.17) 4.00 (1.00) 5.00 (1.00) 3.86 (0.45)
Orchestrates change efforts across functions, departments,business units, and teams.
2.00 (1.00) 4.00 (1.00) 3.50 (0.17) 3.50 (0.50) 4.00 (0.67) 3.71 (0.44)

Envisia LearningReport for Sally Sample
EXECUTIVEVIEW360Feb 13 2015 51
Behavior Summary Continued
Questions Self Manager Peer Direct Report Team Member Average
Driving Change 3.33 (0.37) 2.67 (0.69) 3.33 (0.29) 3.67 (0.58) 4.33 (0.69) 3.62 (0.48)
Initiates and promotes continuous learning and improvementefforts throughout the department or organization.
2.00 (1.00) 2.00 (1.00) 3.00 (0.67) 3.50 (0.50) 4.00 (0.67) 3.29 (0.57)
Financial Leadership 4.67 (0.84) 4.00 (0.53) 3.67 (0.29) 3.83 (0.55) 3.17 (0.70) 3.62 (0.48)
Effectively allocates financial resources to meet businessobjectives.
4.00 (1.00) 6.00 (1.00) 4.00 (0.33) 4.00 (0.67) 2.50 (0.83) 3.86 (0.45)
Effectively manages the financial health of the organizationsthey lead.
5.00 (1.00) 3.00 (1.00) 5.00 (0.33) 4.00 (0.33) 3.00 (0.67) 3.86 (0.40)
Identifies key issues in budgets, profit and loss statements,and other financial indicators.
5.00 (1.00) 3.00 (1.00) 2.00 (0.67) 3.50 (0.83) 4.00 (1.00) 3.14 (0.67)
Technological Leadership 4.00 (0.73) 4.00 (0.28) 2.50 (0.40) 4.17 (0.51) 3.17 (0.51) 3.38 (0.40)
Articulates a compelling strategy for integrating technologyinto the strategic plan.
5.00 (1.00) 7.00 (1.00) 3.00 (0.33) 5.00 (0.67) 5.00 (0.67) 4.71 (0.39)
Supports and champions sufficient financial and humanresources for technology.
4.00 (1.00) 2.00 (1.00) 1.50 (0.83) 5.00 (0.67) 2.50 (0.83) 2.86 (0.48)
Stays informed about innovations and new technologies toensure competitive advantage.
3.00 (1.00) 3.00 (1.00) 3.00 (0.33) 2.50 (0.83) 2.00 (1.00) 2.57 (0.61)
Driving Strategic Direction 2.33 (0.58) 4.67 (0.58) 2.50 (0.68) 4.00 (0.21) 2.50 (0.40) 3.24 (0.35)
Effectively allocates human and financial resourcesnecessary to achieve strategic objectives.
1.00 (1.00) 6.00 (1.00) 2.50 (0.83) 6.50 (0.83) 3.50 (0.17) 4.43 (0.27)
Identifies, directs and focuses the organization’s performanceon high priority strategic goals and initiatives.
4.00 (1.00) 3.00 (1.00) 3.50 (0.83) 4.00 (0.33) 1.00 (1.00) 2.86 (0.45)
Identifies potential risks, contingency plans and drivesachievement of those plans.
2.00 (1.00) 5.00 (1.00) 1.50 (0.83) 1.50 (0.83) 3.00 (1.00) 2.43 (0.57)

Envisia LearningReport for Sally Sample
EXECUTIVEVIEW360Feb 13 2015 52
Open Ended Comments Summary Introduction
You and your respondents had the opportunity to provide written comments online about your perceived strengths and possible development areas.
The questions were:
FEEDFORWARD SIGNATURE STRENGTHSPlease provide any written comments you have regarding the demonstrated Strengths of the individual in the space provided below (what theindividual can do to continue leveraging their strengths)FEEDFORWARD DEVELOPMENT OPPORTUNITIESPlease provide any written comments you have regarding possible Development Areas of the individual in the space provided below (what theindividual can do more, less or differently to be more effective)
These comments are provided on the next pages and are included verbatim without identifying the rater to ensure confidentiality.
Compare the open-ended comments provided in the next few pages with the graphs and other information provided in this feedback report.
Please keep in mind that not all comments will be easy to understand - not everyone can provide concrete, specific, non-judgmental feedback.
It is important to look for trends or themes as you read these comments - it is easy to find a single comment upsetting or even biased. However, if anumber of comments focus on a specific area you might want to place a greater emphasis of importance on the specific behaviors to change to enhanceyour overall effectiveness.
The following questions might be useful in analyzing these open-ended comments:
Are the comments consistent and reinforce the other feedback you have received?Do they add any new information or insight about your performance and effectiveness?Do you see any trends across the open-ended comments?How can you leverage your strengths?What areas are you committed to focus on as part of your executive development plan?
Envisia LearningReport for Sally Sample
EXECUTIVEVIEW360Feb 13 2015 53
Open Ended Comments SummaryFEEDFORWARD SIGNATURE STRENGTHS

Envisia LearningReport for Sally Sample
EXECUTIVEVIEW360Feb 13 2015 54
Open Ended Comments Summary ContinuedFEEDFORWARD DEVELOPMENT OPPORTUNITIES

Envisia LearningReport for Sally Sample
EXECUTIVEVIEW360Feb 13 2015 55
Development Planning Guide
Examining Your ExecutiveView360 Feedback Report
Your reactions to your ExecutiveView360 report provide insight that is useful not only in the interpretation of the results, but in deciding what you may doabout them. Start with your feelings about the results.
If you had to select a single word or phrase to describe your emotional reaction, it would be:
What is it about your results that lead you to feel this way?
What new insights, if any, do you get from your results?
How do your perceptions compare to those of other rater groups? Are there any important trends?
What experiences or feedback from others seems very consistent with these results? What experiences or feedback from others seems very inconsistentwith these results?

Envisia LearningReport for Sally Sample
EXECUTIVEVIEW360Feb 13 2015 56
Development Planning Guide ContinuedDeciding What Competencies To Work On
The table below summarizes the 22 ExecutiveView360 competencies. Place a check next to the ones you rate as being most important to your currentposition below and place a check next to those skills that the majority of others see as possible development areas. Any competency with both columnschecked suggests more critical development areas. These should be considered as part of your development action plan.
Competency Group Competency Competency Importance Rating Development As Perceived By OthersPerformance Leadership Visionary Leadership
Drive for ResultsTechnological LeadershipFinancial LeadershipCross-Functional LeadershipDepth of Industry KnowledgePolitical LeadershipStrategic Problem AnalysisDecision Making
Change Leadership Entrepreneurial LeadershipDriving Strategic DirectionDriving Change
Interpersonal Leadership Building Strategic RelationshipsEmpowering OthersTeam BuildingInterpersonal EffectivenessCommunication/ PresentationInfluence/NegotiationCoaching/Talent Development
Personal Leadership Self-DevelopmentAdaptability/FlexibilityEngenders Trust
Envisia LearningReport for Sally Sample
EXECUTIVEVIEW360Feb 13 2015 57
Development Planning Guide Continued
Focusing On Development
List three scale strengths based upon your ExecutiveView360 results below:
1.
2.
3.
List three possible development scales based upon your ExecutiveView360 results below:
1.
2.
3.
Developing skills can be challenging because it almost always means replacing current behavior with a new pattern of behavior. This is not easy! Theaction planning process helps to increase your success. Research shows that desired change is more likely to be successful when:
The desired skills and behaviors are specifically definedThere is commitment and motivation to changeAn action plan is developed and shared with othersAn analysis is made of reasons for lack of successOther people support the change in observable waysThe outcomes are visible and can be measured

Envisia LearningReport for Sally Sample
EXECUTIVEVIEW360Feb 13 2015 58
Development Planning Guide Continued
The action plan worksheet on the next page will assist you at developing the skills you have identified based on the results of your ExecutiveView360Questionnaire. As you begin work on your action plan, consider the following:
Focus on a single specific skill or skill areaUse the recommendations in your report as a basis for your planKeep your plan simple and put it in writingDefine how you will monitor and evaluate progress

Envisia LearningReport for Sally Sample
EXECUTIVEVIEW360Feb 13 2015 59
Development Planning Guide Continued
Competency:
Development Activities: Target Dates:
Support/Resources Required:
Measures of Success:
Results Achieved: