
Executive Summit Meeting. Executive Summit Agenda Opening Remarks Demystifying Six Sigma Deployment...
51
Executive Summit Meeting
-
Upload
corey-wheeler -
Category
Documents
-
view
216 -
download
2
Transcript of Executive Summit Meeting. Executive Summit Agenda Opening Remarks Demystifying Six Sigma Deployment...

Executive Summit Meeting

Executive Summit Agenda
• Opening Remarks
• Demystifying Six Sigma
• Deployment Structure
• Timeline and Milestone Review
• Functional Roles
- Finance Strategy
- Human Resources Strategy
- Communications Strategy

Opening Remarks
Opening Remarks
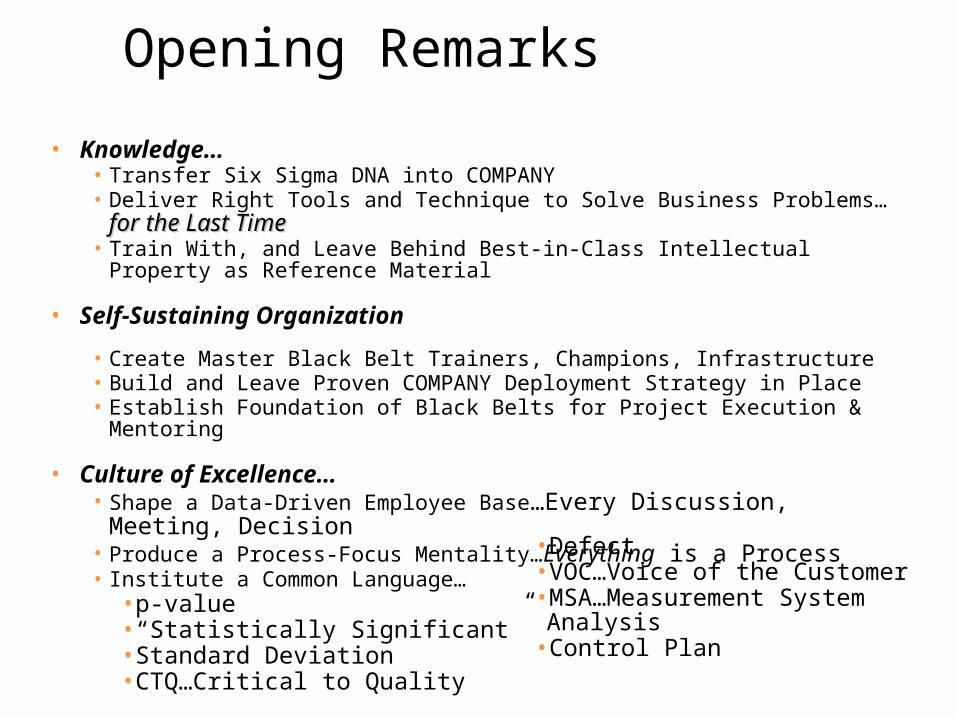
• Knowledge…• Transfer Six Sigma DNA into COMPANY• Deliver Right Tools and Technique to Solve Business Problems… for the Last for the Last
TimeTime• Train With, and Leave Behind Best-in-Class Intellectual Property as Reference
Material
• Self-Sustaining Organization
• Create Master Black Belt Trainers, Champions, Infrastructure• Build and Leave Proven COMPANY Deployment Strategy in Place• Establish Foundation of Black Belts for Project Execution & Mentoring
• Culture of Excellence…• Shape a Data-Driven Employee Base…Every Discussion, Meeting, Decision• Produce a Process-Focus Mentality…Everything is a Process• Institute a Common Language…
•p-value• “Statistically Significant”•Standard Deviation•CTQ…Critical to Quality
• Results…Results…Results
• Defect• VOC…Voice of the Customer• MSA…Measurement System Analysis
• Control Plan

Demystifying Six SigmaIntegrated Methodologies
Demystifying Six Sigma• Provide a basic understanding of key Six Sigma
concepts and terms
• Describe the major disciplines of the Six Sigma Strategy:– Process for Six Sigma (DMAIC with LEAN principles)– Design for Six Sigma (DFSS)
• Offer an overview of some of the Critical Concepts related to implementing Six Sigma principles and techniques

Six Sigma Defined
• Term is used interchangeably to represent: – Vision, Management Philosophy, Management Strategy, Performance Metric,
Benchmark, Statistical Tool Suite, Measure of Variation and a Goal
• In its most basic form, Six Sigma is a metric– Represents 3.4 defects per million opportunities for defects– A defect can be any missed target or nonconformance to standard– This perspective is related to a single opportunity for defect, or a single “critical
to quality” characteristic (CTQ)
• In its most elevated form, Six Sigma is a management strategy– A strategic and tactical system for managing the total business enterprise using
customer data– Enables an organization to improve to the highest possible level of quality
Why Six Sigma Is Different • IT IS NOT:
Just a “quality” program
• IT IS: A common improvement methodology to effect the business as a whole A business process improvement methodology that enables
breakthrough improvements Focused on strategic business priorities Fact-based decision making Focused on minimizing waste and variation Dedicated resources with clear accountability Narrowly scoped projects Quantified project benefits (>$250K) Demonstrated track record of success across industries

The Goal: Breakthrough
Time
De
fect
s a
nd U
nn
ece
ssar
y S
tep
s Six SigmaBreakthrough
Current State
Future State
Improvement Period

The Roles
• Provides executive oversight for all Six Sigma activities
• Controls resources within the functional group
• Drives the Six Sigma initiative
• Owns the Six Sigma Project• Leads Project Team• Reports progress to Project
Champion
• 3-5 Process Experts
• Time commitment as needed
• Supplemental on the ground project resources
• Deployment Support• DMAIC Instruction• DMAIC Mentoring
• Owns project cluster• Breaks down barriers
that prevent project progress
• Review projects• Drives projects to
completion
FunctionalChampion
FunctionalChampion
Team Members
Team Members
Project Champion
Project Champion PSMGPSMG
BlackBelt
BlackBelt

• Customer Centric: View all products, processes and services from customer’s perspective rather than operational efficiency.
• COPQ: Total direct and indirect costs of all issues or problems associated with a process.
• Critical To Quality (CTQ): Customer performance requirement for product or service.
• Defect: Anything that fails to satisfy a customer requirement or internal standard.
• Defect Opportunity: Measurable event that may not meet customer expectation or meet internal standard.
Six Sigma Terminology
“When you can measure what you are speaking about, and express it in numbers, you know something about it; but when you cannot measure it,
when you cannot express it in numbers, your knowledge is of a meager and unsatisfactory kind ….”
Lord Kelvin, British Physicist
Hidden Office: Ad hoc systems that are set up to correct errors made at steps in a process.
Minimize Variance: Reduce variations in process quality.
Process: Group of activities that take inputs, add value and provide an output to customers.
Rolled Throughput Yield: The product of the defect free yield percentage across all steps in a process.
Yield: The percentage of defect free units at single step in a process.
Voice Of Customer: Any feedback received, via formal or informal means, from customers regarding company processes.

Cost of Poor Quality & Sigma
Cost of Poor Quality PPM Sigma Level
30-40% revenue 308,537 2σ
20-30% revenue 66,807 3σ
15-20% revenue 6,210 4σ
10-15% revenue 233 5σ
less than 10% revenue 3.4 6σ
Non-competitive
Industry average
World class

Quality Changes Behaviors
3 4 5 6Sigma Scale of
Measure
Restaurant BillsDoctor Prescription Writing
Payroll ProcessingOrder Write-up
Wire TransfersAirline Baggage Handling
IRS - Tax Advice (phone-in)
(140,000 PPM)
Best-in-Class
Average Company
Industry Six Sigma Levels

If you played 100 rounds of golf per year, and played at:
2 sigma - you'd miss 6 putts per round 3 sigma - you'd miss 1 putt per round 4 sigma - you'd miss 1 putt every 9 rounds 5 sigma - you'd miss 1 putt every 2.33 years 6 sigma - you'd miss 1 putt every 163 years!
Understanding the Differences

The Breakthrough Strategy
Executives
Managers
Employees
Improve market share, Improve market share, increase profitability, increase profitability,
and ensure the and ensure the corporation’s long-term corporation’s long-term
viabilityviability
Improve yield, eliminate Improve yield, eliminate rework, and reduce rework, and reduce
labor and technology labor and technology costscosts
Create Vision,Create Vision,Strategy andStrategy andCommitment Commitment
Reduce waste, Reduce waste, defects, variation defects, variation
and improve and improve capabilitiescapabilities
Prioritization - Focus - Accountability - Reward
Metrics developed Metrics developed to manage key to manage key drivers of the drivers of the
businessbusiness
Empower A-Empower A-Players to “get the Players to “get the
job done”job done”
Voice of the Customer Voice of the Customer

Six Sigma – Integration
EliminateUnnecessary
Steps
ReduceVariability
Design Variability
Out
• Operational Excellence
• Cost Management• Increased
Profitability• Superior
Customer Service• Growth
Results
Design to Customer
Requirements
DMAIC(with LEAN Principles)
Design For Six Sigma
(IDOV Methodology)
Voice Of The Customer (VOC) Data Is Fundamental To The Six Sigma Methodology

DMAIC – Lean Principles
Identifying Waste And Making It Visible Is The First Step
DMAIC/Lean techniques are used to reduce unnecessary steps, eliminate rework, save time, save cost and extend capacity of valuable resources
Elimination of Unnecessary Steps

DMAIC – Lean Principles
• Specify the value of the process
• Identify the value stream for each process
• Allow value to flow without interruptions
• Let the customer pull value from the process
• Continuously pursue perfection

DMAIC – Variation Reduction
Typically A Few Process Input Variables Have An Extraordinary Influence On The Process Output
The basic premise of variation reduction is that sources of variation can be:
• Identified
• Quantified
• Eliminated or controlled
Managing Process Inputs …

DMAIC – Variation Example
• Example 1: Average time to approve is 45, with high variation resulting in most policies approved between 35 and 55 days
• Example 2: Average time to approve is 45, with little variation resulting in policies approved in no more than 47 days
Average Tells Little About The Customer Experience
Output Variation
Application Approval Process Example
30 45 60
Mean
Example #1
Example #2
Days
* Represents fabricated example* Represents fabricated example
**

DMAIC – Process Entitlement
• Shift overall performance to Entitlement, driving dramatic short-term improvements in cost and quality with minimal investment
• Only after the Entitlement is achieved should investment be made to redesign the process
MeanEntitlementPerformance
Shift
Upper Specification Limit
Output Variation 30 45 60
Days
* * Represents fabricated exampleRepresents fabricated example* * Represents fabricated exampleRepresents fabricated example
Application Approval Process Example **

DMAIC Methodology Obtain customer requirements Clearly scoped projects (aligned to
business strategy)Define
Mistake proof the solution Standardize process
Control
Validate the solution design Validate and pilot solution Implement improvement plan
Improve
Identify and quantify root causes Establish improvement targets
Analyze
Quantify process performance Calculate sigma level Measurement Systems Analysis
Measure
ANALYZE
MEASURE
DEFINE
CONTROL
IMPROVE
IDENTIFIED PROJECTS
STANDARDIZE / INSTITUTIONALIZE
DMAIC: Define, Measure, Analyze, Improve & Control
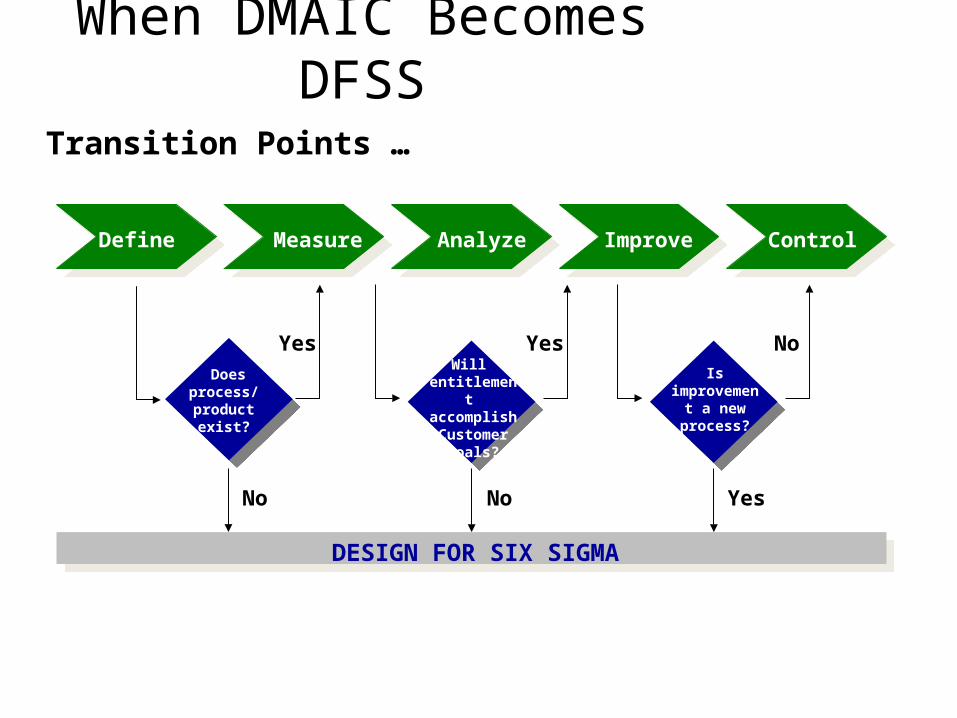
When DMAIC Becomes DFSS
AnalyzeMeasure Improve ControlDefine
DESIGN FOR SIX SIGMA
Doesprocess/ product exist?
No
Yes
No
Will entitlement accomplish
Customer goals?
Yes
Yes
Is improvemen
t a new process?
No
Transition Points …

Design For Six Sigma - Growth
Integrate Customer And Business Needs And Wants Before Launching Products And Services
• Approach for understanding and translating customer requirements for new products and services
• Customer is involved at each stage
• Avoid developing services with no market
Goal – design products, services, and processes that satisfy both customer and business needs at the highest level of quality possible
Design For Six Sigma …

DFSS Methodology
Identify• Obtain customers’ requirements• Conduct competitive benchmarking
Design• Define the functional requirements• Define the design requirements
• Confirm customers’ requirements are met• Implement new designValidate
• Develop detailed design• Predict design performance, Y=ƒ(x)Optimize
Demystifying Six SigmaCritical Concepts
Six Sigma Concepts
• Six Sigma Alignment Approach
• Measurement Systems
• Problem Solving with Statistics
• Instituting Process Controls

Six Sigma Alignment Approach

Alignment Approach
1. Confirm Strategic Goals2. Determine Project Clusters (Key Drivers of Goals)3. Define Y=f(x) Relationships4. Cascade Relationship to a Project Level5. Conduct Six Sigma Projects6. Realize Project Results7. Roll-up Process Metrics to Management
Dashboards8. Manage Business based on Dashboards

1. Confirm Strategic Goals
• Revenue Growth
• Operating Income
• Cash
• Customer Satisfaction

2. Determine Project Clusters
• Project Clusters are large-scale issues within the organization that have:– Levels of complexity which allow the issue to be
broken into smaller pieces– A measurable financial impact– Potential for long-term customer and company
benefit– Metrics which can roll up into dashboard-level
measures of process performance

3. Define Y=f(x) Relationships
• Identify the key drivers of obtaining desired performance within the Project Cluster
• Depict as Y=f(X)
Y=f(X1, X2, X3 … Xn)
Measurable Output
Key Performance Drivers
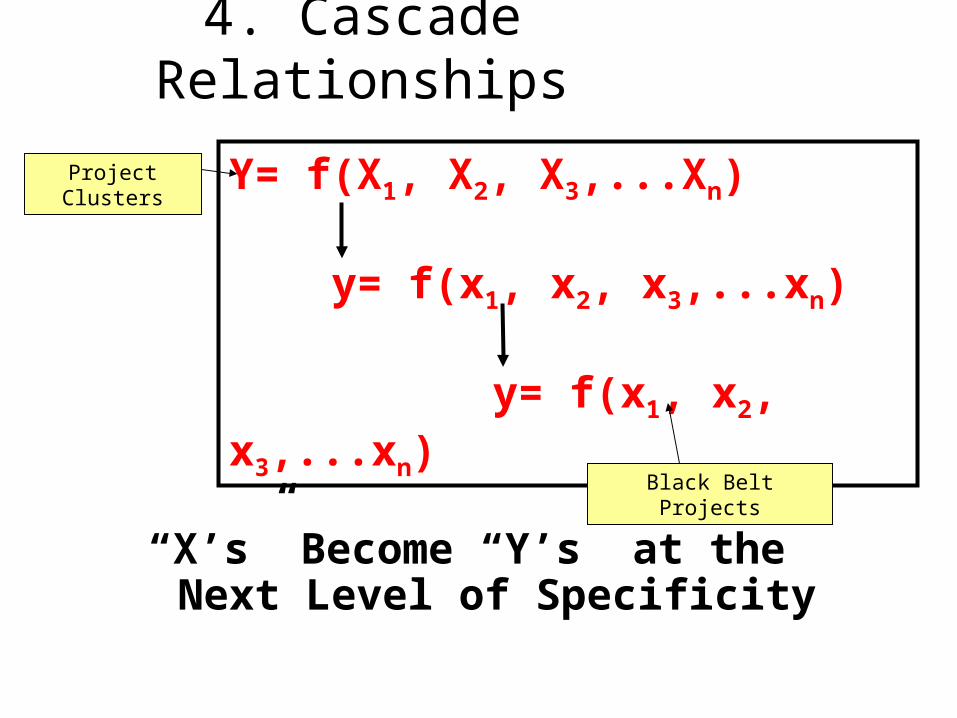
4. Cascade Relationships
Y= f(X1, X2, X3,...Xn)
y= f(x1, x2, x3,...xn)
y= f(x1, x2, x3,...xn)
“X’s” Become “Y’s” at the Next Level of Specificity
Project Clusters
Black Belt Projects

5. Conduct Six Sigma Projects
DMAIC – Improving Process Performance
Off-Target Variation
On-Target
CenterProcess
Reduce Spread
X XXX
XXXXX
XX
X X
X
X
X
XX
X
X
XXX
XX
XXXX
XXXXXXXX

6. Realize Project Results
• Closed Projects
• Validated performance of process improvement
• Control mechanisms in place for sustaining process improvements
• Process Owners are accountable for controlling and sustaining process improvements
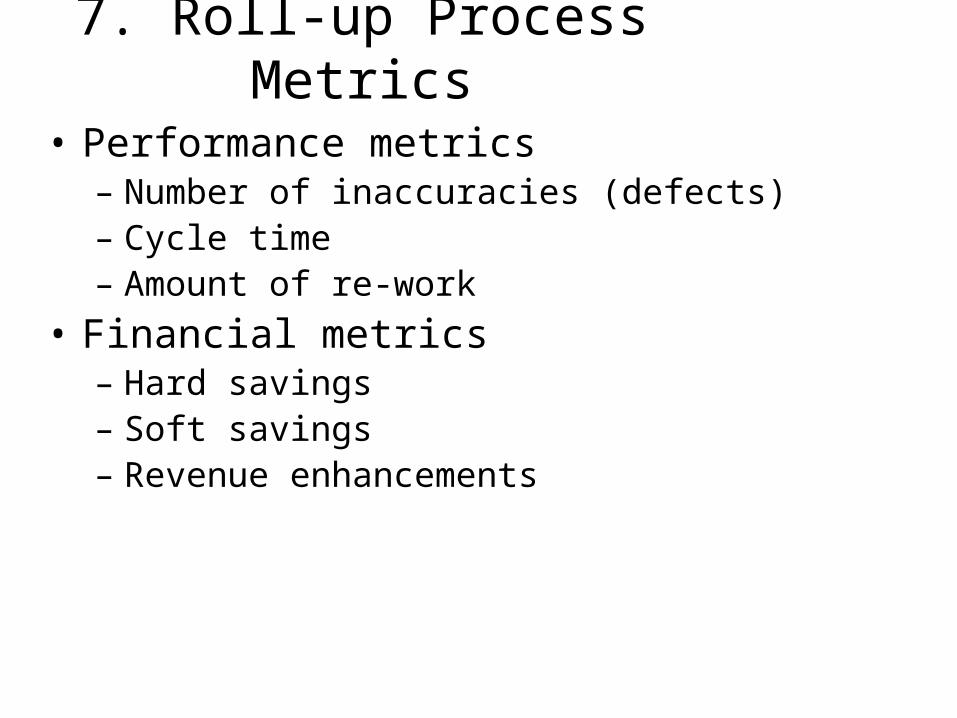
7. Roll-up Process Metrics
• Performance metrics– Number of inaccuracies (defects)– Cycle time– Amount of re-work
• Financial metrics– Hard savings – Soft savings – Revenue enhancements

8. Manage by Dashboards
• Performance of all key sub-level processes are aligned to Project Clusters and rolled up to show performance against business goals
• Process performance metrics are maintained and tracked continuously
• Dashboards provide the managers of high performing companies line-of-sight visibility to performance against business goals, and the capability to drill down to process level performance as needed
Executives
Managers
Employees
Improve market share, Improve market share, increase profitability, and increase profitability, and ensure the corporationensure the corporation’’s s
longlong--term viabilityterm viability
Improve yield, eliminate Improve yield, eliminate rework, and reduce labor rework, and reduce labor
and technology costsand technology costs
Create Vision,Create Vision,Strategy andStrategy andCommitment Commitment
Reduce waste, Reduce waste, defects, variation and defects, variation and improve capabilitiesimprove capabilities
Prioritization - Focus - Accountability - Reward
Metrics developed to Metrics developed to manage key drivers manage key drivers
of the businessof the business
Empower AEmpower A--Players Players to to ““get the job doneget the job done””
Voice of the Customer Voice of the Customer

Measurement Systems

Measurement Systems
+Actual(Par t)2
=
Process Variability(Actual variability)
Meas. System2
Observed(Total)
2
Process A
Process B
Total Variability(Observed variability)
MeasurementVariability
• Observed process variation is made up of:– Variation in the process– Variation in the measurement system

Measurement Systems
• Measurement data is flawed when:
– The right things are not being measured
– The right things are not being measured correctly
OR

Measurement Systems• How organizations typically view measurement systems:
– Our data does not show us the real picture• We measure “days outstanding” by invoice, but not by customer• We know how many people are in the process, but we don’t know how
the level of productivity• We know who is not paying their invoices, but we don’t know why they
are not paying
– We do not have confidence in the data we have• Order to delivery data does not account for the fours days that the order
sits in the sales person’s briefcase• Defect data shows customer complaints, but not the number of times we
fix the order before it reaches the customer• Call center data shows average wait time, but does not include time
spent on hold after a representative has answered the call

Measurement Systems
• Applying Six Sigma to measurement systems:
– Getting the real picture• Ensuring measurements reflect Voice Of the Customer • Measuring the Xs and monitoring the Ys• Aligning measurements to key business objectives• Establishing measurement systems to fill gaps in the data
– Validating the measurement data• Conducting a Measurement System Analysis
– Ensuring a common definition of the defect– Validating that measurements are taken the same way every time– Determining the acceptable level of measurement system variation
• Establishing a process to maintain the measurement system over time

Problem Solving With Statistics

Problem Solving w/ Statistics
• How organizations typically view problem solving:
– If we hire smart people and allow them institute some changes, our problems will be solved
– Every time we solve one problem a new one pops up and we are never able to get the whole thing right
– It seems like we solve the same problem every few years, but we never are able to sustain the improvement
– We have spent a fair amount over the years implementing one great idea after another and none have ever met their original expectations

Problem Solving w/ Statistics
• Six Sigma techniques:
– Determine key drivers of process output at a task level
• Y=f(X1, X2, X3 …Xn) where the Xs are measurable process input and the Y is a measurable process output
– Develop and/or validate performance measurements for the key drivers of process output
– Use statistical tools to understand which of the drivers have a statistically significant impact on the process
– Optimize the performance of statistically significant drivers
– Apply process controls to ensure that performance remains at the optimal level

Project Example
1. Confirm Strategic Goals• For the current fiscal year, senior management has
indicated the following goals:– Organic revenue growth– Reduced costs– Increased customer satisfaction
• Interviews with functional leaders in the organization suggest the following as potential barriers to achieving corporate goals:– Sales closing ratios– Equipment delivery times– Back office inefficiencies

Project Example
2. Determine Project Clusters
• Project Cluster = Late Deliveries
• Description of Project Cluster Issue
– Customer feedback indicates that the amount of time it takes from ordering a piece of equipment until the equipment is installed in not acceptable.
– Available data suggests equipment deliver times are averaging 15 days from order to installation
– Management experience and intuition suggests that 15 days is not a good representation of true delivery times

Project Example
3. Define Y=f(X) Relationship
Late Deliveries Y= f(X, X , X,)
Sale
s O
rder
Del
ays
Fina
l Ass
embl
y
Del
ays
Ship
ping
Del
ays
Approximate annual costs associated with late deliveries:• Cancelled orders = $2.3mm• Expedited shipping = $0.8mm• Additional labor = $ ?

Project Example
3. Define Y=f(X) Relationship
Late Deliveries Y= f(X, X , X,)
Sale
s O
rder
Del
ays
Fina
l Ass
embl
y
Del
ays
Ship
ping
Del
ays
Does “Late Deliveries” align? Revenue Growth – Yes (constraint removal) Cost Saving – Yes ($3.1mm opportunity) Customer Satisfaction – Yes (significant dis-satisfier)
3 days = 20%
Order management data indicates: On average, final assembly begins 3 days after date on customer order On average, shipping is scheduled 5 days after final assembly begins On average, date on customer delivery receipt is 7 days after shipping is scheduled
5 days = 33%
7 days = 47%

Project Example
4. Cascade Relationships
Financial data suggests:• Black Belt project improvements
will produce benefits that represent a portion of the overall opportunity
• Project benefits will be approximated as part of the initial Project Charter and validated with greater specificity as project progresses
Fina
l A
ssem
bly
Del
ays
Ship
ping
Del
ays
Sale
s O
rder
Del
ays
Y = f(X, X , X,)Late Deliveries
Sele
ctin
g &
Sche
dulin
g
Logi
stic
s
Y = f(X, X , X,)Shipping Delays
3rd
Part
y
Logi
stic
sC
usto
mer
Ava
ilabi
lity
Pick
-up
Y = f(X, X , X,)3rd Party Logistics
Proc
essi
ng
Del
iver
y
Black Belt Project
½ day = 7%
½ day = 7%
6 days = 86%
1 day = 16%
1 day = 16%
4 days = 68%
3 days = 20%
7 days = 47%
5 days = 33%

Conduct Six Sigma ProjectsProj. No:
Name:
Problem Statement:
Project Objective:
Project Benefits:
Project Metric "Y":
Defect Definition:
Project Start Date (Signed-Off)
The average time for a 3rd Party Logistics Provider to process outbound shipments to customers is four days. This contributes to an overall average time from order to installation of 15 days. The average of 15 days from order to installation is not meeting customer expectations which leads to expedited shipping cost, and cancelled orders. The total annual cost of Late Deliveries is estimated at $3.1mm.
To reduce 3rd Party Logisitics Provider's average processing time by 2.8 days from and average of 4 days to an average of 1.2 days without incurring additional costs.
Wednesday, June 11, 2003
Project Completion Date (Signed-Off)
Information Technology T. McKinney
Team Makeupe-Mail:
1) Estimated $840,000 in cancelled orders and expedited shipping costs; 2) Improved customer satisfaction
[email protected] Analyst
R. Stevenson
123-565-7714
Project Information Worksheet
Charter Creation Date
June 5,2003
Division / Loc./ Cost Ctr.:
Project Name: 0306-J-0037
Role:
111-555-1237D. DanfordMaster Black Belt
Phone:
Strategic Goals = Improved Customer Satisfaction, Reduced Costs; Big "Y" = Late Deliveries; 2nd Level "Y" = Shipping Delays; 3rd Level "Y" = 3rd Party Logistics
123-565-7801
123-565-7734
V. Lopez
[email protected] Belt
Six Sigma Project Charter
3rd Party Logistics - Processing
Process Owner
123-565-7721 [email protected]
3rd Party Logistics processing times in excess of 1.2 days.
Project Champion E. W. Strauss
X-ampleX-ampleX-ample
To begin the project the Black Belt needs an approved Project Charter
Proj. No./Name
ProjectBaseline Forecast Actual Forecast Actual
Baseline Period (Year, Qtr. Etc.) Jun-02
Cost Of Goods Sold:- Material - - - - - Direct Labor - - - - - Product Overhead - - - - Total COGS - - - - -
Salary & Benefits - Other than Direct Labor (detail):- Full-time Staff (#) - - - - - Full-time Staff ($) - - - - - Temporary Staff (#) - - - - - Temporary Staff ($) - - - - - Part-Time Staff Cost (#) - - - - - Part-Time Staff Cost ($) - - - - Total Salaries & Benefits - - - - -
Other Cost Categories: Project
Baseline Forecast Actual Forecast Actual- Scrap - - - - - Re-Work - - - - - Warranty - - - - - Freight/Shipping 240 168 - 168 - - Other COPQ - - - - Other Cost Category (List): - - - -
- - - - - - - - - - - - - -
Total Other Cost 240 168 - 168 -
Total Productivity Cost Savings 240 168 - 168 -
Project
Revenue Baseline Forecast Actual Forecast Actual- Increase from Volume 600 420 - 420 - - Increase from Price - - - - Total Revenue Increase 600 420 - 420 -
Profit (EBIT) Margin % 12% 0 - 0 - EBIT Impact 72 50 - 50 -
Project
Cash Flow Benefits Baseline Forecast Actual Forecast Actual- Accounts Receivable - - - - - Accounts Payable - - - - - Inventory - - - - - Payroll - - - - - Other (List):- ______________________ - - - - - ______________________ - - - - Total Cash Flow Increase - - - - - % EBIT Impact of Cash Flow 0% 0% 0% 0% 0%EBIT Impact (WACC) - - - - -
Year 1 Year 2
$(000's)
Year 1 Year 2
$(000's)
Year 1 Year 2
Cash Flow Benefits
Six Sigma Project Charter
$(000's)
Revenue Benefits
Year 1 Year 2
Productivity Benefits
0306-J-0037 / 3rd Party Logistics - Processing
X-ampleX-ampleX-ample