Executive Summary - NIST Big Data Working Group...
105
NIST Big Data General Requirements Version 0.1 Requirements & Use Cases Subgroup NIST Big Data Working Group (NBD-WG) September, 2013
Transcript of Executive Summary - NIST Big Data Working Group...
NIST Big Data General Requirements
Version 0.1
Requirements & Use Cases SubgroupNIST Big Data Working Group (NBD-WG)
September, 2013
ContentsExecutive Summary.....................................................................................................................................41 Introduction........................................................................................................................................4
1.1 Background...........................................................................................................................41.2 Objectives.............................................................................................................................5
1. Produce a working draft for Big Data General Requirements Document............................................51.3 How This Report Was Produced............................................................................................51.4 Structure of This Report........................................................................................................6
2 Use Case Summaries...........................................................................................................................72.1 Use Case Process...................................................................................................................72.2 Government Operation.........................................................................................................8
2.2.1 Census 2010 and 2000 – Title 13 Big Data............................................................82.2.2 National Archives and Records Administration Accession NARA, Search, Retrieve, Preservation...........................................................................................................82.2.3 Statistical Survey Response Improvement (Adaptive Design)..............................92.2.4 Non-Traditional Data in Statistical Survey Response Improvement (Adaptive Design) 9
2.3 Commercial...........................................................................................................................92.3.1 Cloud Eco-System, for Financial Industries (Banking, Securities & Investments, Insurance) transacting business within the United States.....................................................92.3.2 Mendeley – An International Network of Research...........................................102.3.3 Netflix Movie Service..........................................................................................102.3.4 Web Search........................................................................................................112.3.5 IaaS (Infrastructure as a Service) Big Data Business Continuity & Disaster Recovery (BC/DR) Within a Cloud Eco-System....................................................................112.3.6 Cargo Shipping...................................................................................................122.3.7 Materials Data for Manufacturing......................................................................122.3.8 Simulation driven Materials Genomics...............................................................13
2.4 Defense...............................................................................................................................132.4.1 Cloud Large Scale Geospatial Analysis and Visualization....................................132.4.2 Object identification and tracking from Wide Area Large Format Imagery (WALF) Imagery or Full Motion Video (FMV) – Persistent Surveillance...............................142.4.3 Intelligence Data Processing and Analysis..........................................................14
2.5 Healthcare and Life Sciences...............................................................................................152.5.1 Electronic Medical Record (EMR) Data...............................................................152.5.2 Pathology Imaging/digital pathology..................................................................152.5.3 Computational Bioimaging.................................................................................162.5.4 Genomic Measurements....................................................................................162.5.5 Comparative analysis for metagenomes and genomes......................................172.5.6 Individualized Diabetes Management................................................................172.5.7 Statistical Relational Artificial Intelligence for Health Care................................182.5.8 World Population Scale Epidemiological Study..................................................182.5.9 Social Contagion Modeling for Planning, Public Health and Disaster Management.......................................................................................................................182.5.10 Biodiversity and LifeWatch.................................................................................19
2.6 Deep Learning and Social Media.........................................................................................192
2.6.1 Large-scale Deep Learning..................................................................................192.6.2 Organizing large-scale, unstructured collections of consumer photos...............202.6.3 Truthy: Information diffusion research from Twitter Data.................................202.6.4 Crowd Sourcing in the Humanities as Source for Big and Dynamic Data............212.6.5 CINET: Cyberinfrastructure for Network (Graph) Science and Analytics............212.6.6 NIST Information Access Division analytic technology performance measurement, evaluations, and standards.........................................................................22
2.7 The Ecosystem for Research...............................................................................................222.7.1 DataNet Federation Consortium DFC.................................................................222.7.2 The ‘Discinnet process’, metadata <-> big data global experiment....................232.7.3 Semantic Graph-search on Scientific Chemical and Text-based Data.................232.7.4 Light source beamlines.......................................................................................24
2.8 Astronomy and Physics.......................................................................................................252.8.1 Catalina Real-Time Transient Survey (CRTS): a digital, panoramic, synoptic sky survey 252.8.2 DOE Extreme Data from Cosmological Sky Survey and Simulations...................252.8.3 Large Survey Data for Cosmology.......................................................................262.8.4 Particle Physics: Analysis of LHC Large Hadron Collider Data: Discovery of Higgs particle 262.8.5 Belle II High Energy Physics Experiment.............................................................27
2.9 Earth, Environmental and Polar Science.............................................................................272.9.1 EISCAT 3D incoherent scatter radar system.......................................................272.9.2 ENVRI, Common Operations of Environmental Research Infrastructure...........282.9.3 Radar Data Analysis for CReSIS Remote Sensing of Ice Sheets...........................292.9.4 UAVSAR Data Processing, Data Product Delivery, and Data Services.................292.9.5 NASA LARC/GSFC iRODS Federation Testbed.....................................................302.9.6 MERRA Analytic Services MERRA/AS..................................................................302.9.7 Atmospheric Turbulence - Event Discovery and Predictive Analytics.................312.9.8 Climate Studies using the Community Earth System Model at DOE’s NERSC center 312.9.9 DOE-BER Subsurface Biogeochemistry Scientific Focus Area.............................322.9.10 DOE-BER AmeriFlux and FLUXNET Networks......................................................32
2.10 Energy.................................................................................................................................322.10.1 Consumption forecasting in Smart Grids............................................................32
2.11 Summary of Key Properties.................................................................................................332.12 Picture Book of Big Data Use Cases.....................................................................................40
3 Use Case Requirements....................................................................................................................503.1 General Requirements........................................................................................................503.2 Use Case Requirements Summary......................................................................................523.3 Transformation Requirements............................................................................................533.4 Resource Requirements......................................................................................................533.5 Data Usage Requirements...................................................................................................533.6 Security & Privacy Requirements........................................................................................533.7 Lifecycle Management Requirements.................................................................................533.8 System Management and Other Requirements..................................................................53
4 Conclusions and Recommendations.................................................................................................535 Reference..........................................................................................................................................54
3
Appendix A: Submitted Use Cases.............................................................................................................54
Executive Summary
1 Introduction
1.1 BackgroundThere is a broad agreement among commercial, academic, and government leaders about the remarkable potential of “Big Data” to spark innovation, fuel commerce, and drive progress. Big Data is the term used to describe the deluge of data in our networked, digitized, sensor-laden, information driven world. The availability of vast data resources carries the potential to answer questions previously out of reach. Questions like: How do we reliably detect a potential pandemic early enough to intervene? Can we predict new materials with advanced properties before these materials have ever been synthesized? How can we reverse the current advantage of the attacker over the defender in guarding against cybersecurity threats?
However there is also broad agreement on the ability of Big Data to overwhelm traditional approaches. The rate at which data volumes, speeds, and complexity are growing is outpacing scientific and technological advances in data analytics, management, transport, and more.
Despite the widespread agreement on the opportunities and current limitations of Big Data, a lack of consensus on some important, fundamental questions is confusing potential users and holding back progress. What are the attributes that define Big Data solutions? How is Big Data different from the traditional data environments and related applications that we have encountered thus far? What are the essential characteristics of Big Data environments? How do these environments integrate with currently deployed architectures? What are the central scientific, technological, and standardization challenges that need to be addressed to accelerate the deployment of robust Big Data solutions?
At the NIST Cloud and Big Data Forum held in January 15-17, 2013, the community strongly recommends NIST to create a public working group for the development of a Big Data Technology Roadmap. This roadmap will help to define and prioritize requirements for interoperability, portability, reusability, and extensibility for big data usage, analytic techniques and technology infrastructure in order to support secure and effective adoption of Big Data.
On June 19, 2013, the NIST Big Data Public Working Group (NBD-PWG) was launched with overwhelmingly participation from industry, academia, and government across the nation. The scope of the NBD-PWG is to form a community of interests from all sectors including industry, academia, and government, with the goal of developing a consensus in definitions, taxonomies, secure reference architectures, and a technology roadmap. Such a consensus would therefore create a vendor-neutral, technology and infrastructure agnostic framework which would enable Big Data stakeholders to pick-
4
and-choose best analytics tools for their processing and visualization requirements on the most suitable computing platform and cluster while allowing value-added from Big Data service providers.
Currently NBD-PWG has created five subgroups namely the Definitions and Taxonomies, Use Case and Requirements, Security and Privacy, Reference Architecture, and Technology Roadmap. These subgroups will help to develop the following set of preliminary consensus working drafts by September 27, 2013:
1. Big Data Definitions2. Big Data Taxonomies 3. Big Data Requirements 4. Big Data Security and Privacy Requirements5. Big Data Reference Architectures White Paper Survey6. Big Data Reference Architectures7. Big Data Security and Privacy Reference Architectures8. Big Data Technology Roadmap
Due to time constraints and dependencies between subgroups, the NBD-PWG hosted two hours weekly telecon meeting from Mondays to Fridays for the respective subgroups. Every three weeks, NBD-PWG called a joint meeting for progress reports and document updates from these five subgroups. In between, subgroups co-chairs met for two hours to synchronize their respective activities and identify issues and solutions
1.2 Objectives
ScopeThe focus of the NBD-PWG Use Case and Requirements Subgroup is to form a community of interest from industry, academia, and government, with the goal of developing a consensus list of Big Data requirements across all stakeholders. This includes gathering and understanding various use cases from diversified application domains.
Tasks Gather input from all stakeholders regarding Big Data requirements. Analyze/prioritize a list of challenging general requirements that may delay or prevent
adoption of Big Data deployment Develop a comprehensive list of Big Data requirements
Deliverables1. Produce a working draft for Big Data General Requirements Document
1.3 How This Report Was ProducedThis report was produced by an open process involving weekly telephone conversations and exchange of information by the NIST document system. The 51 use cases came from participants in the calls and from others who were informed as to opportunity.
5
1.4 Structure of This ReportThe report describes 51 use cases in section 2 starting with a discussion of process that generated them. This section has a summary of each use case with three subsections: Application, Current Approach and Futures. This section is followed by one on the requirements extracted from them which are intended as input to the other working groups – especially the generic architecture. The use case template has 26 fields which are displayed in section 2.1. The use cases are divided into 9 broad areas as follows: Government Operation-4; Commercial-8; Defense-3; Healthcare and Life Sciences-10; Deep Learning and Social Media-6; The Ecosystem for Research-4; Astronomy and Physics-5; Earth, Environmental and Polar Science-10; Energy-1 where each area is followed by the number of associated use cases. Section 2.9 has a summary of 5 key features of the use cases: namely data volume, velocity and variety, software and data analytics. Section 2.12 gives a picture book of the use cases with a short overview of use cases with user contributed diagrams.
6

2 Use Case Summaries
2.1 Use Case ProcessThe initial discussion in working group produced a use case template recorded in Appendix A. It can surely be improved but has shown itself to be useful and keeping it fixed has obviously helped gather comparative information. In the following 9 subsections, we summarize the 51 use cases that filled in this template. Each of these use cases is uploaded to the NIST site http://bigdatawg.nist.gov/show_InputDoc.php and are note as members of uploaded list M00xy. The appendix has the raw data while section 2.11 summarizes 5 critical properties and section 2.12 gives a picture book of the use cases based on submitted images. The following subsections are divided into different categories of application domains based from the diversified submitted use cases. To have a better view of the requirements from each category, multiple similar big data applications are presented. Each big data application is presented with a high-level description along with its current practice and future desired computational environment.
2.2 Government Operation
2.2.1 Census 2010 and 2000 – Title 13 Big DataVivek Navale & Quyen Nguyen, NARA
Application: Preserve Census 2010 and 2000 – Title 13 data for a long term in order to provide access and perform analytics after 75 years. One must maintain data “as-is” with no access and no data analytics for 75 years; one must preserve the data at the bit-level; one must perform curation, which includes format transformation if necessary; one must provide access and analytics after nearly 75 years. Title 13 of U.S. code authorizes the Census Bureau and guarantees that individual and industry specific data is protected.
Current Approach: 380 terabytes of scanned documents
2.2.2 National Archives and Records Administration Accession NARA, Search, Retrieve, Preservation
Vivek Navale & Quyen Nguyen, NARA
Application: Accession, Search, Retrieval, and Long term Preservation of Government Data.
Current Approach: 1) Get physical and legal custody of the data; 2) Pre-process data for virus scan, identifying file format identification, removing empty files; 3) Index; 4) Categorize records (sensitive, unsensitive, privacy data, etc.); 5) Transform old file formats to modern formats (e.g. WordPerfect to PDF); 6) E-discovery; 7) Search and retrieve to respond to special request; 8) Search and retrieve of public records by public users. Currently 100’s of terabytes stored centrally in commercial databases supported by custom software and commercial search products.
7

Futures: There are distributed data sources from federal agencies where current solution requires transfer of those data to a centralized storage. In the future, those data sources may reside in multiple Cloud environments. In this case, physical custody should avoid transferring big data from Cloud to Cloud or from Cloud to Data Center.
2.2.3 Statistical Survey Response Improvement (Adaptive Design)Cavan Capps, U.S. Census Bureau
Application: Survey costs are increasing as survey response declines. The goal of this work is to use advanced “recommendation system techniques” that are open and scientifically objective, using data mashed up from several sources and historical survey para-data (administrative data about the survey) to drive operational processes in an effort to increase quality and reduce the cost of field surveys.
Current Approach: About a petabyte of data coming from surveys and other government administrative sources. Data can be streamed with approximately 150 million records transmitted as field data streamed continuously, during the decennial census. All data must be both confidential and secure. All processes must be auditable for security and confidentiality as required by various legal statutes. Data quality should be high and statistically checked for accuracy and reliability throughout the collection process. Use Hadoop, Spark, Hive, R, SAS, Mahout, Allegrograph, MySQL, Oracle, Storm, BigMemory, Cassandra, Pig software.
Futures: Need to improve recommendation systems similar to those used in e-commerce (see Netflix use case) that reduce costs and improve quality while providing confidentiality safeguards that are reliable and publically auditable. Data visualization is useful for data review, operational activity and general analysis. It continues to evolve; mobile access important.
2.2.4 Non-Traditional Data in Statistical Survey Response Improvement (Adaptive Design)Cavan Capps, U.S. Census Bureau
Application: Survey costs are increasing as survey response declines. This use case has similar goals to that above but involves non-traditional commercial and public data sources from the web, wireless communication, electronic transactions mashed up analytically with traditional surveys to improve statistics for small area geographies, new measures and to improve the timeliness of released statistics.
Current Approach: Integrate survey data, other government administrative data, web scrapped data, wireless data, e-transaction data, potentially social media data and positioning data from various sources. Software, Visualization and data characteristics similar to previous use case.
Futures: Analytics needs to be developed which give statistical estimations that provide more detail, on a more near real time basis for less cost. The reliability of estimated statistics from such “mashed up” sources still must be evaluated.
8
2.3 Commercial
2.3.1 Cloud Eco-System, for Financial Industries (Banking, Securities & Investments, Insurance) transacting business within the United States
Pw Carey, Compliance Partners, LLC
Application: Use of Cloud (Bigdata) technologies needs to be extended in Financial Industries (Banking, Securities & Investments, Insurance).
Current Approach: Currently within Financial Industry, Bigdata and Hadoop are used for fraud detection, risk analysis and assessments as well as improving the organizations knowledge and understanding of the customers. At the same time, the traditional client/server/data warehouse/RDBM (Relational Database Management) systems are used for the handling, processing, storage and archival of the entities financial data. Real time data and analysis important in these applications.
Futures: One must address Security and privacy and regulation such as SEC mandated use of XBRL (extensible Business Related Markup Language) and examine other cloud functions in the Financial industry.
2.3.2 Mendeley – An International Network of ResearchWilliam Gunn, Mendeley
Application: Mendeley has built a database of research documents and facilitates the creation of shared bibliographies. Mendeley uses the information collected about research reading patterns and other activities conducted via the software to build more efficient literature discovery and analysis tools. Text mining and classification systems enables automatic recommendation of relevant research, improving the cost and performance of research teams, particularly those engaged in curation of literature on a particular subject
Current Approach: Data size is 15TB presently, growing about 1 TB/month. Processing on Amazon Web Services with Hadoop, Scribe, Hive, Mahout, Python. Standard libraries for machine learning and analytics, Latent Dirichlet Allocation, custom built reporting tools for aggregating readership and social activities per document.
Futures: Currently Hadoop batch jobs are scheduled daily, but work has begun on real-time recommendation. The database contains ~400M documents, roughly 80M unique documents, and receives 5-700k new uploads on a weekday. Thus a major challenge is clustering matching documents together in a computationally efficient way (scalable and parallelized) when they’re uploaded from different sources and have been slightly modified via third-part annotation tools or publisher watermarks and cover pages.
2.3.3 Netflix Movie ServiceGeoffrey Fox, Indiana University
9
Application: Allow streaming of user selected movies to satisfy multiple objectives (for different stakeholders) -- especially retaining subscribers. Find best possible ordering of a set of videos for a user (household) within a given context in real-time; maximize movie consumption. Digital movies stored in cloud with metadata; user profiles and rankings for small fraction of movies for each user. Use multiple criteria – content based recommender system; user-based recommender system; diversity. Refine algorithms continuously with A/B testing.
Current Approach: Recommender systems and streaming video delivery are core Netflix technologies. Recommender systems are always personalized and use logistic/linear regression, elastic nets, matrix factorization, clustering, latent Dirichlet allocation, association rules, gradient boosted decision trees and others. Winner of Netflix competition (to improve ratings by 10%) combined over 100 different algorithms. Uses SQL, NoSQL, MapReduce on Amazon Web Services. Netflix recommender systems have features in common to e-commerce like Amazon. Streaming video has features in common with other content providing services like iTunes, Google Play, Pandora and Last.fm.
Futures: Very competitive business. Need to aware of other companies and trends in both content (which Movies are hot) and technology. Need to investigate new business initiatives such as Netflix sponsored content
2.3.4 Web SearchGeoffrey Fox, Indiana University
Application: Return in ~0.1 seconds, the results of a search based on average of 3 words; important to maximize quantities like “precision@10” or number of great responses in top 10 ranked results.
Current Approach: Steps include 1) Crawl the web; 2) Pre-process data to get searchable things (words, positions); 3) Form Inverted Index mapping words to documents; 4) Rank relevance of documents: PageRank; 5) Lots of technology for advertising, “reverse engineering ranking” “preventing reverse engineering”; 6) Clustering of documents into topics (as in Google News) 7) Update results efficiently. Modern clouds and technologies like MapReduce have been heavily influenced by this application. ~45B web pages total.
Futures: A very competitive field where continuous innovation needed. Two important areas are addressing mobile clients which are a growing fraction of users and increasing sophistication of responses and layout to maximize total benefit of clients, advertisers and Search Company. The “deep web” (that behind user interfaces to databases etc.) and multimedia search of increasing importance. 500M photos uploaded each day and 100 hours of video uploaded to YouTube each minute.
2.3.5 IaaS (Infrastructure as a Service) Big Data Business Continuity & Disaster Recovery (BC/DR) Within a Cloud Eco-System
Pw Carey, Compliance Partners, LLC
Application: BC/DR (Business Continuity/Disaster Recovery) needs to consider the role that the following four overlaying and inter-dependent forces will play in ensuring a workable solution to an
10
entity's business continuity plan and requisite disaster recovery strategy. The four areas are; people (resources), processes (time/cost/ROI), technology (various operating systems, platforms and footprints) and governance (subject to various and multiple regulatory agencies).
Current Approach: Cloud Eco-systems, incorporating IaaS (Infrastructure as a Service), supported by Tier 3 Data Centers provide data replication services. Replication is different from Backup and only moves the changes since the last time a replication occurs, including block level changes. The replication can be done quickly, with a five second window, while the data is replicated every four hours. This data snap shot is retained for seven business days, or longer if necessary. Replicated data can be moved to a Fail-over Center to satisfy an organizations RPO (Recovery Point Objectives) and RTO (Recovery Time Objectives). Technologies from VMware, NetApps, Oracle, IBM, Brocade are some of those relevant. Data sizes are terabytes up to petabytes
Futures: The complexities associated with migrating from a Primary Site to either a Replication Site or a Backup Site is not fully automated at this point in time. The goal is to enable the user to automatically initiate the Fail Over sequence. Both organizations must know which servers have to be restored and what are the dependencies and inter-dependencies between the Primary Site servers and Replication and/or Backup Site servers. This requires a continuous monitoring of both.
2.3.6 Cargo ShippingWilliam Miller, MaCT USA
Application: Monitoring and tracking of cargo as in Fedex, UPS and DHL.
Current Approach: Today the information is updated only when the items that were checked with a bar code scanner are sent to the central server. The location is not currently displayed in real-time. An architectural diagram is figure 1 of section 2.12.
Futures: This Internet of Things application needs to track items in real time. A new aspect will be status condition of the items which will include sensor information, GPS coordinates, and a unique identification schema based upon a new ISO 29161 standards under development within ISO JTC1 SC31 WG2.
2.3.7 Materials Data for ManufacturingJohn Rumble, R&R Data Services
Application: Every physical product is made from a material that has been selected for its properties, cost, and availability. This translates into hundreds of billion dollars of material decisions made every year. However the adoption of new materials normally takes decades (two to three) rather than a small number of years, in part because data on new materials is not easily available. One needs to broaden accessibility, quality, and usability and overcome proprietary barriers to sharing materials data. One must create sufficiently large repositories of materials data to support discovery.
11

Current Approach: Currently decisions about materials usage are unnecessarily conservative, often based on older rather than newer materials R&D data, and not taking advantage of advances in modeling and simulations.
Futures: Materials informatics is an area in which the new tools of data science can have major impact by predicting the performance of real materials (gram to ton quantities) starting at the atomistic, nanometer, and/or micrometer level of description. One must establish materials data repositories beyond the existing ones that focus on fundamental data; one must develop internationally-accepted data recording standards that can be used by a very diverse materials community, including developers materials test standards (such as ASTM and ISO), testing companies, materials producers, and R&D labs; one needs tools and procedures to help organizations wishing to deposit proprietary materials in data repositories to mask proprietary information, yet to maintain the usability of data; one needs multi-variable materials data visualization tools, in which the number of variables can be quite high.
2.3.8 Simulation driven Materials GenomicsDavid Skinner, LBNL
Application: Innovation of battery technologies through massive simulations spanning wide spaces of possible design. Systematic computational studies of innovation possibilities in photovoltaics. Rational design of materials based on search and simulation. These require management of simulation results contributing to the materials genome.
Current Approach: PyMatGen, FireWorks, VASP, ABINIT, NWChem, BerkeleyGW, and varied materials community codes running on large supercomputers such as 150K core Hopper machine at NERSC produce results that are not synthesized.
Futures: Need large scale computing at scale for simulation science. Flexible data methods at scale for messy data. Machine learning and knowledge systems that integrate data from publications, experiments, and simulations to advance goal-driven thinking in materials design. The current 100TB of data will become 500TB in 5 years.
2.4 Defense
2.4.1 Cloud Large Scale Geospatial Analysis and VisualizationDavid Boyd, Data Tactics
Application: Need to support large scale geospatial data analysis and visualization. As the number of geospatially aware sensors increase and the number of geospatially tagged data sources increases the volume geospatial data requiring complex analysis and visualization is growing exponentially.
Current Approach: Traditional GIS systems are generally capable of analyzing a millions of objects and easily visualizing thousands. Data types include Imagery (various formats such as NITF, GeoTiff, CADRG), and vector with various formats like shape files, KML, text streams. Object types include points, lines, areas, polylines, circles, ellipses. Data accuracy very important with image registration and sensor
12
accuracy relevant. Analytics include closest point of approach, deviation from route, and point density over time, PCA and ICA. Software includes Server with Geospatially enabled RDBMS, Geospatial server/analysis software – ESRI ArcServer, Geoserver; Visualization by ArcMap or browser based visualization.
Futures: Today’s intelligence systems often contain trillions of geospatial objects and need to be able to visualize and interact with millions of objects. Critical issues are Indexing, retrieval and distributed analysis; Visualization generation and transmission; Visualization of data at the end of low bandwidth wireless connections; Data is sensitive and must be completely secure in transit and at rest (particularly on handhelds); Geospatial data requires unique approaches to indexing and distributed analysis.
2.4.2 Object identification and tracking from Wide Area Large Format Imagery (WALF) Imagery or Full Motion Video (FMV) – Persistent Surveillance
David Boyd, Data Tactics
Application: Persistent surveillance sensors can easily collect petabytes of imagery data in the space of a few hours. The data should be reduced to a set of geospatial object (points, tracks, etc.) which can easily be integrated with other data to form a common operational picture. Typical processing involves extracting and tracking entities (vehicles, people, packages) over time from the raw image data.
Current Approach: It is unfeasible for this data to be processed by humans for either alerting or tracking purposes. The data needs to be processed close to the sensor which is likely forward deployed since it is too large to be easily transmitted. Typical object extraction systems are currently small (1-20 node) GPU enhanced clusters. There are a wide range of custom software and tools including traditional RDBMS’s and display tools. Real time data obtained at FMV (Full Motion Video) – 30-60 frames per/sec at full color 1080P resolution or WALF (Wide Area Large Format) with 1-10 frames per/sec at 10Kx10K full color resolution. Visualization of extracted outputs will typically be as overlays on a geospatial (GIS) display. Analytics are basic object detection analytics and integration with sophisticated situation awareness tools with data fusion. Significant security issues so that sources and methods cannot be compromised so the enemy should not be able to know what we see
Futures: Typical problem is integration of this processing into a large (GPU) cluster capable of processing data from several sensors in parallel and in near real time. Transmission of data from sensor to system is also a major challenge.
2.4.3 Intelligence Data Processing and AnalysisDavid Boyd, Data Tactics
Application: Allow Intelligence Analysts to a) Identify relationships between entities (people, organizations, places, equipment) b) Spot trends in sentiment or intent for either general population or leadership group (state, non-state actors) c) Find location of and possibly timing of hostile actions (including implantation of IEDs) d) Track the location and actions of (potentially) hostile actors e) Ability to reason against and derive knowledge from diverse, disconnected, and frequently unstructured (e.g.
13
text) data sources f) Ability to process data close to the point of collection and allow data to be shared easily to/from individual soldiers, forward deployed units, and senior leadership in garrison.
Current Approach: Software includes Hadoop, Accumulo (Big Table), Solr, Natural Language Processing, Puppet (for deployment and security) and Storm running on medium size clusters. Data size in 10s of Terabytes to 100s of Petabytes with Imagery intelligence device gathering petabyte in a few hours. Dismounted warfighters would have at most 1-100s of Gigabytes (typically handheld data storage).
Futures: Data currently exists in disparate silos which must be accessible through a semantically integrated data space. Wide variety of data types, sources, structures, and quality which will span domains and requires integrated search and reasoning. Most critical data is either unstructured or imagery/video which requires significant processing to extract entities and information. Network quality, Provenance and security essential.
2.5 Healthcare and Life Sciences
2.5.1 Electronic Medical Record (EMR) DataShaun Grannis, Indiana University
Application: Large national initiatives around health data are emerging, and include developing a digital learning health care system to support increasingly evidence-based clinical decisions with timely accurate and up-to-date patient-centered clinical information; using electronic observational clinical data to efficiently and rapidly translate scientific discoveries into effective clinical treatments; and electronically sharing integrated health data to improve healthcare process efficiency and outcomes. These key initiatives all rely on high-quality, large-scale, standardized and aggregate health data. One needs advanced methods for normalizing patient, provider, facility and clinical concept identification within and among separate health care organizations to enhance models for defining and extracting clinical phenotypes from non-standard discrete and free-text clinical data using feature selection, information retrieval and machine learning decision-models. One must leverage clinical phenotype data to support cohort selection, clinical outcomes research, and clinical decision support.
Current Approach: Clinical data from more than 1,100 discrete logical, operational healthcare sources in the Indiana Network for Patient Care (INPC) the nation's largest and longest-running health information exchange. This describes more than 12 million patients, more than 4 billion discrete clinical observations. > 20 TB raw data. Between 500,000 and 1.5 million new real-time clinical transactions added per day.
Futures: Teradata, PostgreSQL, MongoDB running on Indiana University supercomputer supporting information retrieval methods to identify relevant clinical features (tf-idf, latent semantic analysis, mutual information). Natural Language Processing techniques to extract relevant clinical features. Validated features will be used to parameterize clinical phenotype decision models based on maximum likelihood estimators and Bayesian networks. Decision models will be used to identify a variety of clinical phenotypes such as diabetes, congestive heart failure, and pancreatic cancer.
14
2.5.2 Pathology Imaging/digital pathologyFusheng Wang, Emory University
Application: Digital pathology imaging is an emerging field where examination of high resolution images of tissue specimens enables novel and more effective ways for disease diagnosis. Pathology image analysis segments massive (millions per image) spatial objects such as nuclei and blood vessels, represented with their boundaries, along with many extracted image features from these objects. The derived information is used for many complex queries and analytics to support biomedical research and clinical diagnosis. Figure 2 of section 2.12 has examples of 2-D and 3-D pathology images.
Current Approach: 1GB raw image data + 1.5GB analytical results per 2D image. MPI for image analysis; MapReduce + Hive with spatial extension on supercomputers and clouds. GPU’s used effectively. Figure 3 of section 2.12 shows the architecture of Hadoop-GIS, a spatial data warehousing system over MapReduce to support spatial analytics for analytical pathology imaging.
Futures: Recently, 3D pathology imaging is made possible through 3D laser technologies or serially sectioning hundreds of tissue sections onto slides and scanning them into digital images. Segmenting 3D microanatomic objects from registered serial images could produce tens of millions of 3D objects from a single image. This provides a deep “map” of human tissues for next generation diagnosis. 1TB raw image data + 1TB analytical results per 3D image and 1PB data per moderated hospital per year.
2.5.3 Computational BioimagingDavid Skinner, Joaquin Correa, Daniela Ushizima, Joerg Meyer, LBNL
Application: Data delivered from bioimaging is increasingly automated, higher resolution, and multi-modal. This has created a data analysis bottleneck that, if resolved, can advance the biosciences discovery through Big Data techniques.
Current Approach: The current piecemeal analysis approach does not scale to situation where a single scan on emerging machines is 32TB and medical diagnostic imaging is annually around 70 PB excluding cardiology. One needs a web-based one-stop-shop for high performance, high throughput image processing for producers and consumers of models built on bio-imaging data.
Futures: Our goal is to solve that bottleneck with extreme scale computing with community-focused science gateways to support the application of massive data analysis toward massive imaging data sets. Workflow components include data acquisition, storage, enhancement, minimizing noise, segmentation of regions of interest, crowd-based selection and extraction of features, and object classification, and organization, and search. Use ImageJ, OMERO, VolRover, advanced segmentation and feature detection software.
2.5.4 Genomic MeasurementsJustin Zook, NIST
Application: NIST/Genome in a Bottle Consortium integrates data from multiple sequencing technologies and methods to develop highly confident characterization of whole human genomes as
15
reference materials, and develop methods to use these Reference Materials to assess performance of any genome sequencing run.
Current Approach: The storage of ~40TB NFS at NIST is full; there are also PBs of genomics data at NIH/NCBI. Use Open-source sequencing bioinformatics software from academic groups (UNIX-based) on a 72 core cluster at NIST supplemented by larger systems at collaborators.
Futures: DNA sequencers can generate ~300GB compressed data/day which volume has increased much faster than Moore’s Law. Future data could include other ‘omics’ measurements, which will be even larger than DNA sequencing. Clouds have been explored.
2.5.5 Comparative analysis for metagenomes and genomesErnest Szeto, LBNL (Joint Genome Institute)
Application: Given a metagenomic sample, (1) determine the community composition in terms of other reference isolate genomes, (2) characterize the function of its genes, (3) begin to infer possible functional pathways, (4) characterize similarity or dissimilarity with other metagenomic samples, (5) begin to characterize changes in community composition and function due to changes in environmental pressures, (6) isolate sub-sections of data based on quality measures and community composition.
Current Approach: integrated comparative analysis system for metagenomes and genomes, front ended by an interactive Web UI with core data, backend precomputations, batch job computation submission from the UI. Provide interface to standard bioinformatics tools (BLAST, HMMER, multiple alignment and phylogenetic tools, gene callers, sequence feature predictors…).
Futures: Management of heterogeneity of biological data is currently performed by relational database management system (Oracle). Unfortunately, it does not scale for even the current volume 50TB of data. NoSQL solutions aim at providing an alternative but unfortunately they do not always lend themselves to real time interactive use, rapid and parallel bulk loading, and sometimes have issues regarding robustness.
2.5.6 Individualized Diabetes ManagementYing Ding, Indiana University
Application: Diabetes is a growing illness in world population, affecting both developing and developed countries. Current management strategies do not adequately take into account of individual patient profiles, such as co-morbidities and medications, which are common in patients with chronic illnesses. Need to use advanced graph-based data mining techniques applied to EHR converted into a RDF graph, to search for Diabetes patients and extract their EHR data for outcome evaluation.
Current Approach: Typical patient data records composed of 100 controlled vocabulary values and 1000 continuous values. Most values have a timestamp. Need to change traditional paradigm of relational row-column lookup to semantic graph traversal.
16
Futures: Identify similar patients from a large Electronic Health Record (EHR) database, i.e. an individualized cohort, and evaluate their respective management outcomes to formulate most appropriate solution suited for a given patient with diabetes. Use efficient parallel retrieval algorithms, suitable for cloud or HPC, using open source Hbase with both indexed and custom search to identify patients of possible interest. Use Semantic Linking for Property Values method to convert an existing data warehouse at Mayo Clinic, called the Enterprise Data Trust (EDT), into RDF triples that enables one to find similar patients through linking of both vocabulary-based and continuous values. The time dependent properties need to be processed before query to allow matching based on derivatives and other derived properties.
2.5.7 Statistical Relational Artificial Intelligence for Health CareSriraam Natarajan, Indiana University
Application: The goal of the project is to analyze large, multi-modal medical data including different data types such as imaging, EHR, genetic and natural language. This approach employs the relational probabilistic models that have the capability of handling rich relational data and modeling uncertainty using probability theory. The software learns models from multiple data types and can possibly integrate the information and reason about complex queries. Users can provide a set of descriptions – say for instance, MRI images and demographic data about a particular subject. They can then query for the onset of a particular disease (say Alzheimer’s) and the system will then provide a probability distribution over the possible occurrence of this disease.
Current Approach: A single server can handle a test cohort of a few hundred patients with associated data of 100’s of GB.
Futures: A cohort of millions of patient can involve petabyte datasets. Issues include availability of too much data (as images, genetic sequences etc) that can make the analysis complicated. A major challenge lies in aligning the data and merging from multiple sources in a form that can be made useful for a combined analysis. Another issue is that sometimes, large amount of data is available about a single subject but the number of subjects themselves is not very high (i.e., data imbalance). This can result in learning algorithms picking up random correlations between the multiple data types as important features in analysis.
2.5.8 World Population Scale Epidemiological StudyMadhav Marathe, Stephen Eubank or Chris Barrett, Virginia Tech
Application: One needs reliable real-time prediction and control of pandemic similar to the 2009 H1N1 influenza. In general one is addressing contagion diffusion of various kinds: information, diseases, social unrest can be modeled and computed. All of them can be addressed by agent-based models that utilize the underlying interaction network to study the evolution of the desired phenomena.
Current Approach: (a) Build a synthetic global population. (b) Run simulations over the global population to reason about outbreaks and various intervention strategies. Current 100TB dataset generated centrally with MPI based simulation system written in Charm++. Parallelism is achieved by exploiting the disease residence time period.
17
Futures: Use large social contagion models to study complex global scale issues
2.5.9 Social Contagion Modeling for Planning, Public Health and Disaster Management Madhav Marathe or Chris Kuhlman, Virginia Tech
Application: Model Social behavior including national security, public health, viral marketing, city planning, disaster preparedness. In a social unrest application, people take to the streets to voice unhappiness with government leadership. There are citizens that both support and oppose government. Quantify the degrees to which normal business and activities are disrupted owing to fear and anger. Quantify the possibility of peaceful demonstrations, violent protests. Quantify the potential for government responses ranging from appeasement, to allowing protests, to issuing threats against protestors, to actions to thwart protests. To address these issues, must have fine-resolution models (at level of individual people, vehicles, and buildings) and datasets.
Current Approach: The social contagion model infrastructure includes different types of human-to-human interactions (e.g., face-to-face versus online media) to be simulated. It takes not only human-to-human interactions into account, but also interactions among people, services (e.g., transportation), and infrastructure (e.g., internet, electric power). These activity models are generated from averages like census data.
Futures: Data fusion a big issue; how should one combine data from different sources and how to deal with missing or incomplete data? Take into account heterogeneous features of 100s of millions or billions of individuals, models of cultural variations across countries that are assigned to individual agents? How to validate these large models?
2.5.10 Biodiversity and LifeWatchWouter Los, Yuri Demchenko, University of Amsterdam
Application: Research and monitor different ecosystems, biological species, their dynamics and migration with a mix of custom sensors and data access/processing and a federation with relevant projects in area. Particular case studies: Monitoring alien species, monitoring migrating birds, wetlands. See ENVRI for integration of LifeWatch with other environmental e-infrastructures.
Futures: LifeWatch initiative will provide integrated access to a variety of data, analytical and modeling tools as served by a variety of collaborating initiatives. Another service is offered with data and tools in selected workflows for specific scientific communities. In addition, LifeWatch will provide opportunities to construct personalized ‘virtual labs', also allowing one to enter new data and analytical tools. New data will be shared with the data facilities cooperating with LifeWatch. LifeWatch operates the Global Biodiversity Information facility and Biodiversity Catalogue that is Biodiversity Science Web Services Catalogue. Data includes ‘omics, species information, ecological information (such as biomass, population density etc.), ecosystem data (such as CO2 fluxes. Algal blooming, water and soil characteristics)
18
2.6 Deep Learning and Social Media
2.6.1 Large-scale Deep LearningAdam Coates, Stanford University
Application: Increase the size of datasets and models that can be tackled with deep learning algorithms. Large models (e.g., neural networks with more neurons and connections) combined with large datasets are increasingly the top performers in benchmark tasks for vision, speech, and Natural Language Processing. One needs to train a deep neural network from a large (>>1TB) corpus of data (typically imagery, video, audio, or text). Such training procedures often require customization of the neural network architecture, learning criteria, and dataset pre-processing. In addition to the computational expense demanded by the learning algorithms, the need for rapid prototyping and ease of development is extremely high.
Current Approach: The largest applications so far are to image recognition and scientific studies of unsupervised learning with 10 million images and up to 11 billion parameters on a 64 GPU HPC Infiniband cluster. Both supervised (using existing classified images) and unsupervised applications investigated.
Futures: Large datasets of 100TB or more may be necessary in order to exploit the representational power of the larger models. Training a self-driving car could take 100 million images at megapixel resolution. Deep Learning shares many characteristics with the broader field of machine learning. The paramount requirements are high computational throughput for mostly dense linear algebra operations, and extremely high productivity for researcher exploration. One needs integration of high performance libraries with high level (python) prototyping environments.
2.6.2 Organizing large-scale, unstructured collections of consumer photosDavid Crandall, Indiana University
Application: Produce 3D reconstructions of scenes using collections of millions to billions of consumer images, where neither the scene structure nor the camera positions are known a priori. Use resulting 3d models to allow efficient and effective browsing of large-scale photo collections by geographic position. Geolocate new images by matching to 3d models. Perform object recognition on each image. 3d reconstruction can be posed as a robust non-linear least squares optimization problem in which observed (noisy) correspondences between images are constraints and unknowns are 6-d camera pose of each image and 3-d position of each point in the scene.
Current Approach: Hadoop cluster with 480 cores processing data of initial applications. Note over 500 billion images on Facebook and over 5 billion on Flickr with over 500 million images added to social media sites each day.
Futures: Need many analytics including feature extraction, feature matching, and large-scale probabilistic inference, which appear in many or most computer vision and image processing problems,
19

including recognition, stereo resolution, and image denoising. Need to visualize large-scale 3-d reconstructions, and navigate large-scale collections of images that have been aligned to maps.
2.6.3 Truthy: Information diffusion research from Twitter DataFilippo Menczer, Alessandro Flammini, Emilio Ferrara, Indiana University
Application: Understanding how communication spreads on socio-technical networks. Detecting potentially harmful information spread at the early stage (e.g., deceiving messages, orchestrated campaigns, untrustworthy information, etc.)
Current Approach: 1) Acquisition and storage of a large volume (30 TB a year compressed) of continuous streaming data from Twitter (~100 million messages per day, ~500GB data/day increasing over time); (2) near real-time analysis of such data, for anomaly detection, stream clustering, signal classification and online-learning; (3) data retrieval, big data visualization, data-interactive Web interfaces, public API for data querying. Use Python/SciPy/NumPy/MPI for data analysis. Information diffusion, clustering, and dynamic network visualization capabilities already exist.
Futures: Truthy plans to expand incorporating Google+ and Facebook. Need to move towards Hadoop/IndexedHBase & HDFS distributed storage. Use Redis as a in-memory database as a buffer for real-time analysis. Need streaming clustering, anomaly detection and online learning.
2.6.4 Crowd Sourcing in the Humanities as Source for Big and Dynamic DataSebastian Drude, Max-Planck-Institute for Psycholinguistics, Nijmegen The Netherlands
Application: Capture information (manually entered, recorded multimedia, reaction times, pictures, sensor information) from many individuals and their devices and so characterize wide ranging individual, social, cultural and linguistic variation among several dimensions (space, social space, time).
Current Approach: Use typically XML technology, traditional relational databases, and besides pictures not much multi-media yet.
Futures: Crowd sourcing has been barely started to be used on a larger scale but with the availability of mobile devices, now there is a huge potential for collecting much data from many individuals, also making use of sensors in mobile devices. This has not been explored on a large scale so far; existing projects of crowd sourcing are usually of a limited scale and web-based. Privacy issues may be involved (A/V from individuals), anonymization may be necessary but not always possible. Data management and curation critical. Size could be hundreds of terabytes with multimedia.
2.6.5 CINET: Cyberinfrastructure for Network (Graph) Science and AnalyticsMadhav Marathe or Keith Bisset, Virginia Tech
Application: CINET provides a common web-based platform for accessing various (i) network and graph analysis tools such as SNAP, NetworkX, Galib, etc. (ii) real-world and synthetic networks, (iii) computing resources and (iv) data management systems to the end-user in a seamless manner.
20

Current Approach: CINET uses an Infiniband connected high performance computing cluster with 720 cores to provide HPC as a service. It is being used for research and education.
Futures: As the repository grows, we expect a rapid growth to lead to over 1000-5000 networks and methods in about a year. As more fields use graphs of increasing size, parallel algorithms will be important. Data manipulation and bookkeeping of the derived data for users is a challenge there are no well-defined and effective models and tools for management of various graph data in a unified fashion.
2.6.6 NIST Information Access Division analytic technology performance measurement, evaluations, and standards
John Garofolo, NIST
Application: Develop performance metrics, measurement methods, and community evaluations to ground and accelerate the development of advanced analytic technologies in the areas of speech and language processing, video and multimedia processing, biometric image processing, and heterogeneous data processing as well as the interaction of analytics with users. Typically employ one of two processing models: 1) Push test data out to test participants and analyze the output of participant systems, 2) Push algorithm test harness interfaces out to participants and bring in their algorithms and test them on internal computing clusters.
Current Approach: Large annotated corpora of unstructured/semi-structured text, audio, video, images, multimedia, and heterogeneous collections of the above including ground truth annotations for training, developmental testing, and summative evaluations. The test corpora exceed 900M Web pages occupying 30 TB of storage, 100M tweets, 100M ground-truthed biometric images, several hundred thousand partially ground-truthed video clips, and terabytes of smaller fully ground-truthed test collections.
Futures: Even larger data collections are being planned for future evaluations of analytics involving multiple data streams and very heterogeneous data. As well as larger datasets, future includes testing of streaming algorithms with multiple heterogeneous data. Use of clouds being explored.
2.7 The Ecosystem for Research
2.7.1 DataNet Federation Consortium DFCReagan Moore, University of North Carolina at Chapel Hill
Application: Promote collaborative and interdisciplinary research through federation of data management systems across federal repositories, national academic research initiatives, institutional repositories, and international collaborations. The collaboration environment runs at scale: petabytes of data, hundreds of millions of files, hundreds of millions of metadata attributes, tens of thousands of users, and a thousand storage resources.
Current Approach: Currently 25 science and engineering domains have projects that rely on the iRODS (Integrated Rule Oriented Data System) policy-based data management system including major NSF
21
projects such as Ocean Observatories Initiative (sensor archiving); Temporal Dynamics of Learning Center (Cognitive science data grid); the iPlant Collaborative (plant genomics); Drexel engineering digital library; Odum Institute for social science research (data grid federation with Dataverse). iRODS currently manages petabytes of data, hundreds of millions of files, hundreds of millions of metadata attributes, tens of thousands of users, and a thousand storage resources. It interoperates with workflow systems (NCSA Cyberintegrator, Kepler, Taverna), cloud and more traditional storage models and different transport protocols. Figure 4 of section 2.12 has a diagram of the iRODS architecture.
2.7.2 The ‘Discinnet process’, metadata <-> big data global experimentP. Journeau, Discinnet Labs
Application: Discinnet has developed a web 2.0 collaborative platform and research prototype as a pilot installation now becoming deployed to be appropriated and tested by researchers from a growing number and diversity of research fields through communities belonging a diversity of domains.
Its goal is to reach a wide enough sample of active research fields represented as clusters–researchers projected and aggregating within a manifold of mostly shared experimental dimensions–to test general, hence potentially interdisciplinary, epistemological models throughout the present decade.
Current Approach: Currently 35 clusters started with close to 100 awaiting more resources and potentially much more open for creation, administration and animation by research communities. Examples range from optics, cosmology, materials, microalgae, health to applied math, computation, rubber and other chemical products/issues.
Futures: Discinnet itself would not be Bigdata but rather will generate metadata when applied to a cluster that involves Bigdata. In interdisciplinary integration of several fields, the process would reconcile metadata from many complexity levels.
2.7.3 Semantic Graph-search on Scientific Chemical and Text-based DataTalapady Bhat, NIST
Application: Establish social media-based infrastructure, terminology and semantic data-graphs to annotate and present technology information using ‘root’ and rule-based methods used primarily by some Indo-European languages like Sanskrit and Latin.
Current approach: Many reports, including a recent one on Material Genome Project finds that exclusive top-down solutions to facilitate data sharing and integration are not desirable for federated multi-disciplinary efforts. However, a bottom-up approach can be chaotic. For this reason, there is need for a balanced blend of the two approaches to support easy-to-use techniques to metadata creation, integration and sharing. This challenge is very similar to the challenge faced by language developer at the beginning. One of the successful effort used by many prominent languages is that of ‘roots’ and rules that form the framework for creating on-demand words for communication. In this approach a top-down method is used to establish a limited number of highly re-usable words called ‘roots’ by
22

surveying the existing best practices in building terminology. These ‘roots’ are combined using few ‘rules’ to create terms on-demand by a bottom-up step.
Y(uj) (join), O (creator, God, brain), Ga (motion, initiation) –leads to ‘Yoga’ in Sanskrit, EnglishGeno (genos)-cide–race based killing – Latin, EnglishBio-technology –English, LatinRed-light, red-laser-light –English.A press release by the American Institute of Physics on this approach is at http://www.eurekalert.org/pub_releases/2013-07/aiop-ffm071813.php
Our efforts to develop automated and rule and root-based methods (Chem-BLAST -. http://xpdb.nist.gov/chemblast/pdb.pl ) to identify and use best-practice, discriminating terms in generating semantic data-graphs for science started almost a decade back with a chemical structure database. This database has millions of structures obtained from the Protein Data Bank and the PubChem used world-wide. Subsequently we extended our efforts to build root-based terms to text-based data of cell-images. In this work we use few simple rules to define and extend terms based on best-practice as decided by weaning through millions of popular use-cases chosen from over hundred biological ontologies.
Currently we are working on extending this method to publications of interest to Material Genome, Open-Gov and NIST-wide publication archive - NIKE. - http://xpdb.nist.gov/nike/term.pl. These efforts are a component of Research Data Alliance Working Group on Metadata https://www.rd-alliance.org/filedepot_download/694/160 & https://rd-alliance.org/poster-session-rda-2nd-plenary-meeting.html
Futures: Create a cloud infrastructure for social media of scientific information where many scientists from various parts of the world can participate and deposit results of their experiment. Some of the issues that one has to resolve prior to establishing a scientific social media are: a) How to minimize challenges related to establishing re-usable, inter-disciplinary, scalable, on-demand, use-case and user-friendly vocabulary? b) How to adopt a existing or create new on-demand ‘data-graph’ to place an information in an intuitive way such that it would easily integrate with existing ‘data-graphs’ in a federated environment without knowing too much about the data management? c) How to find relevant scientific data without spending too much time on the internet? Start with resources like the Open Government movement, Material genome Initiative and Protein Databank. This effort includes many local and networked resources. Developing an infrastructure to automatically integrate information from all these resources using data-graphs is a challenge that we are trying to solve. Good database tools and servers for data-graph manipulation are needed.
2.7.4 Light source beamlinesEli Dart, LBNL
Application: Samples are exposed to X-rays from light sources in a variety of configurations depending on the experiment. Detectors (essentially high-speed digital cameras) collect the data. The data are then analyzed to reconstruct a view of the sample or process being studied.
23

Current Approach: A variety of commercial and open source software is used for data analysis – examples including Octopus for Tomographic Reconstruction, Avizo (http://vsg3d.com) and FIJI (a distribution of ImageJ) for Visualization and Analysis. Data transfer is accomplished using physical transport of portable media (severely limits performance) or using high-performance GridFTP, managed by Globus Online or workflow systems such as SPADE.
Futures: Camera resolution is continually increasing. Data transfer to large-scale computing facilities is becoming necessary because of the computational power required to conduct the analysis on time scales useful to the experiment. Large number of beamlines (e.g. 39 at LBNL ALS) means that aggregate data load is likely to increase significantly over the coming years and need for a generalized infrastructure for analyzing gigabytes per second of data from many beamline detectors at multiple facilities.
2.8 Astronomy and Physics
2.8.1 Catalina Real-Time Transient Survey (CRTS): a digital, panoramic, synoptic sky survey
S. G. Djorgovski, Caltech
Application: The survey explores the variable universe in the visible light regime, on time scales ranging from minutes to years, by searching for variable and transient sources. It discovers a broad variety of astrophysical objects and phenomena, including various types of cosmic explosions (e.g., Supernovae), variable stars, phenomena associated with accretion to massive black holes (active galactic nuclei) and their relativistic jets, high proper motion stars, etc. The data are collected from 3 telescopes (2 in Arizona and 1 in Australia), with additional ones expected in the near future (in Chile).
Current Approach: The survey generates up to ~ 0.1 TB on a clear night with a total of ~100 TB in current data holdings. The data are preprocessed at the telescope, and transferred to Univ. of Arizona and Caltech, for further analysis, distribution, and archiving. The data are processed in real time, and detected transient events are published electronically through a variety of dissemination mechanisms, with no proprietary withholding period (CRTS has a completely open data policy). Further data analysis includes classification of the detected transient events, additional observations using other telescopes, scientific interpretation, and publishing. In this process, it makes a heavy use of the archival data (several PB’s) from a wide variety of geographically distributed resources connected through the Virtual Observatory (VO) framework.
Futures: CRTS is a scientific and methodological testbed and precursor of larger surveys to come, notably the Large Synoptic Survey Telescope (LSST), expected to operate in 2020’s and selected as the highest-priority ground-based instrument in the 2010 Astronomy and Astrophysics Decadal Survey. LSST will gather about 30 TB per night. The schematic architecture for a cyber-infrastructure for time domain astronomy illustrated by Figure 5 of section 2.12.
2.8.2 DOE Extreme Data from Cosmological Sky Survey and SimulationsSalman Habib, Argonne National Laboratory; Andrew Connolly, University of Washington
24

Application: A cosmology discovery tool that integrates simulations and observation to clarify the nature of dark matter, dark energy, and inflation, some of the most exciting, perplexing, and challenging questions facing modern physics including the properties of fundamental particles affecting the early universe. The simulations will generate comparable data sizes to observation.
Futures: Data sizes are Dark Energy Survey (DES) 4 PB in 2015; Zwicky Transient Factory (ZTF) 1 PB/year in 2015; Large Synoptic Sky Survey (LSST see CRTS description) 7 PB/year in 2019; Simulations > 10 PB in 2017. Huge amounts of supercomputer time (over 200M hours) will be used.
2.8.3 Large Survey Data for CosmologyPeter Nugent LBNL
Application: For DES (Dark Energy Survey) the data are sent from the mountaintop via a microwave link to La Serena, Chile. From there, an optical link forwards them to the NCSA as well as NERSC for storage and "reduction”. Here galaxies and stars in both the individual and stacked images are identified, catalogued, and finally their properties measured and stored in a database.
Current Approach: Subtraction pipelines are run using extant imaging data to find new optical transients through machine learning algorithms. Linux cluster, Oracle RDBMS server, Postgres PSQL, large memory machines, standard Linux interactive hosts, GPFS. For simulations, HPC resources. Standard astrophysics reduction software as well as Perl/Python wrapper scripts, Linux Cluster scheduling.
Futures: Techniques for handling Cholesky decompostion for thousands of simulations with matrices of order 1M on a side and parallel image storage would be important. LSST will generate 60PB of imaging data and 15PB of catalog data and a correspondingly large (or larger) amount of simulation data. Over 20TB of data per night.
2.8.4 Particle Physics: Analysis of LHC Large Hadron Collider Data: Discovery of Higgs particle
Michael Ernst BNL, Lothar Bauerdick FNAL, Geoffrey Fox, Indiana University; Eli Dart, LBNL
Application: One analyses collisions at the CERN LHC (Large Hadron Collider) Accelerator (see figure 6 of section 2.12) and Monte Carlo producing events describing particle-apparatus interaction. Processed information defines physics properties of events (lists of particles with type and momenta). These events are analyzed to find new effects; both new particles (Higgs) and present evidence that conjectured particles (Supersymmetry) have not been detected. LHC has a few major experiments including ATLAS and CMS. These experiments have global participants (for example CMS has 3600 participants from 183 institutions in 38 countries), and so the data at all levels is transported and accessed across continents.
Current Approach: The LHC experiments are pioneers of a distributed Big Data science infrastructure, and several aspects of the LHC experiments’ workflow highlight issues that other disciplines will need to solve. These include automation of data distribution, high performance data transfer, and large-scale high-throughput computing. Grid analysis with 350,000 cores running “continuously” over 2 million jobs
25
per day arranged in 3 tiers (CERN, “Continents/Countries”. “Universities”) shown in figure 7 of section 2.12. Uses “Distributed High Throughput Computing” (Pleasing parallel) architecture with facilities integrated across the world by WLCG (LHC Computing Grid) and Open Science Grid in the US. 15 Petabytes data gathered each year from Accelerator data and Analysis with 200PB total. Specifically in 2012 ATLAS had at Brookhaven National Laboratory (BNL) 8PB Tier1 tape; BNL over 10PB Tier1 disk and US Tier2 centers 12PB disk cache. CMS has similar data sizes. Note over half resources used for Monte Carlo simulations as opposed to data analysis.
Futures: In the past the particle physics community has been able to rely on industry to deliver exponential increases in performance per unit cost over time, as described by Moore's Law. However the available performance will be much more difficult to exploit in the future since technology limitations, in particular regarding power consumption, have led to profound changes in the architecture of modern CPU chips. In the past software could run unchanged on successive processor generations and achieve performance gains that follow Moore's Law thanks to the regular increase in clock rate that continued until 2006. The era of scaling HEP sequential applications is now over. Changes in CPU architectures imply significantly more software parallelism as well as exploitation of specialized floating point capabilities. The structure and performance of HEP data processing software needs to be changed such that it can continue to be adapted and further developed in order to run efficiently on new hardware. This represents a major paradigm-shift in HEP software design and implies large scale re-engineering of data structures and algorithms. Parallelism needs to be added at all levels at the same time, the event level, the algorithm level, and the sub-algorithm level. Components at all levels in the software stack need to interoperate and therefore the goal is to standardize as much as possible on basic design patterns and on the choice of a concurrency model. This will also help to ensure efficient and balanced use of resources.
2.8.5 Belle II High Energy Physics ExperimentDavid Asner & Malachi Schram, PNNL
Application The Belle experiment is a particle physics experiment with more than 400 physicists and engineers investigating CP-violation effects with B meson production at the High Energy Accelerator KEKB e+ e- accelerator in Tsukuba, Japan. In particular look at numerous decay modes at the Upsilon(4S) resonance to search for new phenomena beyond the Standard Model of Particle Physics. This accelerator has the largest intensity of any in the world but events simpler than those from LHC and so analysis is less complicated but similar in style compared to the CERN accelerator.
Futures: An upgraded experiment Belle II and accelerator SuperKEKB will start operation in 2015 with a factor of 50 increased data with total integrated RAW data ~120PB and physics data ~15PB and ~100PB MC samples. Move to a distributed computing model requiring continuous RAW data transfer of ~20Gbps at designed luminosity between Japan and US. Will need Open Science Grid, Geant4, DIRAC, FTS, Belle II framework software.
26

2.9 Earth, Environmental and Polar Science
2.9.1 EISCAT 3D incoherent scatter radar systemYin Chen, Cardiff University; Ingemar Häggström, Ingrid Mann, Craig Heinselman, EISCAT Science Association
Application: EISCAT, the European Incoherent Scatter Scientific Association, conducts research on the lower, middle and upper atmosphere and ionosphere using the incoherent scatter radar technique. This technique is the most powerful ground-based tool for these research applications. EISCAT studies instabilities in the ionosphere, as well as investigating the structure and dynamics of the middle atmosphere. It is also a diagnostic instrument in ionospheric modification experiments with addition of a separate Heating facility. Currently EISCAT operates 3 of the 10 major incoherent radar scattering instruments worldwide with its facilities in in the Scandinavian sector, north of the Arctic Circle.
Current Approach: The current running old EISCAT radar generates terabytes per year rates and does not present special challenges.
Futures: The design of the next generation radar, EISCAT_3D, will consist of a core site with a transmitting and receiving radar arrays and four sites with receiving antenna arrays at some 100 km from the core. The fully operational 5-site system will generate several thousand times data of current EISCAT system with 40 PB/year in 2022 and is expected to operate for 30 years. EISCAT 3D data e-Infrastructure plans to use the high performance computers for central site data processing and high throughput computers for mirror sites data processing. Downloading the full data is not time critical, but operations require real-time information about certain pre-defined events to be sent from the sites to the operation center and a real-time link from the operation center to the sites to set the mode of radar operation on with immediate action. See Figure 8 of section 2.12.
2.9.2 ENVRI, Common Operations of Environmental Research InfrastructureYin Chen, Cardiff University
Application: ENVRI Research Infrastructures (ENV RIs) addresses European distributed, long-term, remote controlled observational networks focused on understanding processes, trends, thresholds, interactions and feedbacks and increasing the predictive power to address future environmental challenges. ENVRI includes ICOS is a European distributed infrastructure dedicated to the monitoring of greenhouse gases (GHG) through its atmospheric, ecosystem and ocean networks; EURO-Argo is the European contribution to Argo, which is a global ocean observing system; EISCAT-3D separately described is a European new-generation incoherent-scatter research radar for upper atmospheric science; LifeWatch separately described is an e-science Infrastructure for biodiversity and ecosystem research; EPOS is a European Research Infrastructure on earthquakes, volcanoes, surface dynamics and tectonics; EMSO is a European network of seafloor observatories for the long-term monitoring of environmental processes related to ecosystems, climate change and geo-hazards; IAGOS Aircraft for global observing system; SIOS Svalbard arctic Earth observing system
27
Current Approach: ENVRI develops a Reference Model (ENVRI RM) as a common ontological framework and standard for the description and characterization of computational and storage infrastructures in order to achieve seamless interoperability between the heterogeneous resources of different infrastructures. The ENVRI RM serves as a common language for community communication, providing a uniform framework into which the infrastructure’s components can be classified and compared, also serving to identify common solutions to common problems. Note data sizes in a given infrastructure vary from gigabytes to petabytes per year.
Futures: ENVRI’s common environment will empower the users of the collaborating environmental research infrastructures and enable multidisciplinary scientists to access, study and correlate data from multiple domains for "system level" research. It provides Bigdata requirements coming from interdisciplinary research.
As shown in figure 9 of section 2.12, analysis of the computational characteristics of the 6 ESFRI Environmental Research infrastructure, 5 common subsystems has been identified. The definition of them are given in the ENVRI Reference Model, www.envri.eu/rm:
Data acquisition: collects raw data from sensor arrays, various instruments, or human observers, and brings the measurements (data streams) into the system.
Data curation: facilitates quality control and preservation of scientific data. It is typically operated at a data centre.
Data access: enables discovery and retrieval of data housed in data resources managed by a data curation subsystem.
Data processing: aggregates the data from various resources and provides computational capabilities and capacities for conducting data analysis and scientific experiments.
Community support: manages, controls and tracks users' activities and supports users to conduct their roles in communities.
As shown in figure 10 of section 2.12, the 5 sub-system map well to the architectures of the ESFRI Environmental Research Infrastructures.
2.9.3 Radar Data Analysis for CReSIS Remote Sensing of Ice SheetsGeoffrey Fox, Indiana University
Application: This data illustrated in figure 11 of section 2.12, feeds into intergovernmental Panel on Climate Change (IPCC) and uses custom radars to measures ice sheet bed depths and (annual) snow layers at the North and South poles and mountainous regions. These are typically flown by aircraft in multiple paths illustrated in figure 12 of section 2.12.
Current Approach: The initial analysis is currently Matlab signal processing that produces a set of radar images. These cannot be transported from field over Internet and are typically copied to removable few TB disks in the field and flown “home” for detailed analysis. Image understanding tools with some human oversight find the image features (layers) illustrated in figure 13 of section 2.12, that are stored in a database front-ended by a Geographical Information System. The ice sheet bed depths are used in
28

simulations of glacier flow. The data is taken in “field trips” that each currently gather 50-100 TB of data over a few week period.
Futures: An order of magnitude more data (petabyte per mission) is projected with improved instrumentation. Demands of processing increasing field data in an environment with more data but still constrained power budget, suggests low power/performance architectures such as GPU systems.
The full descriptions gives workflows for different parts of problem and pictures of operation.
2.9.4 UAVSAR Data Processing, Data Product Delivery, and Data ServicesAndrea Donnellan and Jay Parker, NASA JPL
Application: Synthetic Aperture Radar (SAR) can identify landscape changes caused by seismic activity, landslides, deforestation, vegetation changes and flooding. This is for example used to support earthquake science as well as disaster management. This use case supports the storage, application of image processing and visualization of this geo-located data with angular specification.
Current Approach: Data from planes and satellites is processed on NASA computers before being stored after substantial data communication. The data is made public as soon as processed and requires significant curation due to instrumental glitches. The current data size is ~150TB.
Futures: The data size would increase dramatically if Earth Radar Mission launched. Clouds are suitable hosts but are not used today in production.
2.9.5 NASA LARC/GSFC iRODS Federation TestbedBrandi Quam, NASA Langley Research Center
Application: NASA Center for Climate Simulation (NCCS) and NASA Atmospheric Science Data Center (ASDC) have complementary data sets, each containing vast amounts of data that is not easily shared and queried. Climate researchers, weather forecasters, instrument teams, and other scientists need to access data from across multiple datasets in order to compare sensor measurements from various instruments, compare sensor measurements to model outputs, calibrate instruments, look for correlations across multiple parameters, etc.
Current Approach: The data includes MERRA (described separately) and NASA Clouds and Earth's Radiant Energy System (CERES) EBAF(Energy Balanced And Filled)-TOA(Top of Atmosphere) Product which is about 420MB and Data from the EBAF-Surface Product which is about 690MB. Data grows with each version update (about every six months). To analyze, visualize and otherwise process data from heterogeneous datasets is currently a time consuming effort that requires scientists to separately access, search for, and download data from multiple servers and often the data is duplicated without an understanding of the authoritative source. Often times accessing data is greater than scientific analysis time. Current datasets are hosted on modest size (144 to 576 cores) Infiniband clusters.
Futures: The improved access will be enabled through the use of iRODS that enables parallel downloads of datasets from selected replica servers that can be geographically dispersed, but still accessible by
29

users worldwide. iRODS operation will be enhanced with semantically organized metadata, and managed via a highly precise Earth Science ontology. Cloud solutions will also be explored.
2.9.6 MERRA Analytic Services MERRA/ASJohn L. Schnase & Daniel Q. Duffy , NASA Goddard Space Flight Center
Application: This application produces global temporally and spatially consistent syntheses of 26 key climate variables by combining numerical simulations with observational data. Three-dimensional results are produced every 6-hours extending from 1979-present. This supports important applications like Intergovernmental Panel on Climate Change (IPCC) research and the NASA/Department of Interior RECOVER wildfire decision support system; these applications typically involve integration of MERRA with other datasets. Figure 14 of section 2.12 has a typical MERRA/AS output.
Current Approach: MapReduce is used to process a current total of 480TB. The current system is hosted on a 36 node Infiniband cluster
Futures: Clouds are being investigated. The data is growing by one TB a month.
2.9.7 Atmospheric Turbulence - Event Discovery and Predictive AnalyticsMichael Seablom, NASA HQ
Application: This builds datamining on top of reanalysis products including the North American Regional Reanalysis (NARR) and the Modern-Era Retrospective-Analysis for Research (MERRA) from NASA where latter described earlier. The analytics correlate aircraft reports of turbulence (either from pilot reports or from automated aircraft measurements of eddy dissipation rates) with recently completed atmospheric re-analyses. This is of value to aviation industry and to weather forecasters. There are no standards for re-analysis products complicating system where MapReduce is being investigated. The reanalysis data is hundreds of terabytes and slowly updated whereas turbulence is smaller in size and implemented as a streaming service. A typical turbulent wave image is in figure 15 of section 2.12.
Current Approach: Current 200TB dataset can be analyzed with MapReduce or the like using SciDB or other scientific database.
Futures: The dataset will reach 500TB in 5 years. The initial turbulence case can be extended to other ocean/atmosphere phenomena but the analytics would be different in each case.
2.9.8 Climate Studies using the Community Earth System Model at DOE’s NERSC centerWarren Washington, NCAR
Application: We need to understand and quantify contributions of natural and anthropogenic-induced patterns of climate variability and change in the 20th and 21st centuries by means of simulations with the Community Earth System Model (CESM). The results of supercomputer simulations across the world need to be stored and compared.
30
Current Approach: The Earth Systems Grid (ESG) enables world wide access to Peta/Exa-scale climate science data with multiple petabytes of data at dozens of federated sites worldwide. The ESG is recognized as the leading infrastructure for the management and access of large distributed data volumes for climate change research. It supports the Coupled Model Intercomparison Project (CMIP), whose protocols enable the periodic assessments carried out by the Intergovernmental Panel on Climate Change (IPCC).
Futures: Rapid growth of data with 30 PB produced at NERSC (assuming 15 end-to-end climate change experiments) in 2017 and many times more this worldwide.
2.9.9 DOE-BER Subsurface Biogeochemistry Scientific Focus AreaDeb Agarwal, LBNL
Application: Development of a Genome-Enabled Watershed Simulation Capability (GEWaSC) that will provide a predictive framework for understanding how genomic information stored in a subsurface microbiome, affects biogeochemical watershed functioning; how watershed-scale processes affect microbial functioning; and how these interactions co-evolve.
Current Approach: Current modeling capabilities can represent processes occurring over an impressive range of scales (ranging from a single bacterial cell to that of a contaminant plume). Data crosses all scales from genomics of the microbes in the soil to watershed hydro-biogeochemistry. Data are generated by the different research areas and include simulation data, field data (hydrological, geochemical, geophysical), ‘omics data, and observations from laboratory experiments.
Futures: Little effort to date has been devoted to developing a framework for systematically connecting scales, as is needed to identify key controls and to simulate important feedbacks. GEWaSC will develop a simulation framework that formally scales from genomes to watersheds and will synthesize diverse and disparate field, laboratory, and simulation datasets across different semantic, spatial, and temporal scales.
2.9.10 DOE-BER AmeriFlux and FLUXNET NetworksDeb Agarwal, LBNL
Application: AmeriFlux and FLUXNET are US and world collections respectively of sensors that observe trace gas fluxes (CO2, water vapor) across a broad spectrum of times (hours, days, seasons, years, and decades) and space. Moreover, such datasets provide the crucial linkages among organisms, ecosystems, and process-scale studies—at climate-relevant scales of landscapes, regions, and continents—for incorporation into biogeochemical and climate models.
Current Approach: Software includes EddyPro, Custom analysis software, R, python, neural networks, Matlab. There are ~150 towers in AmeriFlux and over 500 towers distributed globally collecting flux measurements.
31

Futures: Field experiment data taking would be improved by access to existing data and automated entry of new data via mobile devices. Need to support interdisciplinary studies integrating diverse data sources.
2.10 Energy
2.10.1 Consumption forecasting in Smart GridsYogesh Simmhan, University of Southern California
Application: Predict energy consumption for customers, transformers, sub-stations and the electrical grid service area using smart meters providing measurements every 15-mins at the granularity of individual consumers within the service area of smart power utilities. Combine Head-end of smart meters (distributed), Utility databases (Customer Information, Network topology; centralized), US Census data (distributed), NOAA weather data (distributed), Micro-grid building information system (centralized), Micro-grid sensor network (distributed). This generalizes to real-time data-driven analytics for time series from cyber physical systems
Current Approach: GIS based visualization. Data is around 4 TB a year for a city with 1.4M sensors in Los Angeles. Uses R/Matlab, Weka, Hadoop software. Significant privacy issues requiring anonymization by aggregation. Combine real time and historic data with machine learning for predicting consumption.
Futures: Wide spread deployment of Smart Grids with new analytics integrating diverse data and supporting curtailment requests. Mobile applications for client interactions.
2.11 Summary of Key PropertiesNo. Use Case Volume Velocity Variety Software Analytics
1M0147Census 2010 and 2000
380TB Static for 75 years Scanned Documents Robust archival storage
None for 75 years
2
M0148NARA: Search, Retrieve, Preservation
Hundred of Terabytes, and growing.
data loaded in batches so bursty
unstructured and structured data: textual documents, emails, photos, scanned documents, multimedia, social networks, web sites, databases, etc.
Custom software, commercial search products, commercial databases.
Crawl/index; search; ranking; predictive search. Data categorization (sensitive, confidential, etc.). Personally Identifiable Information (PII) detection and flagging
3
M0219Statistical Survey Response Improvement
Approximately 1PB Variable. field data streamed continuously, Census was ~150 million records transmitted.
Strings and numerical data
Hadoop, Spark, Hive, R, SAS, Mahout, Allegrograph, MySQL, Oracle, Storm, BigMemory, Cassandra, Pig
recommendation systems, continued monitoring
4 M0222Non-Traditional Data in Statistical Survey Response
N/A N/A Survey data, other government administrative data, web scrapped data, wireless data, e-
Hadoop, Spark, Hive, R, SAS, Mahout, Allegrograph, MySQL, Oracle, Storm, BigMemory,
New analytics to create reliable information from non traditional disparate sources
32

No. Use Case Volume Velocity Variety Software Analytics
Improvement transaction data, potentially social media data and positioning data from various sources
Cassandra, Pig
5M0175Cloud Eco-System
N/A Real Time No Hadoop RDBMS XBRL
Fraud Detection
6
M0161Mendeley
15TB presently, growing about 1 TB/month
Currently Hadoop batch jobs are scheduled daily. Future is real-time recommendation
PDF documents and log files of social network and client activities
Hadoop, Scribe, Hive, Mahout, Python
Standard libraries for machine learning and analytics, LDA, custom built reporting tools for aggregating readership and social activities per document
7
M0164Netflix Movie Service
Summer 2012. 25 million subscribers; 4 million ratings per day; 3 million searches per day; 1 billion hours streamed in June 2012. Cloud storage 2 petabytes (June 2013)
Media (video and properties) and Rankings continually updated
Data varies from digital media to user rankings, user profiles and media properties for content-based recommendations
Hadoop and Pig; Cassandra; Teradata
Personalized recommender systems using logistic/linear regression, elastic nets, matrix factorization, clustering, latent Dirichlet allocation, association rules, gradient boosted decision trees and others. Also and streaming video delivery.
8
M0165Web Search
45B web pages total, 500M photos uploaded each day, 100 hours of video uploaded to YouTube each minute
Real Time updating and real time response to queries
Multiple media MapReduce + Bigtable; Dryad + Cosmos. PageRank. Final step essentially a recommender engine
Crawling; searching including topic based search; ranking; recommending
9
M0137BC/DR) Within A Cloud Eco-System
Terabytes up to Petabytes
Can be Real Time for recent changes
Must work for all Data Hadoop, MapReduce, Open-source, and/or Vendor Proprietary such as AWS (Amazon Web Services), Google Cloud Services, and Microsoft
Robust Backup
10M0103Cargo Shipping
N/A Needs to become real-time. Currently updated at events
Event based N/A Distributed Event Analysis identifying problems.
11
M0162Materials Data for Manufacturing
500,000 material types in 1980's. Much growth since then
Ongoing increase in new materials
Many datasets with no standards
National programs (Japan, Korea, and China), application areas (EU Nuclear program), proprietary systems (Granta, etc.)
No broadly applicable analytics
12 M0176Simulation driven Materials
100TB (current), 500TB within 5 years. Scalable key-value and object store databases
Simulations add data regularly
Varied data and simulation results
MongoDB, GPFS, PyMatGen, FireWorks, VASP, ABINIT, NWChem,
MapReduce and search that join simulation and experimental data.
33
No. Use Case Volume Velocity Variety Software Analytics
Genomics needed. BerkeleyGW, varied community codes
13
M0213Large Scale Geospatial Analysis and Visualization
Imagery -- 100s of Terabytes. Vector Data -- 10s of Gigabytes but billions of points
Vectors transmitted in Near Real Time
Imagery. Vector (various formats shape files, KML, text streams) and many object structures
Geospatially enabled RDBMS, ESRI ArcServer, Geoserver
Closest point of approach, deviation from route, point density over time, Principal Component Analysis (PCA) and Independent Component Analysis (ICA)
14
M0214Object identification and tracking
FMV -- 30-60 frames per/sec at full color 1080P resolution. WALF -- 1-10 frames per/sec at 10Kx10K full color resolution,
Real Time A few standard imagery or video formats.
custom software and tools including traditional RDBM.s and display tools.
Visualization as overlays on a GIS. Analytics are basic object detection analytics and integration with sophisticated situation awareness tools with data fusion.
15
M0215Intelligence Data Processing and Analysis
10s of Terabytes to 100s of Petabytes. Individual warfighters (first responders) would have at most 1-100s of Gigabytes
Much Real Time. Imagery intelligence device gathering petabyte in a few hours
Text files, raw media, imagery, video, audio, electronic data, human generated data
Hadoop, Accumulo (Big Table), Solr, Natural Language Processing, Puppet (for deployment and security) and Storm. GIS
Near Real Time Alerts based on patterns and baseline changes, Link Analysis, Geospatial Analysis, Text Analytics (sentiment, entity extraction, etc.)
16
M0177EMR Data
12 million patients, more than 4 billion discrete clinical observations. > 20 TB raw data
0.5-1.5 million new real-time clinical transactions added per day.
Broad variety of data from doctors, nurses, laboratories and instruments
Teradata, PostgreSQL, MongoDB, Hadoop, Hive, R
Information retrieval methods (TF-IDF) Natural Language Processing, maximum likelihood estimators and Bayesian networks.
17
M0089Pathology Imaging
1GB raw image data + 1.5GB analytical results per 2D image; 1TB raw image data + 1TB analytical results per 3D image. 1PB data per moderated hospital per year,
Once generated, data will not be changed
Images MPI for image analysis; MapReduce + Hive with spatial extension
Image analysis, spatial queries and analytics, feature clustering and classification
18
M0191Computational Bioimaging
medical diagnostic imaging is annually around 70 PB. A single scan on emerging machines is 32TB
Volume of data acquisition requires HPC back end
Multi-modal imaging with disparate channels of data
Scalable key-value and object store databases needed. ImageJ, OMERO, VolRover, advanced segmentation and feature detection methods
Machine learning (SVM and RF) for classification and recommendation services
19M0078Genomic Measurements
>100TB in 1-2 years at NIST; Healthcare community will have many PBs
DNA sequencers can generate ~300GB compressed data/day
File formats not well-standardized, though some standards exist. Generally structured data.
Open-source sequencing bioinformatics software from academic groups
Processing of raw data to produce variant calls. Clinical interpretation of variants
34

No. Use Case Volume Velocity Variety Software Analytics
20
M0188Comparative analysis
50TB New sequencers stream in data at growing rate
Biological data is inherently heterogeneous, complex, structural, and hierarchical. Besides core genomic data, new types of 'Omics' data such as transcriptomics, methylomics, and proteomics
Standard bioinformatics tools (BLAST, HMMER, multiple alignment and phylogenetic tools, gene callers, sequence feature predictors.), Perl/Python wrapper scripts
Descriptive statistics, statistical significance in hypothesis testing, data clustering and classification
21
M0140Individualized Diabetes Management
5 million patients not real-time but updated periodically
Each patient typically has 100 Controlled Vocabulary values and 1000 continuous values. Most values are time stamped.
HDFS supplementing Mayo internal data warehouse called Enterprise Data Trust (EDT)
Integrating data into semantic graph, using graph traverse to replace SQL join. Developing semantic graph mining algorithms to identify graph patterns, index graph, and search graph. Indexed Hbase. Custom code to develop new patient properties from stored data.
22
M0174Statistical Relational Artificial Intelligence for Health Care
100s of GBs for a single cohort of a few hundred people. When dealing with millions of patients, this can be in the order of 1 petabyte.
Electronic Health Records can be constantly updated. In other controlled studies, the data often comes in batches in regular intervals.
Critical Feature. Data is typically in multiple tables and need to be merged in order to perform the analysis.
Mainly Java based, in house tools are used to process the data.
Relational probabilistic models (Statistical Relational AI) learnt from multiple data types
23
M0172World Population Scale Epidemiological Study
100TB Data feeding into the simulation is small but real time data generated by simulation is massive.
Can be rich with avrious population activities, geographical, socio-economic, cultural variations
Charm++, MPI Simulations on a Synthetic population
24
M0173Social Contagion Modeling for Planning
10s of TB per year During social unrest events, human interactions and mobility leads to rapid changes in data; e.g., who follows whom in Twitter.
Data fusion a big issue. How to combine data from different sources and how to deal with missing or incomplete data?
Specialized simulators, open source software, and proprietary modeling environments. Databases.
Models of behavior of humans and hard infrastructures, and their interactions. Visualization of results
25M0141Biodiversity and LifeWatch
N/A Real time processing and analysis in case of the natural or industrial disaster
Rich variety and number of involved databases and observation data
RDMS Requires advanced and rich visualization
26 M0136Large-scale Deep Learning
Current datasets typically 1 to 10 TB. Training a self-driving car could take 100 million images.
Much faster than real-time processing is required. For autonomous driving need to process 1000's
Neural Net very heterogeneous as it learns many different features
In-house GPU kernels and MPI-based communication developed by Stanford. C++/Python
Small degree of batch statistical pre-processing; all other data analysis is performed by the
35
No. Use Case Volume Velocity Variety Software Analytics
high-resolution (6 megapixels or more) images per second.
source. learning algorithm itself.
27
M0171Organizing large-scale
500+ billion photos on Facebook, 5+ billion photos on Flickr.
over 500M images uploaded to Facebook each day
Images and metadata including EXIF tags (focal distance, camera type, etc),
Hadoop Map-reduce, simple hand-written multithreaded tools (ssh and sockets for communication)
Robust non-linear least squares optimization problem. Support Vector Machine
28
M0160Truthy
30TB/year compressed data
Near real-time data storage, querying & analysis
Schema provided by social media data source. Currently using Twitter only. We plan to expand incorporating Google+, Facebook
Hadoop IndexedHBase & HDFS. Hadoop, Hive, Redis for data management. Python: SciPy NumPy and MPI for data analysis.
Anomaly detection, stream clustering, signal classification and online-learning; Information diffusion, clustering, and dynamic network visualization
29
M0211Crowd Sourcing
Gigabytes (text, surveys, experiment values) to hundreds of terabytes (multimedia)
Data continuously updated and analyzed incrementally
So far mostly homogeneous small data sets; expected large distributed heterogeneous datasets
XML technology, traditional relational databases
Pattern recognition (e.g., speech recognition, automatic A&V analysis, cultural patterns), identification of structures (lexical units, linguistic rules, etc)
30
M0158CINET
Can be hundreds of GB for a single network. 1000-5000 networks and methods
Dynamic networks; network collectyion growing
Many types of networks
Graph libraries: Galib, NetworkX. Distributed Workflow Management: Simfrastructure, databases, semantic web tools
Network Visualization
31
M0190NIST IAD
>900M Web pages occupying 30 TB of storage, 100M tweets, 100M ground-truthed biometric images, 100,000's partially ground-truthed video clips, and terabytes of smaller fully ground-truthed test collections.
Most legacy evaluations are focused on retrospective analytics. Newer evaluations are focusing on simulations of real-time analytic challenges from multiple data streams.
Wide variety of data types including textual search/extraction, machine translation, speech recognition, image and voice biometrics, object and person recognition and tracking, document analysis, human-computer dialogue, and multimedia search/extraction.
PERL, Python, C/C++, Matlab, R development tools. Create ground-up test and measurement applications.
Information extraction, filtering, search, and summarization; image and voice biometrics; speech recognition and understanding; machine translation; video person/object detection and tracking; event detection; imagery/document matching; novelty detection; structural semantic temporal analytics
32M0130DataNet
Petabytes, hundreds of millions of files
Real Time & Batch Rich Integrated Rule Oriented Data System (iRODS)
Supports general analysis workflows
33M0163The Discinnet process
Small as metadata to Big Data
Real Time Can tackle arbitrary Big Data
Symfony-PHP, Linux, MySQL
X
34 M0131 Few Terabytes Evolving in Time Rich database Data graph processing
36

No. Use Case Volume Velocity Variety Software Analytics
Semantic Graph-search
35
M0189Light source beamlines
50-400 GB per day. Total ~400 TB
Continuous stream of Data but analysis need not be real time
Images Octopus for Tomographic Reconstruction, Avizo (http://vsg3d.com) and FIJI (a distribution of ImageJ)
Volume reconstruction, feature identification, etc.
36
M0170Catalina Real-Time Transient Survey
~100TB total increasing by 0.1TB a night accessing PB's of base astronomy data. Successor LSST will take 30TB a night in 2020's,
Nightly update runs processed in real time
Images, spectra, time series, catalogs.
Custom data processing pipeline and data analysis software
Detection of rare events and relation to existing diverse data
37
M0185DOE Extreme Data
Several petabytes from Dark Energy Survey and Zwicky Transient Factory. Simulations > 10PB
Analysis done in batch mode with data from observations and simulations updated daily
Image and simulation data
MPI, FFTW, viz packages, FFTW, numpy, Boost, OpenMP, ScaLAPCK, PSQL & MySQL databases, Eigen, cfitsio, astrometry.net, and Minuit2
New analytics needed to analyze simulation results
38
M0209Large Survey Data for Cosmology
Dark Energy Survey will take PB's of data
400 images of one gigabyte in size per night
Images Linux cluster, Oracle RDBMS server, Postgres PSQL, large memory machines, standard Linux interactive hosts, GPFS. For simulations, HPC resources. Standard astrophysics reduction software as well as Perl/Python wrapper scripts
Machine Learning to find optical transients. Cholesky decompostion for thousands of simulations with matrices of order 1M on a side and parallel image storage
39
M0166Particle Physics
15 PB's of data (experiment and Monte Carlo combined) per year
Data updated continuously with sophisticated real-time selection and test analysis but all analyzed "properly" offline
Each stage in analysis has different format but data uniform within each analysis stage
Grid-based environment with over 350,000 cores running simultaneously
Sophisticated specialized data analysis code followed by basic exploratory statistics (histogram) with complex detector efficiency corrections
40
M0210Belle II High Energy Physics Experiment
Eventually 120 PB of Monte Carlo and observational data
Data updated continuously with sophisticated real-time selection and test analysis but all analyzed "properly" offline
Each stage in analysis has different format but data uniform within each analysis stage
Will use DIRAC Grid software
Sophisticated specialized data analysis code followed by basic exploratory statistics (histogram) with complex detector efficiency corrections
37
No. Use Case Volume Velocity Variety Software Analytics
41
M0155EISCAT 3D incoherent scatter radar system
Terabytes per year today but 40PB/year starting ~2022
Data updated continuously with real time test analysis and batch full analysis
Big Data Uniform Custom analysis based on flat file data storage
Pattern recognition, demanding correlation routines, high level parameter extraction
42
M0157ENVRI
Apart from EISCAT 3D given above, these are low volume. One system EPOS ~15 TB/year
Mainly real time data streams
This is 6 separate projects with common architecture for infrastructure. So data very diverse across projects
R and Pytion (Matplotlib) for visulaization. Custom software for processing
Data assimilation, (Statistical) analysis, Data mining, Data extraction, Scientific modeling and simulation, Scientific workflow
43
M0167CReSIS
Current data around a PB increasing by 50-100TB per mission. Future expedition ~PB each
Data taken in ~2 month missions including test analysis and then later batch processing
Raw data, images with final layer data used for science
Matlab for custom raw data processing. Custom image processing software. User Interface is a Geographical Information System
Custom signal processing to produce Radar images that are analyzed by image processing to find layers
44
M0127UAVSAR Data Processing
Rawdata 110TB and 40TB processed plus smaller samples
Data comes from aircraft and so incrementally added. Data occasionally get reprocessed: new processing methods or parameters
Image and annotation files
ROI_PAC, GeoServer, GDAL, GeoTIFF-supporting tools. Moving to Clouds
Process Raw Data to get images which are run through image processing tools and accessed from GIS
45
M0182NASA LARC/GSFC iRODS
MERRA collection (below) represents about most of total data and there are other smaller collections
Periodic updates every 6 months
many applications combine MERRA reanalysis data with other reanalyses and observational data such as CERES
SGE Univa Grid Engine Version 8.1, iRODS version 3.2 and/or 3.3, IBM Global Parallel File System (GPFS) version 3.4, Cloudera version 4.5.2-1.
Federation software
46
M0129MERRA
MERRA is 480TB Increases at ~1TB/month
applications combine MERRA reanalysis data with other re-analyses and observational data.
Cloudera, iRODS, Amazon AWS
Climate Analytics-as-a-Service (CAaaS).
47
M0090Atmospheric Turbulence
200TB (current), 500TB within 5 years
Data analyzed incrementally
Re-analysis datasets are inconsistent in format, resolution, semantics, and metadata. Likely each of these input streams will have to be interpreted/analyzed into a common product
MapReduce or the like; SciDB or other scientific database.
Data mining customized for specific event types
48M0186Climate Studies
Up to 30 PB/year from 15 end to end simulations at NERSC. More at other HPC centers
42 Gbytes/sec from simulations
Variety across simulation groups and between observation and simulation
NCAR PIO library and utilities NCL and NCO, parallel NetCDF
Need analytics next to data storage
49 M0183 N/A N/A From 'omics of the PFLOWTran, Data mining, data
38
No. Use Case Volume Velocity Variety Software Analytics
DOE-BER Subsurface Biogeochemistry
microbes in the soil to watershed hydro-biogeochemistry. From observation to simulation
postgres, HDF5, Akuna, NEWT, etc
quality assessment, cross-correlation across datasets, reduced model development, statistics, quality assessment, data fusion
50
M0184DOE-BER AmeriFlux and FLUXNET Networks
N/A Streaming data from ~150 towers in AmeriFlux and over 500 towers distributed globally collecting flux measurements
Flux data needs to be merged with biological, disturbance, and other ancillary data
EddyPro, Custom analysis software, R, python, neural networks, Matlab
Data mining, data quality assessment, cross-correlation across datasets, data assimilation, data interpolation, statistics, quality assessment, data fusion
51
M0223Consumption forecasting in Smart Grids
4 TB a year for a city with 1.4M sensors like Los Angeles
Streaming data from million(s) of sensors
Tuple-based: Timeseries, database rows; Graph-based: Network topology, customer connectivity; Some semantic data for normalization
R/Matlab, Weka, Hadoop. GIS based visualization
Forecasting models, machine learning models, time series analysis, clustering, motif detection, complex event processing, visual network analysis
2.12 Picture Book of Big Data Use CasesFigure 1: Cargo Shipping (Section 2.3.6) Scenario
39

Figure 2: Pathology Imaging/digital pathology (Section 2.5.2) Examples of 2-D and 3-D pathology images.
Figure 3: Pathology Imaging/digital pathology (Section 2.5.2) Architecture of Hadoop-GIS, a spatial data warehousing system over MapReduce to support spatial analytics for analytical pathology imaging.
Figure 4: DataNet Federation Consortium DFC (Section 2.7.1) iRODS architecture
40
Figure 5: Catalina Real-Time Transient Survey (CRTS): a digital, panoramic, synoptic sky survey (Section 2.8.1) One possible schematic architecture for a cyber-infrastructure for time domain astronomy. Transient event data streams are produced by survey pipelines from the telescopes on the ground or in space, and the events with their observational descriptions are ingested by one or more depositories, from which they can be disseminated electronically to human astronomers or robotic telescopes. Each event is assigned an evolving portfolio of information, which would include all of the available data on that celestial position, from a wide variety of data archives unified under the Virtual Observatory framework, expert annotations, etc. Representations of such federated information can be both human-readable and machine-readable. They are fed into one or more automated event characterization, classification, and prioritization engines that deploy a variety of machine learning tools for these tasks. Their output, which evolves dynamically as new information arrives and is processed, informs the follow-up observations of the selected events, and the resulting data are communicated back to the event portfolios, for the next iteration. Users (human or robotic) can tap into the system at multiple points, both for an information retrieval, and to contribute new information, through a standardized set of formats and protocols. This could be done in a (near) real time, or in an archival (not time critical) modes
41
Figure 6: Particle Physics: Analysis of LHC Large Hadron Collider Data: Discovery of Higgs particle (Section 2.8.4) The LHC Collider location at CERN
Figure 7: Particle Physics: Analysis of LHC Large Hadron Collider Data: Discovery of Higgs particle (Section 2.8.4) The Multi-tier LHC computing infrastructure
42

Figure 8: EISCAT 3D incoherent scatter radar system (Section 2.9.1) System Architecture
Figure 9: ENVRI, Common Operations of Environmental Research Infrastructure (Section 2.9.2) ENVRI Common Architecture
43

Figure 10(a) ICOS Architecture
Figure 10(b) LifeWatch Architecture
44
Figure 10(c) EMSO Architecture
Figure 10(d) Eura-Argo Architecture
45

Figure 10(e) EISCAT 3D Architecture
Figure 10: ENVRI, Common Operations of Environmental Research Infrastructure (Section 2.9.2) Architectures of the ESFRI Environmental Research Infrastructures
46
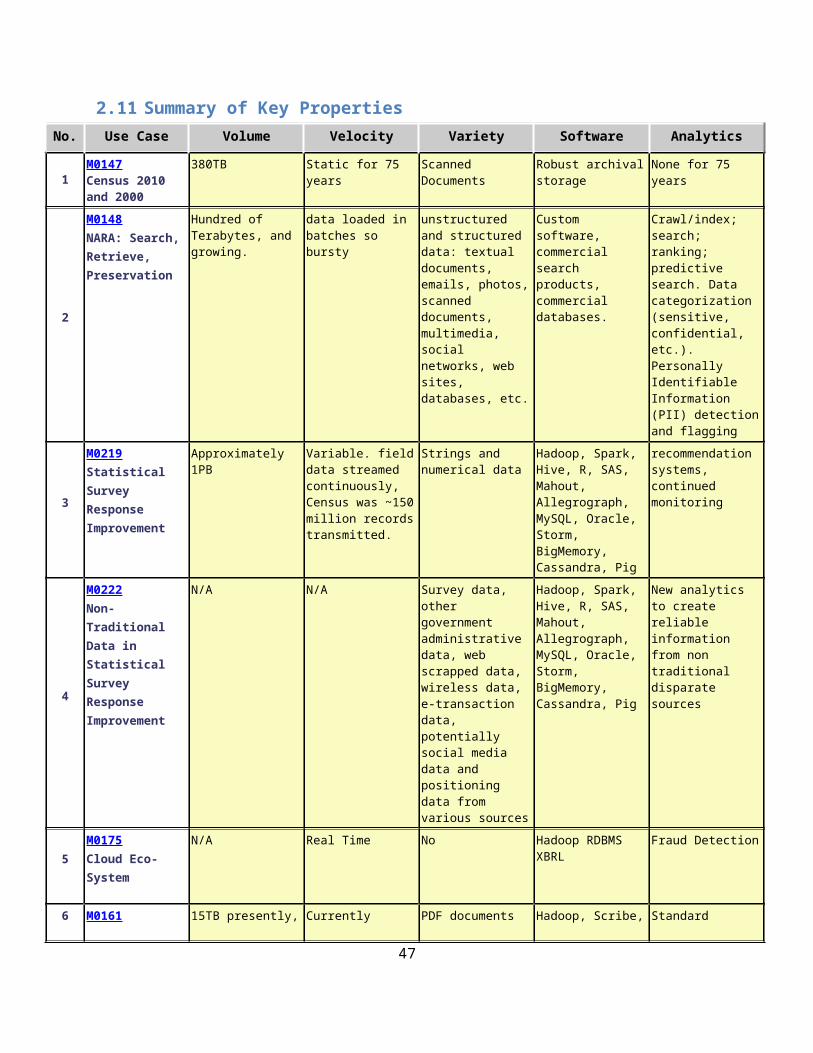
Figure 11: Radar Data Analysis for CReSIS Remote Sensing of Ice Sheets (Section 2.9.3) Typical CReSIS Radar Data after analysis
Figure 12: Radar Data Analysis for CReSIS Remote Sensing of Ice Sheets (Section 2.9.3) Typical flight
paths of data gathering in survey region
Figure 13: Radar Data Analysis for CReSIS Remote Sensing of Ice Sheets (Section 2.9.3). Typical echogram with Detected Boundaries. The upper (green) boundary is between air and ice layer while the lower (red) boundary is between ice and terrain
47

Figure 14 MERRA Analytic Services MERRA/AS (Section 2.9.6) Typical MERRA/AS Output
Figure 15: Atmospheric Turbulence - Event Discovery and Predictive Analytics (Section 2.9.7) Typical NASA image of turbulent waves
48
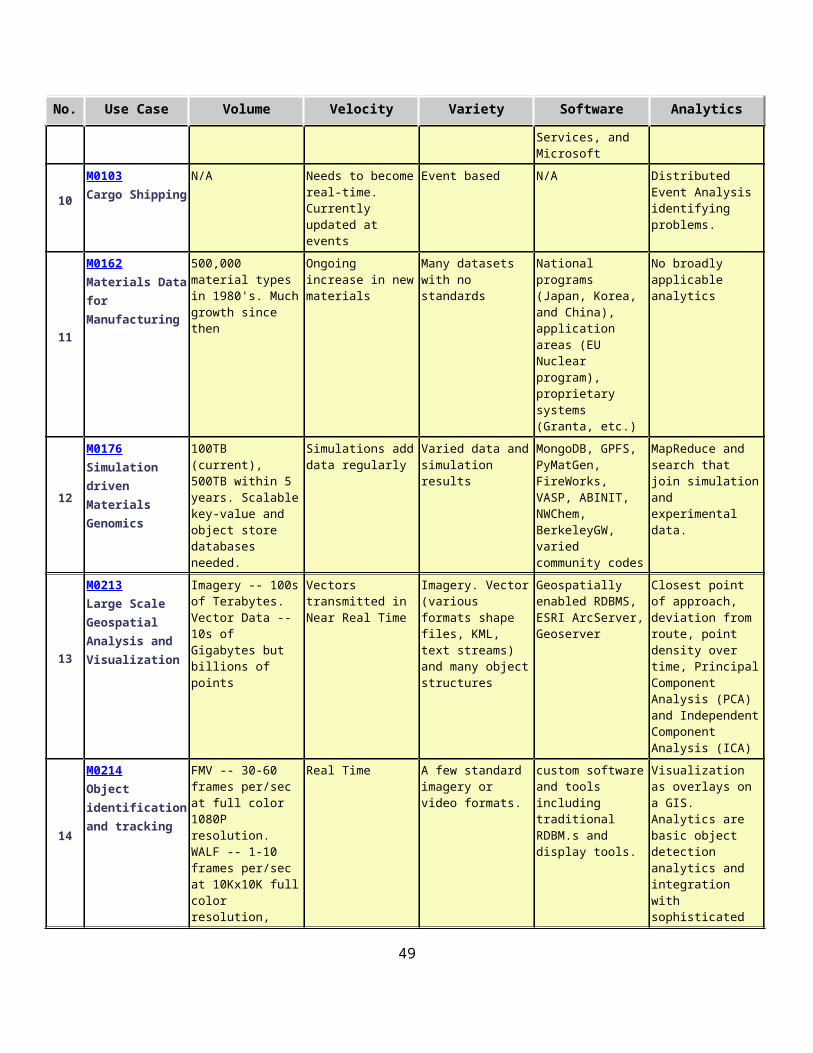
3 Use Case Requirements
There are two steps process involved with the requirement extraction. The first step is to extract specific requirements based from each application’s characteristics which includes detail information on (a) data sources (data size, file formats, rate of grow, at rest or in motion, etc.), (b) data lifecycle management (curation, conversion, quality check, pre-analytic processing, etc.), (c) data transformation (data fusion, analytics), (d) capability infrastructure (software tools, platform tools, hardware resources such as storage and networking), and (e) data usage (processed results in text, table, visual, and other formats). The second step is to aggregate each application’s specific requirements into high-level generalized requirements which are vendor neutral and technology agnostics. Note: These use cases and requirements are not exhaustive.
The following subsections are divided into (a) general requirements, (b) summary of all applications’ characteristics, (c) requirements analysis.
3.1 General Requirements
Data Sources Requirements (DSR)DSR-1: Needs to support reliable real time, asynchronize, streaming, and batch processing to collect data from centralized, distributed, and cloud data sources, sensors, or instrumentsDSR-2: Needs to support slow, bursty and high throughput data transmission between data sources and computing clusters.DSR-3: Needs to support diversified data content ranging from structured and unstructured text, document, graph, web, geospatial, compressed, timed, spatial, multimedia, simulation, and instrumental data. Transformation Provider Requirements (TPR)TPR-1: Needs to support diversified compute intensive, analytic processing and machines learning techniquesTPR-2: Needs to support batch and real time analytic processingTPR-3: Needs to support processing large diversified data content and modelingTPR_4: Needs to support processing data in motion (streaming, fetching new content, tracking, etc.) Capability Provider Requirements (CPR)CPR-1: Needs to support legacy and advance software packages (subcomponent: SaaS)CPR-2: Needs to support legacy and advance computing platforms (subcomponent: PaaS)CPR-3: Needs to support legacy and advance distributed computing cluster, co-processors, I/O processing (subcomponent: IaaS)CPR-4: Needs to support elastic data transmission (subcomponent: networking)CPR-5: Needs to support legacy, large, and advance distributed data storage (subcomponent: storage)
49
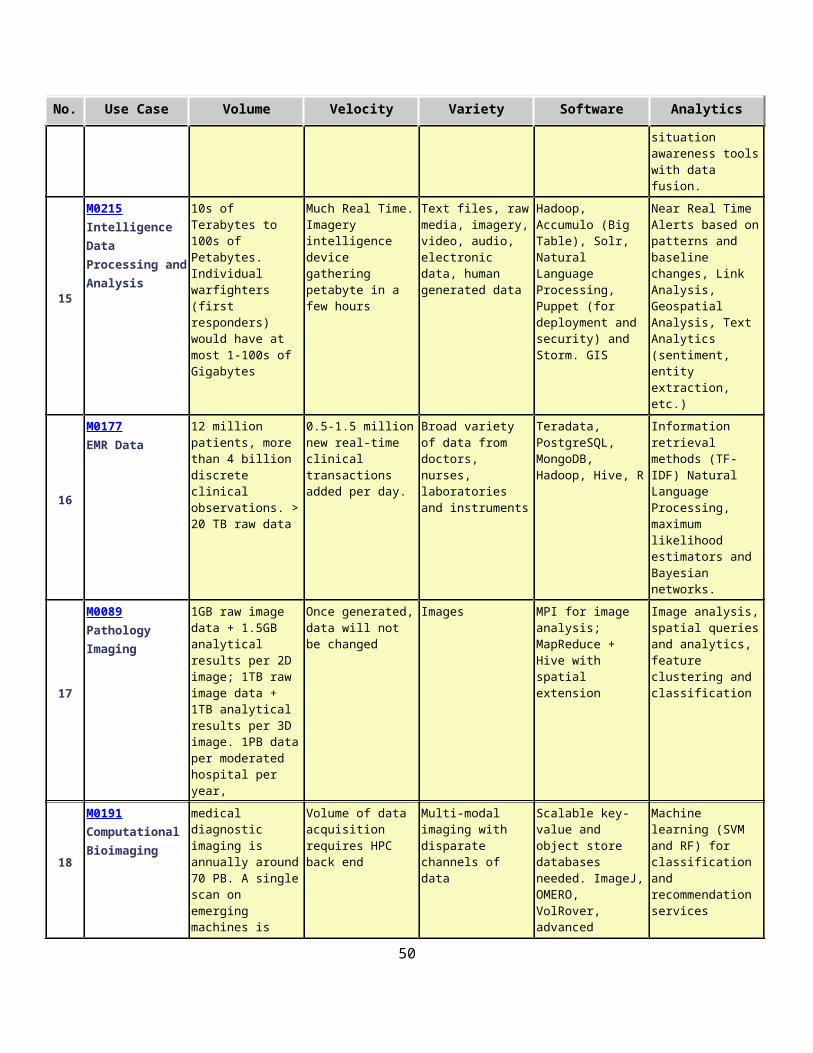
CPR-6: Needs to support legacy and advance programming executable, applications, tools, utilities, and libraries Data Consumer Requirements (DCR)DCR-1: Needs to support fast search (~0.1 seconds) from processed data with high relevancy, accuracy, and high recallDCR-2: Needs to support diversified output file formats for rendering and reportingDCR-3: Needs to support visual layout for results presentationDCR-4: Needs to support rich user interface for access using browser, visualization toolsDCR-5: Needs to support high resolution multi-dimension layer of data visualizationDCR-6: Needs to support streaming results to clients Security & Privacy Requirements (SPR)SPR-1: Needs to support protect and preserve security and privacy on sensitive dataSPR-2: Needs to support multi-level policy-driven, sandbox, access control, authentication on protected data Lifecycle Management Requirements (LMR) LMR-1: Needs to support data quality curation including pre-processing, format transformationLMR-2: Needs to support dynamic updates on data, user profiles, and linksLMR-3: Needs to support data lifecycle and long-term preservation policy including data provenanceLMR-4: Needs to support data validationLMR-5: Needs to support human annotation for data validationLMR-6: Needs to support prevention of data loss or corruptionLMR-7: Needs to support multi-sites archivalLMR-8: Needs to support persistent identifier Other Requirements (OR)OR-1: Needs to support rich user interface from mobile platforms to access processed resultsOR-2: Needs to support performance monitoring on analytic processing from mobile platformsOR-3: Needs to support rich visual content search and rendering from mobile platformsOR-4: Needs to support mobile device data acquisition
50
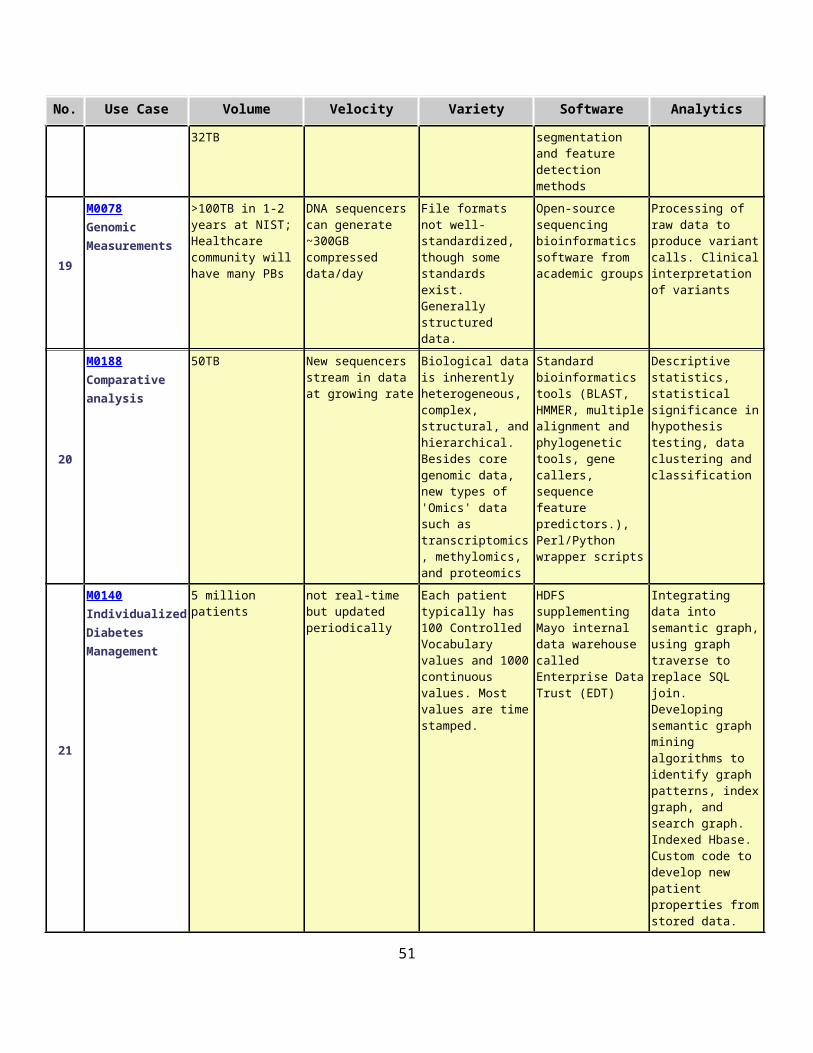
3.2 Use Case Requirements Summary
No. Use Case
DataSources Transformation Capabilities
Data Consumer
Security &Privacy
LifecycleManagement Others
1
M0147Census 2010 and 2000
1. large document format from a centralized storage
-- 1. large centralized storage (storage)
-- 1. Title 13 data 1. long-term preservation of data as-is for 75 years 2. long-term preservation at the bit-level 3. curation process including format transformation 4. access and analytics processing after 75 years 5. needs to make sure no data loss
--
2
M0148NARA: Search, Retrieve, Preservation
1. distributed data sources 2. large data storage 3. bursty data range from GB to hundreds of TB 4. wide variety of data formats including unstructured and structured data 5. distributed data sources in different clouds
1. crawl and index from distributed data sources 2. various analytics processing including ranking, data categorization, detect PII data 3. pre-processing of data 4. long-term preservation management fo large varied datasets. 5. hugh amount of data with high relevancy and recall.
1. large data storage 2. various storages such as NetApps, Hitachi, Magnetic tapes
1. high relevancy and high recall from search 2. high accuracy from categorization of records 3. various storages such as NetApps, Hitachi, Magnetic tapes
1. security policy 1. pre-process for virus scan 2. file format identification 3. indexing 4. categorize records
1. mobile search with similar interfaces/results from desktop
3 M0219Statistical Survey Response Improvement
1. data size approximately one petabyte
1. analytics are required for recommendation systems, continued monitoring and general survey improvement.
1. software includes Hadoop, Spark, Hive, R, SAS, Mahout, Allegrograph, MySQL, Oracle, Storm, BigMemory, Cassandra, Pig
1. data visualization for data review, operational activity and general analysis. It continues to evolve.
1. improving recommendation systems that reduce costs and improve quality while providing confidentiality safeguards that are reliable and publically auditable. 2. both confidential and secure all data.
1. high veracity on data and systems must be very robust. The semantic integrity of conceptual metadata concerning what exactly is measured and the resulting limits of inference remain a challenge
1. mobile access

No. Use Case
DataSources Transformation Capabilities
Data Consumer
Security &Privacy
LifecycleManagement Others
All processes must be auditable for security and confidentiality as required by various legal statutes.
4
M0222Non-Traditional Data in Statistical Survey Response Improvement
-- 1. analytics to create reliable estimates using data from traditional survey sources, government administrative data sources and non-traditional sources from the digital economy
1. software includes Hadoop, Spark, Hive, R, SAS, Mahout, Allegrograph, MySQL, Oracle, Storm, BigMemory, Cassandra, Pig
1. data visualization for data review, operational activity and general analysis. It continues to evolve.
1. both confidential and secure on all data. All processes must be auditable for security and confidentiality as required by various legal statutes.
1. high veracity on data and systems must be very robust. The semantic integrity of conceptual metadata concerning what exactly is measured and the resulting limits of inference remain a challenge
--
5M0175Cloud Eco-System
1. real time ingestion of data
1. real time analytic essential
-- -- 1. strong security and privacy constraints
-- 1. mobile access
6
M0161Mendeley
1. file-based documents with constant new uploads 2. variety of file types such as PDF, social network log files, client activities images, spreadsheet, presentation files
1. standard machine learning and analytics libraries 2. scalable and parallelized efficient way for matching between documents 3. third-party annotation tools or publisher watermarks and cover pages
1. EC2 with HDFS (infrastructure) 2. S3 (storage) 3. Hadoop (platform) 4. Scribe, Hive, Mahout, Python (language) 5. moderate storage (15 TB with 1TB/month) 6. needs to batch and real-time processing
1. custom built reporting tools 2. visualization tools such as networking graph, scatterplots, etc.
1. access controls for who.s reading what content
1. metadata management from PDF extraction 2. identify of document duplication 3. persistent identifier 4. metadata correlation between data repositories such as CrossRef, PubMed and Arxiv
1. Windows Android and iOS mobile devices for content deliverables from Windows desktops
7 M0164Netflix Movie Service
1. user profiles and ranking info
1. streaming video contents to multiple clients 2. analytic processing for matching clients. interest in movie selection 3. various analytic processing techniques for consumer personalization 4. robust learning
1. Hadoop (platform) 2. Pig (language) 3. Cassandra and Hive 4. huge subscribers, ratings, and searching per day (DB) 5. huge storage (2 PB) 6. I/O intensive processing
1. streaming and rendering media??
1. preservation of users. privacy and digital rights for media
1. continued ranking and updating based on user profile and analytic results
1. smart interface accessing movie content on mobile platforms
52
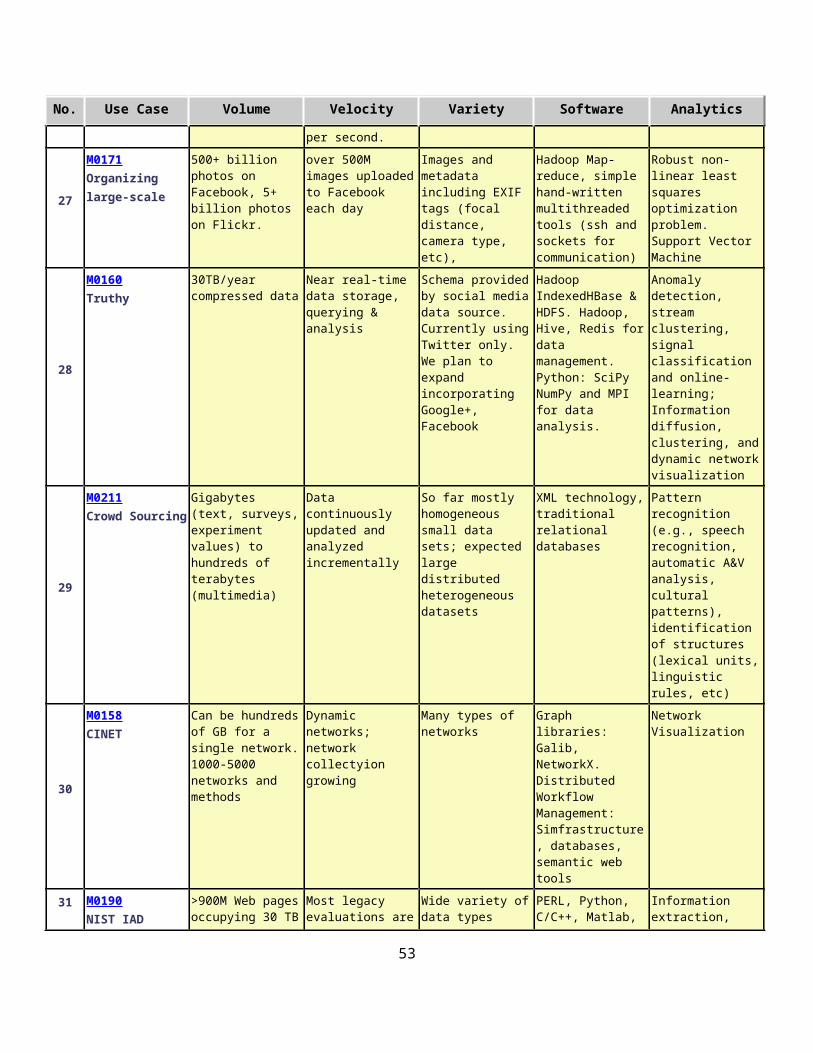
No. Use Case
DataSources Transformation Capabilities
Data Consumer
Security &Privacy
LifecycleManagement Others
algorithms 5. continued analytic processing based on the monitoring and performance results
8
M0165Web Search
1. Needs to support distributed data sources 2. Needs to support streaming data 3. Needs to support multimedia content
1. dynamic fetching content over the network 2. linking user profiles and social network data
1. petabytes of text and rich media (storage)
1. search time in ~0.1 seconds 2. top 10 ranked results 3. page layout (visual)
1. access control 2. needs to protect sensitive content
1. purge data after certain time interval (few months) 2. data cleaning
1. mobile search and rendering
9
M0137BC/DR) Within A Cloud Eco-System
-- 1. robust Backup algorithm 2. replicate recent changes
1. Hadoop 2. commercial cloud services
-- 1. strong security for many applications
-- --
10
M0103Cargo Shipping
1. centralized and real time distributed sites/sensors
1. tracking items based on the unique identification with its sensor information, GPS coordinates 2. real time updates on tracking items
1. Internet connectivity
-- 1. security policy -- --
11
M0162Materials Data for Manufacturing
1. distributed data repositories for more than 500,000 commerical materials 2. may varieties of datasets 3. text, graphics, and images
1. (100s) of independent variables by collecting these variables to create robust datasets
-- 1. visualization for materials discovery from many independent variables 2. visualization tools for multi-variable materials
1. protection of proprietary of sensitive data 2. tools to mask proprietary information
1. how to handle data quality is poor or unknown
--
12 M0176Simulation driven Materials Genomics
1. data streams from peta/exascale centralized simulation systems 2. distributed web dataflows from central gateway to users
1. high-throughput computing real-time data analysis for web-like responsiveness 2. mashup of simulation outputs across codes 3. search and
1. massive (150K cores) of legacy infrastructure (infrastructure) 2. GPFS (General Parallel File Sysem) (storage) 3. MonogDB systems (platform) 4. 10Gb
1. browser-based to search growing material data
1. sandbox as independent working areas between different data stakeholders 2. policy-driven federation of datasets
1. validation and UQ of simulation with experimental data 2. UQ in results from multiple datasets
1. mobile apps to access materials geonics information
53
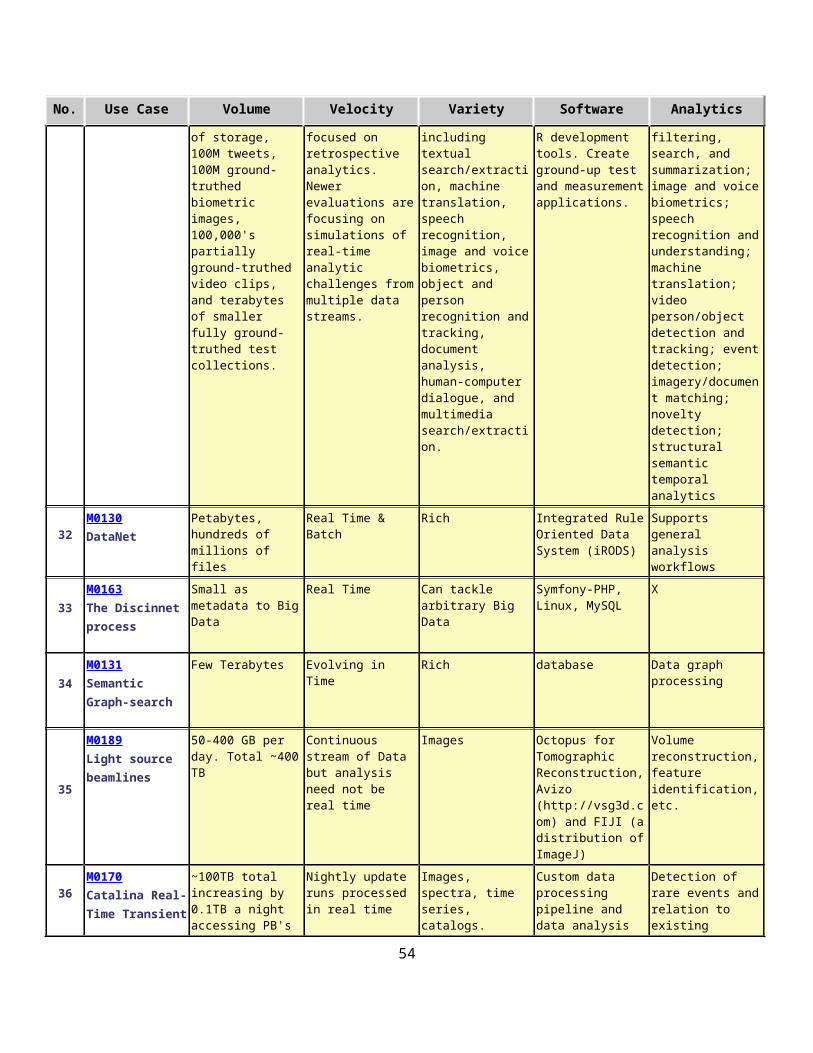
No. Use Case
DataSources Transformation Capabilities
Data Consumer
Security &Privacy
LifecycleManagement Others
crowd-driven with computation backend be flexibly for new targets 4. MapReduce and search to join simulation and experimental data
networking 5. various of analytic tools such as PyMatGen, FireWorks, VASP, ABINIT, NWChem, BerkeleyGW, varied community codes
6. large storage (storage) 7. scalable key-value and object store (platform) 8. data streams from peta/exascale centralized simulation systems
13
M0213Large Scale Geospatial Analysis and Visualization
1. geospatial data requires unique approaches to indexing and distributed analysis.
1. analytics include Closest point of approach, deviation from route, point density over time, PCA and ICA 2. geospatial data requires unique approaches to indexing and distributed analysis.
1. software includes Geospatially enabled RDBMS, Geospatial server/analysis software – ESRI ArcServer, Geoserver
1. visualization with GIS at high and low network bandwidths and on dedicated facilities and handhelds
1. sensitive data and must be completely secure in transit and at rest (particularly on handhelds)
-- --
14
M0214Object identification and tracking
1. real-time data FMV – 30-60 frames per/sec at full color 1080P resolution and WALF – 1-10 frames per/sec at 10Kx10K full color resolution.
1. Rich analytics with object identification, pattern recognition, crowd behavior, economic activity and data fusion
1. wide range custom software and tools including traditional RDBM’s and display tools. 2. several network requirements 3. GPU Usage important
1. visualization of extracted outputs will typically be as overlays on a geospatial display. Overlay objects should be links back to the originating image/video segment. 2. output the form of OGC compliant web features or standard geospatial files (shape files, KML).
1. significant security and privacy, sources and methods cannot be compromised the enemy should not be able to know what we see.
1. veracity of extracted objects
--
54

No. Use Case
DataSources Transformation Capabilities
Data Consumer
Security &Privacy
LifecycleManagement Others
15
M0215Intelligence Data Processing and Analysis
1. much of Data real-time with processing at worst near real time 2. data currently exists in disparate silos which must be accessible through a semantically integrated data space 3. diverse data includes text files, raw media, imagery, video, audio, electronic data, human generated data.
1. analytics include NRT Alerts based on patterns and baseline changes
1. tolerance of Unreliable networks to warfighter and remote sensors 2. up to 100.s PB.s data supported by modest to large clusters and clouds 3. software includes Hadoop, Accumulo (Big Table), Solr, NLP (several variants), Puppet (for deployment and security), Storm, Custom applications and visualization tools
1. primary visualizations will be Geospatial overlays (GIS) and network diagrams.
1. data must be protected against unauthorized access or disclosure and tampering
1. data provenance (e.g. tracking of all transfers and transformations) must be tracked over the life of the data.
--
16 M0177EMR Data
1. heterogeneous, high-volume, diverse data sources 2. volume: > 12 million entities (patients), > 4 billion records or data points (discrete clinical observations) aggregate of > 20 TB raw data 3. velocity: 500,000 - 1.5 million new transactions per day 4. variety: Formats include numeric, structured numeric, free-text, structured text, discrete nominal, discrete ordinal, discrete structured, binary large blobs (images and video). 5. data evolves over time in a highly variable
1. a comprehensive and consistent view of data across sources, and over time 2. analytic techniques: Information retrieval, natural language processing, machine learning decision-models, maximum likelihood estimators and Bayesian networks
1. Hadoop, Hive, R. Unix-based 2. Cray supercomputer 3. Teradata, PostgreSQL, MongoDB 4. various, with significant I/O intensive processing
1. needs to provide results of analytics for use by data consumers / stakeholders - ie, those who did not actually perform the analysis. Specific visualization techniques
1. data consumers may access data directly, AND refer to the results of analytics performed by informatics research scientists and health service researchers. 2. all health data is protected in compliance with governmental regulations. 3. protection of data in accordance with data providers. policies. 4. security and privacy policies may be unique to a subset of the data. 5. robust security to prevent data breaches.
1. standardize, aggregate, and normalize data from disparate sources 2. the needs to reduce errors and bias 3. common nomenclature and classification of content across disparate sources. This is particularly challenging in the health IT space, as the taxonomies continue to evolve - SNOMED, ICD 9 and future ICD 10, etc.
1. security across mobile devices.
55
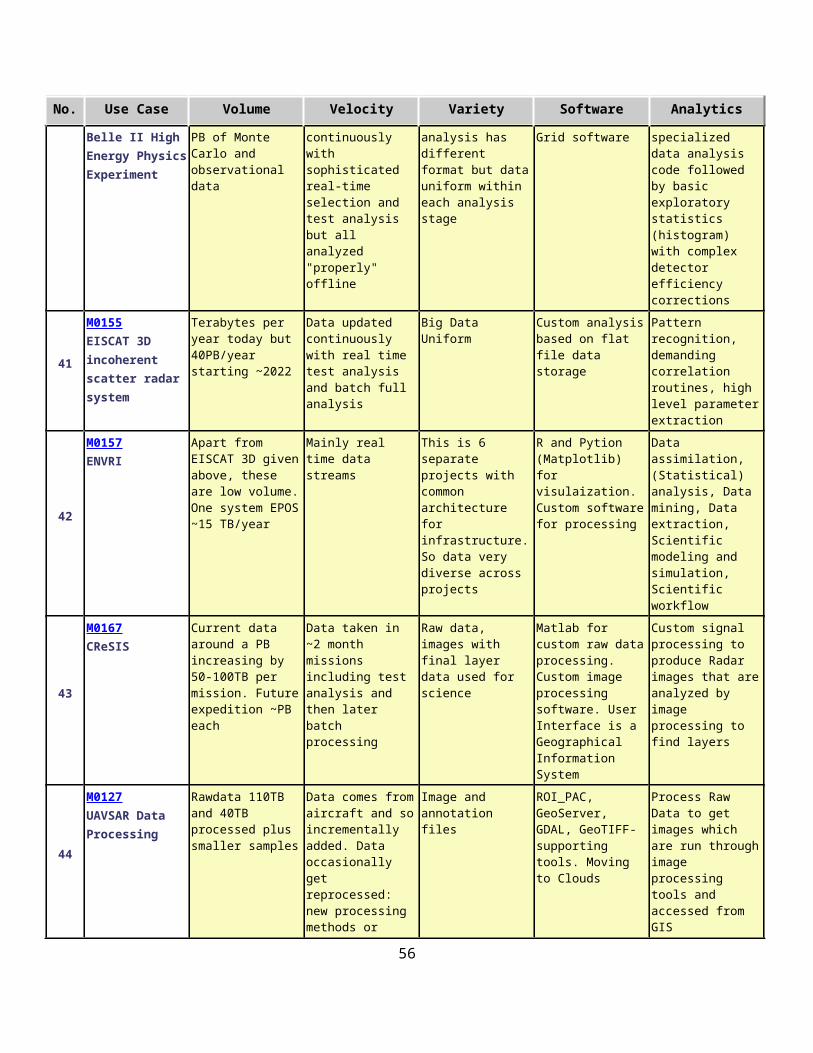
No. Use Case
DataSources Transformation Capabilities
Data Consumer
Security &Privacy
LifecycleManagement Others
fashion
17
M0089Pathology Imaging
1. high resolution spatial digitized pathology images
2. various image quality analysis algorithms 3. various image data formats especially BIGTIFF with structured data for analytical results 4. image analysis, spatial queries and analytics, feature clustering and classification
1. high performance image analysis to extract spatial information 2. spatial queries and analytics, and feature clustering and classification 3. analytic processing on huge multi-dimensional large dataset and be able to correlate with other data types such as clinical data, -omic data.
1. legacy system and cloud (computing cluster) 2. huge legacy and new storage such as SAN or HDFS (storage) 3. high throughput network link (networking) 4. MPI image analysis, MapReduce, Hive with spatial extension (sw pkgs)
1. visualization for validation and training
1. security and privacy protection for protected health information
1. human annotations for validation
1. 3D visualization and rendering on mobile platforms
18 M0191Computational Bioimaging
1. distributed multi-modal high resolution experimental sources of bioimages (instruments). 2. 50TB of data data formats include images.
1. high-throughput computing with responsive analysis 2. segmentation of regions of interest, crowd-based selection and extraction of features, and object classification, and organization, and search. 3. advance biosciences discovery through big data techniques / extreme scale computing…. In-database processing and analytics. … Machine learning (SVM and RF) for classification and recommendation services. … advanced algorithms for massive image analysis. High-performance computational
1. ImageJ, OMERO, VolRover, advanced segmentation and feature detection methods from applied math researchers.... Scalable key-value and object store databases needed. 2. NERSC.s Hopper infrastructure 3. database and image collections. 4. 10 GB and future 100 GB and advanced networking (SDN).
1. 3D structural modeling
1. significant but optional security & privacy including secure servers and anonymization
1. workflow components include data acquisition, storage, enhancement, minimizing noise
--
56
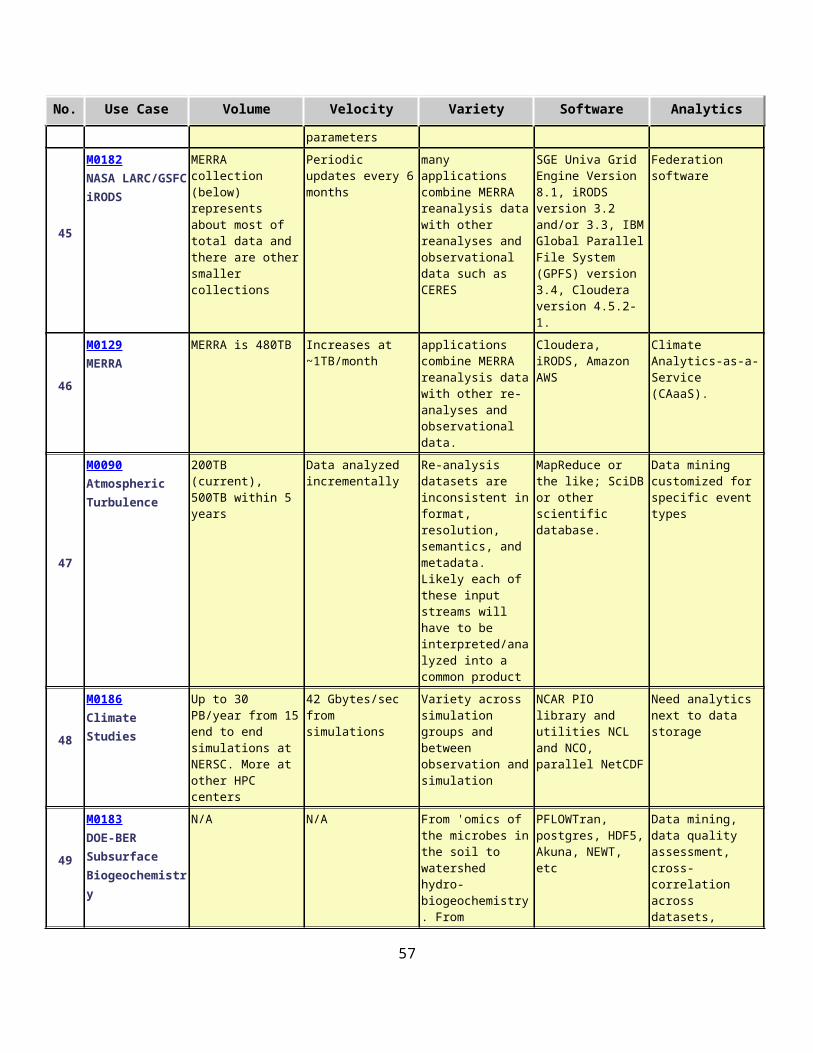
No. Use Case
DataSources Transformation Capabilities
Data Consumer
Security &Privacy
LifecycleManagement Others
solutions. 4. massive data analysis toward massive imaging data sets.
19
M0078Genomic Measurements
1. high throughput compressed data (300GB/day) from various DNA sequencers 2. distributed data source (sequencers) 3. various file formats either structured and unstructured data
1. for processing raw data in variant calls 2. machine learning for complex analysis on systematic errors from sequencing technologies are hard to characterize
1. legacy computing cluster and other PaaS and IaaS (computing cluster) 2. huge data storage in PB range (storage) 3. Unix-based legacy sequencing bioinformatics software (sw pkg)
1. data format for Genome browsers
1. security and privacy protection on health records and clinical research databases
-- 1. mobile platforms for physicians accessing genomic data (mobile device)
20 M0188Comparative analysis
1. multiple centralized data sources 2. proteins and their structural features, core genomic data, new types of “Omics” data such as transcriptomics, methylomics, and proteomics describing gene expression 3. Front real time Web UI interactive. Back end data loading processing must keep up with exponential growth of sequence data due to the rapid drop in cost of sequencing technology. 4. heterogeneous, complex, structural, and hierarchical biological data. 5. metagenomic samples can vary by several orders of magnitude, such as several
2. scalable RDMS for heterogeneity biological data 2. real-time rapid and parallel bulk loading 3. Oracle RDBMS, SQLite files, flat text files, Lucy (a version of Lucene) for keyword searches, BLAST databases, USEARCH databases 4. Linux cluster, Oracle RDBMS server, large memory machines, standard Linux interactive hosts 5. sequencing and comparative analysis techniques for highly complex data 6. descriptive statistics
1. huge data storage
1. real time interactive parallel bulk loading capability
2. interactive Web UI, backend precomputations, batch job computation submission from the UL 3. download assembled and annotated datasets for offline analysis. 4. ability to query and browse data via interactive Web UI. 5. visualize structure [of data] at different levels of resolution. Ability to view abstract representations of highly similar data.
1. login security - username and password 2. creation of user account to submit and access dataset to system via web interface 3. single sign on capability (SSO)
1. methods to improve data quality required. 2. data clustering, classification, reduction. 3. Integrate new data / content into the system.s data store annotate data
--
57

No. Use Case
DataSources Transformation Capabilities
Data Consumer
Security &Privacy
LifecycleManagement Others
hundred thousand genes to a billion genes
21
M0140Individualized Diabetes Management
1. distributed EHR data 2. over 5 million patients with thousands of properties each and many more that are derived from primary values. 3. each record, a range of 100 to 100,000 data property values average of 100 controlled vocabulary values and 1000 continuous values. 4. none real-time but data updated periodically. Data is timestamped with the time of observation [time that the value is recorded.] 5. structured data about a patient falls into two main categories: data with controlled vocabulary [CV] property values, and continuous property values [which are recorded / captured more frequently]. 6. data consists of text, and Continuous Numerical values.
1. data integration, using ontological annotation and taxonomies 2. parallel retrieval algorithms for both indexed and custom searches, identify data of interest. Patient cohorts, patients meeting certain criteria, patients sharing similar characteristics 3. distributed graph mining algorithms, pattern analysis and graph indexing, pattern searching on RDF triple graphs
4. robust statistical analysis tools to manage false discovery rate, determine true subgraph significance, validate results, eliminate false positive / false negative results 5. semantic graph mining algorithms to identify graph patterns, index and search graph.
6. Semantic graph traversal.
1. data warehouse, open source indexed Hbase 2. supercomputers, cloud and parallel computing 3. I/O intensive processing 4. HDFS storage 5. custom code to develop new properties from stored data.
1. efficient data-graph based visualization is needed
1. protection of health data in accordance with legal requirements - eg, HIPAA - and privacy policies. 2. security policies for different user roles.
1. data annotated based on domain ontologies or taxonomies. 2. to ensure traceability of data, from origin [initial point of collection] through to use. 3. convert data from existing data warehouse into RDF triples
1. mobile access
22 M0174Statistical Relational Artificial Intelligence for
1. centralized data, with some data retrieved from internet sources 2. range from 100.s of GB
1. relational probabalistic models / probability therory, software learns models from multiple
1. Java, some in house tools, [relational] database and NoSQL stores 2. cloud and parallel
1. visualization of subsets of very large data
1. secure handling and processing of data is of crucial importance in medical domains
1. merging multiple tables before analysis 2. methods to validate data to minimize errors
--
58
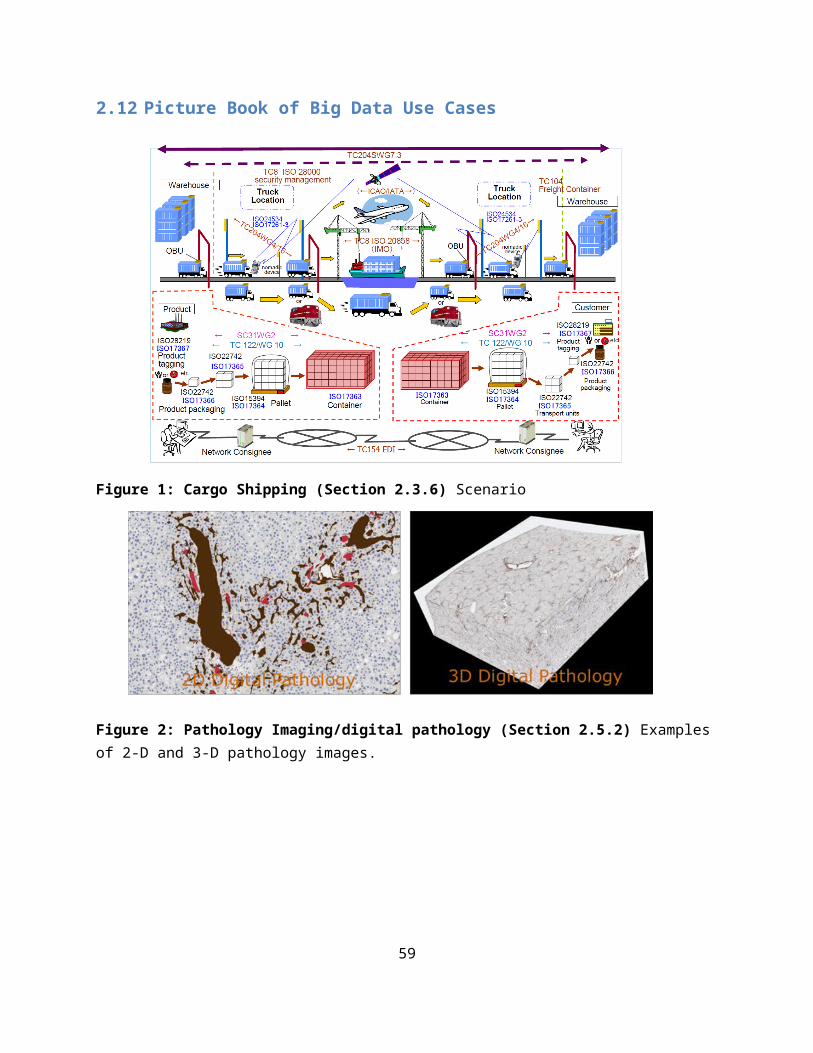
No. Use Case
DataSources Transformation Capabilities
Data Consumer
Security &Privacy
LifecycleManagement Others
Health Care
sample size, to 1 petabyte for very large studies 3. both constant updates / additions [to subset of data] and scheduled batch inputs 4. large, multi-modal, longitudinal data 5. rich relational data comprised of multiple tables, different data types such as imaging, EHR, demographic, genetic and natural language data requiring rich representation 6. unpredictable arrival rates, in many cases data arrive in real-time
data types and can possibly integrate the information and reason about complex queries. 2. robust and accurate learning methods to account for .data imbalance. [where large amount of data is available for a small number of subjects] 3. learning algorithms to identify skews in data, so as to not -- incorrectly -- model .noise. 4. learned models can be generalized and refined in order to be applied to diverse sets of data 5. challenging, must accept data in different modalities [and from disparate sources]
computing 3. high performance computer, 48 GB RAM [to performa analysis for a moderate sample size] 4. clusters for large datasets 5. 200 GB - 1 TB hard drive for test data
23
M0172World Population Scale Epidemiological Study
1. file-based synthetic population either centralized or distributed sites 2. large volume real time output data 3. variety of output datasets depends on the complexity of the model
1. compute intensive and data intensive computation like supercomputer.s performance 2. unstructured and irregular nature of graph processing 3. summary of various runs of simulation
1. movement of very large amount of data for visualization (networking) 2. distributed MPI-based simulation system (platform) 3. Charm++ on multi-nodes (software) 4. network file system (storage) 5. infiniband network (networking)
1. visualization 1. protection of PII on individuals used in modeling 2. data protection and secure platform for computation
1. data quality and be able capture the traceability of quality from computation
--
24 M0173Social Contagion Modeling
1. traditional and new architecture for dynamic distributed processing on
1. large scale modeling for various events (disease, emotions,
1. computing infrastructure which can capture human-to-human
1. multi-levels detail network representations 2. visualization with interactions
1. protection of PII on individuals used in modeling 2. data protection and secure
1. data fusion from variety of dta sources 2. data consistency and
1. efficient method of moving data
59

No. Use Case
DataSources Transformation Capabilities
Data Consumer
Security &Privacy
LifecycleManagement Others
for Planning
commondity clusters 2. fine-resolution models and datasets in to support Twitter network traffic 3. huge data storage per year
behaviors, etc.) 2. scalable fusion between combined datasets 3. multi-levels analysis while generate sufficient results quickly
interactions on various social events via the Internet (infrastructure) 2. file servers and databases (platform) 3. Ethernet and Infiniband networking (networking) 4. specialized simulators, open source software, and proprietary modeling (application) 5. huge user accounts across country boundaries (networking)
platform for computation
no corruption 3. preprocessing of raw data
25
M0141Biodiversity and LifeWatch
1. special dedicated or overlay sensor network 2. storage Distributed, historical and trends data archiving 3. data sources distributed, and include observation and monitoring facilities, sensor network, and satellites. 4. wide variety of data, including satellite images/information, climate and weather data, photos, video, sound recordings… 5. multi-type data combination and linkage potentially unlimited data variety 6. data streaming
1. Web Services based, Grid based services, relational databases and NoSQL 2. personalized virtual labs 3. grid and cloud based resources 4. data analysed incrementally and/or real-time at varying rates due to variations in source processes. 5. a variety of data, analytical and modeling tools to support analytics for diverse scientific communities. 6. parallel data streams and streaming analytics 7. access and integration of multiple distributed databases
1. expandable on-demand based storage resource for global users 2. cloud community resource required
1. access by mobile users 2. advanced / rich / high definition visualization 3. 4D visualization computational models
1. Federated identity management for mobile researchers and mobile sensors 2. access control and accounting
1. data storage and archiving, data exchange and integration 2. data lifecycle management: data provenance, referral integrity and identification traceability back to initial observational data 3. [In addition to original source data,] processed (secondary) data may be stored for future uses 4. provenance (and persistent identification (PID)) control of data, algorithms, and workflows 5. curated (authorized) reference data (i.e. species names lists), algorithms, software code, workflows
--
26 M0136 -- -- 1. GPU -- -- -- --
60
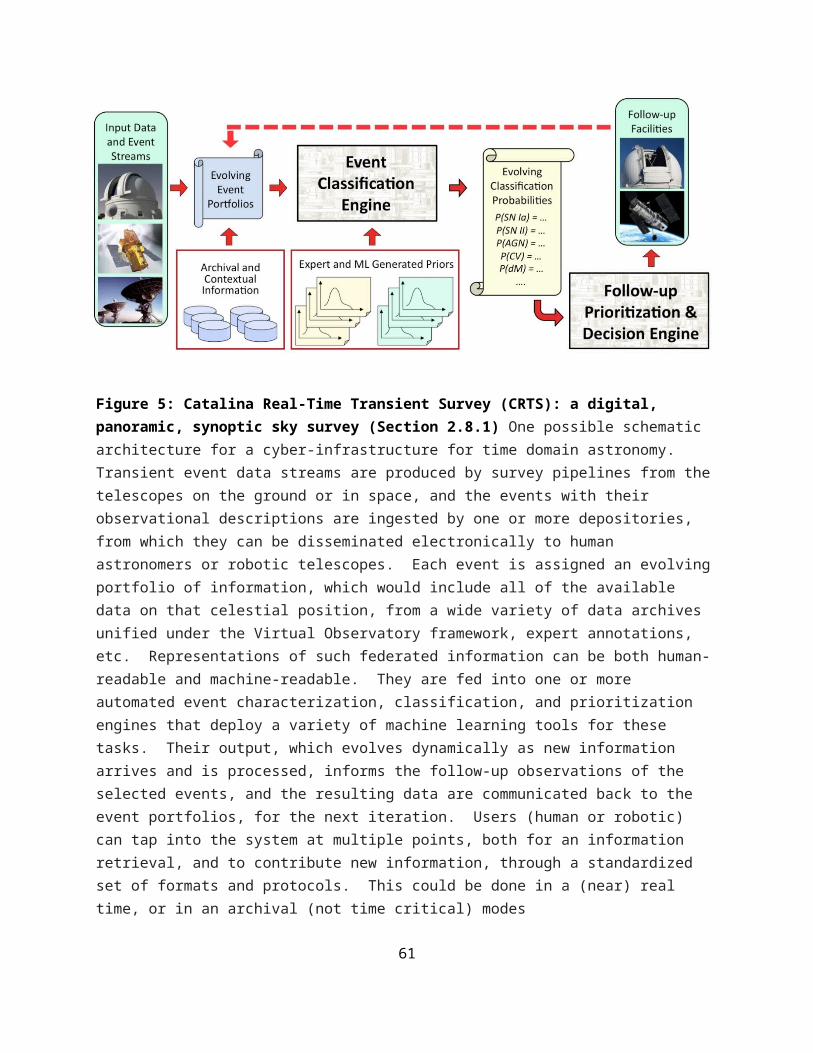
No. Use Case
DataSources Transformation Capabilities
Data Consumer
Security &Privacy
LifecycleManagement Others
Large-scale Deep Learning
2. high performance MPI and HPC Infiniband cluster
3. libraries for single-machine or single-GPU computation are available (e.g., BLAS, CuBLAS, MAGMA, etc.), distributed computation of dense BLAS-like or LAPACK-like operations on GPUs remains poorly developed. Existing solutions (e.g., ScaLapack for CPUs) are not well-integrated with higher level languages and require low-level programming which lengthens experiment and development time.
27
M0171Organizing large-scale
1. over 500M images uploaded to social media sites each day
1. classifier (e.g. a Support Vector Machine), a process that is often hard to parallelize. 2. features seen in many large scale image processing problems
1. Hadoop or enhanced MapReduce
1. visualize large-scale 3-d reconstructions, and navigate large-scale collections of images that have been aligned to maps.
1. preserve privacy for users and digital rights for media.
-- --
28
M0160Truthy
1. distributed data sources 2. large volume real time streaming 3. raw data in compressed formats 4. fully structured data in JSON, users metadata, geo-locations data 5. multiple data schemas
1. various real time data analysis for anomaly detection, stream clustering, signal classification on multi-dimensional time series and online-learning
1. Hadoop and HDFS (platform) 2. IndexedHBase, Hive, SciPy, NumPy (software) 3. in-memory database, MPI (platform) 4. high-speed Infiniband network (networking)
1. data retrieval and dynamic visualization 2. data driven interactive web interfaces 3. API for data query
1. security and privacy policy
1. standardized data structured/formats with extremely high data quality
1. low-level data storage infrastructure for efficient mobile access to data
61
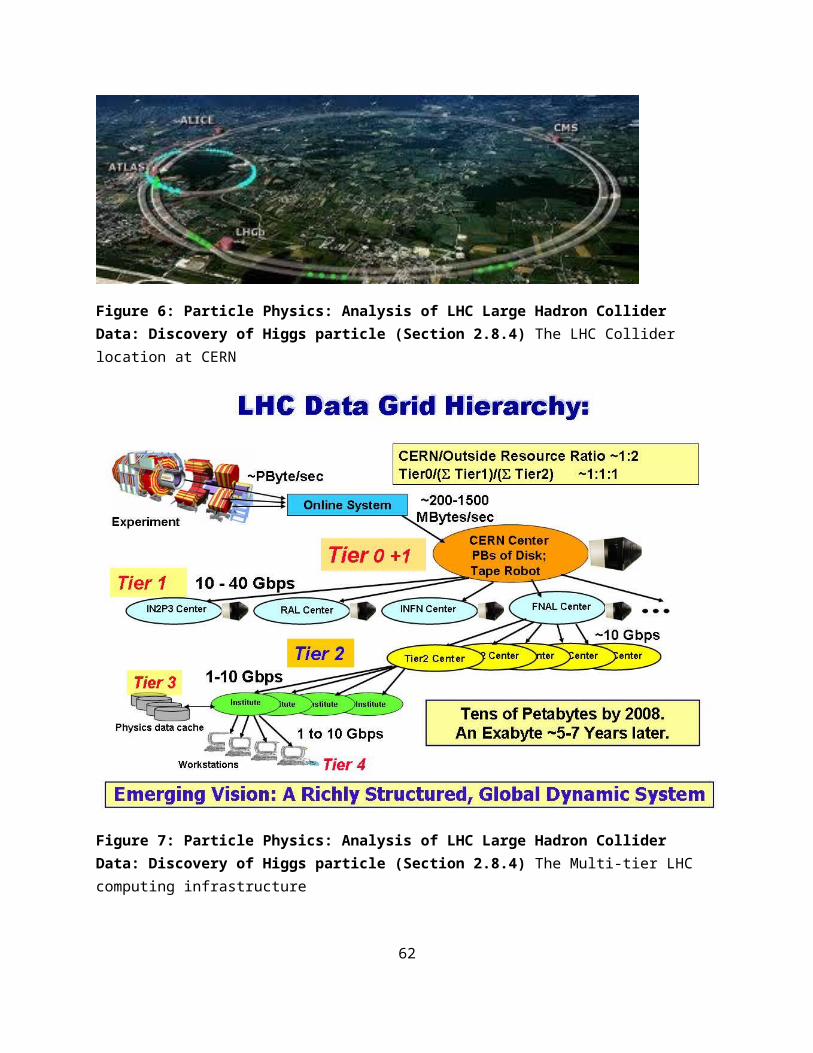
No. Use Case
DataSources Transformation Capabilities
Data Consumer
Security &Privacy
LifecycleManagement Others
29
M0211Crowd Sourcing
-- 1. digitize existing audio-video, photo and documents archives 2. analytics include pattern recognition of all kind (e.g., speech recognition, automatic A&V analysis, cultural patterns), identification of structures (lexical units, linguistic rules, etc.)
-- -- 1. privacy issues in preserving anonymity of responses in spite of computer recording of access ID and reverse engineering of unusual user responses
-- --
30
M0158CINET
1. a set of network topologies file to study graph theoretic properties and behaviors of various algorithms 2. asynchronous and real time synchronous distributed computing
1. environments to run various network and graph analysis tools 2. dynamic grow of the networks 3. asynchronous and real time synchronous distributed computing 4. different parallel algorithms for different partitioning schemes for efficient operation
1. large file system (storage) 2. various network connectivity (networking) 3. existing computing cluster
4. EC2 computing cluster
5. various graph libraries, management toos, databases, semantic web tools
1. client side visualization
-- -- --
31 M0190NIST IAD
1. large amounts of semi-annotated web pages, tweets, images, video 2. scaling ground-truthing to larger data, intrinsic and annotation uncertainty measurement, performance measurement for incompletely annotated data, measuring analytic performance for heterogeneous data and analytic
1. analytic algorithms working with written language, speech, human imagery, etc. must generally be tested against real or realistic data. It’s extremely challenging to engineer artificial data that sufficiently captures the variability of real data involving humans
1. PERL, Python, C/C++, Matlab, R development tools. Create ground-up test and measurement applications
1. analytic flows involving users
1. security requirements for protecting sensitive data while enabling meaningful developmental performance evaluation. Shared evaluation testbeds must protect the intellectual property of analytic algorithm developers
-- --
62
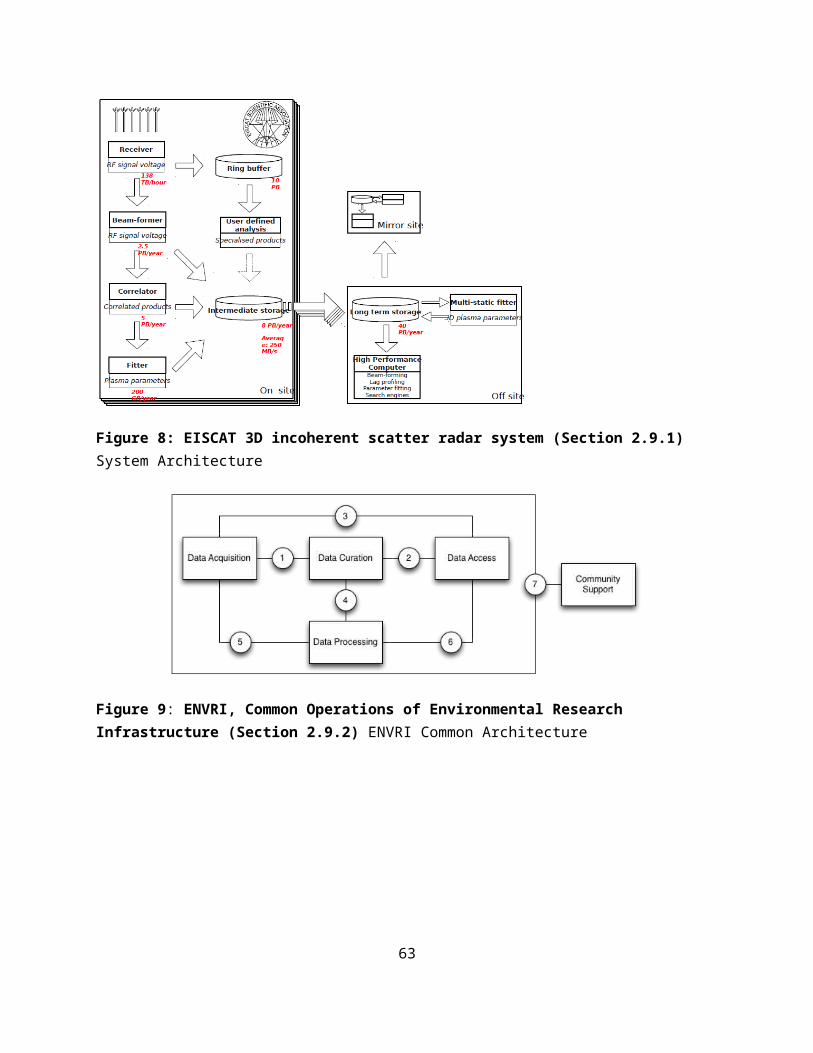
No. Use Case
DataSources Transformation Capabilities
Data Consumer
Security &Privacy
LifecycleManagement Others
flows involving users
32
M0130DataNet
1. process key format types NetCDF, HDF5, Dicom 2. real-time and batch data
1. needs to provide general analytics workflows
1. iRODS data management software 2. interoperability across Storage and Network Protocol Types
1. general visulaization workflows
1. Federate across existing authentication environments through Generic Security Service API and Pluggable Authentication Modules (GSI, Kerberos, InCommon, Shibboleth). 2. access controls on files independently of the storage location.
-- --
33
M0163The Discinnet process
1. integration of metadata approaches across disciplines
-- 1. software: Symfony-PHP, Linux, MySQL
-- 1. significant but optional security & privacy including secure servers and anonymization
1. integration of metadata approaches across disciplines
--
34
M0131Semantic Graph-search
1. all data types, image to text, structures to protein sequence
1. data graph processing 2. RDMS
1. cloud community resource required
1. efficient data-graph based visualization is needed
-- -- --
35
M0189Light source beamlines
1. multiple streams of real time data to be stored and analyzed later 2. sample data to be analyzed in real time
1. standard bioinformatics tools (BLAST, HMMER, multiple alignment and phylogenetic tools, gene callers, sequence feature predictors…), Perl/Python wrapper scripts, Linux Cluster scheduling
1. high volume data transfer to remote batch processing resource
-- 1. multiple security & privacy requirements to be satisfied
-- --
36 M0170Catalina Real-Time Transient Survey
1. ~0.1TB per day at present will increase by factor 100
1. a wide variety of the existing astronomical data analysis tools, plus a large amount of custom developed tools and software, some of it a
-- 1. visualization mechanisms for highly dimensional data parameter spaces
-- -- --
63

No. Use Case
DataSources Transformation Capabilities
Data Consumer
Security &Privacy
LifecycleManagement Others
research project in itself 2. automated classification with machine learning tools given the very sparse and heterogeneous data, dynamically evolving in time as more data come in, with follow-up decision making reflecting limited follow up resources
37
M0185DOE Extreme Data
1. ~1 PB per year becoming 7PB a year observational datal
1. interpretation of results from detailed simulations requires advanced analysis and visualization techniques and capabilities
1. MPI, OpenMP, C, C++, F90, FFTW, viz packages, python, FFTW, numpy, Boost, OpenMP, ScaLAPCK, PSQL & MySQL databases, Eigen, cfitsio, astrometry.net, and Minuit2 2. supercomputer I/O subsystem limitations must be addressed
1. interpretation of results using advanced visualization techniques and capabilities
-- -- --
38
M0209Large Survey Data for Cosmology
1. 20TB data per day
1. analysis on both the simulation and observational data simultaneously 2. techniques for handling Cholesky decompostion for thousands of simulations with matricies of order 1M on a side
1. standard astrophysics reduction software as well as Perl/Python wrapper scripts 2. Oracle RDBMS, Postgres psql, as well as GPFS and Lustre file systems and tape archives 3. parallel image storage
-- -- 1. links between remote telescopes and central analysis sites
--
39 M0166Particle Physics
1. real time data from Accelerator and Analysis instruments 2. asynchronization data collection
1. experimental data from ALICE, ATLAS, CMS, LHb 2. histograms, scatter-plots with model fits
1. legacy computing infrastructure (computing nodes) 2. distributed cached files
1. histograms and model fits (visual)
1. data protection 1. data quality on complex apparatus
--
64
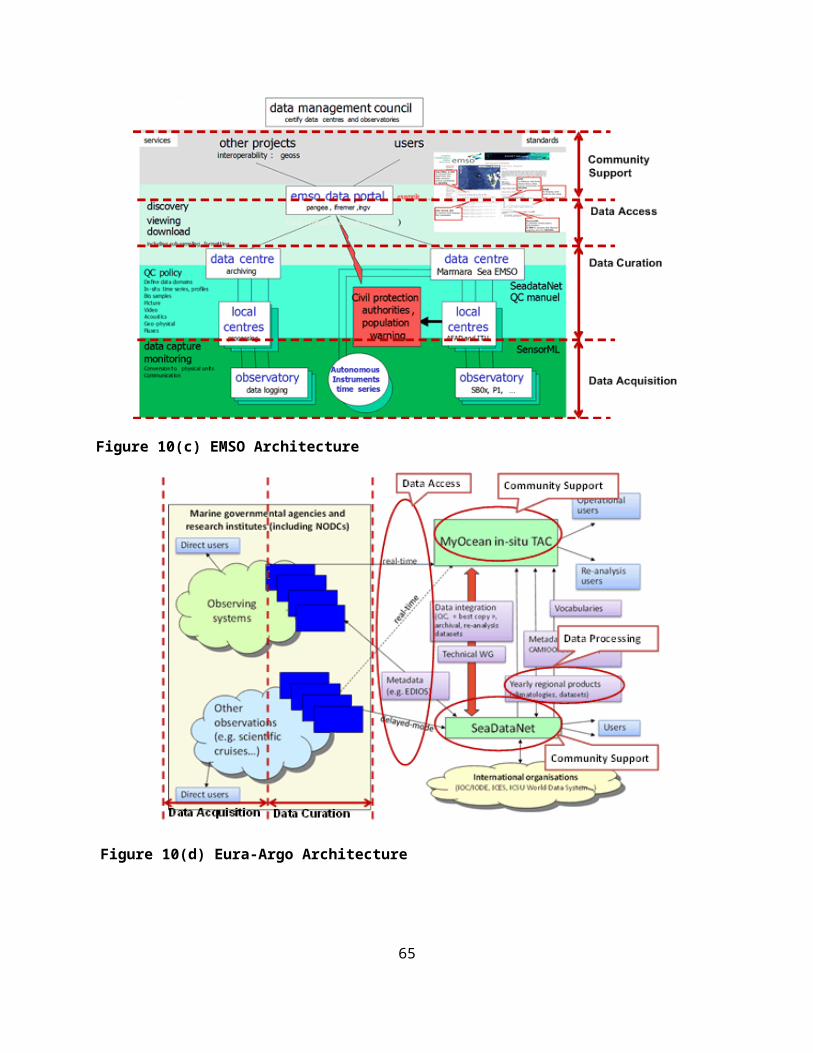
No. Use Case
DataSources Transformation Capabilities
Data Consumer
Security &Privacy
LifecycleManagement Others
3. calibration of instruments
3. Monte-Carlo computations
(storage) 3. object databases (sw pkg)
40
M0210Belle II High Energy Physics Experiment
1. 120PB Raw data
-- 1. 120PB Raw data 2. International distributed computing model to augment that at acceleartor (Japan) 3. data transfer of ~20Gbps at designed luminosity between Japan and US 4. software from Open Science Grid, Geant4, DIRAC, FTS, Belle II framework
-- 1. standard Grid authentication
-- --
41
M0155EISCAT 3D incoherent scatter radar system
1. remote sites generating 40PB data per year by 2022 2. HDF5 data format 3. visualization of high (>=5) dimension data
1. Queen Bea architecture with mix of distributed on-sensor and central processing for 5 distributed sites 2. realtime monitoring of equipment by partial streaming analysis 3. needs to host rich set of Radar image processing services using machine learning, statistical modelling, and graph algorithms
1. architecture compatible with ENVRI Environmental Research Infrastructure collaboration
1. needs to suupport visualization of high (>=5) dimension data
-- 1. preservation of data and avoid lost data due to instrument malfunction
1. needs to suupport realtime monitoring of equipment by partial streaming analysis
42
M0157ENVRI
1. huge volume real time distributed data sources 2. variety of instrumentation datasets and metadata
1. diversified analytics tools
1. variety of computing infrastructures and architectures (infrastructure) 2. scattered repositories (storage)
1. graph plotting tools 2. time-series interactive tools 3. brower-based flash playback 4. earth high-resolution map display 5. visual tools for quality comparisons
1. open data policy with minor restrictions
1. high quality on data 2. mirror archives
3. various metadata frameworks 4. scattered repositories and data curation
1. various kind of mobile sensor devices for data acquisition
65

No. Use Case
DataSources Transformation Capabilities
Data Consumer
Security &Privacy
LifecycleManagement Others
43
M0167CReSIS
1. needs to provide reliable data transmission from aircraft sensors/instruments or removable disks from remote sites 2. data gathering in real time 3. varieties of datasets
1. legacy software (Matlab) and language (C/Java) binding for processing 2. needs signal processing and advance image processing to find layers
1. ~0.5 Petabytes/year of raw data 2. transfer content from removable disk to computing cluster for parallel processing 3. MapReduce or MPI plus language binding for C/Java
1. GIS user interface 2. rich user interface for simulations
1. security and privacy on political sensitive issues 2. dynamic security and privacy policy mechanisms
1. data quality assurance
1. monitoring data collection instruments/sensors
44
M0127UAVSAR Data Processing
1. angular as well as spatial data 2. compatibility with other NASA Radar systems and repositories (Alaska Satellite Facility)
1. geolocated data requires GIS integration of data as custom overlays 2. significant human intervention in data processing pipeline 3. host rich set of Radar image processing services 4. ROI_PAC, GeoServer, GDAL, GeoTIFF-supporting tools
1. interoperable Cloud-HPC architecture should be supported 2. host rich set of Radar image processing services 3. ROI_PAC, GeoServer, GDAL, GeoTIFF-supporting tools 4. compatibility with other NASA Radar systems and repositories (Alaska Satellite Facility)
1. needs to suupport Support field expedition users with phone/tablet interface and low resolution downloads
-- 1. significant human intervention in data processing pipeline 2. rich robust provenance defining complex machine/human processing
1. needs to suupport Support field expedition users with phone/tablet interface and low resolution downloads
45
M0182NASA LARC/GSFC iRODS
1. Federate distributed heterogeneous datasets
1. Climate Analytics as a Service on Clouds
1. Support virtual Climate Data Server (vCDS) 2. GPFS Parallel File System integrated with Hadoop 3. iRODS
1. needs to suupport visualize distributed heterogeneous data
-- -- --
46
M0129MERRA
1. Integrate simulation output and observational data, NetCDF files 2. real time and batch mode both needed 3. Interoperable Use of Amazon AWS and local clusters 4. iRODS data management
1. Climate Analytics as a Service on Clouds
1. NetCDF aware software 2. MapReduce 3. Interoperable Use of Amazon AWS and local clusters
1. high end distributed visualization
-- -- 1. Smart phone and Tablet access required 2. iRODS data management
47 M0090 1. real time 1. MapReduce, 1. other legacy 1. visualization to -- 1. validation for --
66

No. Use Case
DataSources Transformation Capabilities
Data Consumer
Security &Privacy
LifecycleManagement Others
Atmospheric Turbulence
distributed datasets 2. various formats, resolution, semantics, and metadata
SciDB, and other scientific databases 2. continuously computing for updates 3. event-specification language for data mining and event searching 4. semantics interpretation and optimal structuring for 4-dimensional data mining and predictive analysis
computing systems (e.g. supercomputer) 2. high throughput data transmission over the network
interpret results output products (correlations)
48
M0186Climate Studies
1. ~100PB data in 2017 streaming at high data rates from large supercomputers across world 2. Integrate large scale distributed data from simulations with diverse observations 3. link diverse data to novel HPC simulation
1. ata analytics close to data storage
1. extend architecture to several other fields
1. share data with worldwide climate 2. high end distributed visualization
-- -- 1. phone based input and access
49
M0183DOE-BER Subsurface Biogeochemistry
1. heterogeneous Diverse data with different domains and scales, Translation across diverse datasets that cross domains and scales 2. synthesis of diverse and disparate field, laboratory, omic, and simulation datasets across different semantic, spatial, and temporal scales 3. link diverse data to novel HPC simulation
-- 1. postgres, HDF5 data technologies and many custom software systems
1. phone based input and access
-- -- 1. phone based input and access
67

No. Use Case
DataSources Transformation Capabilities
Data Consumer
Security &Privacy
LifecycleManagement Others
50
M0184DOE-BER AmeriFlux and FLUXNET Networks
1. heterogeneous Diverse data with different domains and scales, Translation across diverse datasets that cross domains and scales 2. link to many other environment and biology datasets 3. link to HPC Climate and other simulations 4. link to European data sources and projects 5. access data from 500 distributed sources
1. Custom Software: EddyPro, Custom analysis software, R, python, neural networks, Matlab
1. custom software like EddyPro and analysis software like R, python, neural netowrks, Matlab 2. analytics includes data mining, data quality assessment, cross-correlation across datasets, data assimilation, data interpolation, statistics, quality assessment, data fusion, etc.
1. phone based input and access
-- -- 1. phone based input and access
51
M0223Consumption forecasting in Smart Grids
1. diverse data from Smart Grid sensors, City planning, weather, utilities 2, data updated every 15 minutes
1. new machine learning analytics to predict consumption
1. SQL databases, CVS files, HDFS (platform) 2. R/Matlab, Weka, Hadoop (platform)
-- 1. privacy and anonymization by aggregation
-- 1. mobile access for clients
4 Conclusions and RecommendationsThe use cases are exemplars and there are several areas where additional coverage would be important. We have fixed the current V1.0 collection so we can present a coherent description and send information to the other working groups. We intend to add to the collection which is currently:
Government Operation: National Archives and Records Administration, Census Bureau Commercial: Finance in Cloud, Cloud Backup, Mendeley (Citations), Netflix, Web Search, Digital
Materials, Cargo shipping (as in UPS) Defense: Sensors, Image surveillance, Situation Assessment Healthcare and Life Sciences: Medical records, Graph and Probabilistic analysis, Pathology,
Bioimaging, Genomics, Epidemiology, People Activity models, Biodiversity Deep Learning and Social Media: Driving Car, Geolocate images, Twitter, Crowd Sourcing, Network
Science, NIST benchmark datasets The Ecosystem for Research: Metadata, Collaboration, Language Translation, Light source
experiments
68

Astronomy and Physics: Sky Surveys compared to simulation, Large Hadron Collider at CERN, Belle Accelerator II in Japan
Earth, Environmental and Polar Science: Radar Scattering in Atmosphere, Earthquake, Ocean, Earth Observation, Ice sheet Radar scattering, Earth radar mapping, Climate simulation datasets, Atmospheric turbulence identification, Subsurface Biogeochemistry (microbes to watersheds), AmeriFlux and FLUXNET gas sensors
Energy: Smart grid
We note that all use cases have been submitted openly and no significant editing has been performed. Thus there are differences in scope and interpretation but still the benefits of a free open submission outweigh that of greater uniformity.
The recommendations in section 3 only were abstracted at the end of the process and need more study both within this working group and most importantly discussed with other working groups.
5 Reference
Appendix A: Use Case Template
NBD(NIST Big Data) Requirements WG Use Case Template Aug 11 2013
Use Case TitleVertical (area)
Author/Company/EmailActors/Stakeholders and
their roles and responsibilities
Goals
Use Case Description
CurrentSolutions
Compute(System)Storage
NetworkingSoftware
Big Data Characteristics
Data Source (distributed/centralized)
Volume (size)Velocity
(e.g. real time)
69
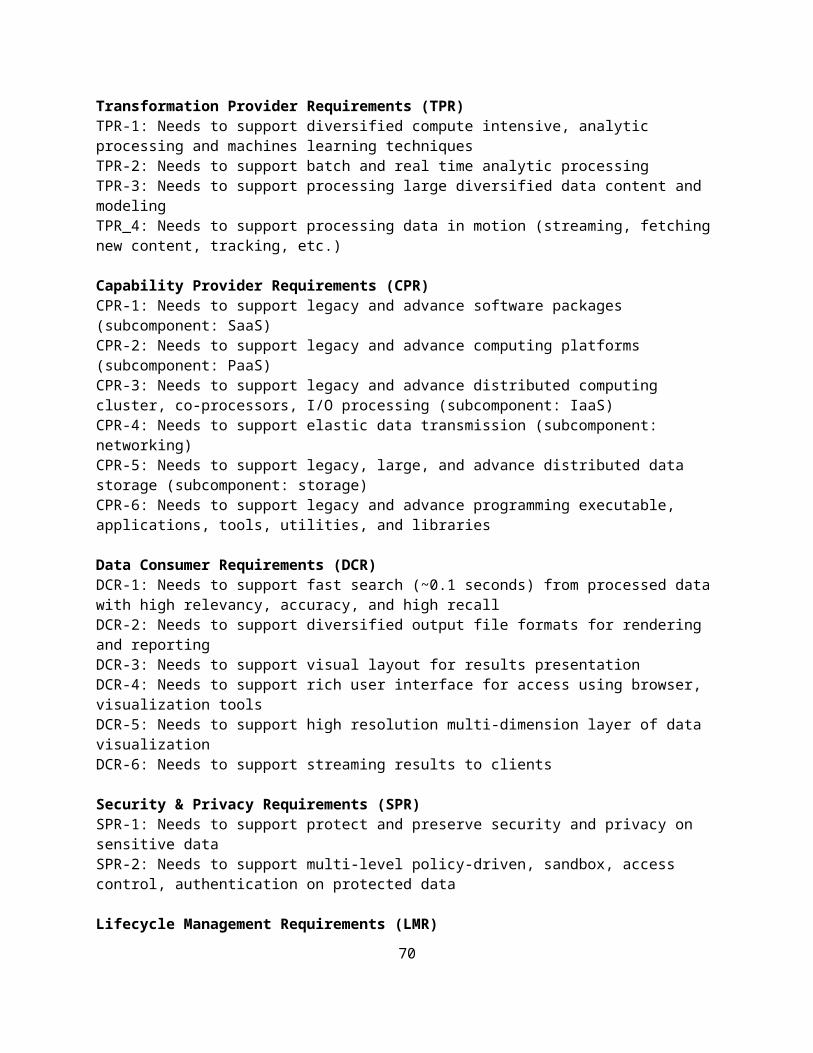
Variety(multiple datasets,
mashup)Variability (rate of
change)Big Data Science
(collection, curation,analysis,
action)
Veracity (Robustness Issues, semantics)
VisualizationData Quality (syntax)
Data TypesData Analytics
Big Data Specific Challenges (Gaps)
Big Data Specific Challenges in Mobility
Security & PrivacyRequirements
Highlight issues for generalizing this use
case (e.g. for ref. architecture)
More Information (URLs)
Note: <additional comments>
Note: No proprietary or confidential information should be included ADD picture of operation or data architecture of application below table
Appendix B: Submitted Use Cases
70