EXECUTIVE SUMMARY · KANBAN 3% ITERATIVE DEVELOPMENT 2% LEAN STARTUP 1% EXTREME PROGRAMMING (XP) 3%...
16
Transcript of EXECUTIVE SUMMARY · KANBAN 3% ITERATIVE DEVELOPMENT 2% LEAN STARTUP 1% EXTREME PROGRAMMING (XP) 3%...


EXECUTIVE SUMMARY
The 13th annual State of Agile survey saw more global diversity, with Europe, Asia, South America, and Africa each showing an increase as a percentage of the total number of respondents. The survey results echoed a few familiar trends, while revealing a couple of notable changes.
The
CONTINUING TRENDS
SCRUM AND SAFE® ARE STILL SOLIDLY IN THE LEAD
ORGANIZATIONAL CULTURE STILL MATTERS
Scrum is again reported as the most widely-practiced agile “methodology”, with at least 72% of respondents practicing Scrum or a hybrid that includes Scrum. 30% report that SAFe® is the approach their organization follows most closely, with Scrum of Scrums coming in a distant second.
Once again, the survey responses indicate that organization cultural issues remain the leading impediments to adopting and scaling agile. General resistance to change, inadequate management support and sponsorship, and organizational culture that is at odds with agile values rank as the top
three challenges.
DEVOPS TRANSFORMATION IS IMPORTANT
Organizations, year over year, show increasing importance of their need to understand and implement DevOps and its core technical practices of Continuous Integration and Continuous Delivery while also focusing on how those technical practices paired with increasing Test Automation can transform the culture between the Development and Operations organizations. Organizations and their teams want to address the visibility and delivery speed challenges they have with DevOps and its technical practices but struggle to understand where the best place to start is because many DevOps transformations start as “big-
bang” efforts.
PAGE 2
stateofagile.com #StateOfAgile
DevOps continues to show momentum in this year’s survey. 42% of
respondents told us that DevOps transformation is “Very important”
and 73% reported that a DevOps initiative is either planned or
currently underway. We expect this trend to continue, as a means of
accelerating the delivery of high-quality solutions at scale.
We also expect that agile organizations will increasingly require that
their outsourcing partners are capable of agile software delivery. 40%
of respondents report that they plan to increase the use of agile in
outsourced projects over the next 24 months.
As Agile and DevOps transformation become more common in
organizations, there is a growing need for the two to be connected
to help move organizations forward and gain competitive advantage.
Even more importantly there is a need for week to week, month to
month, quarter to quarter or year to year outcomes to be made
visible and for there to be a focus on iterative investment so that a
company can inspect, adapt, continue investing or pivot in its Agile or
DevOps Transformation.
COMPANY-PROVIDED TRAINING
PROGRAMS
EXECUTIVE SPONSORSHIP
INTERNAL AGILE COACHES
LOOKING FORWARD
Two observations stand out, as compared to the 12th annual report:
NOTABLE CHANGES
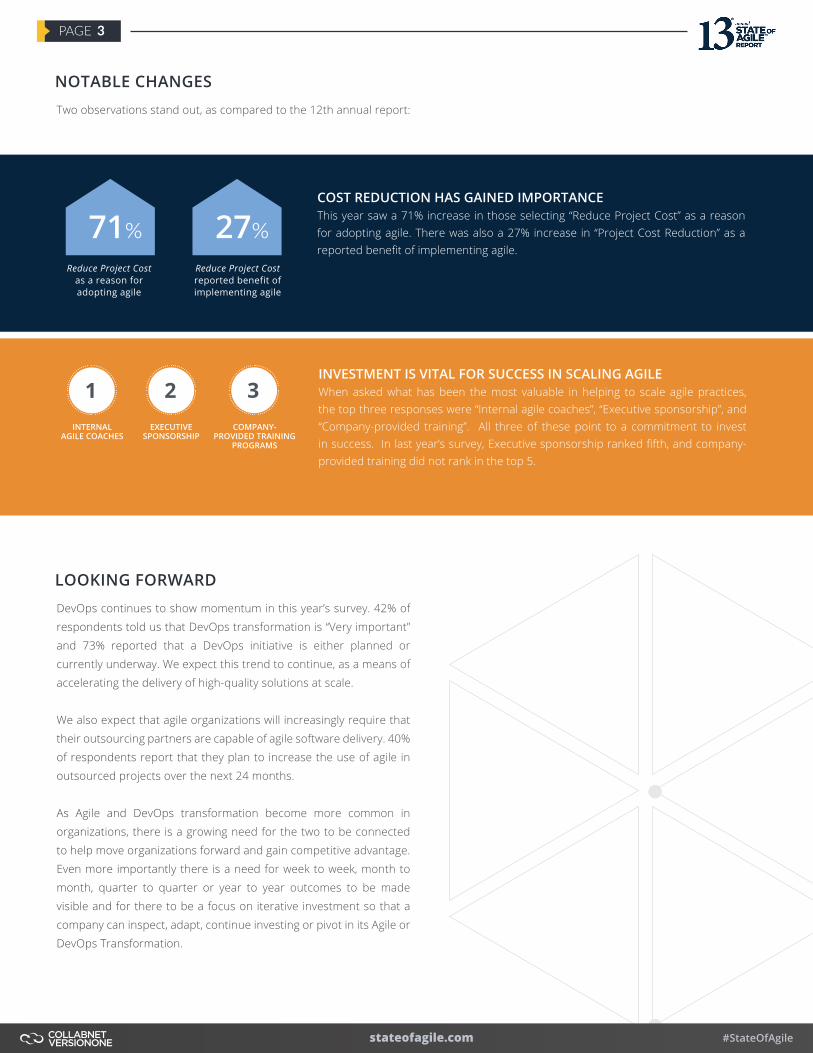
COST REDUCTION HAS GAINED IMPORTANCEThis year saw a 71% increase in those selecting “Reduce Project Cost” as a reason for adopting agile. There was also a 27% increase in “Project Cost Reduction” as a reported benefit of implementing agile.
INVESTMENT IS VITAL FOR SUCCESS IN SCALING AGILEWhen asked what has been the most valuable in helping to scale agile practices, the top three responses were “Internal agile coaches”, “Executive sponsorship”, and “Company-provided training”. All three of these point to a commitment to invest in success. In last year’s survey, Executive sponsorship ranked fifth, and company-provided training did not rank in the top 5.
71%
Reduce Project Cost as a reason for adopting agile
27%
Reduce Project Cost reported benefit of implementing agile
1 2 3
PAGE 3
stateofagile.com #StateOfAgile
TABLE OF
CONTENTS
ABOUT THE SURVEY
RESPONDENT DEMOGRAPHICS
• Size of Organization • Size of Software Organization • Location of Organization • Role • Industry • Distributed Teams
COMPANY EXPERIENCE AND ADOPTION
• Company Experience • Percentage of Teams Using Agile • Reasons for Adopting Agile • Agile Maturity
BENEFITS OF AGILE
• Benefits of Adopting Agile
AGILE METHODS AND PRACTICES
• Agile Methodology Used • Top 5 Agile Techniques • Agile Techniques Employed • Engineering Practices Employed • Agile in Outsourced Development Projects
AGILE SUCCESS AND METRICS
• Success of Agile Projects • How Success Is Measured With
Agile Transformations• How Success Is Measured With
Individual Agile Projects
SCALING AGILE
• Scaling Methods and Approaches • Top 5 Tips for Success with Scaling Agile • Challenges Experienced Adopting &
Scaling Agile
AGILE PROJECT MANAGEMENT TOOLS
• General Tool Use and Preferences • Use of Agile Management Tools • Recommended Agile Project
Management Tools
AGILE + DEVOPS & VALUE STREAM MANAGEMENT
• DevOps Initiatives• Importance of DevOps Transformation• How Success Is Measured with DevOps
Initiatives• Improving DevOps Practices• Importance of Value Stream Management (VSM)
5 & 6 PAGE PAGE
7
8PAGE
9 & 10PAGE
11 PAGE
12 PAGE
13-15PAGE
16PAGE
The 13th annual State of Agile survey was conducted between August and December 2018. Sponsored by CollabNet VersionOne, the survey invited individuals from a broad range of industries in the global software development community and was promoted far beyond CollabNet VersionOne’s customer base at tradeshows and on multiple digital channels. 1,319 full responses were collected, analyzed, and represented in this report. Only 17% of the respondents were CollabNet VersionOne customers, indicating the range and diversity of respondents.
PAGE 4
stateofagile.com #StateOfAgile

Similar to past years, this survey collected responses from a diverse set of organization sizes, geographic locations, roles and industries. There was an increase in the number of responses coming from larger organizations (46% of respondents from organizations of more than 5,000 people and 41% last year). 53% of respondents were from outside of North America this year compared to 48% last year.
Location of OrganizationRespondents were from:
RESPONDENT DEMOGRAPHICS
NORTHAMERICA
47%
EUROPE
30%
SOUTHAMERICA
8%
ASIA
10%
AUSTRALIANEW ZEALAND
3%AFRICA
2%
Size of OrganizationRespondents who worked for organizations with:
20,001+ people
28%
5,001- 20,000 people
18%
18%
36%
1,001- 5,000 people
< 1,000 people
Size of Software Organization Respondents who worked for organizations with software development organizations with:
5,001+ people
20%
1,001- 5,000 people 20
%
33%
27%
101- 1,000 people
<100 people
PAGE 5
stateofagile.com #StateOfAgile

Role
IndustriesIndustries respondents worked in:
ScrumMaster orInternal Coach
External Consultant / Trainer
Development Team Member: Architect / Developer / QA / Tester / UI or UX Designer
Product Manager / Product Owner
Business Analyst
C-LevelExecutive
DevOps
Project / Program Manager
Development Leadership: VP/Director/Manager
RESPONDENT DEMOGRAPHICS
While working together, face-to-face, can be desirable for agile practices, survey respondents indicated that organizations are supporting distributed teams and team members. There is no evidence of a trend toward increased co-location, as organizations continue to support and encourage team collaboration across geographic boundaries and timezones.
78% of respondents said their organization practices agile with team members distributed (not co-located).
68% of respondents said their organization practices agile with multiple co-located teams, collaborating across geographic boundaries.
Distributed Agile Teams
Technology
Financial Services
Professional Services
Insurance
Government
Healthcare andPharmaceuticals
Industrial/Manufacturing
Telecomommunications
Energy
Education
Retail
Transportation
Media/Entertainment
Non-profit
Other
25%
19%
10%
8%
6%
6%
4%
4%
4%
3%
3%
3%
1%
1%
3%
34%
15%
11%
11%
10%
6%
5% 3%
2%
PAGE 6
stateofagile.com #StateOfAgile

Reasons for Adopting Agile The reasons stated for adopting agile were less about increasing
productivity (51% compared to 55% last year), and more about
improving team morale (34% compared to 28% last year) and
less about reducing project risk (28% compared to 37% last
year), and more about reducing project costs (41% compared to
24% last year).
Agile Maturity The vast majority of respondents (83%) said their
organization were below a high level of competency
with agile practices, further revealing opportunities for
improvement through supporting training & coaching.
Company Experience
HOW MANY?97% of respondents report their organizations
practices agile development methods.
97%
HOW LONG?The length of time respondents’ organizations have
been practicing agile development methods:
Percentage of Teams Using AgileWhile buy-in and support for agile continues to grow, most respondents (78%) state that not all of their company’s teams have adopted agile practices, an indication that most enterprise agile adoptions are still in flight.
4%None of our teams are
agile 48%
Less than ½ of our teams are
agile
26%More than ½ of our teams
are agile
22%All of our teams are
agile
10%
23%
34%
27%
9%
26%
34%
29%
15%
25%
32%
28%
< 1 year
1-2 years
3-5 years
5+ years
2018 2017 2016
Agile practices are enabling greater adaptability to market conditions
53
53 %
6
% 12
% 21
53 %5
% 4
53
High level of competency with agile practices
across the organization
Use agile practices but still maturing
Experimenting with agile in pockets
Consideringan agile initiative
No agileinitiatives
%
%
%
%
%
%
COMPANY EXPERIENCE AND ADOPTION
Accelerate software delivery
Enhance ability to manage changing priorities
Increase productivity
Improve business/IT alignment
Enhance software quality
Enhance delivery predictability
Improve project visibility
Reduce project cost
Improve team morale
Reduce project risk
Improve engineering discipline
Increase software maintainability
Better manage distributed teams
74%
62%
51%
50%
43%
43%
42%
41%
34%
28%
21%
23%
19%
*Respondents were able to make multiple selections
PAGE 7
stateofagile.com #StateOfAgile

Benefits of Adopting Agile We continue to see many benefits realized by companies adopting agile,
and specifically worth noting is the increase in those reporting team
morale improvements (64% compared to 61% last year) along with
increased reports of project predictability (52% compared to 49% last
year) and reduction in project risk (50% compared to 47% last year).
BENEFITS OF AGILE
Ability to manage changing priorities
Project visibility
Business/IT alignment
Team morale
Delivery speed/time to market
Increased team productivity
Project predictability
Project risk reduction
Software quality
Engineering discipline
Managing distributed teams
Software maintainability
Project cost reduction
69%
65%
64%
64%
61%
63%
52%
50%
47%
42%
34%
39%
28%
PAGE 8
stateofagile.com #StateOfAgile

Agile Methodologies Used Scrum and Scrum/XP Hybrid (64%) continue to be the most common agile methodologies used by respondents’ organizations.
AGILE METHODS AND PRACTICES
54%SCRUM
14%OTHER/HYBRID/
MULTIPLE
8%SCRUMBAN
10%SCRUM/
XP HYBRID
5%KANBAN
3%ITERATIVE DEVELOPMENT
2%LEAN STARTUP
1%EXTREME
PROGRAMMING (XP)
3%DON’T KNOW
Agile Techniques Employed Notable changes in agile techniques and practices that respondents said their organization uses were Release planning (57%
this year compared to 67% last year) and Dedicated customer/product owner (57% this year compared to 63% last year).
02 04 06 08 0 100
Daily standup
Sprint/iteration planning
Retrospectives
Sprint/iteration review
Short iterations
Planning poker/team estimation
Kanban
Release planning
Dedicated customer/Product owner
Single team (integrated dev and test)
Frequent releases
Common work area
Product roadmapping
Story mapping
Agile portfolio planning
Agile/Lean UX
86%
80%
80%
80%
67%
57%
61%
61%
57%
54%
50%
45%
45%
38%
33%
28%
*Respondents were able to make multiple selections
TOP 5 AGILE TECHNIQUES
DAILY STANDUP
86%SPRINT/ITERATION
PLANNING
80%
RETROSPECTIVES80%
SPRINT/ITERATIONREVIEW
80%
SHORTITERATIONS
67%
*Respondents were able to make multiple selections
PAGE 9
stateofagile.com #StateOfAgile

Engineering Practices Employed The overall rank order of engineering practices employed remained the same this year with exception of one new addition to
the survey: Continuous delivery. It entered the survey results as the 5th highest practice cited.
Agile in Outsourced Dev Projects 46% of respondents are using agile practices to manage outsourced development projects. 40% of respondents indicated they
plan to increase the use of agile in outsourced development projects in the next 24 months.
USE AGILE TO MANAGE OUTSOURCED PROJECTS
PLAN TO INCREASE USE OF AGILE IN OUTSOURCED PROJECTS
AGILE METHODS AND PRACTICES
*Respondents were able to make multiple selections
46% 40%
69%Unit testing
Coding standards
Continuous integration
Refactoring
Continuous delivery
Continuous deployment
Pair programming
Test-driven development (TDD)
Automated acceptance testing
Collective code ownership
Sustainable pace
Behavior-driven development (BDD)
Emergent design
58%
53%
41%
35%
34%
33%
33%
14%
40%
31%
25%
22%
PAGE 10
stateofagile.com #StateOfAgile

Business value delivered
and Customer/user
satisfaction remained the
top two cited measures
of success for individual
projects in this year’s
survey. Earned value went
from 8% last year to 12%
this year.
How Success Is Measured...with Individual Agile
Projects?
Success of Agile Projects 95% of respondents reported at least some of their agile projects have been successful with 48% reporting that most or all of
their agile projects were successful.
How Success Is Measured...with Agile Initiatives?When asked about how organizations measure success of agile transformations, respondents indicated the three measures of success have remained the same over the last few years (Customer/user satisfaction, Business value and On-time delivery). Product scope saw a decline over the past years going from 40% to 20% and falling to 12% this year.
AGILE SUCCESS AND METRICS
52%Customer/user satisfaction
Business value
On-time delivery
Quality
Productivity
Predictability
Process improvement
Project visibility
Product scope
41%
48%
38%
33%
30%
25%
27%
12%
*Respondents were able to make multiple selections
Customer/user satisfaction
Business value delivered
Velocity
Budget vs. actual cost
Planned vs. actual stories per iteration
Planned vs. actual stories release dates
Iteration burndown
Defects in to production
Burn-up chart
Defects over time
Cycle time
Release burndown
WIP (Work-in-process)
Defect resolution
Customer retention
Estimation accuracy
Earned value
Test pass/fail over time
Revenue/sales impact
Cumulative flow chart
Product utilization
Individual hours per iteration/week
Scope change in a release
46%
42%
38%
31%
29%
26%
24%
25%
20%
22%
19%
21%
14%
16%
14%
13%
11%
11%
11%
11%
8%
9%
12%
PAGE 11
stateofagile.com #StateOfAgile

Scaling Methods and ApproachesThe Scaled Agile Framework® continues to be the most popular scaling method cited by respondents (30% this year compared
to 29% last year).
Challenges Experienced Adopting & Scaling AgileThe top three responses cited as challenges/barriers to adopting and
scaling agile practices indicate that internal culture remains an obstacle
for success in many organizations.
Top 5 Tips for Success with Scaling Agile
Respondent indicated the most valuable in helping them scale agile
practices were:
SCALING AGILE
*Respondents were able to make multiple selections
Organizational culture at odds with agile values
General organization resistance to change
Inadequate management support and sponsorship
Lack of skills/experience with agile methods
Inconsistent processes and practices across teams
Insufficient training and education
Lack of business/customer/product owner availability
Pervasiveness of traditional development methods
Fragmented tooling and project-related data/measurements
Minimal collaboration and knowledge sharing
Regulatory compliance or government issue
52%
48%
44%
40%
35%
36%
32%
28%
26%
24%
16%
INTERNAL AGILE COACHES
1EXECUTIVE
SPONSORSHIP
2
IMPLEMENTATION OF A COMMON TOOL ACROSS
TEAMS
5
CONSISTENT PRACTICES AND
PROCESSES ACROSS TEAMS
4COMPANY-PROVIDED TRAINING
PROGRAMS
3
3%
3%
3%
3%
2%
1%
30%
16%
8%
19%
7%
5%
Scaled Agile Framework® (SAFe®)
Don’t Know
Scrum of Scrums
Internally created methods
Disciplined Agile Delivery (DAD)
Spotify Model
Large Scale Scrum (LeSS)
Enterprise Scrum
Lean Management
Agile Portfolio Management (APM)
Nexus
Recipes for Agile Governance in the Enterprise (RAGE)
PAGE 12
stateofagile.com #StateOfAgile

General Tool Use and Preferences More respondents stated using Automated acceptance tools (39% compared to 36% last year) and more respondents stated
they plan to use Agile project management tools in the future (12% this year compared to 9% last year). There were also a few
new options added to the survey this year (Wireframes, Product Roadmapping, Static Analysis and Timecards).
AGILE PROJECT MANAGEMENT TOOLS
*Respondents were able to make multiple selections
2018 2017
CURRENT TOOL USAGE
FUTURE TOOL USAGE
2018 2017Kanban board
Taskboard
Bug tracker
Spreadsheet
Agile project managment tool
Wiki
Automated build tool
Unit test tool
Continuous integration tool
Wireframes
Product Roadmapping
Traditional project management tool
Requirements management tool
Release/deployment automation tool
Automated acceptance tool
Static Analysis
Project & portfolio management (PPM) tool
Story mapping tool
Timecards
Index cards
Refactoring tool
Customer idea management tool
75%
70%
67%
66%
65%
62%
59%
54%
51%
51%
50%
46%
44%
44%
39%
38%
36%
29%
29%
28%
22%
18%
74%
71%
72%
65%
67%
62%
60%
57%
52%
43%
46%
44%
36%
40%
29%
29%
19%
16%
9%
10%
12%
6%
12%
12%
20%
17%
26%
13%
27%
6%
17%
25%
25%
14%
24%
21%
9%
9%
18%
18%
7%
7%
10%
4%
9%
11%
20%
15%
24%
5%
13%
29%
29%
18%
19%
7%
15%
15%
PAGE 13
stateofagile.com #StateOfAgile

Use of Agile Project Management Tools Respondents cited using a myriad of different tools to manage agile projects.
AxosoftBugzillaGoogle DocsHansoftHP Agile ManagerHP QC/ALMIn-house/home-grownJiraLeanKitMicrosoft ExcelMicrosoft ProjectMicrosoft TFSMinglePivotal TrackerRallyRational Team ConcertTarget ProcessTeamForgeVersionOne
2%
5%
19%
1%
2%
16%
8%
65%
4%
48%
24%
23%
2%
3%
9%
5%
1%
3%
14%
JIRAExcelMS TFS
MS ProjectGoogle Docs HP QC/ALM
VersionOneRally
In-house/home-grown
BugzillaRational Team ConcertLeanKitTeamForge
Pivotal Tracker
HP Agile Manager
Mingle
Target Process
HansoftAxosoft
AGILE PROJECT MANAGEMENT TOOLS
*Respondents were able to make multiple selections
PAGE 14
stateofagile.com #StateOfAgile
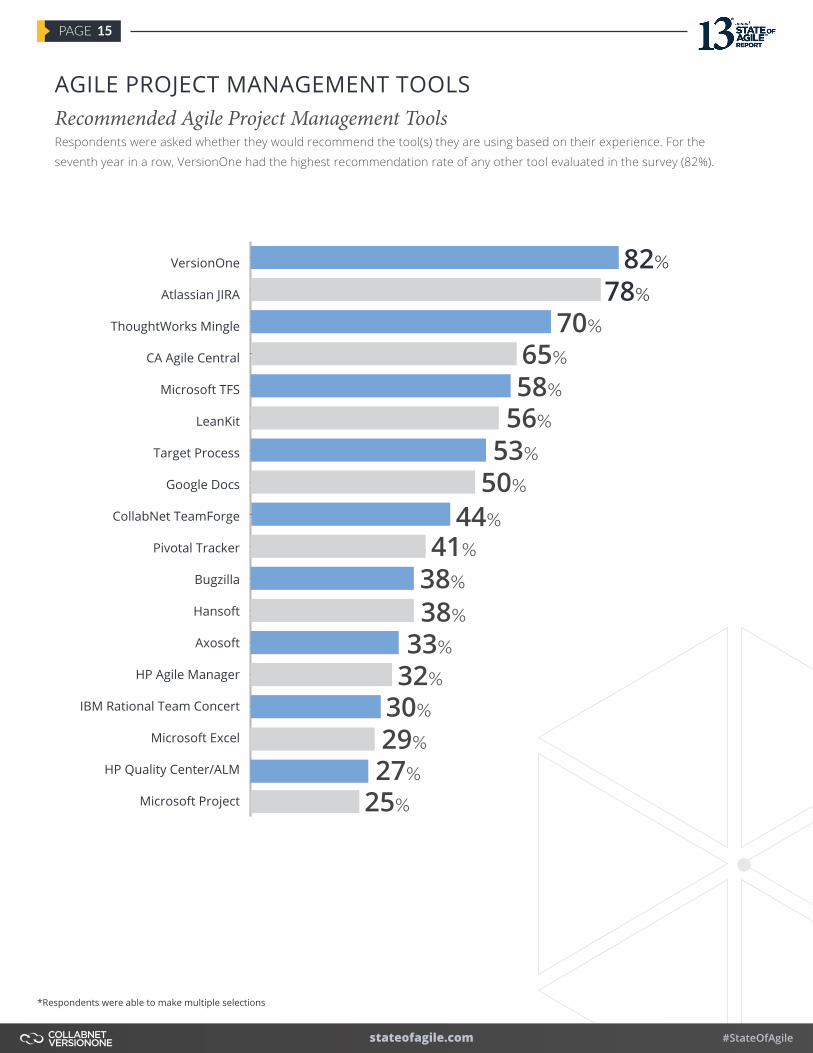
Recommended Agile Project Management Tools Respondents were asked whether they would recommend the tool(s) they are using based on their experience. For the
seventh year in a row, VersionOne had the highest recommendation rate of any other tool evaluated in the survey (82%).
AGILE PROJECT MANAGEMENT TOOLS
*Respondents were able to make multiple selections
82%
78%
70%
65%
58%
56%
53%
50%
44%
41%
38%
38%
33%
32%
30%
29%
27%
25%
VersionOne
Atlassian JIRA
ThoughtWorks Mingle
CA Agile Central
Microsoft TFS
LeanKit
Target Process
Google Docs
CollabNet TeamForge
Pivotal Tracker
Bugzilla
Hansoft
Axosoft
HP Agile Manager
IBM Rational Team Concert
Microsoft Excel
HP Quality Center/ALM
Microsoft Project
PAGE 15
stateofagile.com #StateOfAgile

DevOps Initiatives 73% of respondents stated that they currently have a
DevOps initiative in their organization or are planning one
in the next 12 months (compared to 71% last yeaar).
How Success Is Measured...with DevOps Initiatives
Respondents cited that the most critical measures of DevOps success are improved quality while delivering software faster. Ensuring compliance/governance had the largest increase year over year (17% last year to 26% this year).
Improving DevOps PracticesWhen asked about which capabilities would be most valuable for
improving DevOps practices in their organization, 38% said that
having end to end traceability from business Initiative, through
development, test and deployment would be most valuable,
followed by having metrics that identify disruptions in that flow.
Importance of DevOps Transformation90% of respondents said DevOps
transformation was important in
their organization.
Importance of Value Stream ManagementValue Stream Management (VSM) is an emerging tool
category that connects an organization’s business to its
software delivery capability and helps those organizations
realize the promises of connecting Agile and DevOps
practices. 67% of respondents stated that it was important
or very important to connect their organization’s business
to its software delivery capability.
AGILE + DEVOPS & VALUE STREAM MANAGEMENT
*Respondents were able to make multiple selections
13% 14%
25%
48%
NO DEVOPS INITIATIVES
PLANNING A DEVOPS INITIATIVE
DON’T KNOW
DEVOPS INITIATIVE
CURRENTLY UNDERWAY
Accelerated delivery speed
Improved quality
Reduce risk
Increase customer satisfaction
Increased Visibility of Flow of Value to users
Decreased IT costs
Ensure compliance/governance
66%
61%
48%
46%
34%
34%
26%
42%VERY
IMPORTANT
28%IMPORTANT
20%SOMEWHATIMPORTANT
10%NOT
IMPORTANT
End to end traceability from business Initiative, through development, test and deployment
Ability to measure the cycle time, wait time,
bottlenecks of business value flowing through
delivery cycle
Identification and measurement of
technical risk prior to deployment
Automated audit
compliance and governance
reporting across control
points
38% 30% 22% 10%
40%VERY
IMPORTANT
27%IMPORTANT
17%SOMEWHATIMPORTANT
16%NOT
IMPORTANT
PAGE 16
stateofagile.com #StateOfAgile