EXECUTIVE SUMMARY - Christ Universityrepository.christuniversity.in/1826/2/CHAPTERS.pdf ·...
97
EXECUTIVE SUMMARY This project is done on human resource management topic in the area of ““A study on employee retention practices and its effectiveness in IT sector”. The most challenging job for any present manager is to retain their employees. Employee retention involves taking measures to encourage employees to remain in the organization for the maximum period of time. Corporate is facing a lot of problem in employee retention these days. Hiring knowledgeable people for the job is essential for an employer. Employee recruitment and retention are one of the major issues facing the IT Sector. But retention is even more important than hiring. There is no end of opportunities for talented person. There is ample number of choice around employees. In olden days salary was all that matters, but today it’s just one among the components. Some of the other elements are like work environment, relationship, freedom to work etc. Due to high level of attrition it is important to know whether the employees are satisfied with their job and organization, if not the reason for leaving. This project will specify the effectiveness of various retention practices used retain the employees. The study also include various trends of practice followed by the organizations and it’s effect on the problem of attrition. Retention is a top business priority for more than one third of the organizations. More than one third of HR professionals in IT Sector views retention as one of their pressing issues. It is not very often that the management would be aware of the true reason as to why an employee would be leaving their organization. To be successful in knowing the reason, an effective exit interview procedure is very essential. This would help the organization to an extent to get a clear picture of what is going wrong. 1
Transcript of EXECUTIVE SUMMARY - Christ Universityrepository.christuniversity.in/1826/2/CHAPTERS.pdf ·...

EXECUTIVE SUMMARY
This project is done on human resource management topic in the area of
““A study on employee retention practices and its effectiveness in
IT sector”. The most challenging job for any present manager is to retain
their employees. Employee retention involves taking measures to
encourage employees to remain in the organization for the maximum
period of time. Corporate is facing a lot of problem in employee retention
these days.
Hiring knowledgeable people for the job is essential for an employer.
Employee recruitment and retention are one of the major issues facing the
IT Sector. But retention is even more important than hiring. There is no
end of opportunities for talented person. There is ample number of choice
around employees. In olden days salary was all that matters, but today it’s
just one among the components. Some of the other elements are like
work environment, relationship, freedom to work etc.
Due to high level of attrition it is important to know whether the
employees are satisfied with their job and organization, if not the reason
for leaving. This project will specify the effectiveness of various retention
practices used retain the employees. The study also include various
trends of practice followed by the organizations and it’s effect on the
problem of attrition.
Retention is a top business priority for more than one third of the
organizations. More than one third of HR professionals in IT Sector views
retention as one of their pressing issues. It is not very often that the
management would be aware of the true reason as to why an employee
would be leaving their organization. To be successful in knowing the
reason, an effective exit interview procedure is very essential. This would
help the organization to an extent to get a clear picture of what is going
wrong.
1

Thus, this study is conducted to find out directly from the employees the
factor that does not motivate them to continue employment with their
organization. With help of a self developed questionnaire few factors are
taken into consideration for the study. With the help of the study, An
attempt is made to find out the effectiveness of the practices and how
practical is it to retain the employees.
CHAPTER 1
INTRODUCTION
2

CHAPTER: 1
INTRODUCTION
EMPLOYEE RETENTION
Employee retention refers to policies and practices companies use to
prevent valuable employees from leaving their jobs. How to retain
valuable employees is one of the biggest problem that plague companies
in the competitive marketplace. Not too long ago, companies accepted the
“revolving door policy” as part of doing business and were quick to fill a
vacant job with another eager candidate. Nowadays, businesses often find
that they spend considerable time, effort, and money to train an
employee only to have them develop into a valuable commodity and leave
the company for greener pastures. In order to create a successful
company, employers should consider as many options as possible when it
comes to retaining employees, while at the same time securing their trust
and loyalty so they have less of a desire to leave in the future.
3

Employee retention involves taking measures to encourage employees to
remain in the organization for the maximum period of time. Corporate is
facing alot of problem in employee retention these days. Hiring
knowledgeable people for the job is essential for an employer. But
retention is even more important than hiring. There is no dearth of
opportunities for talented person. There are many organizations which are
looking for such employees. If a person is not satisfied by the job he’s
doing, he may switch over to some other more suitable job. In today’s
environment it becomes very important for organizations to retain their
employees.
According to Get Les Mckeown’s employee retention is define as “
effective employee retention is a systematic effort by employers to create
and foster an environment that encourages current employees to remain
employed by having policies and practices in place that address their
divers needs. Also of concern are the costs of employee turnover
(including hiring costs. productivity loss). Replacement costs usually are
2.5 times the salary of the individual.
The costs associated with turnover may include lost customers, business
and damaged morale. In addition there are the hard costs of time spent in
screening, verifying credentials, references, interviewing, hiring, and
training the new employee just to get back to where you started.”Every
company should understand that people are their best commodity.
Without qualified people who are good at what they do, any company
would be in serious trouble. In the long run, the retention of existing
employees saves companies money. As Beverly Kaye and Sharon Jordan-
Evan stated in Training and Development: “Studies have found that the
cost of replacing lost talent is 70 to 200 percent of that employee’s annual
salary.
There are advertising and recruiting expenses, orientation and training of
the new employee, decreased productivity until the new employee is up to
speed, and loss of customers who were loyal to the departing employee.
4

Finding, recruiting, and training the best employees represents a major
investment. Once a company has captured talented people, the return-on-
investment requires closing the back door to prevent them from walking
out.” When an employee leaves a company for a direct competitor, there
is always a chance that they will take important business strategies and
secrets with them to be explained by the competition. This is yet another
reason why the retention of employees is so crucial to some businesses.
While this practice seems a bit unscrupulous, it skills happens quite
frequently. As Bill Leonard stated in HR Magazine: Because employers
know that the best qualified applicants will come directly from
competitors, recruiting and hiring employees away from mother of
inventive and sometimes controversial business practices. Recruiting and
hiring from your competitors is probably as old as business itself. But what
is new and a hot topic among employers is how to attract and retain
qualified candidates in a highly competitive labor market while also
preventing their own intellectual capital from winding up in the hands of
competitors.
One way for a company to prevent employees from giving valuable
information to competitors is to make it a policy to enforce strict and
confidentiality agreements amongst its employees. The existence of such
agreements could in fact deter a competitor from hiring a valuable employ
because they might not want to risk possible legal entanglements with the
other company. Of course, all this could possibly lead to animosity with
the employee who could feel that his or her options are being limited.
Many employees don’t always remember signing such a document, so a
copy of it should always be kept on file for the employee to refer to. This
area could prove to be a highly sensitive one between employer and
employee, so extreme caution is suggested in all instances.
Retention of Key employees is critical to the long term health and success
of any organization. It is a known fact that retaining your best employees
ensures customer satisfaction, increased product sales, satisfied
colleagues and reporting staff, effective succession planning and deeply
5

imbedded organizational knowledge and learning. Employee retention
matters as organizational issues such as training time and investment;
lost knowledge; insecure employees and a costly candidate search are
involved. Hence failing to retain a key employee is a costly proposition for
an organization. Various estimates suggest that losing a middle manager
in most organizations costs up to five times of his salary.
INTRODUCTION TO IT SECTOR
Information Technology (IT) industry in India is one of the fastest growing
industries. Indian IT industry has built up valuable brand equity for itself in
the global markets. IT industry in India comprises of software industry and
information technology enabled services (ITES), which also includes
business process outsourcing (BPO) industry. India is considered as a
pioneer in software development and a favourite destination for IT
enabled services.
The origin of IT industry in India can be traced to 1974, when the
mainframe manufacturer,
Burroughs, asked its India sales agent, Tata Consultancy Services (TCS), to
export programmers for installing system software for a U.S. client.The IT
industry was originated under unfavourable conditions. Local markets
were absent and government policy toward private enterprise was hostile.
The industry was begun by Bombay based conglomerates which entered
the business by supplying programmers to global IT firms located
overseas.
The Indian Information Technology industry accounts for a 5.19% of the
country's GDP and export earnings as of 2009, while providing
employment to a significant number of its tertiary workforce. More than
2.3 million people are employed in the sector either directly or indirectly,
making it one of the biggest job creators in India and a mainstay of the
national economy. In March 2009, annual revenues from outsourcing
operations in India amounted to US$50 billion and this is expected to
increase to US$225 billion by 2020. The most prominent IT hub is IT
6

capital Bangalore. The other emerging destinations
are Chennai, Hyderabad, Mumbai, Pune, NCR, Jaipur and Kolkata.
Technically proficient immigrants from India sought jobs in the western
world from the 1950s onwards as India's education system produced more
engineers than its industry could absorb. India's growing stature in the
information age enabled it to form close ties with both the United States
of America and the European Union. However, the recent global financial
crises have deeply impacted the Indian IT companies as well as global
companies. As a result hiring has dropped sharply and employees are
looking at different sectors like financial service, telecom or
manufacturing industries, which are growing phenomenally over the last
few years. Due to meltdown the IT industry's pace of growth has dropped
significantly many experts believe that it has lost it flair.
India's IT Services industry was born in Mumbai in 1967 with the
establishment of Tata Group in partnership with Burroughs. The first
software export zone SEEPZ was set up here way back in 1973, the old
avatar of the modern day IT Park. More than 80 percent of the country's
software exports happened out of SEEPZ, Mumbai in 80s. Each year India
produces roughly 500,000 engineers in the country, out of them only 25%
to 30% possessed both technical competency and English language skills,
although 12% of India's population can speak in English. India developed a
number of outsourcing companies specializing in customer support
via Internet or telephone connections. By 2009, India also has a total of
37,160,000 telephone lines in use, a total of 506,040,000 mobile
phone connections, a total of 81,000,000 Internet users comprising 7.0%
of the country's population, and 7,570,000 people in the country have
access to broadband Internet making it the 12th largest country in the
world in terms of broadband Internet users. Total fixed-
line and wireless subscribers reached 543.20 million as of November,
2009.
7
The Indian Government acquired the EVS EM computers from the Soviet
Union, which were used in large companies and research laboratories. In
1968 Tata Consultancy Services established in SEEPZ, Mumbai by the Tata
Group were the country's largest software producers during the 1960s. As
an outcome of the various policies of Jawaharlal Nehru (office: 15 August
1947 – 27 May 1964) the economically beleaguered country was able to
build a large scientific workforce, second in numbers only to that of the
United States of America and the Soviet Union. On 18 August 1951 the
minister of education Maulana Abul Kalam Azad, inaugurated the Indian
Institute of Technology at Kharagpur in West Bengal. Possibly modeled
after the Massachusetts Institute of Technology these institutions were
conceived by a 22 member committee of scholars and entrepreneurs
under the chairmanship of N. R. Sarkar.
Relaxed immigration laws in the United States of America (1965) attracted
a number of skilled Indian professionals aiming for research. By 1960 as
many as 10,000 Indians were estimated to have settled in the US. Kapur
(2006) By the 1980s a number of engineers from India was seeking
employment in other countries. In response, the Indian companies
realigned wages to retain their experienced staff. In the Encyclopedia of
India, Kamdar (2006) reports on the role of Indian immigrants (1980 -
early 1990s) in promoting technology-driven growth: The National
Informatics Centre was established in March 1975. The inception of The
Computer Maintenance Company (CMC) followed in October 1976.
Between 1977-1980 the country's Information Technology companies Tata
InfoTech, Patni Computer Systems and Wipro had become visible.
The 'microchip revolution' of the 1980s had convinced both Indira
Gandhi and her successor Rajiv Gandhi that electronics and
telecommunications were vital to India's growth and
development. MTNL underwent technological improvements. Between
(1987-1986), the Indian government embarked upon the creation of three
wide-area computer networking schemes: INDONET (intended to serve the
8

IBM mainframes in India), NICNET (the network for India's National
Informatics Centre), and the academic research oriented Education and
Research Network (ERNET).
In 1991 the Department of Electronics broke this impasse, creating a
corporation called Software Technology Parks of India (STPI) that, being
owned by the government, could provide VSAT communications without
breaching its monopoly. STPI set up software technology parks in different
cities, each of which provided satellite links to be used by firms; the local
link was a wireless radio link. In 1993 the government began to allow
individual companies their own dedicated links, which allowed work done
in India to be transmitted abroad directly. Indian firms soon convinced
their American customers that a satellite link was as reliable as a team of
programmers working in the clients’ office.
The Indian economy underwent economic reforms in 1991, leading to a
new era of globalization and international economic integration. Economic
growth of over 6% annually was seen between1993-2002. The economic
reforms were driven in part by significant the internet usage in the
country. The new administration under Atal Bihari Vajpayee which placed
the development of Information Technology among its top five priorities
formed the Indian National Task Force on Information Technology and
Software Development. India is now one of the biggest IT capitals in the
modern world. The economic effect of the technologically inclined services
sector in India accounting for 40% of the country's GDP and 30% of export
earnings as of 2006, while employing only 25% of its workforce is
summarized by Sharma (2006).
The share of IT (mainly software) in total exports increased from 1 percent
in 1990 to 18 percent in 2001. IT-enabled services such as back office
operations, remote maintenance, accounting, public call centers, medical
transcription, insurance claims, and other bulk processing are rapidly
9

expanding. Indian companies such as TCS, Wipro, and Infosys may yet
become household names around the world.
Today, Bangalore is known as the Silicon Valley of India and contributes
33% of Indian IT Exports. India's second and third largest software
companies are head-quartered in Bangalore, as are many of the global
SEI-CMM Level 5 Companies. And Mumbai too has its share of IT
companies that are India's first and largest, like TCS and well established
like Reliance, Patni, LnT InfoTech, i-Flex, WNS, Shine, Naukri, Jobspert etc
are head-quartered in Mumbai. And these IT and dot com companies are
ruling the roost of Mumbai's relatively high octane industry of Information
Technology.Such is the growth in investment and outsourcing; it was
revealed that Cap Gemini will soon have more staff in India than it does in
its home market of France with 21,000 personnel in India. On 25 June
2002 India and the European Union agreed to bilateral cooperation in the
field of science and technology. A joint EU-India group of scholars was
formed on 23 November 2001 to further promote joint research and
development. India holds observer status at CERN while a joint India EU
Software Education and Development Center is due at Bangalore.
Top seven IT Hubs in India
*Table 1.1
Ranking City / Region Description
1 Bangalore
Popularly known as the capital of the Silicon
Valley of India is currently leading
in Information Technology Industries in India.
2 Chennai
Famously known as "Gateway of South India",
it is the second largest exporter of Software
3 Hyderabad
Hyderabad which has good infrastructure and
good government support is also a
good technology base in India
4 Pune
Pune, a major industrial town, hosts numerous
multinational and national software giants
10

along with BPO and KPO firms. World class
SEZs like Hinjawadi IT park and Magarpatta
city give Pune a distinct advantage. The city is
a major educational hub and churns out
thousands of technocrats every year.
Kolkata
Kolkata which is slowly becoming a major IT
hub in near future. Some of the well known
technological corporations are si
6 NCR
The National Capital Region of India
comprising Delhi, Gurgaon, Faridabad, Noida,
Greater Noida and Ghaziabadare having
ambitious projects and are trying to do every
possible thing for this purpose.
7 Mumbai
Popularly known as the commercial,
entertainment, financial capital of India, This
is one city that has seen tremendous growth
in IT and BPO industry, it recorded 63% growth
in 2008.TCS, Patni, LnT Infotech, I-
Flex WNS and other companies are
headquartered here.[Source: NASSCOM, 29 Jan 2008]
India's IT industry (USD bn)
*Table 1.2
Particulars FY 2004 FY 2005 FY 2006 FY 2007
IT Services 10.4 13.5 17.8 23.7
- Exports 7.3 10.0 13.13 18.1- Domestic 3.1 3.5 4.5 5.6ITES-BPO 3.4 5.2 7.2 9.5- Exports 3.1 4.6 6.3 8.3- Domestic 0.3 0.6 0.9 1.2
Engineering services, R&D and
Software products2.9 3.9 5.3 6.5
- Exports 2.5 3.1 4.0 4.9- Domestic 0.4 0.7 1.3 1.6
11

Hardware 5.0 5.9 7.0 8.2Total IT industry 21.6 28.4 37.4 47.8- Exports 13.4 18.2 24.1 31.9- Domestic 8.3 10.2 13.2 15.9[Source:NASSCOM,15 Jan 2008]
The IT industry has great scope for people as it provides employment to
technical and non-technical graduates and has the capability to generate
huge foreign exchange inflow for India. India exports softwares and
services to approximately 95 countries in the world. By outsourcing to
India, many countries get benefits in terms of labour costs and business
processes. Also, the Indian companies are broadening the range of
services being provided to the customers, which is resulting in more off
shoring. Talent acquisition, development and retention initiatives taken by
the companies have brought down the employee attrition rates, thereby
providing more stability to the employees and increasing their job
commitment.
Many financial institutions are providing funds for the expansion of IT and
ITeS businesses. In order to support IT and ITES, the Indian Government is
also taking many steps. For example: The Govt. has provided incentives
including tax holiday up to 2010 and competitive duty structures. The
Govt. is trying to reduce the international communication cost. It is
providing infrastructure support through organizations such as software
technology parks. All these factors collectively create a number of
opportunities in the IT sector. IT will continue to gain momentum telecom
and wireless will follow the trend. The immense expansion in networking
technologies is expected to continue into the next decade also.
IT will bring about a drastic improvement in the quality of life as it impacts
application domains and global competitiveness. Technologies that are
emerging are Data Warehousing and Data Mining. They involve collecting
data to find patterns and testing hypothesis in normal research. Software
services that are being used in outsourcing will go a long way. Change is
in the air in 2009. More so, in the case of IT companies. Enterprises are
12

embarking on various forward-thinking approaches and new technologies.
As the global economy slows down, and the macro economic situation
continues to be challenging, IT companies are looking for ways to trim
spending and improve their output. Technology trends in the networking
market point towards growth. According to Naresh Wadhwa, president and
country manager, India and Saarc, Cisco, The network and
communications market will propel the growth of the router and switching
market in India.
While banking, financial services and insurance (BFSI) and telecom service
providers will remain key adopters in the market, the government is likely
to emerge as a big spender due to various e-governance and state wide
area network (SWAN) initiatives. His wish list for 2009, says Naresh
Wadhwa, include, new, interesting and cost-effective applications of
collaborative technologies that enable enterprises to reach out to
consumers in rural India.
The three major business challenges in 2008, according to Arup Roy,
senior research analyst at Gartner, are: low-cost offshore business
delivery model, currency fluctuation and high talent crunch.According to
Pallab Talukdar, director, Enterprise Business, Dell, Given the recession,
the customer is more conscious while buying any product and the decision
cycle become longer. According to Faisal M Paul, head ESS, marketing and
growth Initiatives, HP India Sales Pvt. Ltd,
The biggest business challenge of 2008 which IT companies faced was the
sudden drop in customer projects and buying pattern and hence IT
companies are stretching to meet the orders and revenue commitments
made at the beginning of 2008. The era of incremental benefits and long
drawn out time-to-benefits seems to be over. Now customer would
demand more quantum increases in value based on the new value
frameworks emerging. Both customers, organizations and IT firms would
stick to no-brainer strategies instead of spiny strategies since the
opportunity costs of failure would be magnified in the present context,
Jalan said.
13

Data Centre consolidation seems to be high on every leader s agenda to
ensure optimal utilisation of existing resources and assets. According to
Pallab Talukdar, director, Enterprise Business, Dell, The three major
technologies in of 2009 will be a move towards Standardisation,
Virtualisation and a unified communication fabric in the data centre.
Wadhwa agrees, Virtualisation will play a big role in the near future as IT
organisations morph into more and more of a services management
framework.Analysts at Gartner predict that technology trends like SaaS,
virtualization and cloud computing, among others, are likely to shape IT
and business to a large extent in the coming year. Also, adoption of green
practices as a business imperative will intensify.
Retention Challenges in India
The pool of experienced professionals in India is smaller than its large
population would suggest. Out of its 1.1 billion people, about 350 million
use some English, but there may be as few as 20 million who are fully
fluent. And although over 2.5 million new college graduates are produced
every year, their education is often not up to the hiring standards of
Western firms. Due to the high demand for qualified people, Indians from
top colleges or with experience in reputable firms often have two or three
job offers at any given time. Therefore, although salaries in India are still
much lower than those in the West, they are steadily increasing. For
example, a recently-graduated accountant might be offered a starting
salary of $16,000 today, up from $12,000 two years ago. For graduates of
top business schools, starting salaries have been rising by as much as
50% annually in some cases.
In addition, attrition rates are extremely high in India. Estimates of
attrition rates in the industry’s most affected (business process
outsourcing, IT, retail, pharmaceuticals, etc.) range from 20% to 60%.
Some individual companies have seen attrition as high as 80%. This
revolving-door hiring costs a company severely in terms of lost training as
14

well as reduced efficiency. According to some estimates, a resigning
employee might cost the employer twice his or her yearly salary. In short,
HR professionals must deal with two main types of problems for India:
first, attracting good employees despite fierce competition; and second,
keeping these employees satisfied so that they do not leave.
Obviously, it is important to carefully follow standard best practices in HR,
Designing competitive compensation packages, with performance
incentives like bonuses and stock options as appropriate, Implementing
transparent performance review systems, Making sure employees are well
supervised and respected, providing good working conditions with flexible
hours if necessary. Since the heaviest competition is for candidates who
are already qualified for positions, an increasingly common strategy is to
broaden the pool of candidates past the ideal of “someone already doing a
similar job.” This may include hiring from outside a company’s own
industry; hiring from second-tier colleges and universities; and hiring less
skilled people with the intention of training them up.
One company doing this is Genpact, a major business process
outsourcing (BPO) provider in India originally started up by GE Capital.
Genpact has set up a “pre-hire training” institution to train Indians from
second-tier and third-tier cities. These people are often highly motivated
and capable, but may not know English well or lack degrees from good
schools. Other major companies with similar programs include EXL (also
a BPO provider) and Amway. Training employees not only expands the
candidate pool, but it also helps reduce future turnover, since it helps
candidates clearly understand beforehand what their job will entail.
Formerly, if Indian employees quit their jobs, they were not likely to be
taken back later. However, this is changing with the increased
sophistication of Indian HR practices. Now, in the tight job market, more
companies are welcoming former employees back. This is occurring at
mid-level as well as upper-level ranks. Not only do former employees
often have the skills companies are looking for, but they can also be re-
integrated into the workplace quickly. Examples of Western firms
15

actively reaching out to former employees in India include ADP, a global
financial services company, and Cairn Energy, a British oil exploration
company. Many companies, including Cairn, are creating online “alumni
portals” to keep in touch with their former employees. Some companies
are also expanding their referral commission systems (where employees
get payments for referring new hires) so that former employees as well
as current employees can receive referral commissions.
Many workplaces in India offer various leisure activities on-site. These
can help retain employees by letting them relax and reduce stress. The
methods are not unfamiliar to Western HR professionals. Infosys, an
IT/BPO firm with about 90,000 employees worldwide, hosts music and
sports competitions, clubs, and an art gallery at its India campus. It also
has other more conventional perks like gyms and food courts. These
types of benefits are especially suited to the IT industry, where
employees may have significant down-time between intensive periods
of work.
In India, it is relatively common to hold activities which both employees
and their families can attend. This helps integrate employee more fully
into the workplace “community.”However, leisure activities and perks
can only go so far. If you oversell a workplace as “fun,” candidates may
view their actual work unfavorably. Candidates should have an
understanding of their work as valuable to the company and to
themselves personally. Surveys show that salary is one of the top
considerations of Indians in choosing jobs, but it is only a minor factor in
employee satisfaction. If you want employees to stay at their jobs, one
of the best motivators is career development.
Therefore, the best employers in India carefully track career
development. They hold regular one-on-one meetings on the subject,
set and track goals, and provide training. Large companies tend to have
in-house training facilities, and smaller companies are also increasingly
providing funding for external training. Training might be for specific
technical skills, or for more general skills like learning a new language.
16

This makes employees more productive in the long run and also gives
them the signal that the company sees them as a worthy investment.
One career-development incentive used by larger companies in India is
internal company transfers. The Tata Group, a major conglomerate with
business including cars, finance, steel, and BPO, tracks its talent and
facilitates employee transfers across all companies in the group. This
motivates employees by showing that they will not be trapped in one
industry if they want to expand their marketability as an employee. With
foreign companies, the possibility of transferring to an overseas job is
also alluring. Companies with these internal transfer programs often
specify that employees cannot transfer until they have been employed
for a set period of time, such as 18 months.HR departments of major
companies in India are being forced to expand. According to some
estimates, HR staff is increasing from 1 in 500 total employees to 1 in
100. This is partly because the ratio of applications to new hires is very
high, giving recruiters a heavy workload. In addition, keeping employees
satisfied with their jobs is increasingly time-consuming. Insufficient HR
capability may be a strong liability for Western companies operating in
India.
In India, many HR functions can be outsourced as an alternative to
increasing staff. Nokia India, for example, uses vendors for most HR
functions except for functions integral to the company, like mentoring
and culture building. India’s strength in business process outsourcing
means most of these services can be found locally. Background
screening, for example, was almost nonexistent in India in 1995; today,
there are dozens of Indian companies specializing in it. One of the most
significant challenges to the growth and survival of any business is
finding and retaining qualified employees. It's not enough to offer an
appealing or unique product or service to your customers. A company's
people are the new competitive advantage. Those responsible for
staffing organizations are not only challenged with finding adequate
potential employees, but finding the right people for the positions they
need to fill.
17

This course explores two aspects of recruitment as one component of a
sustainable talent management strategy: attracting the talent needed to
meet the company's needs, and using innovative recruiting techniques to
find the right people. Learners will explore how to consider the needs of
the organization balanced against the expectations and needs of the
potential employees who comprise the talent market. The talent market
consists of a cross-section of potential employees that spans generations,
cultures, languages, and even continents, each of which brings something
different to the table and may expect or want something different in
return. The course specifically focuses on how to appeal to these recruits
by tapping in to what is important to them in a job. It also prepares
learners to establish and implement a recruitment strategy. Reflecting the
most up-to-date recruitment information, this course provides
foundational principles that learners can effectively put to work in their
own organizations.
Employee retention remains a critical issue that no corporation is immune
to. For a company to remain successful and competitive, it must keep its
biggest assets its people engaged and committed for the long term. It's a
known fact that even the most lucrative compensation plan alone is not
enough to keep your much-needed employees from moving on, so your
organization must utilize successful strategies for retaining employees.
This course provides you with an overview of employee retention
strategies. Specifically, you'll explore the elements of a high-retention
organization and the procedure for implementing a successful retention
strategy. This course also covers employee engagement, including
identifying and enhancing engagement drivers, measuring engagement,
and executing an engagement strategy.
One of the most significant challenges to the growth and survival of any
business is finding and retaining qualified employees. To be successful,
businesses should consider recruitment and retention not as two separate
efforts, but instead as a combined strategy for creating a high-retention
organization. This simulation provides the opportunity to practice the skills
required to integrate employee engagement and retention strategies with
18

recruitment efforts. Recruiting and retention in India today leaves little
margin for error. It is a challenge to make sure that new employees are
right for the job, and to make the best employees stay. However, by being
proactive and thorough in addressing these challenges, it is possible for
foreign companies to keep good people and achieve their business goals.
CHAPTER 2
REVIEW OF LITERATURE
19

CHAPTER 2
REVIEW OF LITERATURE
Employee turnover is a much studied phenomenon. There is a vast
literature on the causes of voluntary employee turnover dating back to the
1950s. By developing multivariate models that combine a number of
factors contributing to turnover and empirically testing the models
researchers have sought to predict why individuals leave organisations.
Many studies are based on only a small number of variables which often
only explain a small amount of variability in turnover. Another criticism of
turnover studies is that they do not adequately capture the complex
psychological processes involved in individual turnover decisions. A recent
study of turnover by Boxall et al (2003) in New Zealand confirmed the
view that motivation for job change is multidimensional and that no one
factor will explain it.
However, over time there have been a number of factors that appear to
be consistently linked to turnover. An early review article of studies on
20

turnover by Mobley et al (1979) revealed that age, tenure, overall
satisfaction, job content, intentions to remain on the job, and commitment
were all negatively related to turnover (i.e. the higher the variable, the
lower the turnover). In 1995, a meta-analysis of some 800 turnover
studies was conducted by Hom and Griffeth, which was recently updated
(Griffeth et al, 2000). Their analysis confirmed some well-established
findings on the causes of turnover. These include: job satisfaction,
organisational commitment, comparison of alternatives and intention to
quit. These variables are examined in more detail below, as are a number
of other factors where the evidence on the link to turnover is less
conclusive.
Now more than ever in the history of business, it is imperative for the
organization to manage people well. The shift from industrial age to the
knowledge worker’s age is sweeping the country. In fact the whole world is
in today’s information economy, people’s knowledge, skills and
relationships are an organization’s biggest asset and main source of
competive advantage. People related cost to have risen to more than two
third of organizational spending. Increasingly, talent attraction and
retention is viewed as significant drivers. According to a survey done by
the all India Management Association (AIMA), 90% of Indian companies
have talent retention problem and it mostly include the IT sector.The last
decade has seen problems in sourcing the right talent, rising attrition
rates, decreasing retention rates and poaching of employees by
competitors. To deal with the problem companies resorted to extensive
organizational change programmes and intervention from outside
consultants. These large scale programmes without proper diagnose of
the prevailing problems lead to more troubles rather than any further
changes for the organizations. It is rightly said that “mangers at every
level are accountable for attracting and retaining manpower to keep the
wheels of business running”.
21

“Talent retention is identified as the second most H.R challenge to
critically meet the business demands beyond tomorrow. Organization can
use a combination of four strategies pay, benefit, learning and
development, work environment to create and retain a pool of talented
employees for the organization. Success companies assign the same
importance to employer branding as they give to product branding which
help them in becoming am employer of choice. They are continuously
innovating and inventing new ways to keep talented employees stick to
the organization, which is changing the face of talent management in
India” (Madok.Anneta, 2006).In a recent survey of 57 CEO’s and H.R
professional “Talent Retention” is identified as the second most HR
challenge to critically meet the business demands beyond tomorrow, then
comes the issues of “Creating high performance culture’.
*Table 2.1
Sl.No HR Challenge Rank in order
of
Importance
Percentage
of top ten
reason
Percentage
of bottom
ten reason
1 Creating a
high
performance
culture
1 47% 3%
2 Talent
retention
2 28% 0%
3 Recruiting in
today’s
context
3 22% 0%
22

4 Managing
mindsets
4 6% 8%
5
Training for
growth 5 6% 0%
6 Compensatio
n knowledge
workers
6 3% 8%
7 Building
inter-
personal
relationship
7 6% 14%
8 Going global 8 6% 22%
9 HR system
implementati
on
9 6% 28%
10 Human
capital
practice
10 0% 17%
Source: (Madok.Anneta, 2006)
Attrition in IT sector: A growing cause for concern (Chakraborty. Samik,
2008). In this article it reveals the present scenario situation of employee
attrition rate, and what are few factors which are responsible for this
threat. In olden days the employees were well satisfied with the salary
package they used to get, but now it’s only one factor to retain the
employee with the organization. This article also reveals that the
organization should be very careful in handling with various issues
regarding the employee because it is very sensitive. The article also talks
about the various elements like rewards and recognition, grievance
redressal mechanism, career progress, ego troubles which should be taken
care.
23

"In today's workplace, employers are not only having a hard time
attracting employees, but are also having a difficult time keeping them
(Harkins, 1998). Employees leave for a variety of reasons, including poor
supervision, unchallenging positions, limited advancement opportunities,
lack of recognition, limited control over work, perceived pay inequity, and
the perception of more favorable opportunities in other companies
(Jardine, 2001). High employee turnover is one of the great Samik, yet
causes of declining productivity and decreased morale in corporate
America (Abassi, 2000). While morale decreases, recruiting and training
costs increase and an organization can find itself in a vicious cycle
(Secretan, 2001)." "One of the most foundational issues facing businesses
of any size in the modern economic world is employee retention. Gone are
the days where one individual keeps the same job for their entire working
career retiring with 30 years of service and a gold watch. The current
business climate in small, medium and large companies includes one of
transitional employees, both intentional and unintentional. On the whole
much more funds are spent on the job and external training than has been
spent in the past as a result of the fact that most people now work one job
or career for no more than about ten years and then either move forward
in the company to a completely different position or more commonly
move on to another company or even to a completely different career."
"The CIPD data published by Talent Drain shows that in order to retain
good employees by meeting their psychological growth needs, 58% of
companies institute "training and development" strategies, 20% of
companies redesign job duties, and 29% implement mentoring systems. In
order to enhance "the everyday experience" of employees, 52% of
companies utilize "improved induction processes"; 48% of companies
surveyed work towards "improved communication"; 32% approach the
"work-life balance" of the worker; 35% implement "flexible working"
hours; 32% have established "family-friendly provisions" that go beyond
the UK legal minimum provisions."
24

"The findings of Trank and colleagues (2002) were that individual pay-for-
performance schemes were potentially most effective amongst high
achievers. As these high achievers are likely to also be the most desirable
employees which a company would wish to retain this then would suggest
financial incentives to be an effective tool for retention. Rynes and
colleagues (2003) suggest that this is related to the concept that financial
incentives may function as a motivator due to an individual being driven
by the desire to have a salary which is larger than that of their peers.
Rynes suggests that it is the differentiation of pay which is actually the
largest motivator for this reason. This then would suggest that high salary
alone is not sufficient for retention of desirable staff, but that
differentiation according to achievement is crucial. Rynes argues that high
achievers would not wish to work in a company in which achievement is
not recognized through reward. This would then imply that any company
which does not engage in pay-for-performance schemes is likely to lose
desirable employees to a company which does operate with financial
incentives."
There is little evidence of a person’s sex being linked to turnover. Griffeth
et al’s (2000) Meta analysis re-examined various personal characteristics
that may be linked to turnover. They concluded that there were no
differences between the quit rates of men and women. They also cited
evidence that gender moderates the age-turnover relationship (i.e.
women are more likely to remain in their job the older they get, than do
men). They also found no link between intelligence and turnover, and
none between race and turnover.
The research conducted on the link between dissatisfaction with pay and
voluntary turnover appears to be inconclusive. Mobley et al (1979)
concluded that results from studies on the role of pay in turnover were
mixed but that often there was no relationship between pay and turnover.
Other studies found no significant relationship. On the other hand
Campion (1991) cited in Tang suggests that the most important reason for
25

voluntary turnover is higher wages/career opportunity. Martin (2003)
investigates the determinants of labour turnover using establishment-
level survey data for the UK. Martin indicated that there is an inverse
relationship between relative wages and turnover (ie establishments with
higher relative pay had lower turnover). Martin (2003) detected a complex
relationship between turnover and training. He suggested that
establishments that enhance the skills of existing workers have lower
turnover rates. However, turnover is higher when workers are trained to
be multi-skilled, which may imply that this type of training enhances the
prospects of workers to find work elsewhere. The literature on the link
between lower turnover and training has found that off-the-job training is
associated with higher turnover presumably because this type of training
imparts more general skills (Martin, 2003).
26

Tenure is also negatively related to turnover (the longer a person is with
an organisation, the more likely they are to stay). Mangione in Mobley et
al concluded that length of service is one of the best single predictors of
turnover. Griffeth et al also found that age and tenure have a negative
relationship to turnover. There is little evidence of a person’s sex being
linked to turnover. Griffeth et al’s (2000) Meta analysis re-examined
various personal characteristics that may be linked to turnover. They
concluded that there were no differences between the quit rates of men
and women. They also cited evidence that gender moderates the age-
turnover relationship (i.e. women are more likely to remain in their job the
older they get, than do men). They also found no link between intelligence
and turnover, and none between race and turnover.
The research conducted on the link between dissatisfaction with pay and
voluntary turnover appears to be inconclusive. Mobley et al (1979)
concluded that results from studies on the role of pay in turnover were
mixed but that often there was no relationship between pay and turnover.
Other studies found no significant relationship. On the other hand
Campion (1991) cited in Tang suggests that the most important reason for
voluntary turnover is higher wages/career opportunity.
Martin (2003) investigates the determinants of labour turnover using
establishment-level survey data for the UK. Martin indicated that there is
an inverse relationship between relative wages and turnover (ie
establishments with higher relative pay had lower turnover). Martin (2003)
detected a complex relationship between turnover and training. He
suggested that establishments that enhance the skills of existing workers
have lower turnover rates. However, turnover is higher when workers are
trained to be multi-skilled, which may imply that this type of training
enhances the prospects of workers to find work elsewhere. The literature
on the link between lower turnover and training has found that off-the-job
27

training is associated with higher turnover presumably because this type
of training imparts more general skills (Martin, 2003).
28

According to a study by Daniel G. Spencer in 1986 on Employee voice and
employee retention: Even though the study was conducted upon the
hospital concern, it throws light on the factor how important is for any
employee to raise his/ her voice or suggestion within the organization. The
study also states that if the organization listens to the employee and takes
their value suggestion. To a great extent it will be easy for the
organization to retain the employee. The study also highlights the
importance of working atmosphere in retaining the employee strength. It
states that overall satisfaction plays a very crucial role in employee
retention. Tenure is also negatively related to turnover (the longer a
person is with an organisation, the more likely they are to stay). Mangione
in Mobley et al concluded that length of service is one of the best single
predictors of turnover. Griffeth et al also found that age and tenure have a
negative relationship to turnover.
According to a study conducted by Martin G. Evans in 1970 on Leadership
and Motivation: A core concept. The study emphasize on the importance
of the supervisor relationship in order to retain the employee with the
organization. The study briefly states how a supervisor can motivate a
subordinate to achieve the organizational goals through the achievement
of the individual morale satisfaction. The study also throws a light on how
important is the non-monetary benefits for an employee. The best way to
improve employee retention is to understand what the employee want
and need from the work place and provide it. Companies must meet
employees demand within limits. Management cannot just dish out
indiscriminate amount of money to employee or give them whatever they
demand. Individuals with high career commitment and low organisational
commitment also tend to leave because they do not believe that the
organisation can satisfy their career needs or goals. This is consistent with
previous research that high career committers consider leaving the
company if development opportunities are not provided by the
organisation. However, this group is not apt to leave and is likely to
contribute to the company if their organisational commitment is
29

increased. Chang found that individuals become affectively committed to
the organisation when they perceive that the organisation is pursuing
internal promotion opportunities, providing proper training and that
supervisors do a good job in providing information and advice about
careers.
Kirschenbaum & Mano-Negrin (1999) indicated that turnover is affected
by organisational size, with size being the key mediator of an
organisation’s internal labour market. They suggest that organisational
size impacts on turnover primarily through wage rates but also through
career progression paths. Developed internal organisational labour
markets produce lower departure rates since promotion opportunities
have a strong negative influence on departures for career-related reasons.
Mobley et al (1979) concluded that a number of studies offered moderate
support for a negative relationship between satisfaction with supervision
and turnover (ie the higher the satisfaction with supervision, the lower the
turnover).
Another way of measuring turnover is to base turnover rates on voluntary
leavers or resignation rates only, thus excluding employees who have left
for other reasons such as retirement, redundancy, dismissal or
redeployment to another part of the organisation. However, basing
turnover rates on voluntary leavers can also have its drawbacks because
it does not indicate how many staff needs recruiting to cover those
employees who have left because of retirement or voluntary internal
transfers. One solution is to record separate turnover rates for voluntary
and involuntary leavers (IDS, 2004). Wastage rates can also be used for
specific groups of employees or different business units, which allow an
organisation to detect differences in turnover within different parts of the
organisation. Overall figures tend to mask potentially significant
differences in turnover within an organisation (IDS, 2004). For example,
high turnover in one area of the business could produce the same overall
rate as a small number of leavers distributed evenly across the
30

organisation, but the actions required to deal with these situations would
be quite different. Examining turnover by department can identify any
local issues or possible problems concerning particular line managers or to
monitor turnover among groups of employees with scarce skills. Wastage
rates can also be applied to employees with a certain length of service (eg
less than one year) which can help pinpoint ineffective recruitment,
selection or induction processes (IDS, 2004).
Organisations typically obtain qualitative information on turnover through
exit interviews and surveys. However, it is important to appreciate that
the reasons people give for their resignations are frequently untrue or only
partially true (CIPD, 2004). The use of exit interviews is widespread yet
they can be unreliable, particularly when conducted by someone who may
later be asked to write a reference for the departing employee. Where exit
interviews are used it is best to conduct them a short time after the
employee hands in their notice. The interviewer should be someone who
has not had direct responsibility for the individual (i.e. as their line
manager) and who will not be involved in future reference writing.
Confidentiality should be assured and the purpose of the interview
explained (CIPD, 2004). Alternative approaches involve the use of
confidential attitude surveys which include questions about intention to
leave and questionnaires sent to former employees on a confidential basis
about six months after their departure. In high turnover industries in
particular, a great deal of employee turnover consists of people resigning
or being dismissed in the first few months of employment (CIPD, 2004).
The costs of recruitment and turnover per individual become much
greater when new staff leave after only a short period of time. Where new
employees leave after a short period in the job, poor recruitment and
selection decisions both on the part of the employer and employee are
usually the cause, along with poorly designed or non-existent induction
programs (CIPD, 2004). If expectations are raised too high during the
recruitment process this can result in people accepting jobs for which they
31
may be unsuited. Organisations often do this to ensure that they fill their
vacancies with sufficient numbers of well-qualified people as quickly as
possible. However, this can be counterproductive over the longer-term, as
it can lead to costly avoidable turnover and to the development of a poor
reputation in local labour markets. The CIPD (2004) suggests that
employers give employees a realistic job preview at the recruitment stage
and take care not to raise expectations. It may also be useful to invite
applicants to work a shift before committing themselves.
This review of turnover literature identifies a range of factors that have been shown to be
consistently linked to turnover. These include organisational commitment, job satisfaction,
alternative opportunities and intentions to quit. Evidence on the role of pay is still somewhat
inconclusive, although keeping pay in line with market rates is certainly critical to retaining
staff. Apart from age and tenure, personal characteristics of employees appear to have little
relationship to turnover. While these factors can help employers understand the general nature
of turnover and its likely causes, the retention strategies adopted within industries and
organisations tend to cover a unique mix of measures and approaches specifically targeted at
the particular problem they face. Understanding the problem is the key to devising an
effective retention strategy.
32

CHAPTER 3
RESEARCH METHODOLOGY
CHAPTER 3
RESEARCH METHODOLOGY
33

STATEMENT OF PROBLEM
Managing attrition does not mean reducing attrition only. It could also
mean bringing down the negative effects of attrition. To do this the
organizations should put up appropriate retention and capacity utilization
or talent utilization tactics. There are various retention strategies used by
the organizations today. The objective is to know how effective it is from
the employee’s perspective and how it is administrated. A high rate of
attrition effect the organization in many ways like it leads to more
expense, loss of company knowledge, Interruption of customer service, as
well as the company’s goodwill get effected. Handling the employee
retention issues has got a serious attention at all level of management.
The problem of employee retention has hit all category of employee
equally. Employee retention one of the major issues faced by any industry.
Although several studies are done on the topic, the issue is still disturbing.
Even though companies make efforts to control this issue, still it fails to a
great extent. This study makes an attempt to figure out what the real
problem is and effectiveness of the polices followed by the IT companies
to retain their human resource. This study is done from the employee’s
prospective.
34

OBJECTIVE OF THE STUDY
Broad objective:
“A study on employee retention practices and its effectiveness in IT sector”.
Specific objective:
• To measure the effectiveness of the current employee retention
practice.
• From the employee perspective, to understand and analyse the
reason for high employee turn over rate.
• To find out the recent employee retention practices and techniques
in IT industry.
• To study the impact of non-monetary motivational factors designed
by the organizations in retaining its employees.
• To study the role of organization culture in retaining the employee.
OPERATIONAL DEFINTION
Employee: A person who is hired to provide services to a company on a
regular basis in exchange for compensation and who does not provide
these services as part of an independent business.
35

Retention: In simple words retention means keeping or possessing
something.
Employee Retention: It is a business management term referring to efforts
by employers to retain current employees in their workforce.
NEED FOR THE STUDY
Employers have a need to keep employees from leaving and going to work
for other companies. This is true because of the great costs associated
with hiring and retraining new employees. The best way to retain
employees is by providing them with job satisfaction and opportunities for
advancement in their careers. This study is conducted within Bangalore,
city known as the IT hub of India. There is a good scope for the study as
Bangalore has all the IT firms from all over the world located at different IT
parks. As attrition is a serious problem concerning the companies, the
study will help to have overlook.
METHODOLOGY
Data collection:
Primary data is collected with the help of structured questionnaire
measuring the retention practices and its effectiveness on a five point
Likert scale.
Secondary data is collected on the base of articles and other publication
on the topic from journals, news papers, magazines, and websites.
36

RESEARCH DESIGN
Sample population : The population of the survey consists of employees
(Human Resource Management and Administrative department) from IT
service industry.
Sample Unit: Collection of the data is from the employees of various
groups from IT industry in Bangalore. As for the study convenient
sampling method was used, top ten companies rated by NASSCOM was
selected as sample unit.
Sample size: 200 Management employees from IT companies in
Bangalore.
SAMPLE CHARACTERISTIC:
1. Gender
*Table 3.1
Gender Frequency Percent
Male 94 47.0
Female 106 53.0
Total 200 100.0
*Chart3.1
Source: Table 3.1
Out of 200 respondents 106(53%) were female and 94(47%) were male.
37

2. Age
*Table 3.2
Age Frequency Percent< 30 years 148 74.0
31-40 years 42 21.0
41-50 years 10 5.0
Total 200 100.0
*Chart 3.2
*Source: Table 3.2
Above table and Chart depicting the result of Age distribution among the
samples, among the total sample of 200, maximum respondents were
given by those in the age group of <30 years, constituting to 74%. It was
followed by the sample in the age span of 31-40 years, 21%. Then the
least chunk of respondents was aged above forty, 5%. This implies that
38
maximum numbers of respondents are in the age group of < 30 and the
least are the people aged above forty.
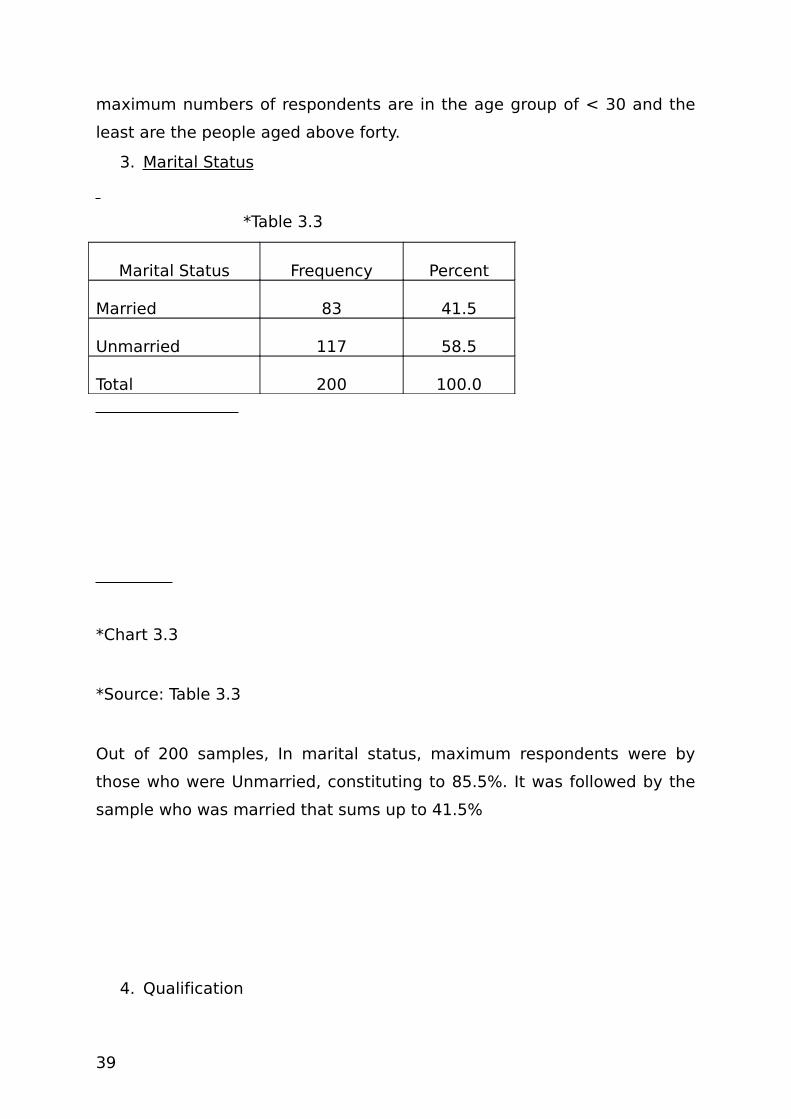
3. Marital Status
*Table 3.3
Marital Status Frequency Percent
Married 83 41.5
Unmarried 117 58.5
Total 200 100.0
*Chart 3.3
*Source: Table 3.3
Out of 200 samples, In marital status, maximum respondents were by
those who were Unmarried, constituting to 85.5%. It was followed by the
sample who was married that sums up to 41.5%
4. Qualification
39

*Table 3.4
Qualification Frequency Percent
Graduate 63 31.5
Post Graduate 95 47.5
Professional 42 21.0
Total 200 100.0
*Chart 3.4
*Source: Table 3.4
When it came to educational qualification, maximum number of
respondents was Post graduates, which constituted to 47.5%. Then 31.5%
of the sample was graduates and 21% percent of them were Professionals.
5. Designation
*Table 3.5
40

Designation Frequency Percent
Associate/Executives 49 24.5
Hr Executive 57 28.5
Mgr / TL 29 14.5
Sr.Exe/Assoc 41 20.5
Others 24 12.0
Total 200 100.0
*Chart 3.5
*Source: Table 3.5
Now considering the designation, we can see that Associates and HR.
Executes are more ore less equally distributed around 25% and followed
by Sr.Executives around 20%. Managers and Team Leads around 14.5%
and others constitutes R&D, Payroll and Support close to 12%
6. Experience
*Table 3.6
Experience in Current Position
Frequency Percent
Less than 1 year 81 40.5
1 to 3 years 72 36.0
41

More than 3 years 47 23.5
Total 200 100.0
*Chart 3.6
*Source: Table 3.6
Considering the work experience of respondents in current organization,
maximum responses were given by those who had work experience
between less than years, constituting to 40.5%. 36% of the respondents
had an experience of 1- 3 years. Then the other chunk of respondents had
an experience more than three years close to 24%.
7. Organization worked for last 5 yrs.
*Table 3.7
No. of Org. worked in last 5 years
Frequency Percent
First Job 14 7.0
1 org. 71 35.5
2 org. 86 43.0
3 org. 23 11.5
42

4 org. 6 3.0
Total 200 100.0
*Chart 3.7
*Source: Table 3.7
Out of 200 samples, 43% of respondents has changes 2 organization in
the past 5 years of their career, followed by 35.5% of 1 organization,
11.5% of respondents worked for 3 organization and 7% of respondents
the current employment is first job in their career
LIMITATION OF THE STUDY
43

The study was restricted only to Bangalore City due to the time
constraint.
The study was limited to the extent of information provided by the
IT Employees.
The study was limited with the data collected from employee of H.R
and administrative department.
The outcome of the study can not be generalized.
The results of the survey was based on the respondents, chance of
bias is present.
STATISTICAL TOOLS USED IN THE STUDY
For the analysis of demographic data percentage analysis is used.
To aggregate factor score, mean score is been used.
Correlation analysis is used to find the relationship between
different elements.
To find the impact on all variable we have used multiple regression
analysis is used.
To check the goodness of the data reliability analysis is used.
To reduce the dimension of retention strategy factor analysis is
used.
44

CHAPTER 4
DATA COLLECTION & ANALYSIS
45

CHAPTER 4
DATA COLLECTION AND ANALYSIS
Section A of the questionnaire
*Table 4.1Retention strategy (N=200) Available Not
AvailableTraining & development opportunities 86.5% 13.5%Rewards & Recognition 83.5% 16.5%Job rotation Relocation 83.0% 17.0%Benchmarking 82.0% 18.0%Mentoring & Coaching 81.5% 18.5%Contract agreements 69.5% 30.5%Help with career plan 66.0% 34.0%Flexible work time 62.5% 37.5%Onsite opportunities 52.5% 47.5%Assistance in higher education 47.5% 52.5%360 degree appraisal system 47.0% 53.0%Work from home 39.0% 61.0%Stock investment opportunities 35.0% 65.0%Antipoaching agreements 35.0% 65.0%Financial support for education 34.5% 65.5%Nominal rental facility 34.5% 65.5%Day care facility 32.0% 68.0%
*Chart 4.1
*Source: Table 4.1
46

Section B of the questionnaire
*Table 4.2
Benefits (N=200) Available Not Available
Salary Compensation 100.0% 0.0%
Leave benefits 76.5% 23.5%
Health Insurance benefits 80.0% 20.0%
Retirement plan PF 84.5% 15.5%
Seasonal Festival benefits 26.5% 73.5%
Nonmonetary benefits such as team tours 61.0% 39.0%
Recreational benefits gym health club 73.0% 27.0%
*Chart 4.2
*Source: Table 4.2
Factor Analysis
*Table 4.3
Rotated Component Matrix Factor Name Career
Development
Education Back
up
Peripherals’ Benefi
Flexi working
s
Locking
strat
Mentoring
47

ts egy
Training & development opportunities
0.81
Rewards & Recognition
0.79
Benchmarking 0.69
Onsite opportunities
0.64
Financial support for education
0.87
Assistance in higher education
0.75
Stock investment opportunities
0.53
Job rotation Relocation
0.46
Day care facility 0.78
Nominal rental facility
0.68
Flexible work time
0.84
Work from home
0.68
Antipoaching agreements
0.89
Contract agreements
0.66
360 degree appraisal system
0.46
Mentoring & Coaching
0.68
Help with career plan
0.64
TVE (%) 69.69%
15.12 14.43 10.38 10.28 10.19
9.28
Eigen Value 4.38 2.03 1.71 1.54 1.17 1.02Extraction Method: Principal Component Analysis. Rotation Method: Varimax with Kaiser Normalization.
48

49

*Chart 4.3
*Source: Table 4.3
Five Factors derived by using Eigen value is greater than 1 total variance explained = 69.69%
Factor 1 – Career Development
*Chart 4.4
*Source: Table 4.3
According to the above table Training and development opportunities have a higher value
than the other factors of career development programmes.
Factor 2 – Education Break up
*Chart 4.5
*Source: Table 4.3
According to the above table financial support for education have a higher
value.
Factor 3 – Pripherlas Benefits
*Chart 4.6
*Source: Table 4.3
50

According to above table compared to a nominal rental facility, day care
facility have a higher value.
Factor 4 – Flexi Workings
*Chart 4.7
*Source: Table 4.3
According to above table an effective plan with flexible work time can help
in employee retention.
Factor 5 – Locking Strategy
*Chart 4.8
*Source: Table 4.3
According to above table antipoaching agreements are effective and have
value.
The general purpose of factor analysis is to find a method of summarizing
the information contained in a number of original variables in to a smaller
set of new composite dimensions (Factors) with minimum loss of
information. That is, the Factor Analysis tries to identify and define the
underlying dimensions in the original variables.
Factor analysis usually proceeds in following steps:
Principal Component Method Factor extraction is used, the number of factors necessary to
represent the data and the method of calculating them must be determined. At this step, how
well the chosen model fits the data is also ascertained. Kept Eigen value is greater than 1 to
extract factors from the given variables. This step is to determine the method of factor
51

extraction, number of initial factors and the estimates of factors. Here Principal Components
Analysis (PCA) is used to extract factors. PCA is a method used to transform a set of
correlated variables into a set of uncorrelated variables (here factors) so that the factors are
unrelated and the variables selected for each factor are related. Next, PCA is used to extract
the no. of factors required to represent the data.
For our study, we have 17 variables (statements rating varying from 1 to 5) 1 is Least
Important and 5 is Highly Important determine practice of Retention Strategy indicators
and kept Eigen value is greater than 1 to extract variables for the factors.
In the row (Eigen values) & below the row named TVE ‘Total variance explained’, we find
the variance on the new factors that were successively extracted. In that these values are
expressed as a percentage of the total variance. As we can see, factor 1 for about 15
Percentage of the total variance, factor 2 about 14 Percentage, and so on. This contains the
cumulative variance extracted is 69.69%. The sums of square of all the variables in given
factors are called the Eigen values. If Eigen value is greater than 1 it become factors. Sum of
square of a variable across factors are called communalities, as a threshold level
communalities should be greater than .5
Varimax Method Rotation is used, focuses on transforming the factors to make them more
interpretable. Since the idea of factor analysis is to identify the factors that meaningfully
summarize the sets of closely related variables, the Rotation phase of the factor analysis
attempts to transfer initial matrix into one that is easier to interpret. It is called the rotation of
the factor matrix.
There are several methods available for rotating factor matrix. The one used in this analysis is
Varimax Rotation, the most commonly used method, which attempts to minimize the number
of variables that have high loadings on a factor. This should enhance the interpretability of
the factors. The Rotated Factor Matrix showed Rotated Component Matrix using Varimax
rotation is given in Table 4.3, where each factor identifies itself with a few set of variables.
52

Scores for each factor can be computed for each case. These scores are then used for further
analysis. Normally factor analysis can generate but in this study we used mean score based
on data summarization is happened as the outcome of the factor analysis.
Summary
Thus the 17 variables in the data were reduced to 6 factor models and
each factor may identify and named with the corresponding variables
which is shown in Table 4.3. They are factor 1 is Career Development,
factor 2 is Education Back up, , factor 3 is Pheriperals Benefits, factor 4
is Flexi workings, factor 5 is Locking strategy and factor 6 is Mentoring
Correlation
*Table 4.4Pearson Correlation
53
Would recommend the organization for anyone to work for your Organization
Correlation Sig. (1-tailed) N
Career Development
0.17 0.01* 200.00
Education Back up
0.13 0.03* 200.00
Peripherals’ Benefits
0.04 0.30 200.00
Flexi workings
0.06 0.18 200.00
Locking strategy
0.04 0.30 200.00
Mentoring 0.14 0.02* 200.00
Benefits 0.13 0.04* 200.00
Personal Satisfaction
0.43 0.00** 200.00
Overall Retention Strategy
0.15 0.02* 200.00
Org. Culture
0.67 0.00** 200.00
** Correlation is significant at the 0.01 level (1-tailed).* Correlation is significant at the 0.05 level (1-tailed)
H1: There is statistically relationship between Employees Retention
Strategies and Employees Recommendation
H2: There is statistically relationship between Benefits and Employees
Recommendation
H3: There is statistically relationship between Personal Satisfaction and
Employees Recommendation
54

H4: There is statistically relationship between Organization Culture and
Employees Recommendation
*Chart 4.9
The above Table reported by Correlation analysis for Employees Retention
Strategies six factors versus Recommendaion variables “Would
recommend the organization for anyone to work for your Organization”.
The First factor is Career Development which is correlated with
Recommendation is 0.17 (17%) since sig value is less than 0.05; the
relationship is statistically significant at 5% level , factor 2 is Education
Back up which is correlated with Recommendation is 0.13 (13%) since sig
value is less than 0.05; the relationship is statistically significant at 5%
level , factor 3 is Pheriperals Benefits which is correlated with
Recommendation is 0.04 (4%) since sig value is not less than 0.05; there
is no statistically significant relationship, factor 4 is Flexi workings
Benefits which is correlated with Recommendation is 0.06 (6%) since sig
value is not less than 0.05; there is no statistically significant relationship,
factor 5 is Locking strategy which is correlated with Recommendation is
0.04 (4%) since sig value is not less than 0.05; there is no statistically
significant relationship and factor 6 is Mentoring which is correlated with
Recommendation is 0.14 (14%) since sig value is less than 0.05; the
relationship is statistically significant at 5% level.
Apart from these, Benefits, Personal Satisfaction and Organizational
Culture are correlated with Recommendation since all sig value is less
than 0.05; the relationship is statistically significant at 5% level. Among
these Organizational Culture is highly correlated with Recommendation
i.e. .67 or 67% and significant at 1% level.
Multiple Regression Analysis
55

*Table 4.5Table Model Summary & ANOVA F Value
R R Square F Sig.
0.68 0.47 56.92 0.00**** Model Sig at 1% level * Sig at 5% level
H5: There is statistically Impact between Employees Retention Strategies
and Employees Recommendation
H6: There is statistically Impact between Benefits and Employees
Recommendation
H7: There is statistically Impact between Personal Satisfaction and
Employees Recommendation
H8: There is statistically Impact between Organization Culture and
Employees Recommendation
Regression analysis was used to find the effect of Employees Retention
Strategies on Recommendation of the employees. The results of the
analysis are shown in the Table. It is seen from the table that the
correlation coefficient value is (R) 0.68 for linear model, which exhibits a
fair amount of correlation between the Independent variable (Employees
Retention practices) and dependent variable (Recommendation), with the
F-ratio being 56.92 and its associated significance level being small
(P<0.01). The R square value gives us the goodness of fit of the
regression model. That is, the amount of variability explained by the
whole of the selected predictor variables in the model for 47 % (R2%=.47 *
x100=47%) of variation in the dependent variable (Recommendation).
56

*Table 4.6
Table Coefficients
( Y=a+b1x1+b2x2+b3x3)
Unstandardized
Coefficients
Standardized
Coefficients
T Sig.
B Std. Error
Beta
(Constant) (a) -
1.930.52 -3.72 0.00**
Personal Satisfaction (x1) 0.02 0.10 0.01 0.20 0.85
Retention Strategy (x2)
0.25 0.11 0.13 2.39 0.02*
Org. Culture (x3) 1.21 0.12 0.66 10.06 0.00**
(Y) Dependent Variable: Level of Recommending to others
** variablesn Sig at 1% level * Sig at 5% level
Coefficient Table shows the relationship between Employees Retention
Strategies, Personal Satisfaction and Organization Culture on
Recommendation of the employees Retention Strategy and Organization
Culture Sig value are less than .05; hence it is statistically significant at
5% level. The signs between variables are also expected all are positive.
Hence there is statistically linear relationship between Employees
Retention Strategies, Organization Culture on Recommendation of the
employees. The most important variables which influences on
Recommendation of the employees is Organization Culture it is based on
Standardized beta coefficient i.e. .66, which shown in the table.
57

Reliability Test *Table 4.7Reliability Statistics Scale Statistics
Cronbach's Alpha
N of Items
MeanVarianc
e
Std. Deviati
on
0.81 17.00 64.21 69.63 8.34
Cronbach alpha inter item test is conducted to know the reliability of the data. In other words
to know the goodness of data which shown .81 , the threshold value is >.7, Nunnally (1990).
In the Table corrected Item-Total correlation is >.3 for all variables which is again meeting
the threshold value of .3.
*Table 4.8
Items
Corrected
Item-Total
Correlation
Cronbach's Alpha if Item
Deleted
Mentoring & Coaching
0.36 0.80
Help with career plan 0.35 0.80
Assistance in higher education
0.54 0.79
Financial support for education
0.44 0.80
Job rotation Relocation
0.34 0.80
Flexible work time 0.40 0.80
Work from home 0.45 0.80
Rewards & Recognition
0.50 0.80
Training & development opportunities
0.31 0.80
58
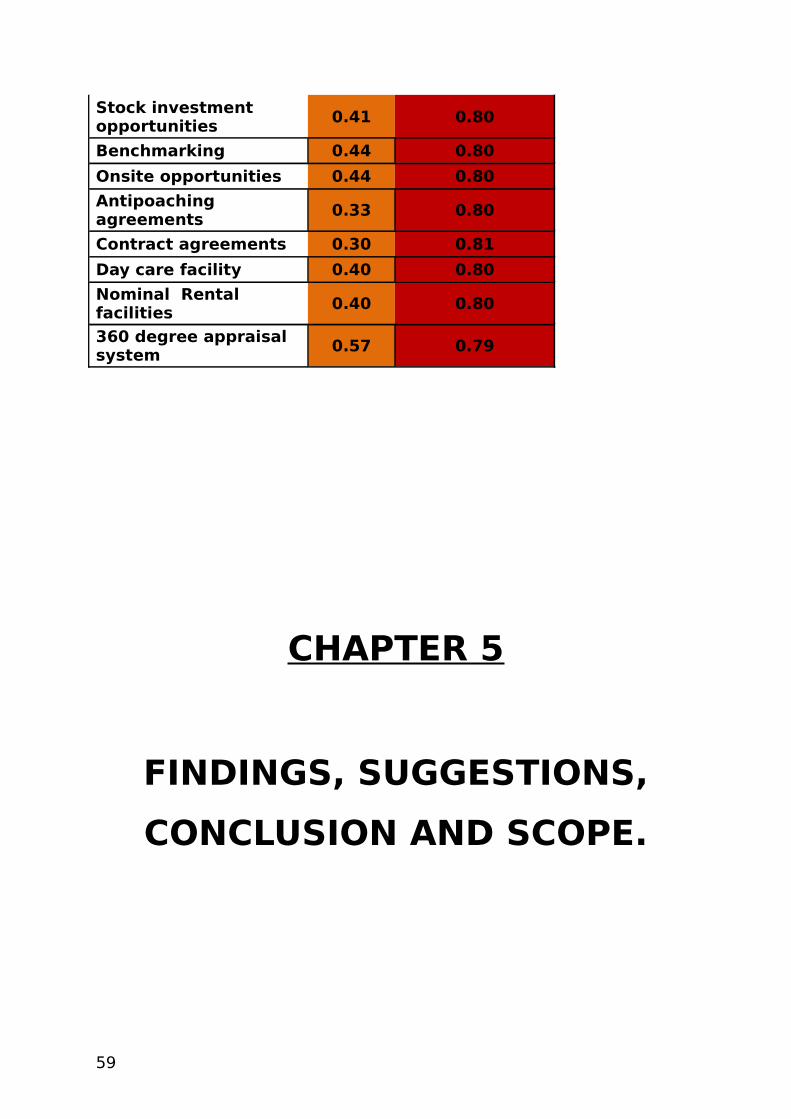
Stock investment opportunities
0.41 0.80
Benchmarking 0.44 0.80
Onsite opportunities 0.44 0.80
Antipoaching agreements
0.33 0.80
Contract agreements 0.30 0.81
Day care facility 0.40 0.80
Nominal Rental facilities
0.40 0.80
360 degree appraisal system
0.57 0.79
CHAPTER 5
FINDINGS, SUGGESTIONS,
CONCLUSION AND SCOPE.
59

CHAPTER 5
FINDINGS, SUGGESTIONS, CONCLUSION AND SCOPE.
FINDINGS FROM THE STUDY:
• There is a positive relation between employee retention
strategies and employee recommendation. This is drawn from
the basis of correlation analysis done [Table4.4].
• The impact or effectiveness of current employee retention
strategies is very low; we can justify this finding with the results
of correlation analysis done. This finding fulfills the first objective
of the study.
• From the regression model analyzed we can say that organization
culture has a positive impact and at the same time a high value
in the process of employee retention practice compared to other
elements. [Chart 4.8]
• Antipoaching agreements, which is one of the current practices of
most IT Firms, has a positive impact in employee retention
practice. Based on the factor analysis done.
60

• From the analysis done we can say non-monetary factors also
play a positive impact on employee retention. On the basis that
the non-monetary benefits have a positive value based on the
factor analysis. [Table 4.3]
• There is a positive relationship between personal satisfaction and
employee recommendation. We can say this on the basis of
correlation analysis. [Table 4.4]
• There is a positive relationship between benefits and employee
recommendation. This finding we support with the multiple
regression analysis. [Table 4.6]
• From the overall analysis of primary data we can state that the
demographic variable also plays an important role in employee.
Like it is tougher to retain an employee with a higher qualification
and experience than an employee at a graduation and entry
level. Another important element which effect the employee
retention is marital status.
SUGGESTIONS FROM THE STUDY
• Based on the primary data collected upon the retention strategy
the following suggestion can be raised. Like out of 200
respondents 61% is not offered with the option of work from
home, just 31% enjoy this option. If the organization put this into
more practice it will have a positive effect on employee retention,
at the same time it will be very beneficial for the organization as
well.
• Taking into consideration of stock investment opportunities only
35% has it and a majority of 65% dose not enjoys this option. The
61

organization can promote this practice which will help them to
build a personnel rapo with the employees.
• Taking into consideration the elements like nominal rental facility
and day care facility. It would help the organization in a good
manner. If the organization could support the employee in the
above mention element, like if there is a day care assistance
attrition rate among the female employees can be reduced to a
good level. From the study it was showing that only 32%
employees have this option rest 68% does not have this
opportunity.
• Considering the second part of the primary data tool ie benefits,
we can see seasonal benefit [Table 4.2] 73.5% is not offered this
benefit. If the organization take a step forward in this practice it
will help to create a sound bounding with the employees.
• From the secondary data ie reviews and articles we could see
that an employee – employer relationship is very important. It
plays very crucial role in employee retention. So the organization
should develop and put into practice programmes which help to
improve this area. At the same time the organization should have
clear communication process which will help to solve 90% of the
problems faced.
• Secondary data also reveals the importance recruitment process.
As it is said if the right person is hired for the position it will be
easy for their retention. So the organization should have strong
and apt recruitment process and at the same time it should be
well executed.
CONCLUSION
62

From the study done we can say that, the best way to improve employee
retention is to understand what the employees want and need from the
work place and provide it. Companies must meet employees demand
within limits of course. Management cannot approve all the demand is a
fact, but at the same time they can take efforts to convince the
employees.
Organization should also take efforts to bring most of the retention
policies into practice which will give a positive effect on the issue. Even
the employees should understand the limits of the organization and act
accordingly. If there is a better understanding between the two parties the
problem of employee retention is solved to a great extent. Both the
parties should be aware of the surroundings and current matters. Every
company should understand that people are their best commodity.
Without qualified people who are good at what they do, any company
would be in serious trouble. In the long run, the retention of existing
employees saves companies money. One way for a company to prevent
employees from giving valuable information to competitors is to make it a
policy to enforce strict noncompete and confidentiality agreements
amongst its employees. The existence of such agreements could in
fact deter a competitor from hiring a valuable employ because they might
not want to risk possible legal entanglements with the other company. Of
course, all this could possibly lead to animosity with the employee who
could feel that his or her options are being limited. Many employees don't
always remember signing such a document, so a copy of it should always
be kept on file for the employee to refer to. This area could prove to be a
highly sensitive one between employer and employee, so extreme caution
is suggested in all instances.
This work enables me to gain a practical explore along with my theoretical
knowledge. I am sure that it will help me to pursuer my future studies. As
further scope of study we can conduct similar study from the organization
point of view, so it will be able to give clearer picture on the issue of
employee retention.
63

BIBLIOGRAPHY
64

Books Referred:
• K. Aswathappa, Human Resource and Personnel Management,
Tata McGraw – Hill Publisher, Fourth Edition.
• C.R.Kothari, Research Methodology, Wishwa Prakasan Publishers,
2nd Edition
• Decento.D.David and Robins.P.Stephen, Personnel and Human
Resource Management, Fourth Edition.
Journals Referred:
• Chakraborty. S (2008) HRD News letter, Vol 24, issue 6, Sep 2008,
page no 34.
• Employee Voice and Employee Retention, Daniel G. Spencer Source:
The Academy of Management Journal, Vol. 29, No. 3 (Sep., 1986),
pp. 488-502 Published by: Academy of Management,
http://www.jstor.org/stable/256220
• Robert P. Steel, Rodger W. Griffeth, Peter W. Hom, Daniel M. Lyons
Practical Retention Policy for the Practical Manager, Source: The
Academy of Management Executive (1993), Vol. 16, No. 2, Theme:
Achieving Competitive Advantage (May, 2002), pp. 149-164
65

Published by: Academy of Management Stable ,
http://www.jstor.org/stable/4165849
• John E. Sheridan Organizational Culture and Employee Retention
Source: The Academy of Management Journal, Vol. 35, No. 5 (Dec.,
1992), pp. 1036-1056 Published by: Academy of Management ,
http://www.jstor.org/stable/256539
• Terence R. Mitchell, Brooks C. Holtom, Thomas W. Lee, Ted Graske
How to Keep Your Best Employees: Developing an Effective
Retention Policy Source: The Academy of Management Executive
(1993), Vol. 15, No. 4, Themes: Business Strategies and Employee
Development (Nov., 2001), pp. 96-109 Published by: Academy of
Management, http://www.jstor.org/stable/4165789
Websites Referred:
• http://www.advertisingglossary.net/definition/1121-
Employee_Retention
• http://definitions.uslegal.com/e/employee-retention/
• http://www.mnp.ca/04library/EmployeeRetention.php
• http://www.accel-team.com/human_resources/hrm_03.html
• http://www.managementhelp.org/hr_mgmnt/hr_mgmnt.htm
• http://www.iloveindia.com/economy-of-india/it-industry.html
• http://www.pacificbridge.com/publication.asp?id=111
• http://www.researchandmarkets.com/research/5ff034/recruiting
_
• http://retention.naukrihub.com/retention-myths.html
• http://retention.naukrihub.com/attrition-rates-in-different-
sectors.html
66

• http://humanresources.about.com/od/retention/Retention_of_Em
ployees_Tips_and_Tools_for_Employee_Retention.htm
• http://www.articlesbase.com/human-resources-
articles/employee-retention-995426.html
• http://www.citehr.com/115162-top-10-companies-india.html
67

ANNEXURE
Christ University Institute of ManagementBangalore – 560029
Dear Sir/Madam,
68

I Neenu Antony, pursuing M.Phil (Management) at Christ University is conducting a research on the topic “A study on employee retention practices and its effectiveness in IT sector”
I kindly request you to fill this questionnaire and help me to complete my study. All the information collected will be used only for the study.
Thank you for your cooperation.
Regards,Neenu AntonyResearch ScholarChrist University
Gender: Male Female Age: Below 30 years 31-40 years 41-50 years Above 51 years
Marital Status: Married Single Others
Qualification: Graduate Post Graduate Professional
Qualification
Others specify
Designation: …………………………………..
Years of experience with current organization: …………………
How many organizations you have worked for in the last 5 years: ………………………..
69

SECTION – A
STRATEGIES
Read the following listed strategies and tick if it is available or not. If it is available rate it on the scale 1 – 5. If it is not available also please rate it on the scale 1 – 5. Please do not omit any item.
Not at all important
Not very important
Neutral
Somewhat important
Very important
Sl.No
Available
1 2 3 4 5
Yes
No
1 Mentoring / Coaching
2 Help with career plan
3 Assistance in higher education
4 Financial support for education
5 Job rotation / Relocation
6 Flexible work time
7 Work from home
8 Rewards & recognition
9 Training & development opportunities
10
Stock investment opportunities
11
Annual performance appraisal /
70

Benchmarking
12
Onsite opportunities based on agreements
13
Anti poaching agreements
14
Contract agreement
15
Day care facility
16
Assistance / low budget / nominal rent accommodation facility
17
360 degree appraisal system
SECTION – B
BENEFITS
Read the following listed benefits and tick if it is available or not. If it is available rate it on the scale 1 – 5. If it is not available also please rate it on the scale 1 – 5. Please do not omit any item.
Not at all important
Not very important
Neutral
Somewhat important
Very important
Sl.No
Available
1 2 3 4 5
Yes
No
71
1 Salary / compensation
2 Leave benefits
3 Health / Insurance benefits
4 Retirement plan / PF
5 Seasonal / Festival benefits
6 Non monetary benefits such as team tours
7 Recreational benefits (gym / health club)
SECTION – C
PERSONAL SATISFACTION
Please rank on scale of 1-5. Please do not omit any item
Strongly disagree
Disagree
Neither agree nor disagree
Agree
Strongly agree
Sl.no
1 2 3 4 5
1 I have lot of freedom on the job to decide how to pursue my goal
2 I believe the prospects for continuing this employment with this company is excellent
3 I have high level of job security
4 I receive respect & fair treatment from my boss
72

Strongly disagree
Disagree
Neither agree nor disagree
Agree
Strongly agree
Sl.no
1 2 3 4 5
5 The amount of support, guidance & overall quality of supervisor relationship is sound
6 I get opportunity to learn new things from my organization
7 My promotion prospects are excellent
SECTION - D
ORGANIZATIONAL CULTURERank on scale 1-5. Please do not omit any item
Strongly disagree
Disagree
Neither agree nor disagree
Agree
Strongly agree
Sl 1 2 3 4 5
73

.no
1 Organization recognize talent & promote it
2 Organization follow social culture & values
3 Employee opinions are valued
4 Employees have great trust in the organization
5 There is delegation of work & authority
6 There is a good communication channel (formal / informal)
7 Regular performance appraisal takes place
8 Good work is always appreciated & rewarded
9 Employees are free to come up with new ideas & projects are encouraged
10
All employees are given equal growth opportunities
11
Would recommend the organization for anyone to work for
12
I believe in the vision & mission of the organization
13
I believe in the value base system of the organization
Thank You
POILT STUDY RESULTS
Section A
****** Method 2 (covariance matrix) will be used for this analysis ******
R E L I A B I L I T Y A N A L Y S I S - S C A L E (A L P H A)
1. V1 2. V2 3. V3 4. V4
74

5. V5 6. V6 7. V7 8. V8 9. V9 10. V10 11. V11 12. V12 13. V13 14. V14 15. V15 16. V16 17. V17 18. V18 19. V19 20. V20 21. V21 22. V22 23. V23 24. V24 25. V25 26. V26 27. V27 28. V28 29. V29 30. V30 31. V31 32. V32 33. V33 34. V34
75

R E L I A B I L I T Y A N A L Y S I S - S C A L E (A L P H A)
N of Cases = 49.0
Item Means Mean Minimum Maximum Range Max/Min Variance 2.6020 1.1429 4.5918 3.4490 4.0179 1.5742
Item Variances Mean Minimum Maximum Range Max/Min Variance .5843 .1250 1.4787 1.3537 11.8299 .1730
Inter-itemCovariances Mean Minimum Maximum Range Max/Min Variance .0633 -.2628 .5723 .8350 -2.1780 .0134
Inter-itemCorrelations Mean Minimum Maximum Range Max/Min Variance .1234 -.4953 .8062 1.3015 -1.6279 .0352
Reliability Coefficients 34 items
Alpha = .8051 Standardized item alpha = .8272
76

Section: B
****** Method 2 (covariance matrix) will be used for this analysis ******
R E L I A B I L I T Y A N A L Y S I S - S C A L E (A L P H A)
1. V2 2. V3 3. V4 4. V5 5. V6 6. V7 7. V8 8. V9 9. V10 10. V11 11. V12 12. V13 13. V14 14. V1
* * * V1 has zero variance
N of Cases = 49.0
Item Means Mean Minimum Maximum Range Max/Min Variance 2.8917 1.1020 4.6735 3.5714 4.2407 2.2278
Item Variances Mean Minimum Maximum Range Max/Min Variance .5313 .0935 1.0638 .9702 11.3727 .1337
Inter-itemCovariances Mean Minimum Maximum Range Max/Min Variance .0759 -.2164 .7241 .9405 -3.3458 .0377
Inter-itemCorrelations Mean Minimum Maximum Range Max/Min Variance .0996 -.4175 .7359 1.1534 -1.7626 .0876
77

Reliability Coefficients 13 items
Alpha = .7842 Standardized item alpha = .8198
78
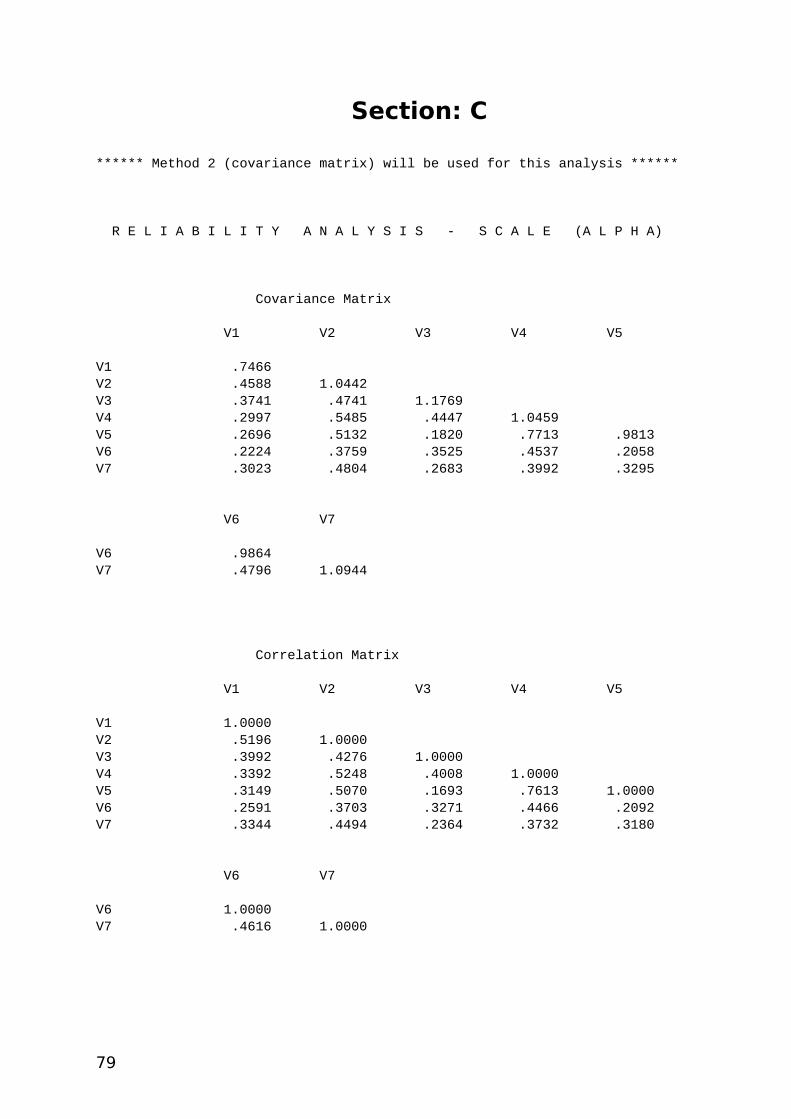
Section: C
****** Method 2 (covariance matrix) will be used for this analysis ******
R E L I A B I L I T Y A N A L Y S I S - S C A L E (A L P H A)
Covariance Matrix
V1 V2 V3 V4 V5
V1 .7466V2 .4588 1.0442V3 .3741 .4741 1.1769V4 .2997 .5485 .4447 1.0459V5 .2696 .5132 .1820 .7713 .9813V6 .2224 .3759 .3525 .4537 .2058V7 .3023 .4804 .2683 .3992 .3295
V6 V7
V6 .9864V7 .4796 1.0944
Correlation Matrix
V1 V2 V3 V4 V5
V1 1.0000V2 .5196 1.0000V3 .3992 .4276 1.0000V4 .3392 .5248 .4008 1.0000V5 .3149 .5070 .1693 .7613 1.0000V6 .2591 .3703 .3271 .4466 .2092V7 .3344 .4494 .2364 .3732 .3180
V6 V7
V6 1.0000V7 .4616 1.0000
79

80

R E L I A B I L I T Y A N A L Y S I S - S C A L E (A L P H A)
N of Cases = 49.0
Item Means Mean Minimum Maximum Range Max/Min Variance 3.4548 3.1020 3.8163 .7143 1.2303 .0592
Item Variances Mean Minimum Maximum Range Max/Min Variance 1.0108 .7466 1.1769 .4303 1.5763 .0180
Inter-itemCovariances Mean Minimum Maximum Range Max/Min Variance .3907 .1820 .7713 .5893 4.2383 .0184
Inter-itemCorrelations Mean Minimum Maximum Range Max/Min Variance .3881 .1693 .7613 .5920 4.4958 .0167
Reliability Coefficients 7 items
Alpha = .8152 Standardized item alpha = .8161
81

82

Section: D
****** Method 2 (covariance matrix) will be used for this analysis ******
R E L I A B I L I T Y A N A L Y S I S - S C A L E (A L P H A)
N of Cases = 49.0
Item Means Mean Minimum Maximum Range Max/Min Variance 3.5055 3.0204 3.9184 .8980 1.2973 .0585
Item Variances Mean Minimum Maximum Range Max/Min Variance .7353 .3682 1.1412 .7730 3.0993 .0428
Inter-itemCovariances Mean Minimum Maximum Range Max/Min Variance .2622 -.0893 .6918 .7810 -7.7476 .0254
Inter-itemCorrelations Mean Minimum Maximum Range Max/Min Variance .3553 -.1161 .9174 1.0336 -7.9006 .0341
Reliability Coefficients 13 items
Alpha = .8781 Standardized item alpha = .8775
83

WORKING NOTES ON STATISTICAL TOOLS USED
q1.Gender
Frequency Percent PercentCumulative
Percent
Male 94 47.0 47.0 47.0
Female 106 53.0 53.0 100.0
Total 200 100.0 100.0
q2.Age
Frequency Percent PercentCumulative
Percent
< 30 years 148 74.0 74.0 74.0
31-40 years 42 21.0 21.0 95.0
41-50 years 10 5.0 5.0 100.0
Total 200 100.0 100.0
q3.MaritalStatus
Frequency Percent PercentCumulative
Percent
Married 83 41.5 41.5 41.5
Unmarried 117 58.5 58.5 100.0
Total 200 100.0 100.0
q4.Qualification
Frequency Percent PercentCumulative
Percent
Graduate 63 31.5 31.5 31.5
Post Graduate 95 47.5 47.5 79.0
Professional 42 21.0 21.0 100.0
Total 200 100.0 100.0
q5.Designation
Frequency Percent PercentCumulative
Percent
Associate/Executives 49 24.5 24.5 24.5
84

Hr Executive 57 28.5 28.5 53.0
Asst. Mgr / TL 29 14.5 14.5 67.5
Sr. Exe/Assoc 41 20.5 20.5 88.0
Others 24 12.0 12.0 100.0
Total 200 100.0 100.0
q6.Experience in Current Position
Frequency Percent PercentCumulative
Percent
Less than 1 year 81 40.5 40.5 40.5
1 to 3 years 72 36.0 36.0 76.5
More than 3 years 47 23.5 23.5 100.0
Total 200 100.0 100.0
q7.Howmanyorganizationsyouhaveworkedforinthelast5years
Frequency Percent PercentCumulative
Percent
0 14 7.0 7.0 7.0
1 71 35.5 35.5 42.5
2 86 43.0 43.0 85.5
3 23 11.5 11.5 97.0
4 6 3.0 3.0 100.0
Total 200 100.0 100.0
85

Count Column N %
A1.MentoringampCoaching Available 163 81.5%
Not Available 37 18.5%
Total 200 100.0%
A2.Helpwitcareerplan Available 132 66.0%
Not Available 68 34.0%
Total 200 100.0%
A3.Assistanceinhighereducation
Available 95 47.5%
Not Available 105 52.5%
Total 200 100.0%
A4.Financialsupportforeducation
Available 69 34.5%
Not Available 131 65.5%
Total 200 100.0%
A5.JobrotationRelocation Available 166 83.0%
Not Available 34 17.0%
Total 200 100.0%
A6.Flexibleworktime Available 125 62.5%
Not Available 75 37.5%
Total 200 100.0%
A7.Workfromhome Available 78 39.0%
Not Available 122 61.0%
Total 200 100.0%
A8.RewardsampRecognition
Available 167 83.5%
Not Available 33 16.5%
Total 200 100.0%
A9.Trainingampdevelopmentopportunities
Available 173 86.5%
Not Available 27 13.5%
Total 200 100.0%
A10.Stockinvestmentopportunities
Available 70 35.0%
Not Available 130 65.0%
Total 200 100.0%
A11.AnnualperformanceappraisalBenchmarking
Available 164 82.0%
Not Available 36 18.0%
Total 200 100.0%
A12.Onsiteopportunitiesbasedonagreements
Available 105 52.5%
Not Available 95 47.5%
Total 200 100.0%
86

A13.Antipoachingagreements
Available 70 35.0%
Not Available 130 65.0%
Total 200 100.0%
A14.Contractagreements Available 139 69.5%
Not Available 61 30.5%
Total 200 100.0%
A15.Daycarefacility Available 64 32.0%
Not Available 136 68.0%
Total 200 100.0%
A16.AssistanceLowbudgetNomonalrentaccommodationfacility
Available 69 34.5%
Not Available 131 65.5%
Total 200 100.0%
A17.360degreeappraisalsystem
Available 94 47.0%
Not Available 106 53.0%
Total 200 100.0%
B1.SalaryCompensation Available 200 100.0%
Not Available 0 .0%
Total 200 100.0%
B2.Leavebenefits Available 153 76.5%
Not Available 47 23.5%
Total 200 100.0%
B3.HealthInsurancebenefits Available 160 80.0%
Not Available 40 20.0%
Total 200 100.0%
B4.RetirementplanPF Available 169 84.5%
Not Available 31 15.5%
Total 200 100.0%
B5.SeasonalFestivalbenefits
Available 53 26.5%
Not Available 147 73.5%
Total 200 100.0%
B6.Nonmonetarybenefitssuchasteamtours
Available 122 61.0%
Not Available 78 39.0%
Total 200 100.0%
B7.Recreationalbenefitsgymhealthclub
Available 146 73.0%
Not Available 54 27.0%
Total 200 100.0%
87

Correlations
q73.Wouldrecommendtheorganizationforanyonetoworkfor
Pearson Correlation Sig. (1-tailed) N
fac1Avg .167(**) .009 200
fac2Avg .132(*) .031 200
fac3Avg .038 .298 200
fac4Avg .064 .183 200
fac5Avg .038 .297 200
fac6Avg .141(*) .023 200
Benefits .126(*) .038 200
Personal Satisfaction .427(**) .000 200
Retention Strategy .146(*) .019 200
Org. Culture .670(**) .000 200
** Correlation is significant at the 0.01 level (1-tailed).* Correlation is significant at the 0.05 level (1-tailed).
Variables Entered/Removed(b)
ModelVariables Entered
Variables Removed Method
1 Personal Satisfaction(a)
. Enter
a All requested variables entered.b Dependent Variable: q73.Wouldrecommendtheorganizationforanyonetoworkfor
Model Summary
Model R R SquareAdjusted R
SquareStd. Error of the Estimate
1 .427(a) .182 .178 .908
88

a Predictors: (Constant), Personal Satisfaction
ANOVA(b)
Model Sum of
Squares df Mean Square F Sig.
1 Regression 36.290 1 36.290 44.064 .000(a)
Residual 163.065 198 .824
Total 199.355 199
a Predictors: (Constant), Personal Satisfactionb Dependent Variable: q73.Wouldrecommendtheorganizationforanyonetoworkfor
Coefficients(a)
Model
Unstandardized Coefficients
Standardized Coefficients t Sig.
B Std. Error Beta B Std. Error
1 (Constant) 1.199 .336 3.574 .000
Personal Satisfaction .614 .092 .427 6.638 .000
a Dependent Variable: q73.Wouldrecommendtheorganizationforanyonetoworkfor
Variables Entered/Removed(b)
ModelVariables Entered
Variables Removed Method
1 Org. Culture(a)
. Enter
a All requested variables entered.b Dependent Variable: Personal Satisfaction
Model Summary
Model R R SquareAdjusted R
SquareStd. Error of the Estimate
1 .601(a) .362 .358 .55716
a Predictors: (Constant), Org. Culture
ANOVA(b)
Model Sum of
Squares df Mean Square F Sig.
1 Regression 34.819 1 34.819 112.167 .000(a)
Residual 61.464 198 .310
89

Total 96.283 199
a Predictors: (Constant), Org. Cultureb Dependent Variable: Personal Satisfaction
Coefficients(a)
Model
Unstandardized Coefficients
Standardized Coefficients t Sig.
B Std. Error Beta B Std. Error
1 (Constant) .839 .260 3.229 .001
Org. Culture .768 .073 .601 10.591 .000
a Dependent Variable: Personal Satisfaction
Variables Entered/Removed(b)
ModelVariables Entered
Variables Removed Method
1 Org. Culture(a)
. Enter
a All requested variables entered.b Dependent Variable: q73.Wouldrecommendtheorganizationforanyonetoworkfor
Model Summary
Model R R SquareAdjusted R
SquareStd. Error of the Estimate
1 .670(a) .449 .446 .745
a Predictors: (Constant), Org. Culture
ANOVA(b)
Model Sum of
Squares df Mean Square F Sig.
1 Regression 89.549 1 89.549 161.474 .000(a)
Residual 109.806 198 .555
Total 199.355 199
a Predictors: (Constant), Org. Cultureb Dependent Variable: q73.Wouldrecommendtheorganizationforanyonetoworkfor
Coefficients(a)
90
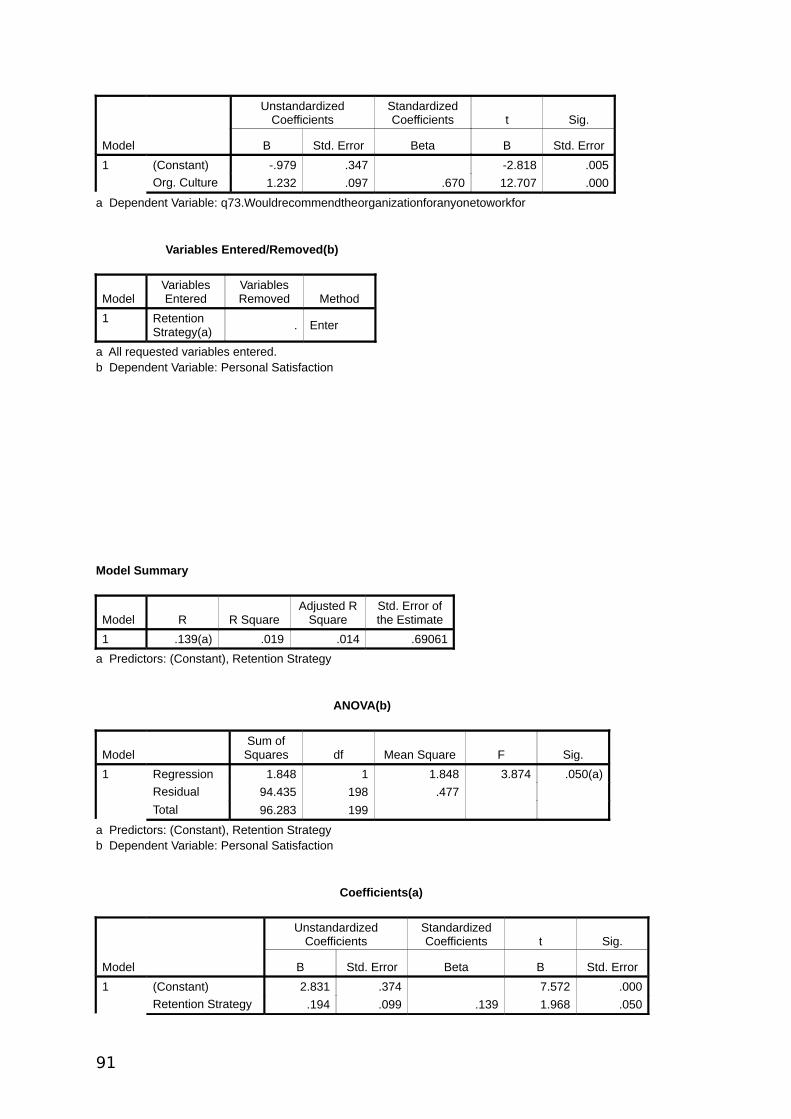
Model
Unstandardized Coefficients
Standardized Coefficients t Sig.
B Std. Error Beta B Std. Error
1 (Constant) -.979 .347 -2.818 .005
Org. Culture 1.232 .097 .670 12.707 .000
a Dependent Variable: q73.Wouldrecommendtheorganizationforanyonetoworkfor
Variables Entered/Removed(b)
ModelVariables Entered
Variables Removed Method
1 Retention Strategy(a)
. Enter
a All requested variables entered.b Dependent Variable: Personal Satisfaction
Model Summary
Model R R SquareAdjusted R
SquareStd. Error of the Estimate
1 .139(a) .019 .014 .69061
a Predictors: (Constant), Retention Strategy
ANOVA(b)
Model Sum of
Squares df Mean Square F Sig.
1 Regression 1.848 1 1.848 3.874 .050(a)
Residual 94.435 198 .477
Total 96.283 199
a Predictors: (Constant), Retention Strategyb Dependent Variable: Personal Satisfaction
Coefficients(a)
Model
Unstandardized Coefficients
Standardized Coefficients t Sig.
B Std. Error Beta B Std. Error
1 (Constant) 2.831 .374 7.572 .000
Retention Strategy .194 .099 .139 1.968 .050
91
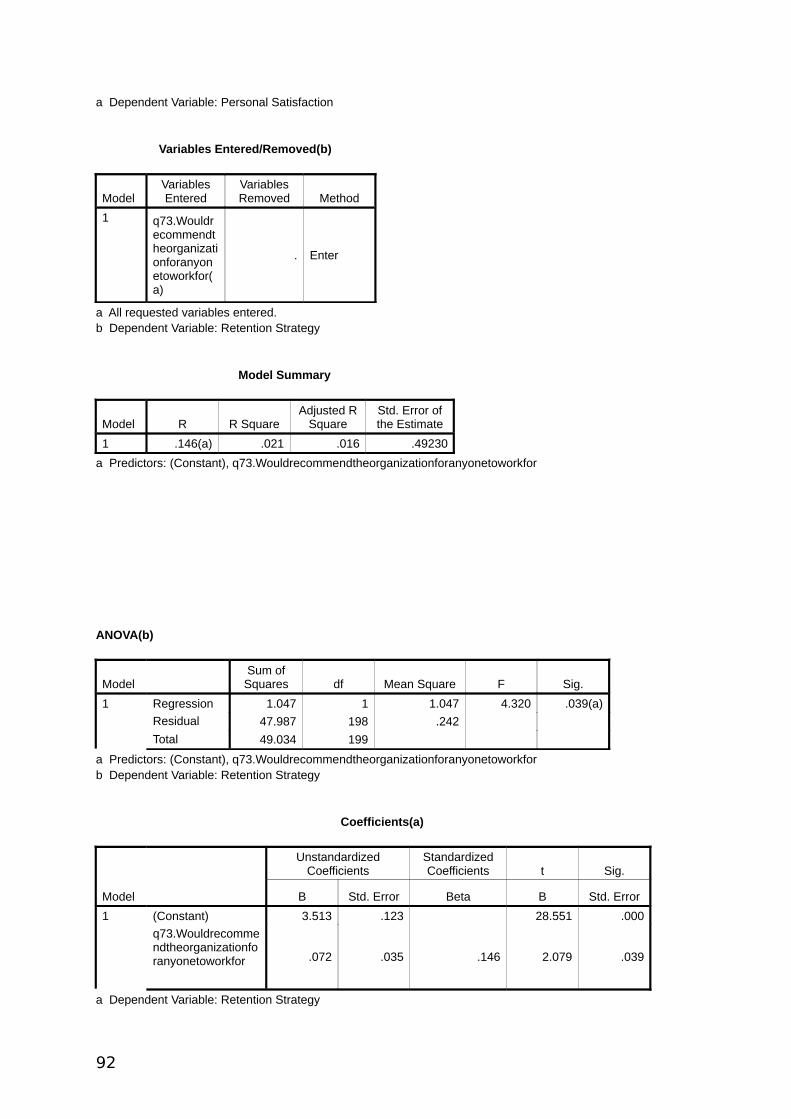
a Dependent Variable: Personal Satisfaction
Variables Entered/Removed(b)
ModelVariables Entered
Variables Removed Method
1 q73.Wouldrecommendtheorganizationforanyonetoworkfor(a)
. Enter
a All requested variables entered.b Dependent Variable: Retention Strategy
Model Summary
Model R R SquareAdjusted R
SquareStd. Error of the Estimate
1 .146(a) .021 .016 .49230
a Predictors: (Constant), q73.Wouldrecommendtheorganizationforanyonetoworkfor
ANOVA(b)
Model Sum of
Squares df Mean Square F Sig.
1 Regression 1.047 1 1.047 4.320 .039(a)
Residual 47.987 198 .242
Total 49.034 199
a Predictors: (Constant), q73.Wouldrecommendtheorganizationforanyonetoworkforb Dependent Variable: Retention Strategy
Coefficients(a)
Model
Unstandardized Coefficients
Standardized Coefficients t Sig.
B Std. Error Beta B Std. Error
1 (Constant) 3.513 .123 28.551 .000
q73.Wouldrecommendtheorganizationforanyonetoworkfor .072 .035 .146 2.079 .039
a Dependent Variable: Retention Strategy
92

Variables Entered/Removed(b)
ModelVariables Entered
Variables Removed Method
1 q73.Wouldrecommendtheorganizationforanyonetoworkfor(a)
. Enter
a All requested variables entered.b Dependent Variable: Personal Satisfaction
Model Summary
Model R R SquareAdjusted R
SquareStd. Error of the Estimate
1 .427(a) .182 .178 .63068
a Predictors: (Constant), q73.Wouldrecommendtheorganizationforanyonetoworkfor
ANOVA(b)
Model Sum of
Squares df Mean Square F Sig.
1 Regression 17.527 1 17.527 44.064 .000(a)
Residual 78.756 198 .398
Total 96.283 199
a Predictors: (Constant), q73.Wouldrecommendtheorganizationforanyonetoworkforb Dependent Variable: Personal Satisfaction
Coefficients(a)
Model
Unstandardized Coefficients
Standardized Coefficients T Sig.
B Std. Error Beta B Std. Error
1 (Constant) 2.557 .158 16.221 .000
93
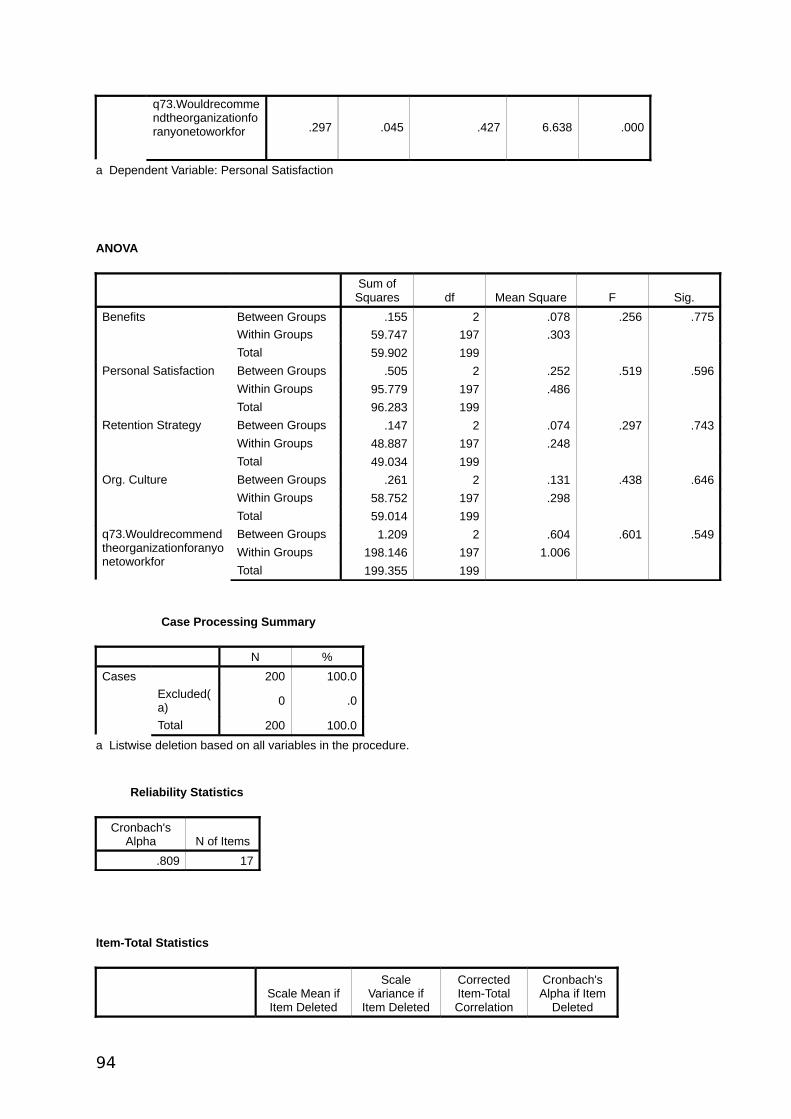
q73.Wouldrecommendtheorganizationforanyonetoworkfor .297 .045 .427 6.638 .000
a Dependent Variable: Personal Satisfaction
ANOVA
Sum of
Squares df Mean Square F Sig.
Benefits Between Groups .155 2 .078 .256 .775
Within Groups 59.747 197 .303
Total 59.902 199
Personal Satisfaction Between Groups .505 2 .252 .519 .596
Within Groups 95.779 197 .486
Total 96.283 199
Retention Strategy Between Groups .147 2 .074 .297 .743
Within Groups 48.887 197 .248
Total 49.034 199
Org. Culture Between Groups .261 2 .131 .438 .646
Within Groups 58.752 197 .298
Total 59.014 199
q73.Wouldrecommendtheorganizationforanyonetoworkfor
Between Groups 1.209 2 .604 .601 .549
Within Groups 198.146 197 1.006
Total 199.355 199
Case Processing Summary
N %
Cases 200 100.0
Excluded(a)
0 .0
Total 200 100.0
a Listwise deletion based on all variables in the procedure.
Reliability Statistics
Cronbach's Alpha N of Items
.809 17
Item-Total Statistics
Scale Mean if Item Deleted
Scale Variance if
Item Deleted
Corrected Item-Total Correlation
Cronbach's Alpha if Item
Deleted
94

A1.1_MentoringampCoaching
60.02 64.788 .261 .808
A2.1_Helpwitcareerplan 60.15 64.239 .347 .803
A3.1_Assistanceinhighereducation 60.59 60.343 .536 .791
A4.1_Financialsupportforeducation 60.45 61.405 .440 .797
A5.1_JobrotationRelocation60.20 63.963 .338 .803
A6.1_Flexibleworktime 60.15 62.282 .401 .799
A7.1_Workfromhome 60.43 60.408 .449 .796
A8.1_RewardsampRecognition 59.65 63.455 .499 .796
A9.1_Trainingampdevelopmentopportunities 59.79 64.646 .311 .805
A10.1_Stockinvestmentopportunities 61.09 61.530 .406 .799
A11.1_AnnualperformanceappraisalBenchmarking 59.79 62.676 .443 .797
A12.1_Onsiteopportunitiesbasedonagreements 60.47 61.597 .441 .797
A13.1_Antipoachingagreements 61.35 62.522 .332 .805
A14.1_Contractagreements61.24 62.980 .298 .807
A15.1_Daycarefacility 60.96 61.471 .403 .799
A16.1_AssistanceLowbudgetNomonalrentaccommodationfacility 60.82 62.376 .398 .800
A17.1_360degreeappraisalsystem 60.15 60.443 .571 .789
Scale Statistics
Mean Variance Std. Deviation N of Items
64.21 69.634 8.345 17
Communalities
Initial Extraction
A1.1_MentoringampCoaching
1.000 .555
A2.1_Helpwitcareerplan 1.000 .794
95

A3.1_Assistanceinhighereducation 1.000 .713
A4.1_Financialsupportforeducation 1.000 .797
A5.1_JobrotationRelocation1.000 .645
A6.1_Flexibleworktime 1.000 .756
A7.1_Workfromhome 1.000 .580
A8.1_RewardsampRecognition 1.000 .749
A9.1_Trainingampdevelopmentopportunities 1.000 .719
A10.1_Stockinvestmentopportunities 1.000 .556
A11.1_AnnualperformanceappraisalBenchmarking 1.000 .671
A12.1_Onsiteopportunitiesbasedonagreements 1.000 .680
A13.1_Antipoachingagreements 1.000 .803
A14.1_Contractagreements1.000 .678
A15.1_Daycarefacility 1.000 .727
A16.1_AssistanceLowbudgetNomonalrentaccommodationfacility 1.000 .768
A17.1_360degreeappraisalsystem 1.000 .655
Extraction Method: Principal Component Analysis.
Rotated Component Matrix(a)
Component
1 2 3 4 5 6
A9.1_Trainingampdevelopmentopportunities .810
A8.1_RewardsampRecognition .794
96

A11.1_AnnualperformanceappraisalBenchmarking .689
A12.1_Onsiteopportunitiesbasedonagreements .637
A4.1_Financialsupportforeducation .871
A3.1_Assistanceinhighereducation .751
A10.1_Stockinvestmentopportunities .526
A5.1_JobrotationRelocation .462
A15.1_Daycarefacility .779
A16.1_AssistanceLowbudgetNomonalrentaccommodationfacility .679
A6.1_Flexibleworktime .843
A7.1_Workfromhome .685
A13.1_Antipoachingagreements .886
A14.1_Contractagreements .657
A17.1_360degreeappraisalsystem .458 .463
A1.1_MentoringampCoaching .682
A2.1_Helpwitcareerplan .604 .640
Extraction Method: Principal Component Analysis. Rotation Method: Varimax with Kaiser Normalization.a Rotation converged in 7 iterations.
97


![Food security and nutrition: building a global narrative ... · EXECUTIVE SUMMARY EXECUTIVE SUMMARY EXECUTIVE SUMMARY EXECUTIVE SUMMAR Y [ 2 ] This document contains the Summary and](https://static.fdocuments.us/doc/165x107/5ff5433612d22125fb06e6b5/food-security-and-nutrition-building-a-global-narrative-executive-summary-executive.jpg)