
Executive Summary Bioboost Draft v17 final-ND-LE
38
Executive Summary
Transcript of Executive Summary Bioboost Draft v17 final-ND-LE

Executive Summary

Supported under the 7th Framework Programme of the European Commission under Contract 2882873
© 2015 SYNCOM Forschungs- und Entwicklungsberatung GmbH, Mühlenstraße 9, 27777 Ganderkesee
No responsibility is assumed by publisher for any injury and/ or damage to persons and property as a matter of product liability, negligence or otherwise, or from any use or operation of methods, products, instructions or ideas contained in the material herein.
All rights reserved by the consortium of the BioBoost project. Parts of this publication may be reproduced, stored in a retrieval system, or transmitted in any form or by any means, electronic, mechanical, photocopying, or otherwise with the prior permission of the publisher.


Table of Contents
1. Motivation and Approach .................................................................. 2
2. Feedstock Potential and Supply Costs .............................................. 4
3. Thermo-Chemical Biomass Conversion ........................................... 6
4. Extraction of Valuable By-Productcs ............................................. 14
5. Logistics .............................................................................................. 16
6. Sustainability Assessment ................................................................ 18
7. Achievements ..................................................................................... 27
8. Conclusions ........................................................................................ 30

2 Executive Summary - Motivation and Approach
1. Motivation and Approach
To increase the share of biomass for renewable energy supply in Europe conversion pathways which are low cost and energy efficient, as well as flexible in feedstock are demanded. But under which conditions does it make sense to produce biofuels? How is the feedstock potential spread over Europe? Which are technically feasible process chains? What would be an ideal location to start up a new production facility? What is the preferred capacity? What are the consequences for social and environmental aspects? And how do they differ from region to region? Many questions, in addition to the technical feasibility of biofuel production, can be asked.
The BioBoost project aims to make a substantial improvement towards answering the questions addressed above. The project focuses on de-centralized conversion of residual biomass and organic wastes to optimised, high energy density carriers, which can be utilised either directly in small scale combined heat and power (CHP) plants or in large scale applications for the synthesis of transportation fuels and chemicals. Dry as well as wet residual biomass and organic waste are used as feedstock for conversion. Due to their secondary nature, these feedstocks have the potential for high environmental sustainability, and in the case of straw, it may even strengthen food production than competing to it. However, perennial lignocellulosic energy crops and forest residues are included as a possibility to compensate the seasonal occurrence of for example straw. In the BioBoost project, these types of biomass are converted by means of fuel-flexible thermo-chemical processes such as fast pyrolysis (FP), catalytic pyrolysis (CP) and hydrothermal carbonization (HTC) to produce stable, intermediate energy carriers in the form of bio-slurries, bio-oil and bio-coal. For straw, as an example, the energy density of the carrier can be increased by a factor of 10 to 15, enabling economic long range transportation from several regionally distributed conversion plants to few central large scale gasification plants for biofuels production.
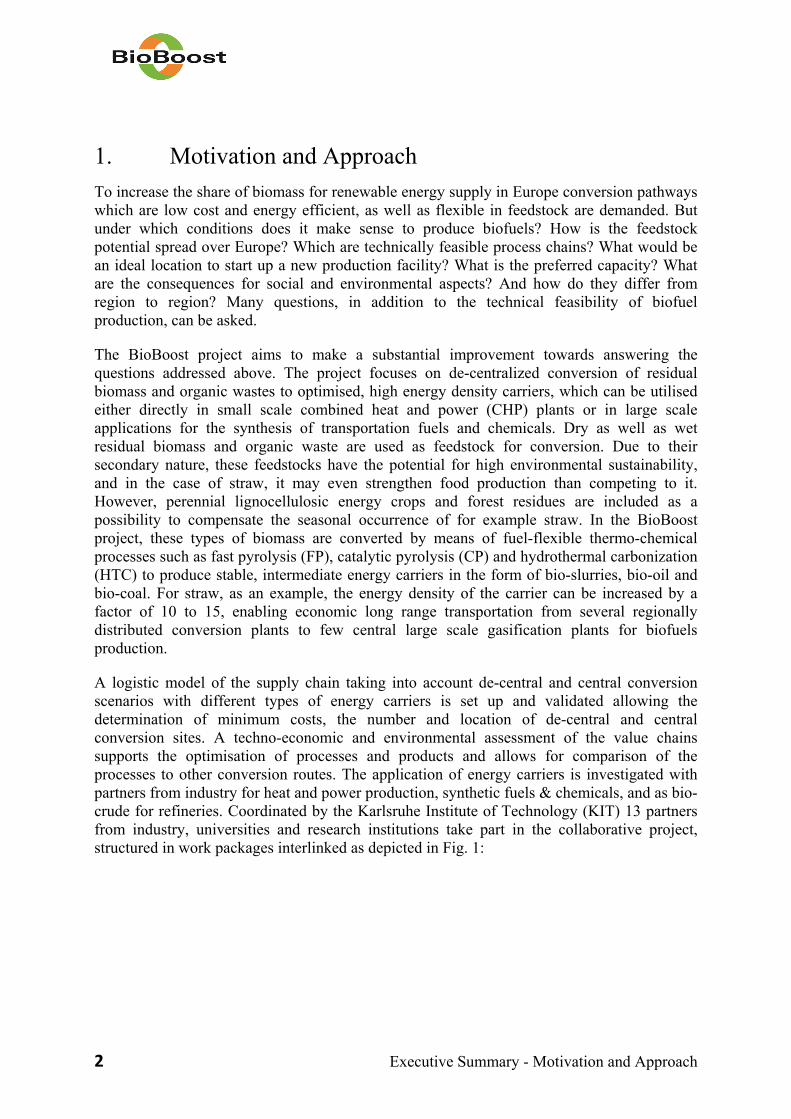
A logistic model of the supply chain taking into account de-central and central conversion scenarios with different types of energy carriers is set up and validated allowing the determination of minimum costs, the number and location of de-central and central conversion sites. A techno-economic and environmental assessment of the value chains supports the optimisation of processes and products and allows for comparison of the processes to other conversion routes. The application of energy carriers is investigated with partners from industry for heat and power production, synthetic fuels & chemicals, and as bio-crude for refineries. Coordinated by the Karlsruhe Institute of Technology (KIT) 13 partners from industry, universities and research institutions take part in the collaborative project, structured in work packages interlinked as depicted in Fig. 1:
Executive Summary - Motivation and Approach 3
Identification of residual biomass potential in EU-28 and development of supply concepts for de-central conversion plants (WP1)
Conversion of biomass to intermediate energy carriers by thermo-chemical processes (WP2)
Improvement of the economic performance of the energy carrier by investigating the recovery of high value chemicals and nutrients from conversion processes (WP3)
Development of a simulation model optimizing biomass and energy carrier logistics (WP4)
Clarification and testing the technical and economic utilisation paths of energy carrier (WP5)
Investigation of the techno-economic feasibility and environmental sustainability of the selected bioenergy carrier pathways (WP6)
Figure 1: BioBoost project structure.
Fast pyrolysis
Iden
tificationoffeed
stocks,
mass
potential, co
sts
Bio‐syncrude
Gasification, synfuels
Combustion
Catalyticpyrolysis
Catalyticbiooil
Upgrading
HTCBiochar CHP
Disposal/reuse
Chemicals
Effluent
Resins
Extraction
Overall Sustainabiliy Assessment
Logistic model for optimization of selected pathways
Transportatio
n
fuels
4 Executive Summary - Feedstock Potential and Supply Costs
2. Feedstock Potential and Supply Costs
The conversion technologies fast pyrolysis, catalytic pyrolysis and hydrothermal carbonisation studied in the BioBoost project make us of a broad feedstock spectrum of lignocellulosic materials from dry to wet. Suitable biogenic resources occur in various residue and waste streams from agriculture, forestry, land cultivation and management, food processing and settlement. Consequently, in BioBoost the feedstock potential of agricultural residues, organic wastes and forestry residues in EU-27 + Switzerland has been assessed considering the following types of biomass:
Agricultural (straw, orchard’s pruning, hay) and animal residues (manure),
Forestry residues,
Natural conservation matter (urban maintenance of green areas, hay and shrubs),
Roadside vegetation,
Urban and industrial waste (biodegradable municipal waste, selected waste from the food and wood industry).
The estimated regions were conducted at IUNG for geocode standard NUTS-3 areas, of which 1313 individual regions have been considered for assessment. Such a comprehensive, EU wide review has been carried out in this high spatial resolution for the first time in BioBoost. The regional NUTS-3 level provides the typical scale for the development of distributed energy scenarios. The main pre-condition for the potential modelling of these regions was to use only waste and residues biomass, which do not compete with food production and to respect the principles of sustainable production and environmental protection. The modelled results of the biomass potential have been illustrated by maps of technical potentials in the NUTS-3 regions (see Fig. 2). Additionally, normalised potentials were developed for visualisation of the biomass density and spatial variability in larger regions. On this basis the amount of biomass and its spatial density and energy content is raised. The largest technical potential of biomass is provided by straw with appr. 150 Mio.t resulting in a share of 37 % related to mass and of 48% regarding the energy content. The second largest potential of ca. 118 Mio.t can be generated from forestry residues (29 %, both in terms of mass share and energy content). Another promising resource is biodegradable municipal waste (17 % of the biomass and 12 % of the energy content). Other types of biomass do not have much significance in the European energy sector. In certain areas, individual types of biomass may play a regional role. All data on biomass potential have been made available (www.BioBoost.eu) via a Geographic Information System (GIS Server) developed and setup.
For the techno-economic assessment, biomass supply costs and supply demand relationships have been determined by SYNCOM based on methods developed earlier123.
1 B. Cochin, INRA Economie rurale, 1977 2 EFI-GTM, European Forest Sector Outlook Study 2 3 Options to improve the management of bio waste in the European Union’, EC DG Environment

Executive Summary - Feedstock Potential and Supply Costs 5
Figure 2: a) Summarized technical biomass potentials available in NUTS-3 regions given in kt.
b) Summarized biomass mass density per area in NUTS-3 regions given in t/km2.
Straw collection was assessed as difference to leaving it on the field in terms of fertilizer withdrawal and replacement costs, baling and bale chasing technology as well as implications of field size, straw amount and labour costs. Applying the most efficient technology for the supply of several ten- to hundred-thousand tonnes to de-centralised conversion plants would lead to straw costs free field side stack between 45 and 118 EUR/t, depending on location and level of competition. This is in the range of prices (between 20 and 180 EUR/t) recorded in 2011. The harvest of forestry residues like thinning wood, slash and stumps was oriented at the example of countries like Sweden and Finland, more advanced and experienced in that area. This information has been complemented by information on the forestry in the other European countries and actual wood chip prices free forest road. Assuming advanced forest management methods and harvesting equipment, wood chip prices were estimated to be between about 40 and 150 EUR/t depending on country and level of competition. Organic wastes from municipalities or food processing have yard gate fees between -60 and -20 EUR/t but treatment costs of the screened and conditioned material are between -41 to -11 EUR/t for in-vessel composting, depending on country and competition in use.
For matter from land management operations, a versatile system of a forestry mulcher coupled to a round baler is suggested e. g. in case of landscape maintenance, clearing of road side green or power line tracks, and pruning residues. The rough cut, round-baled biomass air-dries in road side stacks and the respective chips cost between 66 and 81 EUR/t, depending on the terrain biomass density and forwarding distance. Waste wood has gate fees typically between -60 EUR per tonne of contaminated or treated wood and up to 15 EUR per tonne of untreated wood, this is dependent on the region and the season however. Europe has regions, where the manure from livestock rearing exceeds the amounts which may be land-spread. In these surplus regions between 5 and 25 EUR/t are paid for the manure removal, either to processing plants or to areas of low cattle density.

6 Executive Summary - Thermo-Chemical Biomass Conversion
3. Thermo-Chemical Biomass Conversion
Thermochemical processes make use of temperature to decompose organic matter into gaseous, liquid or solid products. These can be utilised as intermediate energy carriers for heat, electrical power or fuels production. Thermochemical processes allow for a broad range of feedstocks, making them fuel flexible and scalable for high conversion capacities. For transportation, liquid and solid energy carriers of high energy density are favourable. Consequently, for the BioBoost value chains complementary thermochemical processes have been selected in regard to feedstock type and energy carrier application. From fast pyrolysis (FP), catalytic pyrolysis (CP) and hydrothermal carbonisation (HTC) solid and liquid fuels are obtained, which can be used in different applications. In BioBoost exemplary conversion pathways have been agreed making use of different types of feedstocks, producing diverse energy carriers suitable for different applications (Figure 1). In all processes, the feedstocks selected were converted in pilot plants of representative size under optimum conditions. For the products obtained in the conversion experiments conducted, mass yield, energy content and fuel properties have been determined along with storage and transportation properties including safety aspects and transportation risks. The energy carrier specifications relevant for combustion and gasification were identified by the industrial partners CHIMAR, DSM, ENBW and Neste.
3.1. Fast pyrolysis
The work on fast pyrolysis (FP) aimed at the optimization of the fast pyrolysis process to convert dry feedstock into energy carriers suitable for gasification and subsequently following transportation fuel production according to the bioliq concept. Beyond this reference pathway, conditioning procedures were explored allowing for flexible use pyrolysis products for alternative energetic use, generating added value and helping to facilitate technical and market implementation. For that purpose separate combustion tests for char and biooil are conducted at University Stuttgart and the German Aerospace Center (DLR) in Stuttgart, respectively.
At KIT FP devices exist on laboratory, bench, and pilot scale. Both the bench scale (10 kg h-1
biomass feed, also referred to as process development unit, PDU) and the bioliq pilot scale unit (500 kg h-1 biomass feed) make use of a twin screw mixer reactor usually run at 500 °C and equipped with a heat carrier loop operated with steel shot and sand, respectively. In the original design of the PDU, solid product was separated in a first condensation step in one turn with most of the liquid phase. In the bioliq concept, this is a reasonable procedure as solid and liquid products shall be fed together to an entrained flow gasifier. A second condensation step followed, yielding an aqueous condensate, consisting mainly of water containing dissolved organic compounds. However, for applications beyond gasification such as combustion or the extraction of valuable components, this way of product recovery is unfavorable. As a consequence, the pilot plant was equipped with a cyclone for solids recovery followed by a two-step condensation of the vapors yielding liquid organic and aqueous condensates. Within the project, the PDU was re-designed according to the pilot plant configuration now allowing for flexible recovery of separate product fractions.

Executive Summary - Thermo-Chemical Biomass Conversion 7
Figure 3: a) FP process development unit
(10 kg/h) at KIT. Top: b) FP yields of different types of biomass Bottom: c) FP reactor of 500 kg/h pilot plant.
In the optimized equipment, FP experiments have been conducted with wheat straw, miscanthus and scrap wood. The yields obtained are shown in Fig. 3. Considering solid and liquid fractions from 1 kg of biomass (water free), between 0.75 to 0.8 kg of slurry can be derived. However, properties vary relatively strong, especially in terms of solid and therewith ash content. Wheat straw, having an average ash content of ca. 10 wt.%, yields the slurry with the highest char and ash content (27 wt.% and 11 wt.%). This slurry would contain about 18 wt.% of water and has a higher heating value (HHV) of above 16 MJ/kg. Scrap wood yields slurries with the highest HHV-value (above 20 MJ/kg) due to its lower ash and water content. Depending on moisture and ash content, HHV values range between 18 and 14 MJ/kg at water contents of 25-31 wt.% and solids content 15-25 wt.%.
Further, procedures for preparation, handling, storage and transport of FP based energy carriers for gasification, so-called biosyncrude, were developed. After extensive characterization of the pyrolysis products, mixing and storage tests were accomplished. The most determining parameters of biosyncrudes, heating value and flowability, have been studied depending on numerous parameters such as particle content and viscosity of the liquid phase as well as porosity, structural shape and size of the char particles. Also chemical stability and particle sedimentation as well as energy demand for mixing, homogenization by stirring and recirculation as relevant to biosyncrude preparation storage, and transportation have been investigated. As an example, with increasing viscosity of the liquid phase and with rising solid content the sedimentation potential is decreasing. Additional, the solid concentration achievable depends on the ash content and the porosity of the char used. Optimizing these parameters leads to biosyncrudes suitable for storage, transport, and processible for high pressure entrained flow gasification. Alternatively, for energy carriers
0,0
20,0
40,0
60,0
80,0
100,0
120,0Deficit
Gas
Aqueous condensate
OC/without solids
Solids/OC
Solids

8 Executive Summary - Thermo-Chemical Biomass Conversion
with even higher solids-to-liquids ratios (> 40 wt.%) the production of pastes was tested, showing no sedimentation and being expected to be storable over longer periods of time without changing properties. Therefore, extruders have been tested, potentially also suited to feed a gasifier to the required pressure. Advantages of extruders may be the intense mixing, conveying and the possibility of building-up high pressures suitable for the injection into a gasifier. In a twin screw extruder, the screws lead to forced mixing and a highly homogeneous product quality could be achieved with solid contents of 60 wt.%. The general feasibility of extrusion processes for the production of char-condensate-pastes could be shown but requiring further research for technical development.
3.2. Biosyncrude gasification
For gasification purposes, pressurized entrained flow (PEF) gasification has emerged as the preferred technology for large-scale syngas generation. The fuels for a PEF gasifier can be prepared from a multitude of different carbon feedstocks including biomass pyrolysis products from fast pyrolysis or torrefaction. Especially biosyncrudes are a suitable form of feed with storage and transport capacities being ten times higher compared to initial biomass. With the PEF process at temperatures above 1000 °C and pressures up to 80 bar or more a tar-free, low-methane raw syngas is produced with a fuel carbon conversion normally above 99 % using pure oxygen as gasification agent. Ash is removed as molten slag, where the ash melting point determines the minimum gasification temperature and the corresponding minimum O2 consumption.
3.3. Fast pyrolysis oil combustion
In the project, pretests were performed to define the boundary conditions for fast pyrolysis oil (FPO) combustion tests and identify suitable components for a combustion test setup. Air assisted atomization or air blast atomization appeared to be favorable over pressure assisted atomization due to higher operational flexibility and lower sensitivity to erosion or blockage. Fuel preheating temperatures between 50 and 80 °C and ethanol admixture should be employed to optimize fuel atomization. Combustion tests were successfully performed in a FLOX® combustor, proving the claimed fuel flexibility of this combustion concept. The emission behavior for combustion of particle-free oil is acceptable; gaseous emissions need be studied in more detail. Despite a large recirculation zone characteristic for FLOX® combustion, the residence times are not sufficient to burnout particles already entering the combustor.
Figure 4: Flame
appearance in the FLOX burner at DLR at 23.1 kW.

Executive Summary - Thermo-Chemical Biomass Conversion 9
3.4. Catalytic pyrolysis
As the second conversion technology, the catalytic pyrolysis was optimised by CERTH towards the production of catalytic bio-oil (CPO) that has a maximum product yield related to the biomass feed capacity with minimum oxygen content. This bioenergy carrier can be used for the production of transportation fuels in an existing refinery infrastructure. The optimization work performed in this study aimed at the optimized catalytic materials, feedstock types and process operating conditions. The entire work was carried out in collaboration with the BioBoost partners CPERI/CERTH, GRACE and Neste. GRACE performed the catalyst synthesis and catalyst scale up while CPERI carried out the catalyst pre-screening and the process optimization studies on pilot scale. Neste investigated upgrading options of CP oils (CPO) delivered by CPERI.
Fifteen new catalytic materials were synthesized by GRACE and tested at CPERI on bench scale. From this pre-screening study the five best catalysts were selected and scaled up at GRACE in sufficient amounts for pilot scale testing. The new catalysts and five commercially available catalysts were tested in the pilot plant after a steam deactivation procedure. It was concluded that the best BioBoost catalyst performs better than the state of the art commercial catalyst producing about 1-2%wt more oil at the same oxygen yield. This result was fully validated using the other biomass feedstocks tested in the project. It was concluded that this catalyst is an optimum catalyst for this process. Regarding feedstock optimization the woody biomass is the best followed by the energy crop (miscanthus) and the agricultural residue (wheat straw). As best feedstock and catalyst we are considering those that produce a higher yield of the bioenergy carrier at the same oxygen content. Regarding process optimization studies the catalyst to biomass ratio (C/B) plays a significant role since with excess catalyst the energy carrier is decomposed and the yield is decreasing. The pilot plant runs satisfactorily with C/B ratios at the range of 12-20 at the 500 °C pyrolysis temperature. It was also proved in this study that the catalyst deactivation plays an important role on the catalyst performance. Both hydrothermal deactivation and ash metal poisoning have a strong detrimental effect on catalyst stability and performance. This is of major importance for follow up studies.
Figure 5: Catalytic pyrolysis pilot plant at CERTH,
right sample of CPO.

10 Executive Summary - Thermo-Chemical Biomass Conversion
b) CPO yield vs. oxygen content from pilot scale catalysts evaluation studies;
From the entire work performed in this deliverable sufficient amounts of CPO were produced from the various catalysts and feedstocks and were fully characterized using routine and advanced characterization methods like e. g. 2D GC-TOF-MS. Large amounts of this carrier were given to NESTE for refinery application and to other BioBoost partners for further downstream upgrading processes. The characterization studies showed that CPO produced from this pathway has significant advances regarding its much lower oxygen and less organic acid content and the higher stability while it is also a source of useful chemicals like phenols. In terms of stability, CPO shows minimum corrosiveness, according to the copper corrosion test, even after 27 months storage. The high heating value and the total acid number value were stable but the aqueous content showed little variation, due to gradual phase separation over time. The important properties for storage and transport are density and viscosity, as they determine the pumping process. It appears that density shows slight increase after 12 months of storage. However, the viscosity slightly increases within the first 18 months and afterwards shows little variation. The results of the accelerated aging tests are in good accordance with those acquired after actual long term storage. Overall, a CPO has been produced that can be used as bio-crude in a refinery for further upgrading. The storage of the CPO at low temperatures is preferable to long term exposure at higher than room temperature, in order to avoid significant phase separation and side reactions. Normal storage containers as those used for conventional fuels can be used, since the CPO is not corrosive. Therefore, handling procedures of CPO could be the same as those employed for the conventional fuels like diesel or gasoline.
3.5. CPO upgrading
In BioBoost, CPO was considered as feedstock for upgrading in an oil refinery in view to its upgrading by hydrotreating into transportations fuels in dedicated plants located on a refinery site benefitting from already existing infrastructure und access to hydrogen. For this purpose, several factors were evaluated, namely acidity, thermal stability, catalyst harming impurities, miscibility to refinery products. NESTE conducted experimental work with batch experiments where the conditions for upgrading were determined. These were followed by continuous run experiments where hydrodeoxygenation catalysts supplied by GRACE were compared. These results clearly showed that it will be much simpler to upgrade CPO than FPO due to the less oxygen content and more stable product profile. The experiments of continuous upgrading were considered to be basically successful although there was some coking but which is not unusual at non-optimized conditions.

Executive Summary - Thermo-Chemical Biomass Conversion 11
3.6. Hydrothermal Carbonization
Hydrothermal carbonization, carried out at more moderate temperatures around 200 °C and corresponding pressures around 10 bar, leads to biocoal as the main product. In the BioBoost project HTC biocoal has been considered as combustion fuel for heat and power production. First, screening experiments on hydrothermal carbonisation with batch micro-autoclaves have been performed at KIT to find optimum conversion conditions. Important findings are that the nature of the feedstock as well as pre-heating has an important impact on the reaction. This and other observations lead to the development of a kinetic model. This model is able to describe the reaction kinetics of different biomass feedstocks. The screening of biomass conversion and the kinetic model lead to optimized operation of the HTC process at AVACO2. Here, experiments with brewery spent grains (BSG) and organic municipal waste (OMW) in a bench scale and industry size (see Fig. 4) reactor were performed. Surprisingly, the biocoal heating values achieved in these experiments were higher than that in the micro-autoclaves. Therefore, a new laboratory plant was constructed at KIT; first results show good accordance with the results of AVACO2. Scale-up tests of AVACO2 basically proved the validity of KIT’s kinetic model. Regarding the whole process chain from biomass to end product, there are several parameters and factors which are to be optimised.
A huge potential for optimisation was seen on the downstream side of the HTC process, main importantly separation and drying of the biocoal and the handling and treatment of the process water. For separation of HTC coal from the wet phase nano-filtration (NF) optionally combined to a membrane bio-reactor (MBR) for biological post-processing (proving the biological decomposability of the HTC permeate and to capture eventual load peaks of the NF plant) were tested at AVACO2. For the NF tests, a modified filtration device from OSMO Membrane Systems was used. The membranes used were made out of a polyamide-composite material with a membrane filter surface of 7.5 m2. The first pilot test could prove the performance and process stability of the NF process step. The quality of the NF permeate depends on the process water load and the membrane used. Therefore the test was repeated with a different membrane. With a high level of retention for middle sized molecules, the more difficult degrading dissolved organic matter could be better retained by this membrane, which showed a tendency of enrichment before. Also the batch recipe was adjusted to reduce the loading of the process water. Finally, a combination of different types of membranes seems to be the solution of choice to balance process performance and permeate quality. Surface needed and cleaning cycles can be reduced and operating costs are minimized. The best results of HTC permeate treatment by Aerobic Waste Water Treatment can be attributed to the high density of acetic acid as batch catalyst. Use of other catalysts leads to results which are a little worse, but in any case the organic content in the permeate is eliminated to more than 90 % after 48 h.

12 Executive Summary - Thermo-Chemical Biomass Conversion
Figure 6: HTC demonstration plant for biocoal production at AVACO2.
HTC coal as fresh filter cake, in pellet and powder form (top to bottom).
The MBR used for this test is part of a mobile containerized waste water treatment plant of EnviroChemie. It consists of a biological cleaning part with membrane filtration, an active coal filter for post treatment, and a reverse osmosis plant with an expansion tank for in- and outflow. The degradation results of the MBR show that organic compounds can be eliminated by 90 %; the dissolved organic matter content in process water is even eliminated by 100 % after 5 h. However, the results showed that the required purity grades can be achieved without an MBR pre-process. Occasionally, there may be demand in certain cases, but generally is not required, even for permeates out of sewage sludge. The tests showed that NF works very well and meets the legal requirements. The NF plant used is flexible and has a long membrane service life, which leads to low operation costs.
In regard to storage and handling of HTC coal three concepts were elaborated taking into account the most determining parameters particle size and humidity as well as safety regulations. Concerning the latter, only German regulations were taken into account and may be different in other countries. Tests proved, that from a storage point of view, dry pellets or chunks can be recommended, because they keep pourability even on big scale. Therefore, no forced transportation is required (screw conveyor or a shaker), molding is unlikely to happen. HTC coal in dust form also is immune against molding, even if stored in an open barrel, but storing and handling requires explosion prevention, which raises costs e.g. by providing an inert atmosphere and suitable equipment. Cementing might happen, which reduces pourability. Storing of wet biocoal is not recommend; it will mold and cement in all forms. In addition to storage and transportation issues, the form of the biocoal is also determined by the use case related to the combustion plant features. AVACO2 recommends drying of coal in all forms (dust, pellets, and chunks) and short term usage to avoid the problems stated above, meaning a period of several days of up to several weeks.

Executive Summary - Thermo-Chemical Biomass Conversion 13
For drying the wet coal, convective drying technologies have been tested. HTC coal is very temperature sensitive, the self ignition point being at about 100 °C. Therefore only temperatures between 20 and 80 °C can be applied. Six technologies have been tested. The advantages and disadvantages of all technologies have been analyzed and evaluated in terms of drying performance, throughput and energy consumption. Within the scope of BioBoost, where organic municipal waste and brewery spent grain were considered as most promising biomass types for HTC, mill drying is recommended.
3.7. Biocoal combustion
Pulverized bio-coal from HTC and FP was tested for combustion by co-firing with conventional coal as well as by mono-firing by UOS in laboratory and pilot scale pulverized fuel combustion facility with 20 and 500 kW, respectively. The tests were focused on the investigation and evaluation of combustion performance, stability and emission behaviour and compared to the hard coal (mono) firing case.
Fuel properties of HTC coal vary significantly with the type biomass; so biocoal from SBG and OMW shows different challenges. The latter has higher ash and chlorine content as well as lower heating values compared to biocoal from SBG. Consequently, it showed acceptable combustion performance only during co-firing while technically; both mono-firing and co-firing is possible with biocoal from SBG. HTC coal showed some fundamental difference in combustion behaviour in comparison to the reference hard coal. The biocoal particles take longer time to combust and create a very long, departed flame and different temperature profiles in comparison to reference coal (see Fig. 7). The different combustion behaviour is expected to impact aspects of burner and boiler design. Also, fuel-N to NOx formation and reduction related issues, fly ash quality, and safety issues are areas which need further understanding leading to modified burner designs and combustion procedures suitable for promising long term testing.
Figure 7: Biocoal flame (left) and coal flame (right) Figure 8: CO concentration profile down the
burner along the furnace center during coal (mono-firing), 10 % SBG (co-firing) and OMW
biocoal (mono-firing).

14 Executive Summary - Extraction of Valuable By-Productcs
4. Extraction of Valuable By-Productcs
In BioBoost, there is a strong focus on the economics of the processes. To improve the economics of the overall value chains the extraction of chemical byproducts from the pyrolysis products and the HTC process were investigated by AVACO2, CHIMAR and DSM . Focus was set on:
Recovery of phenolic compounds and organic acids from fast and catalytic pyrolysis
Recovery of furanoics from HTC and pyrolysis aqueous effluents and condensates
Recovery of primary and secondary nutrients from HTC process water
DSM developed a promising flow scheme for integrated organic acid and phenol separation, as schematically shown in Fig. 9. First, acetic acid is extracted by water with distribution ratios of up to 3.9 (compared to those of phenol staying <0.1) while the biooil raffinate is further processed in order to recover phenol. For this purpose three different aqueous basic solutions were tested for their ability to extract phenol: sodium hydroxide, sodium bicarbonate and trimethylamine (TEA).
Figure 9: Simplified extraction scheme for organic acid and phenol recovery.
For the isolation of mixtures of phenol derivatives, so-called phenolics, CERTH developed several different extraction schemes. From FPO, mixtures with 13.1 to 18.6 wt.% of phenolics concentration could be extracted with up to 80 % extraction efficiency using a solvent consisting of 50 % ethyl acetate and 50 % cyclohexane. CPO has far higher initial concentrations of phenolic compounds and a multi-stage process has been developed for their efficient extraction. Basically, naphtha is employed as extraction agent, leaving a residue as a concentrate with up to 22 wt.% of phenolics. Based on the results obtained and the methods developed it can be concluded that the extraction of a phenolic fraction from fast and catalytic pyrolysis oils is possible and can be achieved in a few steps and by using benign solvents that can be recycled.
Figure 10: Typical two-dimensional gas chroma-tography ToFMS analysis of an extract rich in phenolic components as extracted from CPO.
For the isolation of furfurals, particularly 5-HMF (5-hydroxymethylfurfural) as one of the most important chemical platform molecules in bioeconomy, from the aqueous effluent
acid extractionbio‐oil
dilutant
acid residue
phen
ol extraction
bio‐oil for refinery use
phen
ol recovery
Extractant recycle
phenol

Executive Summary - Extraction of Valuable By-Productcs 15
stream of the HTC process two methods were investigated. A first approach is the solvent extraction for which different solvents were screened on their partition coefficients, mutual solubility in the aqueous phase and the physical phase separation properties. Chloroform performed best making use of an 8-stage mixer settler battery. Also, the adsorption of HMF onto activated charcoal and the following desorption was tested. However, when optimized towards the production of bio-coal, the amount of furfural in the HTC process water is insufficiently low for extraction. It could be proven that furfurals are intermediately formed species being chemical precursors of HTC coal. A staged or combined process of an HTC and an HMF producing process were suggested to integrate HMF and biocoal production making use of the added value, mainly generated by expected higher bio-coal yields.
At CHIMAR extracted fractions were tested for their suitability in the production of plywood panels. Resins of the phenol-formaldehyde (PF) type with partial replacement of phenol by a phenolic fraction up 50 % are suitable for the production of plywood panels according to existing norms and standards. The phenolic fractions from CPO performed best, resulting in plywood panels free of any smell for utilization in both interior and exterior applications. When 5-HMF was used as formaldehyde substitute, its higher chemical reactivity compared with the formaldehyde lead to limitations in the substitution degree to max. 20 wt.%. The resulting panels had acceptable performance relatively with the shear strength and the wood failure, but unexpectedly strange results in formaldehyde emission measurements. Apparently, 5-HMF prevents full crosslinking of formaldehyde due to its higher reactivity. Overall, it can be said that PF resins with replacement of formaldehyde by 5-HMF need further understanding and optimisation. Using the light phase of CPO as acidification mean during the synthesis of an urea-formaldehyde (UF) resin, it was found that such resins can be easily prepared having properties similar to the UF resins prepared with a petrochemical acidification agent. Particleboards produced with such resins show a comparable performance to those being prepared with a conventional UF.
The feasibility of nutrient recovery from the HTC process was studied by KIT and AVACO2 in order to (i) improve the economic performance of the overall process and to optimize the HTC process parameters in regard to (ii) bio-coal properties (e.g. in view to emissions during combustion) and (iii) process water treatment or disposal. For the types of feedstock relevant to HTC direct recovery of nutrients appeared not to be promising. However, particularly the behavior of nitrogen and phosphorous as well as of other components is relevant to the optimization of the HTC process and was therefore studied in more detail.
While phosphate was found at rather high concentrations at short residence times, it is increasingly incorporated in the bio-coal formed. Nitrogen species showed a much more complex behavior with ammonium, nitrate and nitrite ions exhibiting maximum concentrations during the HTC-process. As a result it was found, that the HTC process water can be disposed via existing conventional waste water systems. Furthermore, it was shown that a separation of nutrient components is possible when extracted during the conversion of feedstocks with higher concentrations.
Figure 11: Ammonia content in HTC process water in dependence of reaction temperature and time reaching concentrations up to 1 g/L converting
green parts of vegetables.

16 Executive Summary - Logistics
5. Logistics
Within the BioBoost project optimisation of transportation and handling of biomass feedstock and of bioenergy intermediates carriers are key issues as part of the assessment and modelling of the whole bioenergy value chains. The primary focus of the project is on conversion technologies for decentralised conversion of biomass to bioenergy intermediates and subsequent energy production on a trans-regional, EU-wide level. Transport of biomass over long distances is expensive and inefficient; therefore, de-central conversion plants should be located in regions with large feedstock potentials. The produced intermediate energy carriers are more transport-worthy concerning energy density and handling, enabling railway transport over long distances to a central plant for efficient upgrading to a usable bioenergy product as e. g. transportation fuel. Overall, handling, transport and storage of biomass and energy carrier as well as size and site of decentral and central plants of the three pathways had to be optimised for Europe. This was investigated with a holistic logistics model developed by FHOÖ on the basis of regional biomass potentials, biomass price/supply functions, data on modes and costs of transportation and conversion technologies and the actual road network for the NUTS 3 regions of the EU28. Uneconomical transportation e. g. of highly water containing types of biomass residues featuring low energy contents favour a decentralised supply network of short haul distances. The model is used to calculate resulting total costs for given scenarios which describe locations and capacities of de-central conversion plants, as well as the amounts of acquired feedstock and transportation targets.
Figure 12: Parameters and factors relevant for scenario analysis and optimization.
The figure below shows the power and performance of FHOÖ’s heuristic optimization model in an exemplary result for the CP pathway. In this process, forest fuel is pyrolyzed in the presence of a catalyst yielding a high quality biooil (15 to 20 % oxygen, storable, compatible to equipment for crude oil transport). Upgrading consists of series of extraction and hydro-treatment steps to remove small acids and phenols, reducing the hydrogen demand in upgrading to transportation fuel. This step is envisaged in refineries profiting of available

Executive Summary - Logistics 17
knowhow, infrastructure and co-processing from commercial facilities. The hypothetic scenario below shows the extremes, as there is a strong east-west gradient of forest residue availability and upgrading capacity in Europe: The Baltic States where the forest residues potential for biooil production exceeds the refinery capacity and the Netherlands which are short in biomass residues but a centre of the European refining industry. The first European CP plants would be built where feedstock is available in large amounts at low cost as e.g. in the Baltic States. CP plants (in the coloured regions) attract feedstock from neighbouring regions (blue arrows). The biooil of these plants will be transported to refineries with available conversion capacities first nearby, later also further away (red arrows). With increasing implementation, the biooil may be transported to refineries with unused capacity or new upgrading capacity would have to be erected. In the Baltic States the forest residue potential for bio-oil production exceeds the locally available refinery capacity, whereas the large Dutch refining capacity is unused because feedstock is scarce. In this example all refineries nearer by the Baltic States have already saturated their surplus capacity with regional-produced biooil, which is the reason the CPO is transported to Rotterdam refineries in the Netherlands. In regions with low feedstock availability as e.g. the Netherlands biooil production costs are relative high due to longer feedstock transport distance and the scale of unit effect. In this model run, the Dutch CP plant had a biooil production of less than 50.000 t/a while the Baltic had about 150.000 t/a. The biooil logistic costs vary between 1 EUR/t for the CP plant at the Lithuanian refinery to about 100 EUR/t for long distance railway transport to Rotterdam. In the BioBoost project these two refineries were calculated to have production costs of about 1400-1600 EUR/t. Further results for all three pathways and EU-28 can be retrieved under www.bioboost.eu.
Figure 13: An exemplary result of the simulation model developed in BioBoost. Areas with CP plants are coloured according to the production costs (green – 630; yellow – 700; orange – 870 EUR/t biooil), NUTS
with refineries are indicated by black arrow. CP plants would be built where feedstock (here forest residues) are available for low cost as e. g. in the Baltic States. Biomass feedstock transport across NUTS is indicated with blue arrows; red arrows indicate biooil transport to refineries with available conversion
capacities. Other regions with a more balanced ratio of biooil supply and demand were omitted for sake of simplicity.
Refineries, estimated biooil conversion capacity816000 t/a 263000 t/a
Baltic biooil productionabout 700.000 t/a @ 630 ‐ 700 EUR/t
Dutch biooil production about50.000 t/a @ 870 EUR/t

18 Executive Summary - Sustainability Assessment
6. Sustainability Assessment
For the overall assessment carried out at TNO, reference cases were defined for each of the energy carrier conversion pathways, which then have been assessed in view to techno-economic, environmental and social aspects. The backbone for the BioBoost assessment methodology relies on the GBEP framework. The Global Bioenergy Partnership (GBEP) developed a set of indicators for policymakers and stakeholders to guide the development of the bioenergy sector and to meet international goals on sustainable development. These sustainability indicators are science-based and refer to environmental, social, and economic aspects. They are based on earlier roadmaps on biofuels by the International Energy Agency (IEA). For the specific techno-economic Key Performance Indicators, guidelines from the European Industrial Bioenergy Initiative were also applied.
Three reference pathways were defined to create base scenarios for the sustainability assessment of biofuels production from waste biomass. These pathways rely on producing intermediate energy carriers in local plants by fast and catalytic pyrolysis as well as by hydrothermal carbonization, which are then transported to central or remote plants for further conversion into biofuels or for usage, respectively. Each pathway consists of a step for biomass preparation, biomass transportation, local conversion, intermediate energy carrier transportation and further central conversion step, for which mass and energy balances have been set-up.
Figure 14: Feedstock, Process steps and products for the three reference pathways along with the
LHV of fuels and design (input) capacity of conversion plants.
The total costs per pathway have been broken down to the direct (techno-economic) and indirect (environmental) costs given in EUR/kWh. For each of the pathways, a sensitivity analysis has been performed, showing the impacts from the variation of relevant parameters as feedstock type and price, plant capacities and transport distances.
The environmental assessment follows a three step approach. In the first step only the greenhouse gas (GHG) footprint is assessed according to the Renewable Energy Directive

Executive Summary - Sustainability Assessment 19
(RED) method. In the second step, additional environmental impacts from conventional Life Cycle Assessment are taken into account according to ISO standards 14040 and 14044 (ISO, 2009a, b) and utilizing the ReCiPe methodology. Finally, in the third step “new” bio-related impacts concerning water and soil quality as well as land use are assessed. These effects usually are not yet included in a conventional LCA. Even though these partly not too well defined impacts like land occupation and transformation or soil organic matter loss and water depletion are relatively new in terms of data inventory and impact methodology with correspondingly high uncertainties, these indicators are helpful to identify potential risks of a certain new aspect. The uncertainties increase per step of the environmental assessment due to a lack of reliable data and of existing and proven methodologies, particularly for the new bio-related environmental impacts. For comparison, the different environmental impacts are monetized by the shadow price methodology (using the Netherlands as reference) expressing all effects as costs in EUR/MWh.
The integrated sustainability assessment consists of weighing-out of both benefits and costs. These consist of direct, techno-economic costs and monetized indirect, environmental effects. This approach indicates strengths and weaknesses relative to one another and supports decision making on different options and pathways. In this study, the indirect costs only result from conventional environmental impacts.
In addition to the reference pathway assessment EU wide implementation scenarios have been simulated for the FP and CP pathways by using the optimization tool, weighing out the effects of biomass supply, transportation, local and central conversion capacities.
6.1. Transportation fuels from FP and CP pathway
Environmental assessment
In Figure 15, the CO2 emissions for the FP and CP reference pathways using different types of feedstocks are shown. The reference emission for the fossil crude oil feedstock benchmark is 83.8 g CO2/MJ. The use of miscanthus leads to CO2 emission reductions of 61 % and 68 % by the FP and the CP pathways, respectively. For the other types of feedstock types, reduction of 80 % and higher are achieved. Miscanthus is an energy crop; therefore emissions from cultivation are taken into account, whereas the emissions from cultivation residues are set zero in accordance to the RED guidelines. Compared to the today´s 1st generation fuels, the CP and FP pathways using bio-residues show considerably lower CO2 emissions with around 15 g CO2/MJ. In Annex V of the RED, waste wood Fisher-Tropsch diesel or methanol production is estimated with even lower GHG emission of 4 g CO2/MJ each.

20 Executive Summary - Sustainability Assessment
Figure 15: CO2 emissions for FP and CP reference pathways with different feedstocks.
CO2 emissions are attributed to extraction & cultivation (Eec), conversion processes (Ep), transport & distribution (Etd), and total emissions for the references (Etot).
The climate change effect of fossil fuels is dominated by the use phase where fossil fuels are combusted whereas the much smaller contributors from the bio-based pathways are the CO2 and N2O emissions during biomass cultivation and the CO2 emissions from the electricity, steam and hydrogen production for the processing steps. In the gasification step (central conversion in FP pathway) and the catalytic pyrolysis step, electricity is co-produced. This leads to an environmental benefit equal to the prevented emissions from the current electricity from the grid. Therefore, the CO2 emissions of the bio-based pathways are even lower than that according to RED.
To sum up the detailed LCA analysis, conventional environmental impacts are sometimes larger for fossil fuels (climate change, fossil depletion, particulate matter formation and ozone depletion) and in other cases larger for bio-based pathways, mainly from human and eco-toxicity as well as eutrophication. The higher eutrophication and toxicity emissions from the bio-pathways are related to straw cultivation and do not occur in case of wood. The higher toxicity emissions from the stem from plant protection products related to the wheat cultivation and are partly allocated to the straw.
For the land-use related impacts of the new environmental indicators, FP shows larger impacts than the CP due to the lower process chain efficiency of the FP pathway. The agricultural land occupation impacts differ largely between different feedstocks. For example, wood residue and wheat straw have low impacts, due to low allocations of impacts to the low value byproduct. Miscanthus has a high allocation, but is as an energy crop efficient with respect to the land-use. Wood forest residues have a low impact allocation, but at the same time very low land-use efficiency. As a consequence relatively high agricultural land occupation is estimated because it just refers to area required to “cultivate” the biomass and intensity of the land occupation is not considered in this factor. This example shows the potential, but also the limitations of applicability of new impact factors.
0
20
40
60
80
100
Miscanthus
Wheat straw
Wood forest residue
Wood In
dustry chips
Miscanthus
Wheat straw
Wood forest residue
Wood In
dustry chips
Waste wood
Rapeseed
Crude oil
Transport fuel Transport fuel Biodiesel
FP CP Reference
RED
‐CO2emissions (g/M
J)
Etot
Etd
Ep
Eec

Executive Summary - Sustainability Assessment 21
Integrated sustainability assessment
Figure 16 shows that the direct costs of the FP pathway are higher than those of the CP pathway basically because of the higher overall efficiency of the latter. Proportionally, the indirect costs are relatively small. For the bio-based FP and CP pathways with straw and forest residues, respectively, they are lower (7-8 EUR/MWh) than those for the fossil reference (13-15 EUR/MWh). Roughly, they represent approximately 5 % of the overall costs for the bio-based routes and approximately 20 % for the fossil benchmarks.
Figure 16: Direct versus indirect (conventional) cost of reference pathways to produce
transport fuels via the FP and CP pathways based on wheat straw and the fossil benchmarks
The costs given in Fig. 16 are related to the pre-defined reference pathway. Optimization by the simulation model may lead to improved production costs by utilizing the most favourable biomass regions and conversion sites. As an example, for the FP pathway minimum costs have been estimated to 1700 EUR/t for a Southeast European scenario.
The local and central processing steps result in the largest contribution to the total direct costs. Logistics contribute to a smaller extent ranging from 10 to 15 % and biomass supply to ca. 12 %. Comparing the conversion of wheat straw, lower direct costs are calculated for the CP pathway due to a higher energy conversion efficiency and better mass balance from biomass towards the intermediate energy carrier and the final transportation fuel. This shows clearly how the economic success of a conversion pathway relies on the energy densification of biomass via suitable intermediates.
The indirect costs of the FP and CP pathway are similar compared to those of the fossil benchmark (see above). Main contributions in the bio-based pathways originate from the biomass. The cultivation of wheat causes impacts due to the use of fertilizers and tractors, which are partially allocated to the by-product, i.e. wheat straw. Transportation either to the local or to the central plants shows low indirect costs. The FP pathway shows a large benefit (negative costs) for the co-production of electricity in the central plant, thus preventing emissions from conventional electricity generation. The CP pathway shows higher costs for the central process in the refinery mainly due to the consumption of hydrogen and steam. The CP pathway is assumed to co-produces electricity in the local process, while the FP pathway shows higher indirect costs for local processing mainly due to the use of external electricity.
0
50
100
150
200
250
300
Gas TF (404 MW) Ref (260 MW) Ref diesel Ref gasoline
FP (100 MW) CP (50 MW) ‐
Wheat straw (32 euro/ton) Crude oil
Costs (euro/M
Wh)
Direct cost Indirect cost

22 Executive Summary - Sustainability Assessment
The sensitivity analysis shows the effects on various impacts on the direct and indirect costs, respectively. The type of feedstock influences the overall costs as a result of different biomass supply prices and yields. These differences result in a variation in the overall costs for the FP pathway from 195 EUR/MWh (wood industry chips) to 261 EUR/MWh (miscanthus). In order to produce 1 kg of biosyncrude from a feedstock free of water, 1.26 kg wheat straw or 1.04 kg of wood industry chips or miscanthus is needed. These results also consider the differences in yield. For the CP pathway 3.54 kg of forest residue, 3.43 kg miscanthus or 3.80 kg wheat straw are needed to produce 1 kg of fuel. However, even though miscanthus shows the highest yield, its high price makes it a more expensive route than utilizing forest residues or wheat straw (167 vs. 146 and 150 EUR/MWh, respectively). Also, miscanthus is an energy crop, not a byproduct, to which all impacts from the cultivation are allocated to calculate the indirect costs. For straw the price ratio of the by-product versus the main product has been used to allocate the impacts from the cultivation to the main and byproduct.
Also, the impact of the transport distance on the overall costs has been assessed. Generally, the logistics costs, direct and indirect contributions, increase almost linearly with the distance increases. The only factor that makes the logistic cost not directly proportional is the handling costs, which depends on the amount of feedstock but not on the transported distance. The transport distance has a small effect on the overall costs, but is decisive in optimizing regional feedstock utilization and prices together with the processing capacities. Both direct and indirect transport costs for the FP pathway are higher than that for the CP pathway because of a lower overall conversion efficiency.
Variation of the conversion plant capacity shows the expected reduction of production costs corresponding to the scaling factors assumed. The effect of the economies of scale will favors larger plants in order to reduce costs. However, large conversion capacities imply longer transport distances or higher feedstock utilization resulting in higher feedstock prices at the plant gate and thus require optimization.
The sensitivity of direct costs towards wheat straw and forest residue prices for the FP and CP pathway not surprisingly shows a linear relationship. In practice, the feedstock price will rise as soon as the utilization or demand in a certain area grows. Therefore, pathway optimization is required to lower feedstock utilization per region and to centralized conversion plants, where logistics and utilization are optimized in order to keep low feedstock prices.
Scenario assessment
From the sensitivity analysis it becomes obvious, that an optimization is necessary to weigh out the effects of biomass supply, transportation, local and central conversion capacities. The optimization tool was applied to study:
(i) Europe wide FP and CP pathway implementation scenarios,
(ii) Case studies for regional implications when applying certain scenarios,
(iii) The influence on fluctuating market prices of biofuels presumed for 2020 and 2050 cases and,

Executive Summary - Sustainability Assessment 23
(iv) The effect of changing feedstock prices varying by 50 %.
Europe wide simulations were performed for both the FP and CP pathways utilizing Europe’s straw and forestry residue potentials, respectively. From the optimum plant capacities and locations for local and central production plants and their locations could be identified. From the techno-economical results social and environmental impacts could be drawn.
The EU wide simulation of the FP pathway implementation shows a straw utilization of 52 Mio.t/a for biofuel production, meaning an average utilization share per region of 35 %. This results in the production of 5.5 Mio.t of biofuel per year, which is 1.25 % of the current total transportation fuel consumption in Europe. The regions with the highest straw production can be found in France, Spain and in the East of Europe in general. In the optimum simulation solution found 137 straw FP plants are constructed, the capacities of which vary between small (<200,000 t/a) and very large (> 350,000 t/a) conversion plants. Approximately 10 times less biosyncrude plants are built with correspondingly 5-10 times larger conversion capacities when compared to the FP plants. This supports the local-central principle, where an intermediate is locally produced and centrally converted. Assessing the profitability, the regions with the lowest production costs were found to be in Hungary, Poland and Romania. These are also the regions were profits are being made with a biofuel selling price of 2500 €/ton. From an economic perspective these are the regions where biofuel production should be first implemented.
Figure 17: a) Straw potential in Europe, b) locations and capacities of local (FP) plants and c) locations and capacities of central plants in Europe. Colors indicate volumes or size of the respective parameter:
red is high/large, green is medium, blue is small and grey is zero.
The simulation of the EU wide CP pathway implementation showed a forestry residue utilization of 23.2 Mio.t/a for biofuel production, which is equivalent to an average of 20 % per region. With the current state of the art this would result in the production of 4 Mio.t/a biofuel which is 0.9 % of the current fuel demand in Europe. The regions with the highest forestry residue production are located in the Scandinavian countries, the East of Europe and France. The optimum scenario utilizes 120 forestry residue converting CP plants, of which ca. 60 % have an annual conversion capacity between 200-400 kt. Approximately six times less central conversion plants on refinery sites are provided with CPO. Around 80 % of the central CPO conversion plants are order of 200-300 kt/a, while in the FP case around 40 % are in the range of 3500-7000 kt/a. This is a result of the assumption that bio-oil conversion plants are limited by the availability of hydrogen on-site of the refineries, where dedicated CPO conversion plants are erected. Additional H2 supply capacities would change this picture, but also the cost situation. The calculated biofuel production costs are quite comparable for all the

24 Executive Summary - Sustainability Assessment
production regions. However, the highest conversion capacities can be found in France and the Netherlands, which is related to the presence of large refineries. As a result the highest absolute profit can be achieved in these countries. Existing industrial infrastructure is of major importance to the CP pathway.
Exemplary, three different regional scenarios were considered for biofuel business cases via the FP and CP pathway: (i) an optimization considering only Austria (scenario AU), (ii) Austria as part of a region including its neighboring countries (AU+), and (iii) Austria as part of whole Europe (EU) (see Fig. 18). The impact on the biofuel business case in Austria was assessed. In all scenarios a biofuel selling price of 2.50 EUR/kg was applied.
Figure 18: Distribution of central conversions plants in case of AU, AU+ and EU wide implementation of
the FP pathway.
Not surprisingly, biofuel production is not profitable when its implementation is limited to the borders of Austria. It is possible to convert straw to biofuel by building three FP plants and one central conversion plant, but no profit will be made. This is mainly due to the mismatch between the capacities of local and central plants. When neighboring countries are considered in the simulation, a profit is generated. Import and export of feedstock and intermediate products take place, resulting in the construction of 5 FP plants and one central plant erected in Austria. However, when EU wide implementation is simulated, no central plants are built
in Austria. In case of the CP pathway, simulation of all implementation constellations resulted in the construction of profitable central conversion plants in Austria. With expansion of the implementation area the overall biofuel production costs are significantly reduced.
Along with the techno-economic aspects of the simulation also socio-economic and environmental impacts of the scenarios can be investigated. These impacts were evaluated based on the social indicators identified by GBEP. Out of these the geographically distributed change in income, the number of jobs in the bioenergy sector and the number of incidents of occupational injury were taken into account. As a result, approximately 2.5 billion EUR value added will be created by the EU wide FP scenario which is comparable to the value added created in the fossil fuel value
Figure 19: Biofuel production costs via the CP pathway for the optimum implementation
scenarios AU, AU+, and EU.

Executive Summary - Sustainability Assessment 25
chain. Most of the value added will be generated in Germany, followed by Spain Italy, Hungary, Poland and UK. Accordingly, a significantly large number of approximately 25,000 jobs will be created or secured in the agricultural sector, especially in the East of Europe related to the more labor intensive farming practices in these areas. Related to the CP pathway, ca. 1.5 billion EUR value added will be created of which major contributions are generated in Germany, France, Finland, Poland, Spain, and Sweden. A total of around 18,000 jobs will be created. The number of refinery related jobs has not been considered in the analysis. However, it can be expected, that due to the erection of dedicated CPO conversion plants the number of these jobs will more or less remain the same.
6.2. Hydrothermal conversion
The products of the HTC pathway, electricity and heat, cannot directly be compared with the products from FP and CP pathways for transportation fuel production, which are energy carriers. Heat and power are energy end products. Therefore, this pathway is assessed separately.
The CO2 emissions for the HTC pathway to produce heat & power from the organic fraction of municipal solid waste (OMW) and brewery spent grain (BSG) via biocoal as intermediate energy carrier have been assessed. Nearly completely, the CO2 emissions are due to energy consumption in the HTC process to produce the biocoal. The reference emissions from fossil coal are approximately 111 g CO2/MJ, consisting of 13 g CO2-eq/MJ in the production and 98 g CO2-eq/MJ in the use phase. The bio-coal will have no CO2 emissions in the use phase. It has been calculated that over the life cycle, biocoal reduces greenhouse gas emissions by almost 60 %, which can be improved when bio-based energy is used to provide process energy.
If other environmental impacts of HTC generated power are compared to average electricity from the German grid, it becomes obvious that the first avoids CO2 emissions, eutrophication, human and eco-toxic emissions while the German grid has lower impacts on particulate matter and photochemical oxidant emissions. These emissions are higher for the HTC of OMW because of its higher transport emissions by house to house, stop and go waste collection. Another difference of OMW and BSG is the allocation of impacts of the cultivation of brewery grains, based upon the relative value.
Regarding the new environmental indicators, land-use impacts of HTC fueled by OMW are limited. Due to avoidance of electricity generation on the grid, natural land transformation (in fossil energy extraction) is avoided. A limited impact on urban land occupation occurs due to plant facilities but this is lower than for public power generation. There is no impact on agricultural land occupation and soil organic matter. The latter is the case for the use of BSG, also higher than for power generation from the grid. Water depletion is lower for HTC than for power generation, due to the avoided water demand in fuel extraction.
As a result of the integrated sustainability assessment, Fig. 20 illustrates the direct and monetized indirect (conventional) costs of the HTC pathway, using OMW as a feedstock. The overall costs of that pathway with 102 EUR/MWh are similar to those of the fossil benchmark, which is the market price of 100 EUR/MWh for electricity from the German grid. Revenues from selling the produced heat are not included in the production costs, which

26 Executive Summary - Sustainability Assessment
would result in lower production costs and minimum selling price. The indirect costs are 31 EUR/MWh for the HTC pathway versus 36 EUR/MWh for the benchmark.
Figure 20: Left: Direct versus indirect (conventional) cost to produce electricity via the HTC conversion
based on Organic Municipal Waste and electricity from the German grid; Right: Breakdown of the direct costs. For electricity no break down was available and the direct costs of the full chain are displayed.
Because of the negative feedstock costs, the direct costs breakdown for the HTC pathway is more complex than for the FP and CP pathways. The right side of Fig. 20 compares the production of electricity and heat with the benchmark electricity price. The production costs of bio-coal have an overall negative value of ca. 40 EUR/MWh. As a result, negative feedstock costs are also considered in the direct costs calculation for the CHP plant. As the sum of the negative feedstock costs and the positive processing costs, overall direct costs of 102 EUR/MWh are resulted.
The indirect costs of the HTC pathway and conventional electricity from the German grid are in the same order of magnitude. The contribution of logistics is negligible, the shares of feedstock, local and central processing are similar in size. No impacts are allocated to the waste, only collection and transport by truck are taken into account. The emissions from waste collection contribute to climate change and particulate matter formation. Local processing contributes to climate change as well, because of the use of steam which is generated by the use of natural gas burners. Overall, the CHP process contributes mainly to human toxicity because of the large amount of ash produced during the combustion of coal. Compared to the conventional new environmental impacts practically do not contribute to the indirect costs.
When BSG is used as feedstock, the total direct costs are 329 EUR/MWh. This difference to OMW is the result of the increased biomass feedstock costs which is - 60 EUR/t for OMW and 0 EUR/t for BSG. Also, the HTC process requires 1.6 kg DM of BSG per kg of bio-coal compared to 1.43 kg DM of OMW. When considering environmental impact categorized by pathway steps, the impacts from the local and central process are similar for both feedstocks. The main difference in impact comes from particulate matter formation and climate change. As mentioned before, the impacts from organic municipal waste are larger, because of the required collection of the waste from door to door. The brewery spent grains are a by-product from the beer brewery and only a part of the impacts from the beer brewing process are allocated to the brewery spent grains.
0
20
40
60
80
100
120
140
160
CHP (20 MWe) Grid
HTC (12 MW) ‐
Organic Municipal Waste (‐60 euro/tonne) German Emix
Costs (euro/M
Wh)
Direct cost Indirect cost
‐200
‐100
0
100
200
300
Organic Municipal Waste (‐60 euro/ton) German Emix
CHP (20 MWe) Grid
HTC (12 MW) ‐
Direct costs (euro/M
Wh)
Biomass Logistics local Local processing
Logistics central Central processing Full chain

Executive Summary - Achievements 27
7. Achievements
Achievements: Feedstock considerations Relevance/Recommendations (→)
Feedstock potentials of agricultural and forestry residues and costs on regional level (NUTS 3),
Online public Geographic Information System → higher resolution level of feestock potentials desired
Cost supply relationships Intensity of use is considered in the simulation model by pricing
→ more details on local cost supply and demand ratio desirable however very high efforts
Achievements: Fast pyrolysis Relevance/Recommendation
Process development unit for low grade biomass conversion re-designed; validation device for process and product optimization available
Reproducible results with accurate mass and energy balance for new feedstocks
→ Modifications/results to be transferred to larger scale
Biosyncrude production optimized toward high sedimentation stability, energy content, minimum energy consumption for storage, transportation and feeding to a gasifier
FP products meet gasification specifications→ large scale testing in bioliq plant
Entrained flow gasification most feasible for ash rich, residual types of biomass
→ Pilot scale verification of feed flexibility at KIT bioliq plant
For gasification, no high quality requirements for FPO and char, for alternative applications FPO is less suited
FP process can potentially be further simplified, FPO can be upgraded
Combustion of FPO possible by air assisted atomization → Equipment and FPO to be adap- ted, need of further development
Achievements: Catalytic pyrolysis Relevance/Recommendation
New catalyst allowing for higher CPO yield at the same oxygen content, catalysts of different activity provide a range of CPO with different oxygen content
CPO of defined O-content can be produced
→ Testing long term demonstration scale with the new catalyst
CPO is a very stable energy carrier that can be stored and handled in a similar way to conventional fuels
CPO is suitable for industrial handling
→ Testing larger quantities from

28 Executive Summary - Achievements
pilot or demo plant operation
Quantitative studies on deactivation of the catalysts due to hydrothermal treatment and solids/ash deposition
→ Testing long term catalyst deactivation tests on piloting scale
Proof of concept for a refinery hydro-treating process (stabilization + deoxygenation) for CPO upgrade
Principle technical feasibility is given
→ Parameter optimization and engine testing of the fuel fractions
CPO upgrading in separate units integrated into oil refineries infrastructure maximizes biofuel yield and is preferred over the co-feed cracking FCC concept
Build-up of dedicated upgrading plants in refineries is favorable
→ Further development on separate CPO upgrading and refining units
Achievements: Hydrothermal carbonization Relevance/Recommendation
Process development along the whole process chain closing essential gaps like product handling, effluent water re-use and treatment
Ready for technical and market implementation
Economic feasibility for waste streams like organic municipal waste
Ready for implementation
Optimization of waste pre-treatment (separation from inorganics like silt, plastics etc.) to improve C content
Plant concept is ready according to 4. BImSchG for all emissions (gas and noise) water, soil and air
Ready for administrative approval
Co-firing with coal is technical feasible, in some cases also mono-firing is possible.
Different combustion behavior has impact on burner and boiler design
→ requires further testing
Achievements: By-products recovery and use Relevance/Recommendation
When optimized towards energy carriers, co-production of chemicals only for phenols useful , other components have too low concentrations
→ Cost optimization required → Sophisticated Biorefinery concepts are required
Analysis methods and complete extraction scheme developed for FP and CP phenol/organic acid extraction
→ For CP testing on pilot scale with larger quantities required
Phenolic fractions of CPO can be used as phenol substitutes for up to 50 % in the synthesis of resins and also as platform for
Ready for technical implementation
Executive Summary - Achievements 29
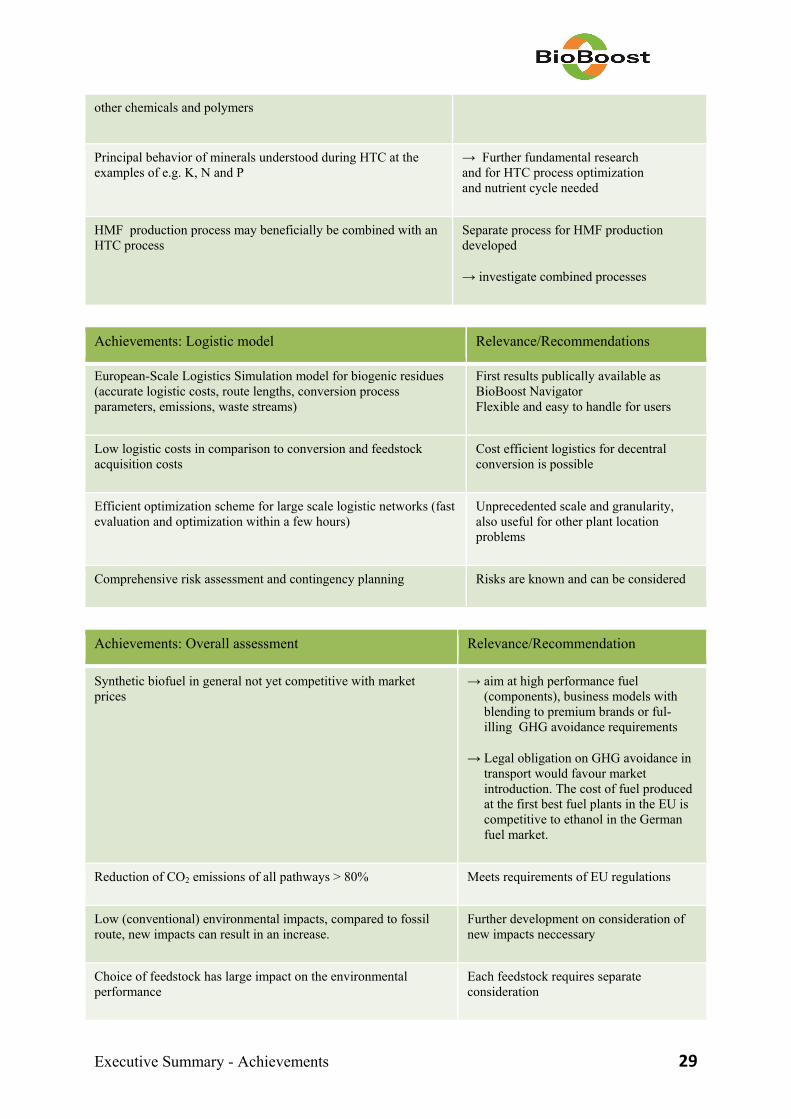
other chemicals and polymers
Principal behavior of minerals understood during HTC at the examples of e.g. K, N and P
→ Further fundamental research and for HTC process optimization and nutrient cycle needed
HMF production process may beneficially be combined with an HTC process
Separate process for HMF production developed
→ investigate combined processes
Achievements: Logistic model Relevance/Recommendations
European-Scale Logistics Simulation model for biogenic residues (accurate logistic costs, route lengths, conversion process parameters, emissions, waste streams)
First results publically available as BioBoost Navigator Flexible and easy to handle for users
Low logistic costs in comparison to conversion and feedstock acquisition costs
Cost efficient logistics for decentral conversion is possible
Efficient optimization scheme for large scale logistic networks (fast evaluation and optimization within a few hours)
Unprecedented scale and granularity, also useful for other plant location problems
Comprehensive risk assessment and contingency planning Risks are known and can be considered
Achievements: Overall assessment Relevance/Recommendation
Synthetic biofuel in general not yet competitive with market prices
→ aim at high performance fuel (components), business models with blending to premium brands or ful- illing GHG avoidance requirements
→ Legal obligation on GHG avoidance in transport would favour market introduction. The cost of fuel produced at the first best fuel plants in the EU is competitive to ethanol in the German fuel market.
Reduction of CO2 emissions of all pathways > 80% Meets requirements of EU regulations
Low (conventional) environmental impacts, compared to fossil route, new impacts can result in an increase.
Further development on consideration of new impacts neccessary
Choice of feedstock has large impact on the environmental performance
Each feedstock requires separate consideration
30 Executive Summary - Conclusions
8. Conclusions
BioBoost was concentrated on all components of a full bio-fuel value chain. Substantial progress has been achieved in all areas in terms of technology improvement, methodology development and knowledge gained. The intense cooperation of academic and industrial participants proved to be a very fruitful approach. The results show that, in spite of substantial progress, the maturity of the conversion pathway concepts and, accordingly, business plans are not ready for direct market implementation. Some technical and business challenges remain. Further exploitation of the three process chains considered require additional efforts:
The FP chain has a high maturity and has been proven in MW size. However challenges are the concept of preparing an industrially feasible biosyncrude from flexible feedstock in de-central plants of small to medium size requiring suitable transport means to central large scale gasification thus profiting from economy of scale. Also the further conversion by gasification and fuel or chemical synthesis is not state of the art today, even though a variety of pilot and demonstration plants exist.
In the CP chain maturity is in an early stage and technical risks like coking of catalysts in long-term operation need to be further investigated. However the concept of producing a high quality CP oil, making use of conventional transport means and its subsequent treatment in several process steps including by-product extraction and hydrotreating, is promising in terms of products and costs. This bioenergy carrier pathway need to be further investigated using larger quantities of CP oil to proof the subsequent steps of the value chain.
The HTC coal has a unique selling point as a solid energy carrier prepared from wet wastes and residues. Further investigation on feedstock cost development, safe transport modes and on scaling effects in combination with other chemicals production is needed. Also the combustion behaviour for heat and power production needs adaption of burner and boiler systems based on additional testing.
The results of the logistic modelling and optimisation of the value chain leads to the following conclusions:
The developed model allows investigation and optimisation of fuel production from feedstock supply at field, pre-treatment to intermediate energy carriers and central large scale production of fuels in Europe. While the central production step profits from scaling effects these are limited in small or medium size pre-treatment plants. High production costs in de-central pre-treatment plants can only partly compensated by optimized feedstock and energy carrier logistic.
In BioBoost the creation of the model and the validation of data and operation needed longer time than planned only some scenarios could be performed in the BioBoost project. The investigation of much more scenarios is still to come.
Cost of transportation fuel production via FP, CP and HTC is higher than today’s market prices of fossil counterparts. GHG savings would be 80-90 %. However the first few million tons could profit from low cost feedstock supply, optimized locations and

Executive Summary - Conclusions 31
capacities of new built pre-treatment plants and the use of spare plant capacity in refineries regarding hydrogen availability. Combined with regulations on GHG avoidance for transportation fuel like in Germany the fuels produced are competitive to other fuel blending options like 2G ethanol. Further requirements to reduce CO2 emissions in transport in the future may even support market uptake in the near future.
Results are available online for the public and data can be downloaded by stakeholder and researchers to take up the results achieved. Broad dissemination has taken place via the BioBoost film in 4K quality, the GIS portal and the BioBoost navigator accessible via www.BioBoost.eu.

32 Executive Summary - Conclusions
Beneficiaries of BioBoost
Karlsruhe Institute of Technology (KIT), coordinator
Center for Research and Technology Hellas (CERTH)
AVA-CO2-Forschung GmbH (AVACO2-Forschung)
CHIMAR HELLAS AE (CHIMAR)
EnBW Energie Baden-Württemberg AG (ENBW)
Deutsches Zentrum fuer Luft- und Raumfahrt (DLR), Third party to EnBW
Nederlandse Organisatie voor Toegepast Natuurwetenschppelijk Onderzork – TNO (TNO)
GRACE GmbH & CO KG (GRACE)
Instytut Uprawy Nawozenia I Gleboznawstwa, Panstwowy Instytut Badawczy (IUNG)
FHOOE Forschungs & Entwicklungs GmbH (FHOOE)
Neste Oy (NESTE)
SYNCOM Forschungs- und Entwicklungsberatung GmbH (SYNCOM)
DSM Chemical Technology R&D BV (DSM)
University Stuttgart (USTUTT)

Executive Summary - Conclusions 33
The authors
Nicolaus Dahmen [email protected] Andrea Kruse [email protected] Andreas Niebel [email protected] Angelos Lappas [email protected] Chrysa Michailof [email protected] Gilbert Anderer [email protected] Hugo Balcazar [email protected] Stepan Kusche [email protected] Electra Papadopoulou [email protected] Eleftheria Athanassiadou [email protected] Heike Grüner [email protected] Leonhard Walz [email protected] Klaus Peter Geigle [email protected] Jasper Grohmann [email protected] Esther Hagen [email protected] Ileana Hernandez Mireles [email protected] Arjan van Horrsen [email protected] Toon van Harmelen [email protected] Christoph M. Fougret [email protected] Edgar Jordan [email protected] Magdalena Borzecka-Walker [email protected] Rafal Pudelko [email protected] Gerald Schönwetter [email protected] Erik Pitzer [email protected] Gabriel Kronberger [email protected] Steven Gust [email protected] Marina Lindblad [email protected] Kathrin Ludewig [email protected] Simon Kühner [email protected] Klaus Lenz [email protected] Barthel Engendahl [email protected] Katarina Babic [email protected] Jörg Maier [email protected] Manoj Paneru [email protected]

34 Executive Summary - Conclusions