Executive Remuneration Emerging Trends S H A N G H A I · TOTAL COMPENSATION FRAMEWORK TYPICAL...
23
© MERCER 2019 0 Executive Remuneration – Emerging Trends SHANGHAI MERCER GLOBAL HR CONFERENCES SEPTEMBER 18-19 Calvin Chen Head of Executive Remuneration Mercer China [email protected]
Transcript of Executive Remuneration Emerging Trends S H A N G H A I · TOTAL COMPENSATION FRAMEWORK TYPICAL...

© MERCER 2019 0
Executive Remuneration –
Emerging Trends
S H A N G H A I
M E R C E R G L O B A L H R C O N F E R E N C E S
SEPTEMBER 18-19
Calvin Chen
Head of Executive Remuneration
Mercer China

© MERCER 2019 1
Global ER Trends
© MERCER 2019 2
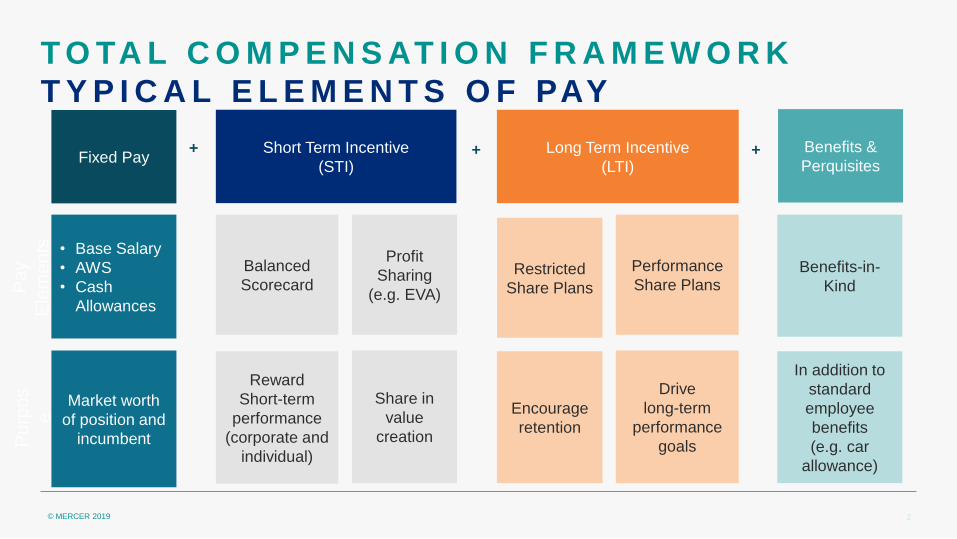
T O TA L C O M P E N S AT I O N F R A M E W O R K
T Y P I C A L E L E M E N T S O F PAY
Fixed Pay Short Term Incentive
(STI)
Long Term Incentive
(LTI)
Benefits &
Perquisites
• Base Salary
• AWS
• Cash
Allowances
Balanced
Scorecard
Profit
Sharing
(e.g. EVA)
Benefits-in-
Kind
Market worth
of position and
incumbent
Reward
Short-term
performance
(corporate and
individual)
Share in
value
creation
Encourage
retention
Drive
long-term
performance
goals
In addition to
standard
employee
benefits
(e.g. car
allowance)
Restricted
Share Plans
Performance
Share Plans
+ + +
Pa
y
Ele
me
nts
P
urp
os
e

© MERCER 2019 3
E X E C U T I V E R E M U N E R A T I O N
G L O B A L T R E N D S
Pay Opportunity Constant – The maximum earning opportunity in US
and European markets has broadly remained constant in the last 5
years but actual payouts (realized pay) have actually declined in the
past 3 years for CEO’s – broadly flat for other executives.
Strategic KPI Usage – TSR usage has flattened out and non-
GAAP metrics (e.g. FCF, adjusted EPS, EBIT) are becoming
more common – both in prevalence and weightage. ESG
measures (carbon emissions, workforce diversity, cybersecurity)
are increasingly being used as well.
Workforce Relativity – Disclosures of CEO to median
employee pay and gender pay gaps in organisations being
mandated to address public concerns around pay inequity
Shareholding Requirements – Post-vesting holding periods (typically
2 years) and higher shareholding requirements (3-5 times of salary for
CEOs) are becoming increasingly common

© MERCER 2019 4
S & P 5 0 0 : V E H I C L E U S A G E
S T O C K I S T H E M O S T P R E VA L E N T
V E H I C L E S A M O N G S & P 5 0 0 C O M PA N I E S .
16.1% 18.6% 19.9% 22.3% 25.9% 30.7% 34.6% 37.9% 34.7% 37.9% 40.9% 16.8% 13.0% 10.7% 8.1%
6.8% 5.1%
4.3% 3.3% 1.5%
1.8% 1.4%
63.5% 66.1% 66.5% 67.5% 65.5% 62.3% 59.6% 57.4% 62.9% 58.3% 55.6%
3.6% 2.3% 2.9% 2.1% 1.8% 1.9% 1.5% 1.4% 0.9% 2.0% 2.1%
0%
20%
40%
60%
80%
100%
2007 2008 2009 2010 2011 2012 2013 2014 2015 2016 2017
Stock Options Both Neither
Source: Mercer, Equilar

© MERCER 2019 5
S & P 5 0 0 : K P I F O R LT I P L A N
T S R I S T H E M O S T P R E VA L E N T K P I F O R
LT I P L A N
46%
24%
18%
TSR EPS/NetIncome
Revenue
All Industry
47%
25% 21%
TSR Revenue OperatingIncome
High-tech
Source: Mercer, Equilar
37% 35%
30%
TSR Revenue EPS
Consumer

© MERCER 2019 6
A - S H A R E : V E H I C L E U S A G E
R S I S S T I L L T H E D O M I N A N T V E H I C L E • Though has its own pitfalls, RS is still a very popular vehicle in A-Share. An increasing number of
companies are buying-back shares as the source of equity to implement RS plan.
3.33%
20.00%
16.67%
60.00%
Options to RS
RS to Optioins
Keep using Options
Keep using RS
74% 74% 78% 69%
24% 24% 21% 31%
1% 1% 0% 0%
2015 2016 2017 2018
RS Options SAR
Vehicle usage for Companies implementing LTI plan
in 2017 and 2018 A-Share LTI Vehicle(2015-2018)
Source: Mercer
© MERCER 2019 7
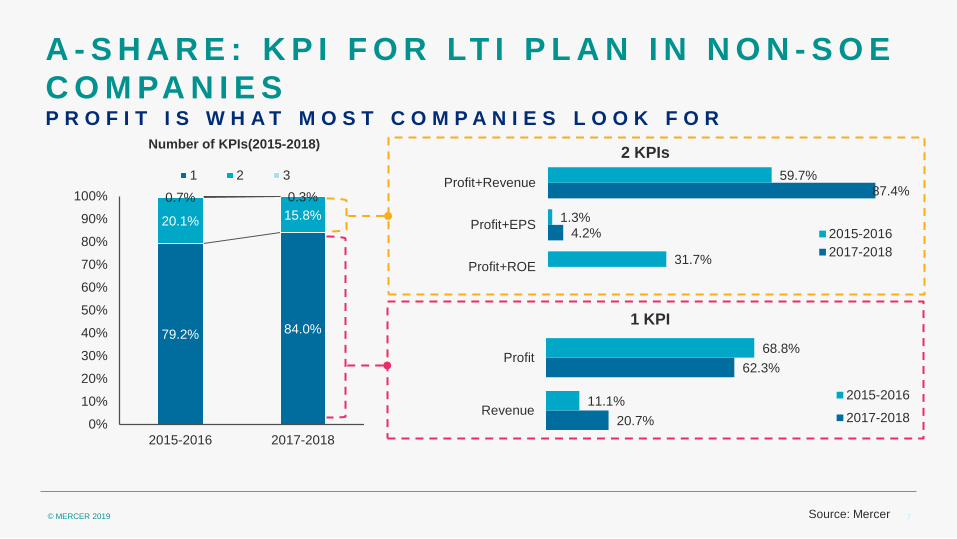
79.2% 84.0%
20.1% 15.8%
0.7% 0.3%
0%
10%
20%
30%
40%
50%
60%
70%
80%
90%
100%
2015-2016 2017-2018
1 2 3
A - S H A R E : K P I F O R LT I P L A N I N N O N - S O E
C O M PA N I E S P R O F I T I S W H A T M O S T C O M P A N I E S L O O K F O R
Number of KPIs(2015-2018)
4.2%
87.4%
31.7%
1.3%
59.7%
Profit+ROE
Profit+EPS
Profit+Revenue
2 KPIs
2015-2016
2017-2018
20.7%
62.3%
11.1%
68.8%
Revenue
Profit
1 KPI
2015-2016
2017-2018
Source: Mercer

© MERCER 2019 8
E X E C U T I V E R E M U N E R A T I O N
L O N G T E R M I N C E N T I V E S – D O T H E Y D E L I V E R ?
LTI plans allow firms to tie in organizational objectives with executive performance and then allow for sustained long term value creation and better returns for
shareholders.
GROW TH RATE NET INCOME (14-18)
Firms with LTI Plan(s) 12%
Firms without any LTI Plans 3%
(N=100)
GROW TH RATE ROCE (14-18)
Firms with LTI Plan(s) 3%
Firms without any LTI Plans -1%
Dividend Yield (14-18)

© MERCER 2019 9
What’s Different In China
© MERCER 2019 10
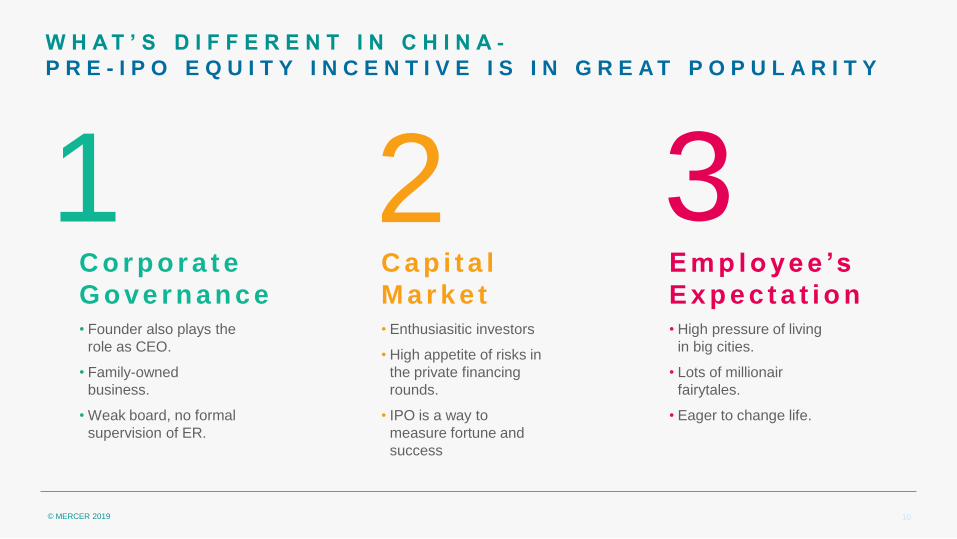
W H A T ’ S D I F F E R E N T I N C H I N A -
P R E - I P O E Q U I T Y I N C E N T I V E I S I N G R E A T P O P U L A R I T Y
• Founder also plays the
role as CEO.
• Family-owned
business.
• Weak board, no formal
supervision of ER.
C o r p o r a t e
G o ve r n a n c e
1 • Enthusiasitic investors
• High appetite of risks in
the private financing
rounds.
• IPO is a way to
measure fortune and
success
C a p i t a l
M a r k e t
2 • High pressure of living
in big cities.
• Lots of millionair
fairytales.
• Eager to change life.
E m p l o ye e ’s
E x p e c t a t i o n
3

© MERCER 2019 11
LT I V E H I C L E S F O R P R I VAT E C O M PA N I E S
I N C H I N A • For the 35 high-tech companies listed in U.S. 71% of them are using options as their
vehicles
71%
37%
6%
23%
Option
RS
Others
No LTI plan
Source: Company filings

© MERCER 2019 12
K E Y C O N S I D E R AT I O N S W H E N C H O O S I N G O P T I O N S
• Legal structure
• Local law compliance
Legal
• Income tax implication
• Possible tax
deduction(No. 101)
Tax
• Measure the
contribution
• Fair and easy to
manage.
Business
• Don’t have to make
No.37 registration.
FX
© MERCER 2019 13
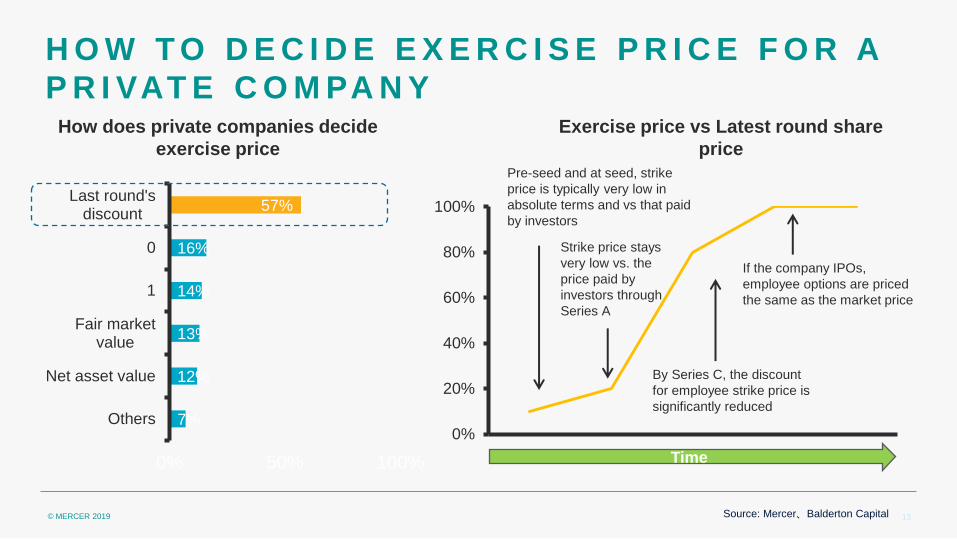
H O W T O D E C I D E E X E R C I S E P R I C E F O R A
P R I VAT E C O M PA N Y
7%
12%
13%
14%
16%
57%
0% 50% 100%
Others
Net asset value
Fair marketvalue
1
0
Last round'sdiscount
Source: Mercer、Balderton Capital
0%
20%
40%
60%
80%
100%
How does private companies decide
exercise price
Exercise price vs Latest round share
price
Pre-seed and at seed, strike
price is typically very low in
absolute terms and vs that paid
by investors
Strike price stays
very low vs. the
price paid by
investors through
Series A
By Series C, the discount
for employee strike price is
significantly reduced
If the company IPOs,
employee options are priced
the same as the market price
Time

© MERCER 2019 14
34.9%
100.0%
85.2%
71.6% 66.0%
43.3%
0%
20%
40%
60%
80%
100%
PA R T I C I PAT I O N R AT E
3 5 % O F T H E T O TA L E M P L O Y E E W I L L
PA R T I C I PAT E I N T H E P R E - I P O I N C E N T I V E
P L A N
Source: Mercer
COMPANY OVERALL CEO VP MID MANAGEMENT PROFESSIONALS
(TECH)
PROFESSIONALS
(NON-TECH)
75%ile
50%ile
25%ile

© MERCER 2019 15
Effective Long Term
Incentive (LTI) Design
Considerations

© MERCER 2019 16
L O N G T E R M I N C E N T I V E P L A N O B J E C T I V E S
A D I F F I C U L T B A L A N C I N G A C T
Organisation Perspective Employee Perspective
EFFECTIVE INCENTIVE PLAN
Performance Linkage
Retention
Shareholder Alignment
Affordability
Achievability
Sizeable Award
Ability to Influence
Fair & Simple

© MERCER 2019 17
K E Y L T I P L A N D E S I G N C O N S I D E R A T I O N S
T H O U S A N D S O F D E S I G N C O M B I N A T I O N S
Objectives Performance
Eligibility
Award Size
Plan Type
Performance
Measurement
Plan Mechanics
Grant Frequency
Exercising
Accounting/ Tax
Retention Market
Competitiveness
Shareholder
Alignment
Top Executives only Top Executives &
Mid Management All Employees Key Talent
Market Aligned Desired Pay-Mix Internally Consistent
Performance Shares Restricted Shares Stock Options Cash Plan
KPI Targets Peer Comparison Share Price Movement
High/Low Leverage Wide/Narrow Performance
Range Capped/ Uncapped
Annually Discretionary Periodically One-time Only
Shares Cash All at once Deferred over time
Total Cost Company/ Individual
Tax Accrual Time Adjustment Provisions

© MERCER 2019 18
A W A R D S I Z E D E T E R M I N A T I O N - M A R K E T B E N C H M A R K I N G
K E Y D E C I S I O N C R I T E R I A
Business Size
Industry
Geography
Disclosure
Proposed Peer Group
Financials (i.e. Revenue, Market Cap) between 50% - 200% of that of your company
Companies operating in a similar or related sector
Companies that have a similar regional/global presence and scope
Organisations with sufficient details of executive pay in public disclosures
Select between 10-15 Companies that meet these criteria to compose the peer group
No peer group is perfect as no two businesses are the same. But using the filters below, select a peer group that resembles your talent market as closely as
possible
Outcome? Pay-mix compared to Market Target Total Compensation Position

© MERCER 2019 19
T Y P E S O F L O N G - T E R M I N C E N T I V E P L A N S
Business objectives Stock Options/SARs Restricted Shares Performance Shares Long-term Cash/ Bonus
Deferral
Align employees’ and
shareholders’ interest
Staff retention
Increase Shareholders’ Value
Minimize share dilution Good Average Poor
High Upside Retention key Performance led No Shares
No Dilution Concern Dilution concern Direct Linkage b/w
Performance & Reward
Managed Cost (budget
set aside)
Difficulty in KPI Selection/
Target Setting
Difficulty in KPI Selection/
Target Setting
Clarity in Key Business
Drivers & Forecasts
Can be performance
related or retention led
Shareholder Aligned Simplicity desired Shareholder Aligned
Plan Suitability
© MERCER 2019 20
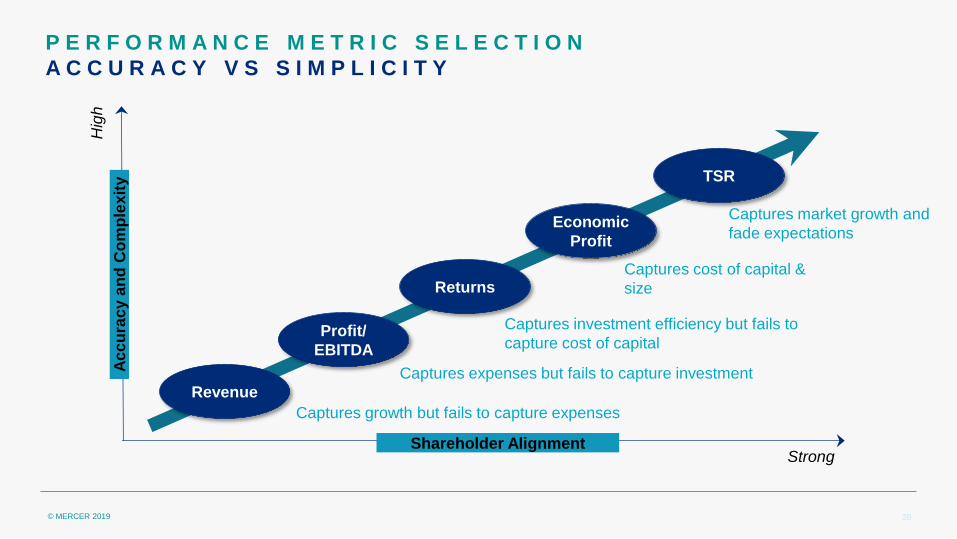
P E R F O R M A N C E M E T R I C S E L E C T I O N
A C C U R A C Y V S S I M P L I C I T Y
Strong Shareholder Alignment
Ac
cu
rac
y a
nd
Co
mp
lex
ity
Revenue
Economic
Profit
TSR
Profit/
EBITDA
Returns
Captures growth but fails to capture expenses
Captures expenses but fails to capture investment
Captures investment efficiency but fails to
capture cost of capital
Captures cost of capital &
size
Captures market growth and
fade expectations
Hig
h

© MERCER 2019 21
D E T E R M I N I N G R I G H T K P I S ’ A N D T A R G E T S
E V I D E N C E B A S E D D E C I S I O N M A K I N G
KPI SELECTION – KEY TESTS
L E A D V S L A G
I N D I C A T O R
B U S I N E S S S T R A T E G Y
A L I G N M E N T
V A L U E D R I V E R
A N A L Y S I S
P E R F O R M A N C E
S E N S I T I V I T Y A N A L Y S I S
TARGET SETTING – KEY TESTS
H I S T O R I C
P E R F O R M A N C E
M A N A G E M E N T
F O R E C A S T S
H I S T O R I C P E E R
P E R F O R M A N C E A N A L Y S T S F O R E C A S T S

© MERCER 2019 22


![TZ PUBLIC SERVICE PAY AND INCENTIVE POLICY.[1] · PDF filePUBLIC SERVICE PAY AND INCENTIVE POLICY ... 1.3 The Medium Term Pay Policy ... To adopt a compensation structure where allowances](https://static.fdocuments.us/doc/165x107/5ab933e67f8b9ac10d8de8de/tz-public-service-pay-and-incentive-policy1-service-pay-and-incentive-policy.jpg)