Executive directors - PwC · ethics of pay Regulatory, trends & ... Proposed regulations by the...
82
Executive directors Practices and remuneration trends report 7th edition, July 2015, South Africa www.pwc.co.za
-
Upload
nguyendien -
Category
Documents
-
view
218 -
download
0
Transcript of Executive directors - PwC · ethics of pay Regulatory, trends & ... Proposed regulations by the...

Executive directorsPractices and remuneration trends report
7th edition, July 2015, South Africa
www.pwc.co.za

7th edition: July 2015
Executive summary
Executive directors: Practices and remuneration trend report
Executive summary Managing shareholder activism
Diversity: The gender agenda
Remuneration trends in other African countries
Profile of an executive director
AppendicesThe psychology of incentives
Executive directors’ total guaranteed package: JSE trends
Executive directors’ total short-term incentives: JSE trends
Information
The economics and ethics of pay
Regulatory, trends & reporting overview
Living wage versus minimum wage
Aligning a company’s purpose and sustainable capital with remuneration: Cyber security
Evolving role of company secretaries
1 18
34
65
2
24 38
76
5
27
40
14
31
43 62

17th edition: July 2015
Executive summary
Executive directors: Practices and remuneration trend report
1. Executive summary
Gerald Seegers Director
It gives us great pleasure to share the seventh edition of the Executive Directors – Practices and remuneration trends report: South Africa 2015 with all our clients and boardroom members. In this edition we continue our discussion of the importance of aligning an organisation’s purpose with executive remuneration, which we initiated in our 2014 report. This year we also focus on the number one agenda item of almost all boards, namely cyber security.
Our research on key trends in executive remuneration continues. Pay equity was on the agenda last year, and we examine it further this year and introduce some deeper debate around living wage versus minimum wage. The focus on executive remuneration is coming from all angles, including regulators, and from a position of what many would argue is simply moral best practice.
The importance of pay-for-performance is recognised by CEOs and is high on their agenda. Remuneration policies are constantly being revisited as organisations and their remuneration committees strive to strike a balance between executive remuneration and stakeholder satisfaction.
At our cut-off date of 30 April 2015 there were 355 active JSE-listed companies with a combined market capitalisation of R11 926 trillion. Industrials lead the pack with 39.8% of the total. It is interesting to note that only 36 companies account for 80% of market capitalisation.
This year only six basic resource companies find themselves among the large-caps. Last year there were 11, one of which has since been delisted. This movement in market capitalisation from large to medium level has created a seismic shift in levels of median remuneration paid in 2014 as against 2013.
In PwC’s 18th Annual Global CEO Survey, released in January, more than 1 300 business leaders in 77 countries shared their views on a range of issues impacting their organisations. The most significant of these are growth, competition, technology, partnerships and diversity. Our analysis touches on some of these findings as we look for the link between these strategic issues and executives’ remuneration.
For the first time this year we extend our analysis to seven other African stock exchanges and observe some interesting trends around executive remuneration across the continent.

27th edition: July 2015
2. Information
Executive directors: Practices and remuneration trend report
2. Information
Sources of information
The data set out in this publication has been drawn from information publicly available for the 12-month reporting period ended 30 April 2015. Information was extracted from the annual reports of 355 (2014: 354) companies listed on the Johannesburg Securities Exchange (JSE), which had a total market capitalisation of R11.9 trillion rand (2014: R10.6 trillion).
We have excluded those companies that have either delisted or have been suspended during the reporting period. To avoid double accounting we have excluded those companies listed with preferential shares. However, included are active AltX companies, which account for a market capitalisation of R47 billion (2014: R23.7 billion).
As at our cut-off date of 30 April 2015, industrials led the pack with 39.8% of the total market capitalisation, followed by financials 22.9%, basic resources 18.9%, services 18% and AltX 0.4%.
i
It is interesting to note that only 36 companies account for 80% of the market’s investment. Large caps hold 82%, medium caps 13% and small caps 5%. The top 100 companies comprising large and medium caps account for 95% of the total JSE-listed invested capital.
During this reporting period, only six basic resources companies were listed as large caps on the JSE. Last year there were 11, one of which has since delisted.
Figure 2.1 Market capitalisation by sector
0,4%
18,9%
22,9%39,8%
18%
Basicresources
Finance
Industrial
Services
AltX

37th edition: July 2015
2. Information
Executive directors: Practices and remuneration trend report
Format of information and definitions
Remuneration levels rarely follow a normal distribution curve – rather, these levels tend to fluctuate. For this reason, we have used a quartile/percentile range rather than giving averages and standard deviations that assume normality.
These quartiles/percentiles are defined as:
• Lower quartile (25th percentile): 75% of the sample earn more than this level and 25% earn less;
• Median (50th percentile): 50% of the sample earn more than this level and 50% of the sample earn less; and
• Upper quartile (75th percentile): 25% of the sample earn more than this level and 75% earn less.
Since the introduction of this annual publication in June 2009, we have held that there is no direct correlation between market capitalisation and the remuneration of executive directors. However, we believe that market capitalisation gives a good indication of size and complexity and is an appropriate metric to set peer groups and for benchmarking purposes. It is against this backdrop that data is analysed.
The market capitalisation breakpoints are:
• Large cap: the top 40 JSE-listed companies;
• Medium cap: 41 to 100 of the JSE-listed companies; and
• Small cap: 101 to 355 of the JSE-listed companies.
As the box and whisker chart in Figure 2.2 shows, outliers are excluded in both maximum and minimum values.
Figure 2.2 Percentile classifications used in this report
Maximum Greatest value,excluding outliers
Upper Quartile 25% ofdata greater than this value
Median 50% of data is greaterthan this value: middle ofdataset
Lower Quartile 25% of datais less than this value
Minimum Least value,excluding outliers
Outlier Less than 1/5times the lower quartile
Outlier More than 1/5times the upper quartile
Terms used in this publication
• Total guaranteed package (TGP) – refers to all components of remuneration that are guaranteed, including base salary and benefits that typically accrue on a monthly basis (retirement, medical, travel allowance, etc.).
• Short-term incentive (STI) – refers to all cash-based payments that are paid to an individual based on company and individual performance for a 12-month period. STI differs from the target STI, which is reflective of the company’s policy regarding the potential STI earnings.
• Long-term incentive (LTI) – refers to all cash and equity-based awards that accrue to an individual based on company performance over a period longer than 12 months.
• Variable pay – refers to short-term incentives and long-term incentives.
• Share gain – refers to gains earned on LTI.

47th edition: July 2015
2. Information
Executive directors: Practices and remuneration trend report
The Johannesburg Securities Exchange
For the fourth year in succession, the JSE was ranked first among 144 countries in the World Economic Forum’s (WEF) Global Competitiveness Report for the effectiveness of its regulation and supervision.
To underline this achievement the following rankings in 2014-2015 (2013-2014) are of interest:
17 (7)Brazil
58 (63)China
62 (27)India
UnitedKingdom
25 (24)
91 (102)
RussianFederation
30 (30)United States
Stock exchanges can play an important role in promoting corporate sustainability reporting. By incorporating sustainability disclosure requirements into listing standards, stock exchanges can create a strong incentive for companies to measure and publicly disclose their sustainability performance to the market.
Some stock exchanges have carved out an early leadership position on this front. Exchanges such as the BM&FBOVESPA (Brazil), the Johannesburg Stock Exchange (South Africa) and the Bombay Stock Exchange (India) have taken concrete steps to
Figure 2.3 Number of companies listed on the JSE, 2005-2014
Source: PwC analysis
2005 2006 2007 2008 2009 2010 2011 2012 2013 2014
373389
411 411396
383 373 358 354 355
encourage sustainability reporting among their listed companies. Moreover, 23 exchanges – at least eight of which belong to the World Federation of Exchanges (WFE) – have joined the Sustainable Stock Exchanges, a United Nations initiative aimed at exploring how stock exchanges can enhance corporate transparency.
Through its conscientious application of King III governance principles and reporting requirements, the JSE has been the driving force behind the achievement of excellence in reporting reflected in the integrated annual reports of many locally listed companies.

57th edition: July 2015
3. Regulatory trends and reporting overview
Executive directors: Practices and remuneration trend report
3. Regulatory, trends & reporting overview
In this section we look at international regulations from the United States and the European Union. We also focus on local regulation in the financial services sector and discuss emerging executive remuneration trends and reporting observations in South Africa.
United StatesDodd-Frank Act: Proposed regulations by the Securities Exchange Commission
Disclosure of hedging by employees, officers and directorsThe United States Securities and Exchange Commission (SEC) released proposed amendments to its rules on 9 February 2015 regarding disclosure required of hedging by employees, officers and directors in the United States under Section 955 of the Dodd-Frank Wall Street Reform and Consumer Protection Act (Dodd-Frank Act).1 This will add to the existing disclosures required in terms of Item 402(b) (which requires disclosure in the Compensation Discussion and Analysis of any issuer policies regarding hedging the economic risk of stock ownership, if material).
1 Securities and Exchange Commission release no. 33-9723, available at http://www.sec.gov/rules/proposed/2015/33-9723.pdf, accessed on 29 April 2015.
The proposed disclosure would be contained in a proxy statement or information statement relating to the election of directors, and the requirement would apply to registered investment companies listed on one of the US national securities exchanges as well as to smaller reporting companies and emerging growth companies.
Hedging is defined in section 14(j) as the “purchase of financial instruments intended to offset decreases in the market value of equity securities (such as prepaid variable forward contracts, equity swaps, collars and exchange funds)”. The proposed rules would also require disclosure of transactions with ‘economic consequences’ comparable to the purchase of the specified financial instruments. As such, all policies relating to transactions that establish downside protection would have to be disclosed.
The salient features of this hedging disclosure requirement are compared to the prohibition on hedging detailed in the European Banking Authority (EBA) consultation paper on sound remuneration practices2 in Figure 3.1. The primary difference between the provisions is that the Dodd-Frank
2 European Banking Authority Consultation paper on draft guidelines on sound remuneration practices, available at http://www.eba.europa.eu/documents/10180/1002374/EBA-CP-2015-03+%28CP+on+GLs+on+Sound+Remuneration+Policies%29.pdf, accessed on 08.05.2015.

67th edition: July 2015
3. Regulatory trends and reporting overview
Executive directors: Practices and remuneration trend report
amendments seek to impose the disclosure of hedging (but not to prohibit hedging itself), while the EBA consultation paper seeks to introduce provisions that will prohibit hedging against equity securities.
Comparison of provisions surrounding hedging of variable pay – SEC proposed regulation vs EBA consultation paper
Dodd-Frank Act: proposed regulation by SEC EBA consultation paper on remuneration policies
Provision
Section 955 of the Dodd-Frank Act does not disallow hedging and does not prescribe that companies should adopt policies prohibiting hedging; but it prescribes disclosure so as to allow shareholders to take appropriate action on whether directors should be allowed to hedge equity securities granted to the director or board member as compensation.
Institutions should ensure that staff members are not able to transfer the downside risks of variable remuneration to another party through hedging or certain types of insurance, e.g. by implementing policies for dealing in financial instruments and disclosure requirements [this arises from CRDIV Article 94(1)(p)].
Reasoning
The SEC has interpreted the statutory purpose of Section 14(j) of the Exchange Act as being to “provide transparency to shareholders if action is to be taken with respect to the election of directors, about whether employees or directors are permitted to engage in transactions that mitigate or avoid the incentive alignment associated with equity ownership”. The proposed rules attempt to introduce a ‘principles-based’ approach to allow for this purpose to be better fulfilled.
A remuneration policy should be sufficiently aligned with risk to allow for a downward adjustment in the level of variable remuneration awarded to staff, and the application of malus and clawback arrangements. This demonstrates the emphasis the guidelines place on risk alignment as opposed to shareholder alignment.
Applicability
Section 14(j) requires disclosure with respect to any “employee or member of the board of directors of the issuer, or any designee of such employee or member”. The proposed rules clarify that the term employee also includes officers.
CRD IV Article 94(1)(p) is applicable to ‘Identified Staff’ but is recommended to be made applicable to all staff.
Further detail
The proposal would require the disclosure of whether any employee or director of a company (going beyond the current requirement pertaining to executive officers) or any designee is permitted to purchase financial instruments (including prepaid variable forward contracts, equity swaps, collars and exchange funds) that are designed to hedge or offset any decrease in the market value of equity securities, and transactions with economic consequences comparable to the purchase of the specified financial instruments.
The equity securities in question would encompass equity securities granted as compensation or otherwise held from whatever source acquired.
Hedging includes circumstances in which a staff member enters a contract with a third party, and the contract requires the third party to make a payment (directly or indirectly) to the staff member that is linked to the amount by which the staff member’s variable remuneration has been reduced.
The prohibition on hedging applies to both deferred and variable remuneration.

77th edition: July 2015
3. Regulatory trends and reporting overview
Executive directors: Practices and remuneration trend report
Currently, the Compensation Discussion and Analysis (CD&A) requires registrants to provide an explanation of all material elements of the registrant’s compensation of named officers. The proposed disclosure will, according to the SEC, supplement the discussion in the CD&A on executive compensation in the company, as well as help shareholders evaluate the directors’ oversight of this area. The salient features of the proposed ‘pay for performance’ disclosure are set out in Figure 3.2.
Figure 3.2 Salient features of proposed ‘pay for performance’ disclosure
The scope of the proposed changes is broad and their efficacy is considered debatable.
Othermeasures
Othermeasures
Disclosure Submissionof data
CalculationBackground
• A graphic may be included in addition to, but not in lieu of, the Summary Compensation Table.• Other measures of performance may also be disclosed (which may be more appropriate to the company) along with TSR, as long as it is clearly defined, not misleading and not presented with greater prominence than the required disclosure.
• SEC-registered companies must disclose in a clear manner the relationship between executive compensation actually paid and the financial performance of the registrant. The proposed disclosure would be contained in proxy or information statements in which disclosure of executive compensation is required.
• The proposed regulation will require a company to provide a clear description of the relationship between executive compensation actually paid to the named executive officers and the cumulative total shareholder return (TSR) of the company; and the relationship between the company’s TSR and the TSR of a peer group chosen by the company, over each of the company’s five most recently completed financial years.• Disclosure must also be in line with plain language principles. • Executive compensation would be presented separately for the principal executive officer, and as an average for the remaining named executive officers identified in the summary table.
• The executive compensation actually paid must be modified to included amounts paid for pension benefits and equity awards. It excludes changes in actuarial present value of benefits under defined benefit and actuarial pension plans that are not attributable to the applicable year of service, and to include the value of equity awards at vesting rather than when granted. • This will include all compensation actually paid, regardless of whether the compensation is based on the registrant’s financial performance. The compensation calculation would include above-market or preferential earnings on deferred compensation that is not tax-qualified because these amounts represent compensation accrued during the relevant year.• It also takes into account any change in the value of the stock and dividends of the company and any distributions.
• The manner of disclosure required is also prescribed in the proposed regulation, and is meant to standardise disclosure for ease of comparison across companies.• The table would include the executive compensation actually paid, TSR for the company and TSR for the selected peer group.• The information itself is to be submitted to the SEC electronically in order to minimise the cost to companies and permit faster data analysis and comparisons between companies.
Pay versus performance: Disclosure of executive compensation versus financial performance of the companyThe SEC also released proposed amendments to its rules in April 2015 requiring the clear disclosure of actual executive compensation paid versus the financial performance of the company.
In South Africa, the King III Remuneration Practice Notes recommend the following:
“To align shareholders’ and executives’ interests, vesting of share incentive awards should be conditional on achieving performance conditions. Such performance measures and the reasons for selecting them should be fully disclosed. They should be linked to factors enhancing shareholder value, and require strong levels of overall corporate performance… (our emphasis).”
The obvious difference between the proposed rule and King III is that the former is binding on companies falling within its ambit, and the latter is non-binding on South African companies. The SEC’s proposals are also more far-reaching, as detailed below.
At the moment, for the purposes of the non-binding advisory vote on executive remuneration, there is no requirement that the relationship between executive compensation actually paid and the financial performance of the registrant company (i.e. listed company on any US-based stock exchange) be disclosed.

87th edition: July 2015
3. Regulatory trends and reporting overview
Executive directors: Practices and remuneration trend report
European Union
EBA Consultation Paper: Sound Remuneration PoliciesThe EBA issued a consultation paper in March 2015 on sound remuneration policies in terms of Capital Requirements Directive IV (CRD IV).3 At this stage it is unclear how much of this consultation paper will translate into the guidelines, which are expected to be published towards the end of the year.
The guidelines, once published, will apply to all institutions and competent authorities. The guidelines aim to establish consistent, efficient and effective supervisory practices within the European Union. The guidelines contain requirements on remuneration policies (and the implementation thereof) for all staff as well as identified staff. Specific guidelines are provided for institutions that benefit from government intervention.
Some of the most striking features of the proposed guidelines are set out below.
Remuneration policies on fixed and variable remuneration are required to be transparent; and the development of a remuneration policy needs to ensure that appropriate performance or risk management tools are used, and contracts between employees and institutions are consistent with the policy.
3 Directive 2013/36/EU of the European Parliament and of the Council of une fficial ournal of the uropean nion - .
Remuneration policies must be included in the institution’s capital and liquidity planning in order to assist it to maintain a sound capital base and protect the liquidity of the organisation. This is an even stronger requirement for companies receiving state aid and government support, which must also ensure that the remuneration policy assists the recovery of the organisation.
In accordance with CRD IV, the remuneration requirements must be applied within subsidiaries that are not subject to CRD IV, and the remuneration policies must comply with additional requirements set within national company, labour and other relevant laws.
The guidelines clarify that for companies with subsidiaries outside of the European Union, the ratio of fixed to variable remuneration must be put to shareholders in the non-Member State country. They also state that where a subsidiary has a head office situated outside of the European Union, the subsidiary is still subject to CRD IV prescriptions relating to remuneration.
Regarding the application of the remuneration guidelines, the principles are applied to smaller institutions on a proportionate basis, according to the institution’s size, internal organisation and nature, and scope, and the complexity of its activities. However, smaller institutions are not exempt.
The guidelines set out the defined components of remuneration; but in light of the fact that much media coverage has focused on how executives have allegedly used allowances as a means of avoiding the bonus cap, this aspect will be specifically addressed.4
It is worth noting that the draft guidelines state that in order to ensure sound risk alignment of variable remuneration, staff members should not be able to transfer the downside risk through hedging or insurance.
Institutions are also called upon to justify the use of any variable remuneration instrument, including allowances, retention bonuses, guaranteed variable remuneration and severance payments.
A summary of some of the salient features of the guidelines is set out in Figure 3.3.
4 “EU accuses big banks of dodging bonus cap” I-Net Bridge 2014 available at http://lexis.hosted.inet.co.za/inews/news/story/197dd58d-edc1-452c-ba22-64708a5dd843/withrelated/4 accessed on 09.09.2014.

97th edition: July 2015
3. Regulatory trends and reporting overview
Executive directors: Practices and remuneration trend report
Figure 3.3 Salient features of proposed guidelines
Proportionality
Ex post riskadjustments malus
and clawback
Shareholderinvolvement
Allowances
Capital base
EBA proposedguidelines: Sound
RemunerationPractices
• efinitions for fixed remuneration, variable remuneration and long-term incentive plans are included.
• The guidelines reaffirm that institutions and competent authorities should ensure that the award, pay-out and vesting of variable remuneration, including the application of malus and clawback arrangements under the institution’s remuneration policy are not detrimental to maintaining a sound capital base. • pecific measures apply to institutions that do not have a sound capital base.
• Institutions are obligated to analyse allowances and allocate them to the variable or fixed component of remuneration. here allowances are considered as fixed remuneration, but show certain features, the reason for identifying them as fixed remuneration should be fully set out.
• x post risk ad ustments should always be related to performance or risk and should respond to the actual risk outcomes or changes to persisting risks inherent in the activities of the institution, business line or staff. • Information disclosed on the link between pay and performance must include the main performance ob ectives, the scope of staff for whom variable remuneration is foreseen in the remuneration policy, and how variable remuneration reacts to performance changes of the institution.
• here the approval of an institution’s remuneration policy has to be tabled before a shareholders’ meeting for a vote, whether binding or non-binding, specific information relating to the remuneration arrangements must be included.• hen approving a higher maximum ratio of fixed to variable remuneration for the organisation, a detailed recommendation with specific detail is required.
• The proportionality exercise is performed once the organisation has identified the staff in the categories of I , e.g. control staff. • The provisions are then applied in a manner and to the extent that it is appropriate, taking into account the institution’s si e and internal organisation and the nature, scope and complexity of its activities. • The fixed to variable remuneration ratio, however, is not sub ect to the proportionality principle.

107th edition: July 2015
3. Regulatory trends and reporting overview
Executive directors: Practices and remuneration trend report
South AfricaFinancial Sector Regulation Bill (“Bill”)The Financial Sector Regulation Bill aims to import the principles of the Twin Peaks system into the South African context.5 According to the National Treasury Response and Explanatory Document:
The Twin Peaks system is a comprehensive and complete system for regulating the financial services sector. It aims to ensure better outcomes for financial customers and the wider economy, by ensuring that customers are treated fairly and that their funds are protected against the risk of financial institutions failing, and by reducing the risk of taxpayer funds being used to protect the economy from systemic failures. Twin Peaks places equal focus on prudential and market conduct supervision by creating dedicated authorities responsible for each of these objectives. It also places a separate focus on financial stability.
5 Twin Peaks in South Africa: Response and Explanatory Document – accompanying the second draft of the Financial Sector Regulation Bill National Treasury, 2014 available at http://www.treasury.gov.za/public%20comments/FSR2014/2014%2012%2012%20Response%20document.pdf, accessed on 05.06.2015.
One of the Bill’s stated objectives is to create a unitary regulatory system for the financial services sector – current regulation has an industry focus, and many of the large financial services companies offer a range of services that bisect different industries. The system will focus on the fairness, efficiency and integrity of services related to the provision of financial products, and look at the way in which financial products are sold, represented, administered and traded.
Remuneration, rewards and incentives in relation to the provision of financial products, financial services, market infrastructures or payment systems, including remuneration payable to persons that promote, market, distribute or provide access to financial products.
Once effective, the Bill will bring into effect a comprehensive regulatory system with two main aims:
• To strengthen the financial safety and soundness of financial institutions by creating a dedicated Prudential Authority (PA); and
• To better protect financial customers and ensure that they are treated fairly by financial institutions by creating a dedicated market conduct authority – the Financial Sector Conduct Authority (FSCA).
Emerging local remuneration trendsThe following section illustrates some of the major emerging remuneration trends we have observed among the JSE Top 40 listed companies.
Malus and clawback provisions
Not many companies have implemented malus provisions as an ex-ante risk adjustment over their executive pay. Where present, the malus provisions are usually imposed over executives’ short-term incentives, deferred bonus awards and long-term incentives. From what we have observed, the trigger events for malus are often the same as or very similar to those prescribed for clawback.
Some companies have implemented an ex post risk adjustment through imposing clawback provisions over their executive pay. As with malus provisions, many remuneration committees have reserved the discretion to exercise clawback where necessary for unforeseen circumstances that would merit its application.
It is difficult to determine why clawback is more prevalent amongst companies than malus (perhaps it is based on the more popular nomenclature of clawback), but it is possible that clawback is both wider in scope (encompassing circumstances which do not necessarily involve the purposeful conduct of the executive) and less accusatory than malus provisions.

117th edition: July 2015
3. Regulatory trends and reporting overview
Executive directors: Practices and remuneration trend report
Our survey of the Top 40 companies’ most recent annual reports revealed no evidence of either malus or clawback being applied by any of the companies in the most recent financial year.
The most common malus and clawback trigger events found among the top 40 companies are set out in Figure 3.4.
Figure 3.4 Common trigger events for malus and clawback (in order of prevalence)
The order of prevalence of the trigger events outlined in Figure 3.4 does not necessarily indicate the importance of one trigger event over another – but may be indicative of some of the Top 40 companies’ priorities in relation to the risk management of executive pay. Furthermore, some of the trigger events are interlinked – for example, gross misconduct by an executive could foreseeably cause harm to the company’s reputation.
In addition to the most common trigger events outlined here, some companies have also left it to the discretion of the remuneration committee to apply malus/clawback under any circumstances that may arise that would merit the application of the provisions to incentive awards. This reservation of discretion is understandable, due to the number of unanticipated circumstances that may arise.
1. Material misstatement of the financial results of the company
. ross misconduct, incompetence or negligence
. arm to the company’s reputation
. material failure of risk management by the company, any group company or business unit
1. Material misstatement of the financial statements of a group company
. ross misconduct, fraud or dishonesty, or material breach of obligations to the company
. roup or business unit suffers a material failure of risk management
. oor individual, business group performance
Malus Clawback
Minimum shareholding guidelinesOur full observations on current trends in minimum shareholding guidelines have been covered in the 2015 edition of PwC’s Non-executive Directors: Practices and Remuneration Trends Report.6 Many executives own shares in their own companies, through the accumulation of share awards that vest in terms of incentive schemes. Our research indicates that more companies are adopting this approach in order to align the interests of their executives with those of their shareholders over time.
The EBA consultation paper discussed above states that where companies have applied a shareholding requirement for some categories of identified staff (i.e. staff whose professional activities have a material impact on the risk profile of the company) in order to achieve a better alignment of the incentives provided to staff with the risk profile of the institution in the long term, the amount should be clearly documented in the institution’s policies. Where a shareholding requirement is applied, staff should have to hold a certain number of shares or a number amount of shares as long as they are employed in the same position or a position of similar or higher authority.
Remuneration reporting trendsDisclosure of remuneration in a company’s annual report is an essential part of the integrated reporting process and forms an important part of a remuneration committee’s strategy to engage with stakeholders, as well as to account for its setting and implementation of the remuneration policy.
6 PwC Non-executive Directors: Practices and Remuneration Trends Report. 6th ed (2015) PwC South Africa.

127th edition: July 2015
3. Regulatory trends and reporting overview
Executive directors: Practices and remuneration trend report
It is expected that South African regulations mandating certain disclosures will become more prescriptive over the next few years, and companies that do not follow good disclosure practices may be faced with challenges relating to change management when the inevitable mandatory disclosure requirements arise.
In the section below we briefly examine some of the current and emerging trends we have observed regarding disclosure of executive remuneration among the Top 40 companies.
The internal wage gap debateIn our 2014 publication7, we dedicated a chapter to examining in detail the economics and ethics of pay and the wage gap debate in South Africa. This year, we have observed that within the JSE Top 40 companies, many have addressed the internal wage gap in one form or another.
Rather than reducing executive pay which, as explained in our 2014 edition, may result in an exodus of executive talent from the country, companies have elected to address the wage gap by mitigating the average base salary increases for executives and increasing the salary increase percentages for management and general staff.
Some companies have explicitly acknowledged the relevance of the internal wage gap debate to their companies, by comparing the percentage increases of base pay for their executive directors to those for their general staff, or staff falling within a collective bargaining unit. These companies have taken a 7 PwC Executive Directors’ Remuneration: Practices and Trends Report
6th ed (2014).PwC South Africa
conscious decision to ensure that the increases for general staff exceed those for executive directors. Others still have elected not to make any explicit statements regarding the internal wage gap debate, but have nevertheless sought to make the comparison.
We also observed that some companies have made base pay increases for their executive directors that have exceeded similar increases made to base pay for general staff. Where this was done, however, it was substantiated on the basis that their benchmarking results indicated that the executive directors’ remuneration (and in some instances, the increases made for individual executives) fell below the market median, and the company had remedied the situation by aligning the pay levels of their executives with the market.
Some companies’ CEOs had foregone salary increases entirely in order to demonstrate their commitment to addressing the internal wage gap. Other companies had not taken a conscious decision to award lower base pay increases for their executives as compared to their general staff; but in the list of factors taken into account when increasing executive pay, they took into consideration the increases made across the company on a broader level.
Emergence of a two-part remuneration reportEmerging global and local reporting practice has seen remuneration reports being split into two parts, with the first part articulating the company’s reward policy for the year going forward (and thus being ‘forward looking’), and the second part disclosing the implementation of the policies for the relevant financial year (and thus considered ‘backward looking’).
This manner of remuneration reporting has been encouraged and welcomed by stakeholders, as it produces a remuneration report that is easy to understand and that aligns with the intention of King III – allowing the remuneration report on which the non-binding shareholder vote is sought to be clearly discernible from past practice in the financial year being reported on within the annual report. Although the majority of Top 40 companies currently do not segment the report in two parts, we have seen a definite increase in this trend, and expect this practice to continue to grow.
137th edition: July 2015
3. Regulatory trends and reporting overview
Executive directors: Practices and remuneration trend report
The link between strategy and remunerationIntegrated reporting has become an entrenched standard in South Africa – but not all aspects of integrated reporting have been fully adopted within annual reports that are presented as ‘integrated reports’. In particular, the remuneration reports of the Top 40 companies surveyed, we observed that companies have been slow to introduce discussion surrounding the linking of business strategy to their remuneration policies and practices.
In addition, the reasons for the selection of performance measures for both short- and long-term incentives are often not disclosed, leaving some shareholders with doubts as to how deeply their remuneration committee understands the strategic objectives that are important to the success of the company, and how to drive these objectives by means of variable incentives.
Disclosure of short-term incentivesExpectations of transparency surrounding the operation of short-term incentives continue to increase at a rapid rate. The vast majority of South African companies are still lacking in their short-term incentive (STI) disclosures relating to executive directors and prescribed officers within their annual remuneration reports.
With behaviour driven by large STI payments touted as a significant cause of the 2008 financial crisis, the focus on bonuses, particularly in the financial services industry, continues – giving birth to demands for short-term incentive processes and policies to be robust and fair.
Our research revealed that most companies lack robust STI disclosure, with most remuneration reports providing only a brief explanation of the STI and eligibility to participate, and a mention of the applicable performance conditions.
Emolument disclosureThe emolument tables are often the most scrutinised part of the remuneration report. As a result of increased scrutiny of executive remuneration, shareholders expect to find all the relevant information pertaining to executive remuneration in the remuneration report and to be able to put a single value on all the remuneration earned (salary, annual bonus and long-term incentives) during the year.
Although we have observed an increasing trend amongst Top 40 companies to disclose the emolument tables in the remuneration report – in addition to disclosure within the annual financial statements – the overall level of long-term incentives (LTI) disclosure is not yet on par with global standards.
In addition, the full value of LTIs in particular is often only fully disclosed for departing executives, leaving many shareholders and the public with large discontent. Further, share gains realised by executives are often quoted out of context by the media without regard to the fact that such gains might relate to a several years’ awards that have all been realised in a particular year. For these reasons, we anticipate that the level of LTI disclosure will continue to improve in future.
147th edition: July 2015
4. Aligning a company’s purpose and sustainable capital with remuneration: Cyber security
Executive directors: Practices and remuneration trend report
4. Aligning a company’s purpose and sustainable capital with remuneration: Cyber security
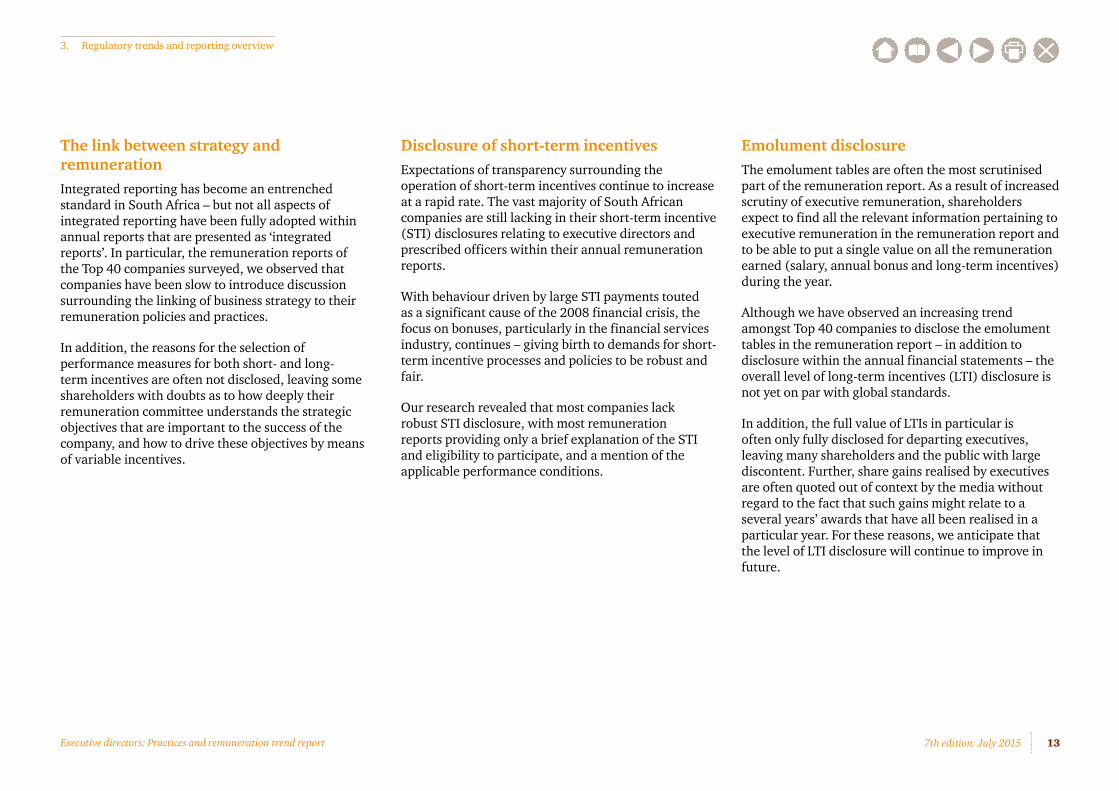
In the previous edition of this publication, released in July 2014, we looked at financial capital and natural capital as the defining factors that will determine the dual performance metrics of future boards and executives. In time, they will also determine executive remuneration.
The new widescreen version of business is heralding a paradigm shift in how stakeholders view organisations. Our 2014 edition ventilated the importance of sustainable capital, and further editorial in our publication dealing with non-executive directors, released in January 2015, carried the subject further under the heading ‘Environmental and social investing’.
Defending and improving the human environment for present and future generations is now an imperative. Climate change is not a far-off problem. It is happening now and is having very real consequences on people’s lives and national economies. But there is a growing recognition that affordable, scalable solutions are available now that will enable us all to leapfrog to cleaner, more resilient economies.
Added to this reality is the challenge for business leaders to satisfy the often conflicting demands of shareholders (short-term profits) and the demands for long-term sustainability in the business environment.
New, unfamiliar choices face boards of directors. Many companies are just pulling out of the worst recession since the 1930s, and just as new strategies offer a firm grip with better solutions, executives are now warned, “not so fast, consider natural capital before your next move”.
PwC’s 18th Annual Global CEO Survey identified a number of rapidly evolving megatrends that are reshaping the world and business:
• Technological breakthroughs;
• Demographic shifts;
• Shifts in global economic power;
• Urbanisation; and
• Resource scarcity and climate change
157th edition: July 2015
4. Aligning a company’s purpose and sustainable capital with remuneration: Cyber security
Executive directors: Practices and remuneration trend report
Of these, technology was identified by 81% of global CEOs as the trend likely to transform their businesses most over the next five years. CEOs recognise that technology is now core to their business and has revolutionised how customers perceive value. This has seen organisations begin to reconfigure their operating models and even their business models, as digital technology has become critical to their operations.
Access to information has, in turn, transformed how customers perceive value and the type of relationships they want to have with organisations. Digital convergence and the growth of mobile technology have become more strategically important for customer engagement in many organisations than any other digital tool.
Data analytics, meanwhile, has transformed the ability of organisations to access, analyse and circulate information about their customers, and use that information to create the type of relationships that their customers want.
“....... Technology also plays a key role, in terms of customer behaviours, competition levels and changes in distribution. In recent years, the traditional financial services arena has been upended by new entrants in the form of supermarkets and digital payments providers such as Apple Pay”
– PwC’s 18th Annual Global CEO Survey 2015
But while many organisations are embracing digital technologies to enhance their businesses, this comes with added risk. In the remainder of this chapter we explore cyber security, which we understand to be a top agenda item in many if not most boardrooms. As the threat of cybercrime poses significant risks to the performance of almost every organisation, few would disagree that the ramifications of this should reach as far as executive remuneration. Should this not find its way onto the executive’s remuneration scorecard?
Cyber securityDataThere is an abundance of data being collected from every person, voluntarily and involuntarily, with and without their knowledge. This data is a valuable marketable commodity. Every activity is monitored, constantly used and recycled back into big data to be used again. Can search engines predict an outbreak of the flu? Sure they can. Can a car detect that a thief is behind the wheel? Yes, it can. Can biometric headphones plugged into a smartphone measure a wearer’s heart rate? You bet.
As technology advances, directors need to be conscious of the risk to their companies, especially where employees may casually, or for business purposes, discuss company strategy. Wearable devices such as eyeglasses and smartwatches are going mainstream and will increasingly be showing up in the work environment. Millions of these devices will flood the digital market this year, adding a new dimension to company policies, with bring-your-own-device (BYOD) rules being expanded to cover wear-your-own-device (WYOD) functionality.
The emerging frontier of wearable devices brings all-new streams of data online. But these devices also bring new security risks to their owners and their employers. Alert hackers may be able to effortlessly see directly into corporate offices and view sensitive data on computer screens using digital eyeglasses, or simply hack into an employee’s new smartwatch.
Cyber threatsThese are real security risks, which need to be addressed at board level and be high on the audit or risk committee’s risk matrix as well as being effectively dealt with at an operational level. Failure to achieve this can result in senior executives paying the ultimate penalty, as the example of US retailer Target, discussed later in this chapter, shows.
Today, business depends on digitised information. The security of data driving all business is at risk. Data in the digital age is not limited to financial institutions, but is deeply embedded into every facet of business endeavour, no matter what sector companies operate in. The technology drivers are many. From the ubiquitous smartphone in almost every hand to the humble PC on a clerk’s desk, to the conference call or video conference beamed from the boardroom to anywhere in the world: all are driven by binary bits and bytes.
Digitisation is data and data is vulnerable. In this world of digital convergence and connectivity, nothing is safe from outside tampering or tracking. The risks are growing, particularly cyber-hacking, and this only adds to the pressure on boards and the decisions they make around risk.

167th edition: July 2015
4. Aligning a company’s purpose and sustainable capital with remuneration: Cyber security
Executive directors: Practices and remuneration trend report
Figure 4.1 Current levels of connectivity
Sources: US.Gov; UK.Gov: dhs.gov/office-cyber-infrastructure-analysis; www.europol.europa.eu; ec.europa.eu/digital-agenda/en/cybersecurity; ICSS 2015: Cyber Security And Forensic Readiness
Directors need to understand the threat that connectivity poses to their companies. Cyber malfeasance is not limited to individual hackers in dark attics, although these are vastly active. The characters in this global drama include nation-states, transnational organised crime groups, foreign intelligence services, military personnel, state-sponsored proxy fighters, disgruntled insiders and others.
31%41% 11% 9% 8%
Business/ manufacturing
Real-time big data analytics of supply chains and equipment; and Robotic and CNC machinery
Health care
Portable health monitoring, electronic recordkeeping, pharmaceutical safeguards
Retail
Inventory tracking, electronic purchasing (including smartphones) barcode anonymous analytics of consumer choices
Security
Biometric and facial recognition locks, CCTV, remote censors and clandestine monitoring
Transport & logistics
GPS locators, self-parking cars, driverless highways
It is the responsibility of the board of directors to demand information and insight on cyber security issues and how they could affect the future of the organisation. The exponential growth in cybercrime demands that boards become more knowledgeable and pose strategic and thoughtful questions towards management and risk functions such as internal audit.
Cyber threats have increased markedly and are likely to become even more prominent in the wake of the recent high-profile attacks on entertainment networks. The rapid pace of technological change – seen as a challenge by 58% of CEOs – is also highlighting a shortage of key skills that could imperil growth.
– Dennis M. Nally, PwC Global CEO, PwC’s 18th Annual Global CEO Survey
Identities are stolen, online bank accounts are siphoned dry, and computer servers are wiped clean. To date, no computer has been created that cannot be hacked, a sobering fact given our radical dependence on these machines for everything from air traffic control to personal internet banking to the click of the camera on a smartphone – all interconnected and all vulnerable.

177th edition: July 2015
4. Aligning a company’s purpose and sustainable capital with remuneration: Cyber security
Executive directors: Practices and remuneration trend report
Cost of cyber attacksCaptains of legitimate industry need to understand that the faceless onslaught they face is successful and sustainable because it is structured and the perpetrators have a technological edge. It’s also big business. The United Nations estimates that transnational organised crime makes at least US$2 trillion (20% of global GDP in 2011) a year in profits.8
Of this, cybercrime is one of the biggest money-spinners9.
8 In total isha lenny, c afia ourney Through the lobal Criminal Underworld” (New York: Vintage Books, 2009).
9 rime is big business nited ations ffice on rugs and rimes , stimating Illicit lows esulting from rug Trafficking and
Other Transnational Organised Crimes” 7 October 2011.
Figure 4.2 Costs associated with cyberattacks on global companies in 2014
Source: Ponemon Institute: Hewlett-Packard (HP Enterprise Security)
1%
38%
35%
22%
4%
Businessdisruption
Informationloss
Revenueloss
Equipmentdamages
Other costs
i
virus
Given the scale of the opportunities and threats posed by connectivity in the digital world, there is a strong argument for cyber security to find its way onto executives’ remuneration scorecards, either directly or indirectly.
Target CEO departure watershed for IT, business alignmentLarry Dignan, ‘Target CEO departure watershed for IT, business alignment’, ZDNet, May 5, 2014, http://www.zdnet.com/article/target-ceo-departure-watershed-for-it-business-alignment/ (accessed 12 June 2015).
The exit of Target CEO Gregg Steinhafel can largely be attributed to a massive IT failure. The lesson: IT is your business now and the two functions are intertwined and aligned.
Target CEO Gregg Steinhafel’s departure from the retailer following a massive data breach that damaged the company’s reputation could be a watershed moment for information technology and business alignment.
Simply put, IT is your business and massive failures even cost the big dogs their jobs. Technology execs have worried about business alignment forever. Stop worrying because business and IT are aligned. If IT blows up – or 110 million customer accounts are breached – so does the business.
While Target’s statement thanked Steinhafel and noted that he took the company through “unprecedented challenges” such as the financial recession, proxy battles and the company’s 2013 data breach, it’s fairly clear that the last crisis cost the CEO his job. Steinhafel “held himself personally responsible” for the breach, said Target.
In other words, sacking CIO Beth Jacob wasn’t enough. And adding Bob DeRodes, a long-time IT veteran, CIO wasn’t going to be enough. Steinhafel’s departure was needed to give Target a clean break. There’s an argument that Target’s response to the data breach was textbook: The company was upfront, transparent and took responsibility and outlined its next steps.
But the response only goes so far. IT failure led to Steinhafel’s departure.
In recent times, it’s hard to recall a corporate chieftain losing a gig over an IT failure. Typically, heads roll over IT failures, but the CEO is usually the one controlling the guillotine.
Steinhafel’s exit may change that equation. IT is so intertwined with business success that the CEO can’t be distanced from technology projects. The key takeaways here break down like this:
• IT is your business.
• Every business is becoming digital.
• Leaders need to know IT and be able to align it with the business.
• Enterprises all run on software and that’s going to restructure industries.
• IT isn’t a cost centre. It’s an ass saver and enabler.
Big data and the ability to use it for competitive advantage will rewrite industries.
Perhaps Steinhafel’s exit is a one-off and not the beginning of a trend. But the business stakes are getting higher and IT is what will choose winners and losers. It’s only common sense that other IT failures will cost more titans of industry their gigs.

187th edition: July 2015
5. Managing shareholder activism
Executive directors: Practices and remuneration trend report
5. Managing shareholder activism
The power balance between shareholders and boards of directors is under significant and increasing strain, with profitability and sustainability seemingly on a collision course. In 2015, we expect to see a greater level of shareholder activism globally, not only in the US and the UK, but also here in South Africa. Time will tell whether this shareholder influence will prove beneficial for corporations, their shareholders and the economy at large.
In the short term, there is reason to question whether increased shareholder influence on matters that the law has traditionally made the responsibility of the board comes at the expense of other values that are essential to the sustainability of corporations10.
10 Forum selection — The Harvard Law School Forum on Corporate Governance and Financial Regulation, http://blogs.law.harvard.edu/corpgov/tag/forum-selection/ (accessed 30 April 2015).
What is shareholder activism?
Shareholder activism occurs when an individual or group of individuals seek to use their rights as owners of a public company to influence its behaviour. Although they do not manage the corporation, they seek to influence management and the board of directors.
There is an increasing shareholder base that is becoming more involved and assertive. This group, including young millennials, would include not only shareholders but also a wider group of stakeholders that have a social and/or environmental agenda.
There is a portion of the owners who are best described as silent – typically these would be individual shareholders who do not bother to vote at AGMs. However, there is also a large portion of the market that sits in the hands of collective investment schemes such as traded funds or pension funds, which may have a more active interest in the management of the corporation.

197th edition: July 2015
5. Managing shareholder activism
Executive directors: Practices and remuneration trend report
While often viewed in a negative light, activists fill the void left by silent shareholders. And they are becoming vigorous. For example, there were 343 US activist campaigns in 2014, the most since 200811.
The purpose of this chapter is to share the insights from our recent PwC US publication so as to provide an overview of a broad spectrum of activism: who the activists are, what they want, when they are likely to approach a company, the tactics most likely to be used and ways that companies can both prepare for and respond to different types of activism12.
Activism spectrum
Shareholders are becoming increasingly active in a number of key areas, with directors juggling dividend demands against the cost of sustainability.
Directors as fiduciaries must act in the best interests of the company and its stakeholders, and must make independent and objective judgments. It is prudent for the board to understand the full range of shareholder concerns and views represented in its constituency.
The board must make its independent judgment and should not defer to the wishes of shareholders without reason. While activist shareholders often bring valuable perspectives to the table, they may demand changes to suit particular special interest groups or press for short-term goals that may not be in the company’s long-term interests.
11 David Benoit, “Activists Are on a Roll”, With More to Come,” The Wall Street Journal, January 1, 2015.
12 PwC US publication March 2015: Shareholder activism: Who, what, when, & how?
Activist efforts fall along a spectrum based on the significance of the desired change and the assertiveness of the investors’ activities. On the most aggressive end of the spectrum is hedge fund activism that seeks a significant change to the company’s strategy, financial structure, management, or board. On the other end of the spectrum are one-on-one engagements between shareholders and companies triggered by the Dodd-Frank Act’s ‘say on pay’ advisory vote.
Hedge fund activism
Say on pay
proposal
Shareholdercampaign
“Vote no”
activ
ism
Hed
ge fu
nd
Hedge fund activism occurs when an investor, usually a hedge fund or other investor aligned with a hedge fund, seeks to effect a significant change in the company’s strategy.
Background
Some activists have been engaged in this type of activity for decades (e.g., Carl Icahn, Nelson Peltz). In the 1980s, activists frequently sought the breakup of the company – hence their frequent characterisation as
corporate raiders. These activists generally used their own money to obtain a large block of the company’s shares and engaged in a proxy contest for control of the board.
In the 1990s, new funds entered this market niche (e.g., Ralph Whitworth’s Relational Investors, Robert Monks’ LENS Fund, John Paulson’s Paulson & Co. and Andrew Shapiro’s Lawndale Capital). These new funds raised money from other investors and used minority board representation (i.e., one or two board seats, rather than a board majority) to influence corporate strategy. While a company breakup was still one of the potential changes sought by these activists, many also sought new executive management, operational efficiencies, or financial restructuring.
Today
During the past decade, the number of activist hedge funds across the globe has dramatically increased, with total assets under management now exceeding $100 billion13. Between 2003 and May 2014, 275 new activist hedge funds were launched14.
Why?
The goals of today’s activist hedge funds are broad, including all of those historically sought, as well as changes that fall within the category of ‘capital allocation strategy’ (e.g., return of large amounts of reserved cash to investors through stock buybacks or dividends, revisions to the company’s acquisition strategy).13 Preqin Special Report: Hedge Fund Activist Report (June 2014),
(available at https://www.preqin.com/docs/reports/Preqin_Special_Report_Activist_Hedge_Funds_June_14.pdf).
14 Ibid.

207th edition: July 2015
5. Managing shareholder activism
Executive directors: Practices and remuneration trend report
‘Vote no’ campaign
Say on pay
proposal
Shareholdercampaign
“Vote no”
activ
ism
Hed
ge fu
nd
Moving down the activism spectrum are ‘vote no’ campaigns in which an investor (or coalition of investors) urges shareholders to withhold their votes from one or more of the board-nominated director candidates.
Why?
These campaigns are rarely successful in forcing an involuntary ouster of a director, because at most companies this would require support from a majority of outstanding shares – not just a majority of the votes cast at the meeting, which is a much lower threshold. But, particularly when the challenged director is not the company’s CEO/chair, a ‘vote no’ campaign can influence the candidate to voluntarily withdraw from the election. If the level of ‘negative’ vote is relatively significant, a director may be replaced during his/her subsequent term.15
15 If a challenged director receives support from less than a majority of the shares voted at the meeting, but still remains a sitting director, other forms of activism may result.
How?
The tactics of the newest activists are also evolving. Many are spending time talking to the company in an effort to negotiate consensus around specific changes intended to unlock value, before pursuing a proxy contest or other more public activities (e.g., media campaign). They may also spend pre-announcement time talking to some of the company’s other shareholders to gauge receptivity to their contemplated changes. Lastly, these activists (along with the companies responding to them) are grappling with the potential impact of high-frequency traders on the identity of the shareholder base that is eligible to vote on proxy matters.
Who?
These campaigns are usually sponsored by public or labour pension funds.16
93%93% received at least 90% shareholder approval
Director support at large-capcompanies
5%5% failed to attain at least 70% shareholder support
2%2% (or 365 directors) failed to get majority support
16 PWC, Broadbridge, ProxyPulse Third Edition 2014, October 2014

217th edition: July 2015
5. Managing shareholder activism
Executive directors: Practices and remuneration trend report
Shareholder proposal
Say on pay
proposal
Shareholdercampaign
“Vote no”
activ
ism
Hed
ge fu
nd
Further down the spectrum is sponsorship of a shareholder proposal (or, more often, the threat of a shareholder proposal)17.
17 Under SEC Rule 14a-8, shareholders holding a minimal amount of stock continuously for a defined period of time may submit a proposal that the company is required to present for a shareholder vote in the company’s annual meeting proxy materials. These proposals must be submitted on a timely basis, may be accompanied by the proponent’s supportive statement (which, together with the proposal itself is subject to a word limitation), and may not pertain to certain topics. These topical exclusions (the most common of which is concerning “the ordinary business” of the company) are the subject of a robust history of SEC staff opinions. Because most corporate actions cannot be effected simply by a shareholder vote, most shareholder proposals are precatory that is, they re ect the shareholders’ recommendation that
the board take the steps necessary to accomplish the desired end.
Why?
The goal of these investors is usually to encourage one of four types of change:
• A change to the board’s governance policies or practices (e.g., declassify the board, adopt majority voting, limit the company’s ability to shift legal fees to unsuccessful shareholder litigants, remove exclusive forum bylaw provisions, provide transparency around succession planning, provide proxy access18), or a change to the board composition (e.g., increase board diversity, name an independent director as chair);
• A change to the company’s executive compensation plans (e.g., a change in vesting terms);
• A change to the company’s oversight of certain functions (e.g., audit, risk management); or
• A change to the company’s behaviour as a corporate citizen (e.g., political spending or lobbying, environmental practices, climate change or resource scarcity preparedness, labour practices).
18 A proxy access shareholder proposal generally asks the board to submit to a shareholder vote a binding bylaw that would enable shareholders who meet specified criteria to nominate director candidates for election to the board and have these nominees and their supporting statements included in the company’s own proxy materials. Proxy access proposals are generally considered to be among the most aggressive of shareholder proposals.
Who?
Shareholder proposals are sponsored by a wide range of different types of investors:
• Governance, executive compensation and risk/audit oversight proposals are usually sponsored by public pension funds, labour pension funds, or individual investors. These investors believe that these changes may promote more effective corporate governance (including more reliable financial reporting), and that good governance enhances shareholder value19.
• Environmental and social proposals are usually sponsored by labour pension funds, ESG-oriented investment managers, religious groups, or coalitions of like-minded investors. These investors believe that these changes may provide broader societal value which also – over the long term – benefits the corporation and all of its stakeholders.
• ‘Shareholder value’ proposals are usually sponsored by hedge funds20 as a component of a more assertive activist campaign.
19 Many academic studies have examined the relationship between certain indicia of good governance and either a company’s financial performance or share price. verall, one can generally find a study to support either a “pro” or “con” position to most aspects of governance. For a discussion of how one governance activist measures the financial impact of its programme, see The hareholder ealth ffect of CalPERS Focus List”, J. of App. Corp. Fin. (Winter 2003), 8-17 (in which the authors found that between 1992 and 2002, publication of CalPERS’ “Focus List” and related efforts to improve the governance of companies on that list generated one-year average cumulative excess returns of 59.4%).
20 As used throughout this chapter, the term “hedge fund” is based on the staff’s definition a fund that is not a mutual fund and thus is not regulated to the same extent as mutual funds) that pools investors’ money and invests it in an effort to earn positive returns; these funds may or may not use “hedging” as a strategy. (See Investor Bulletin: Hedge Funds, available at http://www.sec.gov/investor/alerts/ib_hedgefunds.pdf.) In addition, the hedge funds referred to in this paper typically invest only in publicly traded stocks.

227th edition: July 2015
5. Managing shareholder activism
Executive directors: Practices and remuneration trend report
Say on pay
Say on pay
proposal
Shareholdercampaign
“Vote no”
activ
ism
Hed
ge fu
nd
On the more passive end of the spectrum are investor activities triggered by a company’s ‘say on pay’ advisory vote proxy item21.
These activities are usually limited to letters to a company (typically directed to the compensation committee of the board) or meetings/phone calls with the company (typically involving the company’s general counsel, corporate secretary, and/or compensation committee chair)22.
21 For an overview of the impact of the SEC’s “say on pay” rules, see “Investor Bulletin: Say-on-Pay and Golden Parachute Votes” available at http://www.sec.gov/investor/alerts/sayonpay.pdf.
22 any investors consider the to have a con ict of interest on the topic of executive compensation and prefer not to discuss executive compensation issues with him or her.
Why?
The goal of these conversations is, generally, either to effect a substantive change to the compensation plan, or to alter how it is described in shareholder communications23.
Who?
A wide range of investors participate in this type of activism, including traditional asset managers, mutual funds, pension funds, and individuals. Since ‘say on pay’ is a proxy item presented to all shareholders for an advisory vote, all shareholders who vote generally must form a view about the company’s executive compensation plans. A subset of these voting shareholders may decide to convey these views to the company; doing so generally does not require a significant amount of resources. These investors are particularly likely to do so if they believe the plan does not align pay with performance, contains objectionable features (e.g., certain vesting terms), or utilises inappropriate performance metrics.
23 Sometimes an investor will write a company to ask a question about the compensation plan. Since the purpose of these communications is, generally, to help the investor make its say-on-pay vote decision (and not to effect a change), we do not include this on the activism spectrum.
What can a company do?Board and shareholder dialogue is an important issue. Shareholders, boards, and management have shared interests in promoting both shareholder value and societal trust in the company. It is essential to ensure that regulation does not stifle innovation and robust entrepreneurial activity. This consultation has a long-term sustainability advantage.
In South Africa, shareholder engagement usually follows the post-reporting period, when the integrated annual report has been printed and issued for open discussion. However, the is a growing trend to be more proactive with more roadshows being held throughout the year.
PrepareThere are four key steps that a company and its board should consider so as to properly anticipate, prepare for and respond to an activist campaign.
Critically evaluate all
business lines and market
regions
Monitor the company’s
ownership and understand the
activists
Evaluate the risk factors
Develop an engagement plan tailored to the risks

237th edition: July 2015
5. Managing shareholder activism
Executive directors: Practices and remuneration trend report
RespondIn responding to an activist’s approach, consider the advice that large institutional investors have shared with us: good ideas can come from anyone. While there may be circumstances that call for more defensive responses to an activist’s campaign (e.g. litigation), in general, we believe the most effective response plans have three components:
• Objectively consider the activist’s ideas. By the time an activist first approaches a company, the activist has usually already developed specific proposals for unlocking value at the company and discussed these ideas with other shareholders. The company’s institutional investors generally spend considerable time objectively evaluating activists’ suggestions – and most investors expect that the company’s executives and board to be similarly open-minded and deliberate.
• Look for areas around which to build consensus. In 2013, 72 of the 90 US board seats won by activists were based on voluntary agreements with the company, rather than via a shareholder vote.24 This demonstrates that most targeted companies are finding ways to work with activists, avoiding the potentially high costs of proxy contests. Activists are also motivated to reach agreement if possible. If given the option, most activists would prefer to spend as little time as possible to achieve the changes they believe will enhance the value of their investment in the company.
24 FactSet Insight, New York, 11 March 2014.
• Actively engage with the company’s key shareholders to tell the company’s story.25 An activist will likely be engaging with fellow investors, so it’s important that key shareholders also hear from the company’s management and even the board. In the best case, the company already has established a level of credibility with those shareholders upon which new communications can build. If the company does not believe the activist’s proposed changes are in the best long-term interests of the company and its owners, investors will want to know why – and just as importantly, the process the company used to reach this conclusion. If the activist and company are able to reach an agreement, investors will want to hear that the executives and directors embrace the changes as good for the company. Company leaders that are able to demonstrate to investors that they were part of positive changes, rather than simply having changes thrust upon them, enhance investor confidence in their stewardship.
Objectively consider the activist’s ideas
Look for areas around which to build consensus
Actively engage with the company’s key
shareholders to tell the company’s story
25 As part of this outreach to shareholders, companies should also consider engaging with the proxy advisory firms that are most likely to advise shareholders should the activist campaign reach the proxy voting stage. While these communications may help to avoid a negative voting recommendation from these firms, they should not be viewed as a substitute for communicating directly with the company’s shareholders.
When the activism has concluded – the annual meeting is over, changes have been implemented, or the hedge fund has moved its attention to another target – the risk of additional activism doesn’t go away. Depending on how the company has responded to the activism, the significance of any changes, and the perception of the board’s independence and open-mindedness, the company may again be targeted. Incorporating the ‘Prepare’ analysis into the company’s ongoing processes, conducting periodic self-assessments for risk factors, and engaging in a tailored and focused shareholder engagement programme can enhance the company’s resilience and strengthen its long-term relationship with investors.

24Executive directors remuneration: Practices and trends report 7th edition: July 2015
6. The economics and ethics of pay
6. The economics and ethics of pay
Introduction
We introduced this topic in the 2014 edition of this publication, and the response and level of debate generated were significant. In our interactions with many of the remuneration committees of JSE-listed companies the topic is gaining further attention as non-executive directors wrestle with the requirements to attract, engage and retain leadership talent in a competitive market and in a climate in which there is great popular emotion around income inequality.
In the 2014 edition we explored the topics of measuring the pay gap, pay gap multiples in South Africa and developed economies such as the USA and Europe, the Gini co-efficient and the absolute levels of South African CEO pay compared to BRICs and the developed nations. We also explored some of the issues regarding worker pay and benefits, including the need to better understand worker needs and expenditure requirements and the catastrophic impact of garnishee orders on the financial wellness of many workers, and we discussed ideas about how companies can leverage their buying power to the advantage of their employees and communities surrounding their operations.
The conclusions we reached in the 2014 edition were that:
• The pay of the CEO, executive committee and senior management should be treated with restraint, and measures should be taken to ensure packages are reasonable relative to the market, increases are modest, significant focus is placed on the link between pay and performance, and that extremes of pay from inappropriate bonus and share plans are avoided.
• The Gini co-efficient of the employed in South Africa in 2014 was 0.44 compared to the national statistic of 0.65, with the devastating levels of unemployment in our country accounting for the increase of workplace inequality to the national level.
• Reducing unemployment in South Africa is potentially a more compelling social and ethical issue than reducing the pay gap, as it drives inequality, hardship and social tension. Companies and government should bear this in mind when allocating resources to human capital reward and development.
• The financial wellness of entry-level workers and establishing an appropriate level of pay for this group of workers, which aspires to fund a frugal but adequate expenditure level, is an important area of focus, and research that provides an improved understanding of actual expenditure requirements should inform this objective.

25Executive directors remuneration: Practices and trends report 7th edition: July 2015
6. The economics and ethics of pay
• Consideration should be given to benefit programmes provided by organisations that utilise their buying power and the potential for more effective logistics to provide more cost-effective procurement of basic needs for their employees – food, housing, connectivity and education.
• Consideration could be given to the garnishee order crisis for employees.
Economics and ethicsThe underlying impression of ethics is that it is about being kind, agreeable and fair to other people. In economics, the invisible hand is a metaphor used by Adam Smith to describe the unintended social benefits resulting from selfish individual actions.
Ethics and economics have historically had a troubled relationship and as our current challenges confirm, people and corporations do not always act ethically and the invisible hand often seems invisible because it’s not there at all.
Pay equity is an increasingly visible sustainability theme, with tightening rules around workforce and CEO pay disclosure, and greater vigilance regarding excessive CEO compensation.26 The pay gap and pay-for-performance are important ethical concerns for organisations, as they must understand, manage and fulfil the diverse and often conflicting values, interests, and capacities of large numbers of individuals operating within the constraints of limited resources in a particular community.27
26 http://www.world-exchanges.org/insight/views/measuring-sustainability-disclosure-world%E2%80%99s-stock-exchanges
27 The Philosopher’s Beard: Economics for ethics, http://www.philosophersbeard.org/2011/09/economics-for-ethics.html (accessed 22 April 2015).
At first glance, the pay gap may appear inherently unethical. But seen in the light of the supply and demand dynamics that determine prices in a market, its origin is more easily explained by the vast supply of workers and the shortage of highly-skilled management and professionals in the economy. However, given South Africa’s history of economic, social and political disenfranchisement, we also need to understand the current pattern of wages, employment and income within a broader developmental context.
Executive pay trends
Large listed companies continue to exercise caution when considering the pay levels of their CEO and executive committee members. While the average levels of pay remain high relative to workers, and are viewed as excessive by labour and the general public, increases in guaranteed pay have generally remained subdued and are below those granted to workers.
Structurally, the trend towards less volatile and geared long-term incentives (share awards) remains in place28, with share options and share appreciation rights being replaced by restricted shares, bonus shares and performance shares, which provide better alignment with shareholder interests and are more likely to avoid extreme pay-outs.
In the UK and the EU, regulatory changes (CRD IV) in the financial services sector to cap the absolute level of variable pay to 100% of fixed pay (up to 200% with shareholder approval) have also decreased the volatility and maximum earning potential of banking executives. We are seeing the impacts of these 28 PwC Long-Term Incentive Survey, 2013
regulations in South Africa in UK- and European-owned banks such as Barclays Africa, Investec and Mercantile Bank.
The Gini co-efficient of the employed
In the 2014 edition we calculated the Gini co-efficient of the employed in South Africa to be 0.44. This calculation was based on all employees’ data in the PwC RemChannel® salary survey database, which included data for over 830 000 employees. This is much lower than the national statistic, which is quoted at between 0.63 and 0.73, depending on source. The primary reason for the difference between that national figure and our estimate for the employed is the high rate of unemployment in South Africa.
The official rate of unemployment in South Africa in the first quarter of 2015 was 26.1%, with the extended definition of unemployment, which includes discouraged work-seekers, amounting to 36.1%.29
We have updated our calculation of the Gini co-efficient of the employed in South Africa, based on the latest salary data in the PwC RemChannel® salary survey database in March 2015. The figure for this year shows a slight decrease to 0.43, compared to 0.44 in 2014. The reason for the gap between this estimate of inequality among the employed and the national figure remains the high level of unemployment in South Africa.
29 Quarterly Labour Force Survey, Q1 2015, Statistics South Africa.

26Executive directors remuneration: Practices and trends report 7th edition: July 2015
6. The economics and ethics of pay
Education and skills development
Companies continue to spend large sums of money on education and training of their own workforce, on bursaries for their employees’ children and on other deserving young South Africans.
In addition, The National Education Collaboration Trust (NECT) gained traction during the year. This is an organisation dedicated to strengthening partnerships among business, civil society, government and labour in order to achieve the education goals of the National Development Plan.30 Initiatives such as the NECT represent a broader contribution by business, together with other stakeholders, to the broader education issue.
A living wage
The concept of a living wage and the consideration of an appropriate mechanism to establish the principles and practice of determining this pay level (as discussed in the next chapter of this publication) are emerging as a compelling solution to address junior worker pay.
This approach may well offer ethical and economically successful companies a way to determine an appropriate minimum level of payment for junior workers and provide a mechanism for resolving toxic and unproductive disputes over pay between business and labour.
30 The National Education Collaboration Trust, http://nect.org.za/ (accessed 7 June 2015).
Several leading companies are now calculating their own Gini co-efficient and comparing this to the national average as well as industry norms.
Financial wellness and sufficient pay for junior workers
In the year since we first discussed an appropriate focus on the financial wellness of junior workers and ways to sustainably increase their pay levels, many South African companies have been working on practical measures to address these issues.
Several companies have been focussing on the issue of employee garnishee orders, and have reviewed the legal status and the outstanding balances of existing garnishee orders. In many cases they discovered that the orders were either improperly levied or the balances were already paid-up.
We are aware of one large South African banking group that has been focussing on outcomes-based pay at all levels of the organisation, including junior workers. The group is applying the principle that enhanced productivity should be shared with workers, resulting in higher pay than industry norms for those that deliver enhanced productivity. This approach provides a win-win solution in which the ethical objective to pay junior workers a higher level of pay is congruent with the economic imperative to improve efficiencies and productivity.
Conclusion
There are compelling arguments to remain sensitive to income equality, and companies around the world and in South Africa should focus on practical measures to address inequality in an economically sustainable way.
Several leading companies have been following the principles articulated in our 2014 edition on this topic and have been exercising caution in their approach to executive pay and doing their best to increase the minimum level of pay for junior workers. Many leading companies are addressing their workers’ financial wellness and are contributing to the education and skills development for their own employees, and their children. Many companies are also calculating their own Gini co-efficient and understanding how they compare to their industry and the national average.
Our opinion remains that continued restraint in the approach to executive pay, focussing on the financial wellness of junior workers and aspiring to pay at least a ‘living wage’ is a sound strategy. In addition, investing in education and skills development provides a longer-term solution to addressing inequality and economically sustainable prosperity.

277th edition: July 2015
7. Living wage versus minimum wage
Executive directors: Practices and remuneration trend report
7. Living wage versus minimum wage
In previous editions, we have focussed predominantly on executive remuneration with the emphasis being on a ‘fair and equitable level of earnings’ measured against sustainable performance. At the same time, we also expect employers to pay their employees a ‘fair and equitable living wage’. In this chapter, we discuss the concept of a ‘living wage’ and how it has been applied in the UK and elsewhere.
National minimum wage
Many governments publish a national minimum wage, which is a minimum pay expressed as a rate per hour, per day or per month that workers are entitled to by law. It doesn’t matter how small or big the employer is, they still have to pay the minimum rate for their respective class of employee. In the EU, for example, 22 of the 27 member countries have implemented a national minimum wage.
South Africa is considering the introduction of a national minimum wage, but for now its framework for minimum wage regulation is set by the Labour Relations Act (no 66 of 1995) and the Basic Conditions of Employment Act (no 75 of 1997, as amended).
These Acts establish two main mechanisms for wage determination:
• Collective bargaining, including through statutory institutions (bargaining councils); and
• Sectoral determinations that are published by the Minister of Labour and that set minimum wages for an economic sector.
The Labour Relations Act provides the framework within which employees and their trade unions and employers and related organisations can bargain collectively to determine wages and other conditions of employment. The Act also has as one of its purposes the promotion of collective bargaining at a sectoral level.
Wage regulation in South Africa, therefore, takes place through collective bargaining and direct regulation of pay for vulnerable workers via the sectoral determinations. Currently, the average minimum wage is:
• A monthly wage of R2 731.74 across all the private-sector bargaining councils; and
• In the region of R2 362.36 across all the sectoral determinations.
287th edition: July 2015
7. Living wage versus minimum wage
Executive directors: Practices and remuneration trend report
Globally, minimum wage laws apply to all employees in a given jurisdiction regardless of whether they work in the public or private sector. In the UK, the national minimum wage rate depends on a worker’s age and if they are an apprentice, with the top hourly rate of £6.50 being paid to non-apprentices aged 21 and over.31
Living wage
The concept of a living wage has been around for centuries. Adam Smith wrote about it in the 18th century and it is referred to in the Constitution of the International Labor Organization (ILO) of 1919.32
The United Nations Universal Declaration of Human Rights (1948) and the UN International Covenant on Economic and Social Cultural Rights (1966) both recognise the need for workers to receive a living wage.
Living wages raise the minimum hourly rate to a level sufficient for employees to meet their basic living needs. The emphasis is on living costs alone. The ‘living wage’ concept is not only about pay, but also about employees feeling valued. It would apply to all employees serving a company, including contractors, as it is often the lowest-paid jobs, such as cleaning and security, that are contracted out to third-party service providers.
31 https://www.gov.uk/national-minimum-wage/what-is-the-minimum-wage (accessed 4 June 2015).
32 ILO documents referring to minimum/living wage include the ILO Constitution and its preamble, the 2006 ILO Declaration on Principles concerning Multinational Enterprises and Social Policy and the 2008 ILO Declaration on Social Justice for a Fair Globalization.
Job creation is an imperative for South Africa and there is a fear that escalating minimum wage levels would have adverse consequences, particularly in businesses where productivity cannot support higher wage levels.
However, for those already employed, it has been found that productivity and living standards are linked. Financial issues can both increase stress levels and result in employees being distracted at work, impacting engagement, well-being, absenteeism and productivity.
The 2015 results of PwC’s annual Employee Financial Wellness Survey, conducted among employees of all levels across the US, found that 24% of employees admit that personal finances have been a distraction at work. Of those, 39% say they spend three hours or more at work each week thinking about or dealing with issues related to their personal finances.33 Financial stress has a significant impact on both employees and employers. Increased stress can affect morale, health and ultimately an employer’s bottom line. We can only surmise that a similar survey in South Africa would provide even more disturbing results.
Each year, there is much debate around salary increase time and pressure for increases is drawn from the issue of living standards and what can be done to improve them. But continually pushing up wage levels may not be the answer if it is not sustainable.
For some employers, increased wages may only be affordable if there is a commensurate increase in value creation. Paying a ‘living wage’ would be a voluntary decision by an employer to conscientiously pay its 33 w ,’ mployee financial wellness survey’, pril . http www.
pwc.com us en private-company-services publications financial-well-being-retirement-survey.jhtml (accessed 17 June 2015).
employees at this level. It would surely address the pay gap in a more constructive manner if employers were recognised as paying a living wage and this practice became considered not only best practice, but also good governance on which executives were also measured? The idea of paying a living wage could be part of the solution.
For the private sector to remain competitive and attract the best talent, it also has to compete with global employers who are proud to consider themselves as living wage employers.
United Kingdom
The modern UK Living-Wage Campaign was launched by members of London Citizens34 in 2001. The founders were parents in the East End of London who wanted to remain in work, but found that despite working two or more minimum wage jobs they were struggling to make ends meet and were left with no time for family and community life.35
The living-wage campaign is an example of communities, business, campaigners and faith groups coming together to find practical, non-statutory means to address working poverty and strengthen families. The campaign has since grown into a national movement in the UK.
34 www.citizensuk.org.uk.35 History Living Wage Foundation, http://www.livingwage.org.uk/history
(accessed June 04, 2015).

297th edition: July 2015
7. Living wage versus minimum wage
Executive directors: Practices and remuneration trend report
The current UK Living Wage is £7.85 an hour (whereas the current London Living Wage is £9.15 an hour). This was set in 2014, where for London the first approach calculated the rate to be £7.65 while the second approach gave a rate of £8.25 for an average of £7.95. A premium of 15% is then added to cover unforeseen events, giving a living wage of £9.15 an hour. It is of interest to note that the UK minimum wage is 21% less than the living wage. This applies to workers over the age of 21.
Employers choose to pay the ‘living wage’ voluntarily, which is not only seen as good for business, but also good for the employee and good for society.
An independent study examining the business benefits of implementing a living-wage policy in London found that more than 80% of employers believe that the living wage had enhanced the quality of the work of their staff, while absenteeism had fallen by approximately 25%.37
Two-thirds of employers reported a significant positive impact on recruitment and retention within their organisation and 70% felt that the living wage had increased consumer awareness of their organisation’s commitment to be an ethical employer.
Half of employees felt that earning the living wage had made them more willing to implement changes in their working practices; enabled them to require fewer concessions to effect change and made them more likely to adopt changes more quickly.
37 What is the Living Wage? Living Wage Foundation, http://www.livingwage.org.uk/what-living-wage (accessed June 04, 2015).
Local campaigns began emerging across the UK, offering the opportunity to involve many more employers and lift many more thousands of families out of working poverty. Following consultation with campaigners, trade unions, employers who support the living wage and HR specialists, Citizens UK launched the Living Wage Foundation and Living Wage Employer mark.
These initiatives recognise and celebrate the responsible leadership shown by Living-Wage Employers and support employers to incorporate the living wage into their long-term organisational structures.
The living wage is an hourly rate set independently and updated annually for the Foundation by the Centre for Research in Social Policy. It is based on the Minimum Income Standard for the UK and is calculated according to the basic cost of an acceptable standard of living in the UK for nine non-pensioner household types (ranging from single-unit households to couples with four children).
It applies two separate approaches to calculate a ‘poverty threshold wage’. The first, surveys the cost of living in London in order to compute a ‘low-cost but acceptable’ household budget. The second calculates the threshold wage based on London’s income distribution; the threshold is the wage that would allow a household to have an income equivalent to 60% of the median.36
36 The Economist explains: How a living wage is calculated, http://www.economist.com/blogs/economist-explains/2015/04/economist-explains-4 (accessed June 04, 2015).
United States
In May 2015, the Los Angeles City Council voted to raise its minimum wage from $9 an hour to $15 an hour by 2020.38 Washington DC and New York have also proposed increases to $15 an hour. These rates will take the minimum wage rates well above the federal minimum, currently at $7.25 per hour. It is our understanding that this is being promoted and advocated on similar principles to the UK’s Living-Wage Campaign. States may set higher rates, whereas an act of Congress can only increase the national minimum wage.
Aligning a living wage with a company’s purpose
Employers must act responsibly and have a positive socio-economic impact on their employees and the community within which they operate. Executives should be saying, and be heard to be saying, “We care about our employees and about the remuneration they receive.”
In the digital age employers’ behaviour has become more transparent to all stakeholders, both within and outside the organisation, making it more important than ever before that they are living their values as outlined in their vision statements.
38 7 More Cities That Want to Raise the Minimum Wage, http://www.cheatsheet.com personal-finance -more-cities-that-want-to-raise-the- (accessed 4 June 2015).

307th edition: July 2015
7. Living wage versus minimum wage
Executive directors: Practices and remuneration trend report
Benefits to employers who voluntarily take part in a living-wage employer initiative would include:
• Motivated workforce;
• Positive staff morale;
• Productivity increases;
• Lower staff turnover;
• Aspirational workplace; and
• Enhanced brand reputation.

317th edition: July 2015
8. Evolving role of company secretaries
Executive directors: Practices and remuneration trend report
8. Evolving role of company secretaries
We highlighted in our latest Non-executive directors report, released in January 2015, that the role of the company secretary is expanding and greater responsibility than ever is being placed on this function. As mentioned there, perhaps a more befitting title for the role would be ‘governance director’.
In this section we analyse the company secretary’s role and take a closer look at the remuneration paid to people in this function.
Who is the typical company secretary?
A company secretary has a very diverse range of responsibilities and must be able to multitask. They are responsible for ensuring that an organisation complies with standard financial and legal practice and maintains standards of corporate governance. They therefore require an understanding of all statutory requirements for which the directors will be held accountable. Although they are not strictly required to provide legal advice, company secretaries must have a thorough understanding of the laws that affect their areas of work.
The job specification for company secretaries has developed over time. Nowadays, they provide a crucial link between non-executive directors and the business. They are also an important point of communication between the board of directors and company shareholders in particular, and the broader constituency of stakeholders we now see developing around modern businesses.
Company secretaries need to ensure that reporting on company procedures and developments gets done in a timely and accurate manner.
In terms of the Companies Act No. 71 of 2008 (the Act), each company will need to assess whether or not it is required to appoint a company secretary.39 It is a legal obligation for public companies, state-owned companies and companies whose memorandums of incorporation require them to appoint a company secretary.
39 Declaration in terms of the Companies Act No. 71 of 2008 .., http://www.jsereporting.co.za/ar2013/download_pdf/jsr_afs2013.pdf (accessed 23 April 2015).

327th edition: July 2015
8. Evolving role of company secretaries
Executive directors: Practices and remuneration trend report
What are their typical work activities?
A company secretary’s role covers a wide variety of functions, and these depend, in part, on the company for which they work. Typical tasks include:
• Acquainting themselves with their duties under the Act, including the onerous obligation to guide directors as to their functions and responsibilities;
• Organising and preparing agendas for and taking minutes of board meetings and annual general meetings (AGMs);
• Maintaining statutory books, including registers of members and directors;
• Dealing with correspondence, collating information and writing reports and ensuring decisions made are communicated to the relevant company stakeholders;
• Contributing to meeting discussions as and when required and advising members of the legal, governance, accounting and tax functions on the implications of proposed policies;
• Monitoring changes in relevant legislation and the regulatory environment, and taking appropriate action;
• Liaising with external regulators and advisors, such as lawyers and auditors;
• Taking responsibility for the health and safety of employees and managing matters related to insurance and fixed assets; and
• Entering into contractual agreements with suppliers and customers;
• Managing office space and property as well as dealing with personnel administration; and
• Overseeing public relations and some aspects of financial management.
The company secretary’s position is a full-time line position reporting directly to the board of directors. In some cases, this role is outsourced.
Gone are the days when ill-equipped incumbents might be called upon to act as company secretary on an ad hoc basis. It is notable that the responsibilities delegated to the company secretary in many companies can easily be compared to those of a director or prescribed officer.
In many large-cap companies, the role of the company secretary is combined with that of a legal executive. In these cases, the positions receive a higher job grading due to the complexity of the role as well as the overall management of organisational risk. Some of the typical job titles for such a combined role are:
• Group company secretary;
• Head of legal services/company secretary;
• Vice president, general counsel and company secretary; and
• Executive company secretary.
• Developing and overseeing the systems that ensure the company complies with all applicable codes and legal and statutory requirements.
The work of a company secretary in a registered company may be more specialised than in a smaller private company. For example, the liaison role with shareholders and compliance responsibilities may make up a major part of their work and may include matters such as:40
• Maintaining the register of shareholders and monitoring changes in share ownership of the company;
• Ensuring that dividends are paid;
• Managing share incentive schemes; and
• Being involved in share issues, mergers, takeovers and any other aspect concerning ownership of the company.
In small businesses, other duties commonly undertaken may include:
• Monitoring the administration of the company’s retirement scheme;
• Overseeing and renewing insurance cover for employees, equipment and premises;
40 Company secretary: Job description | Prospects.ac.uk, http://www.prospects.ac.uk/company_secretary_job_description.htm (accessed
pril, .

337th edition: July 2015
8. Evolving role of company secretaries
Executive directors: Practices and remuneration trend report
These positions would typically be graded at an E5 and F1 level in the Paterson grading system, if not higher. The remuneration differentials between the pure company secretarial role and the more complex combined legal function demonstrated in the remuneration extract from the REMchannel® online salary survey are shown in the accompanying table.
Spectrum of company secretary remuneration
Guaranteed package (R’000s)
Title Grade LQ M UQ
Company secretary I D2 579 650 805
Company secretary II D5 873
Company secretary III E2
Legal executive II E5/F1
Company secretaries reflected as prescribed officers in annual reports received remuneration in line with REMchannel®’s analysis. Very few company secretaries fall within the ambit of public disclosure requirements for prescribed positions, and the data is limited.
The importance of the company secretary is further confirmed by the levels of variable remuneration awarded to incumbents. At the E2 level the short-term incentives granted to incumbents in the survey range between 22% and 39% of annual guaranteed remuneration. At the E5/F1 levels these variable payments range between 35% and 65% of annual guaranteed compensation.
King III supports an integrated approach to running a sustainable business and reporting on its activities in the context of its broader social, environmental and financial impacts. The King Report on Governance for South Africa 2009 describes sustainability as the “the primary moral and economic imperative of the 21st century”. This holistic approach places a burden on company secretaries that goes way beyond reporting financial and statutory requirements. It is therefore imperative that the company secretaries be adequately resourced to fulfil their broader responsibilities.
Under King III guidelines41 company secretaries are not permitted to be directors. Since 2008, the number of directors acting as company secretaries has diminished by 38%, and the median pay is depicted in Figure 8.1.
It should be noted that board members acting as company secretaries usually have other director responsibilities, some as important as also being CFO.
Figure 8.1 Company secretary guaranteed pay, listed companies
41 ing III came into effect on arch
1 577 1 408 1 716 1 266 1 532 1 645
2008 2009 2010 2011 2012 2013 2014
710
Median

34Executive directors remuneration: Practices and trends report 7th edition: July 2015
9. Diversity: The gender agenda
9. Diversity: The gender agenda
The concept of diversity encompasses acceptance and respect. It means understanding that each individual is unique, and recognising our individual differences. These can be along the dimensions of race, ethnicity, gender, sexual orientation, socio-economic status, age, physical abilities, religious beliefs, political beliefs, or other ideologies. It is the exploration of these differences in a safe, positive, and nurturing environment. It is about understanding each other and moving beyond simple tolerance to embracing and celebrating the rich dimensions of diversity contained within each individual.
– University of Oregon Diversity Initiative

35Executive directors remuneration: Practices and trends report 7th edition: July 2015
9. Diversity: The gender agenda
There are fewer and fewer women at each step along the path to the boardroom. Women represent the majority of entry-level employees in many organisations and outnumber men in college graduation rates.
Figure 9.2 Percentage of tertiary degree qualifications awarded to women
Source: Education at a Glance, OECD indicators 2014
In our analysis of JSE-listed companies only 16% of executive board members were women. The inherent cultural biases that see few women rise to the top are well known.
SaudiArabia
2015
2014
47 44
Saudi Arabia
47 44 47 44
China
55 48 47 44
Korea
56 51
47 44
G20 Average
56 54
47 44
Ireland
55 54 47 44
Australia
58 55
47 44
Brazil
59 55 47 44
Germany
56 57
47 44
OECD Country Average
58 57
47 44
Canada
59 59 47 44
US
60 60
47 44
South Africa
60 61 47 44
Hungary
70 68
47 44
UK
58 58
How high is gender on your agenda?Having paid lip service to the need to broaden representation at senior levels in their organisations for a number of years, recent global surveys confirm that senior management and gender composition in the boardroom have not shifted noticeably.
The results of our analysis of JSE-listed companies underline how much work still needs to be done to achieve equitable gender representation.
Figure 9.2 Gender gap in board membership for JSE-listed companies
Source: PwC analysis
AltX Basic Resources Financial Services Industrial Services
Male Female
85% 15% 81% 14% 79% 17% 81% 19% 82% 15%
Diversity, too, is becoming a crucial quality in the talent pool that CEOs must draw on to compete. Talent diversity and inclusiveness are no longer seen as a soft issue. It’s now a core component of competitiveness – and most CEOs (77%) have adopted, or intend to adopt, a strategy that promotes it.
Dennis M. Nally, Chairman, PricewaterhouseCoopers International Limited: , PwC’s 18th Annual Global CEO Survey, 2015

36Executive directors remuneration: Practices and trends report 7th edition: July 2015
9. Diversity: The gender agenda
Organisations globally are currently challenged by a lack of women in leadership positions, and are fast becoming concerned with the competitive and financial toll this could mean for their organisations. Meanwhile, they are also facing the challenges that come with vast numbers of millennial talent entering and reshaping the workforce.42
To achieve sustainable change the public and private sectors must focus on developing talented junior women now for future leadership roles. Organisations must drive parallel efforts that tackle enhanced leadership diversity in conjunction with systemic change efforts, targeting their workforce from day one. But to get these right, organisations must first better understand how to attract, develop, and retain female millennial talent.
But the gap between what companies should be doing and what they are doing persists. This generation is the most digital and tech-savvy of any generation. PwC’s recent Next Generation Diversity report found an employer’s provision of state-of-the-art technology is relevant to 59% of millennials when considering a job, although, less important to the female (54%) than the male millennial (64%).43 The report also found that 40% of female millennials have a preference for the use of electronic communication instead of the telephone or face-to-face conversations when it comes to communications in the workplace. However, it is important that employers don’t over-emphasise
42 Next Generation Diversity - PricewaterhouseCoopers, http://www.pwc.com/gx/en/women-at-pwc/internationalwomensday/next-gen-diversity-publication.jhtml (accessed 23 April 2015).
43 Next Generation Diversity - PricewaterhouseCoopers, http://www.pwc.com/gx/en/women-at-pwc/internationalwomensday/assets/next-generat (accessed 23 April 2015).
the importance of technology as a communication channel when it comes to performance evaluations, career planning, and compensation. The millennial generation, much like their previous generations, value face-to-face time when it comes to these types of meaningful career conversations.
In 2014, Gallup found that only 24% of women are happy with what they earn at work, compared to 32% of men.44 This was a more general view of the workforce, but what was discovered was that if you break it down by generation, there isn’t much discrepancy between millennials. After controlling for all other factors, there is only a 2-3% difference between male and female pay across all three generations, and that difference is the smallest for Gen Y.45 The gap is going to shrink overall because 36% of the workforce will be millennials by 2016, and that number will continue to rise. As more women are becoming educated and more men leave the workforce, the gap will shrink even more. Millennials are all about equality in every aspect of life and want women and men to be treated the same. For instance, 74% of millennials support same-sex marriage, which is a big reason for legislation being passed in many states in the United States.
In other words, if she was born between 1980 and 1990 and is in line with succession planning, she should be in your company. With this in mind, what are you paying women who are in line to achieve boardroom status or have already done so?
44 The Top 10 Workplace Trends For 2014 - Forbes, http://www.forbes.com/sites/danschawbel/2013/10/24/the-top-10-workplace-trends-f (accessed 23 April 2015).
45 2nd Annual Study on the State of Gen Y Gen X and Baby Boomer .., http://millennialbranding.com/2013/2nd-annual-study-state-gen-gen-baby-boomer-wo (accessed 23 April 2015).
Not only is there a disparity in the number of female board members, there is one in their level of guaranteed pay as well. It is also evident that females in leadership positions decrease dramatically from the Paterson E level and upwards.
Not all females are paid less than their male counterparts, but our analysis shows that the majority of females are remunerated in the lower quartile when considering total guaranteed pay.
To demonstrate this phenomenon the table below, extracted from PwC’s REMchannel® online salary survey, provides the quartile range spread in terms of total guaranteed package and representation of females in leadership positions. If one considers the F upper levels (only 38 are females compared to 306 males) almost half (44%) of the females are paid in the lower quartile whilst only 23% of their male counterparts are paid at this level.
What is equally interesting to note is that the total guaranteed package spread of males in these high-level positions is more equally distributed from a quartile perspective as compared to the female distribution.

37Executive directors remuneration: Practices and trends report 7th edition: July 2015
9. Diversity: The gender agenda
Total guaranteed package remuneration spread by Paterson level, April 2015
E Lower (Market Sample 14 681)
Gender % Distribution within 1st Quartile
% Distribution within 2nd Quartile
% Distribution within 3rd Quartile
% Distribution within 4th Quartile
% Distribution within Total Sample
Male 15.5 18.2 19.3 20.6 73.6
Female 9.5 6.8 5.7 4.4 26.4
E Upper (Market Sample 2 421)
Gender % Distribution within 1st Quartile
% Distribution within 2nd Quartile
% Distribution within 3rd Quartile
% Distribution within 4th Quartile
% Distribution within Total Sample
Male 19.3 20.2 22.2 21.7 83.4
Female 5.8 4.8 2.8 3.3 16.7
F Lower (Market Sample 921)
Gender % Distribution within 1st Quartile
% Distribution within 2nd Quartile
% Distribution within 3rd Quartile
% Distribution within 4th Quartile
% Distribution within Total Sample
Male 20.3 21.4 21.5 21.7 84.9
Female 4.8 3.6 3.5 3.3 15.1
F Upper (Market Sample 344)
Gender % Distribution within 1st Quartile
% Distribution within 2nd Quartile
% Distribution within 3rd Quartile
% Distribution within 4th Quartile
% Distribution within Total Sample
Male 20.1 23 23 23 8.9
Female 4.9 2.1 2.1 2.0 11.1

387th edition: July 2015
10. Pro le of an executive director
Executive directors: Practices and remuneration trend report
10. Profile of an executive director
As at 30 April 2015 there were 1 180 (2014: 1 145) executive directors at JSE-listed companies, an increase of 3.1% on the previous year. When comparing the 2 204 non-executive directors on listed company boards, the ratio of executives to non-executives is in line with the global norm.
Figure 10.1 Headcount of executive directors in JSE-listed companies, 2011-2014
Source: PwC analysis
2011
1,146 1,1511,145
1,024
1,180
2012 2013 20142014 2015

397th edition: July 2015
10. Pro le of an executive director
Executive directors: Practices and remuneration trend report
Figure 10.2 Number of executive directors in JSE-listed companies
Source: PwC analysis
Age profile overall is similar to 2014 and little variation in sectors is observed.
AltX Basic Resources Financial ServicesIndustrial Services
2013: Total 1 024 2014: Total 1 145 2015: Total 1 180
150 206179 349 415357 182 198208 155 156175 188 205226
The median age across all sectors for executive directors is 54 (2014: 54) and the average is also 54 (2014: 54). When using a static sample, such as age over time, job stability is a factor, with the gap between median and average tending to stabilise.
Figure 10.3 Executive directors’ board tenure
Source: PwC analysis, annual financial statements of JSE-listed companies (1994-2014)
Overall CEO CFO ED0
1
2
3
4
5
6
7
Average tenure 5,0 4,5 4,3 6,2
AltX 4,0 3,6 3,0 5,5
Basic resources 5,5 5,1 4,8 6,5
Financial services 5,2 4,4 4,5 6,8
Industrial 5,2 5,0 5,2 5,5
Services 5,0 4,5 4,0 6,5
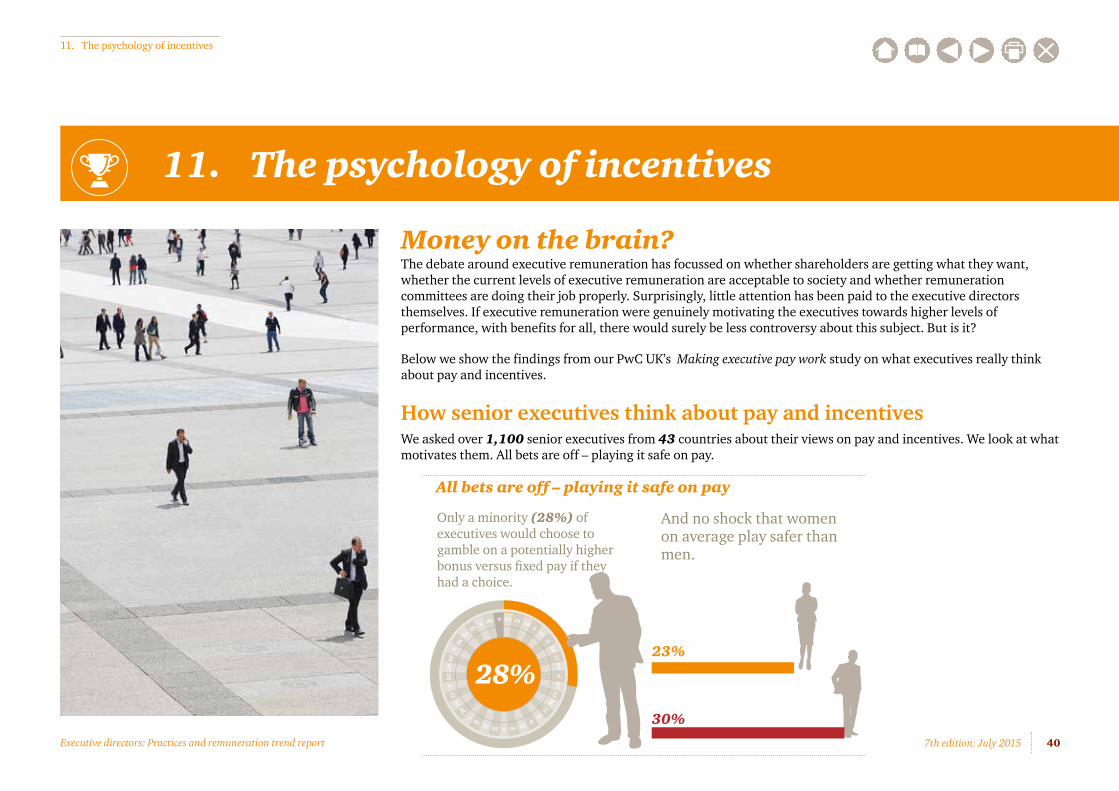
40Executive directors: Practices and remuneration trend report 7th edition: July 2015
11. The psychology of incentives
11. The psychology of incentives
Money on the brain?The debate around executive remuneration has focussed on whether shareholders are getting what they want, whether the current levels of executive remuneration are acceptable to society and whether remuneration committees are doing their job properly. Surprisingly, little attention has been paid to the executive directors themselves. If executive remuneration were genuinely motivating the executives towards higher levels of performance, with benefits for all, there would surely be less controversy about this subject. But is it?
Below we show the findings from our PwC UK’s Making executive pay work study on what executives really think about pay and incentives.
How senior executives think about pay and incentivesWe asked over 1,100 senior executives from 43 countries about their views on pay and incentives. We look at what motivates them. All bets are off – playing it safe on pay.
All bets are off – playing it safe on pay
Only a minority (28%) of executives would choose to gamble on a potentially higher bonus versus xed pay if they had a choice.
And no shock that women on average play safer than men.
26 0 32 15 19 4 21 2 25 17 34
6 2
7 13 36 11 30 8 23 10 5 24 16 33 1
20 14
31
9
22
18
29
7
28 1
2 35 3
28%23%
30%

417th edition: July 2015
11. The psychology of incentives
Executive directors: Practices and remuneration trend report
Complexity and uncertainty are a big turn-off
Two thirds more respondents would prefer a less complex but smaller and more certain reward
51% 27%
$$$
I make more money than you – and that makes mehappy
Cash bonus
Cash bonus
Deferred bonus
Deferred LTIP
LTIP 50%25%
$$
$$
50% of executives felt that getting paid more than their peers was more important than getting paid more in absolute terms
25% felt that a higher payment was more important than the relative payment compared to their peers.
A bird in the hand is worth two in the bush
When there is uncertainty about whether a payment will be received, executives heavily discount the value in their minds. Discounts can equal 50% less incentive pay, and 33% less total compensation.
Salary Cash bonus
Salary Cash bonus
Deferred bonus
Deferred LTIP
LTIP
Economic or accounting cost
Perceived value
My dream job... isn't this
28%
On average executives would take a 28% pay cut for their dream job.

427th edition: July 2015
11. The psychology of incentives
Executive directors: Practices and remuneration trend report
In the cool kids’ gang?
50% 67%
Only half of execs think that their long-term incentive plan is an effective incentive.
Are Long term incentives valued more as a status symbol more than as an effective
incentive?
Only half of execs think that their long-term incentive plan is an effective incentive.
So what?
Many pay models are disliked or mean long term pay is discounted. This means companies end up having to pay more.
Simpler, less leveraged packages, with less volatile outcomes may be more valuable to executives and cheaper for shareholders.
$$$$

437th edition: July 2015
12. Executive directors’ total guaranteed package: JSE trends
Executive directors: Practices and remuneration trend report
12. Executive directors’ total guaranteed package: JSE trends
For easy reference, the following summary draws together two years of data at the median total guaranteed package (TGP) level and increases given overall for CEOs, CFOs and executive directors. The average inflation in South Africa for 2014 was 6.10% (2013: 5.77%).
JSE total guaranteed package summary
2013 R’000s
% Increase
2014 R’000s
% Increase
All of JSE
Upper quartile 5 112 9.5% 5 556 8.7%
Median 3 107 4.5% 3 298 6.2%
Lower quartile 2 011 9.7% 2 080 3.4%
CEO, all of JSE
Upper quartile 6 624 11.0% 7 135 7.7%
Median 3 943 4.9% 4 130 4.8%
Lower quartile 3 002 5.9% 3 064 2.1%
CFO, all of JSE
Upper quartile 3 843 11.9% 4 190 9.0%
Median 3 422 11.6% 3 656 6.8%
Lower quartile 1 901 5.6% 1 968 3.5%
ED, all of JSE
Upper quartile 3 416 7.5% 3 703 8.4%
Median 2 429 4.1% 2 573 5.9%
Lower quartile 1 911 10.4% 2 011 5.2%
Source: PwC analysis

447th edition: July 2015
12. Executive directors’ total guaranteed package: JSE trends
Executive directors: Practices and remuneration trend report
When directors are paid in foreign denominated currency and the amounts are converted to rands, fluctuations in the exchange rate may result in substantial increases or decreases in the value of their remuneration. On the JSE, 140 executive directors are paid in foreign currency.
Rand exchange rate against major currencies
Currency 30 April 2014 30 April 2015 % Movement
Australian dollar 9.8067 9.4714 -3.4%
Euro 14.7270 13.5122 -8.2%
UK pound 17.8651 18.2617 2.2%
US dollar 10.6226 12.0637 13.6%
Source: Closing rates at 00:00:01 01 May 2015

457th edition: July 2015
12. Executive directors’ total guaranteed package: JSE trends
Executive directors: Practices and remuneration trend report
Basic resources
This year only six basic resources companies are listed among the cap companies on the JSE. Last year there were 11. This movement in the market capitalisation of resources companies caused a seismic shift in statistical values as we measure median TGP paid in 2013 against 2014. Statistically, remuneration levels within the six remaining cap companies would be either at the upper quartile or outliers. Most, if not all of these companies have global operations, with their headquarters and primary listings outside of South Africa.
To maintain overall data integrity, the same methodology has been used with the reduced sample. Data presented will therefore not be comparable to previous publications.
Basic resources % market cap by sub-sector
Source: PwC analysis
89.8%
7.5%
2.7%
Mining Forestry Industrial Metals& Mining
Basic resources: Large caps
Increases awarded in 2013/2014
2013 2014
CEO 21.3% -4.3%
CFO -3.5% 11.3%
ED -1.9% 2.9%
Source: PwC analysis
Figure 12.1 Basic resources: Large cap CEO (R’000s)
Source: PwC analysis
2012 TGP – median 2013 TGP – median 2014 TGP – median
18 668
22 65321 670

467th edition: July 2015
12. Executive directors’ total guaranteed package: JSE trends
Executive directors: Practices and remuneration trend report
Figure 12.2 Basic resources: Large cap CFO (R’000s)
Source: PwC analysis
Figure 12.3 Basic resources: Large cap ED (R’000s)
Source: PwC analysis
2012 TGP – median 2013 TGP – median 2014 TGP – median
10 41910 057
11 189
2012 TGP – median 2013 TGP – median 2014 TGP – median
14 968 14 68215 112
Basic resources: Medium capsFive basic resources companies, listed as caps in this sector last year, have moved to the cap level. Excluded is the delisted Palabora Mining Company Ltd. There are 10 cap companies included here.
Increases given to directors in medium cap basic resources companies 2013/2014:
Increases awarded in 2013/2014
2013 2014
CEO 0.9% -2.9%
CFO 5.8% 8.7%
ED -18.9% 5.3%
Source: PwC analysis
Figure 12.4 Basic resources: Medium cap CEO (R’000s)
Source: PwC analysis
2012 TGP – median 2013 TGP – median 2014 TGP – median
7 618 7 549 7 332
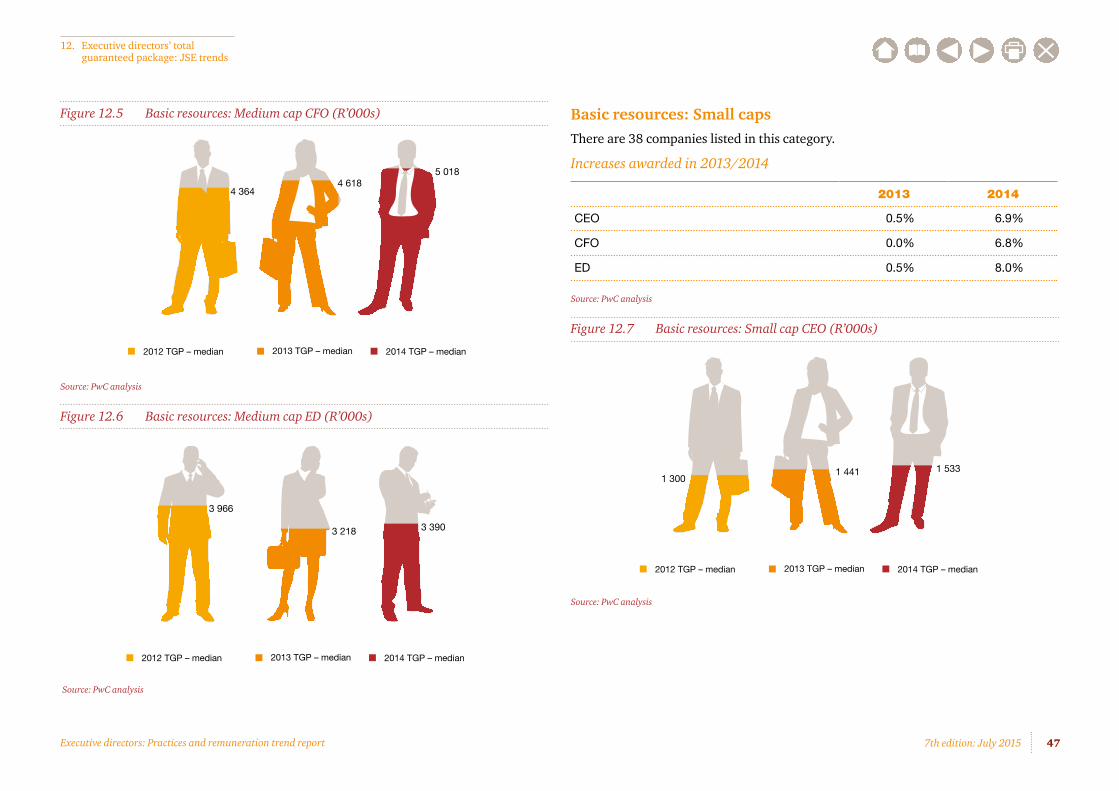
477th edition: July 2015
12. Executive directors’ total guaranteed package: JSE trends
Executive directors: Practices and remuneration trend report
Figure 12.5 Basic resources: Medium cap CFO (R’000s)
Source: PwC analysis
Figure 12.6 Basic resources: Medium cap ED (R’000s)
Source: PwC analysis
2012 TGP – median 2013 TGP – median 2014 TGP – median
4 3644 618
5 018
2012 TGP – median 2013 TGP – median 2014 TGP – median
3 966
3 218 3 390
Basic resources: Small capsThere are 38 companies listed in this category.
Increases awarded in 2013/2014
2013 2014
CEO 0.5% 6.9%
CFO 0.0% 6.8%
ED 0.5% 8.0%
Source: PwC analysis
Figure 12.7 Basic resources: Small cap CEO (R’000s)
Source: PwC analysis
2012 TGP – median 2013 TGP – median 2014 TGP – median
1 3001 441 1 533

487th edition: July 2015
12. Executive directors’ total guaranteed package: JSE trends
Executive directors: Practices and remuneration trend report
Figure 12.8 Basic resources: Small cap CFO (R’000s)
Source: PwC analysis
2012 TGP – median 2013 TGP – median 2014 TGP – median
1 3971 474
1 530
Figure 12.9 Basic resources: Small cap ED (R’000s)
Source: PwC analysis
2012 TGP – median 2013 TGP – median 2014 TGP – median
1 685 1 693 1 828

497th edition: July 2015
12. Executive directors’ total guaranteed package: JSE trends
Executive directors: Practices and remuneration trend report
Financial services
In the financial services sector there has been a sharp focus on improving regulatory controls which measure remuneration against performance. Globally, banks, in particular are under scrutiny to ensure that the cataclysmic events that took place in 2008 are not repeated.
Financial services: Large capsThere are 90 financial services companies listed on the JSE – 16 caps, 20 caps and 54 caps. Their aggregate market capitalisation is R2 728 billion, split R1 985 billion, R562 billion and R181 billion respectively.
Increases awarded in 2013/2014
2013 2014
CEO 6.0% 5.8%
CFO 9.8% 13.8%
ED 4.9% 10.3%
Source: PwC analysis
Financial services % market cap by sub-sector
Source: PwC analysis
Figure 12.10 Financial services: Large cap CEO (R’000s)
Source: PwC analysis
89.8%
22.8%
21.0%
11.1%
1.4%
5.5%
0.4%
Banks Debt
RealEstate
Services
Investment
Insurance
FinancialServices
2012 TGP – median 2013 TGP – median 2014 TGP – median
6 2476 620
7 006

507th edition: July 2015
12. Executive directors’ total guaranteed package: JSE trends
Executive directors: Practices and remuneration trend report
Figure 12.11 Financial services: Large cap CFO (R’000s)
Source: PwC analysis
Figure 12.12 Financial services: Large cap ED (R’000s)
Source: PwC analysis
2012 TGP – median 2013 TGP – median 2014 TGP – median
3 4343 770
4 292
2012 TGP – median 2013 TGP – median 2014 TGP – median
3 355 3 5183 882
Financial services: Medium caps
Increases awarded in 2013/2014
2013 2014
CEO 8.7% 4.8%
CFO 8.8% 2.1%
ED 12.9% 5.5%
Source: PwC analysis
Figure 12.13 Financial services: Medium cap CEO (R’000s)
Source: PwC analysis
2012 TGP – median 2013 TGP – median 2014 TGP – median
3 0593 325
3 483

517th edition: July 2015
12. Executive directors’ total guaranteed package: JSE trends
Executive directors: Practices and remuneration trend report
Figure 12.14 Financial services: Medium cap CFO (R’000s)
Source: PwC analysis
Figure 12.15 Financial services: Medium cap ED (R’000s)
Source: PwC analysis
2012 TGP – median 2013 TGP – median 2014 TGP – median
1 9172 085 2 129
2012 TGP – median 2013 TGP – median 2014 TGP – median
2 0152 275
2 401
Financial services: Small caps
Increases awarded in 2013/2014
2013 2014
CEO 11.3% 8.5%
CFO 10.8% 6.4%
ED 5.5% 3.8%
Source: PwC analysis
Figure 12.16 Financial services: Small cap CEO (R’000s)
Source: PwC analysis
2012 TGP – median 2013 TGP – median 2014 TGP – median
1 7401 936
2 100

527th edition: July 2015
12. Executive directors’ total guaranteed package: JSE trends
Executive directors: Practices and remuneration trend report
Figure 12.17 Financial services: Small cap CFO (R’000s)
Source: PwC analysis
2012 TGP – median 2013 TGP – median 2014 TGP – median
1 3001 441 1 533
Figure 12.18 Financial services: Small cap ED (R’000s)
Source: PwC analysis
2012 TGP – median 2013 TGP – median 2014 TGP – median
1 3971 474
1 530

537th edition: July 2015
12. Executive directors’ total guaranteed package: JSE trends
Executive directors: Practices and remuneration trend report
Industrials
There are 99 companies in this sector listed on the JSE.
Industrials: Large capEleven industrial sector companies are included in the top s40 listed companies and classed as large cap.
Industrials % market cap by sub-sector
Source: PwC analysis
Increases awarded in 2013/2014
2013 2014
CEO 35.4% 1.9%
CFO 7.5% 0.5%
ED -18.3% 9.7%
Source: PwC analysis
25.5%
14.5%
7.3%
3.4%0.8%
0.4%
6.1%5.3%
0.4%
36.3%
PersonalGoods
Services
Oil & Gas
Manufacture
TechnologyHealthcareequipment
Chemical Construction& materials
FoodHousehold
Figure 12.19 Industrials: Large cap CEO (R’000s)
Source: PwC analysis
Figure 12.20 Industrials: Large cap CFO (R’000s)
Source: PwC analysis
2012 TGP – median 2013 TGP – median 2014 TGP – median
10 083
13 659 13 924
2012 TGP – median 2013 TGP – median 2014 TGP – median
5 9376 384 6 419

547th edition: July 2015
12. Executive directors’ total guaranteed package: JSE trends
Executive directors: Practices and remuneration trend report
12.21 Industrials: Large cap ED (R’000s)
Source: PwC analysis
Industrials: Medium capsFifteen industrial companies are ranked among the 60 cap companies on the JSE.
Increases awarded in 2013/2014
2013 2014
CEO 22.4% 2.8%
CFO 10.0% 3.5%
ED 12.9% 8.8%
Source: PwC analysis
2012 TGP – median 2013 TGP – median 2014 TGP – median
4 857
3 9704 357
Figure 12.22 Industrials: Medium cap CEO (R’000s)
Source: PwC analysis
Figure 12.23 Industrials: Medium cap CFO (R’000s)
Source: PwC analysis
2012 TGP – median 2013 TGP – median 2014 TGP – median
4 562
5 584 5 741
2012 TGP – median 2013 TGP – median 2014 TGP – median
3 1883 508 3 632

557th edition: July 2015
12. Executive directors’ total guaranteed package: JSE trends
Executive directors: Practices and remuneration trend report
Figure 12.24 Industrials: Medium cap ED (R’000s)
Source: PwC analysis
Industrial: Small capsSeventy-three small cap industrial companies trade on the JSE.
Increases awarded in 2013/2014
2013 2014
CEO 3.0% 9.2%
CFO -3.1% 10.1%
ED 2.3% 5.2%
Source: PwC analysis
2012 TGP – median 2013 TGP – median 2014 TGP – median
3 1783 587
3 901
Figure 12.25 Industrials: Small cap CEO (R’000s)
Source: PwC analysis
Figure 12.26 Industrials: Small cap CFO (R’000s)
Source: PwC analysis
2012 TGP – median 2013 TGP – median 2014 TGP – median
2 973 3 0633 345
2012 TGP – median 2013 TGP – median 2014 TGP – median
1 878 1 8192 002

567th edition: July 2015
12. Executive directors’ total guaranteed package: JSE trends
Executive directors: Practices and remuneration trend report
Figure 12.27 Industrials: Small cap ED (R’000s)
Source: PwC analysis
2012 TGP – median 2013 TGP – median 2014 TGP – median
1 8641 907
2 007

577th edition: July 2015
12. Executive directors’ total guaranteed package: JSE trends
Executive directors: Practices and remuneration trend report
Services
There are 54 companies listed in the services sector on the JSE, among which five subsectors dominate.
Figure 12.28 Sector profile of services companies by market capitalisation
Source: PwC analysis
Services: Large capSix companies are included in the JSE top 40 listed cap companies.
Increases awarded in 2013/2014
2013 2014
CEO 24.8% 7.7%
CFO 1.7% 9.0%
ED 4.6% 5.9%
Source: PwC analysis
26.8%
31.0%
6.0%14.1%
22.1%
Retail
Healthcare Telecommunications
MediaTravel & Leisure
Figure 12.29 Services: Large cap CEO (R’000s)
Source: PwC analysis
Figure 12.30 Services: Large cap CFO (R’000s)
Source: PwC analysis
2012 TGP – median 2013 TGP – median 2014 TGP – median
5 422
6 7657 287
2012 TGP – median 2013 TGP – median 2014 TGP – median
3 239 3 2933 590

587th edition: July 2015
12. Executive directors’ total guaranteed package: JSE trends
Executive directors: Practices and remuneration trend report
Figure 12.31 Services: Large cap ED (R’000s)
Source: PwC analysis
Services: Medium capsFifteen services companies are ranked as medium cap on the JSE.
Increases awarded in 2013/2014
2013 2014
CEO 10.6% 10.7%
CFO 16.8% 7.3%
ED 7.1% 2.8%
Source: PwC analysis
2012 TGP – median 2013 TGP – median 2014 TGP – median
2 708 2 8333 001
Figure 12.32 Services: Medium cap CEO (R’000s)
Source: PwC analysis
Figure 12.33 Services: Medium cap CFO (R’000s)
Source: PwC analysis
2012 TGP – median 2013 TGP – median 2014 TGP – median
3 7584 156
4 601
2012 TGP – median 2013 TGP – median 2014 TGP – median
3 0663 582
3 844

597th edition: July 2015
12. Executive directors’ total guaranteed package: JSE trends
Executive directors: Practices and remuneration trend report
Figure 12.34 Services: Medium cap ED (R’000s)
Source: PwC analysis
Services: Small capsThirty-three small cap services companies trade on the JSE. These companies are at the coalface in terms of interaction with customers. Their performance in achieving high standards of customer service is vital to the development of South Africa as we move toward Vision 2030.
Increases awarded in 2013/2014
2013 2014
CEO 20.8% 3.2%
CFO 29.0% 5.8%
ED 15.5% 8.4%
Source: PwC analysis
2012 TGP – median 2013 TGP – median 2014 TGP – median
2 333
2 4982 567
Figure 12.35 Services: Small cap CEO (R’000s)
Source: PwC analysis
Figure 12.36 Services: Small cap CFO (R’000s)
Source: PwC analysis
2012 TGP – median 2013 TGP – median 2014 TGP – median
2 835
3 4253 534
2012 TGP – median 2013 TGP – median 2014 TGP – median
1 463
1 887 1 997

607th edition: July 2015
12. Executive directors’ total guaranteed package: JSE trends
Executive directors: Practices and remuneration trend report
Figure 12.37 Services: Small cap ED (R’000s)
Source: PwC analysis
2012 TGP – median 2013 TGP – median 2014 TGP – median
1 7311 999
2 167
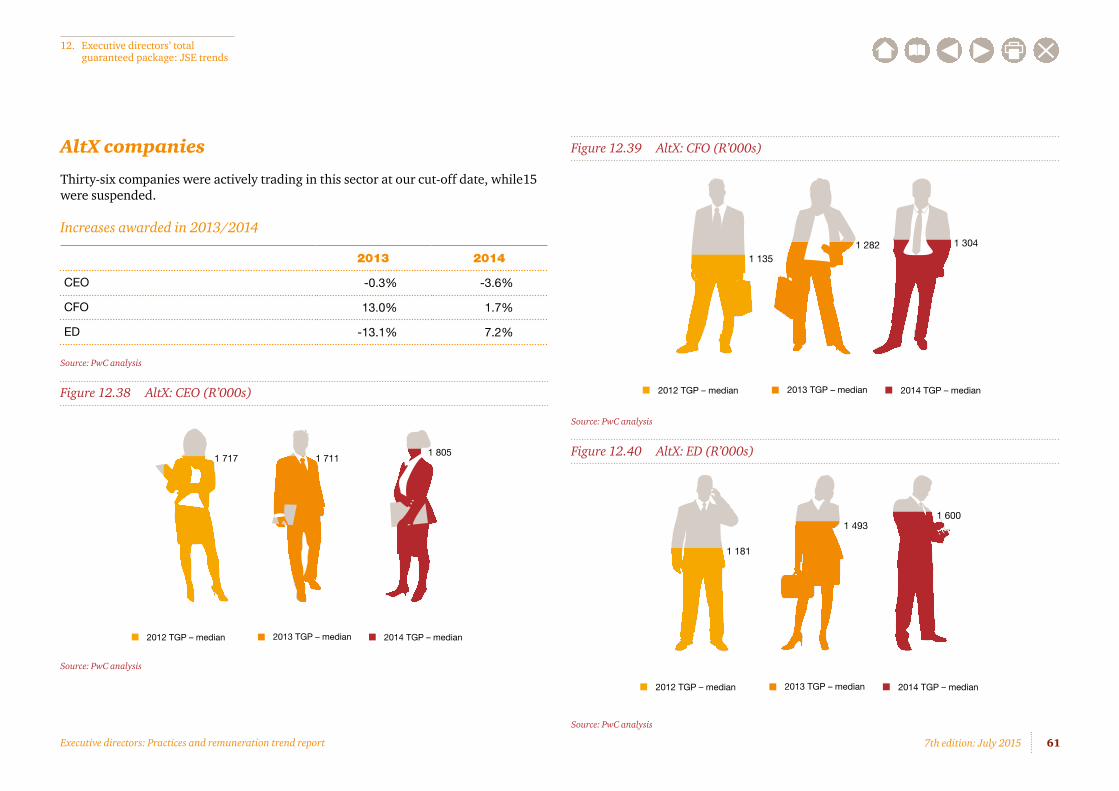
617th edition: July 2015
12. Executive directors’ total guaranteed package: JSE trends
Executive directors: Practices and remuneration trend report
AltX companies
Thirty-six companies were actively trading in this sector at our cut-off date, while15 were suspended.
Increases awarded in 2013/2014
2013 2014
CEO -0.3% -3.6%
CFO 13.0% 1.7%
ED -13.1% 7.2%
Source: PwC analysis
Figure 12.38 AltX: CEO (R’000s)
Source: PwC analysis
2012 TGP – median 2013 TGP – median 2014 TGP – median
1 717 1 7111 805
Figure 12.39 AltX: CFO (R’000s)
Source: PwC analysis
Figure 12.40 AltX: ED (R’000s)
Source: PwC analysis
2012 TGP – median 2013 TGP – median 2014 TGP – median
1 1351 282 1 304
2012 TGP – median 2013 TGP – median 2014 TGP – median
1 181
1 4931 600
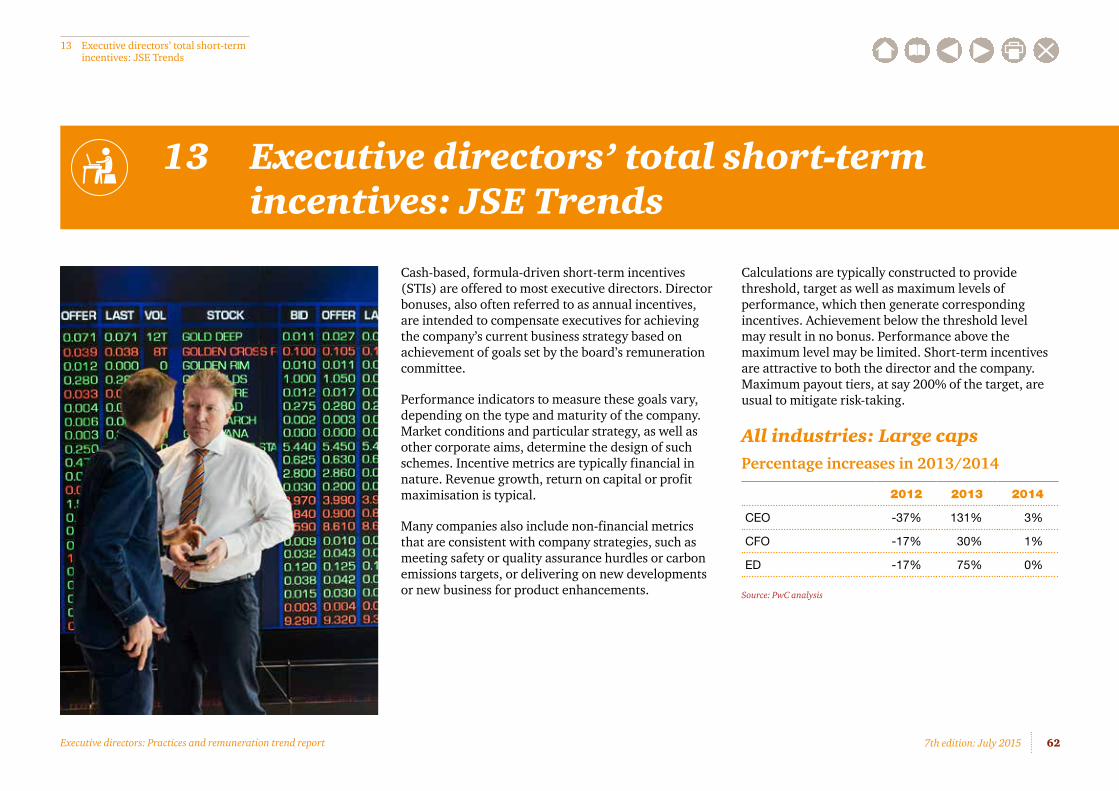
627th edition: July 2015
13 Executive directors’ total short-term incentives: JSE Trends
Executive directors: Practices and remuneration trend report
13 Executive directors’ total short-term incentives: JSE Trends
Cash-based, formula-driven short-term incentives (STIs) are offered to most executive directors. Director bonuses, also often referred to as annual incentives, are intended to compensate executives for achieving the company’s current business strategy based on achievement of goals set by the board’s remuneration committee.
Performance indicators to measure these goals vary, depending on the type and maturity of the company. Market conditions and particular strategy, as well as other corporate aims, determine the design of such schemes. Incentive metrics are typically financial in nature. Revenue growth, return on capital or profit maximisation is typical.
Many companies also include non-financial metrics that are consistent with company strategies, such as meeting safety or quality assurance hurdles or carbon emissions targets, or delivering on new developments or new business for product enhancements.
Calculations are typically constructed to provide threshold, target as well as maximum levels of performance, which then generate corresponding incentives. Achievement below the threshold level may result in no bonus. Performance above the maximum level may be limited. Short-term incentives are attractive to both the director and the company. Maximum payout tiers, at say 200% of the target, are usual to mitigate risk-taking.
All industries: Large capsPercentage increases in 2013/2014
2012 2013 2014
CEO -37% 131% 3%
CFO -17% 30% 1%
ED -17% 75% 0%
Source: PwC analysis
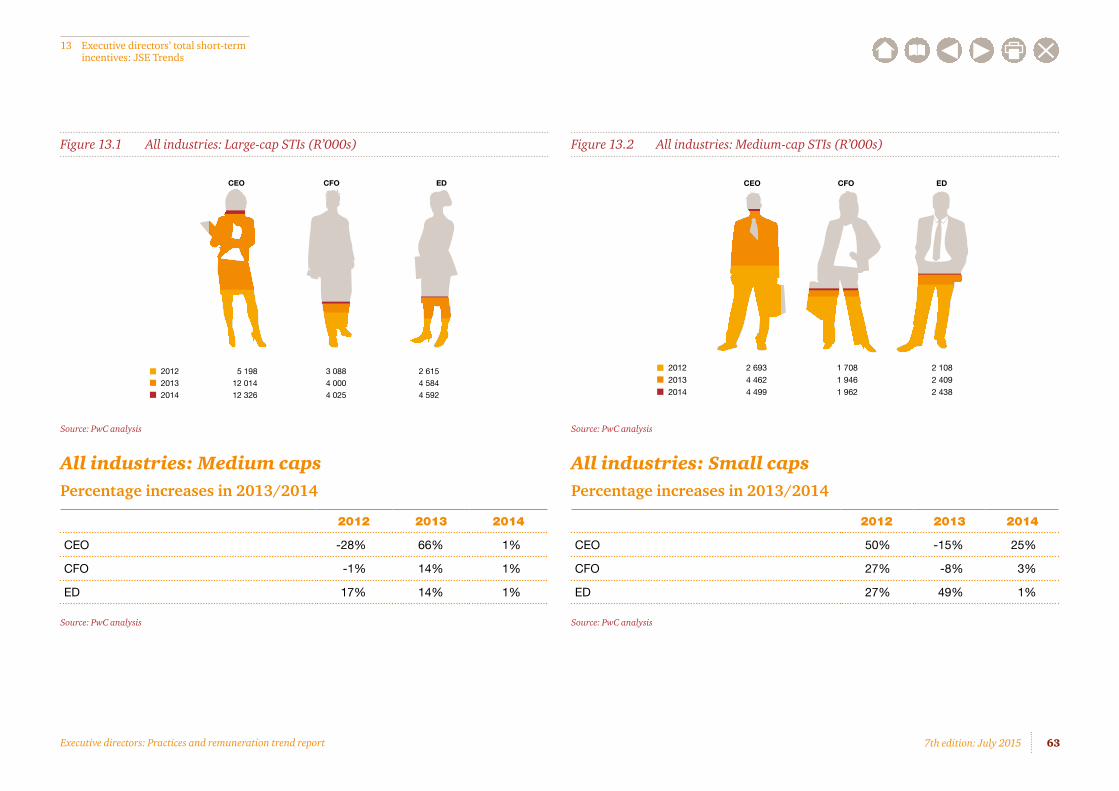
637th edition: July 2015
13 Executive directors’ total short-term incentives: JSE Trends
Executive directors: Practices and remuneration trend report
Figure 13.1 All industries: Large-cap STIs (R’000s)
Source: PwC analysis
All industries: Medium capsPercentage increases in 2013/2014
2012 2013 2014
CEO -28% 66% 1%
CFO -1% 14% 1%
ED 17% 14% 1%
Source: PwC analysis
CEO CFO ED
Figure 13.2 All industries: Medium-cap STIs (R’000s)
Source: PwC analysis
All industries: Small capsPercentage increases in 2013/2014
2012 2013 2014
CEO 50% -15% 25%
CFO 27% -8% 3%
ED 27% 49% 1%
Source: PwC analysis
CEO CFO ED

647th edition: July 2015
13 Executive directors’ total short-term incentives: JSE Trends
Executive directors: Practices and remuneration trend report
Figure 13.3 All industries: Small-cap STIs (R’000s)
Source: PwC analysis
CEO CFO ED

657th edition: July 2015
14. Remuneration trends in other African countries
Executive directors: Practices and remuneration trend report
14. Remuneration trends in other African countries
Africa is made up of 54 independent states, of which 29 have stock exchanges. The majority of African stock exchanges are fledgling markets, some with as few as four listed companies. Others are regional exchanges and do not represent any specific country. For the first time in this edition, we analyse trends in executive directors’ remuneration in sub-Saharan Africa beyond the boundaries of South Africa. Seven sub-Saharan Africa stock exchanges were included in our research, notwithstanding thin data due to lack of disclosure.

667th edition: July 2015
14. Remuneration trends in other African countries
Executive directors: Practices and remuneration trend report
Sub-Saharan stock exchanges analysed
Algeria
Tunisia
Egypt
Sudan
SouthSudan
Mauritania NigerChad Eritrea
Ethiopia
Central
African Republic
KenyaUga
nda
DemocraticRepublicof Congo
Camer
oon
Nigeria
Benin
Togo
Gha
naCôted’Ivoire
Burkin
a
Faso
Liberia
Sierra Leone
Guinea
SenegalGambia
Guinea Bissau
Gabon
Cong
o
Angola
Zambia
Malaw
i
Moz
ambi
que
Zimbabwe
NamibiaBotswana
SouthAfrica
Lesotho
0 500 1000 Nautical Miles
Swaziland
Mad
agas
car
Mauritius
Comoros
Seychelles
Mayotte
Cape Verde
Morocco
Mali
Somali
a
Djibouti
Rwanda
Burundi
Tanzania
Libya
Reunion
Equatorial Guinea
São Tomé and Príncipe
Seven African Stock Exchanges examined
Country Exchange Year established Regulator
Botswana Botswana Stock Exchange (BSE)
1989 Non-Bank Financial Regulatory Authority
Ghana Ghana Stock Exchange (GSE)
1989 Securities and Exchange Commission (SEC) Ghana
Kenya Nairobi Securities Exchange (NSE)
1954 Capital Markets Authority (CMA) Kenya
Namibia Namibian Stock Exchange (NSX)
1904 Namibia Financial Institutions Supervisory Authority
Nigeria Nigerian Stock Exchange (NSE)
1960 Securities and Exchange Commission (SEC) Nigeria
Tanzania Dar es Salaam Stock Exchange
1996 Capital Markets and Securities Authority (CMSA)
Uganda Uganda Securities Exchange (USE)
1997 Capital Markets Authority (CMA) Uganda

677th edition: July 2015
14. Remuneration trends in other African countries
Executive directors: Practices and remuneration trend report
The data reflects trends similar to those seen in other sections of this publication. Listed companies included here are categorised according to their respective ISIN codes.47 Classification of sectors under which the securities are listed is: financial services, basic resources, services and industrials.
There are restrictions on the scope of available information. Information published is thin in detail because of differing regulatory protocols. Because of this, the standards used for the JSE cannot be maintained throughout the data presentation. These markets are developing and in time as more information becomes available, this too will be included.
The seven markets analysed have 457 listed companies with 1 130 executive directors appointed to their boards. In our analysis, data was only available for an average of 63% of directors’ remuneration.
Figure 14.1 Available remuneration data analysed
Source: PwC analysis
47 Sustainable Stock Exchanges, http://www.sseinitiative.org/ (accessed June 04, 2015).
20
40
80
60
Ghana66%
Uganda53%
Average 63%
Tanzania74%
Nigeria46%
Namibia73%
Kenya61%
Botswana69%
Figure 14.2 Average TGP for selected stock exchanges (USD’000s)
Source: PwC analysis
Upper quartile 322 220 223Median 245 174 173Lower quartile 204 128 130
CEO CFO ED

687th edition: July 2015
14. Remuneration trends in other African countries
Executive directors: Practices and remuneration trend report
BotswanaThe Botswana Stock Exchange (BSE) had 34 active trading companies at the cut-off date for this report of 30 April 2015.
Sectors
The BSE sector profile is dominated by the financial services industry.
Figure 14.3 Market capitalisation by sector
Source: PwC analysis
29%
46%
5%
20%
Basicresources
Finance
Industrial
Services
Directors’ remuneration
The larger companies listed on the BSE are dual listed, and have the same executive directors on the board as for their main listing. They have therefore been excluded from the remuneration analysis.
Figure 14.4 Botswana: TGP (USD’000s)
Source: PwC analysis
Upper quartile 231 141 177Median 198 125 154Lower quartile 168 110 120
CEO CFO ED
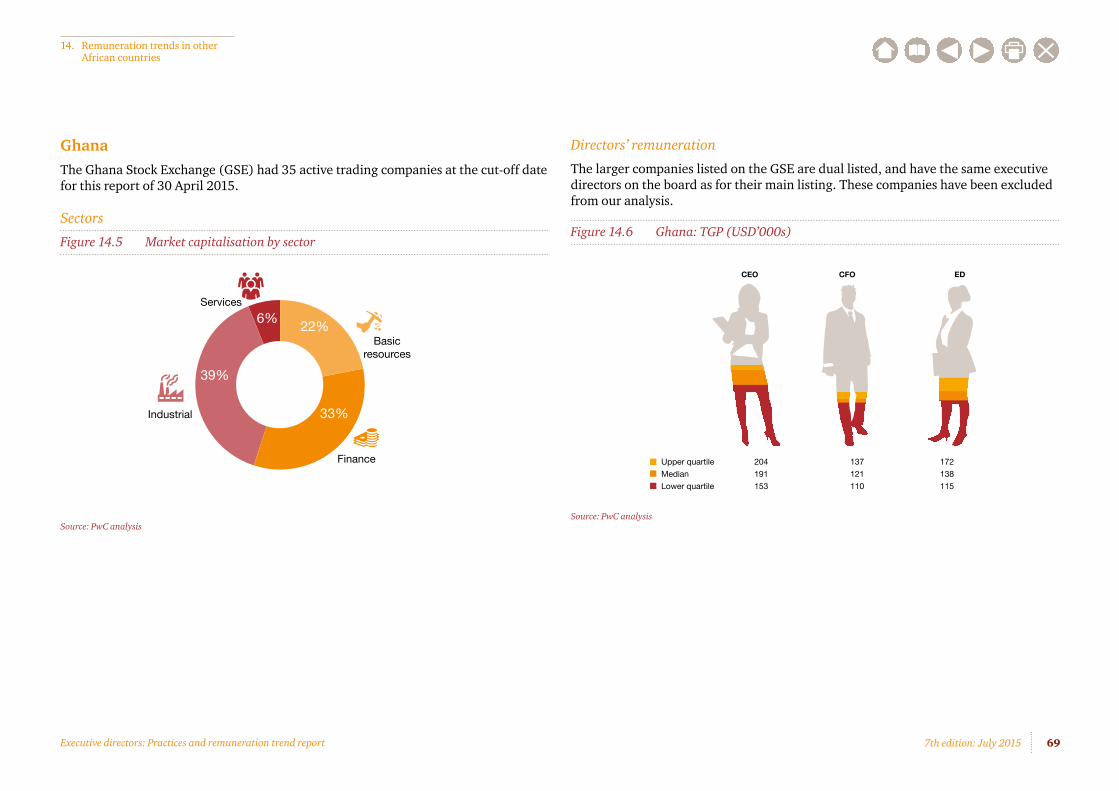
697th edition: July 2015
14. Remuneration trends in other African countries
Executive directors: Practices and remuneration trend report
Ghana The Ghana Stock Exchange (GSE) had 35 active trading companies at the cut-off date for this report of 30 April 2015.
Sectors
Figure 14.5 Market capitalisation by sector
Source: PwC analysis
22%
33%
39%
6%
Basicresources
Finance
Industrial
Services
Directors’ remuneration
The larger companies listed on the GSE are dual listed, and have the same executive directors on the board as for their main listing. These companies have been excluded from our analysis.
Figure 14.6 Ghana: TGP (USD’000s)
Source: PwC analysis
Upper quartile 204 137 172Median 191 121 138Lower quartile 153 110 115
CEO CFO ED
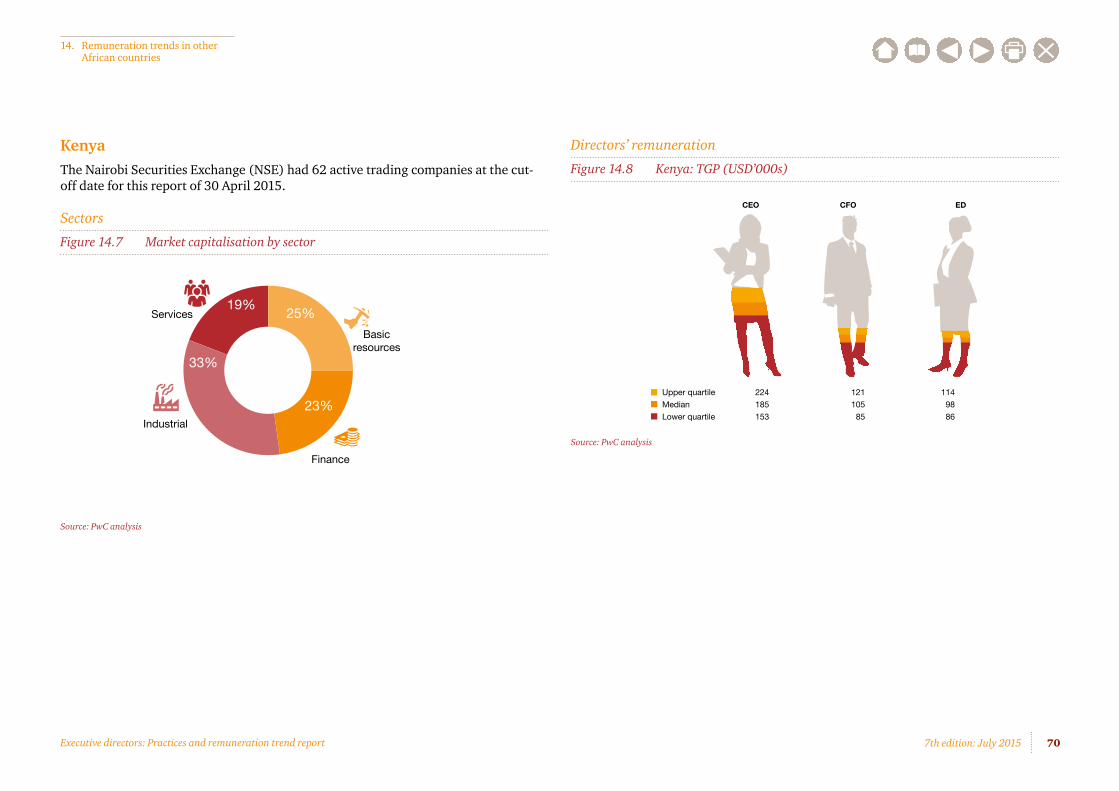
707th edition: July 2015
14. Remuneration trends in other African countries
Executive directors: Practices and remuneration trend report
KenyaThe Nairobi Securities Exchange (NSE) had 62 active trading companies at the cut-off date for this report of 30 April 2015.
Sectors
Figure 14.7 Market capitalisation by sector
Source: PwC analysis
25%
23%
33%
19%
Basicresources
Finance
Industrial
Services
Directors’ remuneration
Figure 14.8 Kenya: TGP (USD’000s)
Source: PwC analysis
Upper quartile 224 121 114Median 185 105 98Lower quartile 153 85 86
CEO CFO ED
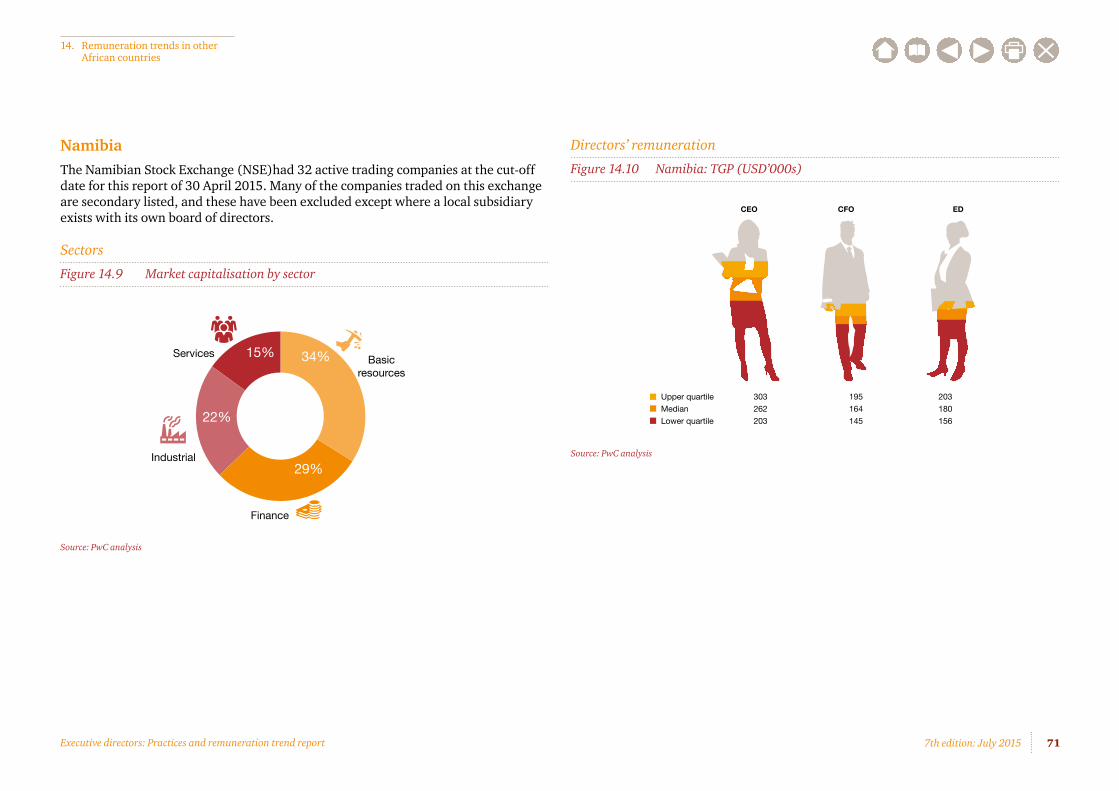
717th edition: July 2015
14. Remuneration trends in other African countries
Executive directors: Practices and remuneration trend report
NamibiaThe Namibian Stock Exchange (NSE)had 32 active trading companies at the cut-off date for this report of 30 April 2015. Many of the companies traded on this exchange are secondary listed, and these have been excluded except where a local subsidiary exists with its own board of directors.
Sectors
Figure 14.9 Market capitalisation by sector
Source: PwC analysis
34%
29%
22%
15%Basic
resources
Finance
Industrial
Services
Directors’ remuneration
Figure 14.10 Namibia: TGP (USD’000s)
Source: PwC analysis
Upper quartile 303 195 203Median 262 164 180Lower quartile 203 145 156
CEO CFO ED

727th edition: July 2015
14. Remuneration trends in other African countries
Executive directors: Practices and remuneration trend report
NigeriaNigerian Stock Exchange (NSE) has 261 active trading companies. Of these, nine are quoted in foreign currency and are excluded in our analysis. The quoted share prices are very weak for most shares, with the most expensive being USD27.62.
A normal distribution of share prices normally follows the Pareto principle in any one stock exchange. This is not the case with the NSE where there is a long-tail distribution, as shown in figure 13.11
Figure 14.11 Distribution of share prices on the NSE
Note: Only five shares listed have a value above USD1.00 120 of the 185 shares listed are valued at USD0.01, or less. Exchange rate: 1USD=NGN198.95
Source: PwC analysis
0
100
200
300
400
500
600
700
800
900
SectorsFigure 14.12 Market capitalisation by sector
PwC analysis
12%
29%
22%
37%Basic
resources
Finance
Industrial
Services

737th edition: July 2015
14. Remuneration trends in other African countries
Executive directors: Practices and remuneration trend report
Directors’ remuneration
Available data reported for executive directors has the lowest percentage disclosure of all the stock exchanges examined, notwithstanding that Nigeria has more companies listed than the other six exchanges combined.
Figure 14.13 Nigeria: TGP (USD’000s)
Source: PwC analysis
Upper quartile 341 246 259Median 292 213 213Lower quartile 246 181 179
CEO CFO ED

747th edition: July 2015
14. Remuneration trends in other African countries
Executive directors: Practices and remuneration trend report
TanzaniaThe Dar es Salaam Stock Exchange (DSE) was incorporated in 1996 and the first equity was traded in 1998. Total market capitalisation on 30 April 2015 was US$11 billion, of which US$5 billion relates to the domestic market. Since nearly half the companies have a secondary listing, remuneration data was thin.
Sectors
Figure 14.14 Market capitalisation by sector
Source: PwC analysis
7%
35%
29%
29%
Basicresources
Finance
Industrial
Services
Directors’ remuneration
Figure 14.15 Tanzania: TGP (USD’000s)
Source: PwC analysis
Upper quartile 356 214 230Median 350 195 189Lower quartile 279 153 158
CEO CFO ED

757th edition: July 2015
14. Remuneration trends in other African countries
Executive directors: Practices and remuneration trend report
Uganda The Uganda Securities Exchange (USE) had 16 active listed companies at the cut-off date for this report of 30 April 2015.
Sectors
Figure 14.16 Market capitalisation by sector
Source: PwC analysis
29%
45%
6%
20%Basic
resources
Finance
Industrial
Services
Directors’ remuneration
Companies that have secondary listings on the USE are excluded, unless they have reported remuneration to directors where they trade as a subsidiary company with their own directors.
Figure 14.17 Uganda: TGP (USD’000s)
Source: PwC analysis
Upper quartile 176 146 159Median 152 127 136Lower quartile 141 108 110
CEO CFO ED

767th edition: July 2015
15. Appendices
Executive directors: Practices and remuneration trend report
15. AppendicesThe South African market place
Listed companies(355)
AltX(36)
Venture capital – includedin financial services
Basic resources(49)
inancial services(90)
Industrial(99)
ervices(54)
Forestry andpaper
(3)
Banking(6)
Autos & parts(2)
Healthcare(6)
AltX excluded(4)
Industrial metals& mining
(6)
evelopmentcapital
(13)
everages(4)
Media(7)
Basic resourcesexcluded
(5)
Mining(40)
eneral finances(23)
Chemicals(6)
Pharmaceuticals(5)
inancial servicesexcluded
(9)
Insurance(10)
Constructionmaterials
(15)
Retail(21)
Industrialexcluded
(4)
Investmentinstruments
(14)
Food producers(11)
Tele-Communications
(6)
ervicesexcluded
(5)
Real estate(24)
Industrial goods services
(30)
Travel leisure(9)
Oil & gas(5)
Personal goods(7)
Technology(19)
Newly listed companies orcompanies with no executive
remuneration reported (excluded)(27)

777th edition: July 2015
15. Appendices
Executive directors: Practices and remuneration trend report
About PwC
At PwC we apply our industry knowledge and professional expertise to identify, report, protect, realise and create value for our clients and their stakeholders.
The strength of this value proposition is based on the breadth and depth of the firm’s client relationships. Networks are built around clients to provide them with our collective knowledge and resources. Our international network, experience, industry knowledge and business understanding are used to build trust and create value for clients.
We are committed to making PwC distinctive through consistent behaviours that enable the success of our clients and people. We call this the PwC Experience and it shapes the way in which we interact with clients, with one another and with the communities in which we operate. This, along with our core values of Teamwork, Leadership and Excellence – and our strong Code of Conduct – guides us in all that we do.

787th edition: July 2015
15. Appendices
Executive directors: Practices and remuneration trend report
Acknowledgements
We would like to thank the following for their valuable contribution to this report:
• Martin Hopkins – Director, PwC
• René Richter – Director, PwC
• Sidriaan de Villiers – Director, PwC
• Anelisa Keke – Consultant, PwC
• Dave Yzelle – Independent project researcher
• PwC UK
• PwC US

797th edition: July 2015
15. Appendices
Executive directors: Practices and remuneration trend report
Contacts
For more information about the issues raised in this report, please contact:
• Gerald Seegers +27 11 797 4560 [email protected]
• Martin Hopkins +27 11 797 5535 [email protected]
• Karen Crous +27 11 797 4616 [email protected]
• Julia Fourie +27 21 529 2170 [email protected]
For media enquiries, please contact:
• Sonja Nel +27 11 797 4207 [email protected]

The information contained in this publication is provided for general information purposes only, and does not constitute the provision of legal or professional advice in any way. Before making any decision or taking any action, a professional adviser should be consulted. No responsibility for loss to any person acting or refraining from action as a result of any material in thias publication can be accepted by the author, copyright owner or publisher.
This publication has been prepared for general guidance on matters of interest only, and does not constitute professional advice. You should not act upon the information contained in this publication without obtaining specific professional advice. No representation or warranty (express or implied) is given as to the accuracy or completeness of the information contained in this publication, and, to the extent permitted by law, PricewaterhouseCoopers Inc, its subsidiary and associated companies and entities and their respective directors, employees agents and subcontractors do not accept or assume any liability, responsibility or duty of care for any consequences of you or anyone else acting, or refraining to act, in reliance on the information contained in this publication or for any decision based on it.
© 2015 PricewaterhouseCoopers (“PwC”), a South African firm, PwC is part of the PricewaterhouseCoopers International Limited (“PwCIL”) network that consists of separate and independent legal entities that do not act as agents of PwCIL or any other member firm, nor is PwCIL or the separate firms responsible or liable for the acts or omissions of each other in any way. No portion of this document may be reproduced by any process without the written permission of PwC. (15-17166)