EXECUTIVE COMPENSATION: THE CASE OF LIBERAL ARTS COLLEGE ...org.elon.edu/ipe/Sorokina FINAL.pdf ·...
16
Issues in Political Economy, Vol. 12, August 2003 EXECUTIVE COMPENSATION: THE CASE OF LIBERAL ARTS COLLEGE PRESIDENTS Olga V. Sorokina, Denison University Over the past decade the cost of higher education has been growing steadily. The real value of average tuition and fees at a four-year private college has increased 127 percent from 1980 to 2000 (Baum 2001). According to a survey conducted in 2000 by the American Council on Education (Ikenberry and Hartle 2000), 60 percent of respondents believe “colleges do not try to keep the amount they charge at an affordable level for families like theirs” (2000, 11). Americans also say that they know very little about college and university presidents: as many as 65 percent of the respondents admitted that they very seldom or almost never hear about college presidents and issues involving them, and 45 percent admitted that they did not know whether college presidents are paid more than they should be (2000, 12). A lot of public attention, however, has been directed at the earnings and compensation of the chief executive officers of major corporations. As a result of the growing skepticism about the effectiveness and fairness of executive compensation in general, the pay and benefits of academic administrators has also begun attracting attention of the general public and economic researchers. “What is a college president worth these days?” is the opening question of an article in The Chronicle of Higher Education (Nicklin 2001) discussing the pay and benefits enjoyed by private college presidents. According to The Chronicle's survey the average salary of a private college president was $207,130 for the 2000 fiscal year, up 11.2 percent from $186,255 in 1999. Over 600 institutions were included in both surveys. During roughly the same time period the average faculty salary at private and public colleges increased by 3.7 percent, from $56,282 in the 1998-99 academic year to $58,352 in the 1999-2000 academic year, according to the American Association of University Professors (Nicklin 2001). What causes such disparity? Is it the positive changes in academic and financial performance of the colleges that translate into such a rapid increase of the presidents’ pay, or are there some other, yet to be explored sources of salary divergence between college faculty and president? In my project, I attempt to take a candid look at the pay of presidents of the highly selective private liberal arts colleges. As chief executive officers, college presidents are not only in charge of day-to-day operations and educational programs; they are also responsible for the continued well-being of the institution. Who are the college presidents? What are their personal and demographic characteristics? What motivates them? Does the structure of their compensation stimulate or discourage them to have the long-term interests of the institution at heart? These are some of the questions I want to address in this paper. I. BACKGROUND AND LITERATURE REVIEW The key functional distinction between nonprofit and business organization lies in the level of constraints they face. Since nonprofits may not distribute profits to anyone associated with the organization, we can expect to see a difference in compensation and in managerial incentives between the two types of institutions. While many believe that top executives are paid like bureaucrats (Jensen and Murphy 1990), performance as measured by levels of profit and sales has proved to be highly correlated with managerial pay (Murphy 1985, Joskow and Rose 1993, Hall and Liebman 1998). The ideal performance measures, however, remains one of the
Transcript of EXECUTIVE COMPENSATION: THE CASE OF LIBERAL ARTS COLLEGE ...org.elon.edu/ipe/Sorokina FINAL.pdf ·...
Issues in Political Economy, Vol. 12, August 2003
EXECUTIVE COMPENSATION: THE CASE OF LIBERAL ARTS COLLEGE PRESIDENTS Olga V. Sorokina, Denison University
Over the past decade the cost of higher education has been growing steadily. The real value of average tuition and fees at a four-year private college has increased 127 percent from 1980 to 2000 (Baum 2001). According to a survey conducted in 2000 by the American Council on Education (Ikenberry and Hartle 2000), 60 percent of respondents believe “colleges do not try to keep the amount they charge at an affordable level for families like theirs” (2000, 11). Americans also say that they know very little about college and university presidents: as many as 65 percent of the respondents admitted that they very seldom or almost never hear about college presidents and issues involving them, and 45 percent admitted that they did not know whether college presidents are paid more than they should be (2000, 12).
A lot of public attention, however, has been directed at the earnings and compensation of the chief executive officers of major corporations. As a result of the growing skepticism about the effectiveness and fairness of executive compensation in general, the pay and benefits of academic administrators has also begun attracting attention of the general public and economic researchers.
“What is a college president worth these days?” is the opening question of an article in The Chronicle of Higher Education (Nicklin 2001) discussing the pay and benefits enjoyed by private college presidents. According to The Chronicle's survey the average salary of a private college president was $207,130 for the 2000 fiscal year, up 11.2 percent from $186,255 in 1999. Over 600 institutions were included in both surveys. During roughly the same time period the average faculty salary at private and public colleges increased by 3.7 percent, from $56,282 in the 1998-99 academic year to $58,352 in the 1999-2000 academic year, according to the American Association of University Professors (Nicklin 2001). What causes such disparity? Is it the positive changes in academic and financial performance of the colleges that translate into such a rapid increase of the presidents’ pay, or are there some other, yet to be explored sources of salary divergence between college faculty and president?
In my project, I attempt to take a candid look at the pay of presidents of the highly selective private liberal arts colleges. As chief executive officers, college presidents are not only in charge of day-to-day operations and educational programs; they are also responsible for the continued well-being of the institution. Who are the college presidents? What are their personal and demographic characteristics? What motivates them? Does the structure of their compensation stimulate or discourage them to have the long-term interests of the institution at heart? These are some of the questions I want to address in this paper.
I. BACKGROUND AND LITERATURE REVIEW The key functional distinction between nonprofit and business organization lies in the
level of constraints they face. Since nonprofits may not distribute profits to anyone associated with the organization, we can expect to see a difference in compensation and in managerial incentives between the two types of institutions. While many believe that top executives are paid like bureaucrats (Jensen and Murphy 1990), performance as measured by levels of profit and sales has proved to be highly correlated with managerial pay (Murphy 1985, Joskow and Rose 1993, Hall and Liebman 1998). The ideal performance measures, however, remains one of the
Issues in Political Economy, Vol. 12, August 2003
major issues of discussion among the economists interested in executive compensation. According to Murphy and Oyer (2002), “for incentive purposes, an ideal performance measure would reflect a manager’s true contribution to firm value, purged of factors beyond her control but including the effect of current actions on the performance of co-workers or on the future profitability of the firm.” In practice, the performance of the CEO is hard to isolate from the overall performance of the firm and the influence of external factors. This is particularly true for nonprofits, because of a multitude of external regulations and a productive output that is hard to measure.
Weisbrod (1989) made an attempt to theoretically justify the differences in managerial compensation between the for-profit and nonprofit organizations. He advocated divorcing pay from performance in nonprofit organizations in order to avoid creating undesirable incentives. Preston (1989) found that managers in nonprofits are accepting lower wages for similar work because they are more closely tied to social benefit provisions than other workers. Hallock (2002) studied pay variability within and across nonprofit industries, pay-performance link, and the relationship between the board of directors and managerial pay, focusing solely on nonprofits. Using panel data on more than 30,000 manager-years from 1992 to 1996, he found that performance significantly influences pay only when it is measured as a function of organization size. He also found that the top managers’ pay is inversely related to the size of the board of directors.
Ehrenberg, Cheslock, and Epifantseva (2001) in their paper “Paying our Presidents: What Do Trustees Value” attempted to examine the pay-performance link at the educational institutions. They were the first to undertake a study using panel data to explain differences in compensation of presidents across academia. The data they collected described over 400 private universities and colleges, and their presidents during five academic years, 1992-1993 through 1996-1997. Their study examined the impact of changes in the institutional financial standing, selectivity, and donation levels on the salary dynamics. While the results provided only weak support for the hypothesis that a president’s salary was performance-based, they indicated that pay was sensitive to fundraising success, and provided a solid framework for the studies of the executive compensation in higher education.
One way to examine the salaries of college presidents is to compare them to faculty salaries. When comparing average salary changes of college presidents to those of faculty, however, it is important to keep in mind the distinction in units of comparison. Distribution of faculty members over ranks and ages as well as size of the total salary pool determines the average faculty salary for any given institution. The college faculty pool varies over time and so does the average salary. Thus it would be incorrect to compare the averages over such a broad group with the earnings of a single individual (Ehrenberg et al. 2001).
Another major argument against comparing college faculty and presidents’ earnings is the difference in market demand for administrators vs. educators. College presidents perform a wide variety of administrative functions, while faculty members are expected to focus on the three major areas: teaching, community service, and research. That is not to say that presidents work harder. It could be the forces of supply and demand that create observed salary differentials. College administrators often have an opportunity to progress up to a higher position within the academic sector, to become presidents at more prestigious universities, to move to the business sector or to go into teaching. Faculty, on the other hand, especially tenured professors, are more limited in their choices. Although most of the college presidents come from the faculty, tenured

Issues in Political Economy, Vol. 12, August 2003
college professors on average are not likely to seek a job outside of the academia or to be willing and able to switch to performing administrative functions (Baum 2001).
The other approach (Hallock 2002) advocates applying the same methodology to studying the executive compensation in non-profits that is being used to decompose the pay and benefits of senior executives in for-profit organizations. The main rationale is that the executives perform roughly similar functions in both types of organizations and face the same level of scrutiny from the Internal Revenue Service. There is a number of factors, however, that make the compensation of the top managers of educational institutions fundamentally different from that of the corporate CEOs. As Ehrenberg (2002) argues in his paper, the university and college presidents have a broader and more complex constituency than corporate executives. Although it is only the board of trustees who determines their compensation, the presidents are accountable to students, faculty, and alumni as well. Corporations, private foundations, and all three levels of government are also a part of the constituency. Such a complex accountability translates into a multitude of objectives, which makes it hard to measure performance. Hence it is hard to create a properly balanced system of managerial incentives for college presidents.
Overemphasizing any particular sphere of college operations may lead to formation of undesirable and counterproductive incentives. Let us assume, for example, that a board of trustees decides to tie the pay of their college president to the rank that the institution achieves in the coming year. One way to for a president to insure a higher rank for her institution is to increase the yield and decrease the acceptance rate. Introduction of early-decision admissions is one of the easiest ways to do this, since early-decision applicants accept offers of admissions with a probability close to one (Ehrenberg 2002). However, this leads to less diversity in the incoming class: low-income and minority students tend to apply to more than one college to be able to choose the best financial aid package. They are not likely to participate in the early admissions process since it requires early commitment and limits their choices. This trade-off between diversity and rank is only one example of the competing values that college presidents face.
In an attempt to ensure that college presidents are neutral between the decisions that draw attention to competing values, trustees may deliberately de-emphasize performance in favor of other more intricate productivity indicators.1 Leadership skills, conflict-moderation abilities, excellent business and academic reputations can all affect performance evaluation and be important determinants of pay.
The focus of college development often changes with time. Different aspects of college operation may be viewed as of primary importance at different times. For example, if there is an unexpected decline in the test scores of the applicant pool, more resources may be temporarily directed to provide more financial aid to incoming students. If the alumni giving rate goes down, more funds may be allocated to strengthen the fundraising office or launch a capital campaign. Often a new president is hired in the process, the one who is believed to be able to improve the performance characteristic that a college finds the most desirable at the moment.
I use an empirical model similar to Ehrenberg et al. (2001) to analyze the factors influencing the salaries of liberal arts college presidents. In addition to college performance variables and human capital variables, I include social capital variables to control for other factors that the trustees may value in a president – leadership skills, social network, academic and managerial reputation. I also examine changes in pay in an attempt to distinguish whether trustees are more likely to reward performance measures or human and social capital characteristics.

Issues in Political Economy, Vol. 12, August 2003
I focus solely on the compensation of liberal arts college presidents. Since the institutions in this group are relatively small with full-time enrollment rarely exceeding 2500 students, it is more likely that the presidents would have more direct impact on the schools’ policies. As in business, where larger firms have larger executive teams, the pay-performance sensitivity may be smaller for a college president if she has a large board of executives (Schaefer 1998). Hence it is reasonable to suggest that, if presidential compensation is at all affected by changes in school’s financial and academic performance, the link will be stronger for small liberal arts colleges than for comprehensive colleges and big research universities.
II. DATA The data come from three different sources. College ratings, tuition costs, and
performance variables are obtained from the US News and World Report.2 Variables reflecting personal characteristics are supplied by the biographical articles in Who’s Who in America (1999 and 2000), Who’s Who in American Education 1996-1997, and the official web sites of the colleges. Data on annual pay are drawn from The Chronicle's Annual Survey of Pay and Benefits for College Presidents, 1993-2000.3
Every year US News and World Report ranks most of the country’s colleges and universities and publishes an issue in the fall that contains the explanations of methodology and the ratings themselves. Colleges are graded on seven broad categories of academic excellence and financial performance, which are then weighted to produce a rank. For 1997 – 1999, the years in focus, the categories and their weights are: academic reputation (25 percent), retention rate (20 percent), faculty resources (20 percent), student selectivity (15 percent), financial resources (10 percent), alumni giving rate (5 percent), and graduation rate performance (5 percent). These categories are composed of 16 different variables, some of which I use in my study to capture the performance of college presidents.4
Who’s Who in America is a bibliographical dictionary published annually by Marquis Who’s Who. It is a widely used source of personal and professional information, which “includes the biographies of millions of leaders and achievers from around the world, and from every significant field of endeavor”.5 The publication does not disclose the methodology they use to select the candidates for inclusion. They indicate, however, that one of the main criteria for inclusion is professional position.
The Chronicle of Higher education publishes an annual survey that shows the pay and benefits received by the chief executive and the five highest-paid employees at 595 private colleges in the country. Pay is defined as all salaries, fees, bonuses, and severance payments that each person receives. The data come from the Form 990 that each institution has to file with the Internal Revenue Service every year.
III. FACTORS INFLUENCING PRESIDENTIAL PAY As established by labor theory, individual’s earnings are influenced by the level of human
capital accumulation, productivity, and demographic characteristics. In addition to that, I include a factor reflecting social capital accumulation. As social capital I define social network, connections, and academic reputation of college presidents.
As a result the model of earning function takes the following form: (1) Y = α0 + β1P + β2 H + β3W +ε,

Issues in Political Economy, Vol. 12, August 2003
where Y = ln(1999-2000 pay in dollars)6; P = a vector of variables reflecting productivity of college presidents; H = a vector of variables reflecting human capital characteristics of the presidents; W = a binary variable for social capital.
I assume that pay is determined by the board based on the previous year’s college performance variables, which reflect productivity. Thus they are reported with a one-year lag. The performance variables used in the model are: college tier, admissions selectivity, retention rate, and alumni giving rate. Admissions selectivity is important because it reflects the academic climate of a college. It is measured by the mean SAT score for incoming freshmen7 and acceptance rate. Acceptance rate is the ratio of the number of students admitted to the number of applications for the fall admissions. Acceptance rate must have a negative effect on the pay of the presidents, since higher acceptance rate indicates lower selectivity.
I expect mean SAT Score to have a positive effect on the presidents’ compensation. The higher the score of the students in an incoming class is, the higher the selectivity and reputation of the school, the higher the pay of the president will be.
Retention rate is an important measure of the school’s ability to provide the classes and services students need to succeed. The statistic used in this study is an average freshman retention rate – the percentage of first-year freshmen that returned to the same college the following fall, averaged over the first-year classes entering between 1995 and 1998. With an average president starting her term in 1993-1994 the lag is big enough to insure that the retention rate statistics reflects the performance of the current president and not her predecessor’s. I anticipate this variable to retain a positive sign, because we can expect a president to be rewarded at a higher level if she is able to ensure that more first-year students have their expectations met and stay enrolled for the next academic year.
Alumni giving rate in my model is the average percentage of alumni of record who donated money to the college. It is calculated by dividing the number of alumni donors during a given academic year by the number of alumni of record8. These rates are averaged for the 1997 and 1998 academic years. The giving rate should have a positive impact on the pay, since it reflects the overall level of alumni satisfaction with the college experience, and the success of presidential fundraising efforts.
I believe that differences exist in presidents’ compensation between the colleges in different tiers, since tier serves as a proxy for the school’s quality and prestige. Although the college tier variable is a function of academic performance, it also includes components reflecting academic reputation, faculty recourses, and financial resources of the institution. To control for these factors I include dummy variables for the first and third tier. I expect the presidents of first tier colleges to make more (positive coefficient), and the presidents of third tier colleges to make less (negative coefficient) than the presidents of the second tier institutions.
Human capital variables used in the model are gender and job tenure. Since most of the college presidents have a doctorate degree, I do not include a variable for education. Some of the presidents in my data set have a Doctor of Business Administration or divinity degree as opposed to Ph.D., but the percentage is small.9 Job tenure, or experience, is a proxy for specific human capital – skills related to performing a particular job at a particular college. I predict job tenure to have a positive effect on the pay.
The expectation regarding the sign of gender variable is ambiguous. There is theoretical evidence supporting both negative and positive influence of gender on the compensation of

Issues in Political Economy, Vol. 12, August 2003
college presidents. Monks and McGoldrick (2002) have shown that women in private college administration earn 11 percent less then men. The majority of this difference, however, can be explained by the institutional characteristics. Ehrenberg et al. (2001) in turn have found that female presidents receive 3.5 percent more than male presidents of liberal arts colleges, ceteris paribus. Thus obtaining either negative or positive sign for the gender coefficient is equally possible.
Since a college president is not only an administrator, but a public figure as well, she is expected to travel around the country, speak at conferences of different levels, solicit donations from alumni, and determine and defend the college policies before the Board of Trustees. Therefore it is plausible to hypothesize that social capital is one of the major factors influencing compensation. In the model, social capital is measured by the dummy variable "Who’s Who". It is equal to one if the president’s biography appears in both 1999 and 2000 issues of Who’s Who in America, zero otherwise. I suggest that the college presidents whose biographical information appears in this publication are likely to be more involved in public relations, be more visible in the academic community, and have better personal skills. To qualify for this publication one has to be nominated by a number of one’s colleagues and to have a substantial list of scholastic and personal achievements. Being in Who’s Who also means that one is willing to let other people know about her accomplishments. It is interesting to note that only about 60% of all the college presidents in my data set have their biographies published in Who’s Who in America. I expect the presidents with more social capital as proxied by their inclusion in Who’s Who in America will be paid higher10.
The data set I use in my study includes the presidents of one hundred top-ranking liberal arts colleges in the United States. For a few presidents, there was no biographical information available, which reduced the population to 97 colleges. All the schools fall in the top 3 tiers as established by the US News and World Report in 199911. Forty colleges belong to the first tier, 34 to the second tier, and 23 to the third tier.
Issues in Political Economy, Vol. 12, August 2003
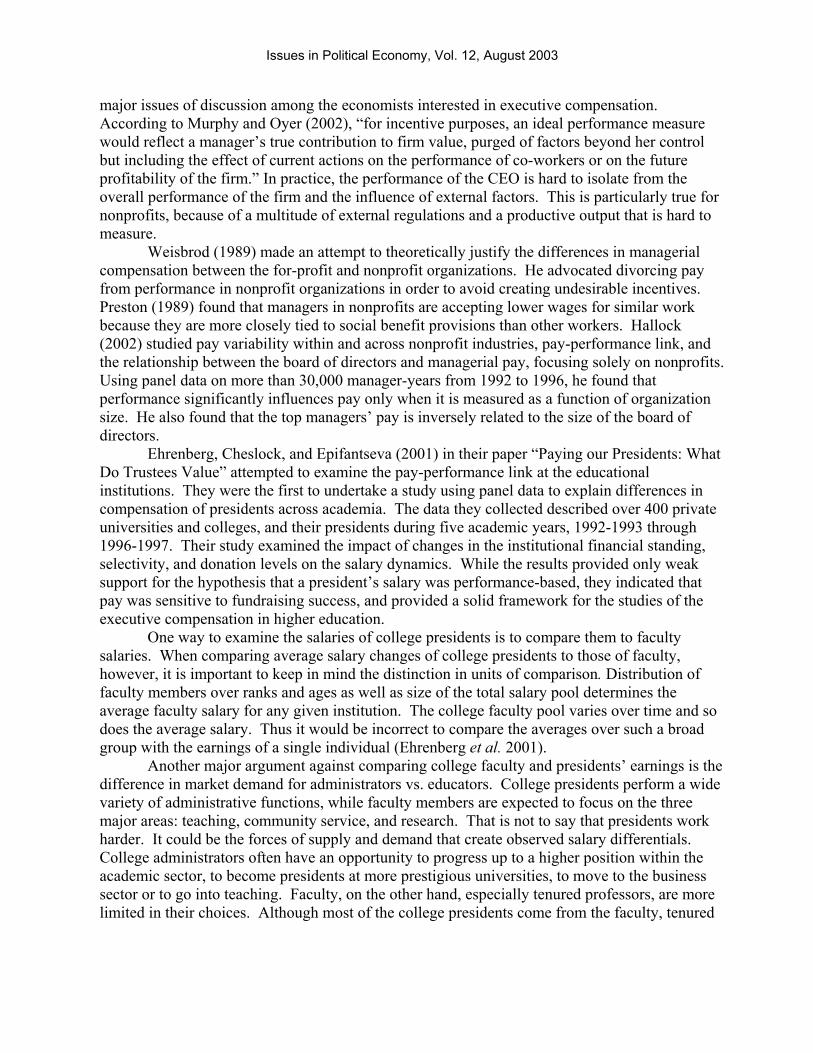
TABLE 1: Descriptive Statistics Variables Minimum Maximum Mean Standard Deviation
Ln (Pay 99-2000) 11.83 12.81 12.21 0.18 Pay 99-2000 137520 365750 204522.19 39619.57 College Performance Variables: Tier 1 3 1.83 0.79 Mean SAT score 1075 1425 1228.22 81.43 Freshmen retention rate (%) 73 98 87.36 5.63 Freshmen in the top of the class (%) 11 84 48.42 15.64
Acceptance rate (%) 19 96 66.46 19.92 Alumni giving rate (%) 15 72 40.78 10.04 Individual Characteristics: Age 40 70 56.65 5.61 Female 0 1 0.23 0.42 Job Tenure 1 28 7.51 5.81 Other presidency 0 1 0.19 0.39 Who’s Who 0 1 0.69 0.46
Table 1 presents the descriptive statistics for all the performance and human capital
variables used to estimate the model. The mean pay of the presidents in academic year 1999 – 2000 is $204,522, ranging from a low of $137,520 to a high of $365,750. The average pay of the presidents, as captured by the 25th and 75th percentile points, is between $181,750 and $226,240.12
The mean age of college presidents in the data set is about 57 years, with a standard deviation of 5.6 years. Female presidents compose 23 percent of the population. Average job tenure is 7.5 years and 18 presidents had experience as presidents at other higher educational institutions before taking their current job.
The average acceptance rate of the institutions in the data set is 66%. The mean SAT score of incoming freshmen is close to 123013, while 48 percent come from the top ten percent of their high school class. As indicated by the mean freshmen retention rate, 87 percent of freshmen entering between 1995 and 1998 returned the following fall. A little over 40 percent of the alumni on average have donated to their colleges during the 1997-1998 and 1998-1999 school years. The average full-time enrollment is 1650, ranging from 443 at Wells College to 3399 at Bucknell University.
The estimated coefficients for the model are reported in the first column of Table 2. Everything else held constant, the presidents of first tier colleges make 9.1 percent more than the second tier presidents, and 15.0 percent more than their counterparts in the third tier colleges14. The coefficient, however, is only significant for the difference between the first and second tier colleges. None of the other college performance variables is significant at conventional level of 10 percent.
Both experience and gender variables are highly statistically significant in the model. Presidents receive about 0.4 percent higher pay each year for each year of tenure in their current position, which is consistent with labor theory and my original hypothesis. Female presidents

Issues in Political Economy, Vol. 12, August 2003
make on average 8.0 percent more than male presidents, ceteris paribus. There are a variety of causes that may account for this difference in pay between TABLE 2: Presidential Pay 1999-2000 Estimated Equations (standard error)
Independent Variables: 1 2
First Tier 0.0874 (0.050)*
Third Tier -0.0516 (0.039)
Mean SAT scorea 0.0359 (0.000)
0.0435 (0.000)
Freshmen retention 0.0045 (.004)
0.0070 (0.004)*
Acceptance rate -0.0017 (0.001)
-0.0028 (0.001)**
Alumni giving rate -0.0022 (0.002)
-0.0011 (0.002)
Female 0.0765 (0.034)**
0.0894 (0.034)***
Job Tenure (experience)
0.0044 (0.002)*
0.0050 (0.002)**
Who’s Who 0.0575 (0.034)*
0.0711 (0.035)***
Intercept 11.457 (0.483)***
11.658 (0.505)***
Sample Size: 97 97 R2 0.558 0.533 R2
adj 0.513 0.493 SEE 0.1308 0.1331 F-ratio 12.362*** 14.664*** SSR 1.507 1.594 a Coefficient has been multiplied by 100
genders. Some labor market characteristics that are correlated with gender may not have been controlled for. A good example would be conflict resolution skills or perceived toughness of women who were able to make it all the way to the top. Also, there may be a difference in treatment of otherwise comparable individuals based on gender, which is often referred to as gender discrimination. Gender gap decomposition, which is often used to detect discrimination, is, however, beyond the scope of this paper. Another reason why trustees may choose to pay women more is because of what female college presidents represent for faculty, current and perspective students, and community. Women are perceived to be historically connected to educational sphere and be more liberal as educators. Having a female college president aids in creating an image of a progressive

Issues in Political Economy, Vol. 12, August 2003
institution with high impact on diversity. Since the female enrollment at private 4-year institutions has been steadily increasing, changing the male-female student ratio from 61/39 in 1970 to 53/47 in 1980, to 46/54 in 199915, there is a growing need to attract women to faculty and administrative positions. Women, however, are still underrepresented among Ph.D. recipients and college administrators. Thus competition for female presidential candidates is more intense than for male ones, which translates into higher earnings premium for women.
Finally, the presidents whose name and biography appear in Who’s Who in America receive 5.9 percent higher pay than their colleagues who are not mentioned in the publication. This finding supports my original hypothesis that more eminent presidents are better paid, independently of the colleges' performance under their supervision.
A number of explanations can be offered for the low statistical significance of the performance variables in my model. First of all, in this project I analyze pay, which is just one part of the compensational package. College presidents also receive benefits that are likely to be more performance-influenced. However, the data on benefits is not available for all the colleges. Also, different colleges use different ways of calculating the total benefit package, which makes it impossible to make comparisons across the institutions.
On the other hand, it is possible that the actual lag between the change in college performance due to the activity of the presidents and the change in pay is more than one year, as was assumed in my model. To start influencing the pay, the performance changes must persist for several years. Not all of the presidents, however, have been in office long enough to be able to considerably influence the policy and performance of the colleges.
Multicollinearity is another possible explanation for the low significance of the colleges’ performance variables. Tier is an aggregate measure for the school’s quality, so it is somewhat correlated with the other performance variables in the model. 16 I remove the tier variables from the model to see if it will reduce multicollinearity. The results are reported in the second column of Table 2. As I anticipated, the restriction leads to the increase of statistical significance in all the performance variables, but only the retention and acceptance rates become significant at conventional level. According to the model estimates, the pay increases by 7.0 percent for every ten percent increase in the retention rate, and decreases by 2.7 percent for every ten percent increase in the acceptance rate, all other factors held constant. The direction of pay change is consistent with my original predictions. The human capital and social capital coefficients remain very similar to those in the original model, although they have higher statistical significance.
IV. CHANGE IN PAY OVER 1998-1999/1999-2000 ACADEMIC YEARS The results of the previous sections suggest that both personal characteristics of the
presidents and institutional attributes influence the pay, but it gives me little insight into what factors have the most weight in determining pay increase.
To estimate the relationships between the pay changes and performance changes, I use am empirical model of the following form: (2) δY = β0 + β1δP +ε, where δP= natural logarithm of presidential pay in 1998-1999 minus the natural logarithm of pay in 1999-2000; δP = change in college performance measures, from 1997-1998 to 1998-1999.
Issues in Political Economy, Vol. 12, August 2003
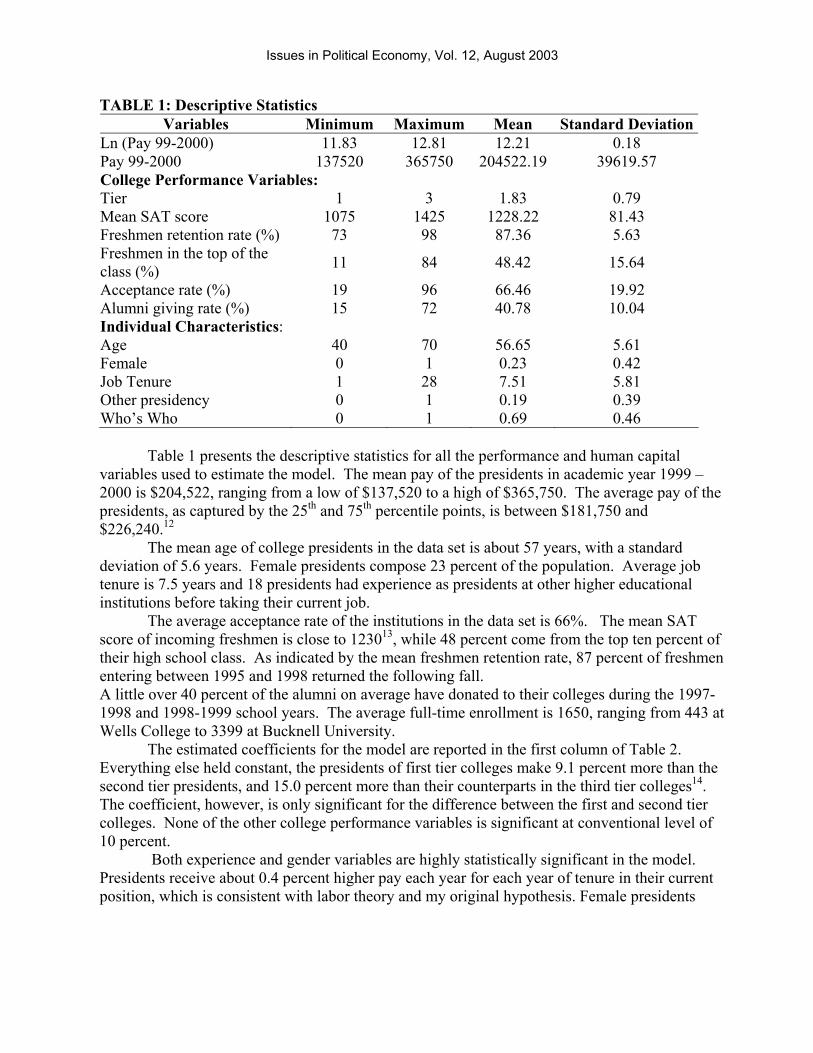
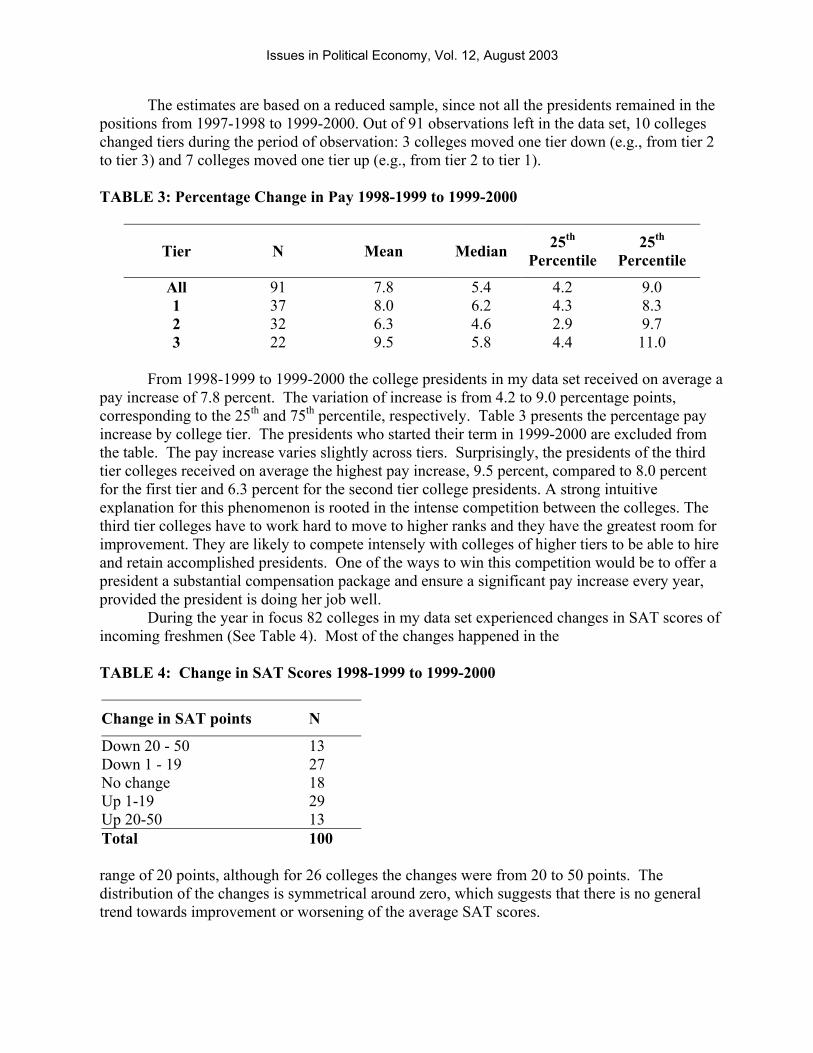
The estimates are based on a reduced sample, since not all the presidents remained in the positions from 1997-1998 to 1999-2000. Out of 91 observations left in the data set, 10 colleges changed tiers during the period of observation: 3 colleges moved one tier down (e.g., from tier 2 to tier 3) and 7 colleges moved one tier up (e.g., from tier 2 to tier 1). TABLE 3: Percentage Change in Pay 1998-1999 to 1999-2000
Tier N Mean Median 25th Percentile
25th Percentile
All 91 7.8 5.4 4.2 9.0 1 37 8.0 6.2 4.3 8.3 2 32 6.3 4.6 2.9 9.7 3 22 9.5 5.8 4.4 11.0
From 1998-1999 to 1999-2000 the college presidents in my data set received on average a
pay increase of 7.8 percent. The variation of increase is from 4.2 to 9.0 percentage points, corresponding to the 25th and 75th percentile, respectively. Table 3 presents the percentage pay increase by college tier. The presidents who started their term in 1999-2000 are excluded from the table. The pay increase varies slightly across tiers. Surprisingly, the presidents of the third tier colleges received on average the highest pay increase, 9.5 percent, compared to 8.0 percent for the first tier and 6.3 percent for the second tier college presidents. A strong intuitive explanation for this phenomenon is rooted in the intense competition between the colleges. The third tier colleges have to work hard to move to higher ranks and they have the greatest room for improvement. They are likely to compete intensely with colleges of higher tiers to be able to hire and retain accomplished presidents. One of the ways to win this competition would be to offer a president a substantial compensation package and ensure a significant pay increase every year, provided the president is doing her job well.
During the year in focus 82 colleges in my data set experienced changes in SAT scores of incoming freshmen (See Table 4). Most of the changes happened in the TABLE 4: Change in SAT Scores 1998-1999 to 1999-2000
Change in SAT points N
Down 20 - 50 13 Down 1 - 19 27 No change 18 Up 1-19 29 Up 20-50 13 Total 100
range of 20 points, although for 26 colleges the changes were from 20 to 50 points. The distribution of the changes is symmetrical around zero, which suggests that there is no general trend towards improvement or worsening of the average SAT scores.

Issues in Political Economy, Vol. 12, August 2003
A roughly similar picture can be observed if we focus on the changes in alumni giving rate from 1998-1999 to 1999-2000 academic years (Table 5). Nineteen colleges did not undergo any changes in the giving rate. Thirty-six colleges improved their giving rate while for 45 colleges the giving rate went down. The range of change is 16 percentage points: 8 percentage points in both directions. TABLE 5: Change in Alumni Giving Rate 1998-1999 to 1999-2000
Percentage points change in giving rate N
Down 4 -8 8 Down 1 - 3 37 No change 19 Up 1-3 31 Up 4-8 5 Total 100
Contrary to what one might expect, no clear pattern can be detected in the changes of
performance measures separated by tier. Roughly the same percentage of schools in all three tiers experiences some or no changes in SAT scores and alumni giving rate. Although the third tier college presidents have the fastest growing pay, there is no evidence that they experience greater changes in the performance variables.
The regression results are presented in the first column of Table 6. The model explains 9.3 percent of total variation in the change of presidential pay. The only statistically significant variable is SAT score. A 100-point increase in incoming freshmen SAT scores causes a 9.8 percent decrease in the pay growth rate.
Although the magnitude of the influence is questionable, the unexpected direction of influence needs explanation. Typically one would anticipate the SAT scores to be an indicator of selectivity and academic environment, and have a positive impact on presidents’ pay: the higher the scores, the more selective the college is. The reality that targeting applicants with higher test scores is expensive can be one of the explanations. To attract students with higher abilities a college has to offer them a competitive and often substantial financial aid package, which reduces the college’s revenues. The decreasing revenues are likely to negatively affect the growth of presidential pay.

Issues in Political Economy, Vol. 12, August 2003
TABLE 6: Change in Presidential Pay from 1998-1999 to 1999-2000 Estimated Equations (standard error)
Independent Variables: 1 2
Change in Tier 0.0395(0.027)
0.0624(0.025)**
Change in SAT score -0.0010(0.000)**
-0.0012(0.000)***
Change in Freshmen Retention
-0.0023(0.004)
Change in Acceptance rate 0.0006(0.002)
Change in Alumni giving rate -0.0007(0.003)
Intercept 0.0737(0.008)***
0.0750(0.008)***
Sample Size: 91 91R2 0.093 0.141R2
adj 0.040 0.122SEE 0.0792 0.0727F-ratio 1.732 7.226***SSR 0.502 0.055
In the second column of Table 6 the regression results for a reduced version of the
original model are reported. To correct for the bias that may be caused by the inclusion of highly insignificant variables I subsequently removed three variables: change in freshmen retention rate, change in acceptance rate, and change in alumni giving rate. Removing these variables improved the fit of the model: the adjusted R-squared increases from 0.04 to 0.12 and the standard error of estimate drops from 0.079 to 0.072. Also the F-ratio becomes statistically significant at a 1 percent level.17
This version of my model explains 14 percent of variation in the change of college presidents’ pay, with the two remaining explanatory variables being highly statistically significant. The results suggest that the presidents of colleges that move one tier up receive a pay increase 6.4 percent larger than their colleagues in colleges that do not change tiers. Thus, if a president receives a pay increase of $10,000 for a given year, she would have received an additional $640 had her college moved one tier up. Also, if the SAT scores of incoming freshmen drop by 100 points, the president is likely to receive an additional 12 percent of her average pay increase as a “bonus”. That is a raise of $11,200 compared to $10,000
The results above suggest that change in college performance variables does not have as strong of an impact on the pay increase of the presidents as I have anticipated. One of the possible explanations lies in the existence of a wide variety of monetary and non-monetary rewards available to the college presidents, which are not directly connected to the pay. A major reward for high achievements is the opportunity to stay in office and retire at a later age. A highly successful president is also likely to receive lucrative offers from other liberal arts colleges

Issues in Political Economy, Vol. 12, August 2003
or bigger research universities (Ehrenberg et al. 2001). Finally, changes in performance may be stronger correlated with benefits as opposed to pay, as assumed in my study.
V. CONCLUSIONS In this paper, I followed the methodology established by Ehrenberg et at. to determine the
factors influencing the pay of liberal arts college presidents and pay growth dynamics. The estimation of an earnings function provided strong support to the assertion that personal characteristics of the presidents are at least as important in determining their pay as the measures of institutional performance.
It has been established that the readily available characteristics of college performance, such as endowment level, alumni giving rate, and the U.S. News and World Report ranking may not only be incomplete, but also biased. Colleges often move between ranks as a result of changes in ranking methodology or as a result of a college tampering with ranking criteria (Ehrenberg 2002). Nevertheless, my findings show that the US News and World Report rank is a significant factor in determining presidential compensation.
Inclusion of the social capital variable provided strong evidence that credentials play a crucial role in determining presidential pay. The results of this study also suggest a strong difference in pay across gender groups. In particular, I found that female college presidents earn approximately 5.7 percent more than male presidents. While excluding from the analysis other variables that are correlated with gender may be the source of some portion of the pay differentials, discrimination may also be the case.
A pay change analysis for the presidents who remained in the office from 1998-1999 to 1999-2000 uncovers some of the causes behind the rapid earnings increase. While moving up in ranks positively influences pay growth, improving freshmen test scores have an opposite effect. If one considers both factors to be the measures of school quality, these results seem conflicting. However, if we keep in mind that increasing selectivity also has a short-term negative impact on college revenues, the results appear more intuitive.
While my study confirms some of the earlier findings of executive compensation research, the results are a mixture of anticipated and unexpected. The estimation of a number of earnings functions reveals that pay-performance link is generally weak. Diversity of functions performed by college presidents and the multilevel structure of their constituency provide a strong intuitive explanation of this phenomenon. In future work I plan to explore alternative ranking methodologies in order to develop a better measure of college presidents' performance.

Issues in Political Economy, Vol. 12, August 2003
REFERENCES Baum, Sandy. Higher Education: Dollars and Sense. College Entrance Examination Board, New York, 2001. Ehrenberg, Ronald. “Reaching for the Brass Ring: The U.S News and World Report Ranking and Competition.” The Review of Higher Education. Vol. 26, 2002: 145-162. Ehrenberg, Ronald, John Cheslock, and Julia Epifantseva. “Paying our Presidents: What do Trustees Value.” The Review of Higher Education. Vol. 25, 2001: 15-37. Gaquin Deirdre and Katherine A. DeBrandt, eds. Education Statistics of the U.S., 3rd ed. Berman, Lanham MD, 2001. Hall, Brian J, and Jeffrey Liebman. “Are CEOs Really Paid Like Bureaucrats?”. The Quarterly Journal of Economics, Vol. 112, 1998. Hallock, Kevin F. “Managerial Pay and Governance in American Nonprofits.” Industrial Relations, vol. 41, 2002. Ikenberry, Stanley, Terry W. Hartle. Taking Stock : How Americans Judge Quality, Affordability, and Leadership at U.S. Colleges and Universities. Washington, D.C. : American Council on Education, 2000. Jensen, Michael, and Kevin Murphy. “Performance, Pay and Top Management Incentives.” Journal of Political Economy, vol. 98, 1990. Joskow, Paul, Nancy Rose, and Andrea Shepherd. “Regulatory Constraints on CEO Compensation.” Brookings Papers on Economic Activity: Microeconomics, 1993.
Monks, James, McGoldrick, KimMarie. “Gender Earnings Differentials among Highly Paid College and University Administrators.” Working paper, 2002. Murphy, Kevin J. “Corporate Perfomance and Managerial Remuneration: An Empirical Analysis.” Journal of Accounting and Economics, vol. 7, 1985. Murphy, Kevin and Paul Oyer, “Discretion in Executive Incentive Contracts: Theory and Evidence.” Working paper, 2002. Nicklin, Julie. “Private-College Presidents Enjoy Another Lucrative Year.” The Chronicle of Higher Education. November 9, 2001. Preston, Anne. “The Nonprofit Worker in a For-Profit World.” Journal o f Labor Economics, October, 1989.

Issues in Political Economy, Vol. 12, August 2003
Schaefer, Schott. “The Dependence of Pay-Performance Sensitivity on the Size of the Firm.” Review of Economics and Statistic, August,1999. U.S. Department of Education. NCES. 2001. Digest of Educational Statistics 2001. Weisbrod, Burton A. “Rewarding Performance that is Hard to Measure: The Private Nonprofit Sector.” Science, New Series, vol. 244, 1989. Who’s Who in America, ed. 53, Chicago: A. N. Marquis, 1999. Who’s Who in America, ed. 54, Chicago: A. N. Marquis, 2000. Who’s Who in American Education 1996-1997, 5th ed, New Providence, NJ: Marquis Who’s Who, 1997. ENDNOTES
1 A good example of competing goals would be profit maximization vs. providing financial aid to students, endowment cultivation vs. building new campus facilities. 2 U.S. News and World Report, USNEWS.COM – America’s Best Colleges: Liberal Arts Colleges - Bachelor’s, <http://www.usnews.com/usnews/edu/college/rankings/ranklibartco_brief.php>, [10 October 2002]. 3 The Chronicle of Higher Education, Facts & Figures, < http://chronicle.com/stats/990/>, [4 October 2002]. 4 The 16 variables used are: six-year graduation rate, freshman retention rate, proportion of classes with fewer than 20 students, proportion with 50 or more students, faculty salary, proportion of professors with the highest degree in their fields, student-faculty ratio, proportion of the faculty who are full time, test scores of enrollees on the SAT or ACT tests, proportion of enrolled freshmen who graduated in the top 10 percent of their high school classes, acceptance rate, yield, average spending per student on instruction, research, student services, and related educational expenditures, graduation rate performance, alumni giving rate, and pier assessment. 5 Marquis Who’s Who <http://www.marquiswhoswho.com/about.asp> [March 12, 2003]. 6 To determine whether to employ a linear or semi log model, I conducted Bera-McAleer test for functional form. The test showed no statistical evidence favoring any of the models, however, the studies of earnings functions typically use log-linear model specification. 7 Average test scores for all enrolled students. The U.S. News provided the average test scores on SAT or ACT converted to percentile scores by using the distribution of all test takers. 25-75th percentile range was reported. To get the mean SAT scores first, I converted all the ACT scores into SAT scores using the table provided by CaliforniaColleges.edu <http://www.californiacolleges.edu/admissions/extras/uc/eligibility_index.asp?poprole=2>, [Nov. 15, 2002] Then, assuming that the scores are normally distributed for the colleges in 2nd tier, and may be skewed to the right for the colleges in 1st tier and to the left for the 3rd tier, I calculated the mean score by adding up high and low scores and dividing the sum by two. 8 Alumni of record are former full- or part-time students that received a degree and for whom the college has a current address. Alumni donors are alumni with undergraduate degrees from

Issues in Political Economy, Vol. 12, August 2003
an institution that made one or more gifts for either current operations or capital expenses during the specified academic year. 9 6 out of 100 presidents have DBA degree 10 There are also some similar publications by Marquis, such as Who’s Who in the Midwest, or Who’s Who Among American Scholars. Although many of the presidents in my data set appear in some of these publications, I have chosen Who’s Who in America because of its broader focus and higher national significance as a bibliographical dictionary. 11 The data set includes all the schools from 1st and 2nd tiers, plus the schools in the 3rd tier, which were listed in 2nd tier by the US News and World Report survey in 2002. 12 In 1998-1999 the average salary of full time professors at a private 4-year institution was $75,549 (Digest of Educational Statistics 2001, 284). 13 According to the Education Statistics of the U.S. (2001, 451) the average SAT scores in 2000 for high school graduates across the country were 1019. 14 All the coefficients are reported after an anti-log adjustment: (eβ -1)*100 15 U.S. Department of Education. NCES, 2001. Digest of Educational Statistics 2001, p. 238. 16 Tier is highly negatively correlated with SAT (Pearson Correlation Coefficient is –0.71) and highly positively correlated with the acceptance rate (coefficient 0.75). 17 Regressing change in salary on the changes in the college performance variables alone does not provide any meaningful results. Only SAT score appears statistically significant, R-squared is 7 percent, and F-statistics is not significant at 10 percent level.