Execution of a Hybrid Vehicle Controls Development Effort ...
83
Dissertations and Theses 8-2014 Execution of a Hybrid Vehicle Controls Development Effort Execution of a Hybrid Vehicle Controls Development Effort Utilizing Model-Based Design, Hardware-in-the-loop Testing, Agile Utilizing Model-Based Design, Hardware-in-the-loop Testing, Agile Scrum Methods and Requirements Engineering Scrum Methods and Requirements Engineering Derek Simon Bonderczuk Embry-Riddle Aeronautical University - Daytona Beach Follow this and additional works at: https://commons.erau.edu/edt Part of the Automotive Engineering Commons Scholarly Commons Citation Scholarly Commons Citation Bonderczuk, Derek Simon, "Execution of a Hybrid Vehicle Controls Development Effort Utilizing Model- Based Design, Hardware-in-the-loop Testing, Agile Scrum Methods and Requirements Engineering" (2014). Dissertations and Theses. 165. https://commons.erau.edu/edt/165 This Thesis - Open Access is brought to you for free and open access by Scholarly Commons. It has been accepted for inclusion in Dissertations and Theses by an authorized administrator of Scholarly Commons. For more information, please contact [email protected].
Transcript of Execution of a Hybrid Vehicle Controls Development Effort ...
Dissertations and Theses
8-2014
Execution of a Hybrid Vehicle Controls Development Effort Execution of a Hybrid Vehicle Controls Development Effort
Utilizing Model-Based Design, Hardware-in-the-loop Testing, Agile Utilizing Model-Based Design, Hardware-in-the-loop Testing, Agile
Scrum Methods and Requirements Engineering Scrum Methods and Requirements Engineering
Derek Simon Bonderczuk Embry-Riddle Aeronautical University - Daytona Beach
Follow this and additional works at: https://commons.erau.edu/edt
Part of the Automotive Engineering Commons
Scholarly Commons Citation Scholarly Commons Citation Bonderczuk, Derek Simon, "Execution of a Hybrid Vehicle Controls Development Effort Utilizing Model-Based Design, Hardware-in-the-loop Testing, Agile Scrum Methods and Requirements Engineering" (2014). Dissertations and Theses. 165. https://commons.erau.edu/edt/165
This Thesis - Open Access is brought to you for free and open access by Scholarly Commons. It has been accepted for inclusion in Dissertations and Theses by an authorized administrator of Scholarly Commons. For more information, please contact [email protected].

Execution of a Hybrid Vehicle Controls Development Effort Utilizing Model-Based Design, Hardware-in-the-loop Testing, Agile Scrum Methods and Requirements
Engineering
by
Derek Simon Bonderczuk
A Thesis Submitted to the College of Engineering Department of Mechanical Engineering in Partial Fulfillment of the Requirements for the Degree of
Master of Science in Mechanical Engineering
Embry-Riddle Aeronautical University Daytona Beach, Florida
August 2014

iii
Acknowledgements
Firstly, I would like to dedicate the first fruits of my efforts to The Almighty God.
From Him I receive my inspiration, my drive and my ability. I would also like to thank
my mother for instilling in me the discipline and fortitude needed to overcome any
obstacle.
I would like to acknowledge Dr. Compere for giving me the opportunity to
contribute my efforts to a most worthy cause. I would also like to recognize Dr. Currier
for his incredible, selfless and tireless effort to guide all of us in our time of need. I
would also like to thank Dave Spitzer for his valuable expertise and insights regarding
cars, business and people.
I would like to thank the executive steering committee of the Advanced Vehicle
Technology Competition group at Argonne National Laboratories as well as contacts at
all of the AVTC sponsor organizations for their generous support of the EcoCAR 2
competition and our team. In particular, I would like to thank GM’s Dimitri Karatsinides
and RMS’s Azam Khan and Chris Brune for supporting our development to an extent far
above and beyond my expectations.
Finally, I would like to thank all of the EcoEagles for building an amazing vehicle
for me to research with. I am privileged to have worked with such a determined and
experienced group of young professionals and I am honored to call them friends.

iv
Abstract Researcher: Derek Simon Bonderczuk
Title: Execution of a Hybrid Vehicle Controls Development Effort Utilizing Model-Based Design, Hardware-in-the-loop Testing, Agile Scrum Methods and Requirements Engineering
Institution: Embry-Riddle Aeronautical University
Degree: Master of Science in Mechanical Engineering
Year: 2014
Modern hybrid vehicles require sophisticated supervisory control systems in order
to realize competitive efficiency gains. Processes such as model-based design, HIL
simulation and Agile Scrum methods can allow for quicker and less costly development
of a complex product. The design of a supervisory control system for a prototype PHEV
vehicle was executed with the intent of developing a mule vehicle into a 99% production
ready vehicle. The control system design process was carried through from requirements
definition to operating parameter optimization of utilizing model-based design, HIL
simulation and the Scrum model. A prototype vehicle that has a fully functioning hybrid
system with innovative propulsion control methods has been produced by this process.
v
Contents Acknowledgements ............................................................................................................ iii Abstract .............................................................................................................................. iv
Chapter I - Introduction ...................................................................................................... 7
Statement of the Problem ................................................................................................ 9
Thesis Definition ........................................................................................................... 10
Thesis Scope ................................................................................................................. 10
Definitions of Acronyms............................................................................................... 11
Chapter II - Review of the Relevant Literature ................................................................ 12
Dynamic Vehicle Modelling ......................................................................................... 12
Simulation Platforms .................................................................................................... 14
Requirements Engineering ............................................................................................ 15
Scrum Development Methodology ............................................................................... 16
Chapter III – Methodology ............................................................................................... 19
Simulation Platform Development ............................................................................... 19
Scrum Model Implementation ...................................................................................... 24
Requirements Specification .......................................................................................... 26
Chapter IV – Results ......................................................................................................... 29
Benefits of HIL Simulation Development .................................................................... 29
Characterization Data Obtained .................................................................................... 30
Vehicle Performance ..................................................................................................... 34
Requirements Specification .......................................................................................... 41
Chapter V - Discussions and Conclusions ........................................................................ 43
Discussions ................................................................................................................... 43
Conclusions ................................................................................................................... 43
Recommendations ......................................................................................................... 44
Future Work .................................................................................................................. 44
References ......................................................................................................................... 45
Appendix A ....................................................................................................................... 47
Appendix B ....................................................................................................................... 59
Appendix C ....................................................................................................................... 78
vi
List of Figures Figure 1 - Series Hybrid Architecture () ............................................................................. 8 Figure 2 - Free-Body Diagram of Vehicle Chassis (Brown University School of Engineering) ...................................................................................................................... 14 Figure 3 - Device Unit Testing and Modelling Process ................................................... 21 Figure 4 - Gain Schedules for Genset Speed Controller .................................................. 23 Figure 5 - Genset Control System Diagram ..................................................................... 23 Figure 6- Development Workflow ................................................................................... 28 Figure 7 - Genset Characterization Test Profile ............................................................... 30 Figure 8 - BSFC Map ....................................................................................................... 30 Figure 9 - Battery Characterization Test Profile .............................................................. 32 Figure 10 - Battery Zero-Load Voltage Map ................................................................... 33 Figure 11 - 0 - 60 Acceleration Velocity Comparison ..................................................... 35 Figure 12 – 0 - 60 Acceleration Current Comparison ...................................................... 36 Figure 13 - Genset Start Torque and Speed...................................................................... 37 Figure 14 - Genset Controller Performance With Boost Disturbance .............................. 38 Figure 15 - Regen Assisted Slowdown ............................................................................ 40 Figure 16 - Automated Validation Test Output ................................................................ 42
List of Tables
Table 1 - Simulation Platform Descriptions ..................................................................... 19 Table 2 - Software Version Log Excerpt .......................................................................... 24 Table 3 - Model Discrepancy Case Log Excerpt .............................................................. 25 Table 4 - Requirements Document Excerpt ...................................................................... 27
7
7
Chapter I - Introduction
This thesis will focus on the body of work that was conducted in constructing a
prototype mule vehicle for the EcoCAR 2 competition. This vehicle was designed, built,
tested and refined over a three year development cycle as per the competition’s schedule.
Aspects of the design were influenced by the demands for content in key deliverables
throughout the competition.
The EcoCAR 2 competition is a student vehicle design competition organized by
Argonne National Laboratories and sponsored primarily by the U.S. Department of
Energy and General Motors. Fifteen universities developed a vehicle for the competition.
Year one of the competition was designated as the design phase, where teams developed
simulations and Computer Aided Design (CAD) models which guided the integration to
follow. Year two was the integration phase where teams assembled the vehicle according
to their designs from year one or revised designs from the beginning of year two. Most
of the teams managed to conduct limited testing before the year two competition. Year
three of the competition was the refinement period. Teams tested their vehicle and
improved it using the simulation platforms that they have refined alongside of it.
The vehicle developed at Embry-Riddle Aeronautical University was a Diesel
Series Plug-in Hybrid Electric Vehicle. Its powertrain consists of a battery pack, an
electric traction motor, a fixed gear transaxle and a Diesel engine coupled to an electric
generator. This vehicle is based off of the 2013 GM Chevrolet Malibu platform and
features a mostly stock interior aside from an added user interface screen. A diagram of
the vehicle architecture can be seen in Figure 1.

8
8
Figure 1 - Series Hybrid Architecture
Vehicle development started with modelling idealized hybrid vehicle architectures
for the purpose of selecting an architecture and components. These models featured
vehicle subsystem plant models and a very simple controller model. Once an architecture
and components were selected, these basic models were expanded to include simulated
vehicle interfaces and a fully functioning supervisory controller model. This platform is
known as a Software-In-the-Loop (SIL) simulation platform. After this stage, the SIL
models were incorporated into a Hardware-In-the-Loop (HIL) simulation featuring an
embedded computer running the plant model simulation and another embedded computer
running the controller model. These two computers were connected as they exist in the
vehicle with all serial, analog and digital channels being simulated. As more information
regarding the operating characteristics of the individual components was revealed
through testing, the subsystem models were improved in order to enable useful HIL
testing and optimization.

9
9
Once a HIL simulation was constructed and subsystem testing was underway, the
need for specific, quantifiable and verifiable vehicle supervisory control requirements
became apparent. Requirements were written through a collaborative effort between the
controls, mechanical and electrical subteams. These requirements were then linked to
software unit tests that would be utilized for their verification. These tests were mostly
automated such that their execution would be made quick and consistent.
The development team was organized and its responsibilities and tools were
established in accordance with the definitions and procedures of the Scrum method as
outlined in the Scrum Guide (Schwaber & Sutherland, 2013). This method was chosen
because of its strength in environments that feature low staffing levels and need for
adaptability. The development team consisted of three individual members that
interfaced with the overall team lead, who was the product owner as described in the
Scrum Guide. The controls team lead, who was also a member of the development team,
was chosen as the Scrum Master (Schwaber & Sutherland, 2013).
Statement of the Problem
There is increasing demand on automakers from consumers and environmental
organizations to develop cleaner, more efficient vehicles. These vehicles require
sophisticated control systems that have become increasingly difficult to develop and
validate.
Several new techniques have been introduced into the automotive industry and
several other software-based industries that promote the rapid development of
sophisticated products and cohesion within small groups handling complex tasks. These

10
10
methods, which include HIL simulation and model-based development and the Scrum
model, could potentially be valuable tools for an ambitious, lean development team with
little room for delays.
In order to optimize the performance of small development groups in their pursuit
of innovation, these methods must be validated together using an appropriate task and its
execution as a benchmark.
Thesis Definition
This thesis details the process of supervisory control unit development for a
Diesel powered series plug-in hybrid electric vehicle during the second and third year of
Embry-Riddle Aeronautical University’s involvement of the EcoCAR 2 competition. In
order to ensure the effective development of a competitive vehicle, the controller was
developed using model-based design and HIL simulation using the Scrum model. The
use of the methods described in this thesis led to the successful development of a hybrid
vehicle and the accumulation of test data that can be used for refinement of the
simulations developed.
Thesis Scope The scope of this thesis is as follows:
1. Plant Model Development
A review of the simulation development work undertaken throughout the
EcoCAR II competition will be presented. In addition, tests were conducted
in order to gain data that could improve plant model simulations. This body

11
11
of work has previously been presented in the Modelling and Simulation
Whitepaper submission for the EcoCAR 2 competition. This paper is
included in appendix A.
2. SCU Development
Development of key controller features, including a nonlinear genset speed
controller, was conducted. Results of controller development have been
captured in the Final Technical Report submitted to the competition. This
paper is included in appendix B.
3. Use of the Scrum Development Model
The Scrum model was utilized in order to maintain effective and cohesive
development among a small development team. The use of requirements
engineering techniques was incorporated into this process. A paper detailing
the implementation of this method was submitted to the IMECE 2014
conference proceedings. This paper is included in appendix C.
Definitions of Acronyms MIL – Model-in-the-Loop SIL – Software-in-the-Loop HIL – Hardware-in-the-Loop SCU – Supervisory Controller Unit ECM – Engine Control Module BCM – Battery Control Module SOC – State of Charge DFMEA – Design for Failure Mode and Effects Analysis

12
12
Chapter II - Review of the Relevant Literature
Dynamic Vehicle Modelling
Modern hybrid vehicles contain complex drivetrains that must be controlled using
sophisticated control strategies (Harries, 2012). In order to develop vehicle control
software in a short time period, A Model Based Design process was utilized. Model
Based Design allows for the quick development of control software by eliminating the
need for much of the field testing typically associated with development. Although there
are large costs associated with developing a plant model of a system up-front, these costs
are recuperated through the elimination of testing time and the construction of prototype
systems or test benches (Reedy, Lunzman, & Mekari, 2011).
Modelling of vehicle powertrains for the purpose of developing control systems
requires the creation and integration of subsystem models for all power producing and
transfer components and controllers. Engines, motors, batteries, transmissions,
suspensions, chassis and wheels are systems that are typically modelled (Park, Lee, Jin,
& Kwak, 2014).
For the purposes of architecture and component selection, as well as optimization
of a hybrid strategy, the engine model can be made by abstracting the behavior of the
individual parts into a series of maps that capture quasi-steady state behavior. This is
typically accomplished through the use of tables that specify torque and fuel flow rate as
a function of engine speed and throttle actuation percentage (Shanmuganathan,
Govarthanan, Muthumailvaganan, & Imayakumar, 2006).
Further development of engine models leads to thermodynamic modelling of the
working fluid and the engine structure. Though the potential for better results exists, this

13
13
type of model can be difficult to construct because of the difficulty in ascertaining
parameters and equations describing the intake, exhaust and valvetrain systems (Nutt,
Bhatti, Rizwi, Mufti, & Kazmi, 2009).
Modelling of electric machines can be approached in a similar way to that of
engine modelling. A series of tables for torque and efficiency can be made as a function
of speed and demand. Again, this is usually done because of the availability of test data.
Modelling of electric machines, specifically Permanent Magnet Synchronous Machines
(PMSM) can be taken further by performing the Park-Clarke transformation on the input
and output of the modelling, thereby transforming the voltages and currents on the three
channels to d and q axis state variables (Park et al., 2014).
Modelling of transmissions is typically done by evaluating torque and speed
reductions that take place as the result of gear ratios that are activated. An efficiency and
inertia may be attributed to the gears to augment vehicle mass with equivalent rotational
mass. Clutches and torque converters may be modelled by varying the efficiency of
torque transfer and by allowing a variable “torque drop” across the components (Park et
al., 2014).
Modelling of the chassis and wheels involves finding the parameters associated
with the aerodynamic and inertial properties associated with them. Properties of
importance are the drag coefficient “Cd”, frontal area “Af”, rolling resistance “μrr” and
combined equivalent inertia “meq”, which is the sum of the mass and the converted
rotational inertia of all rotating components (Park et al., 2014). A free body diagram
depicting the summation of forces on a vehicle body is shown in Figure 2.

14
14
Figure 2 - Free-Body Diagram of Vehicle Chassis (Brown University School of Engineering)
Simulation Platforms
Within the last 20 years, the automotive industry has experienced a great change
in the way that vehicle software is developed (dSPACE Inc, 2014). The introduction of
the HIL simulation platform has given developers the opportunity to begin testing and
validating the behavior of prototype controllers before a prototype vehicle is ready
(Halvorsen, 2011). HIL testing has allowed for the elimination of many software
problems well before field testing in complex projects which contributes to large
reductions in project cost and timescales (Halvorsen, 2011).
A HIL platform consists of a host computer that is connected to one or more I/O
modules. The host computer executes a simulation of a plant system and communicates
with the I/O modules in order to perform actuation. Device controllers, called Electronic
Control Units (ECU), are connected to the I/O modules and interact with their
corresponding plant model subsystems just like they would in the physical system. These
devices are tested using test cases that are linked to function requirements in order to
validate functionality. As physical prototypes are produced and tested, discrepancies
between physical prototype and HIL simulation behavior are rectified by incorporating

15
15
more detailed models into the HIL platform or by adjusting parameters so that output data
will match test data (dSPACE Inc, 2013).
The use of the HIL simulation platform adds several useful development tools to
the arsenal of an organization. HIL simulators can offer an effective training device for
equipment operators as actual plant control hardware may be used. In addition, control
parameters may be tuned in simulation if the plant model is accurate enough. Also,
control components may be tested for fault mitigation without damaging any functional
prototypes (Halvorsen, 2011).
Requirements Engineering
In order to develop control software that allows a hybrid vehicle to safely exercise
all of the behaviors demanded of it, a list of requirements must be made and managed
well. The process of requirements engineering can be broken down into 5 main steps.
These steps are requirements extraction, discussion, documentation, validation and
management (Attarha & Modiri, 2011).
Requirement extraction involves the collection of raw data used to specify
requirements. This data can be sourced from interviews, brain storming sessions or
through focus groups. Difficulties can arise because of confusion over what the product
is supposed to do or the limits of the project. During the analysis of the requirements,
they are modelled and prioritized. At this stage, all requirements should be compatible
with each other. The documentation of requirements involves publishing them in formal
requirements documents that are generated manually or through the use of a specialized
tool. Requirements should be categorized (functional, nonfunctional, limitations) and
convey the features of the product to stakeholders as well as developers in an

16
16
understandable manner. Requirements validation involves checking to see if
requirements adequately specify the behavior of the product. Management of
requirements involves the handling of all requests made to change requirements. This
includes the actions of analyzing the change, allowing or denying it and actually
implementing it (Attarha & Modiri, 2011).
The importance of requirements engineering can be found in the resources, time
and money that can be saved in cutting down on support needed in the future. A well-
designed system, which must be well-specified, will be much easier to maintain and will
cost less in the long run (Attarha & Modiri, 2011).
Scrum Development Methodology
There are several different models for managing software development projects.
A method that has proven particularly effective for projects that require a high degree of
adaptability from the development team is the Scrum method. The scrum method
reduces the amount of time spent managing development by encouraging transparency,
necessary oversight and adaptation. The formal definitions of the method’s three
“pillars” are the following:
1. Transparency – “Significant aspects of the process must be visible to those responsible
for the outcome. Transparency requires those aspects be defined by a common standard
so observers share a common understanding of what is being seen. (Schwaber &
Sutherland, 2013)”
2. Inspection – “Scrum users must frequently inspect Scrum artifacts and progress toward
a Sprint Goal to detect undesirable variances. Their inspection should not be so frequent

17
17
that inspection gets in the way of the work. Inspections are most beneficial when
diligently performed by skilled inspectors at the point of work. (Schwaber & Sutherland,
2013) “
3. Adaptation – “If an inspector determines that one or more aspects of a process deviate
outside acceptable limits, and that the resulting product will be unacceptable, the process
or the material being processed must be adjusted. An adjustment must be made as soon as
possible to minimize further deviation. (Schwaber & Sutherland, 2013)”
There are two documents utilized by the Scrum model. These documents, the
Product Backlog and the Sprint Backlog contain product features to be implemented in
the future. The product backlog contains all features that will ever be needed and the
sprint backlog contains features that will be implemented in a particular “package” or
release. The product backlog is seen by all members of the project team and is managed
by the product owner. The Spring Backlog is seen and managed only by the Scrum
master and the development team and is used for pacing discrete stretches of work,
known as sprints (Schwaber & Sutherland, 2013).
There are three organizations that work within the Scrum framework in order to
develop and coordinate development. Using the Product Backlog, the Product owner
paces development on behalf of stakeholders such that all project goals are met
(Schwaber & Sutherland, 2013). The Scrum master serves as the mediator between the
development team and the product owner. The Scrum master ensures that all principles
of the development model are being adhered to and seeks to optimize the performance of
the main work group, which is the development team (Schwaber & Sutherland, 2013).

18
18
Development is broken up into five events that are repeated until the project is
completed. These events center around the sprint, which is the main development
interval during which no requirements change. The sprint planning event is when the
goals for the sprint are enumerated. These goals are taken from the Product Backlog.
The daily Scrum is a brief meeting that is held between the Scrum master and the
development team in order to assess the progress of the current Sprint. The sprint review
is a time during which the product owner and the development team come together and
discuss the final result of the sprint. The sprint retrospective is a meeting during which
the development team and the Scrum master address procedural changes that need to be
made or deviances from the Scrum methodology that need to be rectified (Schwaber &
Sutherland, 2013).
19
19
Chapter III – Methodology
Simulation Platform Development
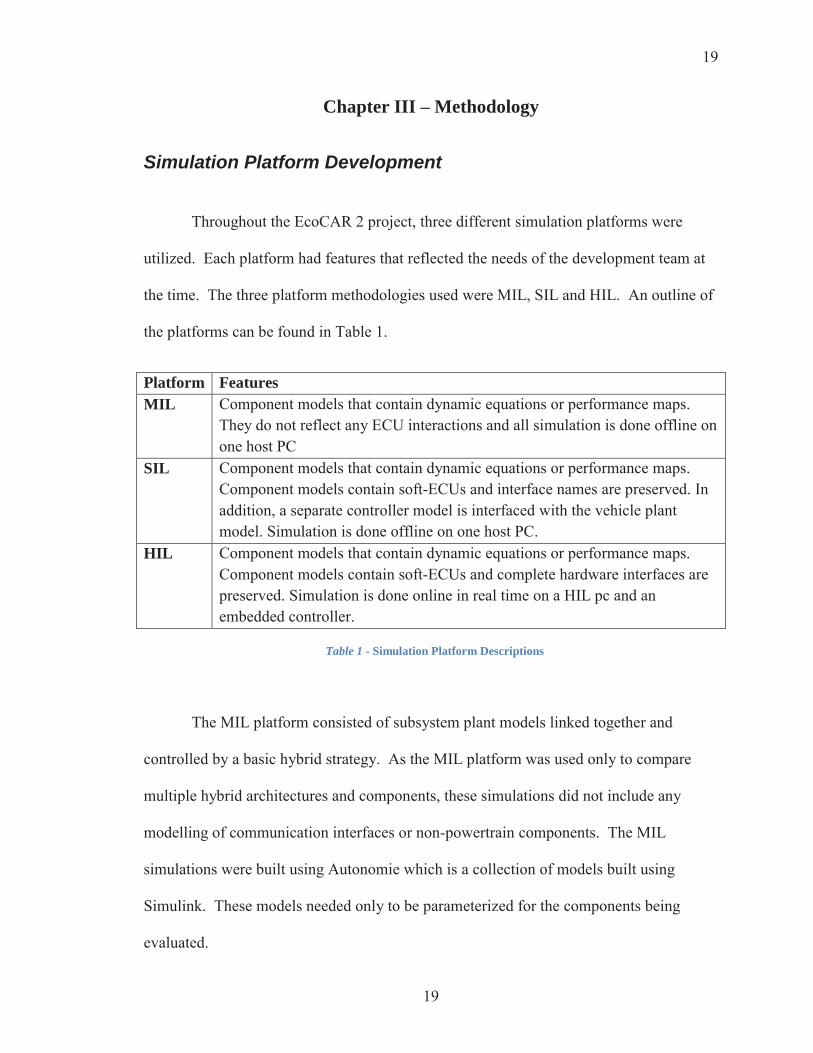
Throughout the EcoCAR 2 project, three different simulation platforms were
utilized. Each platform had features that reflected the needs of the development team at
the time. The three platform methodologies used were MIL, SIL and HIL. An outline of
the platforms can be found in Table 1.
The MIL platform consisted of subsystem plant models linked together and
controlled by a basic hybrid strategy. As the MIL platform was used only to compare
multiple hybrid architectures and components, these simulations did not include any
modelling of communication interfaces or non-powertrain components. The MIL
simulations were built using Autonomie which is a collection of models built using
Simulink. These models needed only to be parameterized for the components being
evaluated.
Platform Features MIL Component models that contain dynamic equations or performance maps.
They do not reflect any ECU interactions and all simulation is done offline on one host PC
SIL Component models that contain dynamic equations or performance maps. Component models contain soft-ECUs and interface names are preserved. In addition, a separate controller model is interfaced with the vehicle plant model. Simulation is done offline on one host PC.
HIL Component models that contain dynamic equations or performance maps. Component models contain soft-ECUs and complete hardware interfaces are preserved. Simulation is done online in real time on a HIL pc and an embedded controller.
Table 1 - Simulation Platform Descriptions
20
20
Once the Series Diesel Architecture was selected, a SIL model was then
developed. The SIL model was built from parameterized models sourced by dSPACE
Inc. These models were parameterized as necessary in order to match the components
that were ultimately chosen. The SIL simulation was the first to be joined with a team
developed control strategy. As development of the SIL model continued, simulated
hardware interfaces were added. Signals from the plant model were named and grouped
as the CAN messages that they represented. Modelling the Serial, digital and analog
communication made the transition to a HIL platform easier.
The HIL platform was developed using the same SIL plant model and controller
model. A dSPACE Midsize HIL simulator was used to simulate the vehicle. The HIL
hardware used features multiple Analog, Digital and CAN channels that allowed for the
complete simulation of the powertrain to be added to the prototype vehicle. The
controller model was executed on a dSPACE MicroAutoBox II which is an embedded PC
with I/O comparable to the HIL simulator used. This same controller was used in the
prototype vehicle once it was constructed.
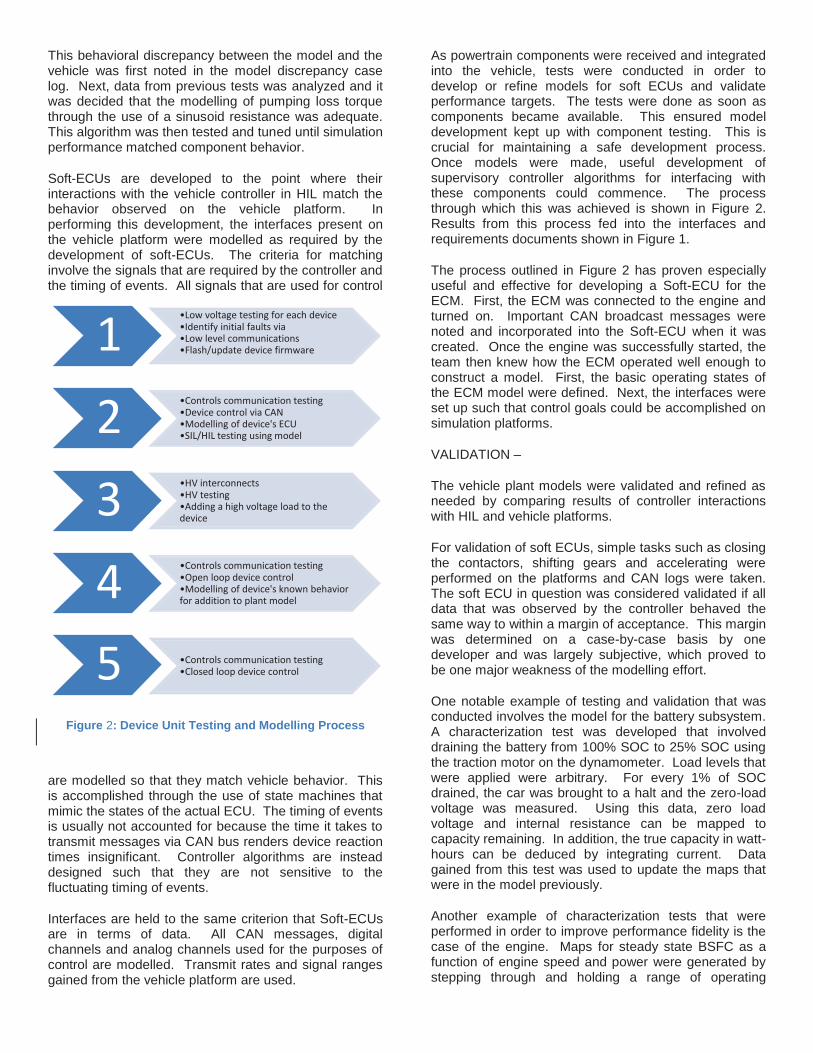
As work during years two and three progressed, new devices were tested and their
behaviors were incorporated into the models. This was accomplished through the use of
a procedure that prescribed the use of limited bench testing of a component, followed by
modelling and controls development. The process is outlined in Figure 3.

21
21
Figure 3 - Device Unit Testing and Modelling Process
, This process encouraged safe testing, integration and validation of the operation
of components in situations involving high power components that could present a risk to
themselves if improperly handled
One situation where this process was particularly useful was in the initial tests
conducted on the engine/generator or genset system. During stage one, the generator
inverter and Engine Control Module (ECM) were powered on and their faults were noted
and rectified programmatically or electrically. Some of the faults required information
from missing components that were not needed to be broadcast over their serial networks,
whereas others required open circuits to be completed with resistors. Once most of the
expected components that were missing were mimicked and the correct faults were
eliminated, the systems functioned normally. The needed changes were added to the
1 •Low voltage testing for each device •Identify initial faults via •Low level communications •Flash/update device firmware
2 •Controls communication testing •Device control via CAN •Modelling of device's ECU •SIL/HIL testing using model
3 •HV interconnects •HV testing •Adding a high voltage load to the device
4 •Controls communication testing •Open loop device control •Modelling of device's known behavior
5 •Controls communication testing •Closed loop device control
22
22
models in stage two. Stage three was a physical integration phase during which no
testing occurred.
Stage four featured the first open-loop testing of the genset system. The throttle
setting of the engine as well as the speed command sent to the generator inverter was
under control of the test operator for this phase. The engine was tested throughout it’s
entire expected operating envelope in order to acquire data for models as well as verify
its operation. For stage five testing, control of the devices was integrated into the
controller model and the vehicle was driven in order to validate closed loop operation. A
plot of the setpoints achieved and s BSFC map was generated as a result of this
characterization testing.
These tests were conducted with the generator inverter operating in speed
command mode. A custom speed controller was developed that issues torque commands
to the inverter instead of speed commands. This controller uses gains that are mapped as
a function of speed error. The controller was first developed on the HIL platform. Gains
were tuned until an acceptable response was obtained. The algorithm was then
implemented on the vehicle platform and tuned until the desired behavior was obtained.
The functions used for the mapping can be seen in Figure 4 and a depiction of the entire
control strategy can be seen in Figure 5.

23
23
Figure 4 - Gain Schedules for Genset Speed Controller
Figure 5 - Genset Control System Diagram
The boundary layers that can be seen in the function allow for a very strict
controller in low speed error regimes, but also allow for a more “forgiving” controller
when the error increases. This functionality has proven useful as disturbances in engine
boost, and therefore the opposing torque from the engine, do happen. These disturbances
are handled well by the controller and the engine speed is kept stable.
The characterization data gained from these tests will allow for future
optimization of the models constructed by the development team. In addition, they will
allow for a good estimate of the performance to be expected from comparable engines.

24
24
Scrum Model Implementation The Scrum model for software development was chosen because of the small size
of the development team and its lack of prior experience undertaking a software design
project. All of the personnel and artifacts, as well as most of the events prescribed by the
official Scrum guide.
The overall team leader was chosen to be the product owner. The product owner
guided discussions concerning the desired functionality of the vehicle at team meetings.
As subteam leads from the mechanical and electrical teams were also in attendance, they
were consulted by the product owner regarding specific functionality needs for their
particular subsystems. The controls team lead was chosen to be Scrum master because of
the proximity of both positions to the development team’s body of work. The
development team consisted of the members of the controls team as they were.
Artifacts were used as prescribed in the Scrum guide, albeit tailored for the team’s
specific needs. The Product Backlog, which was the functional requirements list, was
prioritized by the Product Owner. These requirements were targeted for implementation
in the software as their functionality became needed. The Sprint Backlog was written in
a collaborative effort between the development team and the Scrum master. The Sprint
Backlog contained a breakdown of all of the expected functionality to be contained in the
next anticipated release of software. An example can be seen in Table 2.
Version Codename Code Status
Validation Status
Use Status
Time Used (hh:mm:ss)
Notable Features
Comments
3.6 Ribeye Active-Dev
HIL, Vehicle
Active Use
0:00:00 Floating-Zero Regen
Table 2 - Software Version Log Excerpt

25
25
A similar document was kept for the plant model being developed for the SIL and
HIL platforms. An example can be seen in Table 3.
Version Algorithm Simulated Behavior
Vehicle Behavior
Priority Changed by
Corrective Action
3.6.x
Chassis Car accelerates faster than it should
Car is slower than predicted
High Derek Bonderczuk
Corrected mass, Cd, A and rolling resistance coefficients.
Table 3 - Model Discrepancy Case Log Excerpt
These two documents were updated with new line items during sprint planning
meetings. Once sprint planning meetings were concluded, the list of features to be
included in a particular version of software was finalized. Once a sprint was concluded,
the software was tested by different subteams and concerns were expressed at the next
team meeting. A meeting in this context was considered a review of the past sprint.
Sprint retrospective meetings were not held in a formal setting, but they occurred
sporadically and involved at least the Scrum Master and the Product Owner. Because the
development team was so small and rarely available all at one time, daily Scrum
meetings were conducted through text messages and e-mails in order to avoid
unnecessary inconvenience.

26
26
Requirements Specification In order to begin the process of requirements specification for the vehicle
controller, the intended functionality of the product had to be determined by the
development team. In order to elicit preliminary requirements, team meetings were
conducted. The mechanical and electrical subteams were consulted regularly to
determine possible fault cases, limits and desired modes of operation of the prototype
vehicle. These team meetings were also utilized for all steps of requirements definition,
analysis and management. Requirements were written as functionality to be added was
discussed by the development team. Because the entire breadth of functionality to be
included in the final product was not originally known, the Scrum model for development
was chosen. Once requirements were specified, tests were written that would validate
those requirements on the HIL platform. These tests were then formed into an automated
test execution script that was used to validate the functionality of each software release.
An example of the requirements that were written can be found in Table 4.

27
27
Algorithm Component Identification Number
Requirement Validation Procedure
Pass/Fail Condition
Torque Application
Accelerator Pedal
2.1.1 Accelerator pedal must correspond to a torque demand from -311 to 311Nm in drive.
1) Key shall be actuated ACC-ON-CRANK-ON. 2) Shift P-R-N-D. 3) Actuate accelerator pedal from 0 to 100%.
Pass if 0Nm is hit at 0% and 311Nm is hit at 100% with no higher or lower values hit.
2.1.2 Accelerator pedal must correspond to a torque demand from -150 to 150Nm in reverse.
1) Key shall be actuated ACC-ON-CRANK-ON. 2) Shift P-R. 3) Actuate accelerator pedal from 0 to 100%.
Pass if 0Nm is hit at 0% and 311Nm is hit at 100% with no higher or lower values hit.
Table 4 - Requirements Document Excerpt
Requirement specification is an iterative process that precedes HIL and vehicle
testing. The process involves the entire development team as well as other subteams.
The process begins with an analysis on the safety implications of the addition of new
features. This is conducted by all subteam leads and any findings are reflected in the
Differential Failure Mode and Effects Analysis (DFMEA). Requirements are then
written and the development team incorporates the requirement tests into the automated
testing routine for the HIL platform. The electrical team updates wiring documentation
with any harness changes. The development team then makes the necessary algorithm

28
28
changes and tests them. Any bugs are then noted and rectified and the process repeats
until the algorithm passes all defined criteria. This process is illustrated in Figure 6.
Figure 6- Development Workflow
29
29
Chapter IV – Results
Benefits of HIL Simulation Development
The use of the HIL platform for development has allowed the development team
to conduct a considerable amount of work in tandem with the construction of the vehicle.
Throughout year two of the competition, the prototype vehicle was not available for
testing. In spite of this, individual components were tested for functionality and their
interfaces and behaviors were modelled in order to facilitate more productive
development in year three of the competition.
The use of explicit, readable and verifiable requirements has allowed the team to
have a complete, unified image of how the product is supposed to function. This has
allowed for the concerns of the mechanical and electrical subteams to be effectively
communicated to the controls team. The requirements, which were also linked to tests
that were automated, provided absolute criteria for validation which is something that has
allowed for confidence in the product that was developed.
The control software has allowed for the vehicle to complete all of the events in
the EcoCAR 2 year three competition. These events include ride quality, acceleration,
dynamic handling, efficiency and emissions tests. The results were indicative that the
vehicle developed was indeed a desirable one overall. The vehicle had satisfactory
acceleration and good handling characteristics. The vehicle ended up having a combined
mileage of approximately 30 miles per gallon.
30
30
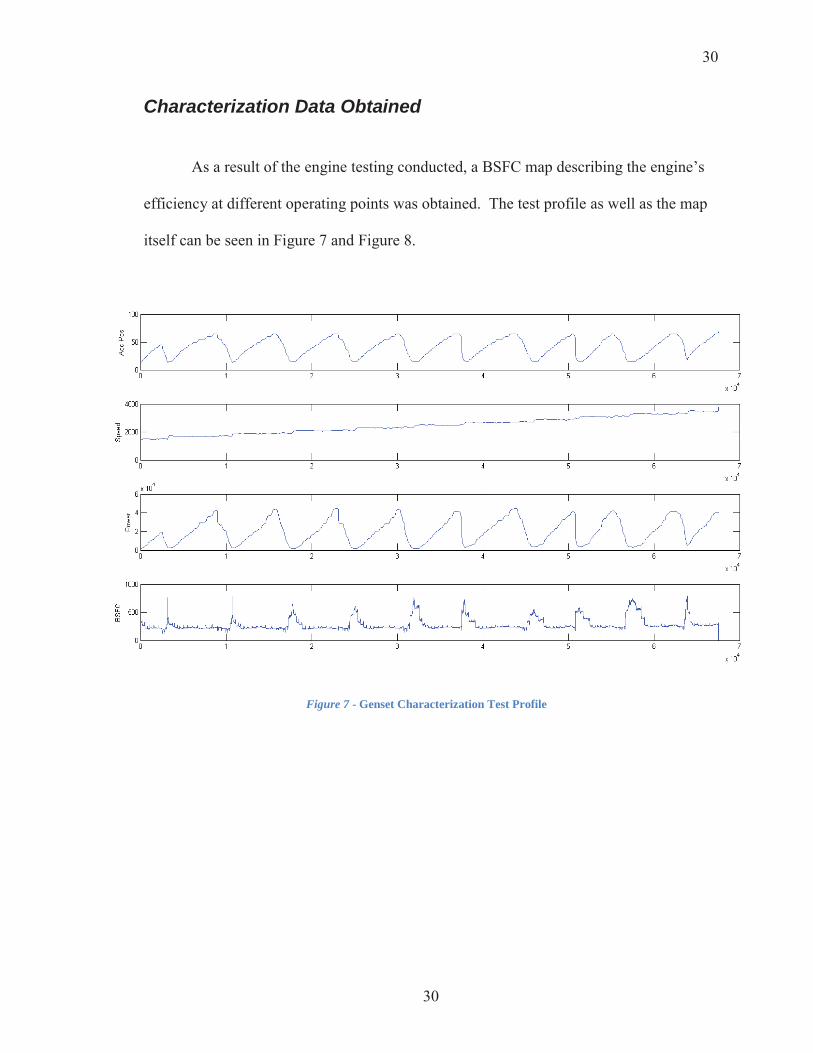
Characterization Data Obtained
As a result of the engine testing conducted, a BSFC map describing the engine’s
efficiency at different operating points was obtained. The test profile as well as the map
itself can be seen in Figure 7 and Figure 8.
Figure 7 - Genset Characterization Test Profile

31
31
Figure 8 – BSFC Map
The BSFC map was generated from the characterization data by dividing the
reported fuel consumption (g/s) by the power produced by the generator inverter (kW).
Data points that were disproportionately low or high were discarded.
32
32
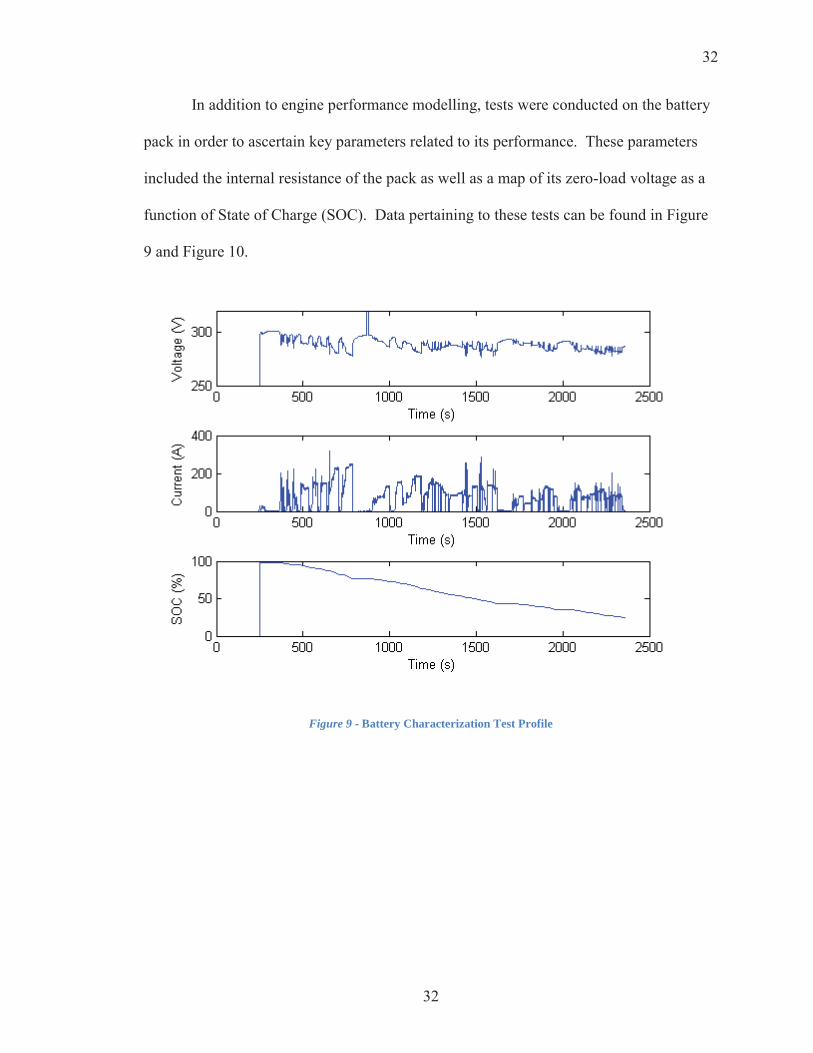
In addition to engine performance modelling, tests were conducted on the battery
pack in order to ascertain key parameters related to its performance. These parameters
included the internal resistance of the pack as well as a map of its zero-load voltage as a
function of State of Charge (SOC). Data pertaining to these tests can be found in Figure
9 and Figure 10.
Figure 9 - Battery Characterization Test Profile
33
33
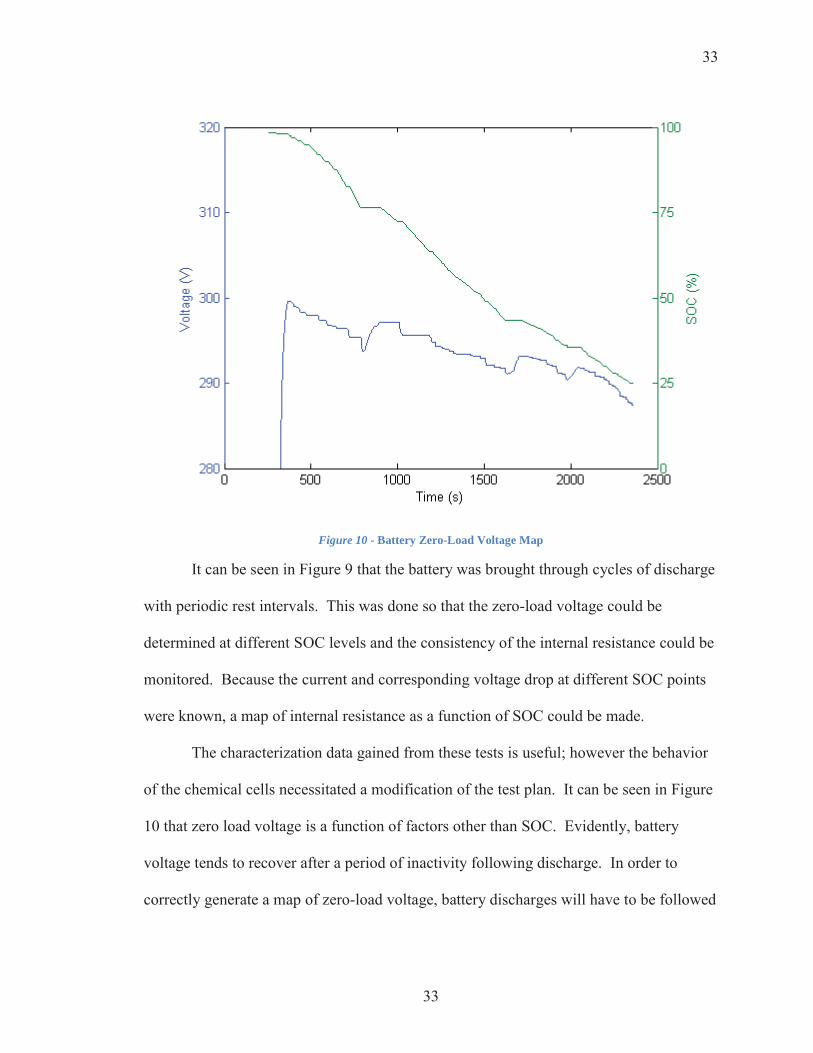
Figure 10 - Battery Zero-Load Voltage Map
It can be seen in Figure 9 that the battery was brought through cycles of discharge
with periodic rest intervals. This was done so that the zero-load voltage could be
determined at different SOC levels and the consistency of the internal resistance could be
monitored. Because the current and corresponding voltage drop at different SOC points
were known, a map of internal resistance as a function of SOC could be made.
The characterization data gained from these tests is useful; however the behavior
of the chemical cells necessitated a modification of the test plan. It can be seen in Figure
10 that zero load voltage is a function of factors other than SOC. Evidently, battery
voltage tends to recover after a period of inactivity following discharge. In order to
correctly generate a map of zero-load voltage, battery discharges will have to be followed

34
34
by enough inactivity for the battery voltage to reach a steady state level. By monitoring
voltage recovery phases, the time constant of the battery can be ascertained.
Vehicle Performance The vehicle was tested throughout the process of development. As testing
continued, data was collected and mew features were implemented. One major target of
development during year three of the competition was the dynamic performance of the
vehicle. The moderate and high speed acceleration of the vehicle was improved as a
result of the implementation of a performance hybrid strategy. Once activated, the
strategy starts the engine when the car is stopped. It provides up to 40 kW of power to
assist the battery in powering the electric motor under heavy load. A plot showing the
improvement of the 0-60 acceleration can be seen below. Furthermore, the reduction in
max battery current between the two modes can be seen in Figure 11 and Figure 12

35
35
Figure 11 - 0 - 60 Acceleration Velocity Comparison

36
36
Figure 12 – 0 - 60 Acceleration Current Comparison
By testing the vehicle in all of the conditions specified by the tests linked to
functional requirements, the team learned of the potential for improvement in
acceleration. Data showed that the inverter was becoming current limited at higher
speed. In order to output more power, the bus voltage would have to be raised. This
prompted the design and implementation of the performance hybrid strategy through the
process described in this thesis.

37
37
The implementation of the genset speed controller has allowed for smooth starts
and stable operating points. Figure 13 depicts a typical genset starting event. The
procedure for starting the engine is the following:
1) Activate fuel pump
2) Activate generator inverter
3) Spin genset to 2000 rpm
4) Activate ECM
Figure 13 - Genset Start Torque and Speed
The ripple in speed that occurs at 731.8 seconds depicts the completion of an
expansion stroke within the engine. The rise in speed following it confirms that the
torque needed to spin the engine from a stop is 75 Nm. The cause for the sudden drop in
applied torque at 732.5 seconds is the derivative gain in the speed controller halting

38
38
control effort. The 50 Nm of torque applied from 734 to 737 seconds represents the
amount of torque necessary to hold the engine at 2000 rpm with no fuel being injected.
The ECM was turned on at 737 seconds which cause the generator applied torque to
decrease.
When a disturbance in engine output torque is encountered, the genset speed
controller will work to maintain the current speed operating point so that a minimal
disturbance will be noticed by the driver. The most common disturbance seen is a sudden
drop in boost pressure which lowers engine output torque substantially. Figure 14 depicts
such an event.
Figure 14 - Genset Controller Performance With Boost Disturbance
39
39
At 24.5 seconds, a sudden lowering of boost pressure can be seen in the top plot.
A corresponding decrease in genset output power can be seen in the middle plot. This
disturbance has a minimal effect on genset speed.
The implementation of regenerative braking on the vehicle has allowed for motor
assisted stops and potential one-pedal control of the vehicle at highway speeds. Figure
15 depicts a slowdown event assisted by the floating-zero regen strategy. The driver
releases the accelerator pedal from 25% to 0% during this event. The brake pedal is used
merely to assist the motor. A negative torque application that corresponds roughly with
accelerator pedal position can be seen between 2225 seconds and 2229 seconds. The
torque application from 2229 to 2235 tapers off because the algorithm lowers negative
torque authority to zero when the vehicle is coming to a stop.

40
40
Figure 15 - Regen Assisted Slowdown

41
41
Requirements Specification One benefit of using the requirements specification method specified was the
seamless interaction between the requirements, software tests and software development.
Requirements were first specified in order to lay out how the product was to operate.
Tests were then constructed and validation criteria were established. The tests were then
executed and reports were generated that highlighted what needed to be changed. The
use of an automated script as opposed to conducting manual stimulus tests cut validation
time down from three hours to less than five minutes. As the Scrum process calls for
quick iteration and the ability to react to changes in product requirements, this script
proved invaluable to encouraging efficient development. An excerpt from the report can
be seen in Figure 16.

42
42
Figure 16 - Automated Validation Test Output

43
43
Chapter V - Discussions and Conclusions
Discussions
The timeframe for the design and testing of the vehicle was extremely ambitions,
especially for the number of people that were involved with the project. The use of HIL
simulation allowed the team to conduct vital development and testing without the
prototype vehicle present. In addition, any risks to the vehicle or operating personnel due
to untested code were eliminated because of the ability of the developed HIL platform to
simulate the vehicle.
The value added by the use of concrete requirements was instrumental in the
success of the team since they were implemented. When compared with the progress
made in year two of the competition, before these new requirements were rolled out, the
team operated in a state of confusion. There was no picture of the vehicle’s intended
operating modes that was shared among all of the team members. Development was
often redundant or headed in the wrong direction. With the new requirements, there was
never any confusion over what the vehicle was supposed to do.
The implementation of the Scrum model for development further contributed to
the cohesion of the team. Because of this implementation, the development team always
knew exactly what was expected of them. This allowed releases to be built with
confidence. Minimal unnecessary development took place and the development team
was allowed to always make efficient use of its resources.
Conclusions
Through the use of the methods presented in this thesis, the development of
control software for a sophisticated hybrid vehicle was accomplished using a remarkably

44
44
small development team. The vehicle has performed well throughout a strict testing and
competition timeline. The vehicle has satisfied all expectations except for those
regarding efficiency. Further work will have to be carried out in order to ascertain the
reason for the inefficiency.
Recommendations My main recommendation for the successors of this team is to put more of an
emphasis on HIL development earlier on. Having a HIL platform that is identical to the
development vehicle in all ways that can be observed by the controller is paramount.
Once the development vehicle is constructed and is available for testing, it can be
tempting to test on it exclusively. This is not the best course of action as it poses high
risks and potentially less reward.
Future Work The next step in this line of work is to improve upon the test plans used to gain
data for model refinement. The improved data should be used to re-parameterize the
model. With a closely matching model, model based optimization can occur. A cost
function balancing emissions performance with efficiency would need to be decided on,
key parameters discussed in the Final Technical Report would then be optimized. Model
refinement and hybrid strategy optimization efforts utilizing the data generated from
characterization testing will published in the future.

45
45
References Green Car Congress. (2009, October 26). Retrieved August 12, 2014, from
http://www.greencarcongress.com/2009/10/general-motors-developed-twomode-hybrid-powertrain-with-mathworks-modelbased-design-cut-24-months-of.html
Documentation Center. (2014). (Mathworks) Retrieved August 12, 2014, from http://www.mathworks.com/help/physmod/sdl/ref/genericengine.html
Attarha, M., & Modiri, N. (2011). Focusing on the Importance and the Role of Requirement Engineering. 2011 4th International Conference on Interaction Sciences. Busan.
Barsotti, D. L., & Boetcher, S. K. (2013). OPTIMIZING JETS FOR ACTIVE WAKE CONTROL OF GROUND VEHICLES. Proceedings of the ASME 2013 International Mechanical Engineering Congress & Exposition IMECE 2013. San Diego.
Brown University School of Engineering. (n.d.). Deriving and solving equations of motion for systems of particles. Retrieved from Introduction to Dynamics and Vibrations: http://www.brown.edu/Departments/Engineering/Courses/En4/Notes/particles_eom_sol/particles_eom_sol.htm
D'Hooge, A., Palin, R. B., & Johnson, S. (2012). The Aerodynamic Development of the Tesla Model S - Part 2: Wheel Design Optimization. SAE 2012 World Congress & Exhibition. Detroit.
dSPACE Inc. (2013, January). Publications/Brochures/Automotive Solutions. Retrieved from dSPACE: http://www.dspace.com/en/inc/home/medien/brochures.cfm?readout=ausgabe&siteNum=2&isSearch=0
dSPACE Inc. (2014, April). Publications/Brochures/Company Profile. Retrieved from dSPACE: http://www.dspace.com/shared/data/bkm/CompanyProfile_en/
EcoCAR 2. (n.d.). About EcoCAR 2 | EcoCAR 2 Plugging In to the Future. Retrieved February 27, 2014, from http://www.ecocar2.org/about-ecocar2
Halvorsen, H.-P. (2011). Hardware-in-the-Loop Simulation. Porsgrunn: Telemark University College Faculty of Technology.
Harries, B. (2012). Development of a Supervisory Control Unit for a Series Plug-In Hybrid Electric Vehicle. Daytona Beach: Embry-Riddle Aeronautical University.
Hosoz, M., Ertunic, H. M., Karabektas, M., & Ergen, G. (2013). ANFIS modelling of the performance and emissions of a diesel engine using diesel fuel and biodiesel blends. Applied Thermal Engineering, 60, 24-32.
Nutt, Q. R., Bhatti, A. I., Rizwi, M. A., Mufti, R., & Kazmi, I. H. (2009). Estimation of automotive engine parameters Part I Discharge coefficient of throttle body]. 2009 6th International Bhurban Conference on Applied Sciences and Technology (pp. 275-280). Islamabad: IEEE.
Park, G., Lee, S., Jin, S., & Kwak, S. (2014). Integrated modeling and analysis of dynamics for electric vehicle powertrains. Expert Systems with Applications, 41, 2595-2607.
Reedy, J., Lunzman, S., & Mekari, B. (2011, February 10). SAE Off-Highway Engineering Online. (SAE International) Retrieved August 12, 2014, from http://articles.sae.org/9422/

46
46
Schwaber, K., & Sutherland, J. (2013, July). The Scrum Guide. Retrieved from Scrum Web Site: https://www.scrum.org/Portals/0/Documents/Scrum%20Guides/2013/Scrum-Guide.pdf#zoom=100
Shanmuganathan, U., Govarthanan, R., Muthumailvaganan, A., & Imayakumar, A. (2006). Modeling and Dynamic Simulation of IC Engine Driven Permanent Magnet Generator Using Matlab/Simulink for Hybrid Tracked Vehicle. IEEE Conference on Electric and Hybrid Vehciles, 2006. ICEHV '06. Pune.
United States Environmental Protection Agency. (2013, January 23). Retrofits| Technology| National Clean Diesel Campaign| US EPA . Retrieved from Environmental Protection Agency: http://www.epa.gov/cleandiesel/technologies/retrofits.htm

47
47
Appendix A

DO NOT TYPE IN THIS FOOTER SECTION ON PAGE 1. TEXT WILL BE INSERTED INTO THIS AREA BY SAE STAFF UPON RECEIPT OF THE FINAL APPROVED MANUSCRIPT AT SAE INTERNATIONAL.
Paper Number
ERAU EcoEagles: Cumulative Modeling and Simulation Whitepaper
Derek Bonderczuk, Matthew Nelson, Chester Paul Rowe II Embry-Riddle Aeronautical University
Dr. Patrick Currier Embry-Riddle Aeronautical University
Copyright © 2009 SAE International
ABSTRACT
As participants in the EcoCAR 2 competition, organized by Argonne National Labs, the Embry-Riddle EcoEagles have spent three years developing a supervisory control system for a plug-in hybrid-electric vehicle using a model-based design process. This process started with the selection of an architecture through Model-In-The-Loop (MIL) testing and is concluding with regression testing using automated scripts on a Hardware-in-the-Loop (HIL) platform and automated optimization of control parameters. The development and testing conducted for the past three years has yielded a control model that has proven to be robust in operation on all platforms and effective at controlling electronic control units (ECU) of multiple powertrain components for the purpose of producing an attractive and efficient driving experience.
INTRODUCTION
Each year of the EcoCAR 2 competition entails very different objectives and workflows for the modelling & simulation effort. Year one of the competition was focused primarily on architecture selection, preliminary performance estimation and development of a high-level control strategy. In year two, efforts transitioned to adapting the control strategy to the selected powertrain components. In year three, unfinished work from year
two was completed alongside refinement of high-level strategies and lower level subroutines.
Development of the model was conducted in parallel with development of the vehicle supervisory controller. As more and more advanced test platforms were made available (MIL, SIL and HIL), the controller was made more and more ready to interface with the vehicle platform. Data gained from vehicle tests was then fed back into the simulation platforms in order to yield higher fidelity models with which development could take place independent of the vehicle platform.
Test cases were constructed such that all desired behaviors written in requirements were observed. Requirements and tests were added or changed through collaboration with the controls developers and the overall team lead. These tests were then made automated for the purpose of allowing rigorous testing with minimal effort and time expenditure.
SIMULATION PLATFORM AND PLANT MODEL REQUIREMENTS
SIMULATION PLATFORMS –
In order to address the two very distinct tasks of architecture/component selection and control strategy development, three simulation platforms were utilized. These platforms are MIL, SIL and HIL and their relative differences are illustrated in Table 1.

Table 1: Simulation Platform Descriptions
Platform Layout
MIL Component models that contain dynamic equations or performance maps. They do not reflect any ECU interactions and all simulation is done offline on one host PC
SIL
Component models that contain dynamic equations or performance maps. Component models contain soft-ECUs and interface names are preserved. In addition, a separate controller model is interfaced with the vehicle plant model. Simulation is done offline on one host PC.
HIL
Component models that contain dynamic equations or performance maps. Component models contain soft-ECUs and complete hardware interfaces are preserved. Simulation is done online in real time on a HIL pc and an embedded controller.
The team chose to use Argonne National Lab’s Autonomie™ in a MIL testing application for exploring architectures that could be chosen. Autonomie™ models are comparatively easy to set up (especially for users not familiar with MATLAB/Simulink products) and it features a sufficient degree of fidelity for comparing architectures. Other platforms were eventually selected because the MIL testing setup doesn’t allow for the controller development necessary to fully define modes and strategies. Models that were used for MIL testing could not be migrated to the team’s HIL hardware and therefore could not be made to interface with prototype controller.
Iterations of MIL models were versioned off by copying the entire folder and assigning it a numeric version. Though adequate for MIL development, this caused problems later due to fact that backups were not committed to a repository and changes could not be tracked.
Once the Diesel series-hybrid architecture was selected, development of a control strategy was begun on a SIL platform. The SIL model and the supervisory controller were then developed in parallel. The SIL model was constructed using dSPACE Inc. ASM powertrain models of vehicle subsystems written in Simulink™. These models were chosen because they were already designed to operate on the midsize HIL that was donated to the team and they featured high fidelity. A controller was developed that interfaced with this vehicle plant model which allowed for the start of the development of a controller for the vehicle platform. The SIL platform allowed for the easy exploration of different control modes. In addition, offline SIL testing is more useful for control parameter optimization because of the wide variety of robust optimization tools that are built into Simulink. HIL modelling was pursued next because of the need to accurately imitate interface dynamics,
something that SIL models incapable of accurately simulating.
Towards the end of year one, a HIL testing setup was constructed. This setup features a dSPACE midsize HIL that runs the vehicle plant model previously used in SIL testing, a dSPACE MicroAutoBox II™ that runs the vehicle supervisory control code and a dSPACE RapidPro unit that serves as a signal amplifier for 12v digital channels. The HIL platform allows for the vehicle-independent development of algorithms that can interface with the vehicle platform. In addition, hardware limitations on controller performance can be modelled and addressed. Downsides of the HIL platform relate to hardware limitations. While the MABX is being used for HIL testing, the vehicle cannot be driven because the team possesses only one MABX. In addition, when changes are made to either the vehicle model or the controller, a recompile and re-load must be performed. While this process only takes three minutes, this time can add up if several changes need to be made and tested alone.
Throughout years one and two of the competition, versions of the SIL and HIL platform were handled in the same way as the MIL platform was. Merely copying the files eventually caused confusion within the team over the features present in each iteration. This system was changed in year three of the competition when software revision logs were made for both the vehicle controller and the vehicle plant models. This revision log and the models themselves were committed to an SVN repository which allowed for effective tracking of changes and backups to be made available. In addition, a main development version called “trunk” was kept. Whenever a stable release with a set number of new features was required, a “branch” was made and recorder in the software revision log.
PLANT MODEL REQUIREMENTS –
Before stating any requirements, driving factors had to be determined. The driving factors identified by the team are safety, increased efficiency, reduced emissions performance, and consumer acceptability. The Requirements/Test Plan was then written detailing acceptable limits for the driving factors in different vehicle operating modes. Whenever the requirements were not met, changes were required.
When a needed controls change or modelling change is identified, its potential impact to the safe operation of the vehicle is assessed. Next, it is listed as a requirement and test cases are developed to validate the requirement. If a hardware change is needed, the interfaces’ documentation for the affected platforms is updated by the electrical team. The tests are made automated if possible.
At this point, the particular algorithm is developed for the controller or model, a test plan is then created from tests

specified in the requirements document. The tests are then executed and problems are noted. Problems are then addressed and the cycle begins again if needed. This workflow is illustrated in Figure 1.
Figure 1: Model Management Workflow
The documents and steps referenced in this workflow have functions which are listed below. The teams which own each document or perform each step are in parenthesis.
DFMEA (All teams) – This document represents the collaborative effort of all systems to predict failure modes of the vehicle. This process feeds into model development by laying out requirements to be modelled for effective fault testing.
FTA (All teams) – This is a team exercise that involves analyzing how faults can be linked or cause one another. This encourages the addition of even more line items for the DFMEA.
Requirements/Test Plan (Controls/Modelling) – This document contains all of the requirements developed for the controller which are linked to defined tests.
Interfaces Document (Controls/Electrical) – This document contains lists of all data that is transmitted between ECUs on the vehicle. Important device interactions are noted here. Most of these interactions happen between the supervisory controller and other ECUs.
Harness Lists (Electrical) – This document contains pinout information for all electrical connections.
Controller Revision Log (Controls) – This document contains all features that have been added to each controller model revision.
Plant Model Discrepancy Case Log (Modelling) – This document contains noted behavioral differences between the vehicle model and the vehicle itself. These are addressed according to the priority assigned to them.
Test Plan (Controls/Modelling) – If active development is taking place, a test plan containing a list of specific test cases is organized.
Controller Debug Log (Controls) – If major controller changes are needed, they are noted in this document.
The documents are updated on SVN once the associated team lead approves all changes. These documents are published with comments explaining changes for maximum transparency.
PLANT MODEL AND SOFT ECU DEVELOPMENT
DEVELOPMENT –
There are three different aspects of the vehicle simulation platforms that must be developed and refined in order for the model to be useful for controls development. These aspects are:
Vehicle performance
Soft-ECUs
Interfaces
The process for developing vehicle performance models is illustrated in the latter four steps in Figure 1. Assuming requirements have already been made for model/component performance matching, projected changes are noted in the model discrepancy case log. Next, algorithms are developed and tested. If major changes are needed, the process is repeated as necessary.
For vehicle performance, trends of behavior were deemed more important than exact numbers. If performance results matched to within ten percent of test data, it was deemed acceptable. Trends of performance were modelled as closely as possible for the purposes of controls tuning in HIL. An example of this is the modelling of the pumping losses incurred when the diesel engine is spinning. Because this phenomenon affects controller performance greatly, it was made a top priority for model development.
This behavioral discrepancy between the model and the vehicle was first noted in the model discrepancy case log. Next, data from previous tests was analyzed and it was decided that the modelling of pumping loss torque through the use of a sinusoid resistance was adequate. This algorithm was then tested and tuned until simulation performance matched component behavior.
Soft-ECUs are developed to the point where their interactions with the vehicle controller in HIL match the behavior observed on the vehicle platform. In performing this development, the interfaces present on the vehicle platform were modelled as required by the development of soft-ECUs. The criteria for matching involve the signals that are required by the controller and the timing of events. All signals that are used for control
are modelled so that they match vehicle behavior. This is accomplished through the use of state machines that mimic the states of the actual ECU. The timing of events is usually not accounted for because the time it takes to transmit messages via CAN bus renders device reaction times insignificant. Controller algorithms are instead designed such that they are not sensitive to the fluctuating timing of events.
Interfaces are held to the same criterion that Soft-ECUs are in terms of data. All CAN messages, digital channels and analog channels used for the purposes of control are modelled. Transmit rates and signal ranges gained from the vehicle platform are used.
As powertrain components were received and integrated into the vehicle, tests were conducted in order to develop or refine models for soft ECUs and validate performance targets. The tests were done as soon as components became available. This ensured model development kept up with component testing. This is crucial for maintaining a safe development process. Once models were made, useful development of supervisory controller algorithms for interfacing with these components could commence. The process through which this was achieved is shown in Figure 2. Results from this process fed into the interfaces and requirements documents shown in Figure 1.
The process outlined in Figure 2 has proven especially useful and effective for developing a Soft-ECU for the ECM. First, the ECM was connected to the engine and turned on. Important CAN broadcast messages were noted and incorporated into the Soft-ECU when it was created. Once the engine was successfully started, the team then knew how the ECM operated well enough to construct a model. First, the basic operating states of the ECM model were defined. Next, the interfaces were set up such that control goals could be accomplished on simulation platforms.
VALIDATION –
The vehicle plant models were validated and refined as needed by comparing results of controller interactions with HIL and vehicle platforms.
For validation of soft ECUs, simple tasks such as closing the contactors, shifting gears and accelerating were performed on the platforms and CAN logs were taken. The soft ECU in question was considered validated if all data that was observed by the controller behaved the same way to within a margin of acceptance. This margin was determined on a case-by-case basis by one developer and was largely subjective, which proved to be one major weakness of the modelling effort.
One notable example of testing and validation that was conducted involves the model for the battery subsystem. A characterization test was developed that involved draining the battery from 100% SOC to 25% SOC using the traction motor on the dynamometer. Load levels that were applied were arbitrary. For every 1% of SOC drained, the car was brought to a halt and the zero-load voltage was measured. Using this data, zero load voltage and internal resistance can be mapped to capacity remaining. In addition, the true capacity in watt-hours can be deduced by integrating current. Data gained from this test was used to update the maps that were in the model previously.
Another example of characterization tests that were performed in order to improve performance fidelity is the case of the engine. Maps for steady state BSFC as a function of engine speed and power were generated by stepping through and holding a range of operating
Figure 2: Device Unit Testing and Modelling Process
1 •Low voltage testing for each device •Identify initial faults via •Low level communications •Flash/update device firmware
2 •Controls communication testing •Device control via CAN •Modelling of device's ECU •SIL/HIL testing using model
3 •HV interconnects •HV testing •Adding a high voltage load to the device
4 •Controls communication testing •Open loop device control •Modelling of device's known behavior for addition to plant model
5 •Controls communication testing •Closed loop device control
points. Data was then post-processed and incorporated into the model.
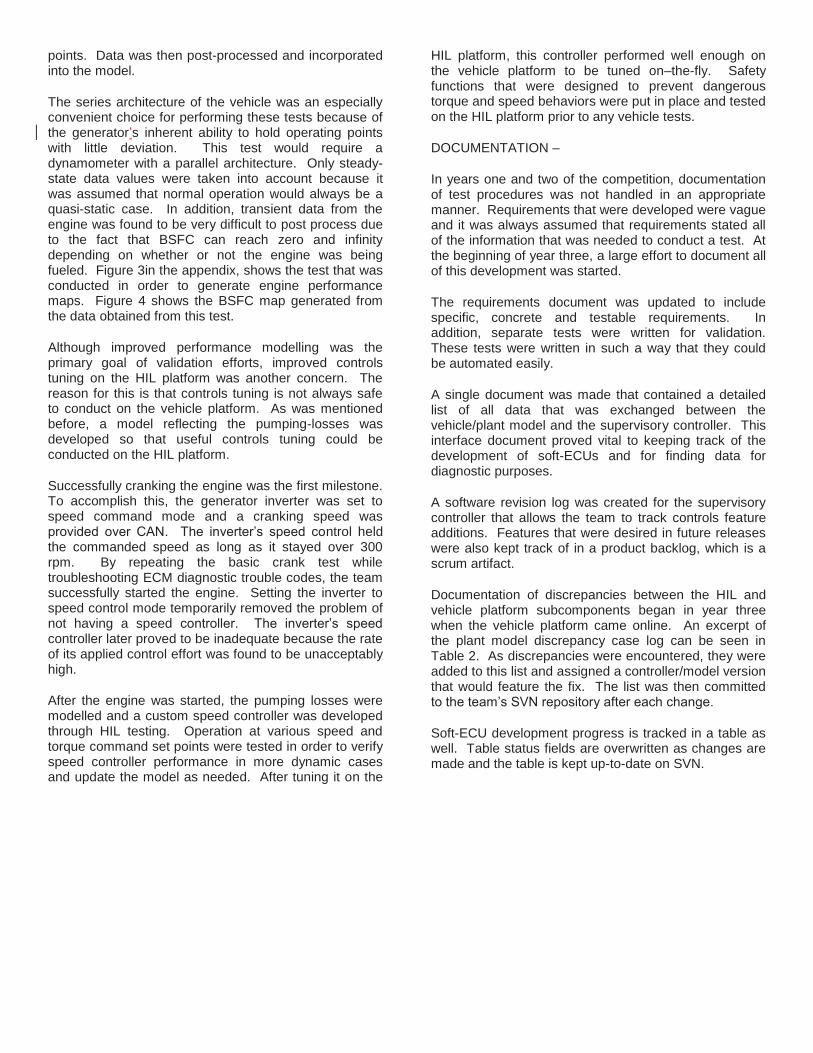
The series architecture of the vehicle was an especially convenient choice for performing these tests because of the generator’s inherent ability to hold operating points with little deviation. This test would require a dynamometer with a parallel architecture. Only steady-state data values were taken into account because it was assumed that normal operation would always be a quasi-static case. In addition, transient data from the engine was found to be very difficult to post process due to the fact that BSFC can reach zero and infinity depending on whether or not the engine was being fueled. Figure 3in the appendix, shows the test that was conducted in order to generate engine performance maps. Figure 4 shows the BSFC map generated from the data obtained from this test.
Although improved performance modelling was the primary goal of validation efforts, improved controls tuning on the HIL platform was another concern. The reason for this is that controls tuning is not always safe to conduct on the vehicle platform. As was mentioned before, a model reflecting the pumping-losses was developed so that useful controls tuning could be conducted on the HIL platform.
Successfully cranking the engine was the first milestone. To accomplish this, the generator inverter was set to speed command mode and a cranking speed was provided over CAN. The inverter’s speed control held the commanded speed as long as it stayed over 300 rpm. By repeating the basic crank test while troubleshooting ECM diagnostic trouble codes, the team successfully started the engine. Setting the inverter to speed control mode temporarily removed the problem of not having a speed controller. The inverter’s speed controller later proved to be inadequate because the rate of its applied control effort was found to be unacceptably high.
After the engine was started, the pumping losses were modelled and a custom speed controller was developed through HIL testing. Operation at various speed and torque command set points were tested in order to verify speed controller performance in more dynamic cases and update the model as needed. After tuning it on the
HIL platform, this controller performed well enough on the vehicle platform to be tuned on–the-fly. Safety functions that were designed to prevent dangerous torque and speed behaviors were put in place and tested on the HIL platform prior to any vehicle tests.
DOCUMENTATION –
In years one and two of the competition, documentation of test procedures was not handled in an appropriate manner. Requirements that were developed were vague and it was always assumed that requirements stated all of the information that was needed to conduct a test. At the beginning of year three, a large effort to document all of this development was started.
The requirements document was updated to include specific, concrete and testable requirements. In addition, separate tests were written for validation. These tests were written in such a way that they could be automated easily.
A single document was made that contained a detailed list of all data that was exchanged between the vehicle/plant model and the supervisory controller. This interface document proved vital to keeping track of the development of soft-ECUs and for finding data for diagnostic purposes.
A software revision log was created for the supervisory controller that allows the team to track controls feature additions. Features that were desired in future releases were also kept track of in a product backlog, which is a scrum artifact.
Documentation of discrepancies between the HIL and vehicle platform subcomponents began in year three when the vehicle platform came online. An excerpt of the plant model discrepancy case log can be seen in Table 2. As discrepancies were encountered, they were added to this list and assigned a controller/model version that would feature the fix. The list was then committed to the team’s SVN repository after each change.
Soft-ECU development progress is tracked in a table as well. Table status fields are overwritten as changes are made and the table is kept up-to-date on SVN.
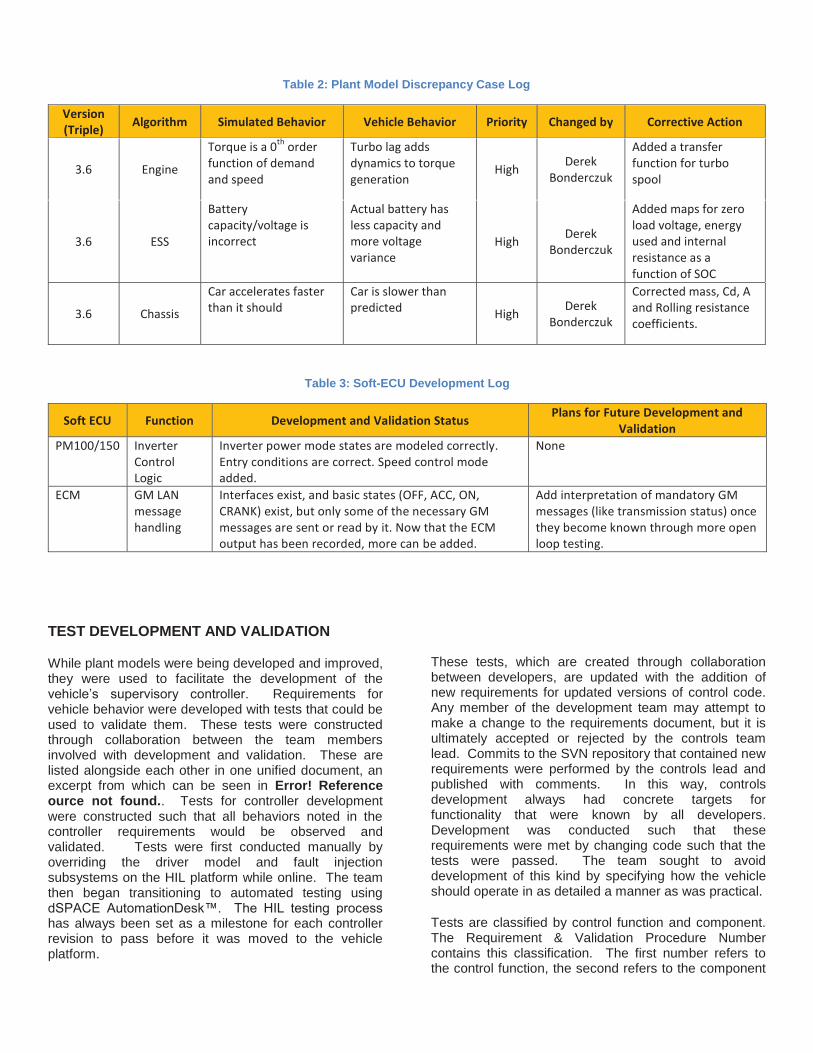
TEST DEVELOPMENT AND VALIDATION
While plant models were being developed and improved, they were used to facilitate the development of the vehicle’s supervisory controller. Requirements for vehicle behavior were developed with tests that could be used to validate them. These tests were constructed through collaboration between the team members involved with development and validation. These are listed alongside each other in one unified document, an excerpt from which can be seen in Error! Reference ource not found.. Tests for controller development were constructed such that all behaviors noted in the controller requirements would be observed and validated. Tests were first conducted manually by overriding the driver model and fault injection subsystems on the HIL platform while online. The team then began transitioning to automated testing using dSPACE AutomationDesk™. The HIL testing process has always been set as a milestone for each controller revision to pass before it was moved to the vehicle platform.
These tests, which are created through collaboration between developers, are updated with the addition of new requirements for updated versions of control code. Any member of the development team may attempt to make a change to the requirements document, but it is ultimately accepted or rejected by the controls team lead. Commits to the SVN repository that contained new requirements were performed by the controls lead and published with comments. In this way, controls development always had concrete targets for functionality that were known by all developers. Development was conducted such that these requirements were met by changing code such that the tests were passed. The team sought to avoid development of this kind by specifying how the vehicle should operate in as detailed a manner as was practical.
Tests are classified by control function and component. The Requirement & Validation Procedure Number contains this classification. The first number refers to the control function, the second refers to the component
Table 2: Plant Model Discrepancy Case Log
Version (Triple) Algorithm Simulated Behavior Vehicle Behavior Priority Changed by Corrective Action
3.6 Engine
Torque is a 0th order function of demand and speed
Turbo lag adds dynamics to torque generation
High Derek Bonderczuk
Added a transfer function for turbo spool
3.6 ESS
Battery capacity/voltage is incorrect
Actual battery has less capacity and more voltage variance
High Derek Bonderczuk
Added maps for zero load voltage, energy used and internal resistance as a function of SOC
3.6 Chassis
Car accelerates faster than it should
Car is slower than predicted High Derek
Bonderczuk
Corrected mass, Cd, A and Rolling resistance coefficients.
Table 3: Soft-ECU Development Log
Soft ECU Function Development and Validation Status Plans for Future Development and Validation
PM100/150 Inverter Control Logic
Inverter power mode states are modeled correctly. Entry conditions are correct. Speed control mode added.
None
ECM GM LAN message handling
Interfaces exist, and basic states (OFF, ACC, ON, CRANK) exist, but only some of the necessary GM messages are sent or read by it. Now that the ECM output has been recorded, more can be added.
Add interpretation of mandatory GM messages (like transmission status) once they become known through more open loop testing.

being controlled and the last number refers to a specific requirement. A category that is also tracked, but not listed in this excerpt is the status of the automation of each specific test.
AUTOMATED TESTING
Automated tests have been developed in parallel with the evolution of the requirements/testing document since the Fall workshop in 2013. The transition to the use of automated tests has been easy as the procedures programmed into the scripts are the same as those that were executed by hand. Automated testing is achieved through the use of a script constructed in AutomationDesk™. This script interfaces with the dSPACE midsize HIL to actuate driver controls as well as insert faults when appropriate. Results are then obtained and the pass/fail criteria are evaluated. A report is then generated showing the tests that have been passed or failed. No hardware changes were necessary for this transition.
Of the 58 tests that have been specified for the controller, 40 are automated. Tests that have not been incorporated into the testing script involve simulating the loss of communication between the supervisory controller and vehicle ECUs. Once these tests can be executed sequentially without resetting the HIL platform, they will be automated.
Utilization of automated testing has greatly accelerated the development of the supervisory controller. Because automated testing exists, there is no costly part of the controller development workflow. Previously, manual tests would take hours to execute, the result only to be made null by the discovery of a change that needed to be made before the controller was to be tested on the vehicle platform.
Because an entire testing session can be competed any time major changes are made to the controller, regression testing has effectively been achieved. This has allowed for the possibility of tracking the disturbances in controller subsystems as changes are made. These disturbances have not been tracked in the documentation, but this could be a topic for pursuit in the future.
The supervisory controller code was constructed in such a way that high level strategy decisions are evaluated separately from lower level subsystem control code. This allows for the operating modes of the vehicle to be defined and tuned with very few parameters. There are two notable parameters that must be tuned in order to achieve the most efficient hybrid strategy.
At the lowest level, the generator and engine are commanded such that they operate at whatever speed and torque is most efficient for the power that is demanded from the system. The power demand that is sent to the system comes from the following equation.
= ( + + )+(1− )( )
The coefficient “alpha” represents the bias towards a load-following strategy as opposed to a thermostatic strategy. Poffset is the amount of power that would be commanded if a full thermostatic strategy was selected.
In addition, a multiplier which is a function of commanded genset speed would be applied to the genset speed command in order to shift the speed/torque curve of engine operating points from what is most fuel efficient to what is fuel efficient and least polluting. The severity of this shift would be determined by the need to perform better emissions-wise.
The speed command multiplier curve as well as the “alpha” coefficient will provide adequate control for powertrain optimization. An experiment that could be conducted to accomplish this optimization is a sweep of both parameters while running the E&EC drive cycle as a test case. The coefficient “alpha” would be swept from 0 to 1 and the value that yields the best fuel efficiency would be chosen. The genset speed offset multiplier map would be cast in the form of a polynomial function which would be adjusted under the same conditions that “alpha” was. Adjustment of the curve is predicted to have a minimal effect on emissions in all conditions except for low speed, low demand operation. At low speed, low demand operating points, incomplete combustion could take place. This would increase CO emissions.
These optimization will be conducted offline using the SIL platform because the optimization engine that is native to Simulink features robust algorithms that are already set up to be automated. Re-purposing these algorithms for use with the automated testing script used on the HIL platform would prove to be a costly endeavor because of the time and testing involved.
Unfortunately, critical progress on making the vehicle fully functional has not allowed for adequate time for performing these optimizations. If they were to be performed, cost functions that would be used would be the scoring equations for E&EC. Ideally, a balance would be struck between fuel efficiency and emissions performance such that the maximum score could be achieved.
PLANS FOR THE FUTURE
The team has gained much knowledge from this exercise in model based controls development. Though a reliable platform for development, the progression of development could have progressed in a more efficient and thorough manner.
Early on in year one, the use of analytical models based on estimated parameters can provide good estimates for performance. This approach was used in year one and
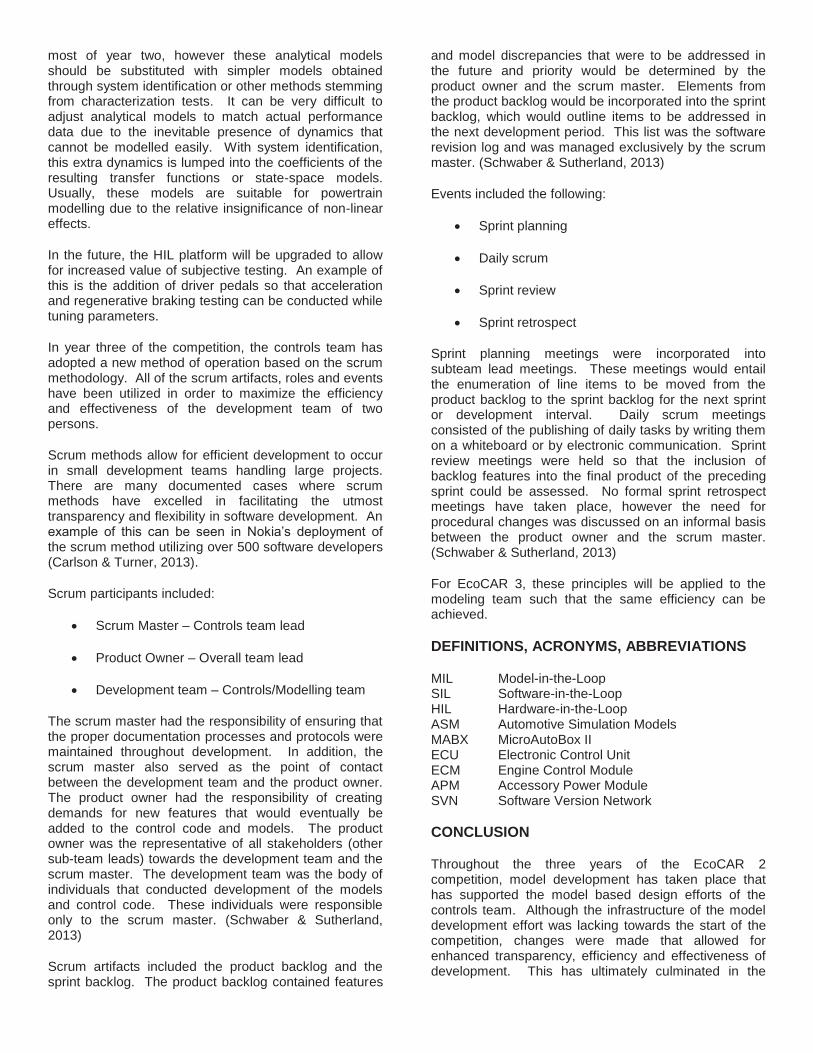
most of year two, however these analytical models should be substituted with simpler models obtained through system identification or other methods stemming from characterization tests. It can be very difficult to adjust analytical models to match actual performance data due to the inevitable presence of dynamics that cannot be modelled easily. With system identification, this extra dynamics is lumped into the coefficients of the resulting transfer functions or state-space models. Usually, these models are suitable for powertrain modelling due to the relative insignificance of non-linear effects.
In the future, the HIL platform will be upgraded to allow for increased value of subjective testing. An example of this is the addition of driver pedals so that acceleration and regenerative braking testing can be conducted while tuning parameters.
In year three of the competition, the controls team has adopted a new method of operation based on the scrum methodology. All of the scrum artifacts, roles and events have been utilized in order to maximize the efficiency and effectiveness of the development team of two persons.
Scrum methods allow for efficient development to occur in small development teams handling large projects. There are many documented cases where scrum methods have excelled in facilitating the utmost transparency and flexibility in software development. An example of this can be seen in Nokia’s deployment of the scrum method utilizing over 500 software developers (Carlson & Turner, 2013).
Scrum participants included:
Scrum Master – Controls team lead
Product Owner – Overall team lead
Development team – Controls/Modelling team
The scrum master had the responsibility of ensuring that the proper documentation processes and protocols were maintained throughout development. In addition, the scrum master also served as the point of contact between the development team and the product owner. The product owner had the responsibility of creating demands for new features that would eventually be added to the control code and models. The product owner was the representative of all stakeholders (other sub-team leads) towards the development team and the scrum master. The development team was the body of individuals that conducted development of the models and control code. These individuals were responsible only to the scrum master. (Schwaber & Sutherland, 2013)
Scrum artifacts included the product backlog and the sprint backlog. The product backlog contained features
and model discrepancies that were to be addressed in the future and priority would be determined by the product owner and the scrum master. Elements from the product backlog would be incorporated into the sprint backlog, which would outline items to be addressed in the next development period. This list was the software revision log and was managed exclusively by the scrum master. (Schwaber & Sutherland, 2013)
Events included the following:
Sprint planning
Daily scrum
Sprint review
Sprint retrospect
Sprint planning meetings were incorporated into subteam lead meetings. These meetings would entail the enumeration of line items to be moved from the product backlog to the sprint backlog for the next sprint or development interval. Daily scrum meetings consisted of the publishing of daily tasks by writing them on a whiteboard or by electronic communication. Sprint review meetings were held so that the inclusion of backlog features into the final product of the preceding sprint could be assessed. No formal sprint retrospect meetings have taken place, however the need for procedural changes was discussed on an informal basis between the product owner and the scrum master. (Schwaber & Sutherland, 2013)
For EcoCAR 3, these principles will be applied to the modeling team such that the same efficiency can be achieved.
DEFINITIONS, ACRONYMS, ABBREVIATIONS
MIL Model-in-the-Loop SIL Software-in-the-Loop HIL Hardware-in-the-Loop ASM Automotive Simulation Models MABX MicroAutoBox II ECU Electronic Control Unit ECM Engine Control Module APM Accessory Power Module SVN Software Version Network CONCLUSION
Throughout the three years of the EcoCAR 2 competition, model development has taken place that has supported the model based design efforts of the controls team. Although the infrastructure of the model development effort was lacking towards the start of the competition, changes were made that allowed for enhanced transparency, efficiency and effectiveness of development. This has ultimately culminated in the

development of a prototype vehicle that is both efficient and drivable to the average person.
ACKNOWLEDGMENTS
The authors would like to acknowledge Argonne National Laboratory and the U.S. Department of Energy, General Motors Inc., dSPACE Inc., The Mathworks, and the Embry-Riddle Mechanical engineering department. REFERENCES
1. K. Schwaber and J. Sutherland, "The Scrum Guide," 2013. [Online]. Available: https://www.scrum.org/Portals/0/Documents/Scrum%20Guides/2013/Scrum-Guide.pdf#zoom=100. [Accessed 20 April 2014].
2. R. Carlson and R. Turner, "Review of agile case studies for applicability to aircraft systems integration," Procedia Computer Science, pp. 469-474, 2013.
CONTACT
This is where main author information is typed, if desired, such as background, education, e-mail address, and web address. This is an optional section.

APPENDIX
Figure 3: Engine Characterization Test

Figure 4: BSFC Map Generated from Test Data

59
59
Appendix B

Page 1 of 17
Type Paper Number Here
Refinement and Optimization of a Series Plug-In Hybrid Electric Vehicle with a B20 Bio-Diesel Generator as Part of EcoCAR 2:
Plugging into the future
Derek Bonderczuk, Chester Rowe II, Yuchi Meng, Matthew Nelson, Adam Szechy
Copyright © 2012 SAE International
ABSTRACT
This paper presents the refinement process carried out on a strong hybrid power system in a 2013 Chevrolet Malibu. This project was executed by the ERAU EcoEagles, a team of participants in the EcoCAR 2 competition. The refinement was done as a follow up to a complete powertrain swap conducted during year 2 of the competition. This bespoke vehicle is a series Plug-in Hybrid Electric Vehicle (PHEV) with extended range utilizing a 1.7L diesel engine powered by B20 biodiesel. Mechanical refinements were carried out for the purpose of wright reduction and improvements to reliability. Control refinements were performed in order to produce a vehicle that was efficient, clean and familiar to the driver. The net result is a vehicle with 57.2 km all-electric range in charge depleting mode and 678 Wh/km energy use in charge sustaining mode.
INTRODUCTION
The Advanced Vehicle Technology Competitions, of which EcoCAR 2 is the most recent, is a series of multi-year interdisciplinary competitions for selected colleges across North America to design, build, and optimize a hybrid-electric vehicle. Currently, Embry-Riddle Aeronautical University (ERAU) is in the 3rd year of the 2nd competition. The end goal for this year is to have a vehicle that passes the vehicle design review milestone and is comparable to a 99% production ready vehicle.
ECOCAR 2 VDP AND VEHICLE ARCHITECTURE
Vehicle Design Process
The EcoCAR 2 Vehicle Design Process (VDP) is characterized by a series of milestones defined within the competition; these milestones are design gateways. There are three gateways specified in the EcoCAR 2 competition:
Program Initiation Approval (PIA), Vehicle Design Review (VDR), and Vehicle Testing Complete (VTC). Each one of the gateways marks the end of a year in the competition. The first year is design focused working toward the PIA. Completing the PIA includes defining the team requirements, developing the concept design, and starting the structure and integration designs while performing Hardware-in-the-Loop (HIL) testing. The second year is implementation focused working toward the VDR. This includes completion of the structure and integration designs, building of a mule vehicle, continued HIL testing and the start controls optimization. The third and final year is refinement focused working toward VTC or a 99% Production ready vehicle. This concludes controls optimization, and HIL testing. The EcoCAR 2 VDP is diagrammatically shown in Figure 1 in the Appendix.
The ERAU EcoCAR 2 team implemented the VDP described above with some modifications to years 2 and 3, which worked towards the VDR and VTC milestones, respectively. At the beginning of year 2, the team needed additional test time with the vehicle in its stock configuration which did not allow for disassembly of the vehicle. In order to not lose valuable assembly time the team made a tactical decision to push back the building of a mule vehicle and start with assembling the powertrain on a test stand. The test stand was designed to mimic the engine bay dimensions, allowing the team to package the engine bay external to the vehicle then transplant the assembly into the vehicle. The second change to the VDP was an extension of the mule/build test phase into year 3. This was not a tactical maneuver but the result of team staffing issues in year 2 which lead to a vehicle that was not fully functional for the VDR. The modified VDP specific to the ERAU team can be seen in Figure 15 in the Appendix.
The team is currently on track with the modified VDP. The majority of the work is focused on controls optimization with a few upsets from mechanical failures during testing that have required a redesign.

Page 2 of 17
Vehicle Technical Specifications
In order to guide the team through in vehicle development throughout the 3 year VDP, the team created Vehicle Technical Specifications (VTS) targets. These targets took into account all competition priorities and were then refined by team priorities in order to guide the vehicle development at high levels. The Vehicle Technical Specifications (VTS) is shown in Table 3 in the Appendix.
During year 1, preliminary VTS information was produced to predict final vehicle performance. From this initial prediction, the numbers have been modified as more testing data and performance data of all parts and systems has been gathered. The current VTS information can be found in Table 3 of the appendix. This table compares the EcoEagle’s vehicle with that of the stock 2013 Malibu and includes all competition requirements. The table also includes VTS data for running the E & EC event both with and without an emissions testing trailer in tow. As shown, the vehicle did lose 0.94s versus stock on the 0-60mph acceleration test; this can be explained by the large increase in vehicle weight. However, the vehicle acceleration on the 50-70mph test would result in a net change of 3.57 seconds faster than the stock vehicle due to the use of an electric machine with a fixed gear ratio. The vehicle has the ability to maintain higher levels of power output continuously without having the drops due to a shifting transmission.
Vehicle Architecture
In order to achieve the VTS targets, the team decided to design and build a series Plug-In Hybrid Electric Vehicle (PHEV). The major components of this architecture are an Internal Combustion Engine (ICE) coupled to an electric generator, a traction motor coupled to a transmission to drive the front wheels, and an Energy Storage System (ESS) as shown in Figure 1.
Figure 1 – Series Architecture
A series PHEV architecture has many strengths and was chosen due to its compact packing, energy efficiency, and simplified controls strategy. Due to the ICE being coupled to an electric generator instead of the wheels it can be placed in the vehicle independently of the final drive. This allowed the EcoEagles fit all powertrain components in the engine bay by slightly shifting the ICE forward and placing the traction
motor coupled to the transmission in the aft of the engine bay in line with the front wheels. This is in stark contrast to a Parallel-Through-The-Road (PTTR) architecture where the ICE would be coupled to a transmission in the engine bay to drive the front wheels while an electric motor coupled to a separate transmission would be located in the rear of the vehicle to drive the rear wheels. Because a series PHEV’s ICE is decoupled from the road it can be run at any speed/load point regardless of the vehicle’s speed. This allows the efficiency of the ICE/Generator combination (Genset) to be optimized at all times. The decoupling of the ICE from the road also leads to a simplified controls strategy as compared to a PTTR. In a PTTR architecture both the ICE and traction motor are coupled to the road; therefore, the tractive force between the two must be balanced in order to ensure the desired speed/performance of the vehicle is achieved. A series PHEV simplifies control development by eliminating the need to balance the tractive force between multiple components as only the traction motor produces tractive force.
There series PHEV is not without its weaknesses, most of which stem from an ICE and traction motor on board with only the traction motor being able to provide tractive force. Some of these drawbacks are added weight if only driving on short trips, single points of failure could disable the vehicle, and the performance of a series PHEV is less than that of a PTTR with similar components. As the vehicle is a PHEV it is able to plug-in to the wall in order to recharge the ESS (High Voltage (HV) batteries). Seeing as how the Genset primarily turns on to extend the range of the vehicle past the 57.2km (35.5mi) capability of Charge Depleting (CD) mode, the Genset is not required for trips shorter than this. Such scenarios result in extra energy being used to move the added weight of a Genset that is rarely used. In addition, when an ICE sits without being started for long periods of time it becomes less reliable. In a series PHEV if the traction motor, transmission, or ESS fail the vehicle is unable to move, even if it has a working ICE. In comparison, if a PTTR vehicle’s traction motor, associated transmission, or ESS fails it still has the ICE which can propel the vehicle and vice versa. As detailed above a series PHEV is more efficient than a PTTR; however, this comes at the cost of performance. A PTTR vehicle can use both the ICE and traction motor to propel the vehicle while a series PHEV can only use the traction motor. With the components selected for the ERAU vehicle this means that although there are a combined total of 241kW and 611Nm, only 145kW and 311Nm are used to propel the vehicle resulting in a significant reduction in performance.
In considering the overall competition goals of reducing fuel consumption, reducing well-to-wheel greenhouse gas emissions, and maintaining consumer acceptability in the areas of performance, utility, and safety (EcoCAR 2 n.d.), a series PHEV is a logical choice. Due to the efficiency characteristics and the reduced use of the ICE as compared to the stock vehicle and the PTTR architecture the series PHEV is a logical choice for the team; however, the team wanted to reduce the vulnerability of the series architecture to a single

Page 3 of 17
point failure. One example of how the team has reduced its vulnerability to a single point failure disable the vehicle is the ESS. The main cause of failure for batteries is heat; therefore, the team is using a novel approach to cooling the ESS. Phase Change Material (PCM) is located beneath each of the HV batteries with coolant lines routed through it. The PCM is able to absorb large amounts of energy while barely changing its temperature as it is kept in a phase change condition during normal operation. The PCM is so effective that the ESS coolant pump rarely turns on during on-road driving, reducing the change of immobilizing the vehicle due to a coolant loop failure. Even during harsh dynamometer testing with little air flow the coolant system is able to maintain appropriate HV battery temperatures.
One of the main challenges that the team had to overcome in Years 2 and 3 in order to adhere to the architecture selection is the coupling between the ICE and generator. Due to axial space constraints imposed on the system by the width of the vehicle’s chassis, a thin coupler has to be used. The ICE is a 1.7L automotive diesel engine that is capable of producing large torque spikes of up to an estimated 1,000Nm. Although there are couplers available on the market for this specific task they are designed with radial constraints in mind instead on axial. In order to overcome this challenge the team worked closely with industry experts from multiple companies for advice including GKN, AM Racing, Lovejoy, and Clutch Masters. The final solution includes a clutch disc from Clutch Masters with the friction surface removed allowing it to be a bolt-on solution.
CONTROL SYSTEM
Overview
The control system consists of 11 ECUs on four different CAN networks, analog lines and digital lines. A supervisory controller (SCU), which is a dSPACE MicroAutoBox II, communicates with all ECUs on all CAN networks and serveral digital and analog lines. The SCU communicates with the following devices over CAN at 500 kbps: The topology of the communication and power distribution networks of the vehicle is shown in Figure 16, in the Appendix.
GM Engine Control Module (ECM) GM High Voltage Air Compressor (HVAC) Traction motor inverter (PM150) Generator inverter (PM100) Battery control module (BCM) Brusa High Voltage Charger GM Accessory Power Module (APM) NOx sensors (Post-Engine, Post-Catalyst) NH3 sensor GM Body Control Module (BCM)
The SCU was developed using model based design on Software-In-The-Loop (SIL), Hardware-In-The-Loop (HIL) and vehicle platforms. The requirements, then the model for the SIL and HIL platform were updated as more was learned about vehicle platform subsystems through testing. A requirements document was made for the SCU that prioritizes requirements for safe operation. These requirements were mapped to tests that were automated using dSPACE AutomationDesk. All changes were validated using this automated test script. Changes were made according to the documentation and testing topology shown in Figure 2.
Figure 2 – Documentation and Testing Ecosystem
The documents and steps referenced in this workflow have functions which are listed below. The teams which own each document or perform each step are in parenthesis.
DFMEA (All teams) – This document represents the collaborative effort of all systems to predict failure modes of the vehicle. This process feeds into model development by laying out requirements to be modelled for effective fault testing.
FTA (All teams) – This is a team exercise that involves analyzing how faults can be linked or cause one another. This encourages the addition of even more line items for the DFMEA.
Requirements/Test Plan (Controls/Modelling) – This document contains all of the requirements developed for the controller which are linked to defined tests.
Interfaces Document (Controls/Electrical) – This document contains lists of all data that is transmitted between ECUs on the vehicle. Important device interactions are noted here. Most of these interactions happen between the supervisory controller and other ECUs.
Harness Lists (Electrical) – This document contains pinout information for all electrical connections.
Controller Revision Log (Controls) – This document contains all features that have been added to each controller model revision.

Page 4 of 17
Plant Model Discrepancy Case Log (Modelling) – This document contains noted behavioral differences between the vehicle model and the vehicle itself. These are addressed according to the priority assigned to them.
Test Plan (Controls/Modelling) – If active development is taking place, a test plan containing a list of specific test cases is organized.
Controller Debug Log (Controls) – If major controller changes are needed, they are noted in this document.
Engine Control Module
The engine control module is responsible for interfacing with all of the engine hardware. Its functions include, but are not limited to, actuating the throttle body, opening the turbocharger vanes, controlling the Exhaust Gas Recirculation (EGR) valve and controlling the fuel injectors. The supervisory controller obtains readings from it for engine speed, temperature and fuel flow rate. The SCU communicates a torque demand to the ECM via an analog channel. The ECM is toggled on via a digital line after then engine reaches a certain speed. This is done in order to make starts smoother with less overshoot.
GM High Voltage Air Compressor
The HVAC system allows for Air Conditioning (AC) functionality when the engine is stopped. It is powered directly off of the vehicle’s high voltage bus. The HVAC is given a speed setpoint over CAN.
Traction motor inverter/Generator inverter
The inverters convert DC power from the high voltage bus to AC power for the three-phase electric machines. The inverters also report data pertaining to voltages, currents, temperature, speed and torque. The devices communicate CAN or RS232 for debugging and calibration purposes. They are turned on via a relay controlled by the SCU.
Battery Control Module
The battery control module contains sensors that monitor the voltage, current and temperature of the cells within the ESS. These signals are reported to the SCU over CAN and the SCU commands contactor closure. The BCM also has the final authority over the contactors and will open them if temperatures get too high or SOC moves out of the allowable range of 0% to 100%.
Brusa High Voltage Charger
The high voltage charger converts 110v AC or 220v AC to 300v DC for the ESS. Although it communicates over CAN, it wakes the BCM and begins charging without any intervention from the SCU.
GM Accessory Power Module
The Accessory Power Module powers the vehicle’s 12v network off of the high voltage network after the contactors have been closed and the high voltage battery has been connected. Until the APM is switched on over CAN, an ordinary 12v battery powers the low-voltage (LV) systems.
SCR System
The NOx and NH3 sensors are placed in the exhaust stream such that the SCR injector can be controlled. The SCR injector injects AdBlue fluid, which breaks down into NH3 in the exhaust stream. The SCU utilizes the NOx and NH3 readings to keep the SCR catylist coated with NH3 by driving the injector with a PWM signal.
The duty cycle of the PWM signal is controlled using a non-linear control law with a sliding mode observer that provides state estimates of NO and N2O. These state estimations allow the control law to govern the system much better than sensor readings alone.
Body Control Module
The body control module controls most of the stock systems that the driver can interface with. Because the stock powertrain has been removed, the SCU sends powertrain information to the BCM over CAN. This causes the gauge cluster to work as intended. Brake pedal position, as well as the status of the cruise control buttons, are reported to the SCU over CAN.
Strategy Goals and Modes
CD-CS
The vehicle operates in two modes. Charge depleting (CD) mode is characterized by fully electric operation with no assistance from the engine-generator (genset). The vehicle has the same handling characteristics in Charge Sustaining (CS) mode as it does in CD mode but with the genset working to sustain the State of Charge (SOC) of the ESS. The SOC threshold for entering CS mode is 30%. CS mode may also be entered if the ESS reaches a temperature that is too hot to support further CD operation. The amount of power that is demanded from the genset system at any one time is dictated by the following formula:
Where PMotor is the power consumed by the traction motor, PHVAC is the power consumed by the HVAC compressor and PAPM is the power consumed by the accessory power module (APM).

Page 5 of 17
The coefficient “alpha” represents the bias towards a load-following strategy as opposed to a bang-bang strategy. Poffset is the amount of power that would be commanded if a full bang-bang strategy was selected.
This formula was designed so that an arbitrary balance between load following and bang-bang modes could be achieved. When testing began, a value of one was chosen for alpha. In addition, 40kW was chosen for POffset because it was the maximum power that was extracted from the engine so far. POffset will be adjusted as higher power levels are achieved. In addition, the value for alpha that yields the highest fuel efficiency on the E&EC drive cycle will be chosen through model based optimization.
An operating point map as a function of speed called “kappa” was also created. This map defines a speed that the engine shall be operated at for every power level that is demanded. This was accomplished by conducting a BSFC analysis on the data yielded from the characterization tests performed on the engine. This map will be adjusted for criteria exhaust yield once more exhaust characterization tests are done. The cost function will be re-defined using the scoring rubric provided by the rules.
Torque Application
Application of torque by the traction motor is controlled based off of input from the accelerator pedal, brake pedal, speed sensors, temp sensors, PRNDL position sensor and ignition switch. The ignition switch controls contactor closure. Once the contactors are closed, the PRNDL position will have an effect on the vehicle torque state. Park and neutral states do not allow for torque to be applied. Reverse and drive allow for torque to be applied as expected.
Fault cases
Faults are separated into three diagnostic categories that each trigger a different set of remedial actions. Tier 1 faults relate to conditions that compromise torque security. The occurrence of these faults disables tractive torque. In a production vehicle, these faults would trigger a very low, constant torque in order to not endanger the consumer by stranding them. For a prototype vehicle, disabling torque is the safer option because of the university campus setting. Tier 2 faults relate to conditions that endanger the tractive system. The occurance of these faults limit output torque to 50Nm, which allows these components to cool down. The fault remedial action lasts for 30 seconds after the fault condition has disappeared. Tier 3 faults occur when conditions compromising the genset exist. The corresponding remedial action is to turn off the genset system. This remedial action also lasts 30 seconds after the condition disappears with the exception of the coupling failure fault, which lasts until a power down. The fault cases that are addressed are shown in Table 2 in the Appendix.
Derating
The temperature of the motor and its inverter is used to assign the tractive system a performance capability in real time. If the temperature rises out of operating range, the performance capability is decreased and the maximum torque that can be applied is decreased as well. This derating scheme does not allow for the tractive system to overheat. Should an overheating condition happen, A fault flag will be tripped that causes maximum torque to fall to 50Nm for 30 seconds. This interval will allow for a diagnostician to feel that something is wrong and assess the situation. This scheme is applied to the genset system as well. Capability v temperature maps have been made for the engine, generator and inverters. The engine derating map also limits power at low temperatures to allow for a proper warmup cycle. The temperature derating curves for all subsystems are linear and vary from 100% to 0% between 140°C and 160°C for the motors, 80°C and 100°C for power electronics and 50°C and 60°C for batteries.
The ESS has a derating map based on the reported charge and discharge buffers. The buffer is calculated by taking into account the thermal load and the SOC of the battery pack. The buffer will fall if the power going into or coming out of the battery pack causes its equilibrium temperature to remain out of the operable zone. In addition, the charge buffer will fall to zero when the SOC approaches 100%. Likewise, the discharge buffer will fall when the SOC approaches 0. The output of the ESS derating map lowers the maximum output of the tractive system and/or genset system depending on which limit is reached.
System Refinement and Optimization
The vehicle model deployed on the SIL and HIL platforms was first constructed in Year 1 of the competition. The model was made of subsystem models sourced from dSPACE Inc. that were constructed in Simulink. At that point, the model consisted of an analytical model with digital and analog channels modeled and generic CAN messages used. Improvements in year two dealt with CAN messaging and digital channels. These networks were modelled with higher fidelity. In year three, powertrain subsystem models were updated in order to allow for optimization offline.
The SIL platform is a model that can be run offline on a PC, or on the HIL platform alone. It contains the vehicle plant model and the SCU model. The HIL platform features the SIL plant model running on the HIL system, which is connected to the SCU using the same CAN networks, digital and analog channels that exist in the vehicle platform. Fault insertion is accomplished through signal overrides within the vehicle model. These overrides are controlled by the automated testing script developed by the team.
Optimization is done using two different methods. For improvements that affect dynamic performance, ride quality

Page 6 of 17
and power mode control, online tuning using the HIL platform is performed. For improvements that concern efficiency or emissions performance, offline optimization in Simulink is performed. Simulink’s native optimization toolbox is used for this purpose.
Traction motor control
At the start of year three, torque security was deemed to already be well handled within the code. Improvements have dealt with drivability and efficiency as well as fault detection and continuous derating.
Accelerator position is adjusted using the map shown in Figure 3. This map was used because the vehicle proved to be difficult to control at low speeds with a linear map. With this new map, the lower portion of the accelerator pedal range commands a disproportionately low amount of torque, thus granting better low-torque, low-speed control.
Figure 3 – Accelerator Position Map
This nonlinear map is then scaled to the maximum torque that can be provided at any given RPM of the traction motor. This maximum torque will naturally trail off as the break speed of the motor is exceeded.
Regenerative braking is achieved with the accelerator and brake pedal. The accelerator pedal has been assigned a map that remaps the pedal from 0% to 100% to -25% to 100%. The amount of “negative” pedal that can be achieved varies with speed. This negative pedal position commands regenerative torque using the same convention as tractive torque. This mapping is achieved through the use of a “zero-point” map that specifies what amount of accelerator displacement corresponds to zero throughout the entire speed range. This map is shown in Figure 4.
Figure 4 – Zero-Point map
The driver notices this algorithm when he or she tips out of the accelerator pedal at speed. The vehicle will begin to slow down faster than a conventional vehicle will coast down. This will feel like an exaggerated amount of aerodynamic resistance being applied to the car. This algorithm allows the driver to slow to a near stop without wasting energy on the friction brakes. The brake pedal also commands regenerative torque depending on the displacement, gradient of displacement and speed. Generating regenerative torque using brake pedal displacement and gradient as a command will ensure that a minimal amount of stopping force will be applied by the friction brakes, thus saving more energy. The curves dictating the amount of regen torque applied as a function of speed and pedal displacement will be tunable by the user via the center console.
Zero-crossings of applied torque must be handled with care as the transition from motoring torque to regen torque can seem rather harsh if rate limits are not set properly. A dynamic rate limit on torque application was used in order to soften this transition and leave swings at higher torque levels unaffected. The dynamic rate limit is defined by a parabolic curve that varies with the sensed torque of the traction motor. The lowest point of the parabola lies at 0Nm of applied torque. This causes the zero crossing from traction to regen to appear smoother because of the decreased rate limit. This limit map is shown in Figure 5. This map is applied to both the rising and falling rates.
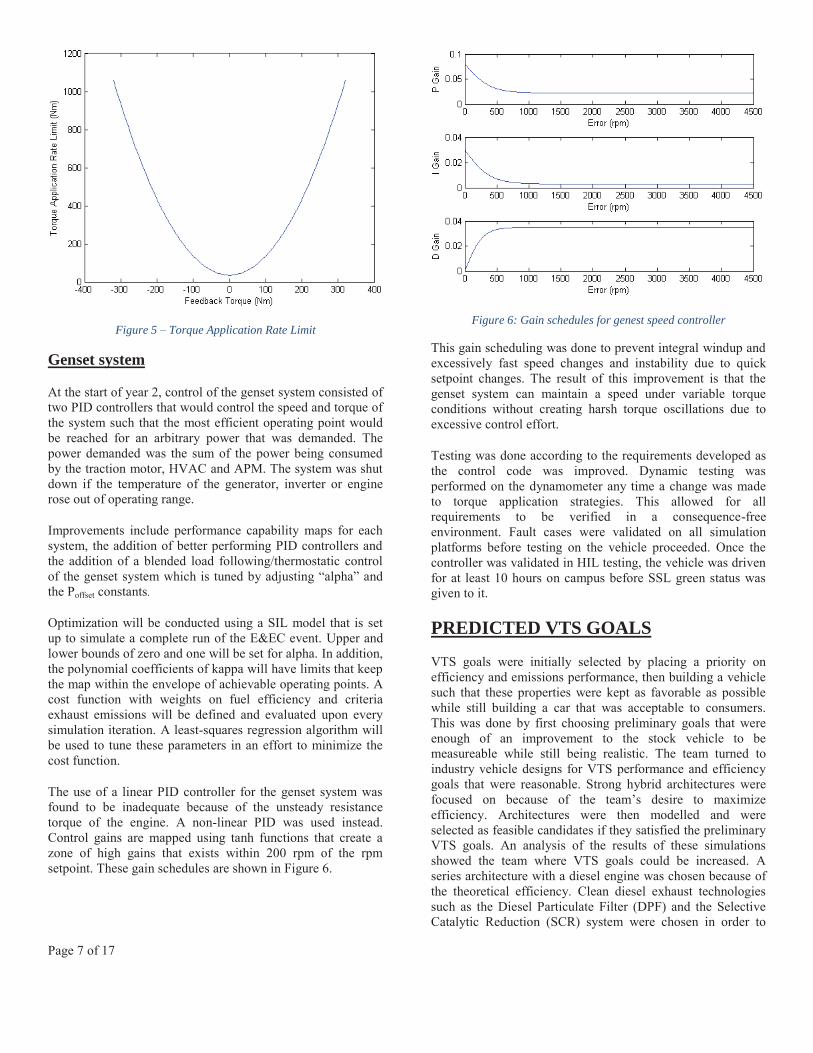
Page 7 of 17
Figure 5 – Torque Application Rate Limit
Genset system
At the start of year 2, control of the genset system consisted of two PID controllers that would control the speed and torque of the system such that the most efficient operating point would be reached for an arbitrary power that was demanded. The power demanded was the sum of the power being consumed by the traction motor, HVAC and APM. The system was shut down if the temperature of the generator, inverter or engine rose out of operating range.
Improvements include performance capability maps for each system, the addition of better performing PID controllers and the addition of a blended load following/thermostatic control of the genset system which is tuned by adjusting “alpha” and the Poffset constants.
Optimization will be conducted using a SIL model that is set up to simulate a complete run of the E&EC event. Upper and lower bounds of zero and one will be set for alpha. In addition, the polynomial coefficients of kappa will have limits that keep the map within the envelope of achievable operating points. A cost function with weights on fuel efficiency and criteria exhaust emissions will be defined and evaluated upon every simulation iteration. A least-squares regression algorithm will be used to tune these parameters in an effort to minimize the cost function.
The use of a linear PID controller for the genset system was found to be inadequate because of the unsteady resistance torque of the engine. A non-linear PID was used instead. Control gains are mapped using tanh functions that create a zone of high gains that exists within 200 rpm of the rpm setpoint. These gain schedules are shown in Figure 6.
Figure 6: Gain schedules for genest speed controller
This gain scheduling was done to prevent integral windup and excessively fast speed changes and instability due to quick setpoint changes. The result of this improvement is that the genset system can maintain a speed under variable torque conditions without creating harsh torque oscillations due to excessive control effort.
Testing was done according to the requirements developed as the control code was improved. Dynamic testing was performed on the dynamometer any time a change was made to torque application strategies. This allowed for all requirements to be verified in a consequence-free environment. Fault cases were validated on all simulation platforms before testing on the vehicle proceeded. Once the controller was validated in HIL testing, the vehicle was driven for at least 10 hours on campus before SSL green status was given to it.
PREDICTED VTS GOALS
VTS goals were initially selected by placing a priority on efficiency and emissions performance, then building a vehicle such that these properties were kept as favorable as possible while still building a car that was acceptable to consumers. This was done by first choosing preliminary goals that were enough of an improvement to the stock vehicle to be measureable while still being realistic. The team turned to industry vehicle designs for VTS performance and efficiency goals that were reasonable. Strong hybrid architectures were focused on because of the team’s desire to maximize efficiency. Architectures were then modelled and were selected as feasible candidates if they satisfied the preliminary VTS goals. An analysis of the results of these simulations showed the team where VTS goals could be increased. A series architecture with a diesel engine was chosen because of the theoretical efficiency. Clean diesel exhaust technologies such as the Diesel Particulate Filter (DPF) and the Selective Catalytic Reduction (SCR) system were chosen in order to

Page 8 of 17
increase emissions performance. The weight target was then adjusted by estimating the sum of the weights of components selected with mounting structures.
Modelling conducted on the SIL and HIL platforms during year two allowed the team to further refine VTS targets by taking integration hardware, such as brackets and cables, into account. Through modelling, new components were selected which effected weight targets and therefore the performance. An example of this is the modelling of weights incurred by SCR and HV distribution components. Although necessary for efficient vehicle operation, they were not modelled in year 1, thus the models and performance targets needed to be adjusted.
As components were tested in year three, the vehicle model was updated with new performance parameters in order to yield higher quality VTS results. The VTS goals for the year three competition are shown alongside the stock VTS in Table 3 in the Appendix. Weights and times of acceleration were adjusted to reflect the actual performance of the vehicle. Changes made that went beyond actual testing were made if it was found that further improvements were likely to take place. If these improvements were unlikely, original values were maintained instead. Thus, the VTS is an expression of actual test results that are augmented based on predicted improvements between the submission of the VTS and the year three competition.
PERFORMANCE TESTING, VALIDATION AND RESULTS
The vehicle validation plan is designed to ensure the vehicle works as designed, meets the VTS goals, and matches the vehicle model. In order to properly validate all features of the vehicle, VTS, and vehicle model a series of tests had to be conducted that ranged from Dynamometer testing to driving in figure eights to real world driving. Once the test was complete the results of the test were then compared to the requirements specified by the design, VTS, or vehicle model. If a discrepancy was found the vehicle and model were evaluated to find the cause of the discrepancy. Once found the discrepancy would be corrected.
In order to better describe the process of validation testing, the Acceleration 0-60 mph test will be described. The first step in the testing is to perform hand calculations, which can be used to verify the vehicle model. The decision was made to calculate the g-force at full vehicle acceleration for multiple speeds based on actual vehicle parameters in order to verify the vehicle model. The results of the hand calculation is shown in Figure 7.
Figure 7 – Calculated G-Force at Full Acceleration vs Vehicle Speed
With the hand calculations completed, the vehicle model can be verified. The results of the model are shown in Figure 8. The hand calculated values follow the simulated values within a reasonable margin of error. This aids in validating the model and allows for physical testing to take place to refine the model.
Figure 8 – Calculated G-Force at Full Acceleration vs Vehicle Speed
With the model completed, the vehicle was tested on a flat blocked off strip of road on campus (coordinated with campus security). In order to perform the test 4 people a required: a driver, a captain (in the front passenger seat), a software logger (behind the driver) and a hand logger (beside the software logger). The test procedure is as follows:
1. Hand Logger: Record start mileage, start time, purpose of testing, and the person in each position of the car. Review test procedure with everyone in the vehicle.
00.050.1
0.150.2
0.250.3
0.350.4
0.450.5
0 10 20 30 40 50 60 70
Acce
lera
tion
(g-fo
rce)
Vehicle Speed (mph)

Page 9 of 17
2. Drive to location, while en route the software logger should verify that all required data can be properly logged and saved.
3. Come to a complete stop at the starting line, software logger should start a new log, hand logger should record the name of the previous log and the location it’s saved to.
4. Upon the captain’s signal, the driver shall accelerate as fast as possible with little to no tire slip.
5. The captain will monitor vehicle speed and signal the driver to stop accelerating at 65 mph. The driver will then slow down and set up for another run or return to the garage based off the captain’s instruction. The software logger will stop the log and start a new log. The hand logger should record the name of the previous log and the location it’s saved to.
6. Repeat steps 3 – 5 as per the captain’s instruction. 7. Once return to the garage, the hand logger should record
the end mileage and time.
The first time the test was run, the VTS target of 9.14s was not met. Upon investigation of the vehicle it was found that the traction motor and generator had been switched when first installed on the vehicle resulting in reduced performance.as seen in Figure 9.
Figure 9 – Actual Vehicle Speed vs Time Pre-Motor Swap
After switching the motors to their proper positions, the vehicle was retested. The performance targets were still not being met which lead to further investigation. The traction motor appeared to have a rate limiter applied to it that could not be found in the model. Investigation then led to the team to look at the RMS inverter which also acts as a motor controller for the traction motor. A rate limiter was found to be set too low within the inverter and was raised to the proper point. Although the rate limiter made a difference it still did not meet the VTS target. Upon further investigation, it was found that the HV bus voltage drops substantially due to the high current draw from the traction motor, see Figure 18 located in the appendix. Even though the bus voltage drops from the
nominal 300 volts the 0-60 mph time was 9.64 seconds which is below the competition requirement of 11.50 seconds but does not meet the VTS target. To achieve the VTS target a new feature was implemented where when the car is in neutral the accelerator pedal is mapped to the ICE power output. The ICE turns on and starts producing power which results in a higher bus voltage. When the vehicle is shifted from neutral to drive the pedal is remapped to control the traction motor output while the bus voltage is still elevated, as shown in Figure 19 in the Appendix. By doing so the VTS target of 0-60 mph in 9.14 seconds was achieved, as shown in Figure 10.
Figure 10 – Actual Vehicle Speed vs Time for VTS
All other validation testing was completed in a similar iterative manner to the Acceleration 0 – 10 mph test described above.
99% BUYOFF FEATURES AND UNIQUE ATTRIBUTES
The EcoEagles have improved and incorporated a number of features on the vehicle. Those features include newly designed suspension system, Diesel exhaust Selective Catalytic Reduction (SCR) system, center stack information system and engine bay/trunk finishing.
New springs and dampers have been selected in order to preserve the driving characteristics of the stock vehicle despite the added weight of the new powertrain. These components were selected by conducting an analysis on the vehicle to see the spring rate necessary to keep the ride height the same as the stock vehicle. The damping rate was increased so that the stock vehicle’s damping ratio was preserved.
The EcoEagles exhaust system, shown in Figure 11, utilizes clean diesel technologies including an exhaust gas recirculation system (EGR) from the stock engine, a diesel

Page 10 of 17
particulate filter (DPF) and a selective catalytic reduction system (SCR). The EcoEagle’s exhaust system is designed to reduce hydrocarbons (HC), particulate matter (PM), carbon oxides (CO), and nitrous oxides (NOx) emissions. The approximated emission reductions are shown in Table 1.
Figure 11 - EcoEagles Exhaust system
Table 1 – Components Emissions (United States Environmental Protection Agency 2013)
Emission Reduction (%)
Technology PM (%)
NOx (%)
HC (%)
CO (%)
Exhaust Gas Recirculation (EGR) 0 25-40 0 0 Diesel Particulate Filter (DPF) 85-95 0 85-95 50-90 Selective Catalytic Reduction (SCR) 0 up to 75 0 0 The SCR system utilizes two NOx sensors, a diesel exhaust fluid (DEF) injector, a catalyst from a Chevy Cruze Diesel and an NH3 sensor. NOx sensors are located upstream and downstream of the catalyst. The ammonia sensor is located downstream of the SCR catalyst and helps the SCR prevent ammonia slip. The injector is mounted 90 degrees from the flow of exhaust and injects DEF fluid.
The center stack information system has also been redesigned to increase static consumer acceptability The team has been developing and refining four graphical user interfaces (GUIs) for implementation in the center stack. The four GUIs are:
1. Main – main information 2. Controls - Displays the CAN data 3. AC - Displays the AC controls 4. Radio - Displays the radio buttons
Figure 12 – Main GUI Mockup First Draft
The EcoEagles logo was displayed on the Centre Stack to test the responsiveness of the screen to the new board.
Figure 13 – New Udoo Board Live Connected to Screen
The team has created new mounts for various instruments and to make the trunk area clean and tidy. The biggest concern the team had was to design and fabricate a cover that would protect the ESS from all possible impacts that a trunk would experience and more. Possible impacts that were considered were groceries, luggage, hardware, etc. To protect the cover from these common impacts, the team went with a composite schedule of Fiberglass Chop Mat (2 layers), Kevlar (2 layers), a Nomex honeycomb sandwich structure, with Carbon Fiber (2 layers) on the top. With the mounts and the final trunk design, the main focus was to maximize trunk space. The first thing done to accomplish this was to create mounts that could fit into the unoccupied space between the wheel-well and the ESS cover. The team felt that this area would be not be used when the final trunk panels went in to the car so they wanted to place as many instruments that could fit. The second thing done was the fabrication of trunk panels in a way that could maximize the trunk space even more. To do this, Plexiglass will be heat formed to the inner shape of the trunk and then wrapped with carbon fiber. With this design, the panels are now more resistant to failure from impact while still being lightweight and thin, making the trunk spacious.
The EcoEagles have developed several aerodynamic modifications that will reduce drag thus decreasing energy

Page 11 of 17
consumption. Simulations have shown that a 10% reduction in drag will result in approximately a 6% decrease in energy consumption for a majority of drive cycles. The first area of drag reduction is the replacement of the standard Chevrolet Malibu mirrors. These will be replaced with two cameras located in approximately the same location. These cameras will have their image visible to the driver on two monitors located directly behind the instrument panel. This will benefit the driver in two ways, firstly the distance the driver’s eyes must move from the road is reduced, and secondly, the field of view is slightly increased over standard mirrors. The mirrors also don’t require adjustment based on individual drivers. It has been shown through Computational Fluid Dynamics (CFD) that the expected reduction in drag for the mirrors is 7%. The EcoEagles will also implement a side skirting system which will reduce the amount of air spilling out from the sides of the vehicle underbody. This reduction in spillage will energize the flow underneath the vehicle and further reduce drag. This will be accomplished with the use of nylon bristles that act as a weather guard. This will allow a close proximity with the ground for improved aerodynamics without sacrificing ground clearance. CFD simulations have shown an approximate 5% reduction in drag. To increase the skirting system’s effectiveness, the EcoEagles have also implemented aerodynamic wheel covers. These have shown significant reductions in drag in previous research (D'Hooge, Palin and Johnson 2012). These, like the skirting system, act to reduce the amount of air spilling from the underbody of the vehicle. Since the vehicle has regenerative braking, reductions in brake cooling are negated. Finally, vortex generators which act to reduce flow separation on the rear window will be installed on the vehicle, as well as, a slot jet in the rear trunk. This slot jet acts to stabilize the rear wake and reduces the turbulent kinetic energy of the vortex structures. On a simplified body, this slot jet has shown reductions in drag up to 15% (Barsotti and Boetcher 2013).
SUMMARY/CONCLUSIONS
A Tremendous conversion from a stock production vehicle to a series plug-in hybrid electric vehicle has been executed. The controls development and vehicle refinement have been presented that have led to rapid innovation. The custom vehicle controller has been integrated with every portion of the stock vehicle. The major milestone of year 3 is to have a vehicle at a 99% production level and the team of students remains committed to the final mechanical, electrical, and controls refinements that will deliver this target.
REFERENCES
Barsotti, Domenic L., and Sandra K. S. Boetcher. 2013. "OPTIMIZING JETS FOR ACTIVE WAKE CONTROL OF GROUND VEHICLES." Proceedings of the ASME 2013 International Mechanical Engineering Congress & Exposition IMECE 2013. San Diego.
D'Hooge, Andrew, Robert B. Palin, and S. Johnson. 2012. "The Aerodynamic Development of the Tesla Model S - Part 2: Wheel Design Optimization." SAE 2012 World Congress & Exhibition. Detroit.
EcoCAR 2. n.d. About EcoCAR 2 | EcoCAR 2 Plugging In to the Future. Accessed February 27, 2014. http://www.ecocar2.org/about-ecocar2.
United States Environmental Protection Agency. 2013. Retrofits| Technology| National Clean Diesel Campaign| US EPA . January 23. http://www.epa.gov/cleandiesel/technologies/retrofits.htm.
ACKNOWLEDGMENTS
The EcoEagles would like to acknowledge the extensive work performed by the EcoCAR 2 organizers and sponsors.
Page 12 of 17
DEFINITIONS/ABBREVIATIONS
CD Charge Depleting CS Charge Sustaining ESS Energy Storage System HV High Voltage ICE Internal Combustion Engine PCM Phase Change Material PHEV Plug-In Hybrid Electric Vehicle PIA Program Initiation Approval PTTR Parallel Through The Road VDP Vehicle Design Process VDR Vehicle Design Review VTC Vehicle Testing Complete VTS Vehicle Technical Specifications
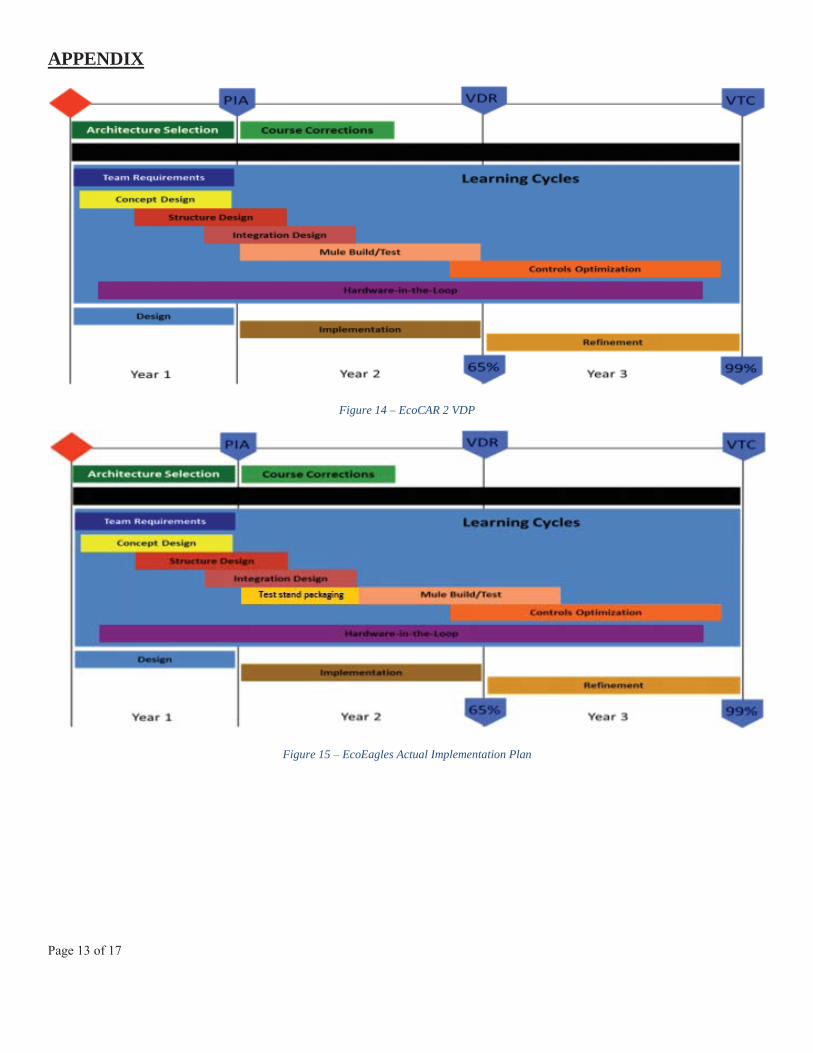
Page 13 of 17
APPENDIX
Figure 14 – EcoCAR 2 VDP
Figure 15 – EcoEagles Actual Implementation Plan

Page 14 of 17
Figure 16 – Communication and Power Distribution Network Topology
Figure 17 - Projected Performance Data

Page 15 of 17
Figure 18 – Bus voltage, EM only vs EM and generator
Figure 19 – Torque and rpm, EM only vs EM and generator

Page 16 of 17
Table 2 – Vehicle Fault Cases
Diagnostic Category Fault Remedial Action
Tier 1 Accelerator Pedal Mismatch Disable traction motor Tier 1 Accelerator Pedal Mismatch Disable traction motor Tier 1 Accelerator Pedal Range Disable traction motor Tier 1 Invalid Shifter Signal Disable traction motor Tier 1 Transaxle Failure Disable traction motor Tier 1 ESS Emergency Power Off N/A (Contactors Open Automatically) Tier 2 Traction Motor Over Temp Limp home torque limit (50 Nm) for 30 seconds after fault disappears Tier 2 DC Bus Voltage Mismatch Limp home torque limit (50 Nm) for 30 seconds after fault disappears Tier 2 ESS Cell Over Temp Limp home torque limit (50 Nm) for 30 seconds after fault disappears Tier 2 ESS Over/Under Volt Limp home torque limit (50 Nm) for 30 seconds after fault disappears
Tier 2 Traction Motor Inverter Over Temp Limp home torque limit (50 Nm) for 30 seconds after fault disappears
Tier 2 ESS Coolant Over Temp Limp home torque limit (50 Nm) for 30 seconds after fault disappears
Tier 3 Engine Over Temp Full tractive torque, no series operation for 30 seconds after fault disappears
Tier 3 Generator Over Temp Full tractive torque, no series operation for 30 seconds after fault disappears
Tier 3 Coupling Failure Full tractive torque, no series operation for 30 seconds after fault disappears
Tier 3 Generator Inverter Over Temp Full tractive torque, no series operation for 30 seconds after fault disappears
Tier 3 Low Oil Pressure Full tractive torque, no series operation
Tier 3 Low Fuel Full tractive torque, no series operation for 30 seconds after fault disappears
Tier 3 Boost Leakage Full tractive torque, no series operation for 30 seconds after fault disappears

Page 17 of 17
Table 3 – VTS Goals
Specification Production 2013 Malibu
Competition Requirement
EcoEagles 2013 Malibu (4 cycle w/o trailer)
EcoEagles 2013 Malibu (E & EC w/o trailer)
EcoEagles 2013 Malibu (E & EC w/ trailer)
Acceleration 0-60 mph 8.2 sec 11.5 sec 9.14 sec Acceleration 50 -70 mph 8 sec 10 sec 4.431 sec Braking 60 – 0 mph 143.3 ft 180 ft 180 ft
43.7 m 54.8 m 54.8 m Highway Gradability @ 20 min
10+% @ 60 mph
3.5% @ 60 mph >3.5% @ 60 mph
Cargo Capacity 16.3 ft ^3 7 ft^3 14 ft^3 Passenger Capacity 5 persons 2 persons 4 persons 4 persons 4 persons Mass 1600 kg <2250 kg 2179 kg Starting Time < 2 sec < 15 sec < 10 sec Ground Clearance 155mm (2012) >127mm >127mm Vehicle Range 736 km
(CAFE) 322 km 385 km 405 km 316 km
457 mi 200 mi 240 mi 253 mi 200 mi Charge Depleting Range N/A 57.2 km 57.1 km 42.8 km Charge Depleting Energy Consumption
N/A 176 Wh/km 176 Wh/km 235 Wh/km
Charge Sustaining Energy Consumption
N/A 678 Wh/km 637 Wh/km 810 Wh/km
UF- Weighted Fuel Energy Consumption
N/A 285 Wh/km 269 Wh/km 418 Wh/km
UF- Weighted AC Electric Energy Consumption
8.83 lge/100km
397 Wh/km 381 Wh/km 546 Wh/km
787 Wh/km UF- Weighted WTW Petroleum Energy (PE) Use
787 Wh/km 0.247 kWh/km 0.232 kWh/km 0.36 kWh/km
UF- Weighted WTW GHG Emissions
253 g GHG/km
154 g/km 150 g/km 203 g/km
Criteria Emissions Tier 2 Bin 5 147 g/km 157 g/km 101 g/km

78
78
Appendix C

1 Copyright © 20xx by ASME
Proceedings of the ASME 2014 International Mechanical Engineering Congress & Exposition IMECE2014
November 14-20, 2014, Montreal, Quebec, Canada
IMECE2014-40018
APPLICATION OF PRINCIPLES FROM THE SCRUM AGILE METHOD TO A PROTOTYPE VEHICLE CONTROL DEVELOPMENT CYCLE
Mr. Derek Bonderczuk Embry-Riddle Aeronautical University
Daytona Beach, FL, United States
Dr. Patrick Currier Embry-Riddle Aeronautical University
Daytona Beach, FL, United States
Author Name Affiliation
City, State, Country
Mr. Matthew Nelson Embry-Riddle Aeronautical University
Daytona Beach, FL, United States
Author name Affiliation
City, State, Country
ABSTRACT Traditional methods for organization of controls development tend not to facilitate the speedy completion of complex tasks such as development of an experimental vehicle control system, particularly when staffing levels are low. This paper proposes the use of Scrum Agile software development methods to streamline the control development cycle for a prototype vehicle. The EcoCAR 2 competition vehicle at Embry-Riddle Aeronautical University is used as a case study for this implementation. Specific protocols and workflows for development are outlined and examples of implementation on the EcoCAR 2 vehicle are provided. Implementation results indicate that the method allowed for an aggressive development schedule for the vehicle software without compromising reliability, maintainability, or upgradeability.
INTRODUCTION The EcoCAR 2 competition is a three-year development cycle student competition in which university teams develop a prototype PHEV (Plug-In Hybrid Electric Vehicle). The competition’s governing body, Argonne National Laboratory, provides a set of rules which dictate a set of base requirements for the vehicle being developed. The team is expected to develop a hybrid powertrain for a General Motors 2013 Chevrolet Malibu™ with the goals of increasing fuel efficiency and reducing well-to-wheel greenhouse gas emissions while maintaining practicality for daily use (Argonne National Laboratory, 2011).
The nature of the project necessitates the organization of inter-disciplinary teams can approach vehicle design from multiple perspectives. Embry-Riddle Aeronautical University (ERAU) has organized its team into a number of technical subteam with specific responsibilities:
Mechanical – Design, integration, and packaging of major
drivetrain components Electrical – Design, integration, and installation of high and
low voltage electrical systems Controls – Design, implementation, and testing of hybrid
supervisory controller
This paper will focus on the ERAU Controls subteam’s use of the Scrum Agile method to organize and assist with implementation of the supervisory controller software. Given the scope of the project, the controls subteam is extremely small, consisting of three members. The team did not apply organized software methods until Year 3 of the competition, and, as illustrated below, the Scrum method was crucial to the ability to completely redevelop a sophisticated vehicle supervisory controller in the span of less than one year. THE SCRUM METHOD
The Scrum method is a system that reduces management overhead by making a series of assertions regarding the execution of process control (Pino, Pedreira, Garcia, Luaces, & Piattini, 2010). The Scrum method is lightweight, meaning there is less managerial and procedural overhead than there is in more traditional methods, such as the V-model or waterfall model

2 Copyright © 20xx by ASME
(Grimheden, 2013). In addition, the method is also very scalable, provided that higher level teams are placed in charge of lower level teams. Changes can then be allowed to flow from level to level. An example of this can be seen in Nokia’s deployment of the Scrum method utilizing over 500 software developers (Carlson & Turner, 2013). There are three “pillars” that hold a central place within the theory. The three pillars are:
1. Transparency – “Significant aspects of the process must be
visible to those responsible for the outcome. Transparency requires those aspects be defined by a common standard so observers share a common understanding of what is being seen.” (Schwaber & Sutherland, 2013)
2. Inspection – “Scrum users must frequently inspect Scrum artifacts and progress toward a Sprint Goal to detect undesirable variances. Their inspection should not be so frequent that inspection gets in the way of the work. Inspections are most beneficial when diligently performed by skilled inspectors at the point of work.” (Schwaber & Sutherland, 2013)
3. Adaptation – “If an inspector determines that one or more aspects of a process deviate outside acceptable limits, and that the resulting product will be unacceptable, the process or the material being processed must be adjusted. An adjustment must be made as soon as possible to minimize further deviation.” (Schwaber & Sutherland, 2013)
Through these ideals, the Scrum method seeks to leverage
the flexibility of the efforts of a small group over the inherent strength of processes. The method does not seek to be anti-procedural, but participants are expected to use processes to manage efforts and not be managed by those very processes. In addition, the amending of processes or end goals during a project is regarded as acceptable and even encouraged. (Schwaber & Sutherland, 2013)
Two important documents used in the Scrum model guide
development. These documents are the Product Backlog (PB) and the Sprint Backlog (SB) and they are categorized as “artifacts”. The PB holds all features or requirements that will be needed for a particular product. This artifact is the primary interface between the Product Owner and the rest of the team. The SB is a document that contains all plans for the current sprint. The sprint backlog is exclusively for planning purposes internal to the Scrum team. (Schwaber & Sutherland, 2013)
Three major entities act within the environment dictated by
the Scrum model in order to deliver a product: 1. Product Owner – Manages the PB in order to pace
development. In performing his or her task, the product owner is responsible for prioritizing PB items in such way that all goals are met. (Schwaber & Sutherland, 2013)
2. Development Team – A group of individuals that collectively hold the responsibility of ensuring that PB
items are addressed. Though Development teams are made up of individuals with different skills, they all share the title of “Developer”. The size of the development team should be greater than three so that significant work can be achieved within a reasonable time increment, but fewer than nine so that minimal effort is spent on coordination. (Schwaber & Sutherland, 2013)
3. Scrum Master – Responsible for optimizing the performance of both the Product Owner and the development team with the goal of seamless collaboration in mind while upholding Scrum model principles throughout development. (Schwaber & Sutherland, 2013)
Development is choreographed using a series of five events
that envelop development efforts: 1. Sprint – A development phase lasting no longer than one
month during which no goals or standards change. The sprint may be cancelled, but it rarely makes sense to do so given the short length. (Schwaber & Sutherland, 2013)
2. Sprint Planning Event – A meeting where the goals for the next sprint are set. This is also the time when the list of PB items to be incorporated is negotiated. (Schwaber & Sutherland, 2013)
3. Daily Scrum – A 15 minute or less meeting used to establish the goals of the next working day. This meeting is exclusively for the development team and the Scrum master to discuss how work is progressing and to reassess the methods being used to attain the sprint goals. (Schwaber & Sutherland, 2013)
4. Sprint Review – An event during which the product that has been created is evaluated. This meeting is held with stakeholders and has a maximum length of 4 hours. (Schwaber & Sutherland, 2013)
5. Sprint Retrospective – A 3 hour meeting that allows the Scrum team to evaluate the process used during the last sprint and make any procedural changes that might be necessary. (Schwaber & Sutherland, 2013)
USE OF SCRUM IN ECOCAR 2
The Scrum process was implemented for controls development on the ERAU EcoCAR 2 team. All parts of it were put to use with the exception of formal Sprint Retrospective meetings. PERSONNEL
Every EcoCAR 2 team has a student team lead that serves to bring cohesion to the team and act as a mediator between the organizers and the student participants. Because the team lead communicates requirements to technical sub-team leads, he or she functions as a Product Owner would. Thusly, the team lead was chosen to be the Product Owner. During team meetings, the Product Owner participated in negotiations with the Scrum
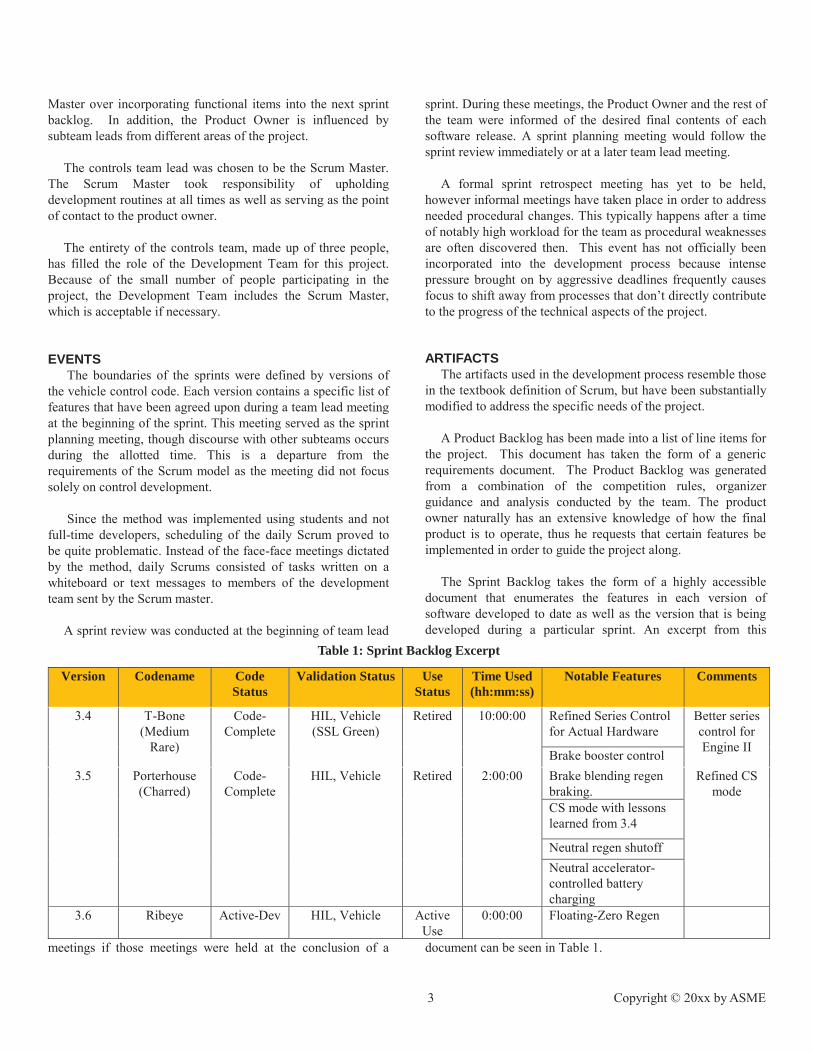
3 Copyright © 20xx by ASME
Master over incorporating functional items into the next sprint backlog. In addition, the Product Owner is influenced by subteam leads from different areas of the project.
The controls team lead was chosen to be the Scrum Master.
The Scrum Master took responsibility of upholding development routines at all times as well as serving as the point of contact to the product owner.
The entirety of the controls team, made up of three people,
has filled the role of the Development Team for this project. Because of the small number of people participating in the project, the Development Team includes the Scrum Master, which is acceptable if necessary.
EVENTS
The boundaries of the sprints were defined by versions of the vehicle control code. Each version contains a specific list of features that have been agreed upon during a team lead meeting at the beginning of the sprint. This meeting served as the sprint planning meeting, though discourse with other subteams occurs during the allotted time. This is a departure from the requirements of the Scrum model as the meeting did not focus solely on control development.
Since the method was implemented using students and not
full-time developers, scheduling of the daily Scrum proved to be quite problematic. Instead of the face-face meetings dictated by the method, daily Scrums consisted of tasks written on a whiteboard or text messages to members of the development team sent by the Scrum master.
A sprint review was conducted at the beginning of team lead
meetings if those meetings were held at the conclusion of a
sprint. During these meetings, the Product Owner and the rest of the team were informed of the desired final contents of each software release. A sprint planning meeting would follow the sprint review immediately or at a later team lead meeting.
A formal sprint retrospect meeting has yet to be held,
however informal meetings have taken place in order to address needed procedural changes. This typically happens after a time of notably high workload for the team as procedural weaknesses are often discovered then. This event has not officially been incorporated into the development process because intense pressure brought on by aggressive deadlines frequently causes focus to shift away from processes that don’t directly contribute to the progress of the technical aspects of the project. ARTIFACTS
The artifacts used in the development process resemble those in the textbook definition of Scrum, but have been substantially modified to address the specific needs of the project.
A Product Backlog has been made into a list of line items for
the project. This document has taken the form of a generic requirements document. The Product Backlog was generated from a combination of the competition rules, organizer guidance and analysis conducted by the team. The product owner naturally has an extensive knowledge of how the final product is to operate, thus he requests that certain features be implemented in order to guide the project along.
The Sprint Backlog takes the form of a highly accessible
document that enumerates the features in each version of software developed to date as well as the version that is being developed during a particular sprint. An excerpt from this
document can be seen in Table 1.
Table 1: Sprint Backlog Excerpt
Version Codename Code Status
Validation Status Use Status
Time Used (hh:mm:ss)
Notable Features Comments
3.4 T-Bone (Medium
Rare)
Code-Complete
HIL, Vehicle (SSL Green)
Retired 10:00:00 Refined Series Control for Actual Hardware
Better series control for Engine II Brake booster control
3.5 Porterhouse (Charred)
Code-Complete
HIL, Vehicle Retired 2:00:00 Brake blending regen braking.
Refined CS mode
CS mode with lessons learned from 3.4
Neutral regen shutoff Neutral accelerator-controlled battery charging
3.6 Ribeye Active-Dev HIL, Vehicle Active Use
0:00:00 Floating-Zero Regen

4 Copyright © 20xx by ASME
Versions of control code are denoted by both a number and
the convention of using a cut of beef as a codename. The temperature denotes the relative length of each sprint. The codenames and temperatures were added to enhance the ability of the developers to easily remember and distinguish between revisions. Line items were added to this document upon reaching a consensus at each sprint planning event. This document is shared on the team’s Subversion (SVN) server and is committed at the end of the sprint planning event.
Since the tasks for the controls team involve maintaining
and utilizing a simulation of the project vehicle, a development log for the simulation has been created as well. Ideally, this simulation would be the responsibility of a different development team altogether, but because of resource constraints, the simulation is maintained by the controls development team. Because of its nature as a separate project, it has its own sprint backlog. An excerpt can be seen in Table 2.
RESULTS Considering the fact that development has continued for a
mere eight months, it can be readily seen that much progress has been made. Though the controls subteam is quite small, the formation of defined roles for the Product Owner and the Scrum Master has simplified communications and have allowed for minimal confusion between members of the development team. Also, with targets for development unchanging during each sprint, no time is wasted ascertaining the latest desires for development of any stakeholders.
Compare this dynamic to last year’s team which struggled with maintaining a well-defined image of how the product is to work. Frequently, several versions of the product are exchanged by word of mouth to the confusion and dismay of development teams. One example of this is the confusion that occurred over
the design of the vehicle cooling system. In the two months preceding the EcoCAR Year Two competition (2013), the schematics of the cooling loops that would evacuate heat from the powertrain components were constantly changing. In addition, these changes were never communicated to the control code development team unless an answer was specifically sought out. Because of this, control algorithms could not be developed for the cooling loops. The only way to avoid this is to specifically define decision-making and leadership roles, but not to over-manage in such a way that the product image becomes unclear due to extensive process overhead. Planned events during which and only during which these changes can be made, need to be instituted as well.
Scrum events have helped to pace development in such a
way that appropriate effort has been given to features that require attention. Meetings are short and a clear image of the development team’s appointed tasks are created at each event. The most important outcome of the implementation of sprints is the fact that every sprint ends with a working product that can be used with confidence. During year 2 of the competition,
sprints were not utilized and thus only one version of the control software was available at a time. To further compound the situation, no SVN server or versioning system was used. This led to frequent incidents of confusion over which file was the latest version and misplacement of needed code.
Much of the time, student projects stagnate in a perpetual
state of optimization. That is to say, a working product is never developed because the focus is usually placed on making it better instead. The Scrum definition calls for a complete, self-sufficient product to be delivered at the conclusion of every sprint. Thus far, the controls development team has not failed in this respect.
Overall, reliability of the control code has improved greatly
because of the fact that new code is packaged into self-
Table 2: Simulation Sprint Backlog Excerpt
Version Algorithm Simulated Behavior Vehicle Behavior Priority Changed by Corrective Action
3.6.x
Engine Torque is a 0th order function of demand and speed
Turbo lag adds dynamics to torque generation
High Derek Bonderczuk Added a transfer function for turbo spool
3.6.x
ESS Battery capacity/voltage is incorrect
Actual battery has less capacity and more voltage variance
High Derek Bonderczuk Added maps for zero load voltage, energy used and internal resistance as a function of SOC
3.6.x
Chassis Car accelerates faster than it should
Car is slower than predicted
High Derek Bonderczuk Corrected mass, Cd, A and rolling resistance coefficients.
5 Copyright © 20xx by ASME
sufficient releases. Barring any electrical or mechanical changes, each release can be loaded onto the vehicle’s controller for testing. The improved reliability introduced by the use of the Scrum process has aided the mechanical and electrical teams by enabling simultaneous development and testing alongside the controls team.
Maintainability of the control code has made exceptional
improvements because of the strong documentation infrastructure that has been introduced because of the implementation of the Scrum Process for development. Sprint backlogs have allowed for the development team to know precisely where code has been deployed. In addition, requirements testing and validation has been made simple because the Sprint Backlogs are very accessible. Product backlogs have allowed for a clearer, more universal understanding of how the product is to operate.
In year one of the competition, the importance of specifying
product features in a concrete and transparent manner was overlooked and it hindered the project greatly. It limited knowledge transfer from experienced individuals to newer additions. In the high-turnover environment of the university, this can be catastrophic to team performance. Now that product features are now documented in a format that is understood by all teams and resident faculty advisors, the addition and training of new team members is quick.
Finally, as the control software is upgraded, new code can be
added without consequence because of the availability of previous releases. There is no longer any confusion over which version is the latest or where new improvements have been deployed.
CONCLUSIONS Overall the Scrum process has introduced much more
flexibility, cohesion and speed in the development process. The addition of defined roles for leadership and decision making has eliminated confusion over project goals and technical methods being pursued. Scrum events have helped to pace development in a way that ensures maximum productivity and minimal risk. Events have also taken anxiety away from the development team by making goals achievable and unchanging. Scrum artifacts have been the greatest asset to the team so far. Before Scrum methods were implemented, an unclear image of how the product was to function existed among the team. Once formal requirements and Scrum backlogs were formed, all stakeholders and developers could collaborate without needing to return to
outdated deliverables for technical requirements or specifications.
The lack of a sprint retrospective event has not hurt the
development effort in a visible way so far. As the organization grows, processes for development will need to be re-evaluated, particularly by the Scrum Master, in order to ensure that the Scrum process is not violated. In addition, the development team will need to acquire significantly more members so that each member can specialize to some degree. When members of the development team are given too many tasks, development becomes fragmented and a higher state of confusion over sprint progress will exist.
ACKNOWLEDGMENTS The authors would like to acknowledge Argonne National
Laboratory and the U.S. Department of Energy, General Motors Inc., the Embry-Riddle EcoEagles and the Embry-Riddle Mechanical engineering department.
REFERENCES [1] K. Schwaber and J. Sutherland, "The Scrum Guide," 2013.
[Online]. Available: https://www.scrum.org/Portals/0/Documents/Scrum%20Guides/2013/Scrum-Guide.pdf#zoom=100. [Accessed 20 April 2014].
[2] K. Vlaanderen, S. Jansen, S. Brinkkemper and E. Jaspers,
"The agile requirements refinery: Applying SCRUM principles to software product management," Information and Software Technology, pp. 58-70, 2011.
[3] F. J. Pino, O. Pedreira, F. Garcia, M. R. Luaces and M.
Piattini, "Using scrum to guide the execution of software process improcement in small organizations," The Journal of Systems and Software, pp. 1662-1667, 2010.
[4] M. E. Grimheden, "Can agile methods enhance
mechatronics design education?," Mechatronics, pp. 967-973, 2013.
[5] R. Carlson and R. Turner, "Review of agile case studies for
applicability to aircraft systems integration," Procedia Computer Science, pp. 469-474, 2013.
[6] Argonne National Laboratory, "About EcoCAR 2," 2011.
[Online]. Available: http://www.ecocar2.org/about-ecocar2. [Accessed 20 April 2014].