Executing on African ambitions South Africa – … on African ambitions South Africa – Major...
26
Executing on African ambitions South Africa – Major banks analysis PwC analysis of major banks’ results for the reporting period ended 31 December 2013 11 March 2014 www.pwc.co.za/banking
Transcript of Executing on African ambitions South Africa – … on African ambitions South Africa – Major...

Executing on African ambitionsSouth Africa – Major banks analysis
PwC analysis of major banks’ results for the reporting period ended 31 December 2013 11 March 2014
www.pwc.co.za/banking

Major banks analysis – March 2014 100
Contents
1. Combined results overview 1
2 Economic outlook 4
3. Net interest income 5
4 Non-interest revenue 6
5. Efficiency 7
6. Asset quality 8
7. Capital and funding 10
8. Passing the stress test 14
9. Rest of Africa highlights 17
10. Key banking statistics 18
11. Industry data 20
12. Contacts 22
Major banks analysis – March 2014 1
1. Combined results overview
One of the central messages coming out of the World Economic Forum meeting in Davos earlier this year was the clear shift in CEO sentiment in favour of advanced economies. This, in turn, was driven by the improving growth outlook in these economies. PwC’s 17th annual Global CEO Survey, which was launched in Davos, shows that the shift was strongest in the US, closely followed by Germany and the UK.
As always, the results of our banks must be seen in the context of global and domestic economic sentiment. The imbalance caused by South Africa’s large current account deficit underlines our economy’s dependence on foreign capital flows to fund growth and its vulnerabilities to global economic developments. The macroeconomic environment that serves as a backdrop to the results of our major banks for the period to December 2013 continued to be challenging.
External developmentsThe impact of somewhat less favourable fundamentals across some emerging economies, including South Africa, has been compounded by concerns that excessive liquidity made available by advanced economies in recent years to fight the crisis will gradually be withdrawn. Evidence of this came most recently by the US Federal Reserve’s decision to scale back, or ‘taper’, the pace of its quantitative easing programme. The impact of this resulted in a sharp rise in the risk premium embedded in most emerging market assets, heightening the economic experience of both volatility and uncertainty.
While prospects in advanced economies may appear brighter than in recent periods, the past five years have shown that hopes of a sustained economic recovery can quickly be dashed. Therefore, key questions for 2014 will centre around whether the outlook for advanced economies can live up to expectations, whether the domestic economy can stand up to the risks it is facing, including the consumer impact of higher inflation and interest rates, labour unrest and the weak rand, and the local impact of global monetary policy.
Of the major advanced economies, the US recovery seems the most secure. The US financial sector has restructured, household debt to GDP ratios are at more manageable levels, while the outlook for US fiscal and monetary policy looks more predictable than in 2013. Despite the uneven growth pattern across the Eurozone, for peripheral Europe, the outlook is somewhat better than previously, while the outlook for core Europe is more positive on the back of strong recent export growth in key markets such as Germany.
Major banks performanceCollectively the banks continue to do well despite the uncertain and volatile environment. The combined increase of 24.5% in headline earnings to R27.6bn against the comparable period comes off the back of strong net interest income growth of 18.4%, solid non-interest income growth of 9.8% and impairment charges that have been reduced due to intense focus on provisioning levels in prior periods.
Credit growth continues to be focused to ensure that loans generated are of appropriate quality and generate acceptable margin under the new capital and funding regimes. Focus has also been maintained on growing in those areas that meet target ROE levels. Gross loans and advances grew by only 4.3% in the second half of 2013, which is slower than the growth of 7.5% seen in the first half of the year.
The major banks’ bad debt trended on the lower end of expectation in the six months to December 2013 on the back of a subdued credit cycle. General consensus among the banks is that we have now seen the bottom end of this cycle, with expectations for current credit pressure, particularly among the retail segment, to materialise over the short term as the impact of the current interest rate cycle sets in.
At the same time, combined non-performing loans (NPLs) have continued on a downward trend over the current reporting period, driven largely by declining mortgage NPLs. This improving NPL trend is good news for banks as they face expectations for a turning credit cycle.
All major banks have commented on having taken a measured approach to scaling down origination of unsecured lending portfolios, while also adequately pricing for this risk and maintaining appropriate provisions to respond to concern about the potential for rising impairments in this segment. This remains a segment of the market where the major banks have found it difficult to achieve significant growth while balancing this growth against risk appetite levels.
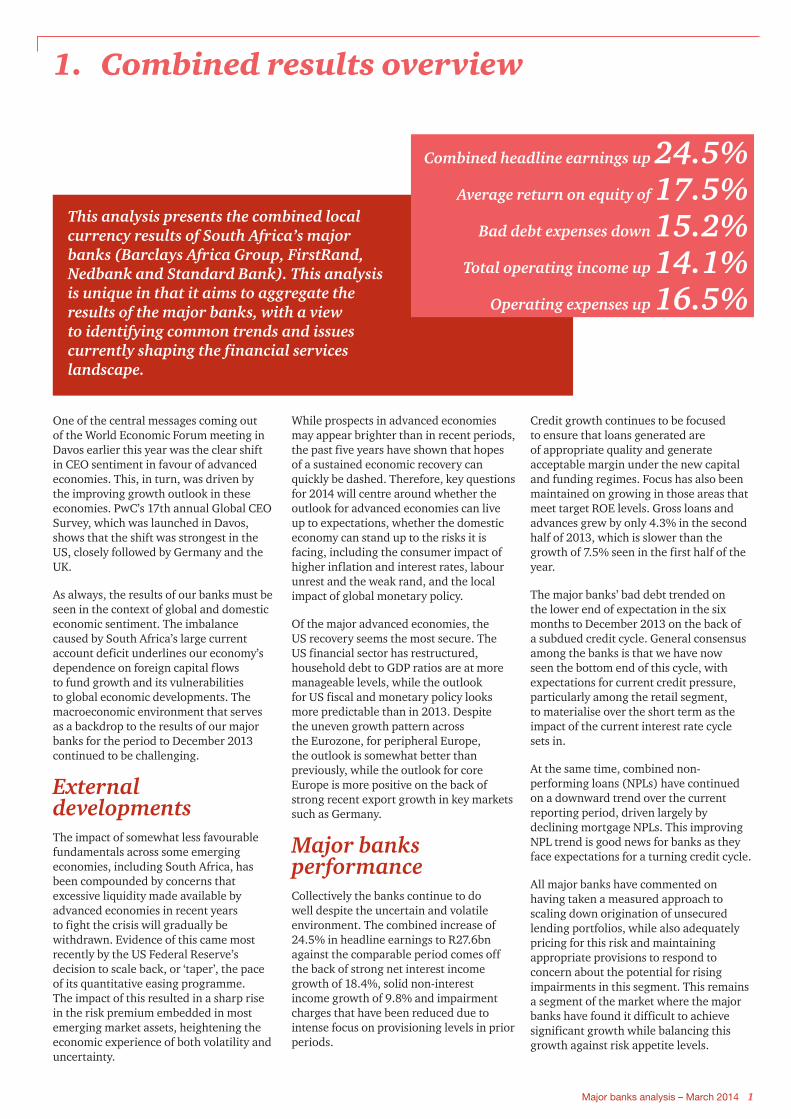
This analysis presents the combined local currency results of South Africa’s major banks (Barclays Africa Group, FirstRand, Nedbank and Standard Bank). This analysis is unique in that it aims to aggregate the results of the major banks, with a view to identifying common trends and issues currently shaping the financial services landscape.
Combined headline earnings up 24.5%Average return on equity of 17.5%
Bad debt expenses down 15.2%Total operating income up 14.1%
Operating expenses up 16.5%
Major banks analysis – March 2014 2
We have not yet seen the loan growth come at the expense of margin but the banks have said that they expect impairment levels to start trending upwards in a higher interest rate cycle. Margins have also been positively impacted by increased dollar lending on the African continent while hedging strategies were positioned to take into account an increasing interest rate cycle. Increased competition for quality assets, deposits and endowment have put some pressure on margins but the overall upward trend in margins continues for now.
The messages with regard to non-interest revenue remains consistent. These include intense focus on increasing customer transaction volumes from primary account holders, minimising the volatility associated with proprietary trading but hanging on to customer trade flows in order to generate income off the back of foreign exchange and interest rate volatility. This is supported by an ever increasing contribution of operations in the rest of Africa as business’ in the region continues to grow and start-up investment stabilises.
Other key features of non-interest revenue include:
• Net fee and commission income grew by 10.6% on the comparable period and 9.0% on 1H13, which in the context of low to zero inflationary increases in banking charges should come from increased customer numbers or customer transaction levels. These have been supported by innovative pricing packages and intense focus on customer loyalty;
• Fair value income has increased on the back of market volatility and the flow of funds between emerging economies and the developed world. We are starting to see the impact of fair value adjustments on private equity investments obtaining more interest from the market; and
• Insurance premiums continue to show good growth despite subdued economic conditions;
This analysis has highlighted a slight decrease in bank efficiency levels to 56.6% from 54.2%, which is still good in the context of global bank efficiency ratios. Factors that impacted the decline are the continued focus on regeneration of information technology capabilities, investment in people and operations as the banks expand their footprint across the continent, and the negative impact of having dollar-based costs (mostly in African countries) in an environment of a significantly devalued rand, when compared to the prior year. That being said the banks continue with their cost containment strategies while managing salary and benefit increases.
Driven by capital generation from growth in organic earnings and a continued focus on risk-weighted assets optimisation, the combined capital adequacy ratios of the banks remained resilient at 15.9%. This has been achieved despite local operations having to hold additional capital to bolster different capital regimes outside of South Africa and one of the local banks paying a significant special dividend.
Return on Equity (ROE) levels continue to be divergent but the combined ROE of 17.5% represents 8.2% growth on the first half of the year and 9.9% growth on the comparable period. Most of the banks have suggested that maintaining or improving ROE levels remains a priority, while one has stated that they believe theirs to be on the higher end of a normal ROE range.
Internal responsesChannel and product innovation remains high on the strategic agenda of our major banks. Most banks have commented positively on their plans for redesigning and repositioning their physical branch networks, with a focus on seamless migration of customers to electronic channels.
Linking innovation to increased levels of customer loyalty is a theme that was consistently highlighted by the major banks in the latest reporting period. Given intense competition for wallet share, a focus on creating an enduring customer value proposition through reward and loyalty plans will continue to form an important part of the banks’ strategies going forward.
The major banks continue to invest heavily in IT systems to facilitate the customer value proposition and ensure that a stable platform is created for future expansion. Most notably, significant IT costs are incurred in the electronic banking platforms as part of the banks’ expansion of their African footprint. At the same time, the banks’ IT investments continue to seek to mitigate heightened recent global concern around developments in cyber crime.
Stakeholder expectationsAs we’ve previously indicated, regulatory changes continue to evolve, impacting and influencing overall bank strategy, business models and balance sheet positioning. In January this year, the Basel Committee on Banking Supervision (BCBS) issued a revision of its leverage ratio framework and set out amendments to the Liquidity Coverage Ratio (LCR) framework. We discuss these changes in further detail later in our analysis.
At the same time, regulators globally continue to sharpen their focus on compliance and market conduct concerns, with a number of high-profile fines having been issued recently. Mitigating compliance risk through robust control processes will be an area that will remain front of mind for banking executives and management. With South Africa’s pending move to a ‘twin peaks’ regulatory model, enhanced focus on market conduct supervision for banks can be expected.
ProspectsWe expect the South African economy to continue to face the triple challenge of a cyclical economic slowdown, a persistent current account deficit and a squeeze on foreign capital flows on the back of tapering by the US Federal Reserve. Being an election year, some short-term volatility, and potential delays in reforms, can be expected to influence the exchange rate market – in many ways a continuation of what we observed in mid-2013.
The latest available National Credit Regulator’s quarterly Credit Bureau Monitor highlighted that consumers classified in good standing increased by 9,000 to 10.5 million consumers at the end of the third quarter of 2013 As a percentage of total credit-active consumers this reflects a very moderate 0.1% decrease compared to the previous quarter, and a 1.1% decrease year-on-year. Looking forward, the retail credit market is expected to continue to be a challenging one.
While uncertainty and heightened forecast risk will continue to be a theme over the short term, the well-diversified product lines and strong franchises of the major banks will assist their resilience to continued volatility. Domestically, wholesale credit demand is expected to continue to supercede demand from the retail sector, at moderate levels, as household indebtedness, the prospect of further interest rate increases and employment challenges persist.
Most banks are cautiously optimistic about their prospects in the short to medium term. Investing for growth, while focusing on operating costs, remains a common theme among the strategies of the major banks. With all of the banks commenting on their expectation of steady growth in markets beyond South Africa, important challenges – including infrastructure constraints and lower commodity prices impacting African growth rates – remain.
As each of the banks seeks to realise strong growth across the continent, our view is that optimal utilisation of all elements of capital and effective execution across areas of specific focus, will be key differentiators.

Major banks analysis – March 2014 3
Combined results for six-month periods (Rm)
2H13 1H13 2H12 1H122H13 vs
1H132H13 vs
2H12
Net interest income 64 277 59 374 54 285 50 309 8.3% 18.4%
Non-interest revenue 57 995 53 936 52 833 49 460 7.5% 9.8%
Total operating income 122 272 113 310 107 118 99 769 7.9% 14.1%
Total operating expenses -71 985 -63 738 -61 766 -57 402 12.9% 16.5%
Core earnings 50 287 49 572 45 352 42 367 1.4% 10.9%
Impairment charge -11 985 -15 413 -14 140 -14 177 -22.2% -15.2%
Other income/(expenses) 650 1 209 -642 1 312 -46.2% -100.0%
Discontinued operations - - 2 004 431 - -100.0%
Income tax expenses -11 415 -8 151 -7 817 -7 412 40.0% 46.0%
Profit for the period 27 537 27 217 24 757 22 521 1.2% 11.2%
Attributable earnings 27 784 24 268 23 161 21 276 14.5% 20.0%
Headline earnings from continuing operations 27 642 24 612 22 210 21 282 12.3% 24.5%
Return on equity 17.5% 16.2% 15.9% 15.6% 8.2% 9.9%
Figure 1.1 Combined income statement of the major banks
Source: PwC analysis
Figure 1.2 Key drivers of combined profit and loss (Rm)
Source: PwC analysis
NII
Rm ROE
NIR Opex Impairment Other Tax ROE
-150 000
-10 0000
-50 000
0
50 000
100 000
15 0000
0%
2%
4%
6%
8%
10%
12%
14%
16%
18%
1H12 2H12 1H13 2H13
NII
NIR
Op
ex
Imp
airm
ent
Oth
er
Tax
2H012
Rm
Income Expenses 2H013
0
5 000
10 000
15 000
20 000
25 000
30 000
35 000
40 000
45 000

Major banks analysis – March 2014 4
2 Economic outlookBy Dr Roelof Botha, economic advisor to PwC
Economic output in the fourth quarter of 2013 rebounded quite sharply to 3.8% from the paltry growth rate of less than 1% recorded in the previous quarter (quarter-on-quarter, annualised).
As a result, positive real GDP growth was recorded for the fourth year in succession, although the rate of 1.9% for the full year was the lowest since the end of the recession and well below South Africa’s output growth potential.
Scrutiny of the sector-specific contributions to output growth in the second half of 2013 clearly reveals the damage that can be done to the economy when a key manufacturing sector is suffering from labour unrest.
Although the repeated strikes in the mining sector also have a significant negative impact on GDP growth trends, manufacturing sectors usually possess more diversified supply chains, which serve to exacerbate the overall negative effect of work stoppages.
During the third quarter of 2013, a two-week labour strike in the vehicle manufacturing industry was followed by an even lengthier strike in the sector that manufactures motor vehicle components.
Combined, these work stoppages were the main culprits behind a decline, in real terms, of almost 7% in manufacturing output in the third quarter of 2013, which almost put paid to the country’s uninterrupted positive quarterly GDP growth cycle (commencing in the third quarter of 2009).
In an effort to catch up on pent-up domestic and export demand for vehicles, several factories resorted to additional shifts and other forms of overtime work, leading to an impressive manufacturing output growth figure of more than 12% in the final quarter.
Figure 2.1 High level of volatility in quarterly output growth by two of the three sector groups
Source: Stats SA
It is abundantly clear from the trends depicted by Figure 2.1 that the South African economy has become prone to a very high degree of volatility regarding two of the three groups of key economic sectors.
Fortunately, the tertiary sectors, which include the single largest economic sector, namely finance, real estate & business services, have followed a stable, albeit diminishing growth path over the past three years. Tertiary sectors account for 70% of total output.
Primary
2011 2012 2013
Secondary Tertiary
-15%
-10%
-5%
0%
5%
10%
15%
20%
Q4Q3Q2Q1Q4Q3Q2Q1Q4Q3Q2Q1
It seems fairly obvious from the trends shown in Figure 2.2 that sluggish growth in mortgage advances since the recession, combined with a steep decline last year in other loans and advances (by all financial institutions), have contributed to the gradual declining trend for tertiary sector output. In fact, expressed in real terms, mortgage advances have now languished in negative territory for six consecutive years.
Figure 2.2 Slowdown in growth for largest two sources of credit extension in 2013
Source: Stats SA
Although total household debt as a percentage of household disposable income has declined consistently since the recession, labour market volatility in several key mining and manufacturing sectors has placed pressure on the finances of employees that forfeit wages during strikes and those that are ultimately retrenched as a result of cancelled orders.
It is no surprise, therefore, that the National Development Plan explicitly singles out South Africa’s unstable labour environment as an issue that requires redress via appropriate policy intervention. Many commentators are hopeful that Government will implement reforms after the May elections to ease the regulatory burden being faced by employers.
February was an intriguing month for economic analysts, as it witnessed the abrupt end of the accommodating trend in the SA Reserve Bank’s monetary policy stance. At its very first meeting of the year, the Monetary Policy Committee of the Reserve Bank raised the official repurchase (repo) rate by 50 basis points – a step that caught many financial analysts and economists by surprise.
A modest shift in fund manager interest towards US bonds and equities (due to higher returns) has placed pressure on the currencies of a number of key emerging markets, including South Africa, leading to inflationary fears and, in some cases, less accommodating monetary policy.
During the tabling of the national budget, also in February, the Minister of Finance indirectly alluded to the possibility of the repo rate remaining at its current level, well into the future, as National Treasury does not foresee consumer inflation breaching the upper limit of the Reserve Bank’s inflation target range (of 6%) by more than 20 basis points.
Other loans
2010 2011 2012 2013
Mortgages
0%
2%
4%
6%
8%
10%
12%
14%
16%
18%
Major banks analysis – March 2014 5
Figure 3.1 Net interest margin and advances
Source: PwC analysis
0100 000
200 000300 000
400 000500 000
600 000
700 000
800 000
900 0001 000 000
2H
13
1H
13
2H
12
1H
12
2H
13
1H
13
2H
12
1H
12
2H
13
1H
13
2H
12
1H
12
2H
13
1H
13
2H
12
1H
12 0%
1%
2%
3%
4%
5%
6%
Gross loans and advances
BAGL
Rm
FSR NED SBK
Net interest margin (% of average interest earning assets)
3. Net interest incomeNet interest margin (Rm)
Combined
2H13 1H13 2H12 1H12
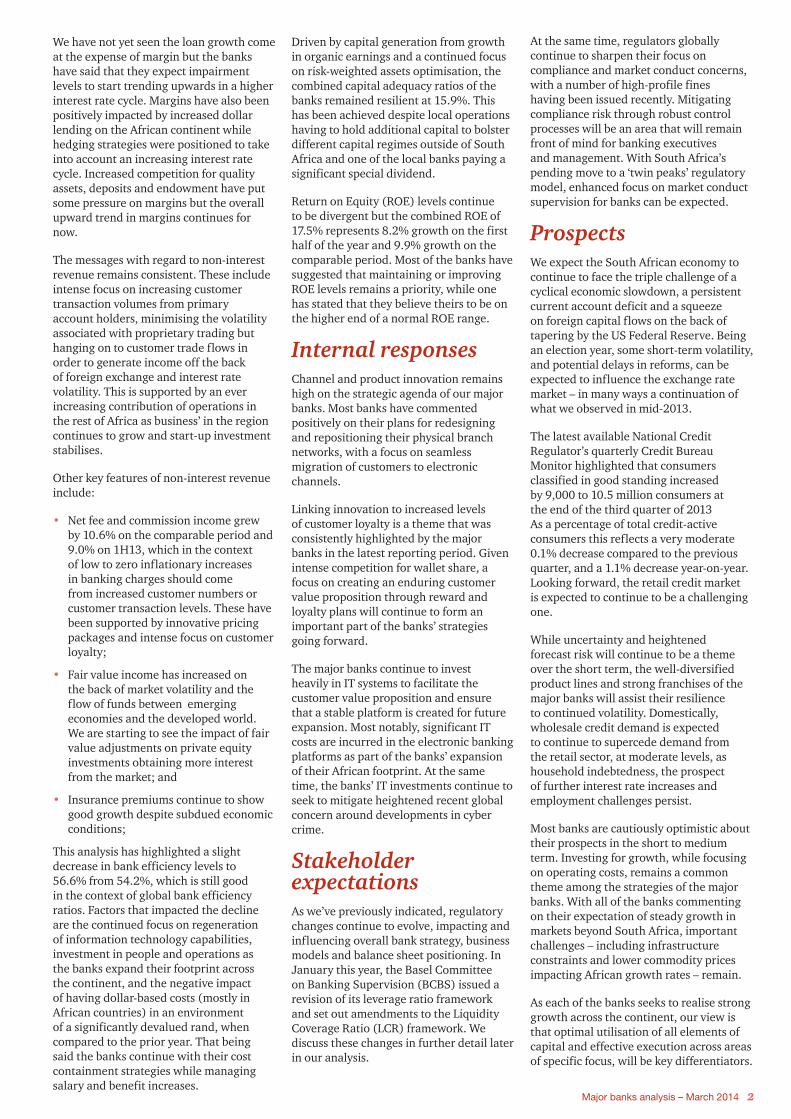
Gross loans and advances 2 859 262 2 795 257 2 589 032 2 471 663
Net interest margin (% of average interest earning assets)
4.37% 4.30% 4.25% 4.12%
Credit growthIndustry credit growth in loans was 2.9% for 1H13 and 3.2% in 2H13. For the major banks we saw credit extension in the form of loans and advances increase 4.3% on 1H13 and 12.1% on 2H12.
Lending by the major banks remains tightly focused with some banks declaring they are prepared to lose market share in certain asset classes to ensure that loans are of an appropriate quality and margin. Growth in the higher yielding asset classes continues but at a slower pace than in the past, with a larger growth contribution from corporate and wholesale advances portfolios.
Some of this growth most certainly comes from the renewable energy programmes as well as the good traction obtained by the banks on the African continent, where large infrastructure and mining-related deals are written in US dollars. Given the dollar nature of these loans, some of the growth seen would naturally arise from exchange rate differences, which would indicate that growth in a stable currency environment would be less than reported.
While mortgage loans continue to be significant in size, new growth in these portfolios continues to be at historically low levels. The increasing interest rate cycle will not aid growth in this area.
Customer deposits Deposits grew only 2.8% in the second half, but full-year growth of 9.9% is commendable given the pressures consumers continue to face.
The banks are reporting that the growth in deposits has been from increased corporate and retail deposits, which have longer tenor expectations than wholesale and institutional deposits.
This is supported by industry data, which reflects that growth in the deposits for the year has come in the form of corporate, wholesale and retail deposits at the expense of government, municipalities and interbank deposits. This trend highlights the importance of maintaining strong corporate transactional banking franchises as these businesses often serve as a key platform for cross-selling opportunities and deposit market share.
Hedge portfoliosHedge portfolios are designed to limit the impact of interest rate volatility and the size of these depends on the timing of the hedges, positioning against the interest rate cycle and also the size of the risk hedged.
The interest rate volatility seen in the second half of the year manifested itself in the increase of the negative impact of endowment on margins and the varied impact of hedging on margins for the banks that disclose this information.
Net interest marginWhilst the drivers of interest margin remain the same, we have seen continued improvements from asset mix initiatives and less improvement from better pricing. This is a trend we expected in our previous report as the cycle of higher interest rates is established and the credit impairment cycle begins to turn. This downward trend is however expected to be partially offset by the increased margin generally observed on advances made in the rest of Africa.
Figure 3.2 Combined net interest margin
Source: PwC analysis
3.703.753.803.853.903.954.004.054.104.154.204.254.304.354.404.454.50
2H13 1H13 2H12 1H122H111H112H101H10
Net interest margin (% of average interest earning assets)
%
Loans and advances growth continues but at focused and measured pace.
Asset mix continues to benefit NII but the positive impact of pricing appears to have ended.
Increased interest rates and a potential change in the credit impairment cycle will put pressure on bank margins.

Major banks analysis – March 2014 6
4 Non-interest revenue
NIR is primarily driven by fee and commission income, which represents 71% of the total for 2H13.
This is in line with the relative contribution to total combined income of 70% in 1H13.
The major banks continue to focus on client flows and minimising the volatility associated with proprietary trading, given the more onerous Basel III capital rules. While volatility persists, customer flows should remain robust, but the positioning of portfolios can be a significant challenge when market direction is difficult to predict.
We have also observed a strong trading performance from the banks’ trading operations in the rest of Africa, given the strong economic growth being experienced in many African countries. While the relative contribution of these operations to the banks’ bottom line currently remains at moderate levels, it is expected to increase substantially as the banks continue to focus on, and increase the pace of execution of, their African ambitions.
Trading income increased moderately in 2H13 despite difficult trading conditions and continuing global economic uncertainty.
Net fee and commission incomeNet fee and commission income grew by 9.0% on 1H13 and 10.6% compared to 2H12. This should be seen in the context of low to zero inflationary increases on bank charges as the banks focus on the expansion of their customer base. The increase in net fee and commission income is also remarkable given the lower income-generating effect of innovative pricing packages introduced by banks and the considerable base established in prior periods. Of significant interest is the continuation of the trend of an increase in electronic banking fees as clients migrate to new lower-cost, higher-volume distribution channels.
Banks also continue to compete fiercely to increase their customer bases through innovative loyalty packages. These offer customers the flexibility to tailor a banking fee package to meet individual requirements in a cost-effective manner. While this strategy has the effect of reducing overall fee income in absolute terms, there has been an increase in
customer numbers as the banking net has been widened and the major banks compete more fiercely in the lower-income market.
We continue to observe that the ability to translate innovative product offerings into increased customer numbers remains a key differentiating factor between the relative growth of the fee and commission income lines for the various banks. We have also noted further aggressive marketing of loyalty programmes as banks compete fiercely to widen the banking net and seek to create new cross-sell opportunities. Interesting recent additions to the loyalty programmes are reward programmes linked to fuel purchases.
Fair value incomeFair value income continued on the volatile trend established in previous reporting periods and was 8.1% up on 1H13 and 18.1% up on 2H12. Concerns about a fiscal disruption in the US and volatile currency and commodities markets negatively impacted trading conditions. Customer flow business has remained at relatively high levels and contributed to the increase in fair value income, although we have observed increased margin compression in this area. However, continuing to position trading books in an environment in which market direction is lacking remains a significant challenge.
Consistent with international trends and our previous observations, banks have faced considerable challenges in growing non-interest revenue contributions from their global markets businesses.
We have also observed a continuation in the trend of strong positive trading results from the banks’ rest of Africa trading operations, given the strong economic growth being experienced in many countries on the continent. These results, although currently a relatively small percentage of total trading operations, were also boosted further by the weakening rand.
Insurance and bancassurance incomeInsurance and bancassurance income was up 4.2% on 1H13, which is commendable given the overall subdued state of the South African economy. This increase is due largely to continuing strong premium growth through the launch of innovative product offerings and relatively volatile equity markets. These favourable results were offset by somewhat high weather-related claim levels in 2H13. Some banks have also commented that bancassurance income has been impacted by the volume-related slowdown in retail unsecured lending.
Figure 4.1 Non-interest revenue
Source: PwC analysis
0
10 000
20 000
30 000
40 000
50 000
60 000
70 000
2H131H132H121H12
Net fee and commission income Fair value income
Other income
Rm
Insurance & bancassurance income
Major banks analysis – March 2014 7
5. Efficiency
Figure 5.1 Operating expenditure
Source: PwC analysis
0
10 000
20 000
30 000
40 000
50 000
60 000
70 000
80 000
2H131H132H121H120%
10%
20%
30%
40%
50%
60%
70%
80%
90%
100%
Total staff costs
Depreciation, amortisation and impairments
Information technology
Other
Cost/income (efficiency) ratio NIR/cost ratio
Rm
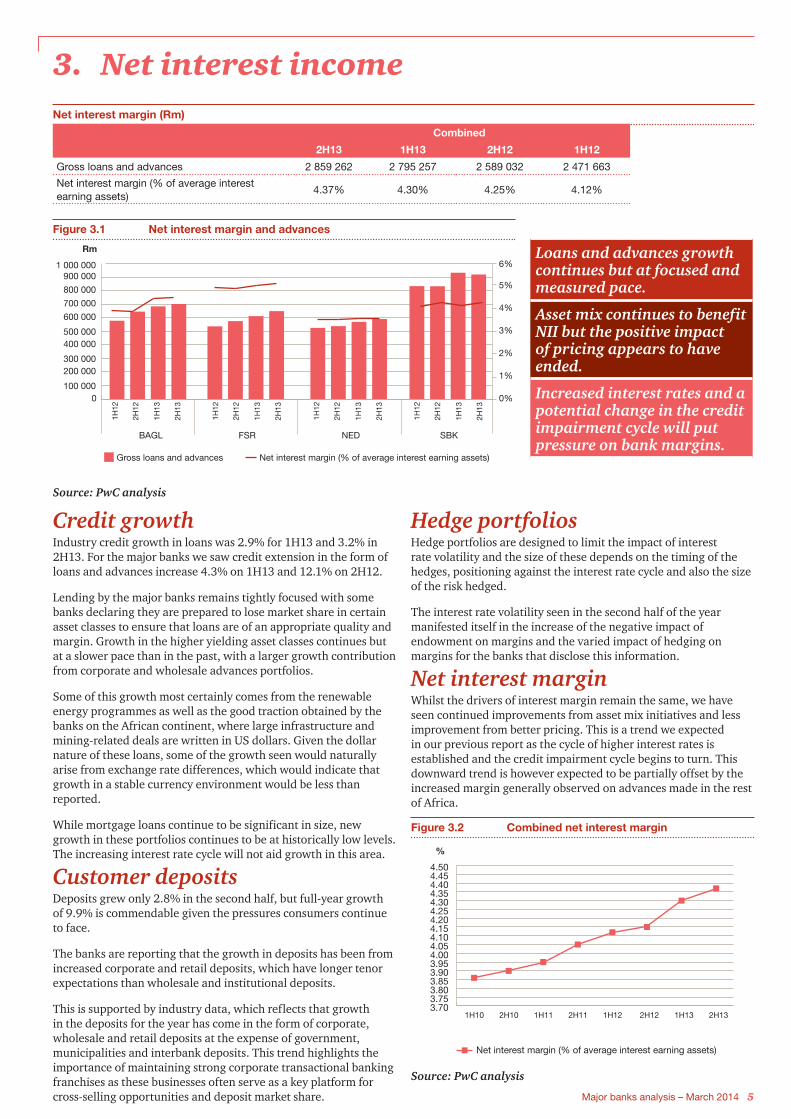
Cost containment strategies, which have been in place for a number of years, continue to be rigorously enforced as revenue growth remains subdued. It is becoming increasingly difficult for banks to minimise their cost base while operating in a higher inflationary environment. This is compounded by the increased costs of building out a footprint in the rest of Africa and ongoing investment required to enhance IT platforms significantly.
Compared to 1H13, banks’ operating expenses increased by 12.9%, while total operating income increased by 7.9%. Consequently, their combined cost-to-income ratio deteriorated to 56.6 % in 2H13 (1H13: 54.2%).
Cost containment strategies, which have been in place for a number of years, continue to be rigorously enforced as revenue growth remains subdued.
Salaries continue to represent roughly half of the total expense bill and grew at above inflation rates, which is also reflective of the increased variable cost element associated with the favourable results.
associated with the banks’ improved operating performances. Tight headcount management remains a top priority for management teams, although this continues to be balanced with the need for ongoing investment in human resources and key talent in the rest of Africa. We have also observed an increase in the banks’ marketing spend as efforts to attract and maintain retail customers – considered absolute gold in the context of regulatory changes and forthcoming prudential liquidity requirements – becomes increasingly competitive.
Successfully executing on these cost containment strategies will become increasingly difficult as discretionary costs have already been an area of focus for a number of years, with a shift to more strategic initiatives being observed. Going forward, we would expect banks to face increased challenges in their variable cost bases as legal processes and collection costs start to rise with the turn of the interest rate cycle.
Increased salary costs reflect annual salary increases as well as increased short and long-term incentive awards
The weaker rand continues to be a drag on the expense base.
IT spend also continues to be on the rise year-on-year as banks continue their efforts to implement new systems to cater to increased regulatory requirements and heightened customer expectations of seamless transactional banking and treasury solutions.
Operating expenses were unfavourably impacted by the weak rand during the period, which continued to be a drag on the expense base. The average ZAR/USD rate weakened from R8.48 in 1H13 to R10.06 in 2H13 and negatively impacted the earnings of those banks with significant operations outside of South Africa.
Looking ahead, it will be interesting to observe the impact of any further weakening in the rand post December 2013 on the cost-to-income ratios of the banks in future periods.

Major banks analysis – March 2014 8
6. Asset qualityAsset quality (Rm)
Combined
2H13 1H13 2H12 1H12
Gross loans and advances 2 859 262 2 795 257 2 589 032 2 471 663
Non-performing loans 92 714 99 331 101 583 106 139
Impairments -59 764 -58 277 -56 164 -52 024
Portfolio provisions -19 418 -17 690 -16 768 -15 819
Specific provisions -40 346 -40 587 -39 395 -36 205
Source: PwC analysis
Gross loans and advancesGrowth in total gross loans and advances slowed to 4.3% for the six months to December 2013 (compared to 7.5% growth reported for the comparative period in 1H13).
The slowing levels of growth in combined gross credit extension of the major banks reflect, in part, a continuation of subdued economic sentiment, persistent increases in administered prices further pressuring indebted households and recent labour unrest in various industries. This uncertain economic context resulted in the exercise of caution on the part of both lenders and borrowers.
Corporate lendingIn contrast, and despite a challenging operating environment, resilient corporate credit appetite was seen in the second half of 2013. Loans and advances to corporates partly related to the awarding of a new round of renewable energy contracts, which most of the major banks have participated in, as well as increasing working capital needs and brisk demand for trade finance loans.
The impact of corporate lending was seen in the other demand loans category reporting the highest growth rate in the six months to December 2013, maintaining a double-digit growth rate of 10.4% (although at a slightly lower growth rate when compared to 14.1% reported at 1H13).
Looking ahead, a generally positive outlook for corporate lending remains, with some of the major banks commenting on their expectations of strong drawdowns in their deal pipelines to continue over 2014 as a result of forecast activity in development sectors expected in the rest of Africa.
Retail mortgagesThe downward trend in mortgage lending growth continued over the current reporting period at 0.4% for the six months to December 2013 (compared to 1.0% growth for the comparative period to June 2013). This trend reflects reduced consumer demand to enter into long-term sources of credit given the upward trending interest rate cycle and still fragile household economic fundamentals.
As we have previously noted, low bank margins on mortgage loans, competitor
activity in this segment and an unpredictable residential property market present little positive outlook for an upside in bank mortgage lending in the short term.
Card debtors and other unsecured lendingIndustry focus on South African banks’ potential overexposure to unsecured lending appears to have reduced somewhat, with all of the banks commenting that their combined total exposure to unsecured lending portfolios as a proportion of total credit extension remains within risk appetite levels a recurring theme that we have reported in previous analyses.
At the same time, continued focus on product mix within lending categories of the major banks and pricing and provisioning strategies reinforce the banks’ view that they are appropriately pricing and providing for the risk they have taken on in their unsecured lending portfolios.
Combined growth in the other loans and advances category, which includes
Figure 6.1 Combined loans and advances by product
Source: PwC analysis
Retail
Central and other
Corporate and investment banking
66.0%
35.5%
-1.5%
Figure 6.2 Retail advances per product
Source: PwC analysis
0
500 000
1 000 000
1 500 000
2 000 000
2 500 000
3 000 000
3 500 000
4 000 000
2H13 1H13 2H12 1H12
Retail
Instalment sale and finance leases
Mortgage loans
Card debtors
Overdrafts and other demand loans
Other loans and advances
Term loans and revolving credit accounts
Rm

Major banks analysis – March 2014 9
unsecured lending, slowed to 7.4% for the six months to December 2013 (compared to 15.2% for the corresponding period to June 2013), reflecting active steps to reduce exposure to unsecured lending portfolios.
Non-performing loansThe improving trend of non-performing loans (NPLs) consistently observed in our previous analyses has continued with increased pace throughout the current reporting period. Combined total NPLs declined 6.7% for the six months to December 2013 (compared with a decline of 2.2% at 1H13). On a year-on-year basis, total NPLs declined 8.7% (compared with a 7.0% decline in the comparative 12 months to December 2012).
This trend highlights the banks’ efforts to focus on the quality of lending portfolios, while taking a more considered approach to lending activities that pose greater potential default risk, including unsecured lending. At the same time, active credit management steps and enhanced focus on recovery efforts paid dividends through declining total combined NPLs of the major banks.
Stable improvement in the domestic residential property market continued during 2013 with both mortgage NPLs and credit losses continuing to decline. Combined mortgage NPLs declined 13.9% in the six months to December 2013 (compared to a 7.2% decline in the comparative six months to June 2013) and comprised 44.2% of the major banks total NPL portfolio at 2H13 (compared to 47.9% at 1H13). These trends clearly reflect the more focused recovery and legal process efforts being applied by the major banks.
The high growth in card debtors seen in previous periods resulted in card NPLs deteriorating to 24.2% at 2H13 (compared to 22.6% at 1H13), reflecting signs of highly indebted retail consumer stress. The proportion of card NPLs to the major banks total NPL portfolio, however, remains limited at 5.9% at 2H13 (compared to 4.5% at 1H13).
Most of the banks have commented on their concern that recent inflationary pressures within the South African economy combined with an upward trending interest rate cycle could push customers, particularly in interest-sensitive lending instalment sale and card categories, who are already on the margin, towards further credit stress.
Coverage ratiosThe major banks’ specific impairment coverage ratios (specific impairment
divided by NPLs) increased to 66.0% over the six months to 2H13 (compared to 60.3% at 1H13).
Consistent with the theme reported previously, this increase in specific impairment coverage ratios continues to derive from retail portfolios, specifically within the mortgage lending and instalment finance categories as both of these portfolios remain particularly sensitive to the interest rate environment.
Going forward, these portfolios are expected to be credit managed with greater focus as the forecast interest rate cycle shows signs of trending upwards, while households come under increased strain through inflationary increases manifesting in rising administered prices.
Income statement impairment chargesThe combined credit loss ratio (income statement impairment charge divided by average advances) of the major banks improved by 31 basis points to 0.9% for 2H13 (compared to a flat 1.2% for both at 1H13 and 2H12). The strengthening of the credit loss ratio reflects the banks focusing
explicitly on the quality of lending given the backdrop of the rising interest rate cycle and continued consumer stress.
The theme we previously observed of variability in credit loss ratios between the major banks showing contraction continued in the latest reporting period, with all of the banks reporting total credit loss ratios in the 0.8-1.1% range. However, some divergence within credit loss ratios in specific portfolios is noted as expected, reflecting each of the banks’ individual areas of focus and lending strategies.
As we noted in our half-year analysis issued in September 2013, the unprecedented default of First Strut (Pty) Ltd’s listed corporate bond in the first half of 2013 represented a notable credit event within the South African bond market. The major banks’ have commented in their latest reporting that their exposure in the form of general banking and other credit facilities to this default is adequately provided for.
Looking ahead, some commentators have noted that regulatory change in the bond market to respond to the default may be pending and would be welcomed by some to stabilise this important financing alternative.
Figure 6.3 Non-performing loans and level of specific impairment
Source: PwC analysis
Figure 6.4 Specific and portfolio impairment levels
Source: PwC analysis
05 000
10 000
15 000
20 000
25 000
30 000
35 000
40 000
45 000
50 000
2H13
2H13
2H13
2H13
1H13
1H13
1H13
1H13
2H12
2H12
2H12
2H12
1H12
1H12
1H12
1H12
2H11
2H11
2H11
2H11
0%
5%10%
15%
20%
25%
30%
35%
40%
45%
50%
NPLs
BAGL FSR NED SBK
Specific impairment of NPLs
Rm
0.0%
0.5%
1.0%
1.5%
2.0%
2.5%
3.0%
2H13
1H13
2H12
1H12
2H11
2H13
1H13
2H12
1H12
2H11
2H13
1H13
2H12
1H12
2H11
2H13
1H13
2H12
1H12
2H11
Specific impairment %
BAGL FSR NED SBK
Portfolio impairment %

Major banks analysis – March 2014 10
7. Capital and funding
Capital and funding (Rm)
Combined
2H13 1H13 2H12 1H12
Common Equity Tier 1 285 841 204 937 195 814 N/A
Total Tier 1 307 044 282 020 255 748 246 840
Tier 2 55 594 54 103 55 192 46 764
Total qualifying capital and reserve funds 362 638 336 123 310 940 293 604
Risk-weighted assets 2 330 473 2 196 525 2 077 770 2 057 601
Deposits 2 986 913 2 906 221 2 716 905 2 543 405
Source: PwC analysis
The upward trend of total qualifying capital and reserve funds of the major banks slowed moderately at end of 2H13, increasing by 7.9% (in contrast to growth of 8.1% for 1H13).
With the major banks having been through a full year of the new Basel III capital requirements, the combined total capital adequacy ratio remained relatively flat at 15.9% for 2H13, compared to 15.8% at 1H13.
The implementation of Basel III which took effect from 1 January 2013 represents a major regulatory change. With it, regulatory reform continues to rank high on the banks’ strategic agendas, and remains a core influence on balance sheet positioning and business models.
The evolution of regulatory change within the global banking landscape has continued throughout 2013, with the most recent amendments by the Basel Committee on Banking Supervision (BCBS) affecting the leverage and liquidity ratios. We analyse these changes in the section below.
Driven by capital generation from growth in organic earnings and a continued focus on risk-weighted assets optimisation, the combined capital adequacy ratio of the major banks remained resilient for the period to December 2013 at 15.9% (compared to 15.8% at 1H13 and 15.5% at 2H12). Interestingly, the translation effect of a weaker currency rate on capital invested in entities outside of the South African border assisted in bolstering the capital base of the banks, to varying degrees.
This trend confirms our previous view that the experience of traditionally strong capital positions in the South African banking industry placed our banks on a strong footing to make the transition to Basel IIIwithoutmaterialdeteriorationin regulatory capital levels. This trend is a credit to the prudent capital management practices of our banks and an enviable regulatory capital regime adopted by the South African Reserve Bank in years past.
Going forward, the banks’ capital buffers will face pressure as minimum regulatory capital requirements trend upward over theBasel IIIimplementationtimeline,while certain existing capital instruments are phased out.
Mindful of this, all of the banks have commented on firmly maintaining their focus on continually optimising the capital mix within target ranges, while building up reserves to remain agile to respond to growth opportunities.
Managing this twin focus of effective capital management on the one hand, while being in a position to tap into strategic opportunity on the other, will present a formidable challenge to the banking industry, compounded by a challenging economic and operating environment.
Growth in combined risk-weighted assets of 6.1% at the end of 2H13 (compared with 5.7% for 1H13) outpaced growth in the total asset base of 0.9% (compared with 6.7% growth at 1H13, reflecting the moreonerousRWAdemandsofBasel III1coming through).
On a positive note, inclusions of certain reserve funds2 and the less punitive treatment of ‘capital held in insurance entities’ have offset some of the higher capitalchargesbroughtaboutbyBasel IIIfor some of the banks.
1 A key driver of the combined RWA increase for 2H13 arises from the increase in the general risk capital requirement as a result of a higher capital multiplier for banks’ exposure to market risk.
2 Foreign currency translation reserves (FCTR), available for sale reserves (AFS), share-based payments reserves and property revaluation reserves, previously disallowed for regulatory capital purposes under Basel II.5, are eligible for inclusion as Core Equity Tier 1 capital under Basel III.

Major banks analysis – March 2014 11
Looking ahead, a strong heritage of capital management and strength in the earnings’ capability of our banks’ core franchises will result in a positive capital adequacy ratio outlook for the major banks. At the same time, the core measure of capital strength under Basel III–theCommonEquityTier1ratio–forthemajorbanksremainsrobustat12.7%at 2H13 (12.5% at 1H13).
Figure 7.1 Regulatory capital ratios and ROEs
Source: PwC analysis
The importance of retail depositsRetail deposits continue to be a critical source of funding for the major banks. The significant change in the regulatory environment from a liquidity perspective, implemented through the Net Stable Funding Ratio to be introduced as a prudential requirement from 1 January 2018, highlights the importance of long-term, stable funding that typically would arise from retail sources.
Half-year growth in total deposits for the major banks slowed to 2.8% at 2H13 (compared to 7.0% growth noted at 1H13). However, growth in total deposits at 9.9% is reported compared against 2H12, reflecting the structural challenges in funding growth over 2H13.
Despite the low interest rate environment and volatile money market that characterised 2013, growth in wholesale deposits continued to outpace much sought-after retail funded sources with corporate and investment banking segments of the major banks having been the main beneficiary of deposit growth.
At the same time, and consistent with industry data, we now see corporate and retail deposits comprising a larger share of the banks’ total deposits as they reduce reliance on foreign currency, government and interbank funding.
The combined loan-to-deposit ratio of the major banks decreased to 95.6% at 2H13 (96.2% for 1H13), highlighting an ongoing and competitive search for retail funding by all of the major banks.
0%
5%
10%
15%
20%
25%
2H
13
1H
13
2H
12
1H
12
2H
13
1H
13
2H
12
1H
12
2H
13
1H
13
2H
12
1H
12
2H
13
1H
13
2H
12
1H
12
Total Tier 1 capital
BAGL FSR NED SBK
ROE
Total Tier 2 capital
Regulatory minimum
CompliancewiththeBasel IIIliquidityratios – the Liquidity Coverage Ratio and the Net Stable Funding ratio, which become prudential requirements from 1 January 2015 and 2018 respectively – weighs heavy on the funding strategy of all of the major banks. In particular, focus on strengthening retail franchises through innovative product placement and pricing continues to characterise the highly competitive retail banking environment in South Africa, which is expected to continue over future reporting periods. At the same time, the need to focus on enhancing the risk profile of the more volatile wholesale and institutional categories of funding will similarly impact the banks’ funding strategies in the short to medium term.
Earlier this year, the BCBS announced anticipated proposals to revise the Net Stable Funding Ratio that was originally included in the Basel III package of regulatory reforms in December 2010 (refer below). We have previously commented on the differentiating structural features of the South African economy compared to advanced economies, which include a lower discretionary retail savings rate. This context resulted in the BCBS’ proposals to revise the NSFR being welcomed by all of the major banks, with comments of further expected revisions by banking regulators to cater for the liquidity constraints of emerging economies.

Major banks analysis – March 2014 12
Basel Committee brushes up leverage and liquidity rules
Making sense of rapidly changing industry developments On 12 January 2014, the Basel Committee published a revision of its leverage ratio framework, the non-risk based ‘backstop’ to risk-based capital requirements.
On liquidity, it is consulting on a finalised version of the Net Stable Funding Ratio (NSFR), with a deadline of 11 April 2014. The Committee also amended the Liquidity Coverage Ratio (LCR) framework to include central bank facilities, published guidance on the use of market-based indicators of liquidity and fleshed out disclosure requirements for the LCR.
Finalising the leverage ratioBanks will report higher leverage ratios under the revised calculation than they would have under the calculation proposed in June 2013. The Committee reined back somewhat from the principles of grossing up exposures to capture all possible sources of leverage and achieving international consistency. They adopted a more pragmatic approach for certain exposure types and allowed for some recognition of netting in the ‘exposure measure’ – the denominator of the leverage ratio.
Changes from the June 2013 proposal• Securitiesfinancingtransactions – Netting of cash
payables against cash receivables arising from multiple trades with a single counterparty is permitted under certain conditions.
• Off-balancesheetitems – Reduced recognition of these items through the application of risk-based credit conversion factors, consistent with the standardised approach to credit risk, subject to a floor of 10%.
• Cashvariationmargin – May be viewed as a pre-settlement payment and therefore offset against gross derivative exposures.
• Centralclearing– Trade exposures to a qualifying central counterparty (QCCP) arising from client derivative transactions may be excluded absent any obligation to reimburse the client in the event of default of the QCCP.
• Writtencreditderivatives – Exposures will be capped at maximum potential loss and increased flexibility has been given for hedging via purchased credit derivatives.
Next steps on leverage ratio The revised calculation reduces near-term uncertainty but does not represent the end of the leverage ratio story, which is shown below.
Leverage ratio timeline
2015 – Banks will have to publicly disclose their
leverage ratios
2018 – Banks will have to meet a legally binding
minimum leverage ratio requirement, currently
expected to be calibratedat 3%
2017 – Regulators will complete the final
calibration of the leverage ratio, following a
monitoring period

Major banks analysis – March 2014 13
Finalising the liquidity ratiosNSFRThe NSFR, as revised by the Basel Committee, keeps the same framework and logic, which is to promote stable funding. It assigns required stable funding and available stable funding factors to assets and liabilities. The main changes in the latest version are:
• Reducing the impact on retail activities by increasing the stable funding factors for both stable and less-stable retail funding and decreasing stable funding requirements for retail and SME loans
• Recognising operational deposits, with a 50% Available Stable Funding factor
• Providing more granularity of treatment for funding with residual maturities of less than one year, and assets with residual maturities of less than one year
• Aligning the treatment of assets with the LCR High-Quality Liquid Assets (HQLA) definitions
LCRThe Committee agreed to relax its framework on including central bank facilities in HQLA. Prior to this relaxation, only jurisdictions with insufficient HQLA to meet the needs of their local banking system could include them. The amendment means that (subject to national discretion) all jurisdictions may include central bank facilities in HQLA, under certain conditions: high commitment fee, support by unencumbered collateral, irrevocability and specific disclosure requirements.
The Basel Committee introduced disclosure requirements for the LCR which, if implemented by national authorities, will be effective from the first reporting date after 1 January 2015. It should apply to all internationally active banks on a consolidated basis, with the same frequency as publication of financial statements. Banks should disclose simple averages of daily observations over the previous quarter, and information about the main drivers of the number, composition of HQLA, etc.
The standards provide a common disclosure template. They also provide other quantitative and qualitative information for banks to consider as potential additional disclosure. The Committee will determine NSFR disclosure requirements after finalisation of the standard.
How this will affect banksLeverage ratioThe outcome on leverage ratios was widely reported as a significant victory for the industry, but the real impact of these revisions will depend on the extent to which these relaxations are relevant to existing, or potentially achievable, transaction structures.
Multiple single counterparty trades are infrequently used in securities financing markets, for example. Whatever the net result, banks will still need to address the significant challenge of operating in a world of multiple prudential regulatory constraints from leverage, risk-based capital and liquidity requirements.
NSFR The new framework is more favourable to retail banks than the previous version was. But it is too early to assess precisely the impact on South African banks because the NSFR framework is pending final adoption by the Basel Committee before transposition into local regulation.
Banks with significant retail portfolios should show a better ratio, as the weighting provided to deposit funding from retail customers has increased. This increases the contribution to stable funding, while the weighting relating to the demand for stable funding (e.g. on advances) by retail customers has decreased.
South African banks should benefit given a generally large concentration of liabilities with six-month to one-year maturities, which previously did not receive recognition in the NSFR calculation, but now would receive a 50% weighting factor.
Given these changes, we would expect an improvement in the NSFR ratios of South African banks, even though the minimum requirement of 100% may not yet be achieved.
LCR The LCR relaxation around central bank facilities will only have an impact if implemented at national level. We would expect most regulators to implement the new LCR disclosure requirements. Although some global banks already disclose LCR numbers, they do not currently provide much information on how they compute their ratios and what their drivers or main areas of risk are.
It might also be a source of concern in terms of reputational risk because there is no time lag in disclosure. Delayed disclosure (for instance a six-month time lag) would give banks time to consider possible remediation actions. But a bank disclosing a sharp decline in its LCR over the last quarter might potentially trigger a loss of confidence by market investors, worsening its situation. The bank’s supervisory team will therefore need to manage the disclosure requirements carefully, especially during stress periods.

Major banks analysis – March 2014 14
How banks carry out stress tests is becoming critical, simply because of their power to set capital buffer levels, determine management actions and restrict distributions such as dividends and employee bonuses. Banks are expected to model more scenarios, across more portfolios, with more speed, accuracy and strategic buy-in than ever before. Given its strategic significance, stress testing sits squarely on the agenda of CEOs.
A PwC global survey of 24 largely non-US banks provides a perspective on banks’ current stress testing practices. The survey included banks from 12 countries across five continents, including three major South African banks.
When we look at responses to the survey across four key areas governance and engagement; operating model; process; and results and impact – most banks feel their approach works for now, with the majority of responses falling into the ‘Basic’ or ‘Sustainable’ categories.
8. Passing the stress testStress testing is moving to the forefront of an ongoing global debate about how banks restore trust and improve their financial health. This process is rapidly emerging as one of the most powerful tools for determining bank capital levels. At the same time, it provides banking regulators with unique insights into the resilience of the banking industry by applying a macro-prudential dimension to supervision. Stress testing also gives banks the ability to spot emerging risks, uncover weak spots and take preventive action.
Survey results heat map
Source: PwC Survey 2013
4 PwC Stress testing report
Excelling at the stress test We place stress testing approaches into four categories: At Risk (inefficient and unstable), Basic (manual processes and controls), Sustainable (reliable and controlled) and Target (high performing business enabler).
When we look at the responses to the survey across the four key areas - governance and engagement; operating model; process; and results and impact – a picture emerges of banks setting the bar low. Most banks feel their approach works for now, with the majority of responses falling into the Basic or Sustainable categories. But we believe that banks need to strive for a high performing approach in their stress tests if they want to be ready for the regulatory demands that are coming.
Methodology The survey was conducted online during November 2013 and includes banks from 12 different countries across 5 continents. We appreciate and value the time of all those respondents who contributed.
Survey results heatmap
Participant summary
Total number of participants 24
Average asset size £500bn
Total participant assets £12tn
Source: PwC Survey 2013
Source: PwC Survey 2013
At riskInefficient unstable stress testing process
BasicIssue awareness with manual processes and control
SustainableReliable,controlled function
TargetHigh performing enterprise-wide business enabler
Governance & engagement
Operating model
Process
Results & Impact
Key findings of the survey:
• More comprehensive board engagement is required While boards and senior management are very engaged in reviewing results of the stress tests, they are rarely involved in the end-to-end process of stress testing.
• Inadequate people resources The banks in our survey rely on small teams to carry out regulatory stress tests, with the majority of respondents revealing gaps in staff capabilities and numbers.
• More collaboration needed with front office Banks believe they effectively integrate finance, treasury and risk for stress testing. However, further scope exists for closer collaboration with front office (banks’ front-line business and commercial activities). Almost three-quarters of respondents feel collaboration with front office is non-functional or only partially functional.
• Results could have wider use in informing and managing the business While banks agree regulatory stress tests provide important insights, they struggle to find useful applications in running the business 95% have never or very rarely revised business plans in response to stress test results.
• Data quality and modelling are top priorities Banks indicated they are able to reconcile finance and risk data despite consistent and persistent concerns from regulators (and within the banks themselves) over data quality. However, many banks are planning to implement new data quality frameworks over the medium term.
Most banks surveyed also indicate they are investing to enhance the operating model for stress testing more broadly. Stress testing is moving from a standalone siloed process to one that is more strongly integrated with other business activities and strategic planning.

Major banks analysis – March 2014 15
Summarised below are the key components of a robust stress testing operating model. We elaborate on some of these further below.
Components of a robust stress testing operating model
1
3
4
5
6
7
2
Governance framework and board engagement
Robust framework with documented policies and procedures and regular engagementby the board and senior management throughout the end-to-end process to develop trust and understanding and therefore enable effective review, challenge and sign-off.
Business alignment and connectivity
Joined up approach with key areas of the business and between risk, finance, treasury andthe stress testing programme.
Regulatory interactions Manage and maintain a positive and constructive relationship with regulators that reinforcesthe credibility of the stress testing process. Demonstrates awareness of regulator intentionsas much as possible.
Data and reporting Deliver high-quality, granular and consistent data as an input to internal models with clear recognition of data gaps and limitations. Clearly articulated future remediation plans to address data deficiencies and challenges.
Modelling and scenarios (including RWA impact)
Comprehensive assessment of the impact on bank resilience of appropriately calibrated scenarios estimated using modelled assumptions subject to effective validation and review. Clear articulation of future plans.
Analysis of results and management actions
Demonstrate a clear and thorough understanding of the stress testing results and associated management actions with the ability to articulate and justify the key drivers, assumptions andlimitations.
Disclosure Effectively manage the disclosure of results to emphasise the quantitative and qualitative strengths of the business to meet stakeholder expectations.
Large and complex banking groups are often exposed to risks that are difficult to quantify or not directly attributable to any of the specific firm-wide stress scenarios. Examples include reputational risk, strategic risk and compliance risk. Leading firms are able to demonstrate how risks omitted from the enterprise-wide scenario analysis are accounted for in the capital planning process.
There is a wide range of practices around how firms account for these risks as part of their capital planning process. Many banks use internal capital targets to account for such risks, putting in place an incremental cushion above their targets. Others assess the impact through reduced revenues or increased expenses as part of their loss estimates.
Governance and board engagementThe board ultimately has oversight responsibility and accountability for capital planning. It is required to make informed decisions on capital adequacy and capital actions, including capital distributions. Boards and senior management of leading firms establish a comprehensive capital planning process that fits into broader risk management processes, consistent with risk appetite frameworks and the strategic direction of the organisation.
Strong governance includes periodic review of risk infrastructure, loss and resource estimation methodologies, evaluation of capital goals, assessment of the appropriateness of stress scenarios and any limitations in the key processes that might impact capital planning.
Alignment and connectivityCombining a comprehensive identification of a firm’s business activities and associated positions with effective techniques for assessing how those positions may evolve under stressful economic conditions are critical elements of capital planning. Leading firms have a systematic and repeatable process to identify all risks and consider the potential impact on capital from these risks.
Stronger risk identification practices include standardised processes through which senior management regularly update risk assessments, review risk exposures and consider how the risk exposures might evolve under a variety of stressful situations.
Senior respresentatives from major lines of business, risk management, finance and treasury provide input to this process. Leading firms are able to demonstrate how the identified risks are accounted for in the capital planning processes. However, stress testing based on on a limited number of scenarios cannot and is not expected to capture all potential risks.

Major banks analysis – March 2014 16
Internal control frameworksAs with other aspects of key risk management and finance functions, a bank should have a strong internal control framework over capital planning processes. The internal control framework should address the entire capital planning process, including the risk measurement and management systems used to produce input data, as well as the models and other techniques used to generate loss and revenue estimates. Similarly, it should address the aggregation and reporting framework used to produce management and board reports.
Leading firms ensure high quality information flows exist to support decisions. Strong management information systems enable these firms to collect, synthesise, analyse and deliver information quickly and efficiently. These systems also provides the flexibility to run ad-hoc analysis to support capital planning as needed without employing substantial resources. Lagging firms place undue reliance on antiquated and siloed systems, requiring substantial human intervention to aggregate and reconcile data.
Model validation is another critical element of a strong control framework. This starts with a complete inventory of all models used in the capital planning process. Consideration should also be given to the validity of the use of the models under stressed conditions as models designed for ongoing business activities may not be appropriate for estimating income and capital under stress conditions.
Leading banks maintain strong controls over the process to incorporate well-supported adjustments to model estimates when model weaknesses and uncertainties are identified.
ConclusionThe leading capital planning practices mentioned above will continue to evolve as new data becomes available, economic conditions change, new products and businesses introduce new risks and estimation techniques advance. These advances should further enhance the stability of individual banks and the health of the overall banking system.
Passing the stress test PwC survey on regulatory stress testing in banks
www.pwc.com/financialservices
Financial Services Risk and Regulation
January 2014
Passing the stress test– PwC Survey on regulatory stress testing in banks
Download the report at www.pwc.com/financialservices

Major banks analysis – March 2014 17
9. Rest of Africa highlights
Rest of Africa highlights
A key trend observed in the major banks’ latest results presentations is that the African agenda continues to increase in prominence, with all of the banks focusing on expansion of their footprint across the continent.
Relative contributions to headline earnings from the banks’ African operations are trending upwards, with expectations for significantly increased growth contributions going forward.
NII margins earned in the rest of Africa continue to benefit from good advances growth and generally higher net interest margin in these territories.
NIR is expected to benefit from the migration of customers to electronic channels the launch of innovative payment mechanisms for cross-border payments associated with migrant work forces.
Strong advances growth continues to be the order of the day as infrastructure and resource-related development continues.
A key trend to observe in the future will be how banks will compete and price for second-tier advances once appetite for first-tier higher credit quality advances have been satisfied by the major banks.
The African expansion is continuing to absorb a significant amount of management time as the banks standardise processes and controls across the various jurisdictions.
Going forward, the strength of the banks’ local deposit franchises will be critical to source local currency, as opposed to US dollar funding.
Competition from large local banks, specifically in the retail segment, will be intense. At the same time, competition will also come from international banks with local operations, specifically in customer flow business and corporate transactional banking.
The build-out of IT platforms across the banks’ rest of Africa operations continues to place pressure on the cost-to-income ratio and represents a trend that is likely to continue as IT systems are aligned and branch networks are expanded.
Trading income from African subsidiaries is starting to become a significant contributor to the banks’ overall trading results in absolute terms. We, however, observe that the business models of the individual banks are at varying stages of maturity to capitalise on the increasing pan-African trade flows. We expect competition in the African investment banking arena to become more intense in years to follow.

Major banks analysis – March 2014 18
10. Key banking statistics
Key banking statistics – 2H13 Rm ASA FSR NED SBK Combined Growth
2H13 1H13 2H12 1H12 2H11 2H13 1H13 2H12 1H12 2H11 2H13 1H13 2H12 1H12 2H11 2H13 1H13 2H12 1H12 2H11 2H13 1H13 2H12 1H12 2H11 2H13 v 2H12
2H13 v 1H13
1H13 v 1H12
1H13 v 2H12
2H12 v 2H11
2H12 v 1H12
Balance sheet
Total assets 959 599 948 013 898 371 808 806 786 719 894 431 869 669 825 327 769 765 763 514 749 594 714 330 682 979 670 021 648 127 1 358 467 1 394 024 1 273 083 1 296 030 1 257 361 3 962 091 3 926 036 3 679 760 3 544 622 3 455 721 7.7% 0.9% 10.8% 6.7% 6.5% 3.8%
Gross loans and advances
701 357 683 516 644 550 577 734 573 066 648 254 611 611 574 850 535 704 508 253 590 828 569 208 538 036 525 071 507 545 918 823 930 922 831 596 833 154 818 996 2 859 262 2 795 257 2 589 032 2 471 663 2 407 860 10.4% 2.3% 13.1% 8.0% 7.5% 4.7%
Total deposits 657 075 620 926 584 525 483 707 479 299 727 032 697 005 651 349 606 281 595 200 602 952 578 807 550 878 536 944 521 115 999 854 1 009 483 930 153 916 473 888 968 2 986 913 2 906 221 2 716 905 2 543 405 2 484 582 9.9% 2.8% 14.3% 7.0% 9.4% 6.8%
Risk-weighted assets
560 865 457 480 438 216 426 452 424 489 535 410 519 960 490 373 471 468 415 121 392 926 386 804 359 568 362 022 331 980 841 272 851 545 789 613 797 659 710 725 2 330 473 2 215 789 2 077 770 2 057 601 1 882 315 12.2% 5.2% 7.7% 6.6% 10.4% 1.0%
1Asset quality & provisioning
Non-performing loans
29 300 29 960 34 054 33 029 35 536 16 564 17 001 17 797 18 666 18 366 17 455 20 176 19 273 21 838 23 073 29 395 32 194 30 459 32 606 32 225 92 714 99 331 101 583 106 139 109 200 -8.7% -6.7% -6.4% -2.2% -7.0% -4.3%
Impairments -16 049 -14 341 -15 777 -13 029 -12 131 -12 811 -12 636 -11 812 -11 197 -9 995 -11 456 -11 859 -10 870 -11 545 -11 497 -19 448 -19 441 -17 704 -16 253 -15 185 -59 764 -58 277 -56 163 -52 024 -48 808 6.4% 2.6% 12.0% 3.8% 15.1% 8.0%
Collective provisions
-3 811 -2 692 -2 831 -2 294 -2 254 -6 152 -5 775 -5 322 -4 892 -3 779 -3 986 -3 605 -3 427 -3 027 -2 748 -5 469 -5 618 -5 188 -5 606 -5 410 -19 418 -17 690 -16 768 -15 819 -14 191 15.8% 9.8% 11.8% 5.5% 18.2% 6.0%
Individually assessed provisions
-12 238 -11 649 -12 946 -10 735 -9 877 -6 659 -6 861 -6 490 -6 305 -6 216 -7 470 -8 254 -7 443 -8 518 -8 749 -13 979 -13 823 -12 516 -10 647 -9 775 -40 346 -40 587 -39 395 -36 205 -34 617 2.4% -0.6% 12.1% 3.0% 13.8% 8.8%
Non-performing loans (% of advances)
4.2% 4.4% 5.3% 6.8% 6.2% 2.56% 2.78% 3.10% 3.48% 3.61% 3.0% 3.5% 3.6% 4.2% 4.5% 3.2% 3.5% 3.7% 3.9% 3.9% 3.2% 3.5% 3.9% 4.6% 4.6% -17.5% -9.0% -22.8% -9.3% -14.6% -14.9%
Impairment charge (% of average advances)
1.05% 1.35% 1.60% 1.6% 1.01% 0.77% 1.07% 0.91% 1.08% 0.80% 0.81% 1.31% 1.05% 1.11% 1.1% 1.04% 1.17% 1.08% 1.0% 0.9% 0.9% 1.2% 1.2% 1.2% 1.0% -20.9% -25.1% 2.9% 5.6% 21.5% -2.5%
Impairment coverage ratio
54.8% 47.9% 46.3% 39.4% 34.1% 77.34% 74.33% 66.37% 59.99% 54.42% 65.6% 58.8% 56.4% 52.9% 49.8% 66.2% 60.4% 58.1% 49.8% 47.1% 66.0% 60.3% 56.8% 50.5% 46.4% 16.1% 9.3% 19.4% 6.2% 22.5% 12.4%
Implied loss given default
41.8% 38.9% 38.0% 32.5% 27.8% 40.20% 40.36% 36.47% 33.78% 33.85% 42.8% 40.9% 38.6% 39.0% 37.9% 47.6% 42.9% 41.1% 32.7% 30.3% 43.1% 40.8% 38.5% 34.5% 32.5% 11.8% 5.7% 18.2% 5.8% 18.7% 11.8%
Profit & loss analysis
Net interest income
16 656 15 695 12 202 11 909 12 807 16 397 14 458 13 606 12 964 11 905 10 911 10 309 10 038 9 642 9 351 20 313 18 912 18 439 15 794 15 613 64 277 59 374 54 285 50 309 49 676 18.4% 8.3% 18.0% 9.4% 9.3% 7.9%
Non-interest income
14 387 12 668 11 567 11 174 10 723 14 839 14 007 14 237 13 517 11 455 9 826 9 535 9 059 8 265 8 273 18 943 17 726 17 970 16 504 15 078 57 995 53 936 52 833 49 460 45 529 9.8% 7.5% 9.0% 2.1% 16.0% 6.8%
Total operating income
31 043 28 363 23 769 23 083 23 530 31 236 28 465 27 843 26 481 23 360 20 737 19 844 19 097 17 907 17 624 39 256 36 638 36 409 32 298 30 691 122 272 113 310 107 118 99 769 95 205 14.1% 7.9% 13.6% 5.8% 12.5% 7.4%
Total operating expenses
-18 311 -16 142 -13 682 -13 011 -13 820 -17 108 -14 708 -15 582 -14 383 -13 380 -11 965 -11 055 -10 918 -10 182 -10 334 -24 601 -21 833 -21 584 -19 826 -18 998 -71 985 -63 738 -61 766 -57 402 -56 532 16.5% 12.9% 11.0% 3.2% 9.3% 7.6%
Core earnings 12 732 12 221 10 087 10 072 9 710 14 128 13 757 12 261 12 098 9 980 8 772 8 789 8 179 7 725 7 290 14 655 14 805 14 825 12 472 11 693 50 287 49 572 45 352 42 367 38 673 10.9% 1.4% 17.0% 9.3% 17.3% 7.0%
Impairment charge
-3 151 -3 836 -4 270 -4 020 -2 179 -2 445 -3 187 -2 518 -3 510 -1 961 -2 240 -3 325 -2 497 -2 702 -2 539 -4 149 -5 065 -4 855 -3 945 -3 522 -11 985 -15 413 -14 140 -14 177 -10 201 -15.2% -22.2% 8.7% 9.0% 38.6% -0.3%
Other income/(expenses)
51 79 214 35 12 487 528 289 1 096 401 -377 354 -52 34 2 489 248 -1 093 147 100 650 1 209 -642 1 312 515 -201.2% -46.2% -7.9% -288.3% -224.7% -148.9%
Discontinued operations
- - - - - - - - - - - - - - - - - 2 004 431 390 - - 2 004 431 390 -100.0% 0.0% -100.0% -100.0% 413.8% 365.0%
Income tax expenses
-2 772 -2 450 -1 610 -1 767 -2 185 -2 891 -2 240 -2 442 -2 181 -2 168 -1 603 -1 413 -1 471 -1 404 -1 169 -4 149 -2 048 -2 294 -2 060 -2 219 -11 415 -8 151 -7 817 -7 412 -7 741 46.0% 40.0% 10.0% 4.3% 1.0% 5.5%
Profit for the period
6 860 6 014 4 421 4 320 5 358 9 279 8 858 7 590 7 503 6 252 4 552 4 405 4 159 3 653 3 584 6 846 7 940 8 587 7 045 6 442 27 537 27 217 24 757 22 521 21 636 11.2% 1.2% 20.9% 9.9% 14.4% 9.9%
Attributable earnings
6 388 5 593 4 204 4 189 5 093 9 050 7 520 7 019 7 129 6 067 4 727 3 910 3 979 3 497 4 436 7 619 7 245 7 959 6 461 5 975 27 784 24 268 23 161 21 276 21 571 20.0% 14.5% 14.1% 4.8% 7.4% 8.9%
Headline earnings from continuing operations
6 289 5 554 4 475 4 332 5 124 8 839 7 919 7 195 7 003 5 639 4 756 3 914 4 042 3 468 3 376 7 758 7 225 6 498 6 479 6 167 27 642 24 612 22 210 21 282 20 306 24.5% 12.3% 15.6% 10.8% 9.4% 4.4%
Key data
Other operating income (% of total income)
46.3% 44.7% 46.7% 48.4% 45.6% 47.51% 49.21% 51.13% 51.04% 49.04% 47.4% 48.0% 47.4% 46.2% 46.9% 48.3% 48.4% 49.4% 51.1% 49.1% 47.4% 47.6% 48.7% 49.2% 47.7% -2.6% -0.4% -3.3% -2.2% 2.1% -1.1%
Net interest margin (% of total assets)
3.6% 3.8% 3.3% 3.0% 3.3% 3.72% 3.31% 3.41% 3.24% 3.25% 3.09% 3.35% 3.3% 3.3% 3.2% 3.33% 3.08% 3.1% 2.5% 2.6% 3.4% 3.4% 3.3% 3.0% 3.1% 5.1% 1.5% 12.9% 3.6% 6.2% 8.9%
Net interest margin (% of average interest earning advances)
4.5% 4.46% 4.3% 3.9% 4.1% 5.13% 5.03% 4.91% 4.92% 4.64% 3.57% 3.58% 3.5% 3.5% 3.5% 4.29% 4.12% 4.3% 4.1% 4.0% 4.4% 4.30% 4.2% 4.1% 4.1% 2.9% 1.7% 4.4% 1.2% 4.9% 3.2%
Standardised efficiency ratio
57.3% 55.2% 58.0% 54.9% 56.3% 52.50% 50.10% 54.30% 54.60% 58.93% 56.3% 54.2% 57.2% 55.5% 57.2% 60.5% 57.3% 59.3% 61.4% 63.5% 56.6% 54.2% 57.2% 56.6% 59.0% -1.0% 4.5% -4.2% -5.2% -3.0% 1.1%
Return on equity
16.70% 14.3% 13.6% 13.8% 16.6% 23.4% 22.5% 21.9% 20.7% 19.5% 16.60% 14.6% 14.8% 14.1% 15.0% 13.2% 13.2% 13.3% 13.8% 13.5% 17.5% 16.2% 15.9% 15.6% 16.2% 9.9% 8.2% 3.5% 1.6% -1.5% 1.9%
Total number of staff
42 356 33 897 33 717 34 244 35 200 38 026 37 231 36 491 36 398 35 526 29 513 28 889 28 748 28 678 28 494 42 221 48 730 42 736 45 755 46 375 152 116 148 747 141 692 145 075 145 595 7.4% 2.3% 2.5% 5.0% -2.7% -2.3%
Capital ratios
CET 1 11.9% 0.0% 13.00% 13.7% 13.8% 12.5% 12.5% 11.8% 12.0% 12.6%
Tier 1 13.0% 13.5% 14.00% 14.3% 14.1% 14.8% 14.8% 13.4% 13.2% 14.0% 13.6% 13.0% 12.9% 12.1% 12.6% 13.2% 12.3% 11.7% 11.0% 12.0% 13.7% 13.4% 13.0% 12.7% 13.2% 5.0% 1.9% 5.9% 3.1% -1.3% 2.8%
Tier 2 2.6% 3.1% 3.40% 2.6% 2.6% 1.4% 1.5% 1.5% 1.5% 1.4% 2.1% 1.8% 2.0% 2.3% 2.7% 3.0% 3.1% 2.9% 2.5% 2.3% 2.3% 2.4% 2.5% 2.2% 2.3% -7.1% -4.2% 6.7% -3.1% 8.9% 10.1%
Total 15.6% 16.6% 17.4% 16.9% 16.7% 16.2% 16.3% 14.9% 14.7% 15.4% 15.7% 14.8% 14.9% 14.4% 15.3% 16.2% 15.4% 14.6% 13.5% 14.3% 15.9% 15.8% 15.5% 14.9% 15.4% 3.1% 1.0% 6.1% 2.1% 0.2% 3.9%

Major banks analysis – March 2014 19
Key banking statistics – 2H13 Rm ASA FSR NED SBK Combined Growth
2H13 1H13 2H12 1H12 2H11 2H13 1H13 2H12 1H12 2H11 2H13 1H13 2H12 1H12 2H11 2H13 1H13 2H12 1H12 2H11 2H13 1H13 2H12 1H12 2H11 2H13 v 2H12
2H13 v 1H13
1H13 v 1H12
1H13 v 2H12
2H12 v 2H11
2H12 v 1H12
Balance sheet
Total assets 959 599 948 013 898 371 808 806 786 719 894 431 869 669 825 327 769 765 763 514 749 594 714 330 682 979 670 021 648 127 1 358 467 1 394 024 1 273 083 1 296 030 1 257 361 3 962 091 3 926 036 3 679 760 3 544 622 3 455 721 7.7% 0.9% 10.8% 6.7% 6.5% 3.8%
Gross loans and advances
701 357 683 516 644 550 577 734 573 066 648 254 611 611 574 850 535 704 508 253 590 828 569 208 538 036 525 071 507 545 918 823 930 922 831 596 833 154 818 996 2 859 262 2 795 257 2 589 032 2 471 663 2 407 860 10.4% 2.3% 13.1% 8.0% 7.5% 4.7%
Total deposits 657 075 620 926 584 525 483 707 479 299 727 032 697 005 651 349 606 281 595 200 602 952 578 807 550 878 536 944 521 115 999 854 1 009 483 930 153 916 473 888 968 2 986 913 2 906 221 2 716 905 2 543 405 2 484 582 9.9% 2.8% 14.3% 7.0% 9.4% 6.8%
Risk-weighted assets
560 865 457 480 438 216 426 452 424 489 535 410 519 960 490 373 471 468 415 121 392 926 386 804 359 568 362 022 331 980 841 272 851 545 789 613 797 659 710 725 2 330 473 2 215 789 2 077 770 2 057 601 1 882 315 12.2% 5.2% 7.7% 6.6% 10.4% 1.0%
1Asset quality & provisioning
Non-performing loans
29 300 29 960 34 054 33 029 35 536 16 564 17 001 17 797 18 666 18 366 17 455 20 176 19 273 21 838 23 073 29 395 32 194 30 459 32 606 32 225 92 714 99 331 101 583 106 139 109 200 -8.7% -6.7% -6.4% -2.2% -7.0% -4.3%
Impairments -16 049 -14 341 -15 777 -13 029 -12 131 -12 811 -12 636 -11 812 -11 197 -9 995 -11 456 -11 859 -10 870 -11 545 -11 497 -19 448 -19 441 -17 704 -16 253 -15 185 -59 764 -58 277 -56 163 -52 024 -48 808 6.4% 2.6% 12.0% 3.8% 15.1% 8.0%
Collective provisions
-3 811 -2 692 -2 831 -2 294 -2 254 -6 152 -5 775 -5 322 -4 892 -3 779 -3 986 -3 605 -3 427 -3 027 -2 748 -5 469 -5 618 -5 188 -5 606 -5 410 -19 418 -17 690 -16 768 -15 819 -14 191 15.8% 9.8% 11.8% 5.5% 18.2% 6.0%
Individually assessed provisions
-12 238 -11 649 -12 946 -10 735 -9 877 -6 659 -6 861 -6 490 -6 305 -6 216 -7 470 -8 254 -7 443 -8 518 -8 749 -13 979 -13 823 -12 516 -10 647 -9 775 -40 346 -40 587 -39 395 -36 205 -34 617 2.4% -0.6% 12.1% 3.0% 13.8% 8.8%
Non-performing loans (% of advances)
4.2% 4.4% 5.3% 6.8% 6.2% 2.56% 2.78% 3.10% 3.48% 3.61% 3.0% 3.5% 3.6% 4.2% 4.5% 3.2% 3.5% 3.7% 3.9% 3.9% 3.2% 3.5% 3.9% 4.6% 4.6% -17.5% -9.0% -22.8% -9.3% -14.6% -14.9%
Impairment charge (% of average advances)
1.05% 1.35% 1.60% 1.6% 1.01% 0.77% 1.07% 0.91% 1.08% 0.80% 0.81% 1.31% 1.05% 1.11% 1.1% 1.04% 1.17% 1.08% 1.0% 0.9% 0.9% 1.2% 1.2% 1.2% 1.0% -20.9% -25.1% 2.9% 5.6% 21.5% -2.5%
Impairment coverage ratio
54.8% 47.9% 46.3% 39.4% 34.1% 77.34% 74.33% 66.37% 59.99% 54.42% 65.6% 58.8% 56.4% 52.9% 49.8% 66.2% 60.4% 58.1% 49.8% 47.1% 66.0% 60.3% 56.8% 50.5% 46.4% 16.1% 9.3% 19.4% 6.2% 22.5% 12.4%
Implied loss given default
41.8% 38.9% 38.0% 32.5% 27.8% 40.20% 40.36% 36.47% 33.78% 33.85% 42.8% 40.9% 38.6% 39.0% 37.9% 47.6% 42.9% 41.1% 32.7% 30.3% 43.1% 40.8% 38.5% 34.5% 32.5% 11.8% 5.7% 18.2% 5.8% 18.7% 11.8%
Profit & loss analysis
Net interest income
16 656 15 695 12 202 11 909 12 807 16 397 14 458 13 606 12 964 11 905 10 911 10 309 10 038 9 642 9 351 20 313 18 912 18 439 15 794 15 613 64 277 59 374 54 285 50 309 49 676 18.4% 8.3% 18.0% 9.4% 9.3% 7.9%
Non-interest income
14 387 12 668 11 567 11 174 10 723 14 839 14 007 14 237 13 517 11 455 9 826 9 535 9 059 8 265 8 273 18 943 17 726 17 970 16 504 15 078 57 995 53 936 52 833 49 460 45 529 9.8% 7.5% 9.0% 2.1% 16.0% 6.8%
Total operating income
31 043 28 363 23 769 23 083 23 530 31 236 28 465 27 843 26 481 23 360 20 737 19 844 19 097 17 907 17 624 39 256 36 638 36 409 32 298 30 691 122 272 113 310 107 118 99 769 95 205 14.1% 7.9% 13.6% 5.8% 12.5% 7.4%
Total operating expenses
-18 311 -16 142 -13 682 -13 011 -13 820 -17 108 -14 708 -15 582 -14 383 -13 380 -11 965 -11 055 -10 918 -10 182 -10 334 -24 601 -21 833 -21 584 -19 826 -18 998 -71 985 -63 738 -61 766 -57 402 -56 532 16.5% 12.9% 11.0% 3.2% 9.3% 7.6%
Core earnings 12 732 12 221 10 087 10 072 9 710 14 128 13 757 12 261 12 098 9 980 8 772 8 789 8 179 7 725 7 290 14 655 14 805 14 825 12 472 11 693 50 287 49 572 45 352 42 367 38 673 10.9% 1.4% 17.0% 9.3% 17.3% 7.0%
Impairment charge
-3 151 -3 836 -4 270 -4 020 -2 179 -2 445 -3 187 -2 518 -3 510 -1 961 -2 240 -3 325 -2 497 -2 702 -2 539 -4 149 -5 065 -4 855 -3 945 -3 522 -11 985 -15 413 -14 140 -14 177 -10 201 -15.2% -22.2% 8.7% 9.0% 38.6% -0.3%
Other income/(expenses)
51 79 214 35 12 487 528 289 1 096 401 -377 354 -52 34 2 489 248 -1 093 147 100 650 1 209 -642 1 312 515 -201.2% -46.2% -7.9% -288.3% -224.7% -148.9%
Discontinued operations
- - - - - - - - - - - - - - - - - 2 004 431 390 - - 2 004 431 390 -100.0% 0.0% -100.0% -100.0% 413.8% 365.0%
Income tax expenses
-2 772 -2 450 -1 610 -1 767 -2 185 -2 891 -2 240 -2 442 -2 181 -2 168 -1 603 -1 413 -1 471 -1 404 -1 169 -4 149 -2 048 -2 294 -2 060 -2 219 -11 415 -8 151 -7 817 -7 412 -7 741 46.0% 40.0% 10.0% 4.3% 1.0% 5.5%
Profit for the period
6 860 6 014 4 421 4 320 5 358 9 279 8 858 7 590 7 503 6 252 4 552 4 405 4 159 3 653 3 584 6 846 7 940 8 587 7 045 6 442 27 537 27 217 24 757 22 521 21 636 11.2% 1.2% 20.9% 9.9% 14.4% 9.9%
Attributable earnings
6 388 5 593 4 204 4 189 5 093 9 050 7 520 7 019 7 129 6 067 4 727 3 910 3 979 3 497 4 436 7 619 7 245 7 959 6 461 5 975 27 784 24 268 23 161 21 276 21 571 20.0% 14.5% 14.1% 4.8% 7.4% 8.9%
Headline earnings from continuing operations
6 289 5 554 4 475 4 332 5 124 8 839 7 919 7 195 7 003 5 639 4 756 3 914 4 042 3 468 3 376 7 758 7 225 6 498 6 479 6 167 27 642 24 612 22 210 21 282 20 306 24.5% 12.3% 15.6% 10.8% 9.4% 4.4%
Key data
Other operating income (% of total income)
46.3% 44.7% 46.7% 48.4% 45.6% 47.51% 49.21% 51.13% 51.04% 49.04% 47.4% 48.0% 47.4% 46.2% 46.9% 48.3% 48.4% 49.4% 51.1% 49.1% 47.4% 47.6% 48.7% 49.2% 47.7% -2.6% -0.4% -3.3% -2.2% 2.1% -1.1%
Net interest margin (% of total assets)
3.6% 3.8% 3.3% 3.0% 3.3% 3.72% 3.31% 3.41% 3.24% 3.25% 3.09% 3.35% 3.3% 3.3% 3.2% 3.33% 3.08% 3.1% 2.5% 2.6% 3.4% 3.4% 3.3% 3.0% 3.1% 5.1% 1.5% 12.9% 3.6% 6.2% 8.9%
Net interest margin (% of average interest earning advances)
4.5% 4.46% 4.3% 3.9% 4.1% 5.13% 5.03% 4.91% 4.92% 4.64% 3.57% 3.58% 3.5% 3.5% 3.5% 4.29% 4.12% 4.3% 4.1% 4.0% 4.4% 4.30% 4.2% 4.1% 4.1% 2.9% 1.7% 4.4% 1.2% 4.9% 3.2%
Standardised efficiency ratio
57.3% 55.2% 58.0% 54.9% 56.3% 52.50% 50.10% 54.30% 54.60% 58.93% 56.3% 54.2% 57.2% 55.5% 57.2% 60.5% 57.3% 59.3% 61.4% 63.5% 56.6% 54.2% 57.2% 56.6% 59.0% -1.0% 4.5% -4.2% -5.2% -3.0% 1.1%
Return on equity
16.70% 14.3% 13.6% 13.8% 16.6% 23.4% 22.5% 21.9% 20.7% 19.5% 16.60% 14.6% 14.8% 14.1% 15.0% 13.2% 13.2% 13.3% 13.8% 13.5% 17.5% 16.2% 15.9% 15.6% 16.2% 9.9% 8.2% 3.5% 1.6% -1.5% 1.9%
Total number of staff
42 356 33 897 33 717 34 244 35 200 38 026 37 231 36 491 36 398 35 526 29 513 28 889 28 748 28 678 28 494 42 221 48 730 42 736 45 755 46 375 152 116 148 747 141 692 145 075 145 595 7.4% 2.3% 2.5% 5.0% -2.7% -2.3%
Capital ratios
CET 1 11.9% 0.0% 13.00% 13.7% 13.8% 12.5% 12.5% 11.8% 12.0% 12.6%
Tier 1 13.0% 13.5% 14.00% 14.3% 14.1% 14.8% 14.8% 13.4% 13.2% 14.0% 13.6% 13.0% 12.9% 12.1% 12.6% 13.2% 12.3% 11.7% 11.0% 12.0% 13.7% 13.4% 13.0% 12.7% 13.2% 5.0% 1.9% 5.9% 3.1% -1.3% 2.8%
Tier 2 2.6% 3.1% 3.40% 2.6% 2.6% 1.4% 1.5% 1.5% 1.5% 1.4% 2.1% 1.8% 2.0% 2.3% 2.7% 3.0% 3.1% 2.9% 2.5% 2.3% 2.3% 2.4% 2.5% 2.2% 2.3% -7.1% -4.2% 6.7% -3.1% 8.9% 10.1%
Total 15.6% 16.6% 17.4% 16.9% 16.7% 16.2% 16.3% 14.9% 14.7% 15.4% 15.7% 14.8% 14.9% 14.4% 15.3% 16.2% 15.4% 14.6% 13.5% 14.3% 15.9% 15.8% 15.5% 14.9% 15.4% 3.1% 1.0% 6.1% 2.1% 0.2% 3.9%

Major banks analysis – March 2014 20
BAGL House Price Index
Source: BAGL
New vehicles sold
Source: SARB
11. Industry data
GDP growth
Source: Statistics SA
-8
-6
-4
-2
0
2
4
6
8
Q4Q3Q2Q1Q4Q3Q2Q1Q4Q3Q2Q1Q4Q3Q2Q1Q4Q3Q2Q1Q4Q3Q2Q1Q4Q3Q2Q1Q4Q3Q2Q1
%
2006 2007 2008 2009 2012 20132010 2011
0
200
400
600
800
1 000
1 200
1 400
Q4Q3Q2Q1Q4Q3Q2Q1Q4Q3Q2Q1Q4Q3Q2Q1Q4Q3Q2Q1
%
2009 2010 2011 20132012
Small Medium Large
0
20
40
60
80
100
120
Q4Q3Q2Q1Q4Q3Q2Q1Q4Q3Q2Q1Q4Q3Q2Q1Q4Q3Q2Q1Q4Q3Q2Q1Q4Q3Q2Q1Q4Q3
2006 2008 2009 2010 2012 20132007 2011
2005=100

Major banks analysis – March 2014 21
Industry credit extension
Source: SARB
Growth in mortgage advances
Source: SARB
Interest rates
Source: SARB
0%
2%
4%
6%
8%
10%
12%
14%
Q4Q3Q2Q1Q4Q3Q2Q1Q4Q3Q2Q1Q4Q3Q2Q1Q4Q3Q2Q1Q4Q3Q2Q1Q4Q3Q2Q1Q4Q3Q2Q1
20072006 2008 2009 2010 2012 20132011
Q4Q3Q2Q1Q4Q3Q2Q1Q4Q3Q2Q1Q4Q3Q2Q1Q4Q3Q2Q1Q4Q3Q2Q1Q4Q3Q2Q1
Repo rate R 157 Bond yield
0
500
1 000
1 500
2 000
2 500
3 000
3 500
4 000
4 500
1.00
1.05
1.10
1.15
1.20
1.25
1.30
1.35
1.40
1.45
1.50
2008 2009 2010 2012 20132011
Total assets Specific impairment %
Rm %
Industry credit impairments
Source: SARB
0.0
0.5
1.0
1.5
2.0
2.5
3.0
Q4Q3Q2Q1Q4Q3Q2Q1Q4Q3Q2Q1Q4Q3Q2Q1Q4Q3Q2Q1Q4Q3Q2Q1Q4Q3
2007 2008 2010 2011 2012 20132009
Rt
0
10
20
30
40
50
60
Q4Q3Q2Q1Q4Q3Q2Q1Q4Q3Q2Q1Q4Q3Q2Q1Q4Q3Q2Q1Q4Q3Q2Q1Q4Q3Q2Q1Q4Q3Q2
2006 2007 2009 2010 2012 20132008
%
2011

Major banks analysis – March 2014 22
12. Contacts
Tom WinterboerFinancial Services Leader - Africa +27 11 797 5407 [email protected]
Johannes GrosskopfBanking & Capital Markets Leader - Africa +27 11 797 4346 [email protected]
Stefan BeyersBanking & Capital Markets Partner +27 11 797 4690 [email protected]
AcknowledgementsKeith Ackerman
Louwrens van Velden
Rivaan Roopnarain


Major banks analysis – March 2014 24
©2014 PricewaterhouseCoopers (“PwC”), the South African firm. All rights reserved. In this document, “PwC” refers to PricewaterhouseCoopers in South Africa, which is a member firm of PricewaterhouseCoopers International Limited (PwCIL), each member firm of which is a separate legal entity and does not act as an agent of PwCIL. (14-14699)
www.pwc.co.za/banking