Exciting Times? The Outlook for U.S. Agriculture during a World Food Crisis Dr. Vincent Smith...
38
Exciting Times? The Outlook for U.S. Agriculture during a World Food Crisis Dr. Vincent Smith Professor of Agricultural Economics Department of Agricultural Economics Great Falls: May 6, 2008 Billings: May 8, 2008
-
date post
21-Dec-2015 -
Category
Documents
-
view
214 -
download
0
Transcript of Exciting Times? The Outlook for U.S. Agriculture during a World Food Crisis Dr. Vincent Smith...

Exciting Times? The Outlook for U.S. Agriculture during a World Food Crisis
Dr. Vincent Smith
Professor of Agricultural Economics
Department of Agricultural Economics
Great Falls: May 6, 2008
Billings: May 8, 2008

Is There A World Food Crisis
• What is the Evidence?– Prices for staple foods are high throughout the
world– Food/Rice Riots have occurred in some poor and
relatively poor countries– Even low income families in wealthy countries
are feeling the pinch.
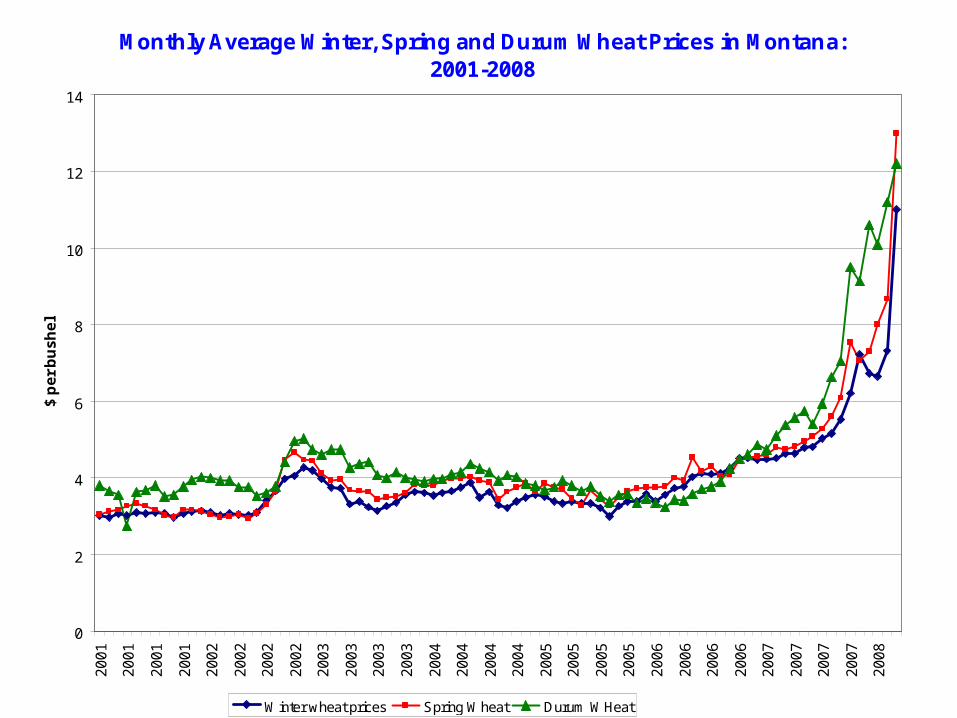
Monthly Average Winter, Spring and Durum Wheat Prices in Montana: 2001-2008
0
2
4
6
8
10
12
142
00
1
20
01
20
01
20
01
20
02
20
02
20
02
20
02
20
03
20
03
20
03
20
03
20
04
20
04
20
04
20
04
20
05
20
05
20
05
20
05
20
06
20
06
20
06
20
06
20
07
20
07
20
07
20
07
20
08
$ p
er
bu
sh
el
Winter wheat prices Spring Wheat Durum WHeat

Feed Barley Prices in Montana: 2005-2008
0
1
2
3
4
5
6
2005
2005
2005
2005
2005
2005
2006
2006
2006
2006
2006
2006
2007
2007
2007
2007
2007
2007
2008
2008
$ p
er
bu
sh
el
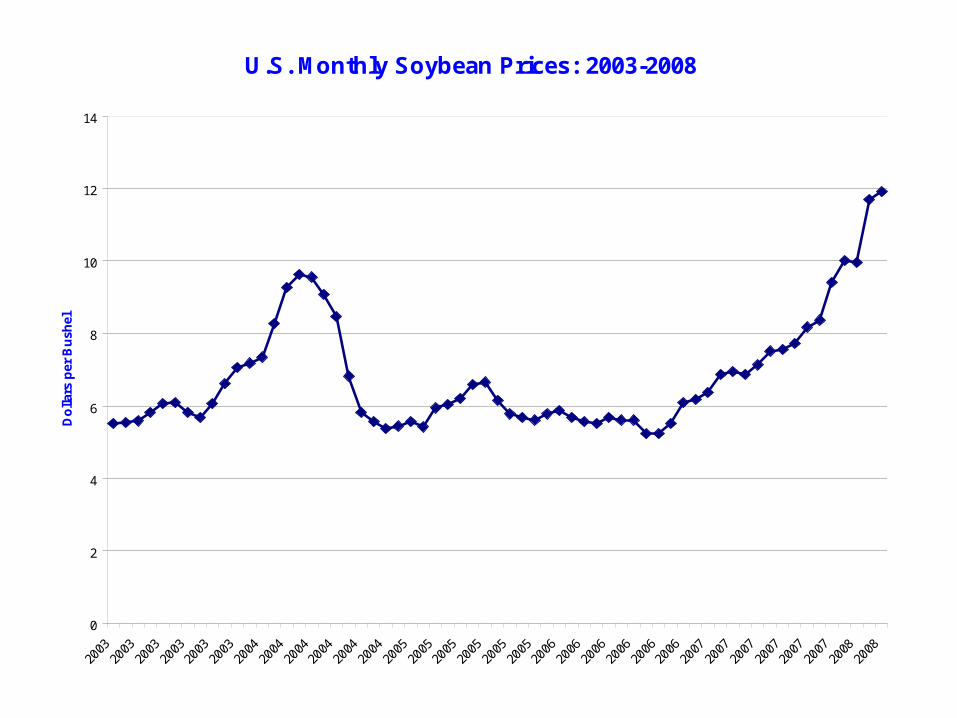
U.S. Monthly Soybean Prices: 2003-2008
0
2
4
6
8
10
12
14
2003
2003
2003
2003
2003
2003
2004
2004
2004
2004
2004
2004
2005
2005
2005
2005
2005
2005
2006
2006
2006
2006
2006
2006
2007
2007
2007
2007
2007
2007
2008
2008
Do
llars
per
Bu
shel


Rice Prices in Thailand: August 2004-November 2007
200
220
240
260
280
300
320
340
360
380
2004
2004
2004
2005
2005
2005
2005
2005
2005
2006
2006
2006
2006
2006
2006
2007
2007
2007
2007
2007
Do
llars
per
To
n

Why Are Food Prices So High
• Is it:
– World production of wheat and other staples in 2007?
– Answer is Yes (in part), at least for wheat.

World Production, Consumption, Trade and Year End Stocks: 1960/61 -2007/08
0
100
200
300
400
500
600
700
1960/61 1964/65 1968/69 1972/73 1976/77 1980/81 1984/85 1988/89 1992/93 1996/97 2000/01
Marketing Year
MM
T
Production Consumption Trade 1/ stocks 2/

Why Are Food Prices So High
• Why are prices for major food commodities so high, relative to average prices over the past thirty years? Is it:
– Low world stocks
– Answer is Yes (in part)

World Production, Consumption, Trade and Year End Stocks: 1960/61-2007/08
0
100
200
300
400
500
600
700
1960/61 1964/65 1968/69 1972/73 1976/77 1980/81 1984/85 1988/89 1992/93 1996/97 2000/01
Marketing Year
MM
T
Production Consumption Trade 1/ stocks 2/
Why Are Food Prices So High
• Is it:
– A Weak Dollar?
– Answer is Yes (in part)

Canada-US Exchange Rate: 1991-2008
0.6000
0.8000
1.0000
1.2000
1.4000
1.6000
1.8000
Canadian Dollars per US $
Why Are Food Prices So High
• Is it:
– Rising Energy Prices?
– Answer is Yes (perhaps)

U.S. Petroleum Prices: 1995-2008
$0.00
$0.50
$1.00
$1.50
$2.00
$2.50
$3.00
$3.50
$4.00
$4.50
Janu
ary-95
Janu
ary-96
Decem
ber-9
6
Decem
ber-9
7
Decem
ber-9
8
Decem
ber-9
9
Decem
ber-0
0
Decem
ber-0
1
Decem
ber-0
2
Decem
ber-0
3
Decem
ber-0
4
Decem
ber-0
5
Decem
ber-0
6
Decem
ber-0
7
Do
llar
s p
er g
allo
n
0
20
40
60
80
100
120
140
Do
llar
s p
er b
arre
l
Retail Gas Prices Retail Diesel Crude Oil
Why Are Food Prices So High
• Is it:
– U.S. Energy Policy (ethanol use mandates and ethanol production subsidies)
– Answer is Yes (in part)

Ethanol and Non ethanol Uses of the U.S. Corn Crop: 1992-2007
0
2000000000
4000000000
6000000000
8000000000
10000000000
12000000000
14000000000
1992 1993 1994 1995 1996 1997 1998 1999 2000 2001 2002 2003 2004 2005 2006 2007
Corn for all other uses Corn for Ethanol

Share of U.S. Corn Crop Allocated to Ethanol Production: 1992-2007
4.61%
7.29%
5.05%
7.20%
4.12%5.43% 5.47% 5.95% 6.23%
6.98%
8.90%10.29% 10.60%
12.84%
16.79%17.81%
0.00%
2.00%
4.00%
6.00%
8.00%
10.00%
12.00%
14.00%
16.00%
18.00%
20.00%
1992 1993 1994 1995 1996 1997 1998 1999 2000 2001 2002 2003 2004 2005 2006 2007

Will Food Prices Remain High
• It depends on the commodity and farm policies:
– Wheat prices are likely to moderate (lots of supply response)
– Rice prices are likely to moderate as exporting countries remove export
taxes and hoarding decreases in third world countries
– Soybean prices may moderate because of supply response in the U.S. and
policy changes in exporting countries like Argentina
– Corn prices are likely to remain relatively strong for a while (planted acres in
the U.S. are down and ethanol plants remain major users of the U.S. corn
crop).

Futures Prices for Crops: May 2008-March 2009
0
200
400
600
800
1000
1200
1400
May-08 Jun-08 Jul-08 Aug-08 Sep-08 Oct-08 Nov-08 Dec-08 Jan-09 Feb-09 Mar-09
cen
ts p
er u
nit
Corn futures Wheat futures Soybean futures

Feeder Cattle Futures Prices: May 2008-January 2009
70
80
90
100
110
120
May-08 Jun-08 Jul-08 Aug-08 Sep-08 Oct-08 Nov-08 Dec-08 Jan-09
Cen
ts p
er p
ou
nd

Implications for the 2008 (?) Farm Bill
High prices raise intriguing issues:• Some argue that price support levels (i.e., loan
rates) need to be higher• Others argue that many farm subsidies should be
discontinued because U.S. farmers have entered a new golden age.
• Several environmental groups are advocating more funding for environmental programs and the removal of subsidies for ethanol production

The 2008 Farm Bill: The Details
We are all waiting, as of May 3, for Congress and the White House to come to an
agreement. Hopefully, we will know more by next week!!!!!!!!
Here are some things we do know from last week’s Senate/House conference committee
discussions

The 2008 Farm Bill: Conference Committee Agreements
1. Loan Rates and Target Prices will be changed a little: details are not yet available but the House and Senate Bills, passed in July 2007 and January 2008, differ a little.

Proposed Changes to Selected Loan Rates
Crop Old (2002)New
(2007 Senate)New
(2007 House)
Wheat (bu) $2.75 $2.94 $2.94
Corn (bu) $1.95 $1.95 $1.95
Barley (bu) $1.85 $1.95 $1.90
Soybeans (cwt) $5.00 $5.00 $5.00
Other Oilseeds (cwt)
$9.30 $10.09 $10.70
Oats (bu) $1.33 $1.39 $1.46

The 2008 Farm Bill: Conference Committee Agreements
2. Funding for direct payments will be cut by about 2% for three years (a reduction of about $100 million a year among all crops receiving direct payments). The direct payment for wheat is currently 52 cents per eligible bushel. For corn it is 28 cents and for barley it is 24 cents. The proposed change would result in about a 1 cent reduction in that amount.

The 2008 Farm Bill: Conference Committee Agreements
3. Some changes will be made in target prices, with implications for counter-cyclical payments. Increases for wheat, soybeans, oats and minor oilseeds, but not for corn or barley.

Proposed Changes to Selected Target Prices
Crop Old (2002)New
(2007 Senate)New
(2007 House)
Wheat (bu) $3.92 $4.20 $4.15
Corn (bu) $2.63 $2.63 2.63
Barley (bu) $2.24 $2.24 $2.74
Soybeans (cwt) $5.80 $6.00 $6.10
Other Oilseeds (cwt)
$10.10 $12.74 $11.50
Oats (bu) $1.44 $1.83 $1.50

Monthly Average Corn Prices Received by Farmers: 1997-2007
0
0.5
1
1.5
2
2.5
3
3.5
4
$ p
er
bu
sh
el
Loan Rate
Target Price
Market Price
Market Price plus Direct Payment

The 2008 Farm Bill: Conference Committee Agreements
4. The Bill creates a new, optional Average Crop Revenue commodity program, available in 2010, that, if selected by a producer, would make them ineligible for direct payments, countercyclical payments, and participation in the loan rate program
The alternative Average Crop Revenue program provides a fixed per acre payment plus an additional payment when the average crop revenue for the crop of interest in a state (or nationally) falls below a certain percentage (90 percent in the senate bill) of its long run average.
The 2008 Farm Bill: Conference Committee Agreements
5. New payment limitations will be introduced
No direct payments or stewardship payments for non-farmers with Adjusted Gross Incomes in excess of $500,000.
Reduced payments to farmers and ranchers with AGI’s in excess of $950,000.

The 2008 Farm Bill: Conference Committee Agreements
6. A Standing Disaster Relief Program will be established for crops (called the Supplemental Revenue Assistance of SURE program in the Senate Bill). Funding is at approximately $1 billion per year.
The conference committee has also added in a Livestock Forage Program, funded at $75 million per year. Payments will be triggered by a drought index for each county

The SURE Program
1. The new standing disaster program is called the Supplemental Revenue Assistance
Program (SURE)
2. It is a “whole farm” revenue guarantee program.
3. Payments will be made only to counties that are declared to be disaster counties by the
Secretary and other counties that are adjacent to them.
4. At the farm level, average revenue is estimated for each crop or forage and the revenue
guarantee no more than 90% of that whole farm average revenue.
5. Farms receiving disaster payments that also receive crop insurance indemnities will
have those indemnities reduced by the amount of the disaster payments
6. Farms must have crop insurance or NAP for all crops and forages covered by those
programs.
7. The goal is to end ad hoc disaster payments.

The 2008 Farm Bill: Conference Committee Agreements
7. The Federal Crop Insurance program will remain largely unchanged, at least from the perspective of agricultural producer.
Funding is being cut by approximately $570 million per year, mainly through reductions in reimbursement payments to insurance companies for their administration and operations expenses.

The 2008 Farm Bill: Conference Committee Agreements
8. Conservation programs continue including:
a. Conservation Reserve Program (with total acres reduced to 32 million acres, but with annual funding at $2.5 billion)
b. Conservation Security (now Stewardship) Program (with additional funding of about $250 million per year).
The 2008 Farm Bill: Conference Committee Agreements
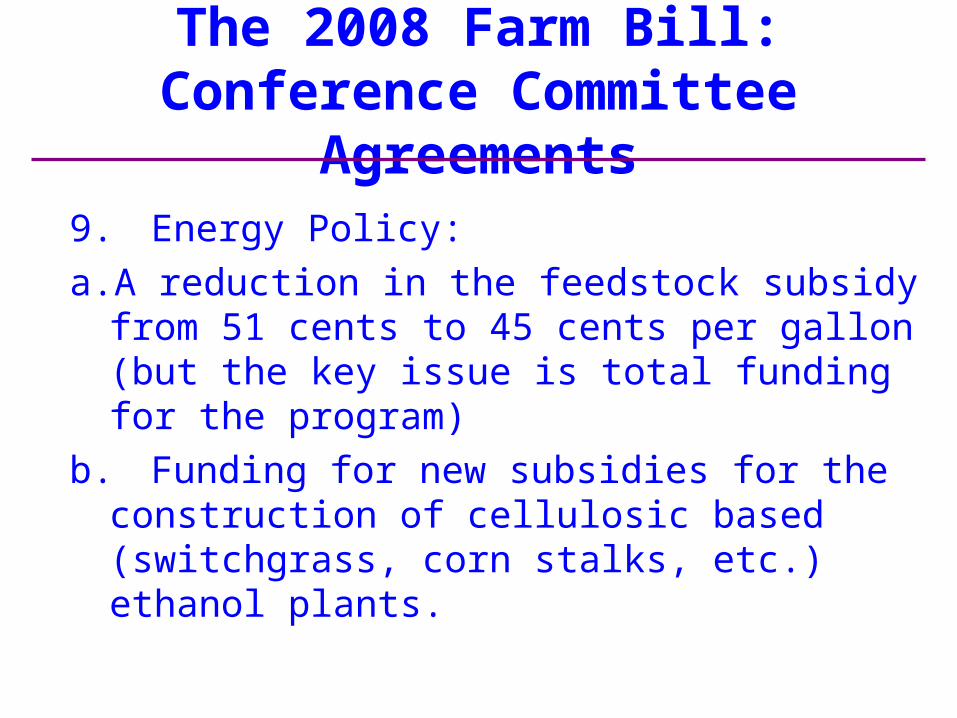
9. Energy Policy:
a. A reduction in the feedstock subsidy from 51 cents to 45 cents per gallon (but the key issue is total funding for the program)
b. Funding for new subsidies for the construction of cellulosic based (switchgrass, corn stalks, etc.) ethanol plants.

The 2008 Farm Bill: Conference Committee Agreements
10. Organic and Specialty Crops:
a. $78 million over four years for organic crop research and extension education
b. $230 million over four years for specialty crop research (including genetics, plant breeding, mechanization, food safety and pests and diseases).
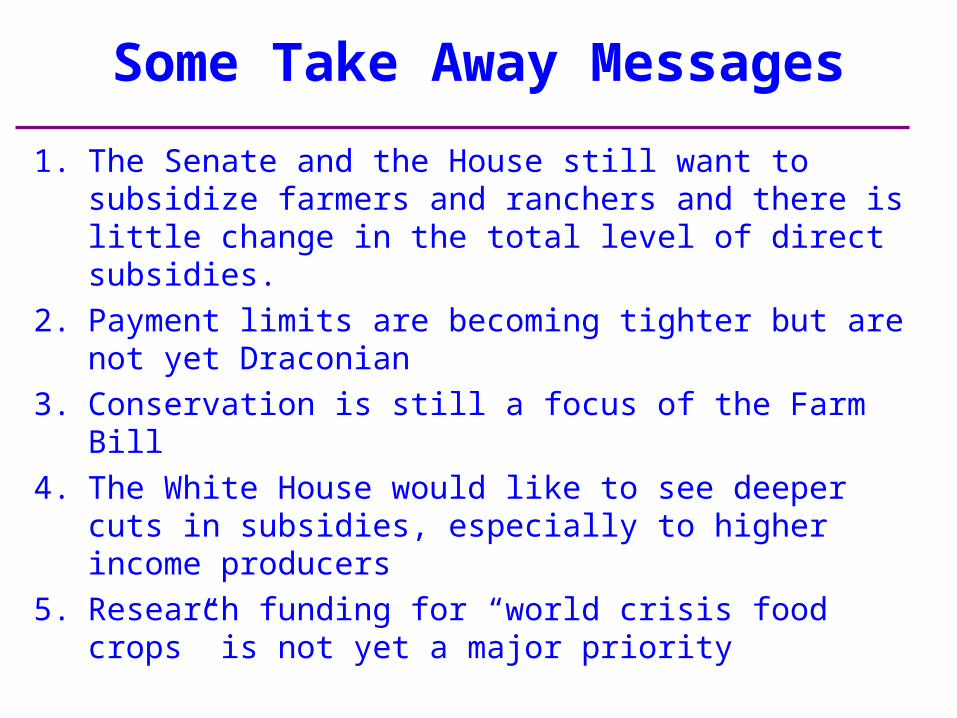
Some Take Away Messages
1. The Senate and the House still want to subsidize farmers and ranchers and there is little change in the total level of direct subsidies.
2. Payment limits are becoming tighter but are not yet Draconian
3. Conservation is still a focus of the Farm Bill
4. The White House would like to see deeper cuts in subsidies, especially to higher income producers
5. Research funding for “world crisis food crops” is not yet a major priority