Exchange Rate Regimes Andrew K. Rose Visiting Norman-Houblon Fellow August, 2010 1.
52
Exchange Rate Regimes Andrew K. Rose Visiting Norman-Houblon Fellow August, 2010 1
-
Upload
eugene-baker -
Category
Documents
-
view
218 -
download
0
Transcript of Exchange Rate Regimes Andrew K. Rose Visiting Norman-Houblon Fellow August, 2010 1.

1
Exchange Rate Regimes
Andrew K. RoseVisiting Norman-Houblon Fellow
August, 2010

2
Three Questions
• Past: What do We Know about Exchange Rate Regimes Historically?– Rose “Fixed, Floating and Flaky”
• Present: How did Different Exchange Rate Regimes do in the “Great Recession”?– Rose and Spiegel “Causes and Consequences”
• Future: What are the Expected Effects of China’s Switch in Regime?– Eichengreen and Rose “27 Up”
3
Past: A Stylized Description of Exchange Rate Regime

4
Exchange Rate Classifications
• Bad Old Days: IMF used official policy
• But De Jure Systems of Exchange Rate
Classification do not Cohere well with Actual
De Facto Behavior

5
3 Popular (Newish) De Facto Classifications
• Levy-Yeyati and Sturzenegger
– Cluster Analysis on Exchange Rates and Reserves
• Reinhart and Rogoff
– Black Market Rates
• Shambaugh
– Nominal exchange rate movements

6
Poor CoherenceIMF Levy-Yeyati &
SturzeneggerReinhart &
RogoffShambaugh
IMF 100%Levy-Yeyati & Sturzenegger
59% 100%
Reinhart & Rogoff
59% 55% 100%
Shambaugh 68% 65% 65% 100%

7
Message
• Don’t rely on any single system!

8
Some Stylized Facts

9
Many Countries are Fixed
Fix
Intermediate
Float
050%
100
%
1970 1980 1990 2000 2010
IMF De Jure
Fix
Intermediate
Float
050%
100
%
1970 1980 1990 2000 2010
Levy-Yeyati & Sturzenegger
Peg
Non-Peg
050%
100
%
1970 1980 1990 2000 2010
Shambaugh
Fix
Intermediate
Float
050%
100
%
1970 1980 1990 2000 2010
Reinhart & Rogoff
Distribution of Countries by RegimeExchange Rate Regimes over Time

10
Not Much GDP in Fixers
Fix
Intermediate
Float
050%
100
%
1970 1980 1990 2000 2010
IMF De Jure
Fix
Intermediate
Float
050%
100
%
1970 1980 1990 2000 2010
Levy-Yeyati & Sturzenegger
Peg
Non-Peg
050%
100
%
1970 1980 1990 2000 2010
Shambaugh
Fix
Intermediate
Float0
50%
100
%
1970 1980 1990 2000 2010
Reinhart & Rogoff
Distribution of GDP by Currency RegimeExchange Rate Regimes over Time

11
Regimes are Becoming Durable0
.2.4
.6
1970 1980 1990 2000 2010
IMF De Jure
0.2
.4.6
1970 1980 1990 2000 2010
Levy-Yeyati & Sturzenegger
0.2
.4.6
1970 1980 1990 2000 2010
Shambaugh
0.2
.4.6
1970 1980 1990 2000 2010
Reinhart & Rogoff
Proportion of Global GDP in Economies with Changing RegimesExchange Rate Regime Switches over Time

12
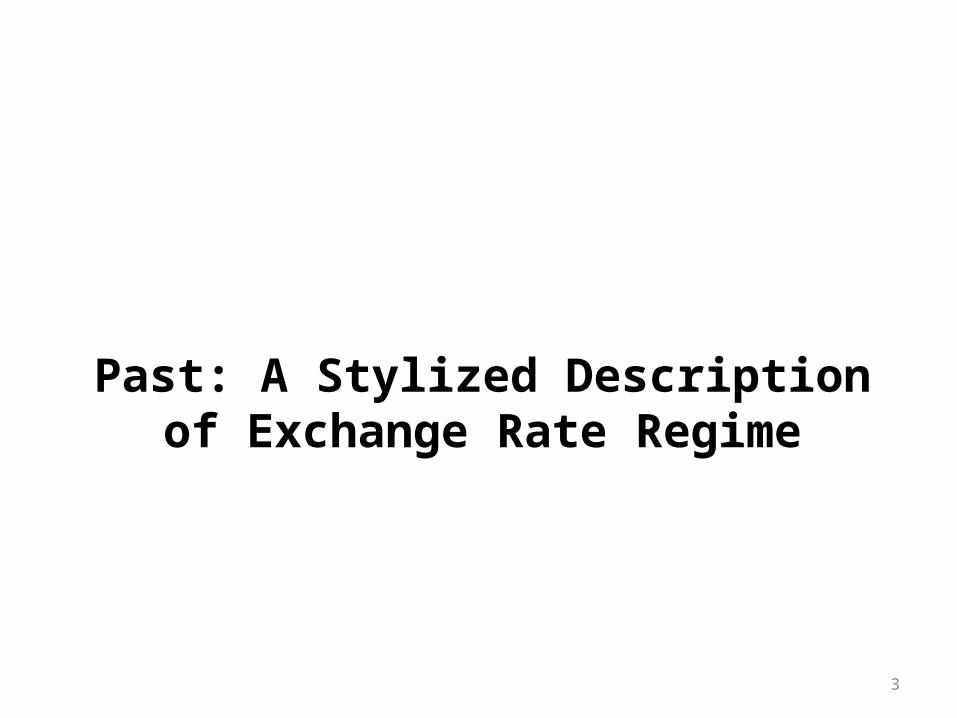
Does Size (Population) Matter?
• Many fixers are small. • But: many small economies
– Berkeley California has population > 49 (/237 ) “countries and other entities” in CIA’s World Factbook
– Many included in the various exchange rate classifications• No doubt that smallest economies of the world do not float
– Many don’t have own currencies– 95 of CIA’s listed “countries” do not have national currency
• Easy to overstate; countries do not have to be large before creating a floating currency– Small floats include: the Seychelles (population 88,000 in June 2010),
Tonga (123,000), and Sao Tome and Principe (176,000).
13
Quantile Plots of Size4
914
Fix
4 9 14non-Fix
Official IMF
49
14
Fix
4 9 14non-Fix
Levy-Yeyati & Sturzenegger
49
14
Fix
4 9 14non-Fix
Shambaugh
49
14
Fix
4 9 14non-Fix
Reinhart & Rogoff
Quantile Plots of logs 2004 PWT 6.3 PopulationSize of Fixers and non-Fixers

14
So Size Matters only at the tail
• Size Matters much less at 2.5 million
– 135 countries
• Size Matters not at all beyond 10 million
– 75 countries

15
Income? No Effect6
78
910
11
Fix
6 7 8 9 10 11non-Fix
Official IMF
67
89
10
11
Fix
7 8 9 10 11non-Fix
Levy-Yeyati & Sturzenegger
67
89
10
11
Fix
6 7 8 9 10 11non-Fix
Shambaugh
67
89
10
11
Fix
6 7 8 9 10 11non-Fix
Reinhart & Rogoff
Quantile Plots of log 2004 PWT 6.3 Real GDP per capitaIncome of Fixers and non-Fixers

16
Other Stylized Facts, 1
1. Two Anchors• Dollar (66 fixers); Euro (227)
2. All Large Rich Economies Float• Large: Dollar, Yen, Euro,• Medium: UK, Canada, Australia, Switzerland, …• EMs: Brazil, India, Indonesia, Korea, Mexico, Russia, and
Turkey• China is exception

17
Other Stylized Facts, 2
3. Regions Differ
– Sub-Saharan Africans fix
– Central Europeans, Asians do not
4. Oil Exporters Fix
– Especially OPEC members in Gulf

18
Other Stylized Facts, 3
5. Small Financial Centers Fix
– Mostly Small
6. Inflation Targeters Float
– Often Very Cleanly
7. Nominal Exchange Rate Volatility is Real
– Mussa

19
Causes of Exchange Rate Regime
• Theory #1: “Sources of Shocks”
– Countries with real shocks should float
– Financial shocks implies fix
• Stockman (2000) “the evidence supporting the
predictions of these models is only slightly
better than the evidence for cold nuclear fusion”

20
Another Theory: Credibility
• Fixed nominal exchange rate transparent easily monitored monetary anchor– Import credibility by fixing to Fed/Buba
• Tornell and Velasco: fiscal indiscipline eventually undermines most fixes– Float: easier to monitor, faster punishment, better
discipline• So credibility arguments theoretically ambiguous
– Is exchange rate constraint different from other constraints (e.g., Inflation Targeting)?

21
Microeconomic Arguments
• Facilitate Trade
– Size? Possible if Hedging Risk difficult (LDCs)
• Deepen Micro-Structure of FX market?
– Deepen liquidity
• But many rich countries (Denmark, HK) fix
• Little intervention outside FX (stocks, bonds)
22
Shameful Empirics
• No Time-Series Understanding– OK since most determinants sluggish
• No Cross-Country Success Either– Very small countries, autocracies , former
colonies, financial centers, oil exporters fix– Little of the cross-country variation explained
though• An Embarrassment! Almost no covariates of
exchange rate regime choices empirically.

23
What about Consequences?

24
Growth Consequences of Regimes?Classification Narrow Crawl Wide Crawl Float FallingOfficial IMF .8*
(.3).5
(.4).2
(.5)
Reinhart and Rogoff
-.3(.4)
-1.0*(.5)
.5(1.2)
-4.3**(.6)
Intermediate Float
Levy-Yeyati and Sturzenegger
-1.5**(.4)
-.5(.4)
Non-Peg
Shambaugh .3(.3)

25
Inflation Consequences of Regimes?Classification Narrow Crawl Wide Crawl Float FallingOfficial IMF -9.1**
(2.1)2.7
(3.6)8.8
(6.3)
Reinhart and Rogoff
.4(2.4)
.8(3.1)
7.9(4.3)
62.**(9.6)
Intermediate Float
Levy-Yeyati and Sturzenegger
18.4**(3.1)
3.5(1.9)
Non-Peg
Shambaugh 7.3**(1.8)

26
Quick Summary of Consequences
• No Real Growth Effects
– Reasonable; monetary neutrality
• Unclear Inflationary Consequences
• Also: no effect on volatility
– Baxter-Stockman (1989); Flood-Rose (1995);
Obstfled-Rogoff “Six Puzzles” (2001)
27
Is this Question Worth Asking?
• Countries with similar income, size, openness,
institutions choose different regimes:
– Singapore vs. Hong Kong
– Denmark vs. Sweden vs. Finland
– Costa Rica vs. Panama
• No convergence, few apparent causes, no clear
consequences

28
Exchange Rate Regimes are Flaky
• Caring about exchange rate regimes is akin to
caring about individual preferences for wine
or beer

29
Present: The Non-Effect of Exchange Rate Regimes on Crisis Incidence

30
Cross-Country Approachto “Great Recession
• Use cross-section of (107) countries to ask which countries experienced biggest crises
• A necessary (but far from sufficient) part of any successful early warning system– Cross-sectional questions easier than time-series
modeling• Attempt to link (2006 and earlier) crisis causes
to (2008 and later) crisis consequences
31
Rose-Spiegel (2010a,b,c) Findings
• ‘Great Recession’ progressive; countries with
higher income suffer worse crises (as in RS)
• No other robust results– Over 80 “national” causes/vulnerabilities– Over 40 “international” linkages
32
Cross-Sectional Data Set
• All countries/territories with real GDP per
capita at least $10,000 in 2003
• All countries/territories with real GDP per
capita at least $4,000 in 2003 and population
at least 1 million
33
Emerging Literature
• Four Big Differences from RS
– Measures of Crisis Intensity
– Potential Causes (Covariates)
– Estimator linking causes, intensity
– Country Sample

34
Key References
• Berkmen, Gelos, Rennhack, Walsh (2009) “BGRW”
• Blanchard, Faruqee and Das (2010) “BFD”• Claessens, Dell’Arriccia, Igan, Laeven (2010)
“CDIL”• Frankel and Saravelos (2010) “FS”• Giannone, Lenza and Reichlin (2010) “GLR”• Lane and Milesi-Fettetti (2010) “LMF”

35
Measures of Crisis Intensity (Dependent Variables)
1. Default: Real 2008-09 GDP growth (from EIU)2. Real GDP growth change, 2008-09 - 2005-07
(LMF)3. Real GDP growth change, 2008-09 - 1990-07
(BFD)4. Revision to WEO 2009 growth forecast (BGRW)5. 2009 output gap (from OECD)6. 2008-09 consumption growth7. First Principal Factor from 4 RS variables

36
Modeling Crisis Causes (Regressors):Many Unsuccessful Attempts
• Credit %GDP
• Debt %GDP
• Domestic Banking Sector Characteristics
• Fiscal Policy
• Trade Flows
• Capital Flows
37
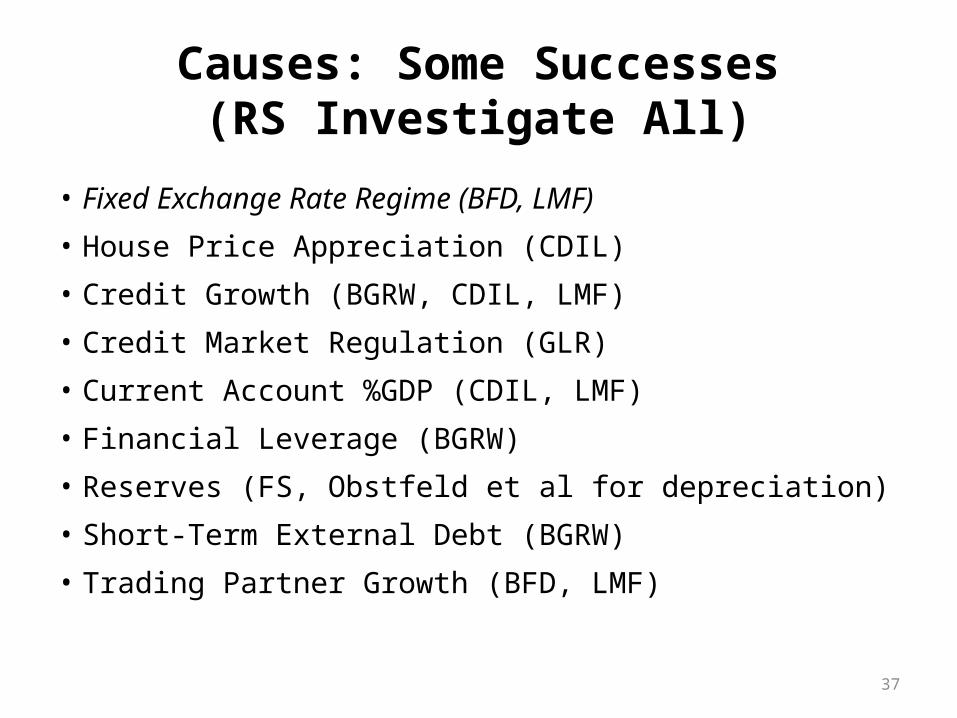
Causes: Some Successes(RS Investigate All)
• Fixed Exchange Rate Regime (BFD, LMF)
• House Price Appreciation (CDIL)
• Credit Growth (BGRW, CDIL, LMF)
• Credit Market Regulation (GLR)
• Current Account %GDP (CDIL, LMF)
• Financial Leverage (BGRW)
• Reserves (FS, Obstfeld et al for depreciation)
• Short-Term External Debt (BGRW)
• Trading Partner Growth (BFD, LMF)

38
Different Country Samples
• Full sample (107)• (51) World Bank High Income• (74) IMF non-Advanced• (89) non-Oil Exporters• (91) non-Small Financial Centers• (51) non-oil, non-FC High/Upper-Middle
Income

39
Simple Econometrics
• LS cross-country regressions, White se’s
• Condition on log (2006) real GDP per capita
• Add dummy for 2006 fixers
• Different regressands, samples

40
Effect of Exchange Rate Regime (Dummy for 2006 Fix)
All HighIncome
NoAdv.
NoOil
No Fin’l Centers
No Poor,Oil, FCs
2008-09 Growth
-1.42(1.41)
.51(1.92)
-1.79(1.91)
-3.07*(1.48)
-1.62(1.55)
-2.29(2.01)
2008-09 Grow - ’05-’07 Grow
-2.11(1.46)
-.25(1.72)
-2.50(1.99)
-3.21(1.62)
-2.42(1.60)
-3.54(2.24)
2008-09 Grow- ’90-’07 Grow
-2.08(1.42)
-.60(1.81)
-2.48(1.95)
-2.96(1.53)
-2.38(1.56)
-2.76(2.10)
Revised WEO ‘09 Grow Fost
.16(.72)
1.15(.98)
-.13(.91)
-.39(.80)
-.29(.73)
-1.10(.95)
Output Gap2009
-.73(.71)
-.62(.70)
n/a -.73(.71)
-.55(.78)
-.55(.78)
Cons. Growth 2008-09
.36(2.39)
3.46(4.64)
-1.06(2.73)
-1.47(1.13)
.38(2.62)
-1.86(1.39)
Extracted Prin. Factor
-.14(.17)
.01(.21)
-.17(.24)
-.26(.18)
-.22(.17)
-.21(.22)

41
Note Insignificant Effects!
• Fixed Exchange Rate Regimes almost never
significantly affect growth
– Signs mostly negative (5/41 positive)
• Very weak indications of importance

42
True of Other Covariates Too!
• Very difficult to link cross-country crisis
incidence of causes and consequences of
“Great Recession”

43
Future: What Can We Expectfrom China’s Switch?
44
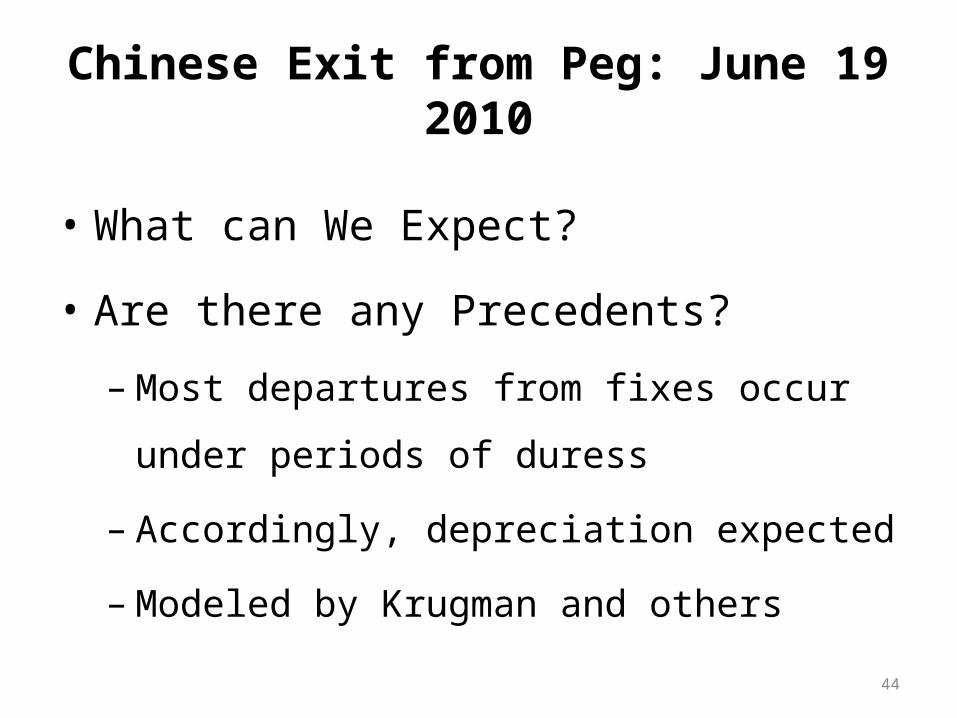
Chinese Exit from Peg: June 19 2010
• What can We Expect?
• Are there any Precedents?
– Most departures from fixes occur under periods of
duress
– Accordingly, depreciation expected
– Modeled by Krugman and others

45
27 Precedents
• Use Reinhart-Rogoff monthly system of 15 exchange regime classifications
• China: pegged initially– Moves to More Flexible Regime– Appreciates
• 27 other observations of regime switch (fix to more flexible) and appreciation ($ or SDR)
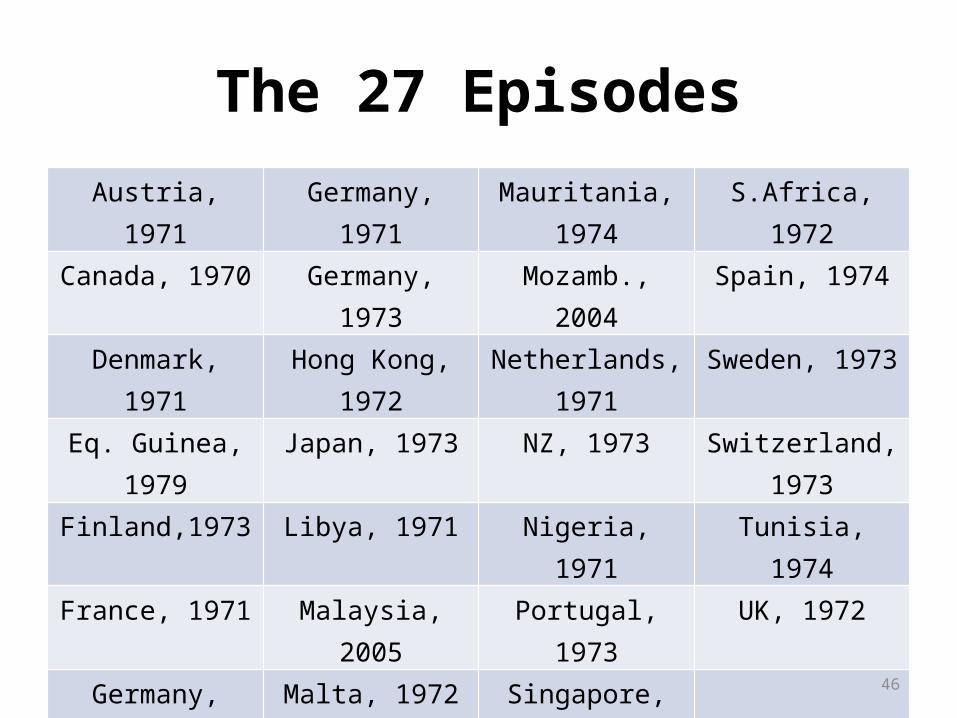
46
The 27 EpisodesAustria, 1971 Germany, 1971 Mauritania, 1974 S.Africa, 1972
Canada, 1970 Germany, 1973 Mozamb., 2004 Spain, 1974
Denmark, 1971 Hong Kong, 1972 Netherlands, 1971 Sweden, 1973
Eq. Guinea, 1979 Japan, 1973 NZ, 1973 Switzerland, 1973
Finland,1973 Libya, 1971 Nigeria, 1971 Tunisia, 1974
France, 1971 Malaysia, 2005 Portugal, 1973 UK, 1972
Germany, 1969 Malta, 1972 Singapore, 1973

47
Growth around Appreciating Exits-2
0-1
00
10
20
30
-5 0 5
Annual Growth around (27) Fix Exits with Appreciation

48
Little Happens to Growth
• Some heterogeneity
• Still, no reason to expect big changes
• What about the macro-economy in general?

49
The Macroeconomy
Annual Movements around (27) Fix Exits with AppreciationMeans and +/-2se CI; Chinese post-'99 means shown
Real GDP growth
-5 0 5-10
0
10
20
Investment/GDP
-5 0 510203040
Inflation
-5 0 5-10
0102030
Trade/GDP
-5 0 5-100
0
100
200
Export Growth
-5 0 5-20
0
20
40
Current Account/GDP
-5 0 5-40
-20
0
20
Domestic Credit Growth
-5 0 5-50
0
50
100
M2 Growth
-5 0 5-50
0
50
100
Reserves/M2
-5 0 5-10123

50
International Reserves
Annual Movements around (27) Fix Exits with AppreciationMeans and 90%CI; Chinese post-'99 means shown
Reserves/GDP
-5 0 50
.2
.4
.6
.8
ST Debt/Reserves
-5 0 50
.5
1
1.5
Reserves/Import Months
-5 0 50
5
10
15
Reserves/M2
-5 0 50
1
2
3

51
Growth Rates of GDP Components
Annual Movements around (27) Fix Exits with AppreciationMeans and 90%CI; Chinese post-'99 means shown
Household Consumption Growth
-5 0 5-10
0
10
20
30
Government Consumption Growth
-5 0 5
0
10
20
Investment Growth
-5 0 5-100
-50
0
50
Import Growth
-5 0 5-20
0
20
40

52
Few Changes in General
• Historically, “exit-ups” unexciting
• Early days, but little reason to believe that
China’s switch will be historically atypical