excess degassing from volcanoes and its role on eruptive and ...
31
EXCESS DEGASSING FROM VOLCANOES AND ITS ROLE ON ERUPTIVE AND INTRUSIVE ACTIVITY Hiroshi Shinohara 1 Received 5 September 2007; revised 27 March 2008; accepted 19 May 2008; published 15 November 2008. [1] Volcanoes emit larger amounts of volcanic gas than can be dissolved in the volume of erupted magma during a variety of volcanic processes, including explosive and effusive eruption and noneruptive continuous degassing. Degassing of unerupted magma with a much larger volume than that of erupted magma caused such a large degassing; erupted magma represents only a small portion of the magma that drives volcanic activity. Evaluation of the magma-gas differentiation process causing the excess degassing is necessary to understand eruption processes, magma chamber evolution, and crustal growth by magma intrusion. Three mechanisms are proposed to explain various degassing modes, including eruption of bubble- accumulated magma, degassing of a convecting magma column, and permeable gas transportation from a deep magma chamber. Examples of large degassing in excess of the erupted magma are common in subduction zone volcanism but are rare in rift- and hot spot – associated volcanism. Citation: Shinohara, H. (2008), Excess degassing from volcanoes and its role on eruptive and intrusive activity, Rev. Geophys., 46, RG4005, doi:10.1029/2007RG000244. 1. INTRODUCTION [2] Volcanoes emit volcanic gas during various types of activity that range from explosive eruptions to noneruptive gas emissions. Volcanic gas is originally supplied from the mantle or lower crust to the upper crust as dissolved components in magmas. However, it is common that the amount of volcanic gases emitted from volcanoes greatly exceeds the amount of volatiles that were dissolved in the erupted magmas; this is called excess degassing of volca- noes [Andres et al., 1991; Wallace, 2001]. Excess degassing implies that the volcanic gases are derived from other sources in addition to the dissolved volatiles in the erupted magma, and a larger volume of magma that did not erupt but remains in the crust is suggested as the source of excess degassing. The excess degassing indicates that a volcano is not just a location of magma emission but is also a locus of gas emission from magmas supplied to the upper crust, including intrusive magmas. A volcano is a chimney in the crust, effectively exhausting gases supplied from deep sources (W. F. Giggenbach, personal communication, 1997). The view of larger intrusive magmas than extrusive magmas has been quantified by geological and geophysical studies of the crustal structure [e.g., Crisp, 1984] and by geochemical studies of magma chamber evolution [e.g., Hildreth, 1981]. The distribution of large intrusive magmas (plutons) in the upper crust indicates their importance on crustal growth, but they are the results of a long history of igneous activity, and their link to the present-day volcanic activity is not clear. Excess degassing is the result of ongoing formation of intrusive magmas that can provide constraints on differentiation process of the extrusive and intrusive magmas beneath each volcano. [3] Volcanic gas supply from a larger amount of a magma than erupted magma implies that excess degassing is caused by magma-gas differentiation in a magma chamber and conduit system. Exsolution and expansion of a volcanic gas phase (bubbles) provides the major driving force of magma ascent and explosive eruptions [Wilson and Head, 1981]. A variety of eruption styles is largely controlled by distribution of gas phase in a magma during eruption [Eichelberger et al., 1986; Jaupart and Vergniolle, 1988]. Original volatile contents in magmas commonly far exceed the amount necessary to cause explosive eruption, whereas some of those magmas erupt effusively because of gas loss from ascending magmas [Eichelberger, 1995]. Therefore, magma-gas differentiation in a magma chamber and conduit system controls not only excess degassing but also occur- rence and style of eruptions. Past volcanic activity is commonly characterized by its erupted magma volume [Newhall and Self, 1982; Simkin, 1993]; however, excess degassing indicates that the erupted magma represents only a small portion of the magma that drives the eruption. Occurrence of excess degassing is different for eruptions with different styles, magma compositions, and tectonic Click Here for Full Articl e 1 Geological Survey of Japan, AIST, Tsukuba, Japan. Copyright 2008 by the American Geophysical Union. 8755-1209/08/2007RG000244$15.00 Reviews of Geophysics, 46, RG4005 / 2008 1 of 31 Paper number 2007RG000244 RG4005
Transcript of excess degassing from volcanoes and its role on eruptive and ...

EXCESS DEGASSING FROM VOLCANOES AND ITS
ROLE ON ERUPTIVE AND INTRUSIVE ACTIVITY
Hiroshi Shinohara1
Received 5 September 2007; revised 27 March 2008; accepted 19 May 2008; published 15 November 2008.
[1] Volcanoes emit larger amounts of volcanic gas thancan be dissolved in the volume of erupted magma during avariety of volcanic processes, including explosive andeffusive eruption and noneruptive continuous degassing.Degassing of unerupted magma with a much larger volumethan that of erupted magma caused such a large degassing;erupted magma represents only a small portion of themagma that drives volcanic activity. Evaluation of themagma-gas differentiation process causing the excessdegassing is necessary to understand eruption processes,
magma chamber evolution, and crustal growth by magmaintrusion. Three mechanisms are proposed to explainvarious degassing modes, including eruption of bubble-accumulated magma, degassing of a convecting magmacolumn, and permeable gas transportation from a deepmagma chamber. Examples of large degassing in excess ofthe erupted magma are common in subduction zonevolcanism but are rare in rift- and hot spot–associatedvolcanism.
Citation: Shinohara, H. (2008), Excess degassing from volcanoes and its role on eruptive and intrusive activity, Rev. Geophys., 46,
RG4005, doi:10.1029/2007RG000244.
1. INTRODUCTION
[2] Volcanoes emit volcanic gas during various types of
activity that range from explosive eruptions to noneruptive
gas emissions. Volcanic gas is originally supplied from the
mantle or lower crust to the upper crust as dissolved
components in magmas. However, it is common that the
amount of volcanic gases emitted from volcanoes greatly
exceeds the amount of volatiles that were dissolved in the
erupted magmas; this is called excess degassing of volca-
noes [Andres et al., 1991; Wallace, 2001]. Excess degassing
implies that the volcanic gases are derived from other
sources in addition to the dissolved volatiles in the erupted
magma, and a larger volume of magma that did not erupt
but remains in the crust is suggested as the source of excess
degassing. The excess degassing indicates that a volcano is
not just a location of magma emission but is also a locus of
gas emission from magmas supplied to the upper crust,
including intrusive magmas. A volcano is a chimney in the
crust, effectively exhausting gases supplied from deep
sources (W. F. Giggenbach, personal communication,
1997). The view of larger intrusive magmas than extrusive
magmas has been quantified by geological and geophysical
studies of the crustal structure [e.g., Crisp, 1984] and by
geochemical studies of magma chamber evolution [e.g.,
Hildreth, 1981]. The distribution of large intrusive magmas
(plutons) in the upper crust indicates their importance on
crustal growth, but they are the results of a long history of
igneous activity, and their link to the present-day volcanic
activity is not clear. Excess degassing is the result of
ongoing formation of intrusive magmas that can provide
constraints on differentiation process of the extrusive and
intrusive magmas beneath each volcano.
[3] Volcanic gas supply from a larger amount of a magma
than erupted magma implies that excess degassing is caused
by magma-gas differentiation in a magma chamber and
conduit system. Exsolution and expansion of a volcanic
gas phase (bubbles) provides the major driving force of
magma ascent and explosive eruptions [Wilson and Head,
1981]. A variety of eruption styles is largely controlled by
distribution of gas phase in a magma during eruption
[Eichelberger et al., 1986; Jaupart and Vergniolle, 1988].
Original volatile contents in magmas commonly far exceed
the amount necessary to cause explosive eruption, whereas
some of those magmas erupt effusively because of gas loss
from ascending magmas [Eichelberger, 1995]. Therefore,
magma-gas differentiation in a magma chamber and conduit
system controls not only excess degassing but also occur-
rence and style of eruptions. Past volcanic activity is
commonly characterized by its erupted magma volume
[Newhall and Self, 1982; Simkin, 1993]; however, excess
degassing indicates that the erupted magma represents only
a small portion of the magma that drives the eruption.
Occurrence of excess degassing is different for eruptions
with different styles, magma compositions, and tectonic
ClickHere
for
FullArticle
1Geological Survey of Japan, AIST, Tsukuba, Japan.
Copyright 2008 by the American Geophysical Union.
8755-1209/08/2007RG000244$15.00
Reviews of Geophysics, 46, RG4005 / 2008
1 of 31
Paper number 2007RG000244
RG4005

settings [Andres et al., 1991; Wallace, 2001; Scaillet et al.,
2003; Sharma et al., 2004]. Quantification of excess
degassing at different situation and evaluation of their
mechanisms can provide an insight into eruption processes.
[4] This paper provides an overview of the nature of
volcanic gas emission, in particular, from the viewpoint of
excess degassing, in order to discuss the magma-gas differ-
entiation process in a magma chamber-conduit system as a
controlling mechanism of volcanic and igneous activity. The
manuscript starts with brief reviews of volatile solubility
and distribution in magmas and the techniques used to
measure volcanic gas emissions. Next, examples of excess
degassing are reviewed for a variety of magma composi-
tions, eruption styles, and tectonic settings by comparing the
amount of volcanic gas, erupted magma volume, and
dissolved volatile concentrations. Excess degassing ob-
served in different situations requires different mechanisms,
and these are reviewed with their relevance to eruption
styles. Finally, an estimate of global SO2 emission rate is
discussed in order to review an integrated temporal and
spatial contribution of various degassing activity and its link
to intrusive activity.
2. VOLATILES IN MAGMAS
[5] Volatile components dissolved in silicate melt are
exsolved when their concentrations exceed their solubility,
forming a magmatic gas phase (bubbles in magma). Volatile
exsolution is caused either by decrease of volatile solubility
due to decompression or by increase of volatile concen-
trations in a melt due to crystallization [Burnham, 1967].
Since most crystals in magma can contain little volatile
components, decrease in silicate melt volume by magma
crystallization increases volatile component concentrations
in the residual melt, leading to saturation. Gas emission
occurs as the result of physical separation of magmatic gas
phase from magma. A glossary of technical terms is given
in Table 1.
[6] Water is the most abundant component in volcanic
gas, followed by CO2 and SO2 (Table 2); other components
include H2S, HCl, HF, H2, CO, N2, Ar, and He. This review
is focused on behavior of H2O, CO2, and SO2, which
commonly comprise more than 95 mol % of volcanic gases
[Symonds et al., 1994]. Volcanic gases from subduction
zone volcanoes are commonly rich in H2O (�95 mol %),
with a few exceptions of CO2-rich volcanic gases such as
those at the Eolian arc (Vulcano and Stromboli volcanoes),
Italy, and White Island, New Zealand [Giggenbach, 1996].
In contrast, at hot spots, volcanic gases are much more CO2-
rich, reflecting the CO2-rich and H2O-poor composition of
their source magmas [Giggenbach, 1996; Wallace, 2005].
2.1. Volatile Solubility in Melts
[7] Solubility of H2O and CO2 is given by simple
relationships between their partial pressure and concentra-
TABLE 1. Glossary of Volcanological Terms
Term Definition
Terms concerning degassing processMagmatic gas A gas phase exsolved from magma, consisting of H2O, CO2, SO2 and others, which are originally
dissolved in silicate melt.Volcanic gas A high-temperature magmatic gas emitted to the Earth’s surface.Volcanic plume A mixture of volcanic gas and air. Volcanic plume may also contain ash and aerosols.Degassing Emission of a gas phase from magma (magma degassing) or a volcano (volcano degassing)
as a result of volatile exsolution and bubble separation from magma.Gas phase In this text, this term refers to a phase of magmatic gas regardless of the exact phase,
including vapor, liquid or supercritical fluid phase.Gas species Chemical components composing a gas phase.Volatile (component) Gas species contained in silicate melt or crystal.Magma A mixture of silicate melt, crystals and bubbles. Composition of recently erupted
magma commonly ranges from basalt, andesite, dacite to rhyolite, with increasingsilica content and viscosity, and decreasing temperature in this order.
Melt A liquid of silicate.Bubble Magmatic gas phase distributed in magma.
Terms describing eruptionsPlinian eruption A continuous ejection of mixtures of highly vesiculated and fragmented magmas
(volcanic ash and pumice) and volcanic gases with a high velocity (100–400 m/s) andlarge discharge rates (106 to >108 kg/s); the eruption continues for several hours, discharginga large volume of material (1010 to >1013 kg [Cioni et al., 2000; Pyle, 2000]).
Vulcanian eruption An explosive eruption characterized by explosions with ballistic ejection of poorly vesiculatedblocks and bombs accompanied by shock waves in the air (a cannon-like explosion), followed bycontinuous emission of volcanic ash for a few minutes to hours [Morrissey and Mastin, 2000].
Strombolian eruption An explosive eruption characterized by the sudden ejection of gases and molten magma fragmentsup to a few hundreds meters above the vent, associated with the outburst of large bubblesascending through the molten magma column [Vergniolle and Mangan, 2000].
Lava fountain A mildly explosive eruption continuously ejecting a mixture of gases and molten magma fragmentsup to several hundreds meters height [Vergniolle and Mangan, 2000]. Lava fountains are causedby low-viscosity magmas and are commonly associated with lava flows.
Hawaiian eruption Combination of lava fountainings and lava flows. Transition of lava fountaining activity tocontinuous quiescent lava effusion is also common.
RG4005 Shinohara: EXCESS DEGASSING OF VOLCANOES
2 of 31
RG4005
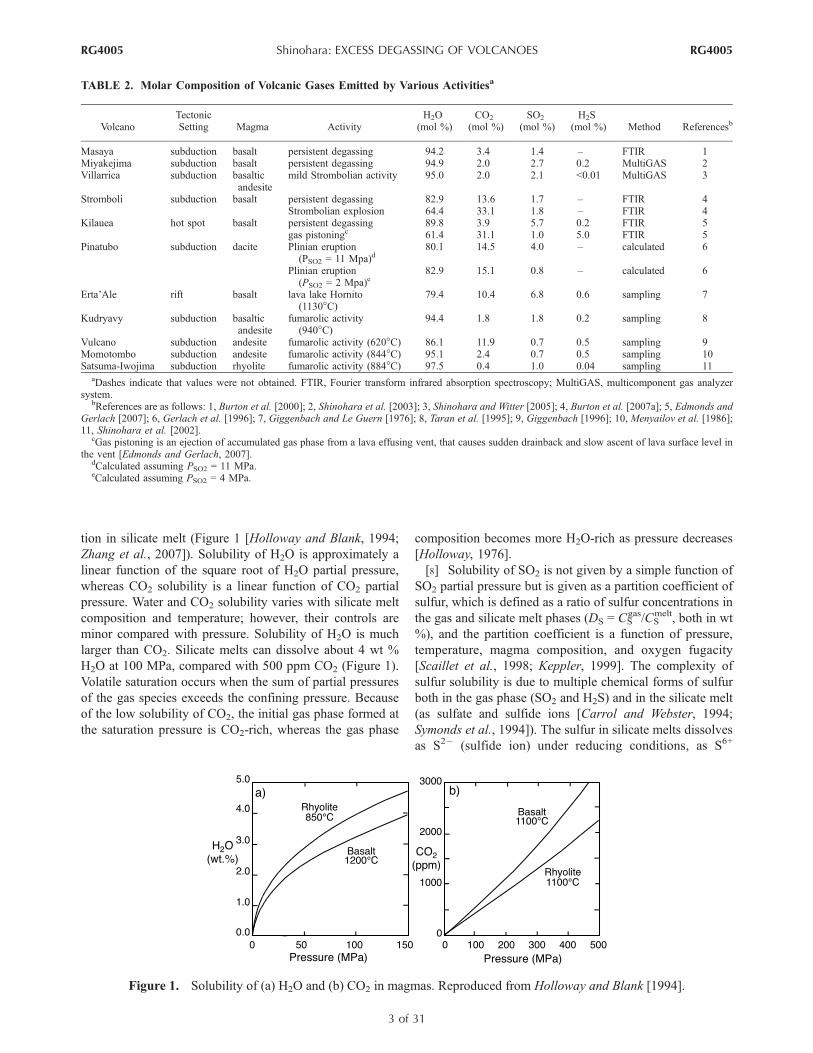
tion in silicate melt (Figure 1 [Holloway and Blank, 1994;
Zhang et al., 2007]). Solubility of H2O is approximately a
linear function of the square root of H2O partial pressure,
whereas CO2 solubility is a linear function of CO2 partial
pressure. Water and CO2 solubility varies with silicate melt
composition and temperature; however, their controls are
minor compared with pressure. Solubility of H2O is much
larger than CO2. Silicate melts can dissolve about 4 wt %
H2O at 100 MPa, compared with 500 ppm CO2 (Figure 1).
Volatile saturation occurs when the sum of partial pressures
of the gas species exceeds the confining pressure. Because
of the low solubility of CO2, the initial gas phase formed at
the saturation pressure is CO2-rich, whereas the gas phase
composition becomes more H2O-rich as pressure decreases
[Holloway, 1976].
[8] Solubility of SO2 is not given by a simple function of
SO2 partial pressure but is given as a partition coefficient of
sulfur, which is defined as a ratio of sulfur concentrations in
the gas and silicate melt phases (DS = CSgas/CS
melt, both in wt
%), and the partition coefficient is a function of pressure,
temperature, magma composition, and oxygen fugacity
[Scaillet et al., 1998; Keppler, 1999]. The complexity of
sulfur solubility is due to multiple chemical forms of sulfur
both in the gas phase (SO2 and H2S) and in the silicate melt
(as sulfate and sulfide ions [Carrol and Webster, 1994;
Symonds et al., 1994]). The sulfur in silicate melts dissolves
as S2� (sulfide ion) under reducing conditions, as S6+
TABLE 2. Molar Composition of Volcanic Gases Emitted by Various Activitiesa
VolcanoTectonicSetting Magma Activity
H2O(mol %)
CO2
(mol %)SO2
(mol %)H2S
(mol %) Method Referencesb
Masaya subduction basalt persistent degassing 94.2 3.4 1.4 – FTIR 1Miyakejima subduction basalt persistent degassing 94.9 2.0 2.7 0.2 MultiGAS 2Villarrica subduction basaltic
andesitemild Strombolian activity 95.0 2.0 2.1 <0.01 MultiGAS 3
Stromboli subduction basalt persistent degassing 82.9 13.6 1.7 – FTIR 4Strombolian explosion 64.4 33.1 1.8 – FTIR 4
Kilauea hot spot basalt persistent degassing 89.8 3.9 5.7 0.2 FTIR 5gas pistoningc 61.4 31.1 1.0 5.0 FTIR 5
Pinatubo subduction dacite Plinian eruption(PSO2 = 11 Mpa)d
80.1 14.5 4.0 – calculated 6
Plinian eruption(PSO2 = 2 Mpa)e
82.9 15.1 0.8 – calculated 6
Erta’Ale rift basalt lava lake Hornito(1130�C)
79.4 10.4 6.8 0.6 sampling 7
Kudryavy subduction basalticandesite
fumarolic activity(940�C)
94.4 1.8 1.8 0.2 sampling 8
Vulcano subduction andesite fumarolic activity (620�C) 86.1 11.9 0.7 0.5 sampling 9Momotombo subduction andesite fumarolic activity (844�C) 95.1 2.4 0.7 0.5 sampling 10Satsuma-Iwojima subduction rhyolite fumarolic activity (884�C) 97.5 0.4 1.0 0.04 sampling 11
aDashes indicate that values were not obtained. FTIR, Fourier transform infrared absorption spectroscopy; MultiGAS, multicomponent gas analyzersystem.
bReferences are as follows: 1, Burton et al. [2000]; 2, Shinohara et al. [2003]; 3, Shinohara and Witter [2005]; 4, Burton et al. [2007a]; 5, Edmonds andGerlach [2007]; 6, Gerlach et al. [1996]; 7, Giggenbach and Le Guern [1976]; 8, Taran et al. [1995]; 9, Giggenbach [1996]; 10, Menyailov et al. [1986];11, Shinohara et al. [2002].
cGas pistoning is an ejection of accumulated gas phase from a lava effusing vent, that causes sudden drainback and slow ascent of lava surface level inthe vent [Edmonds and Gerlach, 2007].
dCalculated assuming PSO2 = 11 MPa.eCalculated assuming PSO2 = 4 MPa.
Figure 1. Solubility of (a) H2O and (b) CO2 in magmas. Reproduced from Holloway and Blank [1994].
RG4005 Shinohara: EXCESS DEGASSING OF VOLCANOES
3 of 31
RG4005

(sulfate ion) under oxidizing conditions, and as their mix-
ture under intermediate conditions [Carrol and Webster,
1994]. Experimental studies reveal that sulfur can strongly
partition into the gas phase relative to rhyolitic or dacitic
melt (with DS > 100) under magma chamber conditions
[Keppler, 1999; Scaillet et al., 1998].
[9] The complexity of sulfur solubility also arises from
the solubility of sulfur-bearing phases in a silicate melt.
Sulfide (e.g., pyrrhotite, Fe1-XS), sulfate (e.g., anhydrite,
CaSO4), and immiscible Fe-S-O liquid are not uncommon
in magmas [Luhr et al., 1984; Hattori, 1996; Larocque et
al., 2000]. The dissolved sulfur concentration in silicate
melt coexisting with sulfide or sulfate minerals is controlled
by mineral solubility. Sulfur concentration in sulfide-satu-
rated melts increases with temperature and cation contents,
in particular of iron [O’Neill and Mavrogenes, 2002; Liu et
al., 2007]. The dissolved sulfur concentration in anhydrite-
saturated melts is much higher than that in sulfide-saturated
melts under the same pressure-temperature condition [Carrol
and Rutherford, 1985; Luhr, 1990].
2.2. Volatile Concentrations in Magmas
[10] Dissolved volatile concentrations in magmas are
typically estimated by analysis of silicate melt inclusions.
Melt inclusions are tiny beads of silicate melt trapped in
phenocrysts during crystal growth that solidify to glass
during rapid cooling after eruption (Figure 2 [Lowenstern,
1995; Wallace, 2005]). Their composition represents that of
the silicate melts at the time of entrapment. Erupted magmas
lose their volatiles because of degassing during eruption,
but silicate melt inclusions can maintain their original
dissolved volatile concentrations because their rigid host
crystal serves as a pressure vessel to keep the trapped melt
at high pressure even during decompression. Silicate melt
inclusions are commonly small (a few to a few hundreds of
mm in diameter) and must be analyzed by microbeam
analytical techniques, such as electron probe microanalyzer,
secondary ion mass spectrometry, Raman spectrometry, or
microbeam infrared (IR) spectroscopy for the analyses of
Figure 2. Melt inclusions. (a) A photomicrograph ofrhyolitic melt inclusions in a plagioclase phenocryst frompumice of Satsuma-Iwojima volcano, Japan. (b) A back-scattered electron image of basaltic melt inclusions in anolivine phenocryst of volcanic bombs from Miyakejimavolcano, Japan (photographs courtesy of G. Saito).
Figure 3. H2O-CO2 concentrations in melt inclusions from subduction zone basalts, modified fromWallace [2005], copyright 2005, with permission from Elsevier. Data shown for Cerro Negro[Roggensack et al., 1997], Fuego [Roggensack, 2001], Guatemalan volcanoes behind the volcanic front(BVF [Walker et al., 2003]), the Trans-Mexican Volcanic Belt [Luhr, 2001; Cervantes and Wallace,2003a, 2003b], Stromboli [Metrich et al., 2001], and Galunggung [Sisson and Bronto, 1998]; shown forcomparison are the primary CO2 concentrations of normal mid-ocean ridge basalt (NMORB) [Marty andTolstikhin, 1998] and enriched mid-ocean ridge basalt (EMORB) [Hekinian et al., 2000] magmas,Kilauea basaltic magmas [Gerlach et al., 2002], and Reunion basaltic magma [Bureau et al., 1999]. Gassaturation isobars are shown for 200 and 500 MPa pressure with red dashed curves, dotted curves showcomposition (CO2 mole fraction) of a gas phase equilibrated with the melt, and dashed-dotted curve witharrows is shown for closed system degassing trend for magma with 5 wt % H2O and 7000 ppm CO2
(calculated using Newman and Lowenstern [2002]).
RG4005 Shinohara: EXCESS DEGASSING OF VOLCANOES
4 of 31
RG4005

volatile components [Ihinger et al., 1994; Lowenstern,
1995; Di Muro et al., 2006].
[11] Water is the most abundant volatile component in
most magma types. Subduction zone magmas are H2O-rich
with a wide range from <1 to >10 wt % but commonly
ranging from 2 to 6 wt %; this is much larger than in hot
spot basalts or mid-ocean ridge basalts (Figure 3 [Scaillet et
al., 2003; Wallace, 2005]). Water concentrations in silicate
melt of subduction zone magmas do not show any general
relationship with magma compositions that range from
basalt to rhyolite [Wallace, 2005]. Carbon dioxide concen-
trations in subduction zone magmas are much lower than
H2O, with a maximum of 2500 ppm in basaltic magmas and
500 ppm in more silicic magmas in many cases [Wallace,
2005]. Saturation pressure estimated from H2O and CO2
concentrations ranges 200–500 MPa for basaltic magmas
(Figure 3) and 100–250 MPa for dacitic or rhyolitic
magmas, and these pressure ranges are consistent with
probable depth ranges of magma crystallization in the crust.
The agreement of the volatile saturation pressure and actual
pressure implies that the melt inclusions were trapped under
gas phase saturated conditions, and these inclusions may
have lost part of their original CO2 into CO2-rich bubbles
before melt inclusion entrapment [Wallace, 2005].
[12] Sulfur concentrations in melt inclusions show large
variation with decreasing sulfur concentration as silica
content increases, from >1000 ppm in basaltic magmas to
<100 ppm in rhyolitic magmas (Figure 4 [Devine et al.,
1984; Wallace, 2005]). Similar sulfur concentrations are
observed in magmas with similar magma composition
regardless of tectonic setting, indicating that the variation
is not due to magma source differences but is caused by
later differentiation. The sulfur concentration variation in
melt inclusions is commonly consistent with sulfide solu-
bility [Wallace and Carmichael, 1992; Wallace, 2005],
suggesting that sulfur concentrations in silicate melts are
controlled by sulfide solubility. Solubility of sulfide miner-
als in silicate melts increases with temperature and cation
content, in particular of iron [Liu et al., 2007], both of
which decrease during magma differentiation. Magmatic
sulfides are not ubiquitous but are common although minor
in volcanic rocks [Larocque et al., 2000]. Therefore the
sulfur concentration variation could be caused by sulfide
precipitation from magmas (Figure 4 [Devine et al., 1984;
Wallace, 2005]). Another possible sink of sulfur is a gas
phase. Since melt inclusions are likely to be trapped under
gas phase saturated conditions (Figure 3) and a large sulfur
partition coefficient can be attained under certain condi-
tions, a significant amount of sulfur can be contained in a
vapor phase under magma chamber conditions. Conditions
of melt inclusions entrapment are quite variable, in partic-
ular under different tectonic settings (Figure 3), and sulfur
loss to a gas phase under such variable conditions cannot
create the simple relationship between sulfur content and
silica content (Figure 4).
3. MEASUREMENTS OF VOLCANIC GAS EMISSION
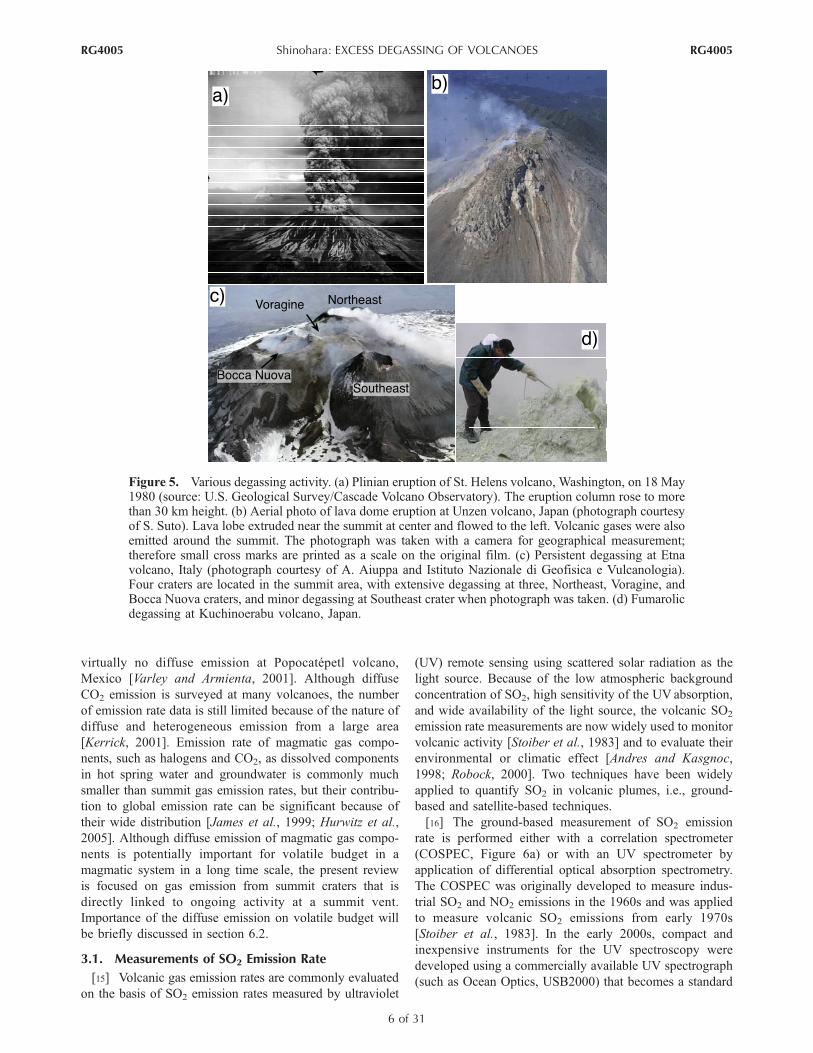
[13] Volcanic gases are emitted during eruptions, contin-
uous degassing from eruptive vents (persistent degassing),
and fumarolic activity (Figure 5). Only the latter is easily
sampled, and most volcanic gas studies have been focused
on gas compositions obtained by direct sampling from
fumaroles and chemical analyses [Symonds et al., 1994;
Giggenbach, 1996]. However, the amount of volcanic gases
emitted by fumarolic activity is commonly minor compared
to that emitted by eruption and persistent degassing, and
quantification of these emissions is more important than
quantification of those from fumaroles. The volcanic gases
emitted from eruptive vents immediately mix with the air at
the exit, forming a volcanic plume, and direct sampling
methods are not applicable to those situations. Measurement
of volcanic plumes became possible by the recent develop-
ment of remote sensing techniques [Stoiber et al., 1983;
McGonigle and Oppenheimer, 2003].
[14] In addition to volcanic gas emission from summit
craters, magmatic gas components are discharged by diffuse
emission from the flanks of volcanoes through soil gas, hot
spring water, and groundwater. Diffuse emission of mag-
matic CO2 gases through soils or faults are observed at
many volcanoes. Contribution of the diffuse CO2 emission
to total emission from an actively degassing volcano is
variable, ranging from an equal contribution to the summit
emission at Etna volcano, Italy [Allard et al., 1991], to
Figure 4. Variation of sulfur concentration with SiO2
content in melt inclusions. Melt inclusions from differenttectonic settings are shown by different symbols. A generaltrend is shown by a yellow shaded curve, which isconsistent with sulfide saturation [Liu et al., 2007]. Dataare taken from following references: Anderson et al. [1989],Bertagnini et al. [2003], Cervantes and Wallace [2003a,2003b], Clague et al. [1995], Devine et al. [1984], Gerlachet al. [1994], Gurenko et al. [2005], Harris and Anderson[1984], Hauri [2002], Luhr [2001], Matthews et al. [1999],Michaud et al. [2000], Palais and Sigurdsson [1989],Roggensack et al. [1996, 1997], Roggensack [2001], Saitoet al. [2001, 2005], Satoh et al. [2003], Self and King[1996], Sigurdsson et al. [1990a], Sisson and Bronto [1998],Sisson and Layne [1993], Stix et al. [2003], Thordarson etal. [1996],Wade et al. [2006],Walker et al. [2003],Westrichand Gerlach [1992], and Witter et al. [2004, 2005].
RG4005 Shinohara: EXCESS DEGASSING OF VOLCANOES
5 of 31
RG4005
virtually no diffuse emission at Popocatepetl volcano,
Mexico [Varley and Armienta, 2001]. Although diffuse
CO2 emission is surveyed at many volcanoes, the number
of emission rate data is still limited because of the nature of
diffuse and heterogeneous emission from a large area
[Kerrick, 2001]. Emission rate of magmatic gas compo-
nents, such as halogens and CO2, as dissolved components
in hot spring water and groundwater is commonly much
smaller than summit gas emission rates, but their contribu-
tion to global emission rate can be significant because of
their wide distribution [James et al., 1999; Hurwitz et al.,
2005]. Although diffuse emission of magmatic gas compo-
nents is potentially important for volatile budget in a
magmatic system in a long time scale, the present review
is focused on gas emission from summit craters that is
directly linked to ongoing activity at a summit vent.
Importance of the diffuse emission on volatile budget will
be briefly discussed in section 6.2.
3.1. Measurements of SO2 Emission Rate
[15] Volcanic gas emission rates are commonly evaluated
on the basis of SO2 emission rates measured by ultraviolet
(UV) remote sensing using scattered solar radiation as the
light source. Because of the low atmospheric background
concentration of SO2, high sensitivity of the UV absorption,
and wide availability of the light source, the volcanic SO2
emission rate measurements are now widely used to monitor
volcanic activity [Stoiber et al., 1983] and to evaluate their
environmental or climatic effect [Andres and Kasgnoc,
1998; Robock, 2000]. Two techniques have been widely
applied to quantify SO2 in volcanic plumes, i.e., ground-
based and satellite-based techniques.
[16] The ground-based measurement of SO2 emission
rate is performed either with a correlation spectrometer
(COSPEC, Figure 6a) or with an UV spectrometer by
application of differential optical absorption spectrometry.
The COSPEC was originally developed to measure indus-
trial SO2 and NO2 emissions in the 1960s and was applied
to measure volcanic SO2 emissions from early 1970s
[Stoiber et al., 1983]. In the early 2000s, compact and
inexpensive instruments for the UV spectroscopy were
developed using a commercially available UV spectrograph
(such as Ocean Optics, USB2000) that becomes a standard
Figure 5. Various degassing activity. (a) Plinian eruption of St. Helens volcano, Washington, on 18 May1980 (source: U.S. Geological Survey/Cascade Volcano Observatory). The eruption column rose to morethan 30 km height. (b) Aerial photo of lava dome eruption at Unzen volcano, Japan (photograph courtesyof S. Suto). Lava lobe extruded near the summit at center and flowed to the left. Volcanic gases were alsoemitted around the summit. The photograph was taken with a camera for geographical measurement;therefore small cross marks are printed as a scale on the original film. (c) Persistent degassing at Etnavolcano, Italy (photograph courtesy of A. Aiuppa and Istituto Nazionale di Geofisica e Vulcanologia).Four craters are located in the summit area, with extensive degassing at three, Northeast, Voragine, andBocca Nuova craters, and minor degassing at Southeast crater when photograph was taken. (d) Fumarolicdegassing at Kuchinoerabu volcano, Japan.
RG4005 Shinohara: EXCESS DEGASSING OF VOLCANOES
6 of 31
RG4005
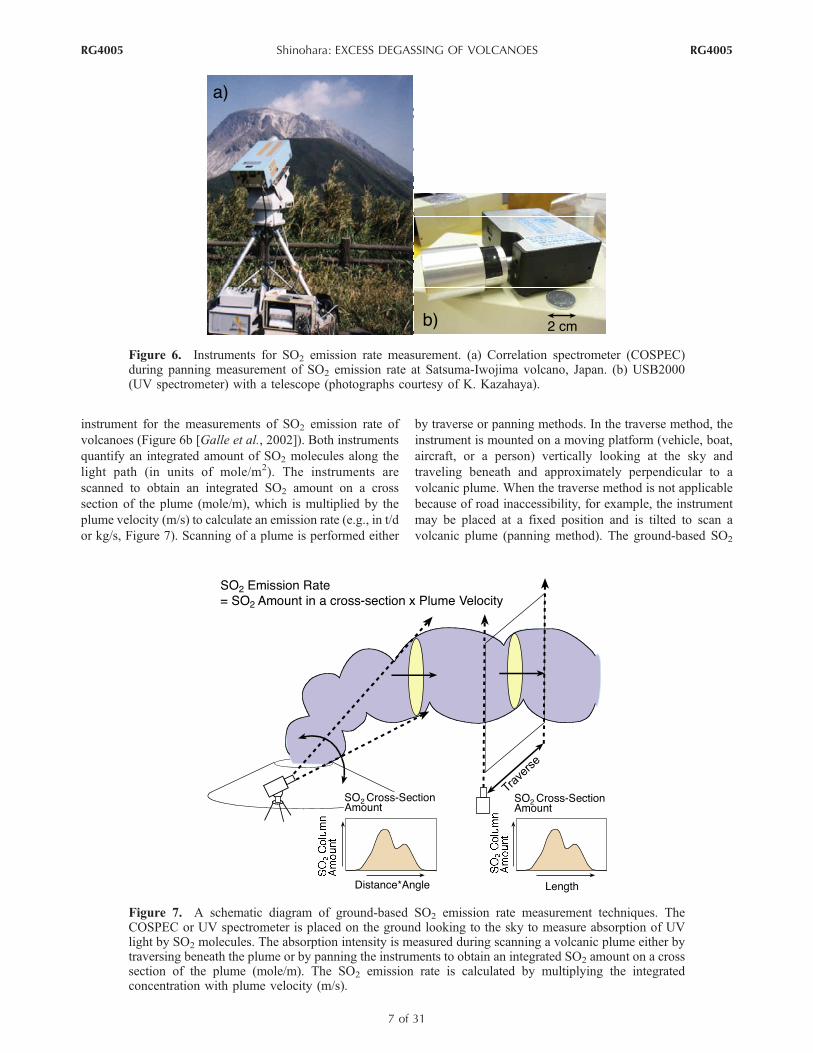
instrument for the measurements of SO2 emission rate of
volcanoes (Figure 6b [Galle et al., 2002]). Both instruments
quantify an integrated amount of SO2 molecules along the
light path (in units of mole/m2). The instruments are
scanned to obtain an integrated SO2 amount on a cross
section of the plume (mole/m), which is multiplied by the
plume velocity (m/s) to calculate an emission rate (e.g., in t/d
or kg/s, Figure 7). Scanning of a plume is performed either
by traverse or panning methods. In the traverse method, the
instrument is mounted on a moving platform (vehicle, boat,
aircraft, or a person) vertically looking at the sky and
traveling beneath and approximately perpendicular to a
volcanic plume. When the traverse method is not applicable
because of road inaccessibility, for example, the instrument
may be placed at a fixed position and is tilted to scan a
volcanic plume (panning method). The ground-based SO2
Figure 7. A schematic diagram of ground-based SO2 emission rate measurement techniques. TheCOSPEC or UV spectrometer is placed on the ground looking to the sky to measure absorption of UVlight by SO2 molecules. The absorption intensity is measured during scanning a volcanic plume either bytraversing beneath the plume or by panning the instruments to obtain an integrated SO2 amount on a crosssection of the plume (mole/m). The SO2 emission rate is calculated by multiplying the integratedconcentration with plume velocity (m/s).
Figure 6. Instruments for SO2 emission rate measurement. (a) Correlation spectrometer (COSPEC)during panning measurement of SO2 emission rate at Satsuma-Iwojima volcano, Japan. (b) USB2000(UV spectrometer) with a telescope (photographs courtesy of K. Kazahaya).
RG4005 Shinohara: EXCESS DEGASSING OF VOLCANOES
7 of 31
RG4005

emission rate measurement is now considered to be the
standard technique of volcano monitoring and has been
repeatedly performed at numerous volcanoes [Symonds et
al., 1994].
[17] Yields of SO2 emitted by large volcanic eruptions are
measured by satellite-based UV spectrometry, such as with
Total Ozone Mapping Spectrometer (TOMS) and Ozone
Monitoring Instrument (OMI). The TOMS and OMI are
spatially scanning UV spectrometers designed to monitor
ozone structure in the Earth’s atmosphere by measuring UV
absorption of the reflected sunlight of the Earth’s surface at
several windows. Since a few reference bands for the ozone
measurements overlap with absorption bands of SO2, these
instruments can also be used for mapping of SO2 in the
atmosphere (Figure 8 [Krueger et al., 1995, 2000]). The
ability to measure volcanic SO2 clouds was recognized
during the eruption of El Chichon volcano, Mexico, in
1982 during operation of TOMS (Figure 8 [Krueger,
1983]); this led to development of a new algorithm to
separately determine both ozone and SO2 in volcanic
clouds, resulting in the large database of SO2 emissions
from eruptions since 1978 [Krueger et al., 2000].
[18] TOMS and OMI instruments give daily snapshots of
SO2 distribution in the atmosphere, and the amount of
discharged SO2 during the previous day can be estimated
from their difference. Therefore, it provides a direct estimate
of SO2 emission by a discrete explosive eruption during a
short period (e.g., a few hours). The great advantage of
TOMS and OMI instruments is almost continuous daily
coverage of global volcanic SO2 emissions. TOMS provided
the global volcanic SO2 emission data since 1978, except
for a gap in 1994–1996 (Figure 9 [Bluth et al., 1993; Carn
et al., 2003]). Since 2004, a new satellite sensor, OMI,
measures the SO2 emission, and TOMS ceased operation at
the end of 2005 [Krotkov et al., 2006]. The OMI has a
higher sensitivity and special resolution than TOMS with
two orders of magnitude improvement in the detection limit
(7000 tons of SO2 by TOMS and 47 tons by OMI [Krotkov
et al., 2006]). Emissions by continuous and repeated erup-
tions, however, need to be quantified by modeling SO2
cloud transportation and dissipation, since the amount of
SO2 in the atmosphere decreases with time by conversion to
H2SO4, and the conversion rates are variable, ranging from
less than 10%/d in the stratosphere to 50%/d in the tropo-
spheric clouds [Krueger et al., 1995]. The TOMS SO2
algorithm was designed for stratospheric measurements;
quantification of SO2 in the lower troposphere is more
difficult and includes larger errors [Symonds et al., 1994;
Krueger et al., 1995]. Therefore TOMS could not quantify
SO2 emissions from continuously degassing volcanoes,
whereas improvement of the OMI algorithm permits meas-
urements of continuous SO2 emissions in the lower tropo-
sphere [Krotkov et al., 2006].
[19] Hydrogen sulfide is another major sulfur species in
volcanic gas, but it is not measured by the UV remote
sensing techniques. Concentration of H2S in high-
temperature fumarolic gases is commonly less than that of
SO2 (Table 2). The H2S/SO2 ratio in a gas phase is a
function of temperature, pressure, and oxygen fugacity
and increases almost proportionally with pressure under a
given temperature and oxygen fugacity; a gas phase derived
from a high-pressure condition has a much higher H2S/SO2
ratio than the fumarolic gas equilibrated at atmospheric
pressure [Giggenbach, 1987; Burgisser and Scaillet,
Figure 8. An example of the SO2 cloud images obtained by Total Ozone Mapping Spectrometer(TOMS). The SO2 cloud was produced by the 4–5 April 1982 eruption of El Chichon volcano, Mexico,after drifting for 4 days at 25 km altitude. This cloud contained about 7 million tons of SO2. Cited fromKrueger et al. [2000].
RG4005 Shinohara: EXCESS DEGASSING OF VOLCANOES
8 of 31
RG4005

2007]. Volcanic gas emitted during gas-pistoning activity at
Kilauea volcano has a high H2S/SO2 ratio (Table 2) that is
attributed to the high-pressure origin of the gas [Edmonds
and Gerlach, 2007]. Therefore, an eruption may discharge a
significant amount of H2S because of the higher-pressure
origin of the gas phase than fumarolic gases. The H2S gas,
however, is rapidly oxidized to SO2 in the atmosphere with
a lifetime of approximately 1 day [Graedel, 1977] and can
be detected as SO2 by the satellite remote sensing. Bluth et
al. [1995] observed an increase in the daily SO2 amounts in
the eruption clouds followed by eruptions of Mount Spurr,
USA, and interpreted the increase as the results of gradual
oxidation of H2S discharged by the eruption. The SO2
amount measured by TOMS and OMI includes contribu-
tions from SO2 and H2S, but their relative contributions
could not be estimated in most cases.
[20] Large amounts of volatile compounds are commonly
trapped on fresh volcanic ash as water-soluble components,
such as CaSO4, NaCl, and absorbed acid gases [Taylor and
Stoiber, 1973; Rose, 1977]. Sulfur concentrations of the
water-soluble components are commonly 0.1 wt % and
exceed 1 wt % in some cases. Therefore, the emission of
sulfur compounds as water-soluble sulfur components dur-
ing eruptions is significant in comparison with the SO2
emission detected by TOMS. Contribution of the water-
soluble components to the total sulfur emission is estimated
to range 30–50% for several large explosive eruptions, such
as at Mount Saint Helens in 1980 [Gerlach and McGee,
1994], El Chichon in 1982 [Luhr et al., 1984], and Galung-
gung in 1982–1983 [de Hoog et al., 2001]. Water-soluble
components will not be preserved after rains, and their
analyses are not always available. Because of the scarce
data set, emission of sulfur compounds trapped on volcanic
ash will not be considered in the rest of this manuscript, and
sulfur emissions by eruption will be evaluated on the basis
of the SO2 emission estimates by TOMS, which should be
regarded as a minimum estimate.
[21] Sulfur yields emitted by large eruptions in the past
can be estimated from the analysis of ice cores from
Greenland and Antarctica [Delmas, 1992; Hammer et al.,
1980; Zielinski, 1995; Robock, 2000]. Sulfur gases (SO2 +
H2S) injected by large volcanic eruptions into the strato-
sphere will convert to sulfate aerosols that eventually fall to
Earth and are deposited within the record of glacial ice. The
ice provides annual to subannual resolution for more than
10,000 years and can be compared to geological or histor-
ical eruption records. The volcanic sulfate loadings can be
estimated by modeling transport of volcanic aerosols in the
stratosphere from the eruption locality. For example,
80 peaks of sulfate concentration were measured in core
of the Greenland ice sheet over the last 2,100 years,
permitting estimation of sulfur yields from a variety of
identifiable eruptions [Zielinski, 1995].
3.2. Measurements of Volcanic Gas Composition
[22] Quantification of more abundant H2O and CO2 in
volcanic plumes is as important as the SO2 emission rate
measurements. Volcanic gas composition data can provide
information not only about the amount degassed but also
about volatile composition of magma and its degassing
conditions. Since a volcanic plume is a mixture of volcanic
gas and air, the volcanic gas composition can be estimated
by determining the composition of the volcanic plume and
subtracting the background air composition. Volcanic plume
composition is measured either by Fourier transform infra-
red absorption spectroscopy (FTIR) or by analytical instru-
ments after sampling the air in the plume.
[23] Various components in volcanic gases, including
H2O, CO2, SO2, HCl, HF, CO, and others, have sensitive
Figure 9. The SO2 masses observed with TOMS. Red bars show eruptions at subduction zonevolcanoes (Arc), and blue bars show eruptions at divergent plate boundaries or hot spot volcanoes (Non-arc). Large or well-known eruptions are labeled. Cited from web site of TOMS Volcanic EmissionGroups (http://toms.umbc.edu/) with permission from S. Carn.
RG4005 Shinohara: EXCESS DEGASSING OF VOLCANOES
9 of 31
RG4005

absorption bands in the IR and can be quantified by IR
absorption spectroscopy [Mori and Notsu, 1997]. FTIR
measurements require an IR light source, such as the Sun,
an IR lamp, or natural hot materials such as hot lavas
[McGonigle and Oppenheimer, 2003]. The FTIR can quan-
tify H2O and CO2 concentration in a plume, but their
measurements are limited in number because of the large
and noisy backgrounds of these components (in particular,
H2O) in the atmosphere. In order to estimate volcanic H2O
and CO2, the measurements need to be conducted near the
degassing vent to minimize the atmospheric H2O and CO2
[Burton et al., 2000, 2007a; Edmonds and Gerlach, 2007].
[24] Volcanic plume compositions are also measured with
analytical instruments after sampling the air in the plume.
By flying through the eruptive plume, atmospheric studies
of volcanic emissions have been conducted with various
bulky instruments, such as gas chromatography, flame
photometric detector, or filter samplers of acid gases and
particles, to detect various trace components such as SO2,
H2S, NO, O3, and aerosols [Friend et al., 1982; Martin et
al., 1986]. Because of the high CO2 atmospheric back-
ground, quantification of volcanic CO2 in the plume
requires precise measurements of CO2 concentration near
degassing sources prior to significant dilution. Measurement
of volcanic plume CO2 emission was realized by application
of IR spectrophotometer to airborne measurement during
the Mount Saint Helens eruptions [Harris et al., 1981] and
was applied to other volcanoes [Gerlach et al., 1997;
Gerlach and McGee, 1998; McGee et al., 2001].
[25] Another approach to measure volcanic plume com-
position is to bring portable gas analyzers to the rim of a
degassing vent to measure concentration of volcanic gas
species in a concentrated plume. Near-vent measurement is
necessary to obtain volcanic gas composition including H2O
by quantifying volcanic H2O concentrations high enough to
discriminate them from the large background fluctuation. A
portable multicomponent gas analyzer system (MultiGAS)
was developed to facilitate the near-vent volcanic plume
measurements by combining several gas analyzers into a
handy package [Aiuppa et al., 2005; Shinohara, 2005]. The
MultiGAS consists of several portable gas analyzers, such
as a portable IR spectrometer for H2O and CO2, electro-
chemical sensors for SO2 and H2S, and a H2 semiconductor
sensor, to obtain concentration ratios of these species
[Shinohara, 2006]. The MultiGAS weighs less than several
kg and allows easy deployment at the volcano summit and
thus close to the degassing vent.
[26] Table 2 lists available volcanic gas composition data
measured during eruptions and persistent degassing activity,
together with calculated compositions of gases emitted
during Plinian explosive eruption, plus a few representative
fumarolic gas compositions. There are many other compo-
sitional data of volcanic gases emitted during eruptions and
persistent degassing such as SO2/HCl or CO2/SO2 ratios,
but the compositional data with H2O concentration are still
limited. All data indicate that H2O is the dominant species
regardless of tectonic settings and styles of degassing
activity. Compositions of the gases emitted during persistent
degassing are similar to that of fumarolic gas obtained from
volcanoes in a similar tectonic setting.
4. EXCESS DEGASSING
[27] The amount of SO2 emitted during eruptions and
persistent degassing will be compared with the amount of
dissolved sulfur in the erupted magma to evaluate occur-
rence and degree of excess degassing. The amount of
volcanic gases derived from dissolved volatiles in erupted
magmas is calculated as
Mgas ¼ Mmagma CMI � CMGð ÞFmelt; ð1Þ
where Mgas and Mmagma are masses of the volcanic gases
and magmas, CMI and CMG are concentrations (in mass
fraction) of the volatile component in a preeruptive melt
(melt inclusion) and in a posteruptive melt (matrix glass),
and Fmelt is a silicate melt mass fraction of a magma.
Mmagma is estimated on the basis of volume measurement of
lavas and tephra deposits by geological surveys, whose
accuracy depends on availability of outcrops. This method
is referred to as the petrological method and was developed
for estimation of volcanic S and Cl discharges associated
with large eruptions in the past, to evaluate the impact of
volcanic eruptions on climate change [Devine et al., 1984;
Palais and Sigurdsson, 1989]. The petrological method,
however, often resulted in SO2 yields lower than estimates
based on measurements of the discharged sulfur, using
methods such as COSPEC, TOMS, or ice core analyses
(Table 3 and Figure 10 [Wallace, 2001; Scaillet et al.,
2003]). Though excess degassing is estimated through the
SO2 yields, volcanic gases are commonly dominated by
H2O and CO2 (Table 2), so that excess degassing would
imply not only excess of sulfur but also of those other
volcanic gas species.
4.1. SO2 Emission by Eruptions
[28] Volcanic eruptions are always associated with gas
emissions, but emission styles of gases and magmas are
variable depending on eruption styles (Table 1). The SO2
emission by eruption is commonly in excess of the dis-
solved sulfur amount in the erupted magma, but the degree
of excess is variable depending on tectonic setting, eruption
style, and magma composition (Table 3 and Figure 10). In
the compilation, the explosive and effusive eruptions were
distinguished on the basis of SO2 emission data sources;
eruptions measured by TOMS or ice core records are
categorized as ‘‘explosive,’’ and the others measured by
ground-based UV spectroscopy are categorized as
‘‘effusive’’ (Table 3).
4.1.1. SO2 Emission by Explosive Eruptions[29] Plinian and Vulcanian eruptions are accompanied by
a large degree of excess degassing (Figure 10 [Wallace,
2001; Scaillet et al., 2003]). The degree of excess degassing
is measured by the ratio of the measured SO2 yields to the
petrological estimate; this is variable depending on magma
composition, ranging from 10 to 100 for dacitic and
rhyolitic eruptions, 1 to 30 for andesitic eruptions, and
RG4005 Shinohara: EXCESS DEGASSING OF VOLCANOES
10 of 31
RG4005

1 to 10 for basaltic eruptions (Figure 10). Excess degass-
ing by explosive eruption was first quantified for the
eruption of El Chichon, Mexico, in 1982, that discharged
7 Mt of SO2 and 840 Mt of magma [Bluth et al., 1997;
Varekamp et al., 1984]; this corresponds to 0.8 wt % SO2
in bulk magma, exceeding the SO2 concentrations in melt
inclusions (<0.1 wt % SO2 [Luhr et al., 1984]). The large
excess SO2 degassing estimated for the 1982 El Chichon
eruption was first considered to be an unusual example;
however, accumulation of TOMS data revealed that such
excess SO2 degassing is in fact a common feature of
explosive eruptions, in particular for silicic magmas at
subduction zones [Wallace, 2001; Scaillet et al., 2003].
[30] Basaltic explosive eruptions at rifts and hot spots do
not show significant excess degassing (Figure 10 [Wallace,
2001; Scaillet et al., 2003; Sharma et al., 2004]). Basaltic
TABLE 3. Comparison of the Measured SO2 Emissions With Petrological Estimatesa
Volcano Age Magma
S inMelt
Inclusion(ppm)
S in MatrixGlass(ppm)
DS(ppm)
EruptedMagma
Mass (Mt)
Petrological Estimateof SO2 Emission
(Mt)
MeasuredSO2 Emission
(Mt) Method Referencesb
Nonsubduction Zone VolcanoesExplosive eruptions
Hekla 2000 basalt 900 310 590 411 0.48 0.10 TOMS 1Mauna Loa 1984 basalt 1,010 160 850 506 0.86 1.00 TOMS 1Krafla 1984 basalt 1,590 490 1,100 295 0.65 0.40 TOMS 1Hekla 1980 basalt 910 340 570 322 0.37 0.50 TOMS 1Laki 1783 basalt 1,675 205 1,470 41,525 122* 130 AT 2, 3
28, 66 IC 4, 5Eldgja 934 basalt 2,150 100 2,050 53,900 220* 110 IC 5, 6
40 IC 4Hekla 1104 dacite 71 10 61 1,250 0.15 20 IC 4, 7
Effusive eruptionKilauea 1992–1997 basalt 1,000 250 750 2,079 3.1 4.0 COSPEC 8
Subduction Zone VolcanoesExplosive eruptions
Chikurachki 1986 basalt 2,900 350 2,550 100 0.51 0.70 TOMS 9, 10Galunggung 1982–1983 bas-and 200 100 100 550 0.11 0.80 TOMS 9, 11Agung 1963 bas-and 1,000 70 930 1,625 2.5* 7.0 OD 12Redoubt 1989–1990 andesite 500 80 420 35 0.021* 0.18 TOMS 9, 13Ruiz 1985 andesite 700 50 650 70 0.091 0.7 TOMS 9, 14, 15El Chichon 1982 trach-and 186 156 30 2,900 0.17 7.0 TOMS 7, 16, 17Bezymianny 1956 andesite 514 47 467 2,500 2.4 7.2 IC 4, 18, 19Tambora 1815 phonolite 689 290 399 81,000 55* 70 IC 4, 20Pinatubo 1991 dacite 80 60 20 12,500 0.28* 20 TOMS 9, 21Mt. St. Helens 1980 dacite 68 25 43 1,150 0.08* 1.0 TOMS 9, 22Katmai 1912 rhyolite 170 65 105 28,000 2.0* 26 IC 4, 23Santa Maria 1902 dacite 198 108 90 20,400 3.7 27 IC 4, 18, 19Krakatau 1885 rhyodacite 200 100 100 28,524 5.6* 38 IC 4, 24Huaynaputina 1600 dacite 264 80 184 12,500 5 48 IC 25, 26Mt. St. Helens 1480 dacite 71 38 33 2,300 0.15 15 IC 4, 18, 19Taupo 181 rhyolite 46 38 8 80,500 1.3 16 IC 4, 18, 19Minoan 1645 B.C. rhyodacite 100 35 65 84,000 10.9 125 IC 27, 28
Effusive eruptionsArenal 1985–1996 bas-and 1,000 100 900 1,240 1.1* 1.3 COSPEC 29, 30Soufriere Hills 1995–1998 andesite 46 70 46 690 0.063 0.70 COSPEC 31Lascar 1989 andesite 4,400 300 4,100 3.7 0.030 0.54 COSPEC 32, 33Unzen 1991–1994 dacite 220 50 170 400 0.14 0.13 COSPEC 34, 35, 36Redoubt 1990 dacite 140 60 80 210 0.018* 0.63 COSPEC 37St. Helens 1980–1986 dacite 68 25 43 180 0.015 0.50 COSPEC 22, 38aVolcanoes listed as nonsubduction zone volcanoes are all in Iceland except for Mauna Loa and Kilauea, which are in Hawaii. The explosive and effusive
eruptions were distinguished on the basis of the SO2 emission data sources; eruptions measured by the TOMS or ice core records are categorized as‘‘explosive,’’ and the others measured by the ground-based techniques are categorized as ‘‘effusive.’’ DS = (S in melt inclusion) � (S in matrix glass), andDS = S in melt inclusion for Soufriere Hills. Petrological estimates of SO2 emissions were calculated with equation (1) assuming Fmelt = 1, except for thedata marked with asterisks, which indicate the value was calculated in the original references considering additional information. Methods are as follows:TOMS, Total Ozone Mapping Spectrometer; AT, atmospheric turbidity measurement; OD, optical depth measurement; IC, ice core analyses; COSPEC,correlation spectrometer.
bReferences are as follows: 1, Sharma et al. [2004]; 2, Thordarson et al. [1996]; 3, Stothers [1996]; 4, Zielinski [1995]; 5, Hammer et al. [1980]; 6,Thordarson et al. [2001]; 7, Devine et al. [1984]; 8, Sutton et al. [2001]; 9, Bluth et al. [1993]; 10, Gurenko et al. [2005]; 11, de Hoog et al. [2001]; 12, Selfand King [1996]; 13, Gerlach et al. [1994]; 14, Sigurdsson et al. [1990a]; 15, Krueger et al. [1990]; 16, Krueger et al. [1995]; 17, Luhr and Logan [2002];18, Palais and Sigurdsson [1989]; 19, Scaillet et al. [2003]; 20, Self et al. [2004]; 21, Gerlach et al. [1996]; 22, Gerlach and McGee [1994]; 23,Westrich etal. [1991]; 24, Mandeville et al. [1996]; 25, Costa et al. [2003]; 26, de Silva and Zielinski [1998]; 27, Sigurdsson et al. [1990b]; 28, Hammer et al. [1987];29, Williams-Jones et al. [2001]; 30, Streck and Wacaster [2006]; 31, Edmonds et al. [2001]; 32, Andres et al. [1991]; 33, Matthews et al. [1999]; 34,Hirabayashi et al. [1995]; 35, Nakada et al. [1999]; 36, Satoh et al. [2003]; 37, Gerlach et al. [1994]; 38, Swanson et al. [1987].
RG4005 Shinohara: EXCESS DEGASSING OF VOLCANOES
11 of 31
RG4005

explosive eruptions at rifts and hot spots are dominated by
lava fountain and lava effusion eruptions and are much less
explosive than the explosive eruptions at subduction zones,
which are Plinian or Vulcanian eruptions. In contrast, an
explosive eruption of rhyolitic magma in the rift environ-
ment (A.D. 1104 Hekla eruption at Iceland) shows evidence
for large excess degassing (Figure 10), suggesting that the
absence of excess degassing in basaltic eruptions at rifts and
hot spots is not simply due to tectonic setting but caused by
the eruption style or the magma composition [Scaillet et al.,
2003].
4.1.2. SO2 Emission by Effusive Eruptions[31] Effusive eruptions have lower magma and gas emis-
sion rates but longer duration than explosive eruptions.
Changes in emission rates as well as eruption styles, such
as sporadic explosive eruptions, often occur during the long
duration of an eruption, and excess degassing during
effusive eruptions needs to be evaluated considering these
variations. Since volcanic plumes of low-activity effusive
eruptions likely remain in the lower troposphere, TOMS
does not provide precise emission rates of a small and
continuous plume; thus, variations in SO2 emission rates
during effusive eruptions are monitored commonly by
repeated ground-based measurements.
[32] Kilauea volcano, Hawaii, is the only quantified
example of an effusive eruption at a hot spot, and this
example does not indicate excess degassing (Figure 10).
Kilauea volcano has erupted effusively for more than
20 years and was monitored for SO2 and magma emission
in detail [Andres et al., 1989; Sutton et al., 2001]. Eruption
rates and styles are variable on short time scale, with
activity including lava fountains and continuous low-activity
lava effusions, but the annual magma effusion rate and SO2
emission rate has been almost constant at about 0.1 km3/a and
0.5 Mt/a, respectively. The constant ratio between magma
and SO2 emission rates suggests the absence of excess
degassing at Kilauea volcano.
[33] Effusive eruptions at subduction zones show a var-
iable degree of excess degassing but are also associated with
different eruption sequences. The eruption of dacitic magma
at Unzen volcano was a simple example of a lava dome
eruption without major explosive activity and was not
associated with excess degassing [Hirabayashi et al.,
1995; Nakada et al., 1999; Satoh et al., 2003]. In contrast,
significant excess degassing was observed during lava dome
eruptions at Mount Saint Helens and Reboubt volcanoes, for
example (Table 3). Lava dome eruptions at Mount Saint
Helens volcano occurred immediately after the Plinian
eruption on 18 May 1980, with the Plinian and lava dome
eruptions both showing large excess degassing (Figure 10
[Swanson et al., 1987; Gerlach and McGee, 1994]). A large
degree of excess degassing was also observed during Plinian
and lava dome eruptions at Redoubt volcano (Table 3), but
degassing continued even after the end of lava dome extru-
sion, discharging an additional 0.18 Mt of SO2 [Gerlach et
al., 1994].
4.2. SO2 Emission by Persistent Degassing
[34] Intense volcanic gas emission occurs even without
magma extrusion, known as persistent degassing (also
called passive, quiescent, or noneruptive degassing). Since
persistent degassing is associated with little magma dis-
charge, definition of excess degassing is not applicable to
this activity in a strict sense. Persistent degassing commonly
continues many years, yielding gas emission comparable to
large eruptions and evidently requiring degassing of a large
amount of magma. Such degassing is also considered as
excess degassing of a volcano in a broad sense. Andres and
Kasgnoc [1998] listed 49 volcanoes which continuously
emit SO2 with relatively constant activity over the last
25 years (Table 4). These volcanoes exhibit various eruptive
activity including Vulcanian, Strombolian, lava dome, and
lava flow eruptions as well as persistent degassing without
eruption; persistent degassing commonly contributes a
majority of the gas emission from these volcanoes. The
top 15 volcanoes in Table 4 continuously emit >0.2 Mt/a of
SO2, and 10 years of degassing at these volcanoes yields 2Mt
of SO2, larger than the yield of the 1980 Plinian eruption at
Mount Saint Helens (Table 3).
[35] The simplest examples of persistent degassing are
continuous and long-term gas emission activity without any
eruption, such as at Masaya volcano, Nicaragua, and Satsu-
ma-Iwojima, Japan (Table 4). Masaya volcano is a basaltic
volcano that continued to degas since 1993 with only a few
minor explosions [Duffell et al., 2003; Rymer et al., 1998].
The constant volcanic gas emission at the rhyolitic dome of
Satsuma-Iwojima volcano has been monitored for about
30 years but may have continued for hundreds of years
without any magmatic eruption [Shinohara et al., 2002].
Figure 10. Comparison of measured and petrologicalestimates of SO2 emissions by various eruptions. Data andtheir sources are listed in Table 3. The solid and dashedlines indicate 1:1 and 10:1 correlation line of the measuredversus the petrologically estimated SO2 emissions.
RG4005 Shinohara: EXCESS DEGASSING OF VOLCANOES
12 of 31
RG4005
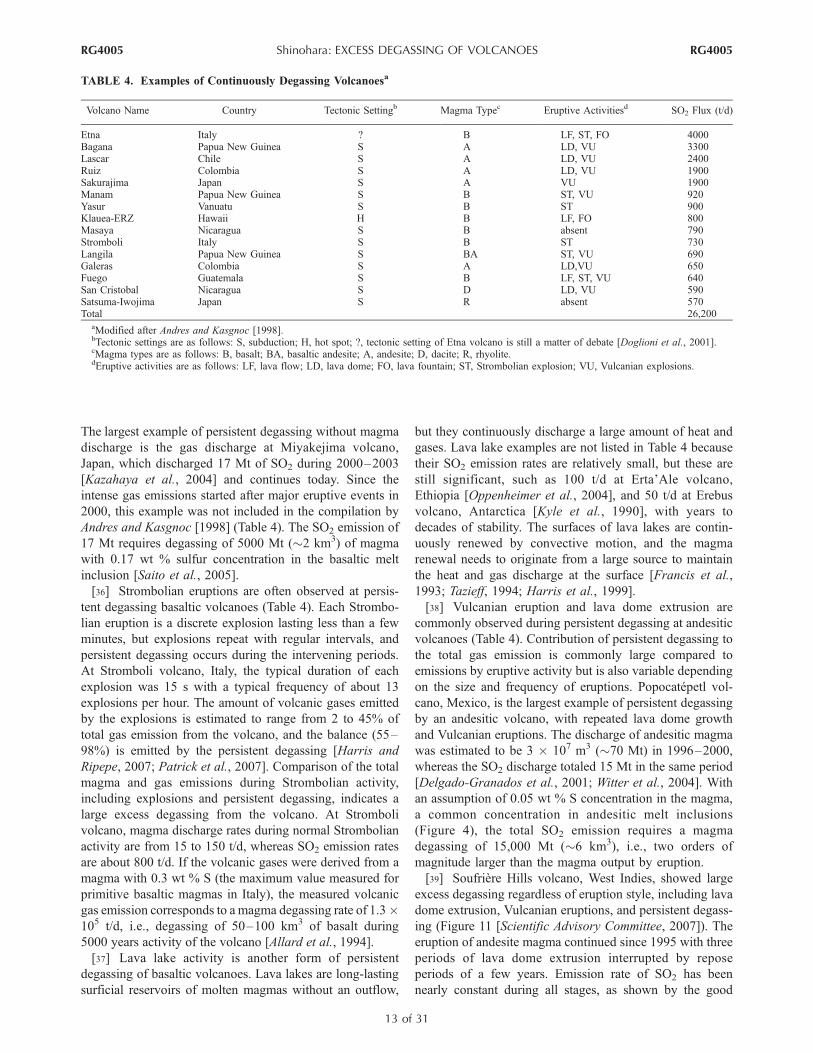
The largest example of persistent degassing without magma
discharge is the gas discharge at Miyakejima volcano,
Japan, which discharged 17 Mt of SO2 during 2000–2003
[Kazahaya et al., 2004] and continues today. Since the
intense gas emissions started after major eruptive events in
2000, this example was not included in the compilation by
Andres and Kasgnoc [1998] (Table 4). The SO2 emission of
17 Mt requires degassing of 5000 Mt (�2 km3) of magma
with 0.17 wt % sulfur concentration in the basaltic melt
inclusion [Saito et al., 2005].
[36] Strombolian eruptions are often observed at persis-
tent degassing basaltic volcanoes (Table 4). Each Strombo-
lian eruption is a discrete explosion lasting less than a few
minutes, but explosions repeat with regular intervals, and
persistent degassing occurs during the intervening periods.
At Stromboli volcano, Italy, the typical duration of each
explosion was 15 s with a typical frequency of about 13
explosions per hour. The amount of volcanic gases emitted
by the explosions is estimated to range from 2 to 45% of
total gas emission from the volcano, and the balance (55–
98%) is emitted by the persistent degassing [Harris and
Ripepe, 2007; Patrick et al., 2007]. Comparison of the total
magma and gas emissions during Strombolian activity,
including explosions and persistent degassing, indicates a
large excess degassing from the volcano. At Stromboli
volcano, magma discharge rates during normal Strombolian
activity are from 15 to 150 t/d, whereas SO2 emission rates
are about 800 t/d. If the volcanic gases were derived from a
magma with 0.3 wt % S (the maximum value measured for
primitive basaltic magmas in Italy), the measured volcanic
gas emission corresponds to a magma degassing rate of 1.3�105 t/d, i.e., degassing of 50–100 km3 of basalt during
5000 years activity of the volcano [Allard et al., 1994].
[37] Lava lake activity is another form of persistent
degassing of basaltic volcanoes. Lava lakes are long-lasting
surficial reservoirs of molten magmas without an outflow,
but they continuously discharge a large amount of heat and
gases. Lava lake examples are not listed in Table 4 because
their SO2 emission rates are relatively small, but these are
still significant, such as 100 t/d at Erta’Ale volcano,
Ethiopia [Oppenheimer et al., 2004], and 50 t/d at Erebus
volcano, Antarctica [Kyle et al., 1990], with years to
decades of stability. The surfaces of lava lakes are contin-
uously renewed by convective motion, and the magma
renewal needs to originate from a large source to maintain
the heat and gas discharge at the surface [Francis et al.,
1993; Tazieff, 1994; Harris et al., 1999].
[38] Vulcanian eruption and lava dome extrusion are
commonly observed during persistent degassing at andesitic
volcanoes (Table 4). Contribution of persistent degassing to
the total gas emission is commonly large compared to
emissions by eruptive activity but is also variable depending
on the size and frequency of eruptions. Popocatepetl vol-
cano, Mexico, is the largest example of persistent degassing
by an andesitic volcano, with repeated lava dome growth
and Vulcanian eruptions. The discharge of andesitic magma
was estimated to be 3 � 107 m3 (�70 Mt) in 1996–2000,
whereas the SO2 discharge totaled 15 Mt in the same period
[Delgado-Granados et al., 2001; Witter et al., 2004]. With
an assumption of 0.05 wt % S concentration in the magma,
a common concentration in andesitic melt inclusions
(Figure 4), the total SO2 emission requires a magma
degassing of 15,000 Mt (�6 km3), i.e., two orders of
magnitude larger than the magma output by eruption.
[39] Soufriere Hills volcano, West Indies, showed large
excess degassing regardless of eruption style, including lava
dome extrusion, Vulcanian eruptions, and persistent degass-
ing (Figure 11 [Scientific Advisory Committee, 2007]). The
eruption of andesite magma continued since 1995 with three
periods of lava dome extrusion interrupted by repose
periods of a few years. Emission rate of SO2 has been
nearly constant during all stages, as shown by the good
TABLE 4. Examples of Continuously Degassing Volcanoesa
Volcano Name Country Tectonic Settingb Magma Typec Eruptive Activitiesd SO2 Flux (t/d)
Etna Italy ? B LF, ST, FO 4000Bagana Papua New Guinea S A LD, VU 3300Lascar Chile S A LD, VU 2400Ruiz Colombia S A LD, VU 1900Sakurajima Japan S A VU 1900Manam Papua New Guinea S B ST, VU 920Yasur Vanuatu S B ST 900Klauea-ERZ Hawaii H B LF, FO 800Masaya Nicaragua S B absent 790Stromboli Italy S B ST 730Langila Papua New Guinea S BA ST, VU 690Galeras Colombia S A LD,VU 650Fuego Guatemala S B LF, ST, VU 640San Cristobal Nicaragua S D LD, VU 590Satsuma-Iwojima Japan S R absent 570Total 26,200
aModified after Andres and Kasgnoc [1998].bTectonic settings are as follows: S, subduction; H, hot spot; ?, tectonic setting of Etna volcano is still a matter of debate [Doglioni et al., 2001].cMagma types are as follows: B, basalt; BA, basaltic andesite; A, andesite; D, dacite; R, rhyolite.dEruptive activities are as follows: LF, lava flow; LD, lava dome; FO, lava fountain; ST, Strombolian explosion; VU, Vulcanian explosions.
RG4005 Shinohara: EXCESS DEGASSING OF VOLCANOES
13 of 31
RG4005
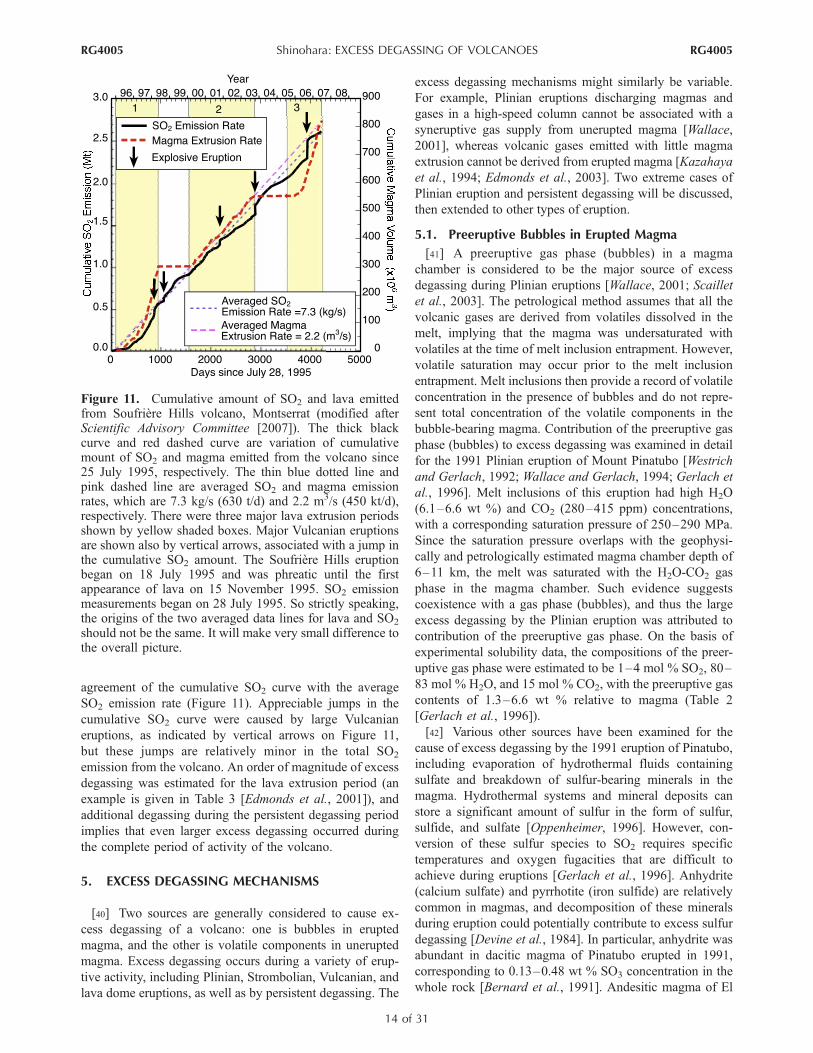
agreement of the cumulative SO2 curve with the average
SO2 emission rate (Figure 11). Appreciable jumps in the
cumulative SO2 curve were caused by large Vulcanian
eruptions, as indicated by vertical arrows on Figure 11,
but these jumps are relatively minor in the total SO2
emission from the volcano. An order of magnitude of excess
degassing was estimated for the lava extrusion period (an
example is given in Table 3 [Edmonds et al., 2001]), and
additional degassing during the persistent degassing period
implies that even larger excess degassing occurred during
the complete period of activity of the volcano.
5. EXCESS DEGASSING MECHANISMS
[40] Two sources are generally considered to cause ex-
cess degassing of a volcano: one is bubbles in erupted
magma, and the other is volatile components in unerupted
magma. Excess degassing occurs during a variety of erup-
tive activity, including Plinian, Strombolian, Vulcanian, and
lava dome eruptions, as well as by persistent degassing. The
excess degassing mechanisms might similarly be variable.
For example, Plinian eruptions discharging magmas and
gases in a high-speed column cannot be associated with a
syneruptive gas supply from unerupted magma [Wallace,
2001], whereas volcanic gases emitted with little magma
extrusion cannot be derived from erupted magma [Kazahaya
et al., 1994; Edmonds et al., 2003]. Two extreme cases of
Plinian eruption and persistent degassing will be discussed,
then extended to other types of eruption.
5.1. Preeruptive Bubbles in Erupted Magma
[41] A preeruptive gas phase (bubbles) in a magma
chamber is considered to be the major source of excess
degassing during Plinian eruptions [Wallace, 2001; Scaillet
et al., 2003]. The petrological method assumes that all the
volcanic gases are derived from volatiles dissolved in the
melt, implying that the magma was undersaturated with
volatiles at the time of melt inclusion entrapment. However,
volatile saturation may occur prior to the melt inclusion
entrapment. Melt inclusions then provide a record of volatile
concentration in the presence of bubbles and do not repre-
sent total concentration of the volatile components in the
bubble-bearing magma. Contribution of the preeruptive gas
phase (bubbles) to excess degassing was examined in detail
for the 1991 Plinian eruption of Mount Pinatubo [Westrich
and Gerlach, 1992; Wallace and Gerlach, 1994; Gerlach et
al., 1996]. Melt inclusions of this eruption had high H2O
(6.1–6.6 wt %) and CO2 (280–415 ppm) concentrations,
with a corresponding saturation pressure of 250–290 MPa.
Since the saturation pressure overlaps with the geophysi-
cally and petrologically estimated magma chamber depth of
6–11 km, the melt was saturated with the H2O-CO2 gas
phase in the magma chamber. Such evidence suggests
coexistence with a gas phase (bubbles), and thus the large
excess degassing by the Plinian eruption was attributed to
contribution of the preeruptive gas phase. On the basis of
experimental solubility data, the compositions of the preer-
uptive gas phase were estimated to be 1–4 mol % SO2, 80–
83 mol % H2O, and 15 mol % CO2, with the preeruptive gas
contents of 1.3–6.6 wt % relative to magma (Table 2
[Gerlach et al., 1996]).
[42] Various other sources have been examined for the
cause of excess degassing by the 1991 eruption of Pinatubo,
including evaporation of hydrothermal fluids containing
sulfate and breakdown of sulfur-bearing minerals in the
magma. Hydrothermal systems and mineral deposits can
store a significant amount of sulfur in the form of sulfur,
sulfide, and sulfate [Oppenheimer, 1996]. However, con-
version of these sulfur species to SO2 requires specific
temperatures and oxygen fugacities that are difficult to
achieve during eruptions [Gerlach et al., 1996]. Anhydrite
(calcium sulfate) and pyrrhotite (iron sulfide) are relatively
common in magmas, and decomposition of these minerals
during eruption could potentially contribute to excess sulfur
degassing [Devine et al., 1984]. In particular, anhydrite was
abundant in dacitic magma of Pinatubo erupted in 1991,
corresponding to 0.13–0.48 wt % SO3 concentration in the
whole rock [Bernard et al., 1991]. Andesitic magma of El
Figure 11. Cumulative amount of SO2 and lava emittedfrom Soufriere Hills volcano, Montserrat (modified afterScientific Advisory Committee [2007]). The thick blackcurve and red dashed curve are variation of cumulativemount of SO2 and magma emitted from the volcano since25 July 1995, respectively. The thin blue dotted line andpink dashed line are averaged SO2 and magma emissionrates, which are 7.3 kg/s (630 t/d) and 2.2 m3/s (450 kt/d),respectively. There were three major lava extrusion periodsshown by yellow shaded boxes. Major Vulcanian eruptionsare shown also by vertical arrows, associated with a jump inthe cumulative SO2 amount. The Soufriere Hills eruptionbegan on 18 July 1995 and was phreatic until the firstappearance of lava on 15 November 1995. SO2 emissionmeasurements began on 28 July 1995. So strictly speaking,the origins of the two averaged data lines for lava and SO2
should not be the same. It will make very small difference tothe overall picture.
RG4005 Shinohara: EXCESS DEGASSING OF VOLCANOES
14 of 31
RG4005

Chichon, erupted in 1982, was also associated with large
excess degassing; the magma contained abundant anhydrite,
corresponding to 1.3 wt % SO3 concentration in the whole
rock [Luhr et al., 1984]. These minerals in the erupted
magmas, however, are commonly euhedral (perfect crys-
tals), without a significant reaction rim; therefore, syner-
uptive decomposition is unlikely [Luhr et al., 1984; Bernard
et al., 1991].
[43] Concentrations of H2O and CO2 in melt inclusions
indicate that melt inclusions are trapped under gas phase
saturated conditions at many volcanoes (Figure 3 [Wallace,
2005]). Experimental studies demonstrate strong sulfur
partitioning into the gas phase relative to silicate melt
[Scaillet et al., 1998; Keppler, 1999]. On the basis of the
experimental data and volatile concentrations measured in
melt inclusions, sulfur concentrations in the preeruptive gas
phase were calculated for various eruptions to range up to
10 wt %. In order to account for the observed SO2
emissions, bubble contents in the preeruptive magma were
estimated as 5 and 1 wt % for silicic and mafic magmas,
respectively [Scaillet et al., 2003; Wallace, 2003]. These
estimates indicate that more than 90% of sulfur species in
the magma occurs in bubbles prior to eruption of interme-
diate to silicic magma at subduction zone [Scaillet et al.,
2003].
[44] Bubbles are formed either by decompression or
crystallization of magma, but vesiculation (bubble forma-
tion) itself does not change the bulk volatile content of the
magma. Large content of sulfur-rich bubbles in a magma
requires either very sulfur-rich original magma or bubble
supply from other sources. Since most silicate melt is
sulfide saturated (Figure 4), sulfur concentration in a silicate
melt supplied to a magma chamber is similar to that in melt
inclusions unless the magma experienced significant evolu-
tion in composition, temperature, or oxygen fugacity. There-
fore, an order of magnitude larger sulfur content in bubbles
than in melt inclusions cannot be caused by simple vesicu-
lation (bubble formation) of a magma and requires accumu-
lation of bubbles. Magmas may originally have been bubble
bearing when they ascended to the chamber (Figures 12a and
12b). Magma crystallization will increase dissolved volatile
concentration in residual melt, eventually causing bubble
formation (Figures 12c–12e). Crystallization-induced vola-
tile saturation is likely a common process in a magma
chamber as evidenced by variation of H2O-CO2 concentra-
tion in melt inclusions (Figure 3 [Anderson et al., 1989;
Wallace, 2005]). Wallace et al. [1995] compared the con-
centrations of volatile components, trace elements, and
crystals in different eruption units of the Bishop tuff, eastern
California, and revealed that the Plinian eruptions occurred
from a magma chamber with preeruptive bubble content
gradient from less than 2 wt % of the magma in the deeper
region to 6 wt % near the magma chamber top. However,
magma crystallization itself cannot increase volatile con-
centration in the bulk magma, and an additional process is
necessary to concentrate volatiles in the erupted magmas.
[45] Ascending bubbles in a magma chamber may accu-
mulate to the top to form bubble-rich magma and may cause
Plinian eruptions with excess degassing (Figure 12). In
order to accumulate a ten times larger amount of sulfur
than originally dissolved in a silicic magma, the exsolved
gas phase needs to be supplied either from at least a ten
times larger magma body or from a separate sulfur-rich
source, such as a basaltic magma (Figure 12). Basaltic
magmas typically have a high sulfur concentration
(Figure 4) and thus can effectively supply SO2-rich bubbles.
Traces of basaltic magmas are commonly found in the
eruption products from silicic magmas, indicating a coex-
istence of or mingling with basaltic magma in the silicic
magma chamber [Bacon, 1986; Eichelberger, 1980; Saito et
al., 2001]. Erupted magmas at Pinatubo were mostly dacite;
however, traces of basaltic magmas are also present, and
this mafic component is considered to have acted as the
excess sulfur source as well as provided the eruption trigger
[Pallister et al., 1992, 1996].
[46] Supply of SO2-rich gases from basaltic to dacitic
magma is inferred from the occurrence of sulfide and sulfate
minerals in 1991 eruption products from Mount Pinatubo
[Hattori, 1993, 1996]. Partially decomposed sulfide minerals
found in the Pinatubo dacitic and basaltic magmas indicate
that the sulfide minerals had been stable in both magmas
during an early, reduced stage. Later formation of anhydrite
in dacitic magma required subsequent addition of sulfur and
oxidation of the magma. The addition of sulfur as well as
magma oxidation is likely caused by an influx of SO2 from
the basalt, which also caused accumulation of SO2-rich
bubbles in the dacitic magma. Absence of anhydrite in the
basalt also suggests that the SO2 influx to dacitic magma
was derived from the basaltic magma. Similar occurrences
of sulfide and sulfate minerals in the 1980 El Chichon
magmas [Luhr et al., 1984] and 1985 Nevado del Ruiz
magmas [Fournelle, 1990] suggest that SO2 influx is
commonly associated with Plinian eruptions and large
excess degassing [Hattori, 1993]. Larger excess sulfur
degassing was observed for eruptions of more silicic mag-
mas (Figure 10), and this correlation is reasonable if the
excess amount of SO2 was supplied from an underplated
basaltic magma.
5.2. Gas Transport From Unerupted Magma
[47] Persistent degassing occurs without magma eruption;
therefore, a model for this kind of degassing must explain
the mechanism of gas transport from unerupted magma. The
large-rate and long-term volcanic gas emission must be
derived from a large magma chamber. For example, Sakur-
ajima volcano, Japan, has continued SO2 emission of 2 kt/d
for 50 years with total SO2 emissions corresponding to the
degassing of 15 km3 magma with an initial 0.05 wt % S.
Estimated depth of a large magma chamber commonly
ranges from 5 to 10 km, such as at Sakurajima [Kriswati
and Iguchi, 2003], Miyakejima [Ueda et al., 2005], and
Soufriere Hills volcanoes [Aspinall et al., 1998; Barclay et
al., 1998]. A model of persistent degassing must explain
continuous gas transport from a km3-size magma chamber
at 5–10 km depth to a degassing vent at the surface. Two
models have been proposed: one is based on convecting
RG4005 Shinohara: EXCESS DEGASSING OF VOLCANOES
15 of 31
RG4005

magma column [Kazahaya et al., 1994; Stevenson and
Blake, 1998], and the other is permeable gas flow though
volcanic conduit [Edmonds et al., 2003].
5.2.1. Degassing of a Convecting Magma Column[48] In convecting magma column model, magma con-
vects through a narrow conduit between a deep magma
chamber and a shallow level, where gases escape from the
convecting magma (Figure 13). Magma convection occurs
because degassing at the top of the magma column increases
the density of the magma, resulting in gravitational insta-
bility. Since the gas phase–magma separation occurs at a
shallow depth and hence low pressure, most of the volatile
components in the magma will escape. The density of
degassed magma is larger than nondegassed magma be-
cause of the loss of bubbles at low pressure and because of
the density increase due to the decrease in dissolved water
concentration at high pressure (Figure 13c). The dense
degassed magma will sink through a magma column filled
Figure 12. Schematic diagrams of bubble accumulation processes in a magma chamber. (a) Magmassupplied from a deep source may be volatile supersaturated at the magma chamber pressure. The bubble-bearing magma, however, will not cause significant excess degassing because volatile concentration inthe bulk magma is the same as that in the supplied magma. (b) Bubbles in a chamber will ascend by theirbuoyancy and be accumulated at the top of the chamber. Eruption of the bubble-accumulated magma willresult in significant excess degassing and will leave a large amount of bubble-lost but volatile-saturatedmagma in the chamber. (c) Crystallization of magmas will concentrate volatile components in the melt,causing volatile saturation (bubble formation). (d) Increase in the volatile concentration by crystallizationwill be proportional to degree of crystallization. For example, 50 vol % crystallization will double theconcentration of the volatile components. (e) Accumulation of bubbles to chamber top will create abubble-rich magma to cause eruption with significant excess degassing, and a large volume ofcrystallized magma and volatile-saturated magma will remain in the chamber. (f) Sulfur-rich basalticmagma underplated beneath silicic magmas in a chamber could be a source of SO2-rich bubbles. (g)Silicic magma with SO2-rich bubbles transferred from basaltic magma will cause eruptions with excessdegassing leaving volatile-saturated basaltic magma in the chamber.
RG4005 Shinohara: EXCESS DEGASSING OF VOLCANOES
16 of 31
RG4005

with less dense nondegassed magma until it reaches a base,
likely the bottom of a deep magma chamber. Nondegassed
magmas in a chamber ascend, compensating for the
descending degassed magmas, creating a nonstop link of
degassing and convective transport of magmas between a
deep magma chamber and the near-surface top of the
magma column. The convecting magma column model
assumes insignificant mixing of descending and ascending
magmas; significant mixing causes loss of the driving force
of the convection. The convecting magma column model
can explain the essential features of persistent degassing,
long-term continuous discharge of large amounts of volca-
nic gases without magma discharges. Convective magma
flow allows volatile components to travel with the magma
from a deep and large chamber for near-surface extraction
through a narrow and long magma column. Since convec-
tion is driven by degassing near the surface, such convec-
tion is a stable process and can continue as long as the
magma chamber contains buoyant, nondegassed magmas.
[49] Lava lakes are direct examples of the convecting
magma column degassing. Large amounts of gases and heat
are continuously emitted from the lava lake, whose surface
is continuously renewed by convective movement of magma
[Tazieff, 1994]. Thermal energy budgets of lava lakes require
the continuous renewal of the lava lake to maintain its
molten state, suggesting a convective exchange of magmas
between the lava lake and a deeper magma chamber [Francis
et al., 1993; Harris and Stevenson, 1997].
[50] The composition of volcanic gases emitted during
persistent degassing of basaltic volcano indicates that
degassing occurs at low pressure, supporting the idea of
degassing from a convecting magma column. Volcanic
gases emitted during persistent degassing at Villarrica
volcanoes have compositions similar to that expected from
the difference of the dissolved volatile contents in melt
inclusions and matrix glasses, and low-pressure degassing
was interpreted to be the source of the volcanic gas
[Shinohara and Witter, 2005]. Contrasting gas compositions
were measured by FTIR at Stromboli during persistent
degassing and intermittent Strombolian eruptions. Gases
emitted during eruptions are CO2-rich, that is, equilibrated
at high pressure (70–80 MPa), whereas gases emitted
during persistent degassing are CO2-poor with equilibrium
pressure of �0.3–4 MPa (Table 2 [Burton et al., 2007a]).
Figure 13. Schematic diagrams of degassing model in a convecting magma column. (a) A cylindricalmagma filled conduit with 1–50 m radius connects a deep magma chamber at several km depth toshallow depths. Counterflows of ascending nondegassing magma and descending degassed magmacoexist in a narrow conduit, causing continuous supply of nondegassed magma from the chamber andreturn of degassed magma to the chamber. (b) Ascending magma is water-rich and also bubble bearingabove volatile saturation level (green dashed line) and has much less density than water-poor and bubble-poor descending magma. Bubble-rich ascending magma will lose gas phase by permeable gas flowthrough the bubbly magma at the magma column top and become a degassed magma with increaseddensity; this will sink through a column filled with less dense nondegassed magma. (c) Convection isdriven by density difference between nondegassed and degassed magmas. Above the volatile saturationlevel, large density difference will be created by vesiculation (bubble formation) of nondegassed magmaand bubble separation to create degassed magma. The degassed magma has larger density thannondegassed magma even below the volatile saturation level because silicate melt density decreases withwater dissolution; therefore the degassed magma will continue to descend until it reaches a physicalbarrier, likely at the bottom of a magma chamber. Dehydration-induced crystallization will causesolidification of the descending magma, which will slow the magma descent, whereas magma densitywill increase with solidification, resulting in acceleration of the magma descent.
RG4005 Shinohara: EXCESS DEGASSING OF VOLCANOES
17 of 31
RG4005

Similar contrast in gas compositions was observed also
during persistent degassing and gas-pistoning activity at
Kilauea volcano [Edmonds and Gerlach, 2007]. Those
examples indicate that bubble rise from a deep source
may cause Strombolian or gas-pistoning activity but persis-
tent degassing needs to be caused by gases that escaped
from magma at low pressure.
[51] The rate of volcanic gas discharge from a convecting
magma column can be calculated on the basis of a fluid
dynamic model of volumetric magma flow through a
conduit [Kazahaya et al., 1994; Stevenson and Blake,
1998]. On the basis of laboratory observations of over-
turning fluids, the magma upflow rate (=downflow rate, Q)
of concentric counterflows with an inside upflow and an
outside downflow through a pipe (conduit) is expressed as
follows [Stevenson and Blake, 1998]:
Q ¼ p R*ð Þ2Ps gDrR4=md
� �; ð2Þ
where R is the conduit radius, Ps is a Poiseulle number, R*
is a ratio of the upflow radius to the conduit radius, g is the
acceleration due to gravity, Dr is density difference
between nondegassed and degassed magmas, and md is
viscosity of the descending degassed magma. The Poiseulle
number (Ps) is a parameterize terminal velocity of the
ascending flow (v) given by the following equation as a
function of a viscosity ratio of descending and ascending
flows (md/mc) and R*:
Ps ¼ vmd= gDrR2� �
¼ f md=mc;R*ð Þ: ð3Þ
[52] The Ps and R* were determined by laboratory
experiments as 0.064 and 0.6, respectively, at md/mc > 12.
This fluid dynamic model reveals that magmas can flow
rapidly enough to cause volcanic gas discharges with the
observed rate. If we assume a basaltic magma with mc =
10 Pa s, md/mc = 100, and Dr = 50 kg/m3, we can calculate
that a 3 m radius conduit can allow counterflows with a
flow rate of 5 � 103 kg/s (1.5 � 105 m/d); this can cause the
observed discharge of 800 t/d SO2 at Stromboli volcano by
degassing of magmas with an initial concentration of 0.1 wt
% sulfur. Magma viscosities and density difference used in
this calculation are obtained for bubble-free magmas; there-
fore it is applicable to magma flow below the vesiculation
level (Figure 13c). Above the vesiculation level, magma
density difference will become larger at lower pressure
because of larger bubble content in nondegassed magma
than in degassed magma, and that will accelerate magma
convection. Magma viscosity, however, increases with
magma ascent because of water content decrease, bubble
content increase, and dehydration-driven crystallization,
causing slowdown of magma flow. Magma density and
viscosity also vary with crystallization kinetics, bubble
deformation, or bubble separation from magma [Blundy
and Cashman, 2005; Llewellin and Manga, 2005; Burton
et al., 2007b], and their effects on the magma convection
are not yet quantified.
[53] Persistent degassing commonly occurs at volcanoes
with low-viscosity basaltic magmas but is also common
with more viscous andesitic magmas. Persistent degassing is
observed even at dacitic and rhyolitic volcanoes with much
more viscous magmas, but the number of examples is small
(Table 4). Conduit convection of silicic magmas is contro-
versial because their large viscosities, up to several orders of
magnitude larger than basaltic magmas, will slow the
magma flow. The small number of examples of persistent
degassing at dacitic and rhyolitic volcanoes can be due to
the difficulty of magma convection with viscous silicic
magmas. Conduit of silicic magmas, however, is commonly
considered to have a larger radius than that of basaltic
magma [Stevenson and Blake, 1998]. A larger conduit
radius may compensate for the larger viscosities because
magma flow rate is proportional to the fourth power of the
conduit radius (equation (2)). However, conduit geometry is
not yet well quantified for each volcano, and validity of
conduit magma convection at silicic volcanoes must be
examined also considering other constraints such as magma
degassing pressure estimated from compositions of volcanic
gases and dissolved volatiles.
[54] Satsuma-Iwojima volcano is a unique example of
persistent degassing from rhyolitic magma and is also
unique for its low volatile content in melt inclusions
(H2O = 1.4 wt %, CO2 = 140 ppm) and high temperature
of the rhyolitic magma (�1000�C) estimated by petrological
study [Saito et al., 2001]. Gas saturation pressure of the melt
is 50 MPa, implying that gas phase forms only at a shallow
depth (<2 km). The H2O/CO2 mole ratio of volcanic gas
(�250, Table 2 [Shinohara et al., 2002]) is almost identical to
the ratio of dissolved volatiles (�250 [Saito et al., 2001]),
and the good agreement requires almost complete discharge
of the dissolved H2O and CO2 at near-atmospheric pressure
to account for the observed volcanic gas composition. The
low-pressure degassing is consistent with the idea that it
occurs at the top of a convecting magma column [Kazahaya
et al., 2002]. To account for 600 t/d of SO2 emitted from the
volcano, the necessary conduit radius is estimated with
equation (2) to be 25 m for the high-temperature rhyolite
with md = 106 Pa s,Dr = 50 kg/m3, and 0.01 wt % of sulfur.
The high temperature and low water content of the Satsuma-
Iwojima rhyolite provide a favorable condition for conduit
magma convection because of lower magma viscosity and
lower degree of dehydration-driven crystallization than com-
mon rhyolites. These conditions might be the cause of the
unique occurrence of persistent degassing from rhyolitic
magma at Satsuma-Iwojima volcano. Comparison of volca-
nic gas composition and dissolved volatiles in melt inclusion
provide a constraint of degassing conditions; however, such
quantitative comparisons are not yet performed at other
persistently degassing silicic volcanoes, and validity of the
conduit magma convection model at other andesitic or dacitic
volcanoes must be examined with future studies of volcanic
gases and melt inclusions.
5.2.2. Permeable Gas Flow Model[55] A gas phase may ascend by permeable flow through
a volcanic conduit connecting a deep magma chamber to the
RG4005 Shinohara: EXCESS DEGASSING OF VOLCANOES
18 of 31
RG4005

surface. Volcanic conduits may have a higher permeability
than the surroundings because of high concentrations of
bubbles and fractures and may provide the permeable gas
flow path connecting a deep magma chamber to the surface.
Permeable gas flow is considered for a variety of volcanic
processes, including gas loss from ascending magma [Melnik
and Sparks, 1999; Gonnermann and Manga, 2007], gas
phase migration in a magma chamber [Candela, 1994;
Bachmann and Bergantz, 2006], and hydrothermal fluid
circulation caused by a cooling magma chamber [Cathles,
1977; Shinohara and Kazahaya, 1995]. Such flow through a
volcanic conduit has been implicitly assumed in physical
models of volcanic gas emissions [e.g., Chiodini et al., 1993;
Fischer et al., 1996]; however, an explicit model of gas
transport from a deep magma chamber to a vent has only
recently been proposed for Soufriere Hills volcano [Edmonds
et al., 2003].
[56] At Soufriere Hills volcano, excess degassing is
thought to be caused by transport of a SO2-rich gas from
a basaltic magma chamber by permeable gas flow through a
volcanic conduit (Figure 14 [Edmonds et al., 2003]). The
large amount of SO2-rich gases cannot be supplied by the
erupted andesitic magma with low-S content and was
attributed to an unerupted basaltic magma at a 5–7 km
depth. Since large excess SO2 degassing was observed both
during lava dome eruption and the eruption repose period
(Figures 7 and 8), permeability of the volcanic conduit and
the SO2-rich gas supply from the basaltic magma is as-
sumed to be similar whether or not it was erupting
[Edmonds et al., 2003].
[57] The permeability necessary to cause the observed
gas emission rates at Soufriere Hills volcano was calculated
to be on the order of 10�9 to 10�12 m2 for a gas flow
through a conduit of 1000 m2 cross-sectional area driven by
lithostatic pressure gradient [Edmonds et al., 2003]. The
calculated permeability range overlaps with the upper end
of measured values for volcanic rocks (10�11 to 10�14 m2
[Melnik and Sparks, 2002; Gonnermann and Manga,
2007]), and the agreement indicates validity of the perme-
able gas flow model at a shallow region. The volcanic
rocks, however, are surface samples which do not neces-
sarily represent permeability at depth. Permeability of
volcanic conduit likely decreases with depth because po-
rosity, and therefore permeability, of ascending molten
magma decreases with depth [Melnik and Sparks, 1999],
and permeability of geological formation commonly
increases with depth, in particular at depth larger than 1
km [Saar and Manga, 2004]. The permeable gas flow
model must be tested for its efficiency at a deep region
(5–10 km) with quantitative estimates of volcanic conduit
permeability at the depth.
[58] The gas phase supplied to the permeable conduit
consists of the exsolved gas species at a magma chamber
depth (5–10 km). Therefore, composition of volcanic gas
supplied by the permeable gas flow must be distinct from
the gases emitted at low pressure from the convecting
magma column, in particular for the CO2/H2O ratio because
of their contrasting solubility (Figures 1 and 2). The
comparison of compositions of the volcanic gases and melt
inclusions at Stromboli, Villarrica, and Satsuma-Iwojima
volcanoes indicate low-pressure source for the persistent
degassing, consistent with the conduit magma convection
model (Table 2 [Kazahaya et al., 2004; Shinohara and
Witter, 2005; Burton et al., 2007a]). However, data on
volcanic gas and melt inclusion compositions are not yet
available at persistently degassing andesitic volcanoes, such
as at Soufriere Hills volcano, and we need comparison of
those data to confirm the high-pressure degassing inferred
from the permeable gas flow model.
5.3. Excess Degassing Mechanisms During VariousEruptive Styles
[59] Three mechanisms have been proposed as the source
of excess degassing for the two extreme cases, Plinian
eruption and persistent degassing. These mechanisms are
not necessarily exclusive of each other, and multiple mech-
anisms may contribute in some cases. Persistent degassing
occurs in close association with Strombolian, Vulcanian,
and lava dome eruptions; here the interplay of the degassing
mechanisms with these eruption processes is discussed.
[60] Bubbles accumulated in a magma chamber, that is,
responsible for excess degassing during Plinian eruptions,
can also contribute to excess degassing during other type of
eruptions. Lava dome eruptions immediately after Plinian
eruptions, such as at Mount Saint Helens and Redoubt
volcanoes, were accompanied by large excess degassing,
similar to that observed during the earlier Plinian activity
(Table 3 [Gerlach and McGee, 1994; Gerlach et al., 1994]).
Magmas emitted by lava dome eruptions are derived from a
magma chamber remnant from the explosive activity, which
may yet contain accumulated bubbles responsible for the
excess degassing during subsequent lava dome eruptions.
However, additional sources of degassing are also required
at Redoubt volcano, where persistent degassing continued
long after the end of lava dome extrusions [Gerlach et al.,
1994]. Persistent degassing after eruption indicates either
degassing of a convecting magma column or permeable gas
flow from a magma chamber occurred simultaneously with
or subsequent to the lava dome eruption.
[61] Vulcanian eruption commonly occurs at persistently
degassing andesitic or dacitic volcanoes, where transition
between these activity and lava dome eruption is also
common, such as at Soufriere Hills [Edmonds et al., 2003],
Galeras [Zapata et al., 1997], Sakurajima [Hirabayashi et al.,
1986], Lascar [Matthews et al., 1997], and Popocatepetl
[Witter et al., 2005] volcanoes. In the permeable gas flow
model, the SO2 emission during repetition of persistent
degassing and lava dome extrusions is attributed to a
continuous SO2-rich gas supply from deep-seated basalt
magma though a permeable conduit (Figure 14a [Edmonds
et al., 2003]). The long-term near-constant SO2 emission
rate implies that permeability of the volcanic conduit is
nearly constant during dome extrusion and persistent
degassing (Figure 11). In contrast, permeability change
due to hydrothermal mineral precipitation and opening/
closure of fracture and bubble networks is proposed to
RG4005 Shinohara: EXCESS DEGASSING OF VOLCANOES
19 of 31
RG4005

cause short-term variation of SO2 emission rate and pressure
accumulation at the upper part of the volcanic conduit
causing Vulcanian explosions [Edmonds et al., 2003].
[62] The repetition of persistent degassing and lava dome
extrusions with excess degassing can be explained also on
the basis of a convective magma column degassing model
(Figure 14b). The convecting magma column model
assumes that all the degassed magma produced at the top
of the magma column descends back to the magma chamber
(Figure 13). When the top of the convecting magma column
reaches the surface, part of the degassed magma can flow out
from the conduit to form lava domes or flows (Figure 14b). In
this model, the near-constant SO2 emission rate implies a
near-constant magma convection rate, whereas the variable
lava extrusion rates reflect changes in magma column
height, likely controlled by a magma chamber overpressure.
At the top of the convecting magma column, blockade of
continuous overturn of degassed and nondegassed magmas
will cause pressure accumulation beneath degassed magma
because of the ascending bubble-rich magma and may result
in Vulcanian explosions. Further tests of the two models are
necessary to draw conclusions about the persistent degass-
ing mechanism at andesitic and dacitic volcanoes; it is also
important to understand eruption processes of the lava dome
and Vulcanian eruptions.
[63] Strombolian eruptions commonly occur during per-
sistent degassing at basaltic volcanoes. For example, at
Stromboli volcano, Strombolian explosions occur almost
every 5 minutes with typical durations of 15 s, and
continuous degassing occurs during rest of the time [Harris
and Ripepe, 2007; Patrick et al., 2007]. The rapid transition
from persistent degassing to Strombolian explosions implies
that the large bubbles ascend through the convecting magma
column. The origin of the large bubbles, their behavior and
ability to activate seismic signals, and diversity of petro-
logical features of erupted magmas have been studied
assuming a stagnant magma column [Jaupart and
Vergniolle, 1988; Ripepe et al., 2001; Lautze and Houghton,
2005] or an ascending magma [Parfitt, 2004]. A magma
column accommodating Strombolian eruptions, however, is
convecting in many cases, and consideration of counter-
flows in the convecting magma column may alter the
implications of the previous studies.
Figure 14. Schematic diagrams of excess degassing mechanisms during lava dome extrusions.(a) Permeable gas flow model [Edmonds et al., 2003]. The SO2-rich gases derived from a mafic magma atdepth ascend through a permeable volcanic conduit to the surface. Variation of SO2 emission rate iscontrolled by changes in volcanic conduit permeability through magma cooling, sealing by hydrothermalmineral precipitation, and closure of fractures and bubble networks. (b) Convecting magma columnmodel. Volcanic gases are continuously supplied by the magma convection in a volcanic conduit, and theSO2 emission rate is controlled by the convection rate. When the top of the convecting magma reachesthe surface, the degassed magma flows out from the conduit resulting in lava extrusion.
RG4005 Shinohara: EXCESS DEGASSING OF VOLCANOES
20 of 31
RG4005

5.4. Degassed Magma Chamber
[64] Excess degassing produces a large amount of
degassed magmas, which have less potential for future
eruptions and likely solidify in the crust to form intrusive
magma bodies (plutons). Degassed magmas produced by
degassing of a convecting magma column will solidify as
intrusive magma bodies soon after their return to a deep
magma chamber because their low water concentration
causes dehydration-driven crystallization [Blundy and
Cashman, 2005], and they have little potential to cause
future eruptions. Degassing of a convecting magma column
is not only a mechanism of continuous volcanic gas
discharge but also of continuous creation of large intrusive
magma bodies beneath volcanoes (i.e., endogenous or
cryptic growth of volcanoes [Francis et al., 1993]). The
density increase caused by degassing results in a measurable
gravity increase over scales of tens of kilometers, as
observed at Sakurajima and possibly at Etna volcanoes
[Locke et al., 2003]. Accumulation of the crystallized
magma beneath volcanoes will result in a dense body with
high seismic velocity, consistent with high-velocity zones
indicated by seismic tomography or dense bodies suggested
by gravity studies [De Luca et al., 1997].
[65] An eruption of bubble-accumulated magma removes
only the exsolved volatiles from the unerupted magma
(Figure 12), and the unerupted magma in a chamber still
maintains its dissolved volatiles at their saturation concen-
trations as a driving force for future eruptions. The uner-
upted magma, however, cannot cause excess degassing by
future eruption without additional volatile sources. Volatile
addition to the unerupted degassed magma is a possible
process, but it produced an even larger amount of unerupted
degassed magma. Therefore, in average, unerupted
degassed magma is solidified as intrusive magma bodies;
thus, excess degassing should be accompanied by formation
of large intrusive magma bodies.
[66] Solidification and degassing processes of magma
chambers control the petrological diversity of plutonic rocks
and the evolution of magmatic hydrothermal systems
[Candela, 1994; Shinohara and Kazahaya, 1995; Marsh,
2000]. Magmas degassed by convective magma column
degassing contain low concentrations of volatiles and can-
not be the volatile source of a magmatic hydrothermal
system. The degassed magma is still hot and can drive a
hydrothermal system dominated by meteoric water
[Cathles, 1977]. In contrast, magmas degassed by bubble
removal in a chamber still contain most of their original
H2O concentration and can create magmatic water-
dominated hydrothermal systems, closely related to ore
mineralization [Hedenquist and Lowenstern, 1994].
[67] The amount of the intrusive magma must be larger
than the erupted magma at subduction zone volcanoes, as
their eruption commonly results in excess degassing. Com-
parison of the erupted and intruded magma volumes esti-
mated from geological and geophysical evaluation of crustal
structures indicates that only 10–20% of the magmas
supplied to the upper crust have erupted, with the balance
of the magmas solidified in the crust [Crisp, 1984; Fisher
and Schmincke, 1984; White et al., 2006]. The intrusive/
extrusive volume ratio varies depending on tectonic setting:
about 10:1 at subduction zones, 5:1 at oceanic hot spots,
and 6:1 at ocean ridges [Crisp, 1984]. Since the geologi-
cally estimated ratio represents the results of a long history,
integration of the gas emission data in time and space is
necessary to compare with the geological estimate, as
discussed in section 6.
6. GLOBAL DEGASSING RATE
[68] The global emission rate of volcanic gases is impor-
tant to evaluate their time and space-integrated effect not
only on the crustal evolution but also on the global
environment [Berresheim and Jaeschke, 1983; Graf et al.,
1997]. Volcanic gas emissions, in particular SO2, have
significant effects on climate and atmospheric chemistry
[Robock, 2000]. Sulfur dioxide injected into stratosphere by
Plinian eruptions has a long residence time and will be
converted to sulfate aerosols, which scatter solar radiation
and cause cooling at the Earth’s surface [Bluth et al., 1997].
Volcanic eruptions are by far the largest contributor to
stratospheric sulfate aerosols [Pyle et al., 1996]. In contrast,
less violent eruptions, such as Hawaiian, lava flows, or lava
dome, as well as persistent degassing, cause a continuous
addition to the troposphere, resulting in near-surface envi-
ronmental effects [Andres and Kasgnoc, 1998]. In order to
evaluate these two effects separately, we must distinguish
the global emission rates of explosive eruptions and con-
tinuous degassing.
6.1. Global SO2 Emissions by Explosive Eruptions
[69] The TOMS instruments have provided almost con-
tinuous daily coverage of global volcanic activity since
1978 (Figure 9). During 1978–2001, TOMS detected 141
eruptive events with SO2 emissions, which include 100% of
volcanic explosivity index (VEI) > 4 eruptions and 60% of
VEI = 3 eruptions [Carn et al., 2003]. VEI is a logarithmic
scale of explosive eruptions based on both magnitude
(erupted volume) and intensity (eruption column height)
information [Newhall and Self, 1982]. The magnitude
portion of VEI (k) is described as follows [Pyle et al., 1996]:
k ¼ log10 Mð Þ � 4; ð4Þ
where M is erupted magma volume (m3) and k is equal to
VEI for explosive eruptions with a large eruption column.
This index has been adopted by the Smithsonian Institute in
their compilations of past volcanic eruptions and is widely
used [Simkin and Siebert, 1994]. This index is practical for
explosive eruptions but is not useful for effusive eruptions
whose eruption column height is small, resulting in a small
VEI even for a large eruption volume.
[70] Bluth et al. [1993] estimated an annual rate of global
SO2 emission from explosive eruptions as 3.7 Mt/a, with a
70% contribution from subduction zone volcanoes, on the
basis of a compilation of TOMS data during 1978–1992. In
contrast, the average annual SO2 emissions detected by
RG4005 Shinohara: EXCESS DEGASSING OF VOLCANOES
21 of 31
RG4005

TOMS in 1996–2001 was 0.8 Mt/a, with a contribution by
subduction zone volcanoes of only 15% (Table 5 [Carn et
al., 2003]). The large difference between these two esti-
mates is caused by the heterogeneous occurrence of erup-
tions over time. During 1978–1992, the total SO2 emission
was 52 Mt, of which more than half was emitted by two
eruptions: Pinatubo volcano in 1991 (20 Mt) and El
Chichon in 1982 (7 Mt). Since the frequency of larger
eruptions is smaller, we need to estimate a time-averaged
SO2 emission rate, considering contributions from large but
less frequent eruptions.
[71] The time-averaged frequency of past eruptions was
estimated on the basis of a comprehensive survey of past
volcanic eruptions with an eruption-size scale of VEI
[Simkin and Siebert, 1994]. Frequency of explosive erup-
tions is known to follow a power law distribution with the
following relationship (Figure 15a [Simkin, 1993; Pyle et
al., 1996]):
log10 l ¼ 2:83� 0:79k; ð5Þ
where l is the number of eruptions with a magnitude
between k and k + 1 per year (equation (4)). The intercept
and slope of the regression line vary about ±10% depending
on duration of the data set (Figure 15a [Pyle et al., 1996]).
On the basis of this relationship, a Pinatubo-class eruption
(VEI = 6) is expected to occur only once in every 100 years;
therefore, including the 1991 Pinatubo eruption in the
14 year sum of SO2 emissions caused an overestimate of the
average value.
Figure 15. Correlation between (a) frequency and magnitude of eruptions over the past 200 years and(b) average SO2 yields and magnitude of eruptions, reprinted from Pyle et al. [1996] with kindpermission of Springer Science and Business Media. In Figure 15a, eruption rates of volcanic explosivityindex (VEI) = 2 and 3 for the decade 1975–1985 [McClelland et al., 1989] are assumed to berepresentative of volcanic activity over the past 200 years; 50- and 200-year averaged rates were adoptedfor VEI = 4 and 5 eruptions [cf. Simkin, 1993]. Recurrence rates of VEI = 6 eruptions (200- and 500-yearaverage) [Simkin and Siebert, 1994] are shown for reference but were not included in the regression.Figure 15b shows data from the TOMS database [Bluth et al., 1993]. Because TOMS cannot sample alleruptions of VEI = 3 [Bluth et al., 1993; Krueger et al., 1995], only eruptions of VEI = 4–6 wereincluded. However, extrapolation to VEI = 3 does not significantly underestimate the SO2 yields perevent. Small dots are raw data from the TOMS database, and large dots show averaged value at a giveneruption magnitude. Error bars show ±0.5 log unit error, which covers 70% of spread of the data.
TABLE 5. Annual Flux of Volcanic SO2a
Activity Method Year Arc Volcanoes Nonarc Volcanoes Referencesb
Global fluxExplosive eruptions TOMS 1974–1994 2.6 1.1 1
TOMS 1996–2001 0.1 0.7 2VEI-SO2 relation (4 � VEI � 6) 0.9c 3
Continuous degassing COSPEC 9.2 0.5 4Continuous degassing activities
Popocatepetl volcano, Mexico 1994–2005 2.0 5Miyakejima volcano, Japan 2000–2007 2.8 6, 7aUnit is Mt/a. TOMS, Total Zone Mapping Spectrometer; VEI, volcanic explosivity index; COSPEC, correlation spectrometer.bReferences are as follows: 1, Bluth et al. [1993, 1997]; 2, Carn [2003]; 3, Pyle et al. [1996]; 4, Andres and Kasgnoc [1998]; 5, Witter et al. [2005]; 6,
Kazahaya et al. [2004]; 7, Japan Meteorology Agency Web site (http://www.seisvol.kishou.go.jp/tokyo/320_Miyakejima/320_So2emission.htm).cSum of the fluxes from arc and nonarc volcanoes.
RG4005 Shinohara: EXCESS DEGASSING OF VOLCANOES
22 of 31
RG4005

[72] The SO2 yields by eruptions increase with eruption
magnitude (Figure 15b [Pyle et al., 1996]):
log10 FSO2 ¼ 0:75k � 0:21; ð6Þ
where FSO2 is the SO2 yield (kt). The SO2 yields span a
wide range for eruptions of a given magnitude. If we allow a
±0.5 log unit error for SO2 yields for a given magnitude of
eruption, this accounts for 70% of spread of the data as
shown by the error bars on Figure 15b. On the basis of
equations (5) and (6), the annual SO2 emission for each
eruption size can be obtained. Pyle et al. [1996] estimated
an annual SO2 loading to stratosphere as 0.9 Mt by
considering all eruptions of 4 � VEI � 6 and 25% of VEI =
3 eruptions. If we also include all VEI = 3 and VEI =
7 eruptions in order to estimate an average SO2 emission,
the annual SO2 emission amounts to 1.3 Mt. Both estimates
are in the middle of the two averages of TOMS data from
1978 to 1992 (3.7 Mt/a) and 1996 to 2001 (0.8 Mt/a).
[73] Equation (6) implies that the average SO2 concen-
tration in erupted magmas is smaller for eruptions with
larger magnitude. Assuming magma density of 2500 kg/m3,
we can estimate that the average SO2 concentrations in
magmas are 800, 1400, and 2500 ppm for eruptions of VEI =
6, 5, and 4, respectively. This dependence is consistent with
the trend showing that smaller eruptions appear to have a
greater excess of SO2 than larger eruptions [Wallace, 2001].
Greater excess of SO2 might imply a larger contribution of
preeruptive gas phase accumulated in the upper part of a
magma chamber, either due to a relatively fixed amount of
bubble-rich magmas compared with a smaller volume of
erupted magmas or due to a larger degree of bubble accu-
mulation necessary to initiate a smaller eruption [Wallace,
2001].
[74] The regression lines given by equations (5) and (6)
were obtained for subaerial eruptions in all types of tectonic
settings, including subduction zones, rifts, and hot spots
(Figure 12), although this compilation is dominated by
subduction zone volcanoes; therefore the average SO2
emission rate obtained from equations (5) and (6) likely
underestimates the contribution from nonsubduction zone
volcanoes. Out of 122 VEI � 4 eruptions between 1500 and
1980, only 16 eruptions were reported for nonsubduction
zone volcanoes, including 12 eruptions in Iceland [Newhall
and Self, 1982, Table 4]. Therefore, the frequency magni-
tude relationship expressed by equation (5) is dominated by
that of subduction zone volcanoes. The dominance of
explosive eruptions at subduction zones is not due to the
difference in magma production rate because magma output
rates at subduction zone volcanoes and oceanic intraplate
volcanoes are comparable, at 0.4–0.6 and 0.3–0.4 km3/a,
respectively [Crisp, 1984]. Since the VEI is an index of
explosivity but not eruption volume, the VEI undervalues
the contribution of eruptions at divergent plate boundaries
and hot spots, which are dominated by effusive eruptions.
[75] The relationship between the eruption magnitude and
SO2 yield was also obtained with TOMS data for eruptions
only of subduction zone volcanoes (Figure 15b). Pyle et al.
[1996] compiled TOMS data of VEI � 4 eruptions during
1979–1993; all eruptions occurred at subduction zone
volcanoes. Eruptions at rift or hot spot volcanoes yield
larger amounts of SO2 than from similar magnitude erup-
tions at subduction zone volcanoes [Bluth et al., 1993], but
the eruption magnitudes and SO2 yields are poorly corre-
lated [Stoiber et al., 1987; Schnetzler et al., 1997]. The
TOMS data indicate that annual SO2 emission rates of large
eruptions at nonsubduction zone volcanoes are 1.1 and
0.7 Mt/a in 1974–1994 and 1996–2001, respectively [Bluth
et al., 1993; Carn et al., 2003]. The average values are
based on a short-period data set but indicate that SO2
emissions by large eruptions at divergent plate boundaries
and hot spots are comparable to the emissions from sub-
duction zones (Table 5). Degassing activity of nonsubduc-
tion zone volcanoes is quite localized. The SO2 emissions
are recorded only from volcanoes in Hawaii, Nyamuragira,
Iceland, and Galapagos (Figure 9).
6.2. Global SO2 Emission by Continuous Degassing
[76] Estimates of SO2 emission rates by continuous
degassing are obtained by repeated ground-based measure-
ments at individual volcanoes. Ideally, the global SO2
emission rate is based on a time-averaged compilation of
SO2 emission data from all degassing volcanoes; however,
this is limited by existing data, which are biased to volca-
noes in more populated regions. In order to include all
existing SO2 data, published references and personal com-
munication was used [Andres and Kasgnoc, 1998; Stoiber et
al., 1987]. Andres and Kasgnoc [1998] compiled 49 con-
tinuously degassing volcanoes and 25 sporadically degass-
ing volcanoes, with a global SO2 emission rate of 9.7 Mt/a
(Table 5).
[77] The compiled data indicate that continuous emis-
sions of SO2 are dominated by subduction zone volcanoes
(Table 5), with 9.2 Mt/a of SO2 out of the total of 9.7 Mt/a.
In contrast, SO2 emission from rifts and hot spots listed by
Andres and Kasgnoc [1998] was almost completely due to
emissions from Kilauea volcano, which emits 0.5 Mt/a of
SO2. Other listed volcanoes were Erebus volcano, Antarc-
tica (0.03 Mt/a), Erta’Ale volcano, Ethiopia (0.008 Mt/a),
and Ol Donyo Lengai carbonatite volcano, Kenya (0.006
Mt/a). Lava lake activity are also common at Nyamuragira
and Nyiragongo volcanoes [Tazieff, 1994], which emit large
amounts of SO2 during large eruptions as well as by
continuous degassing from the lava lake and effusive lavas;
however, their emission rates were not measured in suffi-
cient detail to allow a quantitative evaluation [Carn and
Bluth, 2003]. Other volcanoes at nonsubduction zones with
large magma eruption rates, such as at Iceland, Galapagos,
and Reunion, do not show intense continuous degassing
activity.
[78] In subduction zones, SO2 emission by continuous
degassing (9.2 Mt/a) is ten times larger than by explosive
eruptions (�1 Mt/a; Table 5). The larger SO2 emission
associated with continuous degassing but with little magma
eruption implies a large production rate of intrusive mag-
mas; this is consistent with a large intrusive/extrusive
RG4005 Shinohara: EXCESS DEGASSING OF VOLCANOES
23 of 31
RG4005

magma volume ratio of about 10:1 [Crisp, 1984; White et
al., 2006]. Although the ratio of explosive/continuous SO2
emission rates apparently agrees with the geologically
estimated intrusive/extrusive magma volume ratio, direct
comparison of these ratios is too simplistic because explo-
sive eruptions at subduction zone volcanoes are accompa-
nied by a large degree of excess degassing, in particular of
silicic volcanoes (Figures 10 and 12). If the excess SO2 is
supplied from unerupted silicic magma, the excess degass-
ing during explosive eruptions also causes a large intrusive/
extrusive magma volume ratio that results in a much larger
ratio than the geologically estimated ratio that is suggested
from the SO2 emission data. In contrast, SO2-rich gas
supply from S-rich basaltic magma does not require a large
intrusive/extrusive magma volume ratio for explosive erup-
tions, and a total intrusive/extrusive magma volume ratio
including contribution of continuous degassing may result
in a similar number with the geologically estimated ratio. In
this case, unerupted magma is dominated by basalt and
andesite, as continuous degassing is dominated by basaltic
and andesitic volcanoes (Table 4). This estimate, however,
does not agree with the view that an averaged chemical
composition of the upper crust at young subduction zones is
andesitic to dacitic [Taylor and McLennan, 1995; Togashi et
al., 2000]. Quantification of the contribution of magmas
with different composition to excess degassing is necessary
not only to understand the origin of excess degassing but
also to understand the crustal growth process.
[79] Volcanoes at rift and hot spots do not show excess
degassing, either during large eruptions or due to continu-
ous degassing; the lack of excess degassing appears to
indicate little degassing from unerupted magma, implying
the absence of intrusive activity. Intrusive to extrusive
volume ratios at Iceland and Hawaii are estimated as 1:1
to 8:1, on the basis of a geological and geophysical
evaluation of crustal structure [Crisp, 1984; White et al.,
2006]. The small but still significant ratios contradict the
observed lack of excess degassing. The lack of excess
degassing could be due to a lack of SO2 measurements
during excess degassing periods. On the basis of ground
deformation study, magma supply rate to Kilauea volcano
was estimated to be constant for 1961–1992 at 0.18 km3/a,
whereas eruption rates were variable from almost zero in
1976–1982 to 0.1 km3/a in 1983–1997, implying that
intrusive activity was minor in 1983–1997 but was signif-
icant in 1976–1982; the lack of excess degassing was
estimated on the basis of systematic SO2 measurements
starting from 1979 [Cayol et al., 2000; Sutton et al., 2001].
In order to evaluate the excess degassing of a volcano, we
may require a data set for a longer period of time to cover
the long-term variation of activity.
[80] The global estimate for continuously degassing vol-
canoes is limited by the existing data set, and the present
compilation provides only a minimum estimate. In contrast
to localized activity at rifts and hot spots, there are many
more volcanoes associated with subduction zones. The
global emission rate is controlled mainly by contributions
from a few volcanoes. The top five volcanoes listed in
Table 4 yield more than half of the global emissions.
Therefore, lack of data for a few large degassing volcanoes
will result in a large underestimate. For example, two large
emissions were reported after publication of the compilation
by Andres and Kasgnoc [1998]: Popocatepetl volcano,
Mexico, discharged 20 Mt SO2 during 1994–2005 [Witter
et al., 2005], and Miyakejima volcano, Japan, discharged 20
Mt SO2 in 2000–2007 [Kazahaya et al., 2004; Japan
Meteorology Agency Web site, http://www.seisvol.kishou.
go.jp/tokyo/320_Miyakejima/320_So2emission.htm]. Con-
sidering a few other possibly large contributions from
Ambrym volcano, Vanuatu [Bani et al., 2008], and Nya-
muragira and Nyiragongo volcanoes, Congo [Carn et al.,
2003; Carn, 2003], global SO2 emissions by continuously
degassing may be double the present estimate. A new satellite
sensor, OMI, can quantify SO2 emission from continuously
degassing volcanoes to the lower troposphere [Krotkov et al.,
2006], and its daily and global coverage of degassing activity
will largely improve the global estimate in the near future.
[81] The present evaluation of global emission rate is
based only on SO2 emission rate from summit craters, but
magmatic gas components are also discharged by diffuse
emission of soil gas, hot spring, and groundwater. Waters in
volcanic edifice dissolve magmatic gases, resulting in
reduction of emission rate from summit craters [Symonds
et al., 2001]. But magmatic gas entrapment by waters
effectively occurs at low gas emission rate [Symonds et
al., 2001]; the large SO2 emission rates from summit crater,
as listed in Table 4, are less likely be affected by the
entrapment process. Diffuse emission of magmatic gas
components is also observed at apparently dormant volca-
noes such as at central Oregon Cascades, United States,
with emission rate of 32 t/d of CO2 (from a 75-km-long
segment [James et al., 1999]) and 14 t/d of Cl (from a
260-km-long segment [Hurwitz et al., 2005]). A significant
amount of diffuse emission of magmatic CO2 gas through
soil is observed both at actively degassing volcanoes and
apparently dormant volcanoes, such as at Mammoth Moun-
tain, United States [Allard et al., 1991; Farrar et al., 1995].
Although a range of diffuse CO2 emission rate is estimated
at actively degassing volcanoes from negligible emission to
equal contribution to summit emission, the contribution
may not exceed 10% of the summit emission in many cases
[Kerrick, 2001]. Although the rate of diffuse emission is
commonly small, it may contribute to volatile budget of a
magmatic system because of its long-lived activity and also
to global emission rates because of its wide distribution.
Incorporation of diffuse emission data is necessary for better
evaluation of volatile budget in a magmatic system as well
as in a global scale; however, the number of diffuse
emission rate data is still limited, and a better database is
necessary to integrate them in a time and space-averaged
estimate.
7. SUMMARY AND PROBLEMS
[82] Large excess degassing is associated with various
volcanic activities, including explosive and effusive erup-
RG4005 Shinohara: EXCESS DEGASSING OF VOLCANOES
24 of 31
RG4005

tions and during persistent degassing with and without
eruptive activity. On average, an order of magnitude larger
amount of magma in a crustal magma chamber supplies
gases to cause the excess degassing, and the degassed
chamber solidifies to form a pluton. Excess degassing
during explosive eruption is caused by magmas that accu-
mulate bubbles, either from a large silicic magma body or
via a S-rich basaltic magma that provides excess gas to the
silicic magma before eruption. Large excess degassing is
caused by persistent degassing without magma discharge
and is caused by transport volatile components from a large
magma chamber, either through convecting magma column
degassing or by gas phase flow through a permeable
volcanic conduit. Excess degassing is an important concept
to understand the volatile budget, eruption mechanisms, and
differentiation of magmas in the crust, but major questions,
such as mechanism, source, and causes of excess degassing,
are not yet well understood.
[83] Three different models have been proposed to ex-
plain excess degassing under different conditions. These
models are based largely on the sulfur budget, and they have
yet to be confirmed by independent evidence. Volcanic gas
is dominated by H2O and CO2, and this composition can
provide constraints to the origin of the volatiles, such as
source magma composition or degassing pressure. For
example, contrasting degassing pressures are estimated on
the basis of volcanic gas compositions emitted during
Strombolian eruptions and persistent degassing [Burton et
al., 2007a; Edmonds and Gerlach, 2007]. The volcanic gas
composition data, however, are still quite limited, in partic-
ular for volatiles emitted during eruptions. Accumulation of
volcanic gas composition data is necessary to constrain the
mechanisms and conditions of degassing as well as to
evaluate the relative contribution of different excess degass-
ing mechanisms.
[84] Excess degassing mechanisms are coupled to erup-
tion processes. Examples of excess degassing and their
models revealed magma–gas phase differentiation process-
es in a magma chamber and conduit system, and the
differentiation processes control degassing and eruption
styles. Degree of excess degassing during Plinian eruption
is larger with smaller eruption, suggesting that the eruption
triggering is controlled by the content of accumulated
bubbles, although the quantified examples are still limited.
Strombolian, Vulcanian, and lava dome eruptions are com-
monly associated with persistent degassing, implying oc-
currence of these eruptions either through a convecting
magma column or through a gas-permeable volcanic con-
duit. Eruption models commonly consider a stagnant or
rising magma column, but these excess degassing mecha-
nism models need to be incorporated to the eruption models
that will also provide, in turn, a test of the excess degassing
mechanism models.
[85] The original source of excess degassing is not yet
clear, in particular for silicic volcanism. Excess amounts of
volatiles emitted from silicic volcanoes are derived either
from a unerupted magma of the same composition as the
erupted magmas or from an unerupted S-rich basaltic
magma. The former model is simple and possible, at least
to some degree, in all cases, but contribution of basaltic
magmas is commonly observed in eruption products of
silicic magma eruption, and there is also evidence of SO2-
rich gas supply from basaltic magma in some cases, such as
for the 1991 Pinatubo eruption. The relative importance of
these two magma sources, however, has not been studied for
many other eruptions, and it is necessary to evaluate it not
only for excess degassing mechanisms but also to under-
stand evolution of magmas in a chamber and the present
crustal growth through solidification of degassed magma.
[86] ACKNOWLEDGMENTS. I would like to thank J. W.
Hedenquist, J. B. Lowenstern, C. Oppenheimer, A. Namiki,
I. Sumita, and T. Kawamoto for detailed reviews of early versions
of this manuscript and S. Carn, G. Wadge, P. Delmelle, Toshiya
Mori, and S. Takeuchi for constructive comments on the manu-
script. K. Kazahaya, A. Aiuppa, G. Saito, and N. Matsushima
shared their insights, and M. Someya helped drafting figures.
Careful and constructive reviews by B. Scaillet, P. Wallace, an
anonymous reviewer, and the journal editor, M. Manga, are deeply
appreciated.
[87] The Editor responsible for this paper was Michael Manga.
He thanks Bruno Scaillet and Paul Wallace as the technical
reviewers along with one anonymous technical reviewer.
REFERENCES
Aiuppa, A., C. Federico, G. Giudice, and S. Gurrieri (2005), Che-mical mapping of a fumarolic field: La Fossa Crater, VulcanoIsland (Aeolian Islands, Italy), Geophys. Res. Lett., 32, L13309,doi:10.1029/2005GL023207.
Allard, P., et al. (1991), Eruptive and diffuse emissions of CO2
from Mount Etna, Nature, 351, 387 – 391, doi:10.1038/351387a0.
Allard, P., J. Carbonnelle, N. Metrich, H. Loyer, and P. Zettwoog(1994), Sulphur output and magma degassing budget of Strom-boli volcano, Nature, 368, 326–330, doi:10.1038/368326a0.
Anderson, A. T., Jr., S. Newman, S. N. Williams, T. H. Druitt,C. Skirius, and E. Stolper (1989), H2O, CO2, Cl and gas inPlinian and ash-flow Bishop rhyolite, Geology, 17, 221–225,doi:10.1130/0091-7613(1989)017<0221:HOCCAG>2.3.CO;2.
Andres, R. J., and A. D. Kasgnoc (1998), A time-averaged inven-tory of subaerial volcanic sulfur emissions, J. Geophys. Res.,103, 25,251–25,261, doi:10.1029/98JD02091.
Andres, R. J., P. R. Kyle, J. B. Stokes, and W. I. Rose (1989), SO2
from the episode 48A East Rift Zone eruption of Kilaueavolcano, Hawaii, Bull. Volcanol., 52, 113–117, doi:10.1007/BF00301550.
Andres, R. J., W. I. Rose, P. R. Kyle, S. de Silva, P. Francis,M. Gardeweg, and H. Moreno Roa (1991), Excessive sulfur diox-ide emissions from Chilean volcanoes, J. Volcanol. Geotherm.Res., 46, 323–329, doi:10.1016/0377-0273(91)90091-D.
Aspinall, W. P., A. D. Miller, L. L. Lych, J. L. Latchman, R. C.Stewart, R. A. White, and J. A. Power (1998), Soufriere Hillseruption, Montserrat, 1995–1997: Volcanic earthquake locationsand fault plane solutions, Geophys. Res. Lett., 25, 3397–3400,doi:10.1029/98GL00858.
Bachmann, O., and G. W. Bergantz (2006), Gas percolation inupper-crustal silicic crystal mushes as a mechanism for upwardheat advection and rejuvenation of near-solidus magma bodies,J. Volcanol. Geotherm. Res., 149, 85 – 102, doi:10.1016/j.jvolgeores.2005.06.002.
Bacon, C. R. (1986), Magmatic inclusions in silicic and intermediatevolcanic rocks, J. Geophys. Res., 91, 6091–6112, doi:10.1029/JB091iB06p06091.
RG4005 Shinohara: EXCESS DEGASSING OF VOLCANOES
25 of 31
RG4005

Bani, P., C. Oppenheimer, V. I. Tsanev, S. A. Carn, S. J. Cronin,R. Crimp, J. A. Calkins, D. Charley, and M. Lardy (2008), Firstmeasurements of sulphur and bromine degassing from Ambrymvolcano, Vanuatu, Bull. Volcanol., in press.
Barclay, J., M. J. Rutherford, M. R. Carrol, M. D. Murphy, J. D.Devine, J. Gardner, and R. S. J. Sparks (1998), Experimentalphase equilibria constraints on pre-eruptive storage conditionsof the Soufriere Hills magma, Geophys. Res. Lett., 25, 3437–3440, doi:10.1029/98GL00856.
Bernard, A., D. Demaiffe, N. Mattielli, and R. S. Punongbayan(1991), Anhydrite-bearing pumices from Mount Pinatubo:Further evidence for the existence of sulfur-rich silicic magmas,Nature, 354, 139–140, doi:10.1038/354139a0.
Berresheim, H., and W. Jaeschke (1983), The contribution of vol-canoes to the global atmospheric sulfur budget, J. Geophys. Res.,88, 3732–3740, doi:10.1029/JC088iC06p03732.
Bertagnini, A., N. Metrich, P. Landi, and M. Rosi (2003), Strom-boli volcano (Aeolian Archipelago, Italy): An open window onthe deep-feeding system of a steady state basaltic volcano,J. Geophys. Res., 108(B7), 2336, doi:10.1029/2002JB002146.
Blundy, J., and K. Cashman (2005), Rapid decompression-drivencrystallization recorded by melt inclusions from Mount St.Helens, Geology, 33, 793–796, doi:10.1130/G21668.1.
Bluth, G. J. S., C. C. Schnetzler, A. J. Krueger, and L. S. Walter(1993), The contribution of explosive volcanism to global atmo-spheric sulphur dioxide concentrations, Nature, 366, 327–329,doi:10.1038/366327a0.
Bluth, G. J., C. J. Scott, I. E. Sprod, C. C. Schnetzler, A. J.Krueger, and L. S. Walter (1995), Explosive emissions of sulfurdioxide from the 1992 Crater Peak eruptions, in The 1992Eruptions of Crater Peak Vent, Mount Spurr, Volcano, Alaska,edited by T. E. C. Keith, U.S. Geol. Surv. Bull., 3139, 37–45.
Bluth, G. J. S., I. William, I. E. Sprod, C. C. Schnetzler, A. J.Krueger, and A. J. Krueger (1997), Stratospheric loading of sul-fur from explosive volcanic eruptions, J. Geol., 105, 671–683.
Bureau, H., N. Metrich, and M. P. Semet (1999), Fluid-magmadecoupling in a hot-spot volcano, Geophys. Res. Lett., 26,3501–3504, doi:10.1029/1999GL005422.
Burgisser, A., and B. Scaillet (2007), Redox evolution of a degas-sing magma rising to the surface, Nature, 445, 194–197,doi:10.1038/nature05509.
Burnham, C. W. (1967), Hydrothermal fluids at the magmaticstage, in Geochemistry of Hydrothermal Ore Deposits, editedby H. L. Barnes, pp. 34–76, Holt, Rinehart, and Winston,New York.
Burton, M. R., C. Oppenheimer, L. A. Horrocks, and P. W.Francis (2000), Remote sensing of CO2 and H2O emission ratesfrom Masaya volcano, Nicaragua, Geology, 28, 915–918,doi:10.1130/0091-7613(2000)28<915:RSOCAH>2.0.CO;2.
Burton, M. R., P. Allard, F. Mure, and A. La Spina (2007a), Mag-matic gas composition reveals the source depth of slug-drivenStrombolian explosive activity, Science, 317, 227 – 230,doi:10.1126/science.1141900.
Burton, M. R., H. M. Mader, and M. Polacci (2007b), The role ofgas percolation in quiescent degassing of persistently active ba-saltic volcanoes, Earth Planet. Sci. Lett., 264, 46 – 60,doi:10.1016/j.epsl.2007.08.028.
Candela, P. A. (1994), Combined chemical and physical modelfor plutonic devolatilization: A non-Rayleigh fractionationalgorithm, Geochim. Cosmochim. Acta, 58, 2157 – 2167,doi:10.1016/0016-7037(94)90002-7.
Carn, S. A. (2003), Eruptive and passive degassing of sulphurdioxide at Nyiragongo volcano (D.R. Congo): The 17 January2002 eruption and its aftermath, Acta Vulcanol., 14, 75–86.
Carn, S. A., and G. J. S. Bluth (2003), Prodigious sulfur dioxideemissions from Nyamuragira volcano, D.R. Congo, Geophys.Res. Lett., 30(23), 2211, doi:10.1029/2003GL018465.
Carn, S. A., A. J. Krueger, G. J. S. Bluth, S. J. Schaefer, N. A.Krotkov, I. M. Watson, and S. Darra (2003), Volcanic eruptiondetection by the Total Ozone Mapping Spectrometer (TOMS)
instruments: A 22-year record of sulphur dioxide and ash emis-sions, in Volcanic Degassing, edited by C. Oppenheimer, D. M.Pyle, and J. Barclay, Geol. Soc. Spec. Publ., 212, 177–202.
Carrol, M. R., and M. J. Rutherford (1985), Sulfide and sulfatesaturation in hydrous silicate melts, J. Geophys. Res., 90, 601–612.
Carrol, M. R., and J. D. Webster (1994), Solubilities of sulfur, noblegases, nitrogen, chlorine, and fluorine in magmas, in Volatiles inMagmas, Rev. Mineral., vol. 30, edited by M. R. Carroll and J. R.Holloway, pp. 231–279, Mineral. Soc. of Am., Washington, D. C.
Cathles, L. M. (1977), An analysis of the cooling of intrusives byground-water convection which includes boiling, Econ. Geol.,72, 804–826.
Cayol, V., J. H. Dieterich, A. T. Okamura, and A. Miklius (2000),High magma storage rates before the 1983 eruption of Kilauea,Hawaii, Science, 288, 2343 – 2345, doi:10.1126/science.288.5475.2343.
Cervantes, P., and P. J. Wallace (2003a), Role of H2O in subduc-tion-zone magmatism: New insights from melt inclusions inhigh-Mg basalts from central Mexico, Geology, 31, 235–238,doi:10.1130/0091-7613(2003)031<0235:ROHOIS>2.0.CO;2.
Cervantes, P., and P. J. Wallace (2003b), Magma degassing andbasaltic eruption styles: A case study of the 2000 yr B.P. eruptionof Xitle volcano, central Mexico, J. Volcanol. Geotherm. Res.,120, 249–270, doi:10.1016/S0377-0273(02)00401-8.
Chiodini, G., R. Cioni, and L. Marini (1993), Reactions governingthe chemistry of crater fumaroles of Volcano Island, Italy andimplications for volcanic surveillance, Appl. Geochem., 8, 357–371, doi:10.1016/0883-2927(93)90004-Z.
Cioni, R., P. Marianelli, R. Santacroce, and A. Sbrana (2000),Plinian and Subplinian eruptions, in Encyclopedia of Volcanoes,edited by H. Sigurdsson, pp. 477–494, Academic, San Diego,Calif.
Clague, D. A., J. G. Moore, J. E. Dixon, and W. B. Friesen (1995),Petrology of submarine lavas from Kilauea’s Puna Ridge, Hawaii,J. Petrol., 36, 299–349.
Costa, F., B. Scaillet, and A. Gourgaud (2003), Massive atmo-spheric sulfur loading of the AD 1600 Huaynaputina eruption,Geophys. Res. Lett., 30(2), 1068, doi:10.1029/2002GL016402.
Crisp, J. A. (1984), Rates of magma emplacement and volcanicoutput, J. Volcanol. Geotherm. Res., 20, 177–211, doi:10.1016/0377-0273(84)90039-8.
de Hoog, J. C. M., G. W. Koetsier, S. Bronto, T. Sriwana, and M. J.van Bergen (2001), Sulfur and chlorine degassing from primitivearc magmas: Temporal changes during the 1982–1983 eruptionsof Galunggung (west Java, Indonesia), J. Volcanol. Geotherm.Res., 108, 55–83, doi:10.1016/S0377-0273(00)00278-X.
Delgado-Granados, H., L. Cardenas Gonzalez, and N. PiedadSanchez (2001), Sulfur dioxide emissions from Popocatepetlvolcano (Mexico): Case study of a high-emission rate, passivelydegassing erupting volcano, J. Volcanol. Geotherm. Res., 108,107–120, doi:10.1016/S0377-0273(00)00280-8.
Delmas, R. J. (1992), Environmental information from ice cores,Rev. Geophys., 30, 1–21, doi:10.1029/91RG02725.
De Luca, G., L. Filippi, G. Patane, R. Scarpa, and S. Vinciguerra(1997), Three-dimensional velocity structure and seismicity ofMt. Etna volcano, Italy, J. Volcanol. Geotherm. Res., 79, 123–138, doi:10.1016/S0377-0273(97)00026-7.
de Silva, S., and G. Zielinski (1998), Global influence of the AD1600 eruption of Huaynaputina, Peru, Nature, 393, 455–457,doi:10.1038/30948.
Devine, J. D., H. Sigurdsson, A. N. Davis, and S. Self (1984),Estimates of sulfur and chlorine yield to the atmosphere fromvolcanic eruptions and potential climatic effects, J. Geophys.Res., 89, 6309–6325.
DiMuro, A., B. Villemant, G.Montgnac, B. Scaillet, andB. Reynard(2006), Quantification of water content and speciation in naturalsilicic glasses (phonolite, dacite, rhyolite) by confocal microRa-man spectrometry, Geochim. Cosmochim. Acta, 70, 2868–2884,doi:10.1016/j.gca.2006.02.016.
RG4005 Shinohara: EXCESS DEGASSING OF VOLCANOES
26 of 31
RG4005

Doglioni, C., F. Innocenti, and G. Mariotti (2001), Why Mt. Etna?,Terra Nova, 13, 25–31, doi:10.1046/j.1365-3121.2001.00301.x.
Duffell, H. J., C. Oppenheimer, D. M. Pyle, B. Galle, A. J. S.McGonigle, and M. R. Burton (2003), Changes in gas composi-tion prior to a minor explosive eruption at Masaya volcano,Nicaragua, J. Volcanol. Geotherm. Res., 126, 327 – 339,doi:10.1016/S0377-0273(03)00156-2.
Edmonds, M., and T. M. Gerlach (2007), Vapor segregation andloss in basaltic melts, Geology, 35, 751–754, doi:10.1130/G23464A.1.
Edmonds, M., D. Pyle, and C. Oppenheimer (2001), A model fordegassing at the Soufriere Hills Volcano, Montserrat, West In-dies, based on geochemical data, Earth Planet. Sci. Lett., 186,159–173, doi:10.1016/S0012-821X(01)00242-4.
Edmonds, M., C. Oppenheimer, D. M. Pyle, R. A. Herd, andG. Thompson (2003), SO2 emissions from Soufriere Hills volcanoand their relationship to conduit permeability, hydrothermal inter-action and degassing regime, J. Volcanol. Geotherm. Res., 124,23–43, doi:10.1016/S0377-0273(03)00041-6.
Eichelberger, J. C. (1980), Vesiculation of mafic magmaduring replenishment of silicic magma reservoirs, Nature, 288,446–450, doi:10.1038/288446a0.
Eichelberger, J. C. (1995), Ascent of viscous magmas from crustalreservoirs, Annu. Rev. Earth. Planet. Sci., 23, 41 – 63,doi:10.1146/annurev.ea.23.050195.000353.
Eichelberger, J. C., C. R. Carrigan, H. R. Westrich, and J. R.Shannon (1986), Non-explosive volcanism, Nature, 323, 598–602, doi:10.1038/323598a0.
Farrar, C. D., M. L. Sorey, W. C. Evans, J. F. Howele, B. D. Kerr,B. M. Kennedy, C.-Y. King, and J. R. Southon (1995), Forest-killing diffuse CO2 emission at Mammoth Mountain as a sign ofmagmatic unrest, Nature, 376, 675–678, doi:10.1038/376675a0.
Fischer, T. P., G. B. Arehart, N. C. Sturchio, and S. N.Williams (1996), The relationship between fumarole gas compo-sition and eruptive activity at Galeras volcano, Colombia,Geology, 24, 531–534, doi:10.1130/0091-7613(1996)024<0531:TRBFGC>2.3.CO;2.
Fisher, R. V., and H.-U. Schmincke (1984), Pyroclastic Rocks,Springer, Berlin.
Fournelle, J. (1990), Anhydrite in Nevado del Ruiz November 1985pumice: Relevance to the sulfur problem, J. Volcanol. Geotherm.Res., 42, 189–210, doi:10.1016/0377-0273(90)90076-R.
Francis, P. W., C. Oppenheimer, and D. Stevenson (1993), Endo-genous growth of persistently active volcanoes, Nature, 366,554–557, doi:10.1038/366554a0.
Friend, J. P., A. R. Bandy, J. L. Moyers, W. H. Zoller, R. E.Stoiber, A. L. Torres, W. I. Rose Jr., M. P. McCormick, andD. C. Woods (1982), Research on atmospheric volcanic emis-sions: An overview, Geophys. Res. Lett., 9, 1101 – 1104,doi:10.1029/GL009i009p01101.
Galle, B., C. Oppenheimer, A. Geyer, A. J. S. McGonigle,M. Edmonds, and L. Horrocks (2002), A miniaturized ultravioletspectrometer for remote sensing of SO2 fluxes: A new tool forvolcano surveillance, J. Volcanol. Geotherm. Res., 119, 241–254, doi:10.1016/S0377-0273(02)00356-6.
Gerlach, T. M., and K. A. McGee (1994), Total sulfur dioxideemissions and pre-eruption vapor-saturated magma at MountSt. Helens, 1980–88, Geophys. Res. Lett., 21, 2833–2836,doi:10.1029/94GL02761.
Gerlach, T. M., and K. A. McGee (1998), Rates of volcanic CO2
degassing from airborne determinations of SO2 emission ratesand plume CO2/SO2: Test study at Puu Oo cone, Kilauea volca-no, Hawaii, Geophys. Res. Lett., 25, 2675–2678, doi:10.1029/98GL02030.
Gerlach, T. M., H. R. Westrich, T. J. Casadevall, and D. L.Finnegan (1994), Vapor saturation and accumulation in magmasof the 1989 – 1990 eruption of Redoubt volcano, Alaska,J. Volcanol. Geotherm. Res., 62, 317–337, doi:10.1016/0377-0273(94)90039-6.
Gerlach, T. M., H. R. Westrich, and R. B. Symonds (1996), Pre-eruption vapor in magma of the climactic Mount Pinatubo erup-tion: Source of the giant stratospheric sulfur dioxide cloud, inFire and Mud: Eruptions and Lahars of Mount Pinatubo, Phi-lippines, edited by C. G. Newhall and R. S. Punongbayan, pp.415–433, Univ. of Wash. Press, Seattle.
Gerlach, T. M., H. Delgado, K. A. McGee, M. P. Doukas, J. J.Venegas, and L. Cardnas (1997), Application of the LI–CORCO2 analyzer to volcanic plumes: A case study, Volcan Popoca-tepetl, Mexico, June 7 and 10, 1995, J. Geophys. Res., 102,8005–8019, doi:10.1029/96JB03887.
Gerlach, T. M., K. A. McGee, T. Elias, A. J. Sutton, and M. P.Doukas (2002), Carbon dioxide emission rate of Kilauea Volca-no: Implications for primary magma and the summit reservoir,J. Geophys. Res., 107(B9), 2189, doi:10.1029/2001JB000407.
Giggenbach, W. F. (1987), Redox processes governing thechemistry of fumarolic gas discharges from White Island, NewZealand, Appl. Geochem., 2, 143 – 161, doi:10.1016/0883-2927(87)90030-8.
Giggenbach, W. F. (1996), Chemical composition of volcanicgases, in Monitoring and Mitigation of Volcanic Hazards, editedby R. Scarpa and R. I. Tilling, pp. 221–256, Springer, Berlin.
Giggenbach, W. F., and F. Le Guern (1976), The chemistry ofmagmatic gases from Erta’Ale, Ethiopia, Geochim. Cosmochim.Acta, 40, 25–30, doi:10.1016/0016-7037(76)90190-3.
Gonnermann, H. M., and M. Manga (2007), The fluid mechanicsinside a volcano, Annu. Rev. Fluid Mech., 39, 321 – 356,doi:10.1146/annurev.fluid.39.050905.110207.
Graedel, T. (1977), The homogeneous chemistry of atmosphericsu l fu r, Rev. Geophys . , 15 , 421 – 428 , doi :10 .1029/RG015i004p00421.
Graf, H.-F., J. Feichter, and B. Langmann (1997), Volcanic sulfuremission: Estimates of source strength and its contribution to theglobal sulfate distribution, J. Geophys. Res., 102, 10,727–10,738, doi:10.1029/96JD03265.
Gurenko, A. A., A. B. Belousov, R. B. Trumbull, and A. V. Sobolev(2005), Explosive basaltic volcanism of the Chikurachki volcano(Kurile arc, Russia): Insights on pre-eruptive magmatic conditionsand volatile budget revealed from phenocryst-hosted melt inclu-sions and groundmass glasses, J. Volcanol. Geotherm. Res., 147,203–232, doi:10.1016/j.jvolgeores.2005.04.002.
Hammer, C. U., H. B. Clausen, and W. Dansgaard (1980), Green-land ice sheet evidence of post-glacial volcanism and its climaticimpact, Nature, 288, 230–235, doi:10.1038/288230a0.
Hammer, C. U., H. B. Clausen, W. L. Friedrich, and H. Tauber(1987), The Minoan eruption of Santorini in Greece dated to1645 BC?, Nature, 328, 517–519, doi:10.1038/328517a0.
Harris, A., and M. Ripepe (2007), Temperature and dynamics ofdegassing at Stromboli, J. Geophys. Res., 112, B03205,doi:10.1029/2006JB004393.
Harris, A. J. L., and D. S. Stevenson (1997), Thermal observationsof degassing open conduits and fumaroles at Stromboli and Vul-cano using remotely sensed data, J. Volcanol. Geotherm. Res.,76, 175–198, doi:10.1016/S0377-0273(96)00097-2.
Harris, A. J. L., L. P. Flynn, D. A. Rothery, C. Oppenheimer, andS. B. Sherman (1999), Mass flux measurements at active lavalakes: Implications for magma recycling, J. Geophys. Res., 104,7117–7136, doi:10.1029/98JB02731.
Harris, D. M., and A. T. Anderson Jr. (1984), Volatiles H2O, CO2,and Cl in a subduction related basalt, Contrib. Mineral. Petrol.,87, 120–128, doi:10.1007/BF00376218.
Harris, D. M., M. Sato, T. J. Casadevall, W. I. Rose, and T. J.Bornhorst (1981), Emission rate of CO2 from plume measure-ments, in The 1980 Eruptions of Mount St. Helens, Washington,U.S. Geol. Surv. Prof. Pap., 1250, 201–207.
Hattori, K. (1993), High-sulfur magma, a product of fluid dis-charge from underlying mafic magma: Evidence from MountPinatubo, Philippines, Geology, 21, 1083–1086, doi:10.1130/0091-7613(1993)021<1083:HSMAPO>2.3.CO;2.
RG4005 Shinohara: EXCESS DEGASSING OF VOLCANOES
27 of 31
RG4005

Hattori, K. (1996), Occurrence and origin of sulfide and sulfate inthe 1991 Mount Pinatubo eruption products, in Fire and Mud:Eruptions and Lahars of Mount Pinatubo, Philippines, edited byC. G. Newhall and R. S. Punongbayan, pp. 807–824, Univ. ofWash. Press, Seattle.
Hauri, E. (2002), SIMS analysis of volatiles in silicate glasses, 2:Isotopes and abundances in Hawaiian melt inclusions, Chem.Geol., 183, 115–141, doi:10.1016/S0009-2541(01)00374-6.
Hedenquist, J. W., and J. B. Lowenstern (1994), The role of mag-mas in the formation of hydrothermal ore deposits, Nature, 370,519–527, doi:10.1038/370519a0.
Hekinian, R., F. Pineau, S. Shilobreeva, D. Bideau, E. Gracia, andM. Javoy (2000), Deep sea explosive activity on the Mid-Atlan-tic Ridge near 34�500N: Magma composition, vesicularity, andvolatile content, J. Volcanol. Geotherm. Res., 98, 49 –77,doi:10.1016/S0377-0273(99)00190-0.
Hildreth, W. (1981), Gradients in silicic magma chambers: Impli-cations for lithospheric magmatism, J. Geophys. Res., 86(B11),10,153–10,192.
Hirabayashi, J., J. Ossaka, and T. Ozawa (1986), Geochemicalstudy on volcanic gases at Sakurajima volcano, Japan, J. Geo-phys. Res., 91, 12,167–12,176, doi:10.1029/JB091iB12p12167.
Hirabayashi, J., T. Ohba, K. Nogami, and M. Yoshida (1995),Discharge rate of SO2 from Unzen volcano, Kyushu, Japan,Geophys. Res. Lett., 22, 1709–1712, doi:10.1029/95GL01319.
Holloway, J. R. (1976), Fluid in the evolution of granitic mag-mas: Consequences of finite CO2 solubility, Geol. Soc. Am.Bull., 87, 1513–1518, doi:10.1130/0016-7606(1976)87<1513:FITEOG>2.0.CO;2.
Holloway, J. R., and J. G. Blank (1994), Application of experi-mental results to C-O-H species in natural melts, in Volatiles inMagmas, Rev. Mineral., vol. 30, edited by M. R. Carroll and J. R.Holloway, pp. 187–230, Mineral. Soc. of Am., Washington, D. C.
Hurwitz, S., R. H. Mariner, U. Fehn, and G. T. Snyder (2005),Systematics of halogen elements and their radioisotopes in ther-mal springs of the Cascade Range, central Oregon, western USA,Earth Planet. Sci. Lett., 235 , 700 – 714, doi:10.1016/j.epsl.2005.04.029.
Ihinger, P. D., R. L. Hervig, and P. F. McMillan (1994), Analyticalmethods for volatiles in glasses, in Volatiles in Magmas, Rev.Mineral., vol. 30, edited by M. R. Carroll and J. R. Holloway,pp. 67–129, Mineral. Soc. of Am., Washington, D. C.
James, E. R., M. Manga, and T. P. Rose (1999), CO2 degassing inthe Oregon Cascades, Geology, 27, 823–826, doi:10.1130/0091-7613(1999)027<0823:CDITOC>2.3.CO;2.
Jaupart, C., and S. Vergniolle (1988), Laboratory models of Ha-waiian and Strombolian eruptions, Nature, 331, 58 – 60,doi:10.1038/331058a0.
Kazahaya, K., H. Shinohara, and G. Saito (1994), Excessive de-gassing of Izu-Oshima volcano: Magma convection in a conduit,Bull. Volcanol., 56, 207–216, doi:10.1007/BF00279605.
Kazahaya, K., H. Shinohara, and G. Saito (2002), Degassing pro-cess of Satsuma-Iwojima volcano, Japan: Supply of volatile com-ponents from a deep magma chamber, Earth Planets Space, 54,327–335.
Kazahaya, K., H. Shinohara, K. Uto,M. Odai, Y. Nakahori, H.Mori,H. Iino, M. Miyashita, and J. Hirabayashi (2004), Gigantic SO2
emission fromMiyakejima volcano, Japan, caused by caldera col-lapse, Geology, 32, 425–428, doi:10.1130/G20399.1.
Keppler, H. (1999), Experimental evidence for the source of excesssulfur in explosive volcanic eruptions, Science, 284, 1652–1654,doi:10.1126/science.284.5420.1652.
Kerrick, D. M. (2001), Present and past nonanthropogenic CO2
degassing from the solid earth, Rev. Geophys., 39, 565–585,doi:10.1029/2001RG000105.
Kriswati, E., and M. Iguchi (2003), Inflation of the Aira calderaprior to the 1999 eruptive activity at Sakurajima volcano detectedby GPS network in south Kyushu, Ann. Disast. Prev. Res. Inst.Kyoto Univ., 46B, 817–826.
Krotkov, N. A., S. A. Carn, A. J. Krueger, P. K. Bhartia, andK. Yang (2006), Band residual difference algorithm for retrievalof SO2 from the Aura Ozone Monitoring Instrument (OMI),IEEE Trans. Geosci. Remote Sens. , 44 , 1259 – 1266,doi:10.1109/TGRS.2005.861932.
Krueger, A. J. (1983), Sighting of El Chichon sulfur dioxide cloudswith the Nimbus 7 total ozone mapping spectrometer, Science,220, 1377–1379, doi:10.1126/science.220.4604.1377.
Krueger, A. J., C. C. Schnetzler, L. S. Walter, and S. D. Doiron(1990), TOMS measurement of the sulfur dioxide emitted duringthe 1985 Nevado del Ruiz eruptions, J. Volcanol. Geotherm.Res., 41, 7–15, doi:10.1016/0377-0273(90)90081-P.
Krueger, A. J., L. S. Walter, P. K. Bhartia, C. C. Schnetzler, N. S.Krotko, I. Sprod, and G. J. S. Bluth (1995), Volcanic sulfurdioxide measurements from the total ozone mapping spectro-meter instruments, J. Geophys. Res., 100, 14,057–14,076,doi:10.1029/95JD01222.
Krueger, A. J., S. J. Schaefer, N. Krotkov, G. Bluth, and S. Barker(2000), Ultraviolet remote sensing of volcanic emissions, in Re-mote Sensing of Active Volcanism, Geophys. Monogr. Ser.,vol. 116, edited by P. J. Mouginis-Mark, J. A. Crisp, and J. H.Fink, pp. 25–43, AGU, Washington, D. C.
Kyle, P. R., K. Meeker, and D. Finnegan (1990), Emissions rates ofsulfur dioxide, trace gases and metals from Mount Erebus, Ant-arctica, Geophys. Res. Lett., 17, 2125–2128, doi:10.1029/GL017i012p02125.
Larocque, A. C. L., J. A. Stimac, J. D. Keith, andM.A. E. Huminicki(2000), Evidence for open-system behavior in immiscible Fe-S-Oliquids in silicatemagmas: Implications for contributions ofmetalsand sulfur to ore-forming fluids, Can. Mineral., 38, 1233–1249,doi:10.2113/gscanmin.38.5.1233.
Lautze, N. C., and B. F. Houghton (2005), Physical mingling ofmagma and complex eruption dynamics in the shallow conduit atStromboli volcano, Italy, Geology, 33, 425–428, doi:10.1130/G21325.1.
Liu, Y., N.-T. Samara, and D. R. Baker (2007), Sulfur concentra-tion at sulfide saturation (SCSS) in magmatic silicate melts,Geochim. Cosmochim. Acta, 71, 1783–1799, doi:10.1016/j.gca.2007.01.004.
Llewellin, E. W., and M. Manga (2005), Bubble suspension rheol-ogy and implications for conduit flow, J. Volcanol. Geotherm.Res., 143, 205–217, doi:10.1016/j.jvolgeores.2004.09.018.
Locke, A. C., H. Rymer, and J. Cassidy (2003), Magmas transferprocesses at persistently active volcanoes: Insights from gravityobservations, J. Volcanol. Geotherm. Res., 127, 73 – 86,doi:10.1016/S0377-0273(03)00179-3.
Lowenstern, J. B. (1995), Application of silicate-melt inclusions tothe study of magmatic volatiles, in Magmas, Fluids, and OreDeposits, Short Course Ser., vol. 23, edited by J. F. H.Thompson, pp. 71–99, Mineral. Assoc. of Can., Quebec, Que.,Canada.
Luhr, J. F. (1990), Experimental phase relations of water- andsulfur- saturated arc magmas and the 1982 eruptions of ElChichon volcano, J. Petrol., 31, 1071–1114.
Luhr, J. F. (2001), Glass inclusions and melt volatile contentsat Paricutin volcano, Mexico, Contrib. Mineral. Petrol., 142,261–283.
Luhr, J. F., and M. A. V. Logan (2002), Sulfur isotope systematicsof the 1982 El Chichon trachyandesite: An ion microprobe study,Geochim. Cosmochim. Acta, 66, 3303–3316, doi:10.1016/S0016-7037(02)00931-6.
Luhr, J. F., I. S. E. Carmichael, and J. C. Varekamp (1984), The1982 eruptions of El Chichon volcano, Chiapas, Mexico:Mineralogy and petrology of the anhydrite-bearing pumices,J. Volcanol. Geotherm. Res., 23, 69–108, doi:10.1016/0377-0273(84)90057-X.
Mandeville, C. W., S. Carey, and H. Sigurdsson (1996), Magmamixing, fractional crystallization and volatile degassing duringthe 1883 eruption of Krakatau volcano, Indonesia, J. Volcanol.
RG4005 Shinohara: EXCESS DEGASSING OF VOLCANOES
28 of 31
RG4005

Geotherm. Res . , 74 , 243 – 274, doi :10 .1016/S0377-0273(96)00060-1.
Marsh, B. D. (2000), Magma chambers, in Encyclopedia of Volca-noes, edited by H. Sigurdsson, pp. 191–206, Academic, SanDiego, Calif.
Martin, D., B. Ardouin, G. Bergametti, J. Carboneelle, R. Faivre-Pierret, G. Lambert, M. F. Le Cloarec, and G. Sennequier (1986),Geochemistry of sulfur in Mount Etna plume, J. Geophys. Res.,91, 12,249–12,254, doi:10.1029/JB091iB12p12249.
Marty, B., and I. N. Tolstikhin (1998), CO2 fluxes from mid-oceanridges, arcs and plumes, Chem. Geol., 145, 233 – 248,doi:10.1016/S0009-2541(97)00145-9.
Matthews, S. J., M. C. Gardeweg, and R. S. J. Sparks (1997), The1984 to 1996 cyclic activity of Lascar volcano, northern Chile:Cycles of dome growth, dome subsidence, degassing and explo-sive eruptions, Bull. Volcanol., 59, 72 – 82, doi:10.1007/s004450050176.
Matthews, S. J., R. S. J. Sparks, and M. C. Gardeweg (1999), ThePiedras Grandes-Soncor eruptions, Lascar volcano, Chile; Evo-lution of a zoned magma chamber in the central Andean uppercrust, J. Petrol., 40, 1891 – 1919, doi:10.1093/petrology/40.12.1891.
McClelland, L., , T. Simkin, M. Summers, E. Nielsen, and T. C.Stein (Eds.) (1989), Global Volcanism 1975–1985, 657 pp.,Prentice-Hall, Englewood Cliffs, N. J.
McGee, A. K., M. P. Doukas, and T. M. Gerlach (2001), Quiescenthydrogen sulfide and carbon dioxide degassing from Mount Ba-ker, Washington, Geophys. Res. Lett., 28, 4479 – 4482,doi:10.1029/2001GL013250.
McGonigle, A. J. S., and C. Oppenheimer (2003), Optical sensingof volcanic gas and aerosol emissions, in Volcanic Degassing,edited by C. Oppenheimer, D. M. Pyle, and J. Barclay, Geol. Soc.Spec. Publ., 213, 149–168.
Melnik, O., and R. S. J. Sparks (1999), Non-linear dynamics oflava dome extrusion, Nature, 402, 37–41, doi:10.1038/46950.
Melnik, O., and R. S. J. Sparks (2002), Dynamics of magma ascentand lava extrusion at Soufriere Hills volcano, in The Eruptions ofSoufriere Hills Volcano, Montserrat, From 1995 to 1999, editedby T. H. Druitt and B. P. Kokelaar, Mem. Geol. Soc. London, 21,153–171.
Menyailov, I. A. A., L. P. Nikitina, V. N. Shaper, and V. P. Pilipenko(1986), Temperature increase and chemical change of fumarolicgases at Momotombo volcano, Nicaragua, in 1982–1985: Arethese indicators of a possible eruption?, J. Geophys. Res., 91,12,199–12,214, doi:10.1029/JB091iB12p12199.
Metrich, N., A. Bertagnini, P. Landi, and M. Rosi (2001), Crystal-lization driven by decompression and water loss at Strombolivolcano (Aeolian Islands, Italy), J. Petrol., 42, 1471–1490,doi:10.1093/petrology/42.8.1471.
Michaud, V., R. Clocchiatti, and S. Sbrana (2000), The Minoan andpost-Minoan eruptions, Santorini (Greece), in the light of meltinclusions: Chlorine and sulphur behaviors, J. Volcanol.Geotherm. Res . , 99 , 195 – 214, doi :10 .1016/S0377-0273(00)00173-6.
Mori, T., and K. Notsu (1997), Remote CO, COS, CO2, SO2, HCldetection and temperature estimation of volcanic gas, Geophys.Res. Lett., 24, 2047–2050, doi:10.1029/97GL52058.
Morrissey, M. M., and L. G. Mastin (2000), Vulcanian eruptions,in Encyclopedia of Volcanoes, edited by H. Sigurdsson, pp. 463–476, Academic, San Diego, Calif.
Nakada, S., H. Shimizu, and K. Ohta (1999), Overview of the1990–1995 eruption at Unzen Volcano, J. Volcanol. Geotherm.Res., 89, 1–22, doi:10.1016/S0377-0273(98)00118-8.
Newhall, C. G., and S. Self (1982), The volcanic explosivity index(VEI): An estimate of explosive magnitude for Historical volcan-ism, J. Geophys. Res., 87, 1231–1238.
Newman, S., and J. B. Lowenstern (2002), VOLATILECALC: Asilicate melt-H2O-CO2 solution model written in Visual BasicExcel, Comput. Geosci., 28, 597–604, doi:10.1016/S0098-3004(01)00081-4.
O’Neill, H. S. C., and J. A. Mavrogenes (2002), The sulfide capa-city and the sulfur content at sulfide saturation of silicate melts at1400�C and 1 bar, J. Petrol., 43, 1049–1087, doi:10.1093/pet-rology/43.6.1049.
Oppenheimer, C. (1996), On the role of hydrothermal systems inthe transfer of volcanic sulfur to the atmosphere, Geophys. Res.Lett., 23, 2057–2060, doi:10.1029/96GL02061.
Oppenheimer, C., A. J. S. McGonigle, P. Allard, M. J. Wooster,and V. Tsanev (2004), Sulfur, heat, and magma budget of Er-ta’Ale lava lake, Ethiopia, Geology, 32, 509–512, doi:10.1130/G20281.1.
Palais, J. M., and H. Sigurdsson (1989), Petrologic evidence ofvolatile emissions from major historic and pre-historic volcaniceruptions, in Understanding Climate Change, Geophys.Monogr. Ser., vol. 52, edited by A. L. Berger, R. E. Dickinson,and J. Kidson, pp. 31–53, AGU, Washington, D. C.
Pallister, J. S., R. P. Hoblitt, and A. G. Reyes (1992), A basalttrigger for the 1991 eruptions of Pinatubo volcano?, Nature, 356,426–428, doi:10.1038/356426a0.
Pallister, J. S., R. P. Hobitt, G. P. Meeker, R. J. Knight, and D. F.Siems (1996), Magma mixing at Mount Pinatubo: Petrographicand chemical evidence from the 1991 deposits, in Fire and Mud:Eruptions and Lahars of Mount Pinatubo, Philippines, edited byC. G. Newhall and R. S. Punongbayan, pp. 687–731, Univ. ofWash. Press, Seattle.
Parfitt, E. A. (2004), A discussion of the mechanisms of explosivebasaltic eruptions, J. Volcanol. Geotherm. Res., 134, 77–107,doi:10.1016/j.jvolgeores.2004.01.002.
Patrick, M. R., A. J. L. Harris, M. Ripepe, J. Dehn, D. A. Rothery,and S. Calvari (2007), Strombolian explosive styles and sourceconditions: Insights from thermal (FLIR) video, Bull. Volcanol.,69, 769–784, doi:10.1007/s00445-006-0107-0.
Pyle, D. M. (2000), Size of volcanic eruptions, in Encyclopedia ofVolcanoes, edited by H. Sigurdsson, pp. 263–269, Academic,San Diego, Calif.
Pyle, D. M., P. D. Beattie, and G. J. S. Bluth (1996), Sulphuremissions to the stratosphere from explosive volcanic eruptions,Bull. Volcanol., 57, 663–671, doi:10.1007/s004450050119.
Ripepe, M., S. Ciliberto, and M. D. Schiava (2001), Time con-straints for modeling source dynamics of volcanic explosions atStromboli, J. Geophys. Res., 106, 8713–8727, doi:10.1029/2000JB900374.
Robock, A. (2000), Volcanic eruptions and climate, Rev. Geophys.,38, 191–219, doi:10.1029/1998RG000054.
Roggensack, K. (2001), Unraveling the 1974 eruption of Fuegovolcano (Guatemala) with small crystals and their young meltinclusions, Geology, 29 , 911 – 914, doi:10.1130/0091-7613(2001)029<0911:UTEOFV>2.0.CO;2.
Roggensack, K., S. N. Williams, S. J. Schaefer, and R. A. ParnellJr. (1996), Volatiles from the 1994 eruptions of Rabaul: Under-standing large caldera systems, Science, 273, 490 – 493,doi:10.1126/science.273.5274.490.
Roggensack, K., R. L. Hervig, S. B. McKnight, and S. N. Williams(1997), Explosive basaltic volcanism from Cerro Negro volcano:Influence of volatiles on eruptive style, Science, 277, 1639–1642, doi:10.1126/science.277.5332.1639.
Rose, W. I. (1977), Scavenging of volcanic aerosol by ash: Atmo-spheric and volcanologic implications, Geology, 5, 621–624,doi:10.1130/0091-7613(1977)5<621:SOVABA>2.0.CO;2.
Rymer, H., B. van Wyk de Vries, J. Stix, and G. Williams-Jones(1998), Pit crater structure and processes governing persistentactivity at Masaya volcano, Nicaragua, Bull. Volcanol., 59,345–355, doi:10.1007/s004450050196.
Saar, M. O., and M. Manga (2004), Depth dependence of perme-ability in the Oregon Cascades inferred from hydrogeologic,thermal, seismic, and magmatic modeling constraints, J. Geo-phys. Res., 109, B04204, doi:10.1029/2003JB002855.
Saito, G., K. Kazahaya, H. Shinohara, J. Stimac, and Y. Kawanabe(2001), Variation of volatile concentration in a magma system ofSatsuma-Iwojima volcano deduced from melt inclusion analyses,
RG4005 Shinohara: EXCESS DEGASSING OF VOLCANOES
29 of 31
RG4005

J. Volcanol. Geotherm. Res., 108, 11–31, doi:10.1016/S0377-0273(00)00276-6.
Saito, G., K. Uto, K. Kazahaya, H. Shinohara, Y. Kawanabe, andH. Satoh (2005), Petrological characteristics and volatile contentof magma from the 2000 eruption of Miyakejima volcano, Japan,Bull. Volcanol., 67, 268–280, doi:10.1007/s00445-004-0409-z.
Satoh, H., G. Saito, H. Shinohara, and Y. Yamaguchi (2003), Sul-fur source for the 1991–1995 Unzen eruption: Evidence frommelt inclusions in pyroxenes, Geophys. Res. Lett., 30(23), 2220,doi:10.1029/2003GL017629.
Scaillet, B., B. Clement, B. W. Evans, and M. Pichavant (1998),Redox control of sulfur degassing in silicic magmas, J. Geophys.Res., 103, 23,937–23,949, doi:10.1029/98JB02301.
Scaillet, B. J., F. Luhr, and M. R. Carrol (2003), Petrological andvolcanological constraints on volcanic sulfur emissions to theatmosphere, in Volcanism and the Earth’s Atmosphere, Geophys.Monogr. Ser., vol. 139, edited by A. Robock and C. Oppenheimer,pp. 11–40, AGU, Washington, D. C.
Schnetzler, C. C., G. J. S. Bluth, A. J. Krueger, and L. S. Walter(1997), A proposed volcanic sulfur dioxide index (VSI), J. Geo-phys. Res., 102, 20,087–20,091, doi:10.1029/97JB01142.
Scientific Advisory Committee (2007), Assessment of the hazardsand risks associated with the Soufriere Hills Volcano, EighthReport of the Scientific Advisory Committee on Montserrat Vol-canic Activity, 31 pp., Foreign and Commonw. Off., London.
Self, S., and A. J. King (1996), Petrology and sulfur and chlorineemissions of the 1963 eruption of Gunung Agung, Bali, Indone-sia, Bull. Volcanol., 58, 263–285, doi:10.1007/s004450050139.
Self, S., R. Gertisser, T. Thordarson, M. R. Rampino, and J. A.Wolff (2004), Magma volume, volatile emissions, and strato-spheric aerosols from the 1815 eruption Tambora, Geophys.Res. Lett., 31, L20608, doi:10.1029/2004GL020925.
Sharma, K., S. Blake, S. Self, and A. J. Krueger (2004), SO2
emissions from basaltic eruptions, and the excess sulfur issue,Geophys. Res. Lett., 31, L13612, doi:10.1029/2004GL019688.
Shinohara, H. (2005), A new technique to estimate volcanic gascomposition: Plume measurements with a portable multi-sensorsystem, J. Volcanol. Geotherm. Res. , 143 , 319 – 333,doi:10.1016/j.jvolgeores.2004.12.004.
Shinohara, H. (2006), Near vent volcanic plume measurement by aportable multi-gas-sensor system to estimate volcanic gas com-position, Eos Trans. AGU, 87(52), Fall Meet. Suppl., AbstractV43E-01.
Shinohara, H., and K. Kazahaya (1995), Degassing processes re-lated to magma-chamber crystallization, in Magmas, Fluids, andOre Deposits, Short Course Ser., vol. 23, edited by J. F. H.Thompson, pp. 47–70, Mineral. Assoc. of Can., Quebec, Que.,Canada.
Shinohara, H., and J. Witter (2005), Volcanic gases emitted duringmild Strombolian activity of Villarrica volcano, Chile, Geophys.Res. Lett., 32, L20308, doi:10.1029/2005GL024131.
Shinohara, H., K. Kazahaya, G. Saito, N. Matsushima, and Y.Kawanabe (2002), Degassing activity from Iwodake rhyoliticcone, Satsuma-Iwojima volcano, Japan: Formation of a new de-gassing vent, 1990–1999, Earth Planets Space, 54, 175–185.
Shinohara, H., K. Fukui, K. Kazahaya, and G. Saito (2003), De-gassing process of Miyakejima volcano: Implications of gasemission rate and melt inclusion data, in Melt Inclusions in Vol-canic Systems Advances in Volcanology, vol. 4, edited by B. DeVivo and R. Bodnar, pp. 147–161, Elsevier, Amsterdam.
Sigurdsson, H., S. Carey, J. M. Palais, and J. Devin (1990a), Pre-eruption compositional gradients and mixing of andesite anddacite erupted from Nevado del Ruiz volcano, Colombia in1985, J. Volcanol. Geotherm. Res., 41, 127–151, doi:10.1016/0377-0273(90)90086-U.
Sigurdsson, H., S. Carey, and J. Devine (1990b), Assessment of themass, dynamics, and environmental effects of the Minoan erup-tion of Santorini volcano, in Thera and the Aegean World 2,edited by D. A. Hardy, pp. 101–108, Thera Found., London.
Simkin, T. (1993), Terrestrial volcanism in space and time, Annu.Rev. Earth Planet. Sci., 21, 427–452, doi:10.1146/annurev.ea.21.050193.002235.
Simkin, T., and L. Siebert (1994), Volcanoes of the World, 2nd ed.,349 pp., Geoscience, Tucson, Ariz.
Sisson, T. W., and S. Bronto (1998), Evidence for pressure-releasemelting beneath magmatic arcs from basalt at Galunggung, In-donesia, Nature, 391, 883–886, doi:10.1038/36087.
Sisson, T. W., and G. D. Layne (1993), H2O in basalt and basalticandesite glass inclusions from four subduction-related volcanoes,Earth Planet. Sci. Lett., 117, 619–635, doi:10.1016/0012-821X(93)90107-K.
Stevenson, D. S., and S. Blake (1998), Modeling the dynamics andthermodynamics of volcanic degassing, Bull. Volcanol., 60,307–317, doi:10.1007/s004450050234.
Stix, J., G. D. Layne, and S. N. Williams (2003), Mechanisms ofdegassing at Nevado del Ruiz volcano, Colombia, J. Geol. Soc.,160, 507–521, doi:10.1144/0016-764902-028.
Stoiber, R. E., L. L. Malinconico, and S. N. Williams (1983), Useof the correlation spectrometer at volcanoes, in Forecasting Vol-canic Events, Dev. Volcanol., vol. 1, edited by H. Tazieff and J.-C.Sabroux, pp. 425–444, Elsevier, Amsterdam.
Stoiber, R. E., S. N. Williams, and B. Huebert (1987), Annualcontribution of sulfur dioxide to the atmosphere by volcanoes,J. Volcanol. Geotherm. Res., 33, 1 – 8, doi:10.1016/0377-0273(87)90051-5.
Stothers, R. B. (1996), The great dry fog of 1783, Clim. Change,32, 79–89, doi:10.1007/BF00141279.
Streck, M. L., and S. Wacaster (2006), Plagioclase and pyroxenehosted melt inclusions in basaltic andesites of the current erup-tion of Arenal volcano, Costa Rica, J. Volcanol. Geotherm. Res.,157, 236–253, doi:10.1016/j.jvolgeores.2006.03.040.
Sutton, A. J., T. Elias, T. M. Gerlach, and J. B. Stokes (2001),Implications for eruptive processes as indicated by sulfur dioxideemissions from Kilauea volcano, Hawaii, 1979–1997, J. Volca-nol. Geotherm. Res., 108, 283 – 302, doi:10.1016/S0377-0273(00)00291-2.
Swanson, D. A., D. Dzurisin, R. I. Holcomb, E. Y. Iwatsubo, W. W.Chadwick Jr., T. J. Casadevall, J. W. Ewert, and C. C. Heliker(1987), Growth of the lava dome at Mount St. Helens, Washing-ton, (USA), 1981–1983, Spec. Pap. Geol. Soc. Am., 212, 1–16.
Symonds, R. B., W. I. Rose, G. J. S. Bluth, and T. M. Gerlach(1994), Volcanic-gas studies: Methods, results, and applications,in Volatiles in Magmas, Rev. Mineral., vol. 30, edited by M. R.Carroll and J. R. Holloway, pp. 1–66, Mineral. Soc. of Am.,Washington, D. C.
Symonds, R. B., T. M. Gerlach, and M. H. Reed (2001), Magmaticgas scrubbing: Implications for volcano monitoring, J. Volcanol.Geotherm. Res. , 108 , 303 – 341, doi:10.1016/S0377-0273(00)00292-4.
Taran, Y. A., J. W. Hedenquist, M. A. Korzhinsky, S. I.Tkachenko, and K. I. Shumulovich (1995), Geochemistry ofmagmatic gases from Kudryavy volcano, Itrup, Kurile Islands,Geochim. Cosmochim. Acta, 59, 1749–1761, doi:10.1016/0016-7037(95)00079-F.
Taylor, P. A., and R. E. Stoiber (1973), Soluble material on ashfrom active central American volcanoes, Geol. Soc. Am. Bull.,84, 1031–1042, doi:10.1130/0016-7606(1973)84<1031:SMOA-FA>2.0.CO;2.
Taylor, S. R., and S. M. McLennan (1995), The geochemical evo-lution of the continental crust, Rev. Geophys., 33, 241–265,doi:10.1029/95RG00262.
Tazieff, A. (1994), Permanent lava lakes: Observed facts and in-duced mechanisms, J. Volcanol. Geotherm. Res., 63, 3–11,doi:10.1016/0377-0273(94)90015-9.
Thordarson, T., S. Self, N. Oskarsson, and T. Hulsebosch (1996),Sulfur chlorine, and fluorine degassing and atmospheric loadingby the 1783–1784 AD Laki (Skaftar) eruption in Iceland, Bull.Volcanol., 58, 205–225, doi:10.1007/s004450050136.
RG4005 Shinohara: EXCESS DEGASSING OF VOLCANOES
30 of 31
RG4005

Thordarson, T., D. J. Miller, G. Larsen, S. Self, and H. Sigurdsson(2001), New estimates of sulfur degassing and atmosphericmass-loading by the 934 AD Eldgja eruption, Iceland,J. Volcanol. Geotherm. Res., 108, 33–54, doi:10.1016/S0377-0273(00)00277-8.
Togashi, S., N. Imai, Y. Okuyama-Kusunose, T. Tanaka, T. Okai,T. Koma, and Y. Murata (2000), Young upper crustal chemicalcomposition of the orogenic Japan Arc, Geochem. Geophys.Geosyst., 1(11), 1049, doi:10.1029/2000GC000083.
Ueda, H., E. Fujita, M. Ukawa, E. Yamamoto, M. Irwan, andF. Kimata (2005), Magma intrusion and discharge process at theinitial stage of the 2000 activity of Miyakejima, central Japan,inferred from tilt and GPS data, Geophys. J. Int., 161, 891–906,doi:10.1111/j.1365-246X.2005.02602.x.
Varekamp, J. C., J. F. Luhr, and K. Prestegaard (1984), The1982 eruption of El Chichon volcano (Chiapas, Mexico):Character of the eruptions, ash-fall deposits, and gas phase,J. Volcanol. Geotherm. Res., 23, 39–68, doi:10.1016/0377-0273(84)90056-8.
Varley, N. R., and M. A. Armienta (2001), The absence of diffusedegassing at Popocatepetl volcano, Mexico, Chem. Geol., 177,157–173, doi:10.1016/S0009-2541(00)00389-2.
Vergniolle, S., and M. Mangan (2000), Hawaiian and Strombolianeruptions, in Encyclopedia of Volcanoes, edited by H. Sigurdsson,pp. 447–461, Academic, San Diego, Calif.
Wade, J. A., T. Plank, W. G. Melson, G. J. Soto, and E. H. Hauri(2006), The volatile content of magmas from Arenal volcano,Costa Rica, J. Volcanol. Geotherm. Res., 157, 94 – 120,doi:10.1016/j.jvolgeores.2006.03.045.
Walker, J. A., K. Roggensack, L. C. Patino, B. I. Cameron, andO. Matıas (2003), The water and element contents of melt inclu-sions across an active subduction zone, Contrib. Mineral. Petrol.,146, 62–77, doi:10.1007/s00410-003-0482-x.
Wallace, P. J. (2001), Volcanic SO2 emissions and the abundanceand distribution of exsolved gas in magma bodies, J. Volcanol.Geotherm. Res . , 108 , 85 – 106, doi :10 .1016/S0377-0273(00)00279-1.
Wallace, P. J. (2003), From mantle to atmosphere: Magma degas-sing, explosive eruptions, and volcanic volatile budgets, in MeltInclusions in Volcanic Systems, Dev. Volcanol., vol. 4, edited byB. De Vivo and R. Bodnar, pp. 147–161, Elsevier, Amsterdam.
Wallace, P. J. (2005), Volatiles in subduction zone magmas: Con-centrations and fluxes based on melt inclusion and volcanic gasdata, J. Volcanol. Geotherm. Res., 140, 217–240, doi:10.1016/j.jvolgeores.2004.07.023.
Wallace, P., and I. S. E. Carmichael (1992), Sulfur in basalticmagmas, Geochim. Cosmochim. Acta, 56, 1863 – 1874,doi:10.1016/0016-7037(92)90316-B.
Wallace, P. J., and T. M. Gerlach (1994), Magmatic vapor sourcefor sulfur dioxide released during volcanic eruptions: Evidencefrom Mount Pinatubo, Science, 265, 497–499, doi:10.1126/science.265.5171.497.
Wallace, P. J., A. T. Anderson Jr., and A. M. Davis (1995), Quan-tification of pre-eruptive exsolved gas contents in silicic magmas,Nature, 377, 612–616, doi:10.1038/377612a0.
Westrich, H. R., and T. M. Gerlach (1992), Magmatic gas sourcefor the stratospheric SO2 cloud from the June 15, 1991, eruptionof Mount Pinatubo, Geology, 20, 867–870, doi:10.1130/0091-7613(1992)020<0867:MGSFTS>2.3.CO;2.
Westrich, H. R., J. C. Eichelberger, and R. L. Hervig (1991),Degassing of the 1912 Katmai magmas, Geophys. Res. Lett.,18, 1561–1564, doi:10.1029/91GL01667.
White, S. M., J. A. Crisp, and F. J. Spera (2006), Long-term volu-metric eruption rates and magma budgets, Geochem. Geophys.Geosyst., 7, Q03010, doi:10.1029/2005GC001002.
Williams-Jones, G., J. Stix, M. Heiligmann, J. Barquero, E. Fernandez,and E. D. Gonzalez (2001), A model of degassing and seismicity atArenal volcano, Costa Rica, J. Volcanol. Geotherm. Res., 108, 121–139, doi:10.1016/S0377-0273(00)00281-X.
Wilson, L., and J. W. Head (1981), Ascent and eruption of basalticmagma on the Earth and Moon, J. Geophys. Res., 86, 2971–3001, doi:10.1029/JB086iB04p02971.
Witter, J. B., V. C. Kress, P. Delmelle, and J. Stix (2004), Volatiledegassing, petrology, and magma dynamics of the VillarricaLava Lake, Southern Chile, J. Volcanol. Geotherm. Res., 134,303–337, doi:10.1016/j.jvolgeores.2004.03.002.
Witter, J. B., V. G. Kress, and C. G. Newhall (2005), VolcanPopocatepetl, Mexico. Petrology, magma mixing, and immediatesources of volatiles for the 1994-present eruption, J. Petrol., 46,2337–2366, doi:10.1093/petrology/egi058.
Zapata, G. J. A., et al. (1997), SO2 fluxes from Galeras volcano,Colombia, 1989–1995: Progressive degassing and conduit ob-struction of a Decade Volcano, J. Volcanol. Geotherm. Res., 77,195–208, doi:10.1016/S0377-0273(96)00094-7.
Zhang, Y., X. Zhengjiu, Z. Mengfan, and W. Haoyue (2007), Si-licate melt properties and volcanic eruptions, Rev. Geophys., 45,RG4004, doi:10.1029/2006RG000216.
Zielinski, G. A. (1995), Stratospheric loading and optical depthestimates of explosive volcanism over the last 2100 years derivedfrom the Greenland Ice Sheet Project 2 ice core, J. Geophys.Res., 100, 20,937–20,955, doi:10.1029/95JD01751.
�������������������������H. Shinohara, Geological Survey of Japan, AIST, Central 7, Higashi
1-1-1, Tsukuba, Ibaraki 305-8567, Japan. ([email protected])
RG4005 Shinohara: EXCESS DEGASSING OF VOLCANOES
31 of 31
RG4005