Examples of Offshore Renewable Energy - DOI
23
Examples of Offshore Renewable Energy Wind Energy Wave Energy Ocean Current Energy
Transcript of Examples of Offshore Renewable Energy - DOI
Examples of Offshore Renewable
Energy
Wind Energy
Wave Energy
Ocean Current
Energy
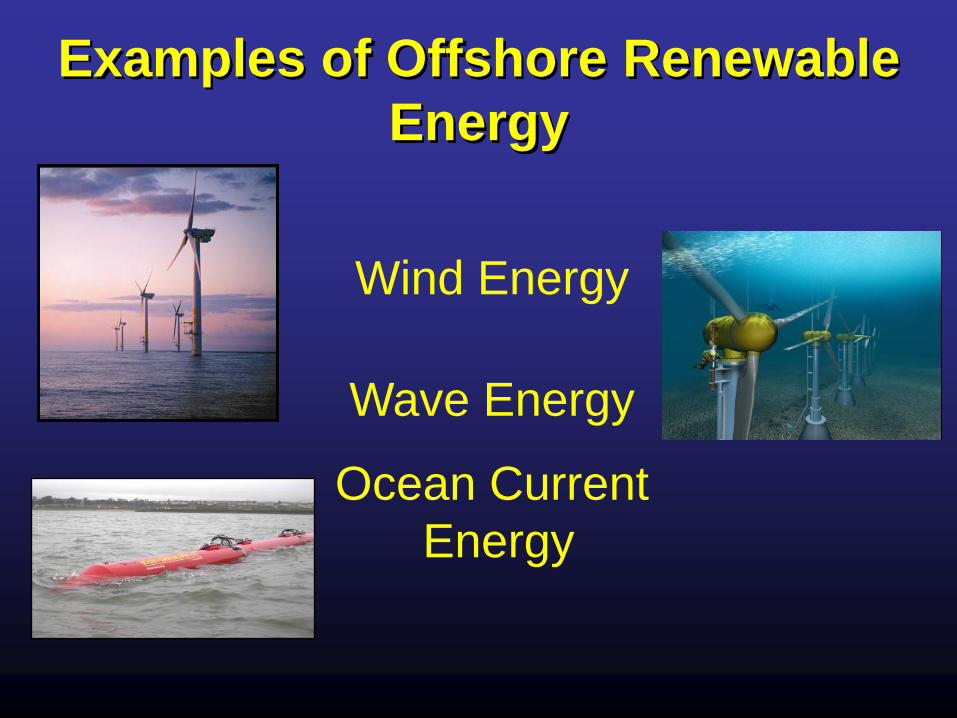
ELECTRICITY DEMAND ON THE RISE
Data courtesy of Marc Imhoff (NASA/GSFC) and
Christopher Elvidge (NOAA/NGDC). Image by
Craig Mayhew (NASA/GSFC)
and Robert Simmon (NASA/GSFC)
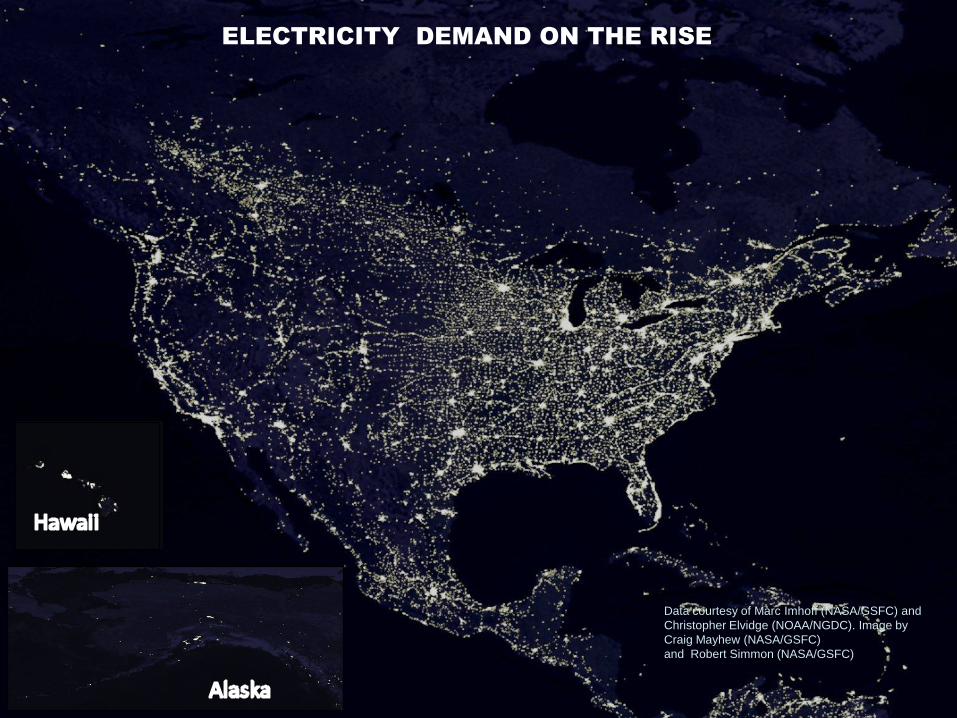
Population DensityPopulation Density of the Contiguous United States

U.S. Wind Speed DataSubstantial Offshore Resources Located Near Coastal Areas

What About Watts?
• Household power is measured in KW (kilowatts)
• 1,000 KW = 1 MW (megawatt)
• 1,000 MW = 1 GW (gigawatt)
• A mid-size coal-fired electrical plant produces
~350 MW; so 1 GW = output from 3 typical coal
plants
Energy Consumption
• The average American
household uses about
10,655 kilowatt-hours per
year (kWh/y)
• 1 GW of wind power will
supply between 225,000 to
300,000 average U.S.
homes with power annually.

Regional Offshore Wind Energy Potential Capacity
Region Shallow Waters Deeper Waters Total
Atlantic 253.2 GW 770.9 GW 1024 GW
Pacific 9.8 GW 741.5 GW 751 GW
Gulf 0 GW 67 GW 67 GW

California and Pacific NW Resource
0-30 m – 9.8 GW
30-60 m – 24 GW
60-900 m – 319 GW
>900 m – 399 GW
NREL
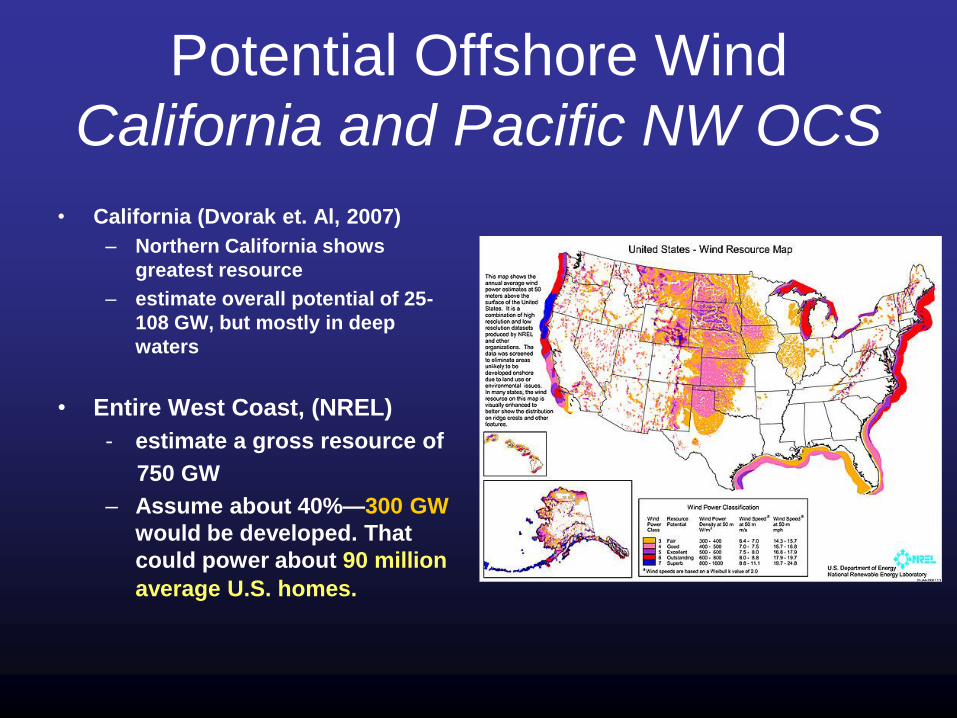
Potential Offshore Wind
California and Pacific NW OCS
• California (Dvorak et. Al, 2007)
– Northern California shows
greatest resource
– estimate overall potential of 25-
108 GW, but mostly in deep
waters
• Entire West Coast, (NREL)
- estimate a gross resource of
750 GW
– Assume about 40%—300 GW
would be developed. That
could power about 90 million
average U.S. homes.

U.S. Offshore Wave Energy
Resources
New England and Mid-Atlantic
110 TWh/yr
WA, OR, CA
440 TWh/yr
Southern AK
1,250 TWh/yr
Northern HI
300 TWh/yr
Total Energy = 2,100 Twh/yr (excluding the Bering sea) for
sites with >10 kW/m
Extracting 15% and converting to electricity at 80% yields
255 Twh/yr
Greatest resource potential occurs in the Pacific, especially Alaska
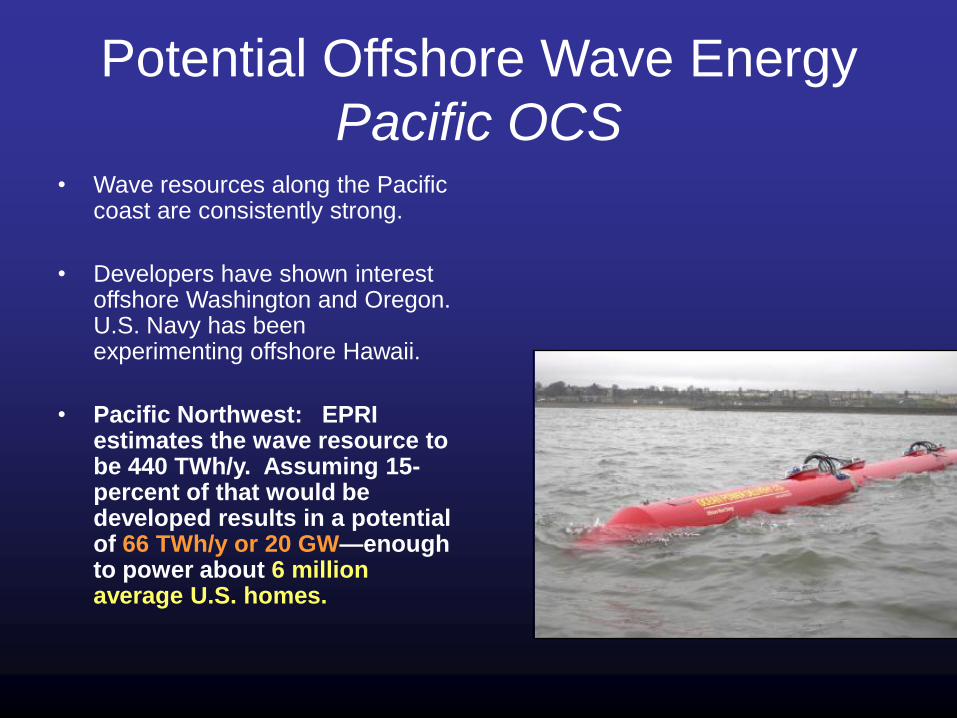
• Wave resources along the Pacific coast are consistently strong.
• Developers have shown interest offshore Washington and Oregon. U.S. Navy has been experimenting offshore Hawaii.
• Pacific Northwest: EPRI estimates the wave resource to be 440 TWh/y. Assuming 15-percent of that would be developed results in a potential of 66 TWh/y or 20 GW—enough to power about 6 million average U.S. homes.
Potential Offshore Wave Energy
Pacific OCS
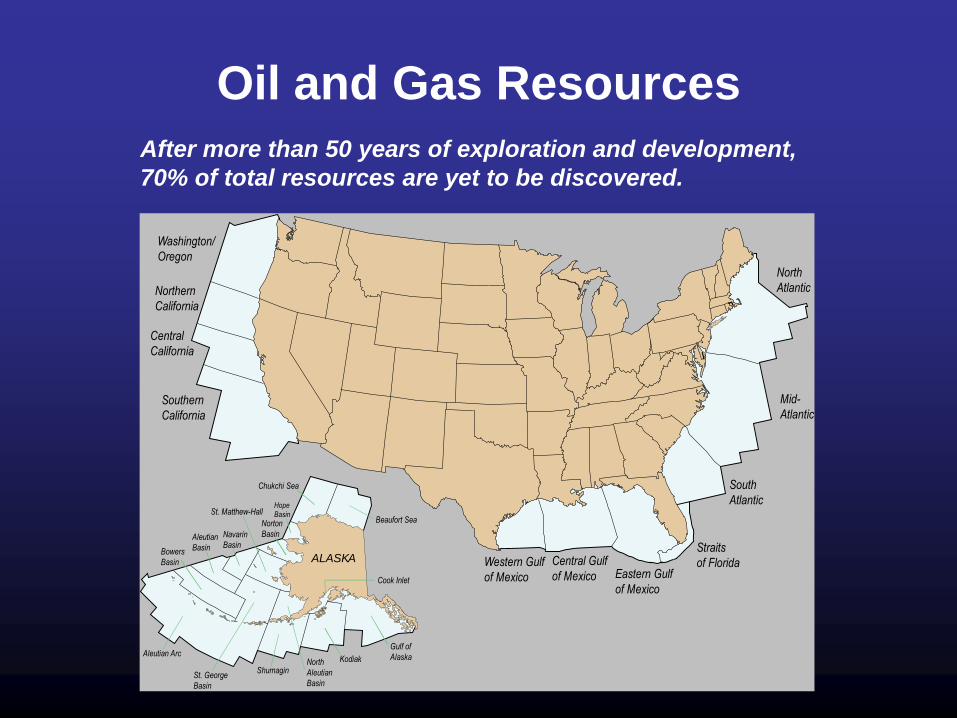
Oil and Gas Resources
After more than 50 years of exploration and development,
70% of total resources are yet to be discovered.
Washington/
Oregon
Northern
California
Central
California
Southern
California
North
Atlantic
Mid-
Atlantic
South
Atlantic
Straits
of FloridaEastern Gulf
of Mexico
Central Gulf
of MexicoWestern Gulf
of Mexico
Bowers
Basin
Aleutian
Basin
Navarin
Basin
Chukchi Sea
Aleutian Arc
St. George
Basin
ShumaginNorth
Aleutian
Basin
Kodiak
Gulf of
Alaska
Cook Inlet
Beaufort Sea
ALASKA
HopeBasin
Norton
Basin
St. Matthew-Hall
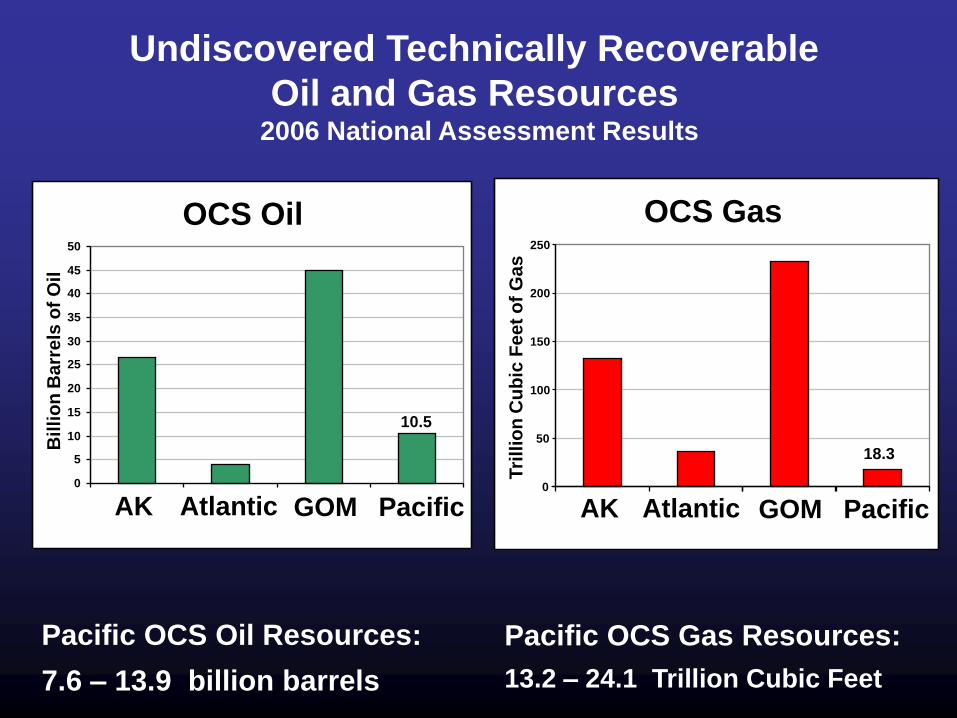
Undiscovered Technically Recoverable
Oil and Gas Resources2006 National Assessment Results
OCS Oil
0
5
10
15
20
25
30
35
40
45
50
AK Atlantic GOM Pacific
Bil
lio
n B
arr
els
of
Oil
OCS Gas
0
50
100
150
200
250
Tri
llio
n C
ub
ic F
eet
of
Gas
AK Atlantic GOM Pacific
Pacific OCS Oil Resources:
7.6 – 13.9 billion barrels
Pacific OCS Gas Resources:
13.2 – 24.1 Trillion Cubic Feet
10.5
18.3
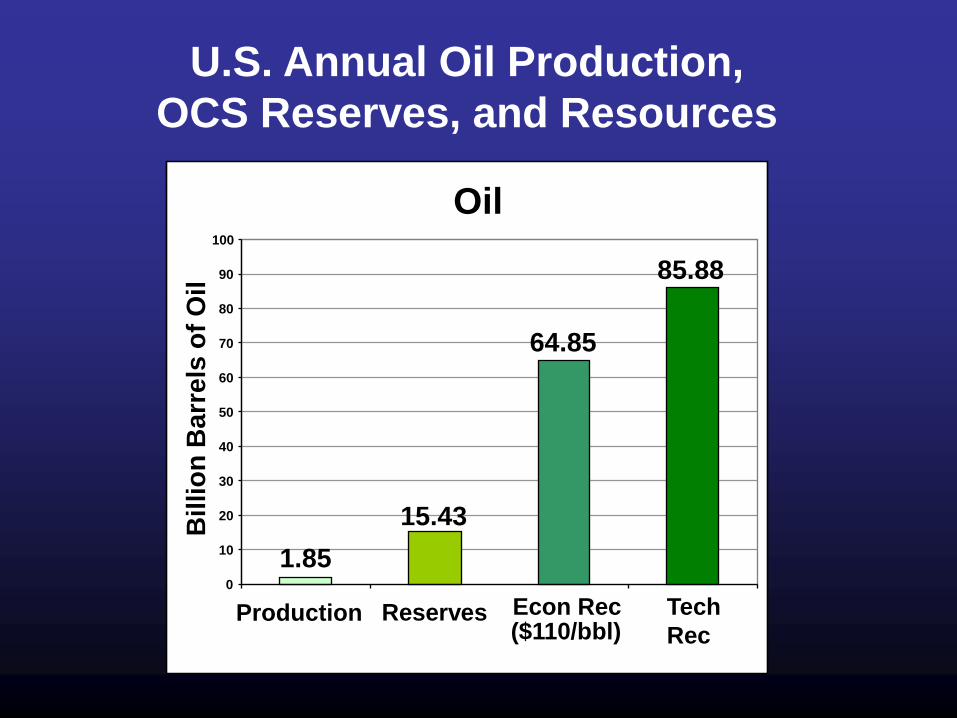
U.S. Annual Oil Production,
OCS Reserves, and Resources
Oil
64.85
15.43
1.85
85.88
0
10
20
30
40
50
60
70
80
90
100
Bil
lio
n B
arr
els
of
Oil
Production Econ Rec($110/bbl)
Tech
RecReserves
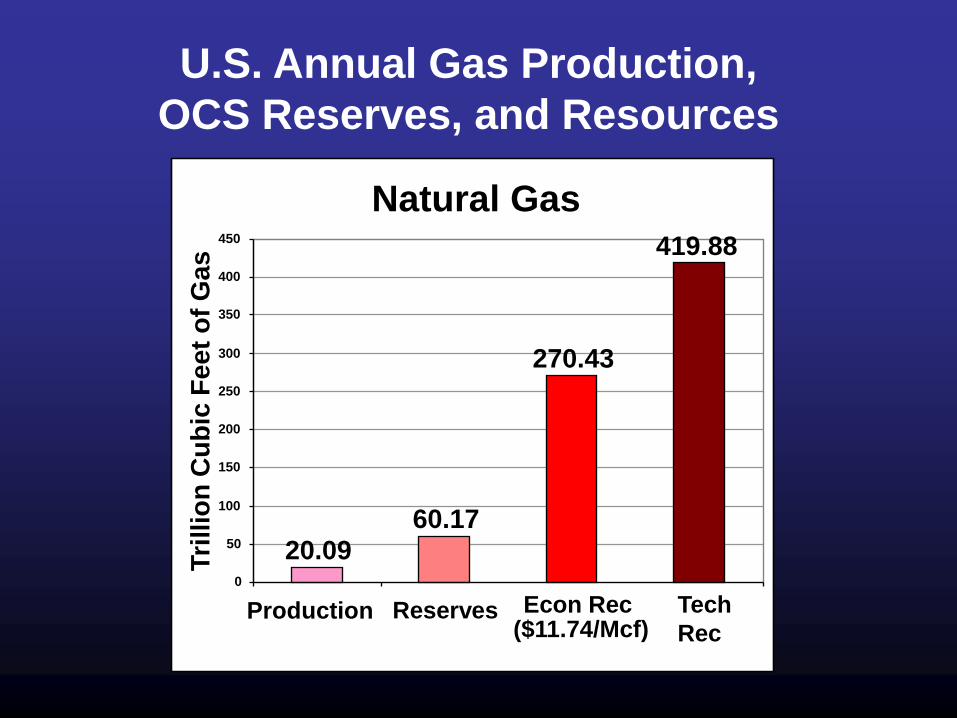
U.S. Annual Gas Production,
OCS Reserves, and Resources
Natural Gas
60.17
20.09
270.43
419.88
0
50
100
150
200
250
300
350
400
450
Tri
llio
n C
ub
ic F
ee
t o
f G
as
Production Econ Rec($11.74/Mcf)
Tech
RecReserves
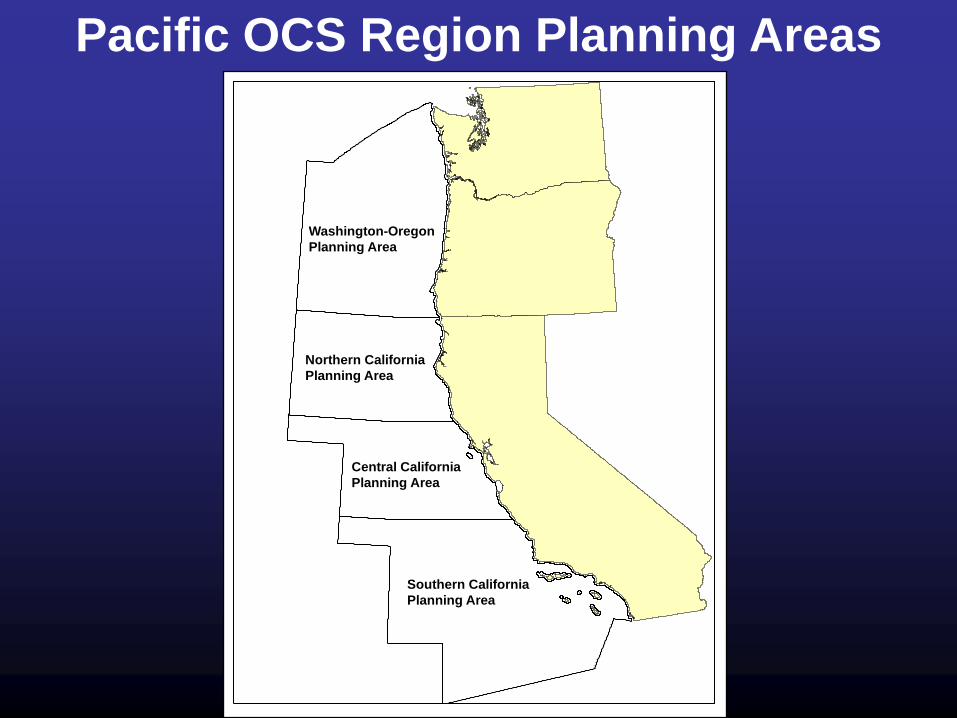
Pacific OCS Region Planning Areas
Central California
Planning Area
Washington-Oregon
Planning Area
Northern California
Planning Area
Southern California
Planning Area
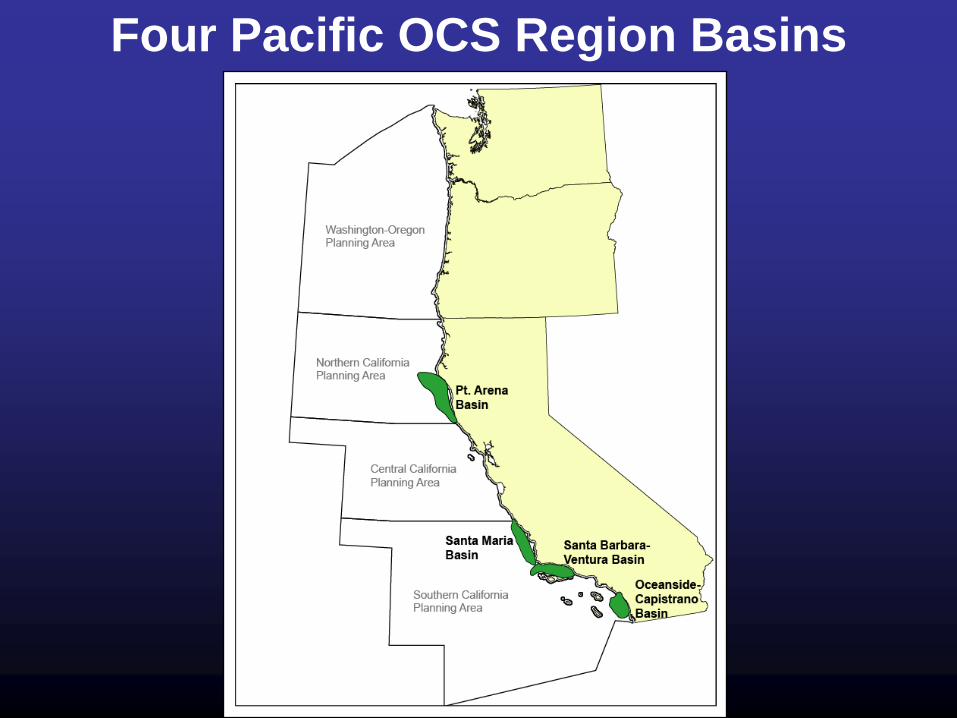
Four Pacific OCS Region Basins

Pacific OCS Region Seismic Data
California
Oregon
Washington
Washington-Oregon
Planning Area
Northern California
Planning Area
Central California
Planning Area
Southern California
Planning Area

Four Pacific OCS Basins
Undiscovered Oil and Gas Resources
Oil
0
2
4
6
8
10
Bill
ion
Bar
rels
of
Oil
Gas
0
2
4
6
8
10
Trill
ion
Cu
bic
Fe
et o
f G
as
Econ Rec
($110/bbl)
Tech Rec Econ Rec
($11.74/Mcf)
Tech Rec
• Most Seismic data were acquired in the 1970’s and 1980’s.
• New seismic and related data may be desired for some areas in the Pacific OCS Region by the oil and gas industry as part of their pre-leasing evaluation.
• Prior to acquisition of seismic data, National Environmental Policy Act (NEPA) and other environmental analyses will be required.
Pacific OCS Region Oil and
Gas Resource Data Gaps
Stewardship
Our Overriding Consideration
Key Environmental Issues
BALANCING:
• the Nation’s energy needs
• Environmental sensitivity and marine productivity
• Multiple use of the sea and seabed
Forecasting, planning for and mitigating:
• Long-term Ecosystem Changes
– (and effects on species and habitats)
• Changes in Renewable Energy Resources
– e.g. Wind and Wave frequency, persistence, etc.
• Changes in Environmental Conditions and Impacts
to Energy Infrastructure
– (storms, sea level, wave heights, etc.)
The Challenge of Climate Change
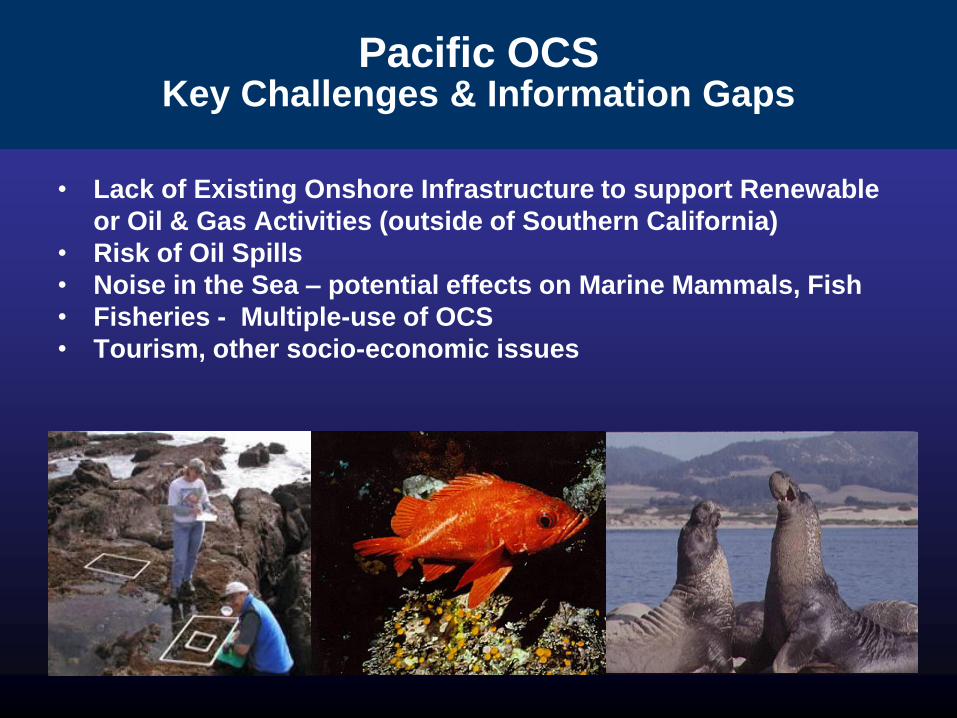
• Lack of Existing Onshore Infrastructure to support Renewable
or Oil & Gas Activities (outside of Southern California)
• Risk of Oil Spills
• Noise in the Sea – potential effects on Marine Mammals, Fish
• Fisheries - Multiple-use of OCS
• Tourism, other socio-economic issues
Pacific OCS Key Challenges & Information Gaps