Example of multivariate data What is R? R is available as Free Software under the terms of the Free...
42
Example of multivariate data What is R? R is available as Free Software under the terms of the Free Software Foundation 's GNU General Public License in source code form. It compiles and runs on a wide variety of UNIX platforms and similar systems (including FreeBSD and Linux),Windows and MacOS. R can be extended (easily) via packages. There are about eight packages supplied with the R distribution and many more are available through the CRAN family of Internet sites covering a very wide range of modern statistics. R is a language and environment for statistical computing and graphics.
-
Upload
stuart-jefferson -
Category
Documents
-
view
217 -
download
1
Transcript of Example of multivariate data What is R? R is available as Free Software under the terms of the Free...
Example of multivariate dataWhat is R?
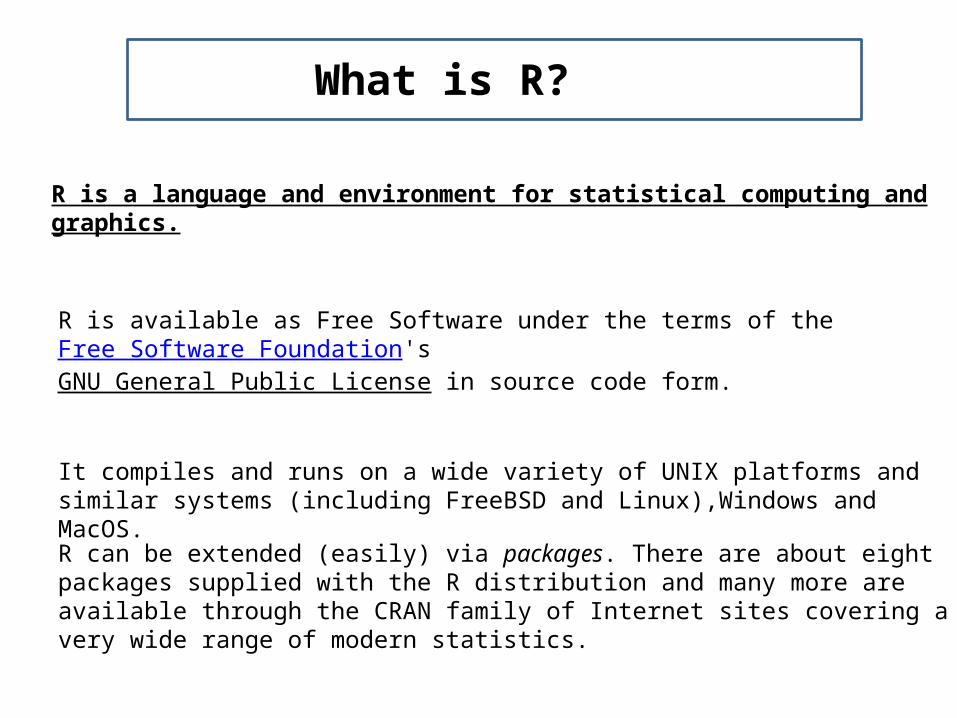
R is available as Free Software under the terms of the Free Software Foundation's GNU General Public License in source code form.
It compiles and runs on a wide variety of UNIX platforms and similar systems (including FreeBSD and Linux),Windows and MacOS.
R can be extended (easily) via packages. There are about eight packages supplied with the R distribution and many more are available through the CRAN family of Internet sites covering a very wide range of modern statistics.
R is a language and environment for statistical computing and graphics.
Example of multivariate dataThe R environment
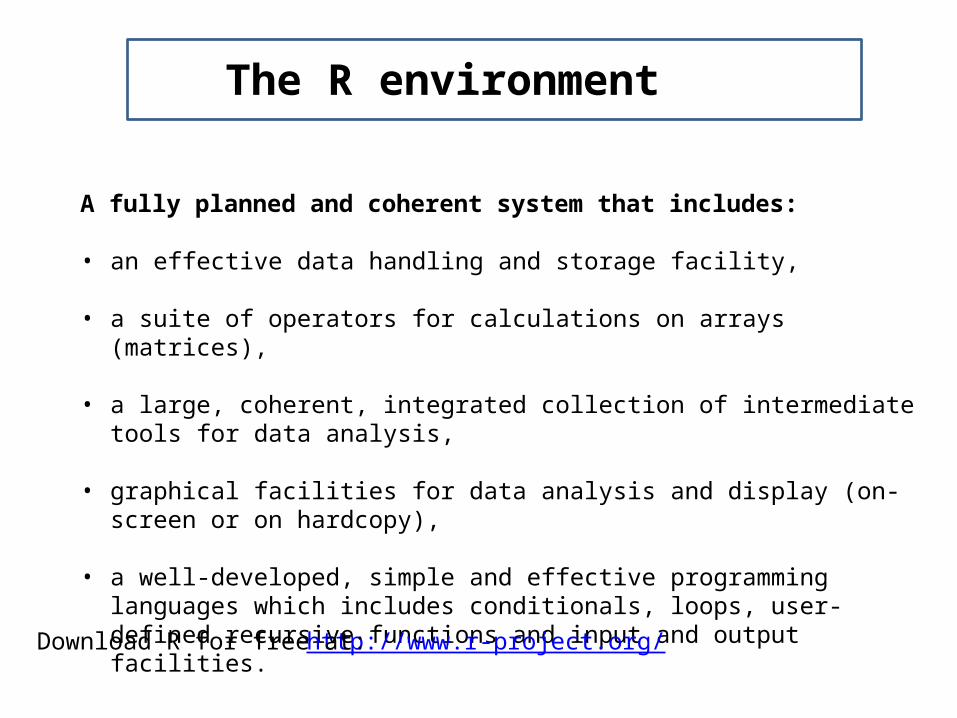
A fully planned and coherent system that includes:
• an effective data handling and storage facility,
• a suite of operators for calculations on arrays (matrices),
• a large, coherent, integrated collection of intermediate tools for data analysis,
• graphical facilities for data analysis and display (on-screen or on hardcopy), • a well-developed, simple and effective programming languages which includes
conditionals, loops, user-defined recursive functions and input and output facilities.
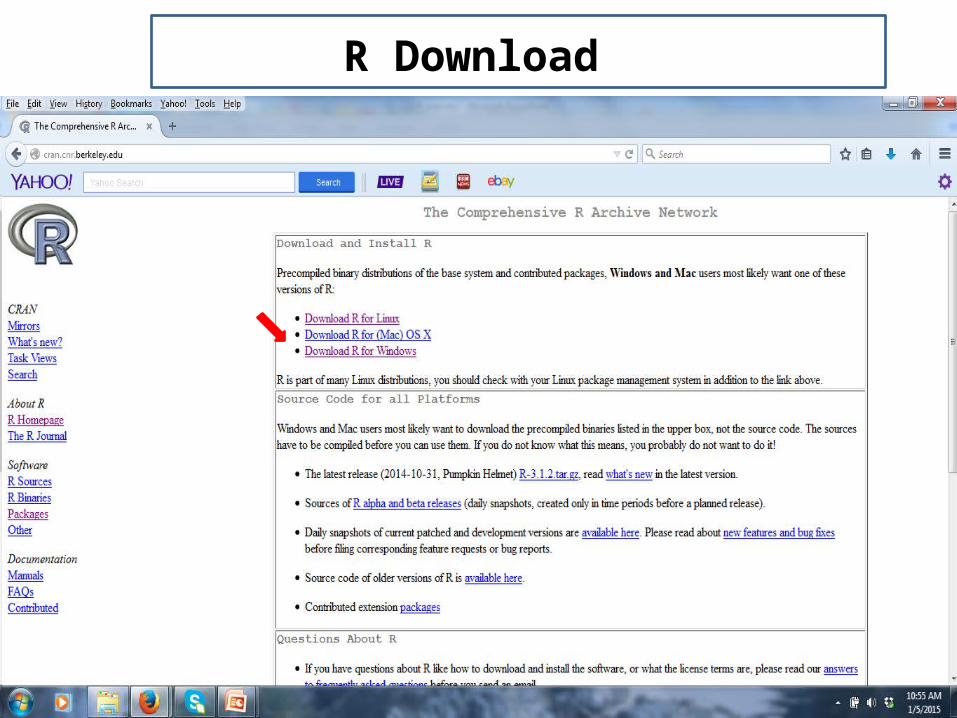
http://www.r-project.org/Download R for free at:
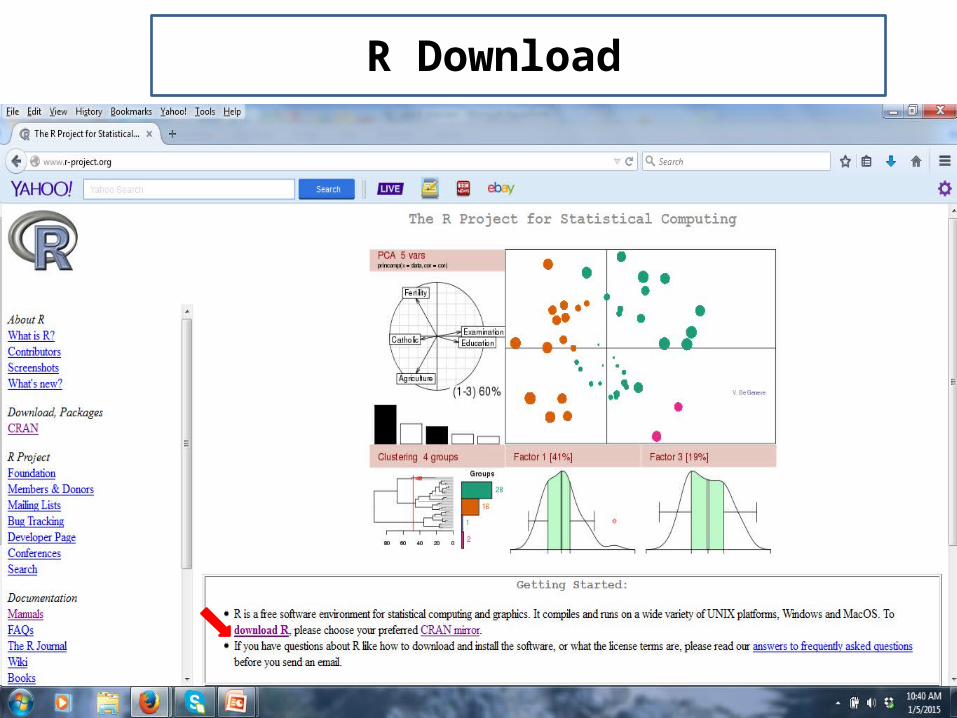
Exam of multivariate dataR Download

Exam of multivariate dataR Download
Exam of multivariate dataR Download
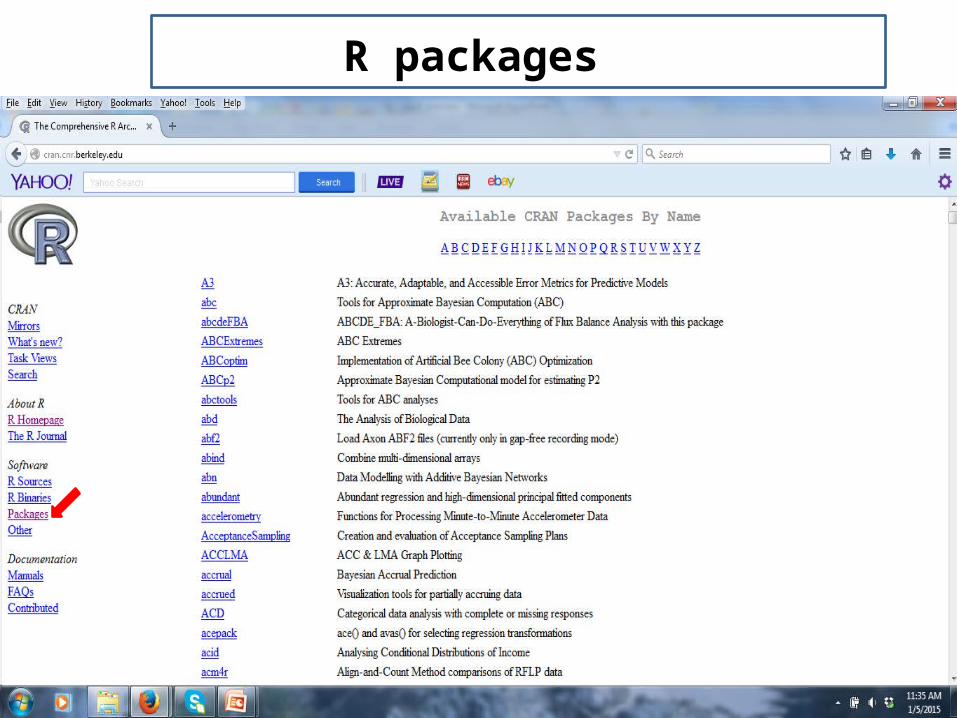
Exam of multivariate dataR packages
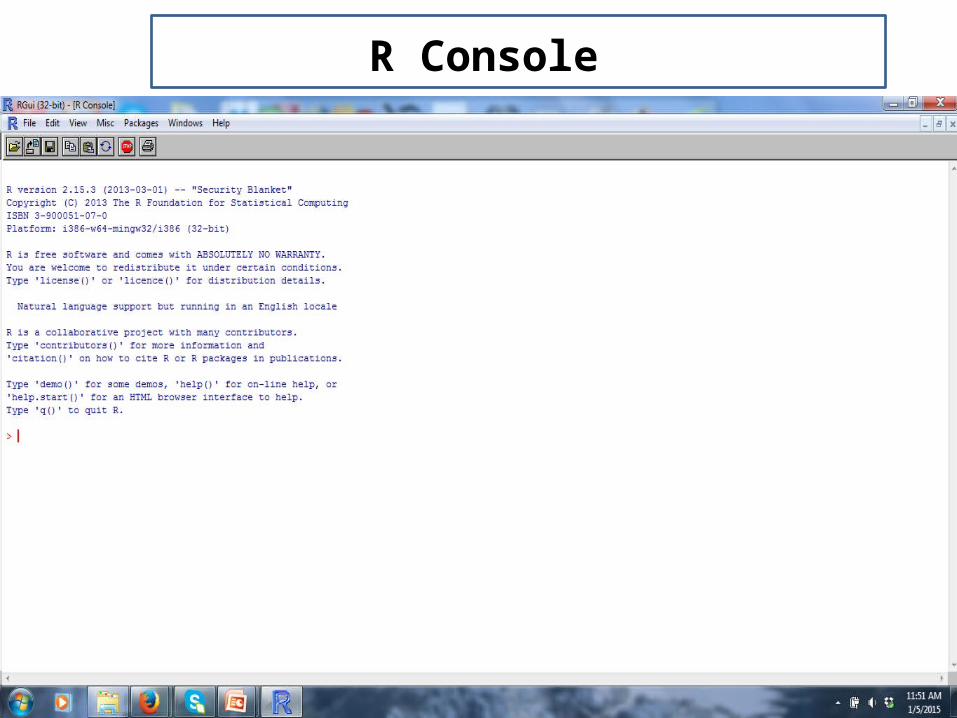
Exam of multivariate dataR Console
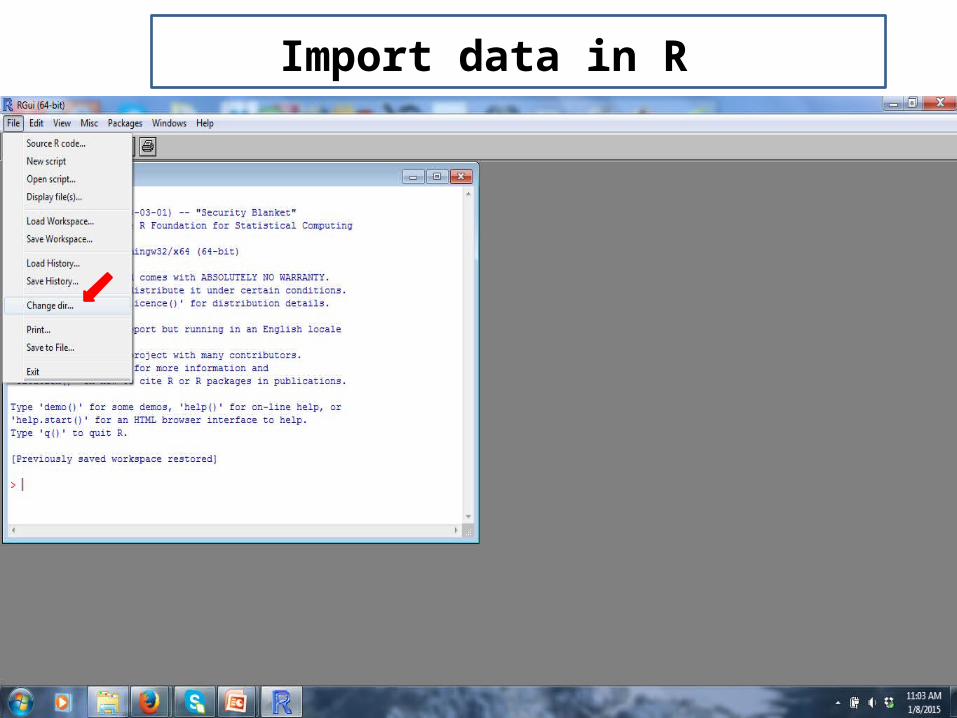
Exam of multivariate dataImport data in R
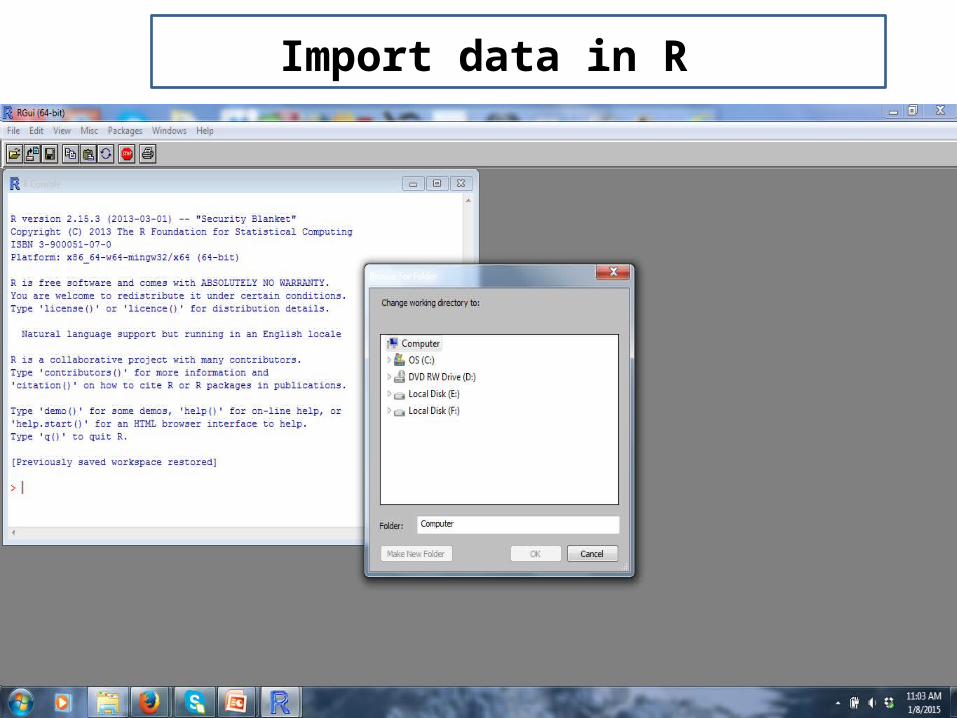
Exam of multivariate dataImport data in R

Exam of multivariate dataInstall packages

Exam of multivariate dataInstall packages
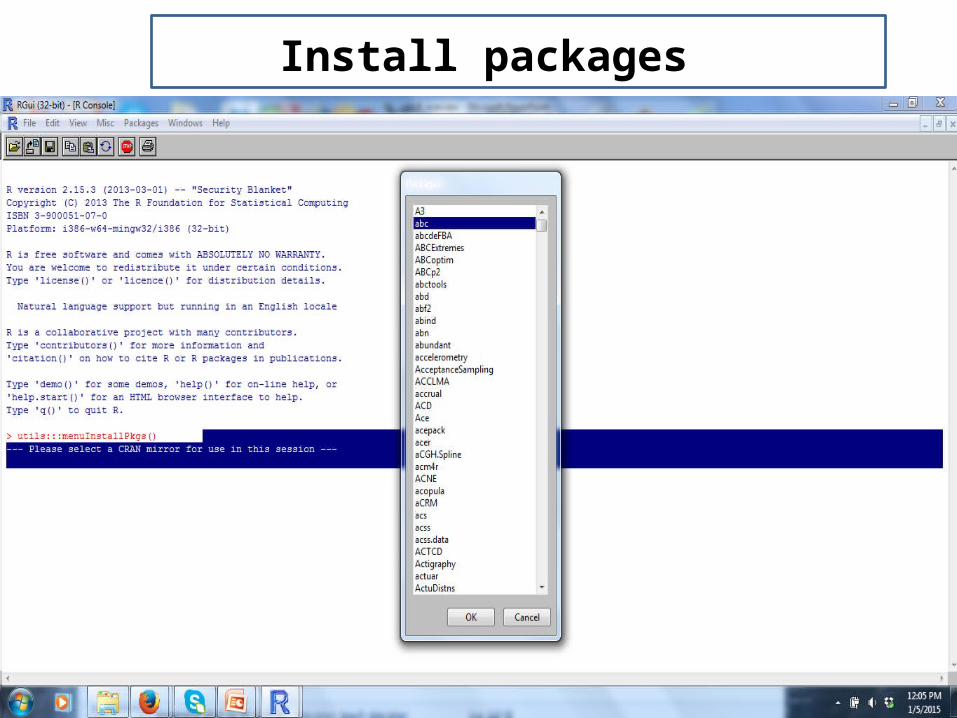
Exam of multivariate dataInstall packages

Exam of multivariate dataR script
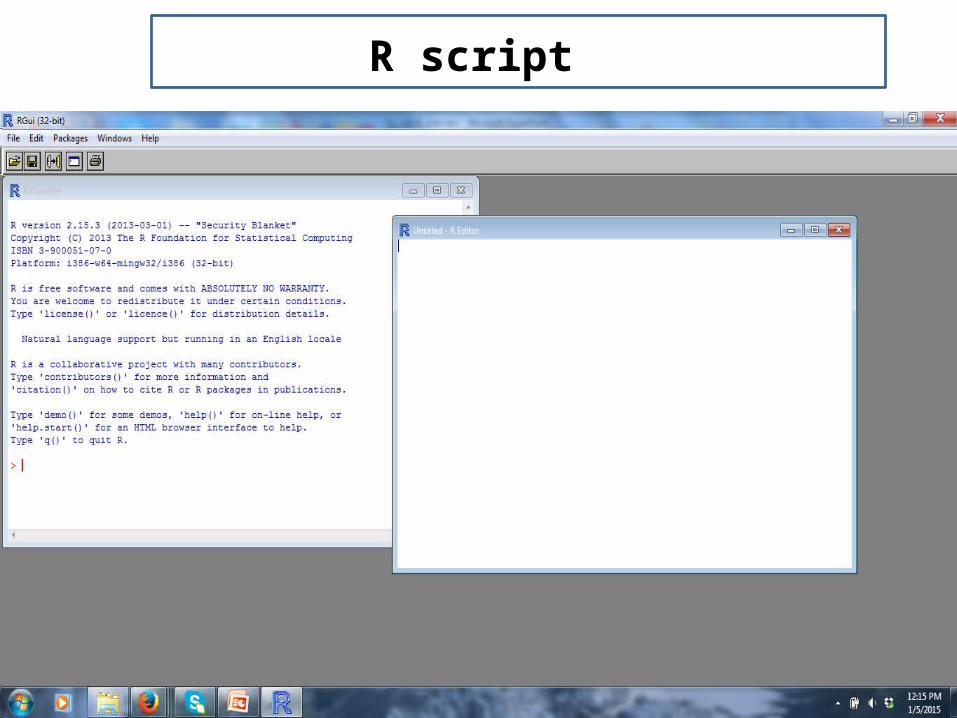
Exam of multivariate dataR script

Exam of multivariate dataRStudio
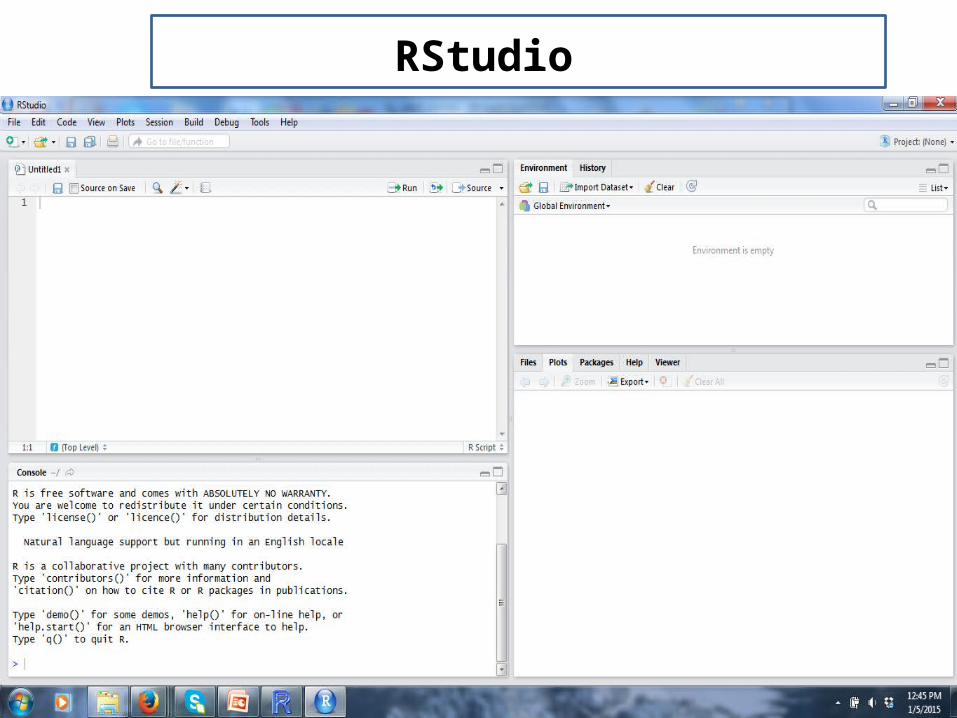
Exam of multivariate dataRStudio
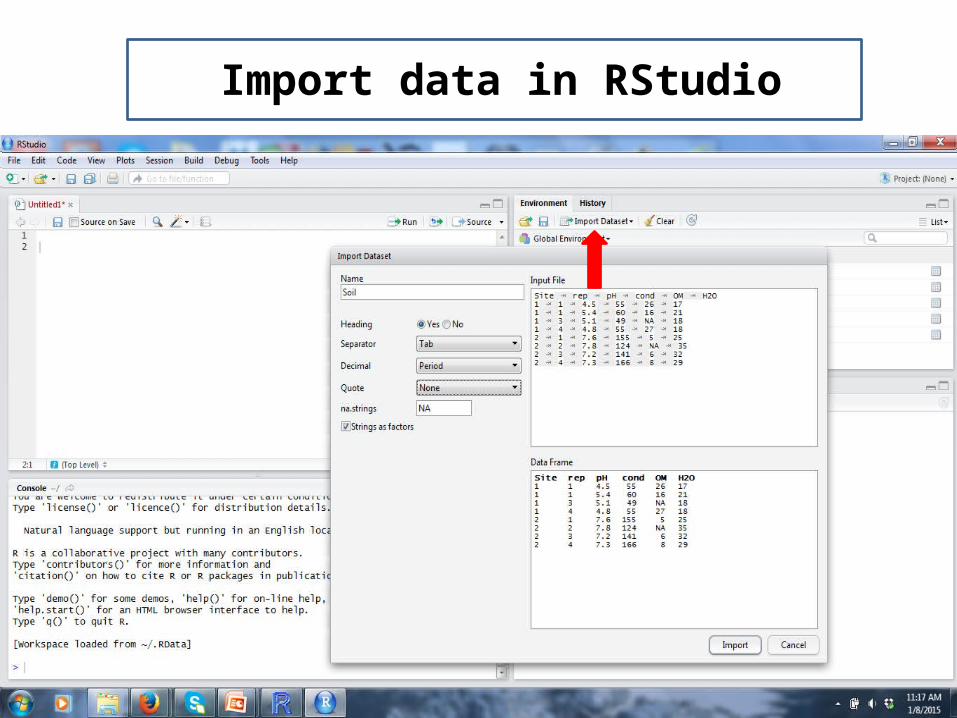
Example of multivariate data Import data in RStudio

Exam of multivariate dataInstall packages in RStudio

Exam of multivariate dataR in linux
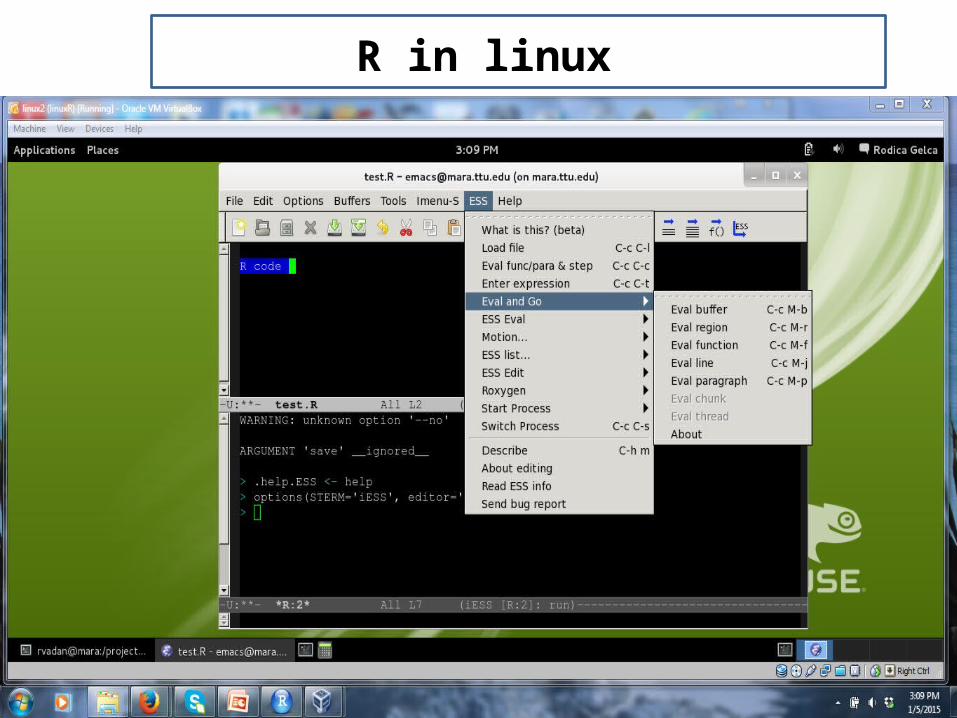
Exam of multivariate dataR in linux

Essential commands in R
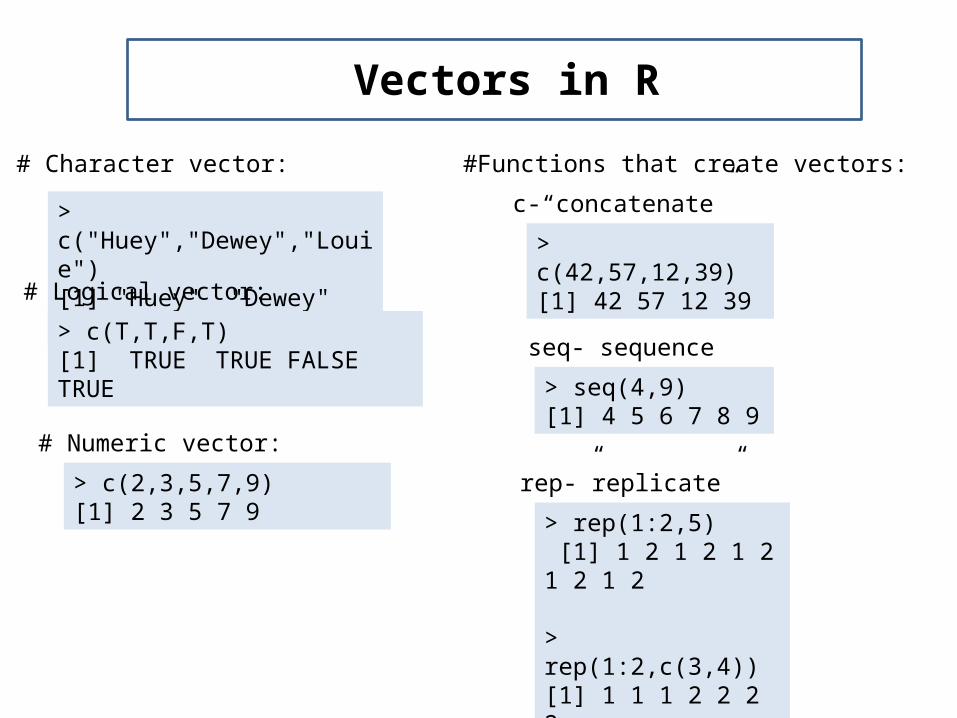
ExampleVectors in R
# Character vector:
> c("Huey","Dewey","Louie")[1] "Huey" "Dewey" "Louie"
# Logical vector:
> c(T,T,F,T)[1] TRUE TRUE FALSE TRUE
# Numeric vector:
> c(2,3,5,7,9)[1] 2 3 5 7 9
#Functions that create vectors:
c-“concatenate”
seq-”sequence”
rep-”replicate”
> c(42,57,12,39)[1] 42 57 12 39
> seq(4,9)[1] 4 5 6 7 8 9
> rep(1:2,5) [1] 1 2 1 2 1 2 1 2 1 2
> rep(1:2,c(3,4))[1] 1 1 1 2 2 2 2
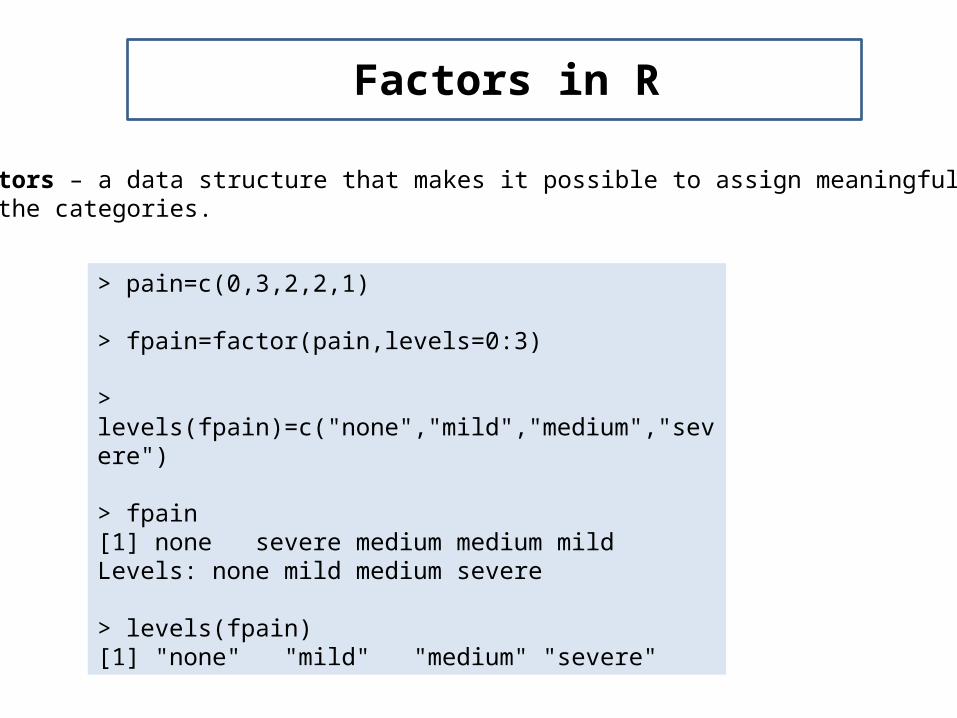
ExampleFactors in R
Factors – a data structure that makes it possible to assign meaningful names to the categories.
> pain=c(0,3,2,2,1)
> fpain=factor(pain,levels=0:3)
> levels(fpain)=c("none","mild","medium","severe")
> fpain[1] none severe medium medium mild Levels: none mild medium severe
> levels(fpain)[1] "none" "mild" "medium" "severe"

ExampleMatrices and arrays
> x=1:2> x=1:12> dim(x)=c(3,4)> x [,1] [,2] [,3] [,4][1,] 1 4 7 10[2,] 2 5 8 11[3,] 3 6 9 12
> x=matrix(1:12,nrow=3,byrow=T)> rownames(x)=LETTERS[1:3]> x [,1] [,2] [,3] [,4]A 1 2 3 4B 5 6 7 8C 9 10 11 12> t(x) A B C[1,] 1 5 9[2,] 2 6 10[3,] 3 7 11[4,] 4 8 12
LETTERS- build in variable that contains the capital letters A-Z.
t(x) – the transpose matrix of x.

ExampleMatrices and arrays
> cbind(A=1:4,B=5:8,C=9:12) A B C[1,] 1 5 9[2,] 2 6 10[3,] 3 7 11[4,] 4 8 12
> rbind(A=1:4,B=5:8,C=9:12) [,1] [,2] [,3] [,4]A 1 2 3 4B 5 6 7 8C 9 10 11 12
# Use the functions cbind and rbind to “bind” vectors together columnwise or rowwise.

ExampleData frames
Data frame – it is a list of vectors and/or factors of the same length, which are related “across”, such that data in the same position come from the same experimental unit (subject, animal, etc.).
> conc=c(5,12,20,24,35,40)> vol=c(20,25,33,40,50,55)> d=data.frame(conc,vol)> d conc vol1 5 202 12 253 20 334 24 405 35 506 40 55
Example of multivariate data Data manipulation in R
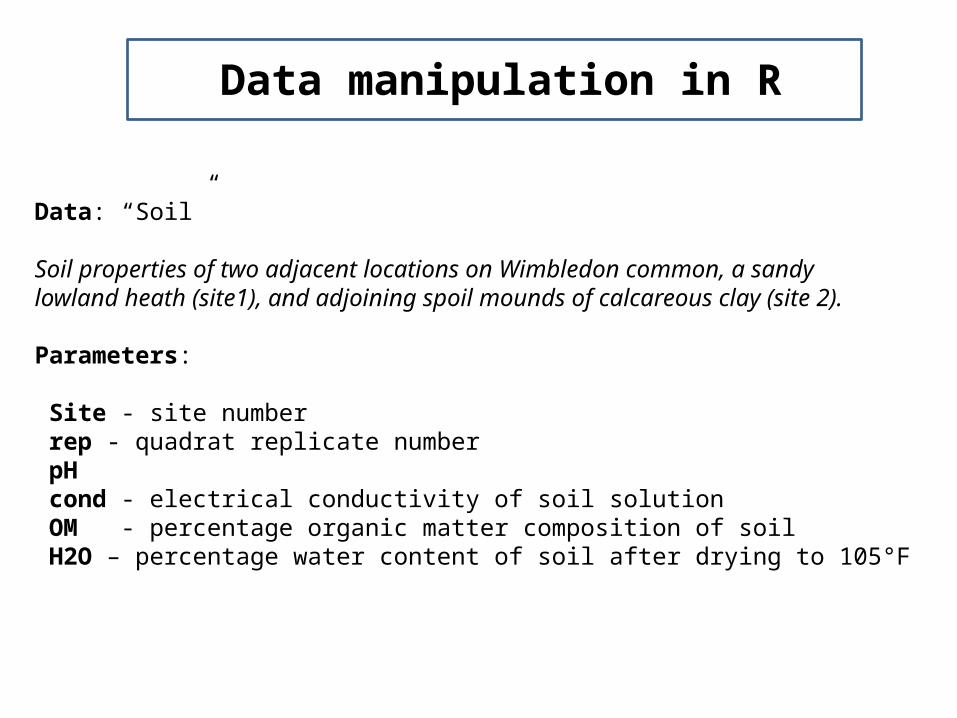
Data: “Soil”
Soil properties of two adjacent locations on Wimbledon common, a sandylowland heath (site1), and adjoining spoil mounds of calcareous clay (site 2).
Parameters:
Site - site number rep - quadrat replicate number pH cond - electrical conductivity of soil solution OM - percentage organic matter composition of soil H2O – percentage water content of soil after drying to 105°F

Example of multivariate data Read data in R
>Soil=read.csv("E:/Multivariate_analysis/Data/Soil.csv",header=T)
> Soil Site rep pH cond OM H2O1 1 1 4.5 55 26 172 1 1 5.4 60 16 213 1 3 5.1 49 NA 184 1 4 4.8 55 27 185 2 1 7.6 155 5 256 2 2 7.8 124 NA 357 2 3 7.2 141 6 328 2 4 7.3 166 8 29
A comment in R is marked with #
#import a .text file:
> Soil=read.table("E:/Multivariate_analysis/Data/Soil.txt",header=T)
#import a .csv file:
Example of multivariate data Data manipulation in R
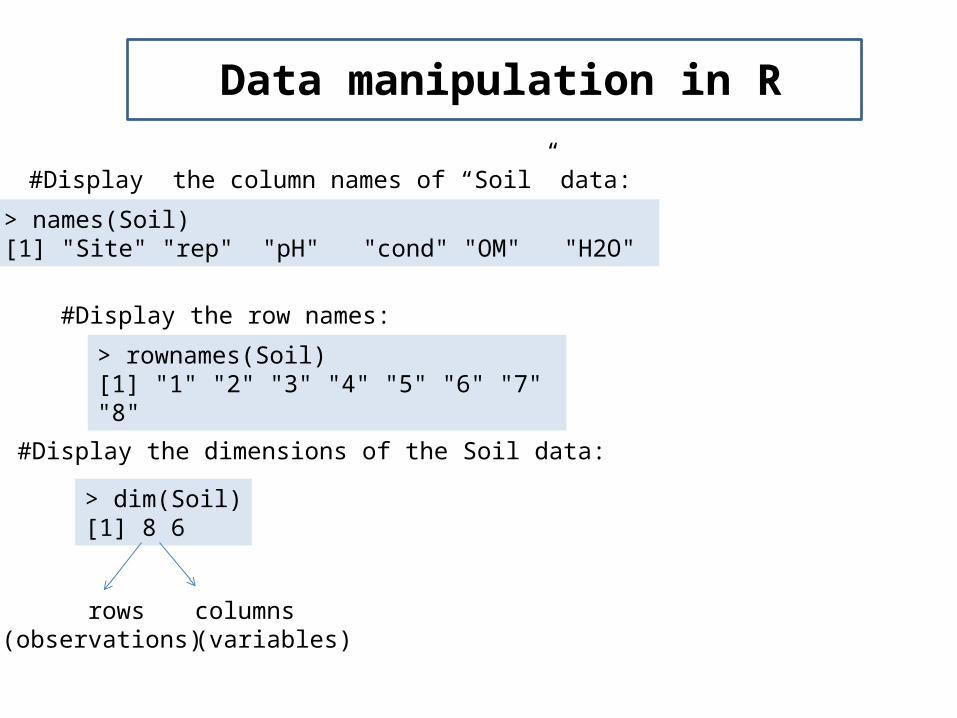
> names(Soil)[1] "Site" "rep" "pH" "cond" "OM" "H2O"
#Display the column names of “Soil” data:
#Display the row names:
> rownames(Soil)[1] "1" "2" "3" "4" "5" "6" "7" "8"
#Display the dimensions of the Soil data:
> dim(Soil)[1] 8 6
rows(observations)
columns(variables)

Example of multivariate data Data manipulation in R
#Select the second column of the data:
#or:
#Select the third row of the data:
> Soil[,2][1] 1 1 3 4 1 2 3 4
> Soil$rep[1] 1 1 3 4 1 2 3 4
>Soil[3,] Site rep pH cond OM H2O3 1 3 5.1 49 34 18
#Select rows 2,4, and 5:
> Soil[c(2,4,5),] Site rep pH cond OM H2O2 1 1 5.4 60 16 214 1 4 4.8 55 27 185 2 1 7.6 155 5 25
Example of multivariate data Data manipulation in R
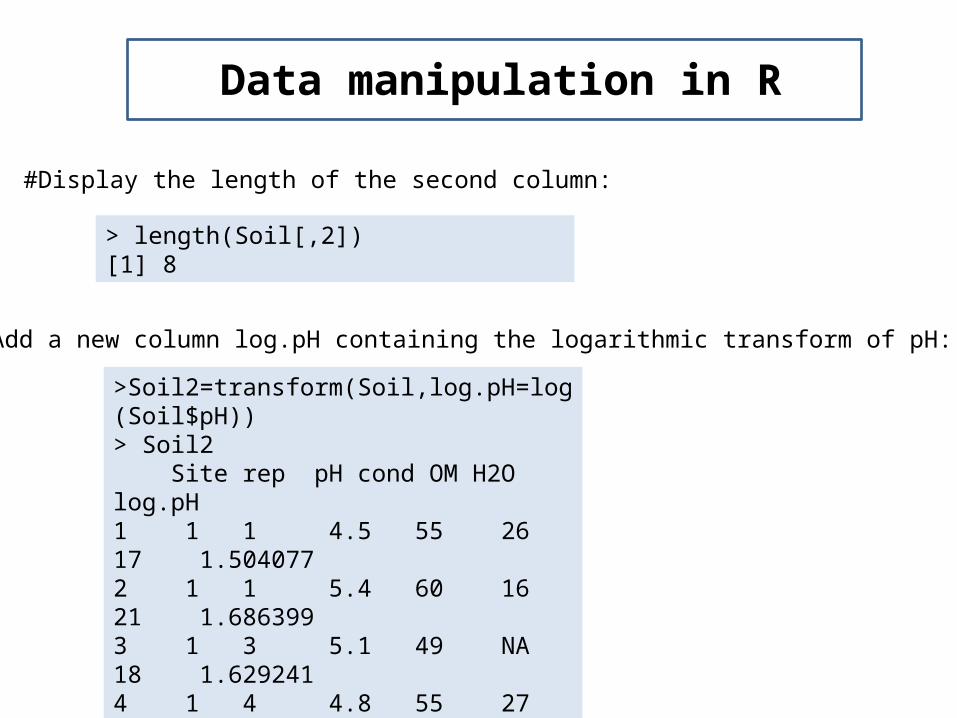
#Display the length of the second column:
#Add a new column log.pH containing the logarithmic transform of pH:
> length(Soil[,2])[1] 8
>Soil2=transform(Soil,log.pH=log(Soil$pH))> Soil2 Site rep pH cond OM H2O log.pH1 1 1 4.5 55 26 17 1.5040772 1 1 5.4 60 16 21 1.6863993 1 3 5.1 49 NA 18 1.6292414 1 4 4.8 55 27 18 1.5686165 2 1 7.6 155 5 25 2.0281486 2 2 7.8 124 NA 35 2.0541247 2 3 7.2 141 6 32 1.9740818 2 4 7.3 166 8 29 1.987874

Example of multivariate data Data manipulation in R
#Delete the third column (pH) of the “Soil2” data:
> Soil3=Soil2[,-3]> Soil3 Site rep cond OM H2O log.pH1 1 1 55 26 17 1.5040772 1 1 60 16 21 1.6863993 1 3 49 NA 18 1.6292414 1 4 55 27 18 1.5686165 2 1 155 5 25 2.0281486 2 2 124 NA 35 2.0541247 2 3 141 6 32 1.9740818 2 4 166 8 29 1.987874
Example of multivariate data Data manipulation in R
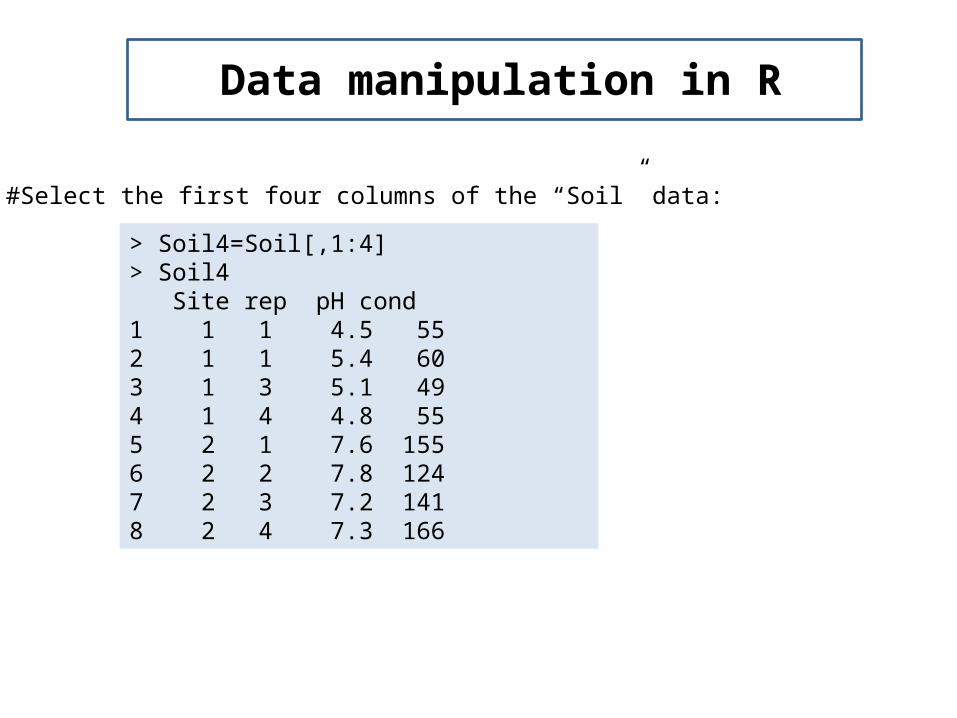
#Select the first four columns of the “Soil” data:
> Soil4=Soil[,1:4]> Soil4 Site rep pH cond1 1 1 4.5 552 1 1 5.4 603 1 3 5.1 494 1 4 4.8 555 2 1 7.6 1556 2 2 7.8 1247 2 3 7.2 1418 2 4 7.3 166

Example of multivariate data Data manipulation in R
#Obtain a subset of the “Soil” data with cond >100:
> Soil5=subset(Soil,Soil$cond>100)> Soil5 Site rep pH cond OM H2O5 2 1 7.6 155 5 256 2 2 7.8 124 NA 357 2 3 7.2 141 6 328 2 4 7.3 166 8 29
#Obtain a subset of the “Soil” data with cond >100 and H2O<32
>Soil6=subset(Soil,Soil$cond>100&Soil$H2O<32)> Soil6 Site rep pH cond OM H2O5 2 1 7.6 155 5 258 2 4 7.3 166 8 29
Example of multivariate data Data manipulation in R
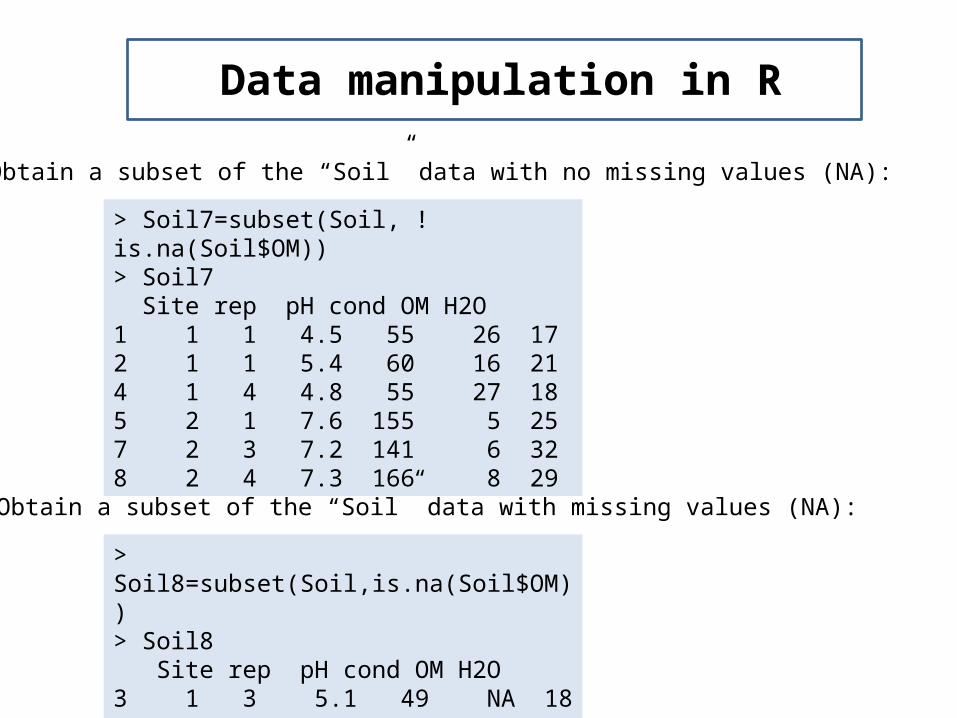
#Obtain a subset of the “Soil” data with no missing values (NA):
> Soil7=subset(Soil, !is.na(Soil$OM))> Soil7 Site rep pH cond OM H2O1 1 1 4.5 55 26 172 1 1 5.4 60 16 214 1 4 4.8 55 27 185 2 1 7.6 155 5 257 2 3 7.2 141 6 328 2 4 7.3 166 8 29
#Obtain a subset of the “Soil” data with missing values (NA):
> Soil8=subset(Soil,is.na(Soil$OM))> Soil8 Site rep pH cond OM H2O3 1 3 5.1 49 NA 186 2 2 7.8 124 NA 35

Example of multivariate data Data manipulation in R
#Identify which observations have pH<7: > which(Soil$pH<7)[1] 1 2 3 4
# observations (rows) 1,2,3,and 4 have pH<7.
#Identify which observations have missing values for OM: > which(is.na(Soil$OM))[1] 3 6
#observations 3 and 6 have missing values for OM.
#Identify which observation has pH=5.4: > which(Soil$pH==5.4)[1] 2
> which(Soil$Site!=1)[1] 5 6 7 8
#Identify which observations are not from the Site 1:

Example of multivariate data Data manipulation in R
#Order “Soil” data by pH:
> Soil9=Soil[order(Soil$pH),]> Soil9 Site rep pH cond OM H2O1 1 1 4.5 55 26 174 1 4 4.8 55 27 183 1 3 5.1 49 NA 182 1 1 5.4 60 16 217 2 3 7.2 141 6 328 2 4 7.3 166 8 295 2 1 7.6 155 5 256 2 2 7.8 124 NA 35
> Soil10=Soil[order(-Soil$pH),]> Soil10 Site rep pH cond OM H2O6 2 2 7.8 124 NA 355 2 1 7.6 155 5 258 2 4 7.3 166 8 297 2 3 7.2 141 6 322 1 1 5.4 60 16 213 1 3 5.1 49 NA 184 1 4 4.8 55 27 181 1 1 4.5 55 26 17
Increasing Decreasing

Example of multivariate data Data manipulation in R
#Save “Soil10” data from the R console to your computer:
>write.table(Soil10,file="E:/Multivariate_analysis/pH_Order_Soil.csv“,row.names=F,col.names=names(Soil10),quote=F,sep=",")
#Load a package in R (after installing it):
> library(MASS) # load the package called MASS
# Get help with R functions:
>help(read.table)
>?read.table
or
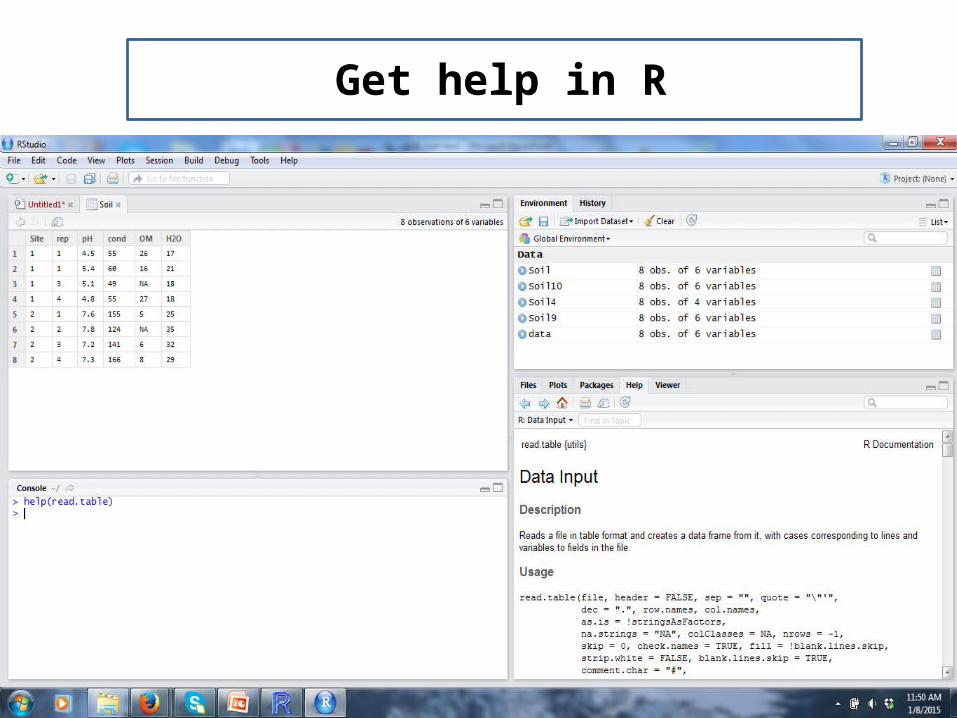
Example of multivariate data Get help in R
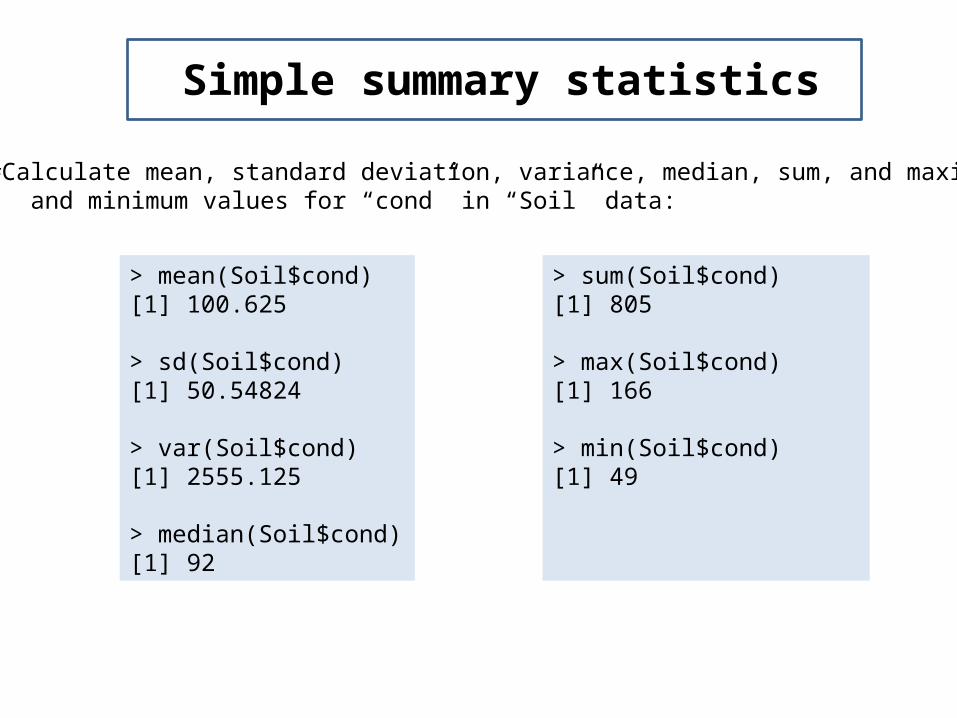
Example of multivariate data Simple summary statistics
#Calculate mean, standard deviation, variance, median, sum, and maximum and minimum values for “cond” in “Soil” data:
> mean(Soil$cond)[1] 100.625
> sd(Soil$cond)[1] 50.54824
> var(Soil$cond)[1] 2555.125
> median(Soil$cond)[1] 92
> sum(Soil$cond)[1] 805
> max(Soil$cond)[1] 166
> min(Soil$cond)[1] 49

Example of multivariate data Graphics in R

Example of multivariate data Graphics in R