EXAMINING THE USE OF MARKETING METRICS IN ANNUAL …
165
COURSE REP-P REPORT STUDENT 70822344 EXAMINING THE USE OF MARKETING METRICS IN ANNUAL REPORTS OF SA LISTED COMPANIES by HILKE GARTZ
Transcript of EXAMINING THE USE OF MARKETING METRICS IN ANNUAL …

COURSE REP-P REPORT STUDENT 70822344
EXAMINING THE USE OF MARKETING METRICS IN
ANNUAL REPORTS
OF SA LISTED COMPANIES
by
HILKE GARTZ
COURSE REP-P: RESEARCH REPORT STUDENT 70822344
II
EXAMINING THE USE OF MARKETING METRICS IN
ANNUAL REPORTS
OF SA LISTED COMPANIES
by
HILKE GARTZ
submitted in part fulfillment of the requirements for the degree of MBL
in the subject
MARKETING
at the
UNIVERSITY OF SOUTH AFRICA
SUPERVISOR: PROF. P. VENTER
November 2007

COURSE REP-P: RESEARCH REPORT STUDENT 70822344
III
Abstract
Purpose
This paper analyses the use of marketing metrics and marketing information and metrics contained
in 2006/7 annual reports of companies listed on the Johannesburg Stock Exchange. The
assumption is that the annual reports are the vehicle whereby listed companies communicate to
their shareholders and other stakeholder constituencies.
Methodology
The assessment criteria is based on Ambler’s (2003) suggested marketing metrics and qualitative
data is based on a checklist compiled from various academic sources. The elements which are
assessed pertain to brand equity, other customer metrics, segmentation, competition, innovation
and environmental and strategic aspects. The information obtained is compared to information
required by investors and rating is done based on a grand total maturity.
Findings
Research results indicate that the use of quantitative metrics and qualitative data is very limited.
The majority of companies display a lack of information pertaining to marketing. The results reflect
a bi-modal tendency. Half (53%) of the companies do not provide any or poor information on their
brand whereas 26% of companies supplied good and excellent information. The grand total score
indicates that nearly two thirds (60%) of companies obtain a score of less than 50%, providing
insufficient information. On the other hand, 27% of companies provide good and excellent
information. Segmentation metrics are generally not reflected in annual reports, neither are
competitors. Innovation and environmental aspects influencing market trends are covered by two
thirds, however a third provides insufficient information. Other findings include that no standard
reporting format exists. Information pertaining to marketing is spread throughout the annual reports.
None of the companies provide a glossary of marketing definition or brand terminology.
Research implications
More in-depth research needs to be conducted on various industry sectors and amongst investors
as to their needs.
Originality/ value
The paper is of value to corporate executives, marketing and communication practitioners who
seek to improve communication and to convey optimal information for the investment community.
The aim is to stimulate executive management to revise their relationship towards customers, the
brand, marketing strategy and investors.
Keywords
Marketing metrics, marketing performance measures, annual report, shareholder value

COURSE REP-P: RESEARCH REPORT STUDENT 70822344
IV
Acknowledgements
The input and assistance of the following people in the compilation of this research is gratefully
acknowledged and very much appreciated:
Professor Peet Venter, for getting me started and giving me guidance
My life mentor and dearest friend Denis, who has enabled me to reach new heights

COURSE REP-P: RESEARCH REPORT STUDENT 70822344
V
Table of Contents
CHAPTER 1: Orientation .................................................................................................................1 1.1 Introduction................................................................................................................ 1 1.2 Importance of Study ................................................................................................. 1 1.3 Purpose of Research and Assumption of Study ..................................................... 3 1.4 Objectives of the Study............................................................................................. 4 1.5 Definition of Marketing .............................................................................................. 5 1.6 Delimitation of Study ................................................................................................. 5 1.7 Outline of Research Report...................................................................................... 6
CHAPTER 2: Foundation of Study ............................................................................................7 2.1 Introduction................................................................................................................ 7 2.2 The Origins of Marketing .......................................................................................... 7 2.3 The Role of Marketing in the Organisation .............................................................. 8 2.4 Measurement Tools ............................................................................................... 10 2.5 Marketing in South Africa ...................................................................................... 10 2.6 Conclusion ............................................................................................................. 11
CHAPTER 3: Literature Review ............................................................................................. 12 3.1 Introduction............................................................................................................. 12 3.2 Accounting Regulations......................................................................................... 12 3.3 The Role of Annual Reports .................................................................................. 13 3.4 Research on Annual Reports ................................................................................ 13 3.5 Creation of Shareholder Value .............................................................................. 16 3.6 Brand Equity........................................................................................................... 19 3.7 The Debate on Financial versus Marketing Measures ........................................ 20 3.8 Measuring Marketing’s Performance .................................................................... 23 3.9 Implementation of Metrics ..................................................................................... 33 3.10 Conclusion ............................................................................................................. 35
CHAPTER 4: Research Design & Analysis ......................................................................... 37 4.1 Introduction............................................................................................................. 37 4.2 Methodology .......................................................................................................... 37 4.3 The Assessment Method ...................................................................................... 38 4.4 The Sample ............................................................................................................ 38 4.5 Data Analysis ......................................................................................................... 39 4.6 Measuring Instruments and Assessment Criteria ................................................ 40 4.7 Rating Scale Procedure ........................................................................................ 43 4.8 Qualitative Method ................................................................................................. 44 4.9 Research Questions ............................................................................................. 44 4.5 Limitations of Study ............................................................................................... 48 4.6 Conclusion ............................................................................................................. 48
CHAPTER 5: Research Results ............................................................................................ 50 5.1 Introduction............................................................................................................. 50 5.2 Financial Aspects ................................................................................................... 50 5.3 Brand Equity........................................................................................................... 50 5.4 Other Customer Metrics ........................................................................................ 56 5.5 Segmentation Metrics ............................................................................................ 57 5.6 Competition ............................................................................................................ 59 5.7 Innovation Performance ........................................................................................ 59 5.8 Environmental and Strategic Aspects .................................................................. 60 5.9 Reporting Standard ............................................................................................... 63 5.10 Glossary ................................................................................................................. 63 5.11 Information required by Investors ......................................................................... 63 5.12 Grand Total Maturity Model................................................................................... 64 5.13 Summary of Findings ............................................................................................ 67
CHAPTER 6: Discussion, Conclusion, Recommendations ..................................................... 69 6.1 Introduction............................................................................................................. 69
COURSE REP-P: RESEARCH REPORT STUDENT 70822344
VI
6.2 Financial Aspects ................................................................................................... 69 6.3. Brand Equity........................................................................................................... 71 6.4 Brand Equity: What customers think (Reputation) .............................................. 75 6.5 Brand Equity: What customers feel (Customer Satisfaction) .............................. 76 6.6 Brand Equity: Customer Loyalty ........................................................................... 77 6.7 Brand Equity: Availability/ Distribution Channel ................................................... 78 6.8 Other Customer Performance Indicators ............................................................. 79 6.9 Segmentation ......................................................................................................... 80 6.10 Competition ............................................................................................................ 80 6.11 Innovation ............................................................................................................... 81 6.12 Environmental and Strategic Analysis .................................................................. 82 6.13 General Comments ............................................................................................... 86 6.14 Information Required by Investors ........................................................................ 89 6.15 Grand Total Maturity Model................................................................................... 90 6.16 Conclusion ............................................................................................................. 91 6.17 Recommendations ................................................................................................ 95
CHAPTER 7: Abstract ................................................................................................................ 99 References .................................................................................................................................. 121 Appendix ...................................................................................................................................... 124

COURSE REP-P: RESEARCH REPORT STUDENT 70822344
VII
Appendix
Annexure 1 Financial Metrics Checklist Annexure 2 General Marketing Metrics Checklist Annexure 3 Grand Total Maturity Model Annexure 4 List and description of Companies Annexure 5 Detailed information per company Annexure 6 Annual Reports’ Rating: Brand Equity Annexure 7 Annual Reports’ Rating: Other Customer Metrics Annexure 8 Annual Reports’ Rating: Segmentation Annexure 9 Annual Reports’ Rating: Innovation Annexure 10 Annual Reports’ Rating: Environmental and Strategic Aspects Annexure 11 Example of Annual Reports Annexure 11.1 Massmart Annexure 11.2 SAB Miller Annexure 11.3 AVI Annexure 11.4 Rainbow Chicken Annexure 11.5 Ellerine Annexure 11.6 Kagiso Media Annexure 11.7 Distell Annexure 11.8 Naspers Annexure 12 List of Tables and Figures Annexure 13 Statistical Analysis

COURSE REP-P: RESEARCH REPORT STUDENT 70822344
VIII
List of Tables Table 5.1 Explanation of Total Brand Equity Rating Scale 51 Table 5.2 Frequency and percentage distribution of Total Brand Equity ratings 51 Table 5.3 Rating scale for Elements of Brand Equity 53 Table 5.4 Frequency and percentage distribution of Brand Equity Elements 53 Table 5.5 Frequency and percentage distribution of Brand Penetration 53 Table 5.6 Frequency and percentage distribution of Reputation 54 Table 5.7 Frequency and percentage distribution of Customer Satisfaction 54 Table 5.8 Frequency and percentage distribution of Customer Loyalty 54 Table 5.9 Frequency and percentage distribution of Availability/ Distribution Channel 55 Table 5.10 Rating scale for Customer Metrics 56 Table 5.11 Frequency and percentage distribution of Market Share 56 Table 5.12 Frequency and percentage distribution of Relative Price 56 Table 5.13 Frequency and percentage distribution of Sales to New Customers 57 Table 5.14 Rating scale for Segmentation 57 Table 5.15 Frequency and percentage distribution of percentage of market 57 represented by segment Table 5.16 Frequency and percentage distribution of percentage of total market 58 produced by segment Table 5.17 Frequency and percentage distribution of profit produced by segment 58 to weight of segment in total population Table 5.18 Frequency and percentage distribution of percentage defection rate 58 Table 5.19 Frequency and percentage distribution of Customer Retention rate per 59 market segment Table 5.20 Frequency and percentage distribution of Top 10 customers/ Actual or 59 potential Customer Lifetime Value Table 5.21 Frequency and percentage distribution of Initiatives in Process 60 Table 5.22 Frequency and percentage distribution of percentage revenue due to 60 launches Table 5.23 Frequency and percentage distribution of Innovations launched 60 Table 5.24 Rating scale for environmental and strategic aspects 61 Table 5.25 Frequency and percentage distribution of External Factors influencing 61 market trends Table 5.26 Frequency and percentage distribution of Environmental influences on 61 marketing Table 5.27 Frequency and percentage distribution of Key Risk Factors influencing 61 cash flow or risk assessment per segment Table 5.28 Frequency and percentage distribution of Marketing’s alignment to Strategy 62 Table 5.29 Frequency and percentage distribution of Chairperson mentioning 62 marketing or quantifying marketing assets Table 5.30 Information deemed important by investors versus information supplied 63 in annual reports Table 5.31 Rating scale of annual reports’ Grand Total Maturity Level 64 Table 5.32 Frequency and percentage distribution of annual reports’ rating level 64 as per Grand Total Maturity Level List of Figures Figure 5.1 Pie Chart showing rating percentage per companies’ Total Brand Equity 52 Figure 5.2 Histogram showing rating level results of Brand Equity 52 Figure 5.3 Box plot showing sector’s rating scale of Brand Equity 52 Figure 5.4 Correlation between Marketing’s alignment to Strategy and Brand Equity 62 Figure 5.5 Frequency of annual reports rated as per Grand Total Maturity Model 65 Figure 5.6 Box plot depicting rating scale of all elements by sector 66 Figure 5.7 Histogram depicting Grand Total 66

COURSE REP-P: RESEARCH REPORT STUDENT 70822344
IX

COURSE REP-P REPORT STUDENT 70822344
CHAPTER 1: Orientation
1.1 Introduction
In recent years the need to show what marketing contributes to business success has been raised
time and time again. The Marketing Science Institute has stated that marketing performance
measures (metrics) have for consecutive years in mid-2000 been identified as one of the top
priorities which need to be attended to (Ambler, 2003:xiii). Marketing practitioners, academics and
consultants have been confronted with many challenges. Some of these are:
• Marketing is the conduit between the company and the customer, but has problems
quantifying its results internally to the company while externally it is said to push the
company’s need, sometimes to the detriment of consumer and public.
• There is no consensus on what the marketing field entails. Non-marketers’ perceptions
often differ from those of the specialists.
• The marketing function has been downgraded from a strategic position to a tactical support
function.
• Marketing executives are said to lack the necessary marketing skills
• Application of marketing metrics has been problematic and no generally accepted
standards have been consistently applied by companies globally. This has led to
insufficient measurement of market performance.
• Individual companies often do not consistently and reliably measure marketing aspects
such as their customer segment profitability, marketing mix and brand equity.
• Intangible assets with long term results such as a brand are difficult to measure and are
therefore often ignored.
• Financial analysis is the norm for annual reports and intangible assets do not have to be
reflected. Accounting principles take a short term view, whereas changes such as growth
in brand equity are not measured. As their worth is not reflected in performance, the
marketing function is not given its due recognition
• Marketing performance measurements are not globally standardized and enforced.
This leads to the conclusion that marketing needs to be clarified and marketing metrics can assist
with achieving this. One way of assessing a company’s perception of the importance of marketing,
is to assess the marketing content of publicly available documents such as annual reports.
1.2 Importance of Study
The reason for selecting the topic “Examining the use of marketing metrics in annual reports of SA
listed companies” is that marketing’s traditional role has been that of the key enabler between the
customer and the company and annual reports are one of the key communication tools with

COURSE REP-P: RESEARCH REPORT STUDENT 70822344
2
investors and stakeholders. Marketing has the ability to give direction and build the
competitive strengths of a company and, when applied, properly add substantial value to the
organization.
Aspects of marketing have been increasingly relegated away from core decision-making to other
organizational units. Its role has been marginalized, often to become a sales support department
(McDonald, 2006:426). Marketing professionals have tended to focus on tactical aspects. This has
led to marketing taking on a diminishing role of importance in the organization. To give the
marketing function its due credit (and more importantly, allow it to play its proper role), marketing
has to become a strategic function which can be measured, researched and developed.
Marketers have historically reported on sales related measures such as market share, but have
ignored focusing on shareholder value and impact on profit (Ambler, 2003). Traditional accounting
methods, pressures from financial markets and senior executive management’s performance drive
have caused many companies to emphasize short term outcomes. With a move towards more
stringent corporate governance and increased transparency the trend nowadays is to incorporate
values of intangible assets and to take a more long term view in establishing the worth of a
company.
The scope of management’s responsibility has increased substantially in the last decade – having
to address issues such as global competitiveness and increased customer knowledge and
demands. Executives need to be well informed and knowledgeable, thereby enabling good
decision-making, while investors need to be assured that management is monitoring, evaluating
and managing the business as best as possible.
Marketing metrics can be part of the solution, giving the company financial quantitative and
qualitative indicators of performance in the marketplace on which management and investors need
to make decisions. Kerin (2005:13) highlights that research is needed and should focus on metrics
that matter to CEO’s and corporate boards. In order to take corrective action and to align with
investor’s objectives, marketing needs to be assessed.
Research (Ambler, 2002:48; McDonald and Dunbar, 2004:4; Greenyer, 2006:240) has shown that
little information on marketing is shown in annual reports and that more can be done. To make
good decisions measures such as quantifying and assessing the value of marketing metrics are
necessary.
The gains from marketing can sometimes only be assessed over the medium to long term.
Measuring long term and intangible assets in conjunction with short term financials has become
essential. Shareholders need to base their decisions on facts and best practice and to have access
to information regarding their investment. Research suggests that companies and shareholders

COURSE REP-P: RESEARCH REPORT STUDENT 70822344
3
gain from disclosing marketing related information in their annual reports. If more
marketing information were disclosed in annual reports the quality of annual reports could improve
by becoming more valuable. More marketing disclosure could facilitate companies taking a more
long term view on their brands thereby enhancing long term sustainability of their businesses.
Annual reports can become more valuable tools for investors, analysts and other stakeholders by
aiding their decision-making. By suggesting ways of measuring marketing metrics and showing the
current state of disclosure in annual reports, executives might become aware of the need to
incorporate intangible assets such as a brand and the need to take a longer term view. In addition,
the study aims to highlight the need to measure more accurately and consistently marketing
performance and to compare it to benchmarks and competitors. The study might result in
highlighting the need for a more standardized set and usage of marketing metrics which, in turn,
might assist marketing managers in substantiating their budget requests and improving overall
marketing performance.
The research aims to assess to what extent (type and depth) qualitative marketing aspects are
reported in annual reports and how quantitative metrics are reflected. This will be done by
assessing the use of marketing metrics in annual reports. Aspects such as customers, competition,
brand, segmentation, innovation, and strategic marketing information will be addressed. The
companies will also be assessed according to their level of marketing metrics maturity.
1.3 Purpose of Research and Assumption of Study
This research proposes to assess to what extent companies communicate their marketing metrics
and information relevant to marketing in annual reports. The analysis will include review of the full
contents of annual reports, both qualitative and quantitative.
The purpose of this research is to assess the level of maturity in terms of marketing metrics and the
degree of credibility marketing is being assigned by executives and as communicated to
shareholders. This will be done by primarily analyzing annual reports. The research aims to provide
an insight on whether and to what extent companies display marketing metrics and marketing
trends in their annual reports.
In order to promote marketing and its role in creating value and sustainability for the company
management needs to be able to measure the effectiveness of marketing. This makes the
compilation and disclosure of marketing metrics necessary.
The researcher hopes to stimulate new ways of thinking about the importance of marketing metrics
with a view to improving the perception of the importance of the marketing function.
COURSE REP-P: RESEARCH REPORT STUDENT 70822344
4
The main assumption of the study is that annual reports are seen as vehicles
whereby listed companies communicate with their stakeholder constituencies.
1.4 Objectives of the Study
The primary objective of this research is to determine the quality and type of disclosure pertaining to
aspects of marketing and usage of marketing metrics in listed companies’ annual reports. From
this we can deduct what level of importance companies place on conveying and disclosing
marketing information and metrics to external stakeholders such as investors.
The aim is to assess the overall maturity level of marketing disclosure and to assess whether it is
sufficient for the investor community to use annual reports for their investment decisions.
This will be done by evaluating firstly, the quantitative aspects based on Ambler’s (2003) suggested
marketing metrics measurements. Secondly, assessment of the qualitative criteria will be based on
the extent and quality of the marketing contents in annual reports. Trends and general tendencies
observed in annual reports will also be reported on.
The qualitative and quantitative aspects will be combined to result in a rating per company for total
brand equity and for a grand total score. These ratings will give an indication of the importance
companies assign to marketing in their communication with shareholders.
1.4.1 Objective 1
The objective is to analyze the extent to which quantitative marketing performance
measures (metrics) are disclosed in annual reports of listed corporate businesses in South
Africa. This will be done by assessing metrics as per Ambler’s (2003) suggested metrics.
These include financial and brand equity measurements, other customer and
segmentation metrics, measurements pertaining to competition, innovation and more
generally mentioning of environmental and strategic aspects pertaining to marketing and
the use of a marketing glossary.
1.4.2 Objective 2
The second objective is to determine the qualitative marketing information reflected in
annual reports. This will be done by assessing the type of marketing aspects mentioned
and to what extent (their quality) is reflected. The aspects under review are brand,
customer, segmentation, competition, innovation, environment and strategy, the source
(under which section in annual reports these aspects are mentioned). General tendencies
and trends will be commented on under this section. This will give an indication of the
value companies place on marketing and disclosure thereof.

COURSE REP-P: RESEARCH REPORT STUDENT 70822344
5
1.4.3 Objective 3
The third objective is to collate this information by rating each company individually on its
elements and then drawing a total for brand equity and grand total score. The grand total
score will be based on Ambler’s (2003) five level marketing maturity model. Results
should indicate the level of sophistication used by companies in reflecting marketing
metrics and other marketing aspects in annual reports. This overall level of maturity or
sophistication will give an indication whether sufficient marketing metrics and aspects are
communicated for investor and other external stakeholder purposes.
1.5 Definition of Marketing
The American Marketing Association (2007) defines marketing as follows: “Marketing is an
organizational function and a set of processes for creating, communicating, and delivering value to
customers and for managing customer relationships in ways that benefit the organization and its
stakeholders”.
Other definitions state that marketing is a multifaceted field that leverages perspectives from
multiple disciplines and its studies cover a range of topics such as macro to micro, organization to
the consumer, capitalist practice to social welfare and local to global (MacInnes, 2005:14).
The definition of marketing as per Doyle (2001:53) states “Marketing is the management process
that seeks to maximize returns to shareholders by developing and implementing strategies to build
relationships of trust with high value customers and to create sustainable advantage”.
In a world class organization the customer is at the centre of a business model. McDonald
(McDonald and Dunbar, 2004:9) defines marketing as a process of understanding and defining
markets, quantifying the needs of customer groups within these segments and developing a value
proposition for satisfying these researched needs. These propositions then have to be
communicated externally and within the organization. Marketing plays a role in delivering these
value propositions as well as monitoring its delivery. For the process to be effective, an organization
needs to be customer driven (McDonald, 2006:427).
Each of these definitions have a slightly different focus. For our research purposes we will align
ourselves more closely with the definitions by Doyle’s and McDonald’s as they emphasize the
strategic role and needs of shareholders and customers.
1.6 Delimitation of Study
The objective is to assess the importance placed on marketing and marketing metrics by South
African corporate companies as communicated in annual reports of the year 2006. The sample will

COURSE REP-P: RESEARCH REPORT STUDENT 70822344
6
consist of corporate companies from various sectors listed on the South African
Johannesburg Stock Exchange. The aim is to assess each company’s level of maturity in terms of
marketing metrics. It is a point in time representation, based mainly on Ambler’s (2003) guidelines.
Although an assessment of use of marketing metrics at board level would have been the preferred
method, this is not possible due to confidentiality, accessibility and time constraints.
1.7 Outline of Research Report
The report begins by briefly stating the origins and role of marketing in organizations. In the
literature review the role of and research pertaining to annual reports and accounting regulations
are outlined. It continues with creation of shareholder value and discussion of an intangible
marketing asset, a company’s brand(s). This leads to the debate on financial measures and tools
and models to use in evaluating marketing. The report continues with how to measure the brand
and internal marketing (employees and innovation) and the marketing mix. More detail is given on
the characteristics and possible choices of metrics with suggestions as to implementation. This
serves as background to the problem statements.
Chapter 4 refers to the research design, assessment criteria and questions to evaluate the type and
extent of qualitative and quantitative marketing information presented in annual reports. Financial,
brand equity, consumer, segmentation, competitors, environmental and strategic measurements
and information will be gathered and analyzed. Each element is individually rated per company.
Finally overall rating of brand equity and grand total score will be derived and assessed according
to a grand total maturity evaluation model. Chapter 5 describes the quantitative and qualitative
research results. The final chapter 6 presents a discussion, conclusion and recommendations.

COURSE REP-P: RESEARCH REPORT STUDENT 70822344
7
CHAPTER 2: Foundation of Study
2.1 Introduction
The perception of the value which the marketing function can add to a company has in recent years
seemingly deteriorated in practice. Research is needed and should focus on metrics that matter to
chief executive officers and corporate boards (Kerin, 2005:13) and investors. The approach of this
research is to establish whether sufficient information and what type of information is provided on
marketing in annual reports with the view of highlighting some of the challenges which need to be
overcome.
2.2 The Origins of Marketing
Webster (1992:4) defines marketing as having a tactical, cultural and strategic dimension. In the
past 60 years the emphasis has shifted and the tactical dimension has been emphasized during
the past two decades. During the 1960s the notion of the four P’s of marketing (product, price,
promotion, place) was readily accepted. However, in the original concept in the 1950s the main
marketing variables, namely segmentation, targeting and positioning, were omitted and did not form
part of tactical marketing. Marketing had been downsized or eliminated as a corporate function.
Important functions of marketing had been delegated to strategic business units who did not have
the necessary marketing skills, resources or time. Traditional marketing tools originated in the
1960s and took a more strategic approach with tools like the Boston Consultancy Group Matrix, the
Ansoff Matrix, the SWOT analysis and the 4P’s of marketing. Limited understanding and application
by marketers led to the inappropriate use of tools, particularly the sole emphasis on the 4P’s
(Grönroos, 1994:5). Strategic marketing planning according to Jenkins (Jenkins & McDonald,
1997:18) was not done effectively and strategy took over some of the functions which marketing
discipline had been performing. This resulted in marketing decisions being taken on an operational,
input level, thereby emphasizing short term results such as market share and sales volume. This
approach has a narrow focus, more on transaction analysis rather than long term goals. By contrast
a long term view of marketing should focus more on relationship and interpersonal approaches to
produce sustainable business growth.
Short term measures of performance were frequently emphasized. Driving marketing and customer
orientation often relied on the commitment of the chief executive officer or managing director.
These aspects resulted in the marketing discipline losing its momentum.
COURSE REP-P: RESEARCH REPORT STUDENT 70822344
8
2.3 The Role of Marketing in the Organisation
There is a lack of understanding of what constitutes marketing and the importance of its
contribution to the success of an organisation. Key responsibilities of marketers vary, depending on
the company. Some marketers are accountable for profits, product specification, pricing and sales,
while others are not and remain separate from the main direction of a business.
The function of marketing has been often been downgraded to a sales support function in charge of
advertising and promotions (McDonald and Dunbar, 2004:9). This is far too narrow a definition for
marketing professionals.
2.3.1 Strategic Position
The role and status of marketing has diminished in many companies (Brown, 2005:4).
Strategically important aspects of marketing have been taken away from the function of
marketing, downgrading marketing. By contrast, creating and delivering value to customers is
seen as one of the top business priorities (Brown, 2005:4).
Marketing should be seen as having a major impact on corporate strategy development
(McDonald, 2006:428), but marketers cannot sufficiently translate and consolidate their
company’s strengths and competitive advantages into a strategy which benefits the customer
(Oosthuizen, 2007:8). The function of marketing is not being marginalized, but marketers are
(Sheth and Sisodia, 2005:11). There are several reasons, for example, confusion between
marketing function and marketing concept, lack of in-depth analysis, lack of skills (McDonald,
1992) and lack of knowledge by marketing practitioners, for example, about the financial impact of
marketing expenditure (McDonald and Dunbar, 2004). The strategically important aspects of
marketing such as price, new product decision, advertising budgeting, are taken over by other
functions in the organization. Strategy should guide the tactical approach. As Webster (2005:4)
points out, the sum of tactics does not equate to a coherent strategy. Tactical marketing does not
address the issue of how a company should compete. Marketing professionals see marketing as
a holistic activity involving the whole company, but non-marketers’ perceptions of marketing often
differ from the specialist. The focus of marketers is on achieving the customers’ goals, thereby
ultimately achieving the company’s goals.
2.3.2 Perception
Results of a survey conducted by Yankelovich (Sheth and Sisodia, 2005:10) showed that 60% of
consumers claimed that marketing and advertising had worsened over the past years and that
they perceived marketing and advertising to be “out of control” and not adhering to their brand
promise. Another research survey in 2006 of 1000 consumers showed similar results, with 62%
displaying a negative attitude towards marketing (Sheth and Sisodia, 2005:10) because of the
perceived non-ethical and morally corrupt approach.

COURSE REP-P: RESEARCH REPORT STUDENT 70822344
9
Similar attitudes towards marketing have been confirmed by the Cranfield University School of
Management where non-marketing managers described marketing practitioners as
“unaccountable, untouchable, expensive and slippery” (Baker & Holt, 2004:557) and McDonald
(McDonald, 2006:427) stated that: “After fifty years [of marketing it] has become the laughing
stock and is seen as little more than promotional puffery” . Even within its own ranks marketing
has been criticized to have become too narrow, insular and self-centred. Marketing has lost much
of its credibility.
2.3.3 Globalization
Over the past two decades marketers have been faced with globalization of markets and
production. National barriers hardly exist and deregulation of trade and lowering of investment
barriers have resulted in companies producing where it is the most efficient. Advancing
technological changes have improved and quickened communication, information and
transportation channels. In the last decade world trade has been growing faster than world output,
transaction in foreign direct investment has increased substantially and increased imports have
affected especially industrialized countries, resulting in intensified competitive pressure (Hill,
2005:16).
Globalization is one of the most important opportunities and challenges a company faces.
Marketers are in the position to contribute considerably to the knowledge and to create
competitive advantage for companies.
2.3.4 Consumer Power
The power of the customer (buyer and supplier) has increased. Customers are more demanding
and have greater expectations of quality and reliability. This has also resulted in a move away
from mass, standardized product to increasingly selling by reputation and delivering a product
according to exact client specifications on an “as needed” basis (Denison and McDonald,
1995:58). Customers can educate themselves quickly via the internet, interact and exchange
opinions with one another. Marketers are confronted by increasing switching behaviours, overflow
of information and at times government regulations (e.g. advertising restrictions). The traditional
style where the push model characterized marketing (between 1950 to 2000) is moving towards
trust-based marketing (Sheth and Sisodia, 2005:11), where companies work closely together with
customers to enhance their success. The implications for this widespread connectivity is for
companies to form stronger collaboration with customers and to incorporate them into their entire
process from idea creation to support. Otherwise, Sawheny argues (Sheth and Sisodia, 2005:11),
customers can cut out the marketer and do the process themselves by self informing, self
evaluating, self pricing, self supporting, self advertising, self organizing, etc.

COURSE REP-P: RESEARCH REPORT STUDENT 70822344
10
2.4 Measurement Tools
Concerning the issue of marketing’s accountability it might seem that no tools have been made
available. Strategic and tactical marketing tools have been available for more than 40 years (Baker
and Holt, 2004:561), but have not sufficiently been employed by corporate companies.
In some cases there was insufficient application of marketing tools. For example, Reichheld’s
(1996) research on customer retention proved that actively retaining customers improved the profit
margin. Despite this few organizations have measured customer retention rates and the effect of
customer retention on financial performance (Baker and Holt, 2004). Research has shown that a
positive correlation exists between marketing planning and financial success (McDonald, 1992:7),
but many companies do not revise their fiscal forecasts or budgets. Customer key account
profitability states that marketing spend should focus on profitable customer segments, but
knowledge of real profitability remains low (McDonald, 1997:18). Customer relationship
management through the use of information systems technology was seen as a good tool for
measuring effectiveness, but high failure rates lead to reassessment of its usefulness.
2.5 Marketing in South Africa
High profile marketing professionals like Thomas Oosthuizen (Oosthuizen, 2007:9) and Jeremy
Maggs (2007:3) are concerned about the juniorisation of marketing in South Africa. Marketing
executives globally have been said to lack the skills and ability necessary to persuade senior
management of the worth of marketing. This has been exasperated by the lack of consistent and
generally accepted marketing metrics. Although the trend is to increasingly look at the value of
intangible assets such as brands, the net present value of marketing assets and activities has not
yet been fully incorporated in shareholder and publicly available documents such as annual reports.
In South Africa approximately R18 billion was spent on above the line media during the year ending
June 2006 according to ACNielsen’s Adex (Sinclaire, 2007:25). International guidelines state that
about one third of total marketing investments are used for above the line exposure. This would
translate to marketing professionals in South Africa spending about R55 billion, which constitutes
4,5% of its gross domestic product (Sinclair, 2007:25). Marketing expenditure is therefore
substantial and executives query whether their companies receive value for their money from their
marketing initiatives.
The general consensus is that marketing is difficult to measure. However, according to Sinclair
(2007:24) and other academics (McDonald, 2004:9; Ambler, 2003:19), it is possible to place a
value on the output of marketing activity, such as increased distribution, improved brand awareness
and strengthening the key attributes in relation to competitors. When data such as market share,
penetration, retention ratios or awareness is properly collected and analyzed, it is measurable and
reliable (Ambler, 2003:21).
COURSE REP-P: RESEARCH REPORT STUDENT 70822344
11
2.6 Conclusion
This chapter gave a brief overview as to the foundations of this study. The role of marketing in
organizations, measurement tools and marketing in South Africa was briefly addressed. The
following chapter will consist of a literature review pertaining to accounting regulations and the role
of annual reports with an emphasis on the creation of shareholder value. Brand equity and
marketing performance measures are discussed.

COURSE REP-P: RESEARCH REPORT STUDENT 70822344
12
CHAPTER 3: Literature Review
3.1 Introduction
For marketing performance to be seen as a leading discipline in corporate companies (on par with
other main functions like finance) and to be recorded accordingly in annual reports, it needs to
consistently apply generally accepted marketing performance measures. To enhance the use of
metrics, we need to understand the underlying challenges. Below is a brief review of accounting
regulations, the role of annual reports and research conducted on annual reports.
3.2 Accounting Regulations
Countries differ in their regulations and approach as to what needs to be included in the balance
sheet. The USA requires more disclosure than the United Kingdom (UK), although companies are
given much freedom in deciding how much information to disclose. The value of the brand may not
be reflected on UK companies’ balance sheets although the cost of acquisition can be (Ambler,
2003:209). Nevertheless, Canadian and British accounting regulations suggest that annual reports
should not only reflect historical perspectives, but also express to shareholders prospective
analysis and expectations of the future.
The balance sheet in the annual report is only providing part of the information necessary for
shareholders to make a decision. The other more narrative parts in the annual report, such as the
chairman’s and chief operating officer’s (CEO) and operating review, play a major role in giving a
more in-depth understanding of the company’s activities and future prospects.
Brands are defined as assets according to the new International Financial Accounting Standards
(IFRS). Shareholders own the assets of a company and it is management’s duty and responsibility
to protect and create shareholder wealth. Marketing expenditure is an investment into an asset
which often is the most valuable one a company owns (Sinclair, 2007:26). The Accounting
Standards Board in the UK published new guidelines in 2003 for the “Operating and Financial
Review” section(s) of company annual reports (Ambler, 2003:209). The recommendation is that
shareholders should be informed about marketing investment and particularly brand equity. Ambler
points out that, in practice, annual reports have very limited information on these topics.
But brands do not have to be displayed on the balance sheet, thereby losing out on the impact they
deserve. Brands have different meanings and can be interpreted as their value to the customer,
value to the company or value in terms of competitive advantage (Ambler, 2003:45). Brands can be
measured but a financial value in point in time is only one way and the number will differ according
to the purpose of the valuation. Marketing experts such as McDonald and Ambler believe that

COURSE REP-P: RESEARCH REPORT STUDENT 70822344
13
quantifying for example brand equity into traditional financial data is not sufficient and
needs a different approach to make sense. Although some tools (which make use of present value
of future cash flow) exist to measure marketing ,such as customer lifetime value, Ambler
(2003:211) maintains that these techniques are not useful in reporting on the progress marketing
has made to date, because it takes credit for future marketing activities.
Ambler cautions against tunnel vision in rigorously applying metrics. Innovation results in
opportunities which currently are not present. Customer life time value, for example, focuses on
current customers and shareholder value indicates how best to spend cash flow, but does not
analyze the source of origin. Marketers therefore need to have some space for creativity.
3.3 The Role of Annual Reports
A corporate annual report is the main statement reflecting a company’s financial reporting system.
The purpose is to communicate information to shareholders and other interested parties, such as
clients, suppliers, media and the general public.
Annual reports are seen as a “barometer of a company’s fortune and future” and not as purely
financial reports (Greenyer, 2006:240). They are not only used by stakeholders and analysts, but
are opinion shapers for city representatives, the press/media, competitors, reseller networks and
the general public.
According to the American Institute of Certified Public Accountings’ Special Committee on Financial
Reporting (Ho and Wong, 2004:62) effective functioning of capital markets depends on effective
information sharing among companies, securities analysts and shareholders. The accounting
profession stipulates that information contained in annual reports should be useful to users to
enable a rational investment and other decisions (Ho and Wong, 2004). Improvements in
information sharing should increase management’s credibility, analyst’s understanding of a
company, investor’s confidence and patience and potentially shareholder value (Ho and Wong,
2004:69).
“Financial reports need to take on the role of marketing documents” (Greenyer, 2006:240).
Companies are assessing whether annual reports can be more effectively used for communicating
major marketing messages, especially considering the trend of the growing number of small
shareholders and shareholders increasingly being customers of a company (Greenyer, 2006:240).
In order to reflect these marketing messages, data-driven marketing is becoming necessary.
3.4 Research on Annual Reports
On average 27% of the UK’s top 1000 companies in 2004 are effective in using their annual reports
as key marketing documents, according to Corporate Mailing Matters research (Greenyer, 2006).

COURSE REP-P: RESEARCH REPORT STUDENT 70822344
14
According to this research (Greenyer, 2006:240) industries traditionally strong in
direct marketing are at the forefront of bringing financial reporting and marketing together, including
retail (32%), telecommunications(30%), automotive (28%) and banking sector (28%).
According to a survey by Research Strategy Management Inc. for the Public
Relations Society of America (Investor Relations Business; 2000), 91% of investors said that a
company’s annual report was the most credible source of information, ranking above financial
media and analysts’ reports. The survey revealed that investors rated annual reports as the most
important source on which to base an investment decision. In addition annual reports ranked high
on credibility but rated low as an immediately desirable source. The survey also found that annual
reports and other financial information and inclusion of specialist news sources were highly rated
features on corporate websites (Investor Relations Business; 2000). On the other hand, Sinha and
Watts (2001:663) argue that the relevance of corporate annual reports has diminished due to an
increase of alternative information sources.
On behalf of the Centre for Business Performance the Institute of Chartered Accountants in
England and Wales researched the annual reports and surveyed executives of 350 FTSE
companies in 2002 to assess how large UK companies report on marketing where currently
legislation on reporting guidelines is lacking. Results show that low levels of reporting on intangible
assets occurred and only limited reasons were provided (Ambler, 2002).
According to this research many annual reports give general information on brands and marketing,
but marketing metrics (quantitative measures normally viewed internally) are not regularly and
consistently reported (Ambler, 2002:48). A minority of companies follow the Accounting Standards
Board’s guidelines for marketing disclosure in the operating and financial review section (e.g. 16%
disclosed marketing spend and 53% detailed new products). Companies on average only reported
on two market metrics per report, mostly sales volume and product distribution. On average annual
reports contain 20% of the market metrics which are regularly presented to the board, according to
the executives. 15% of the remaining measures are not disclosed because of competitive reasons,
while 60% had other various reasons for non-disclosure (Ambler, 2002:48).
Despite this, most executives agreed that more marketing information could be given and 85% of
executives agreed that shareholders were ”entitled” to be informed about a company’s main assets
including brand equity. Analysts questioned also agreed that more information on market and brand
equity should prevail in annual reports.
The research showed that the most admired companies were those displaying the most marketing
information. In addition, the research showed that analysts confirmed that companies who
consistently disclosed marketing related information were outperforming the FTSE index. From the
shareholders’ point of view disclosure meant that management saw a professional understanding

COURSE REP-P: RESEARCH REPORT STUDENT 70822344
15
of the market as important (Ambler, 2002:48), thereby increasing transparency. It can
be argued that shareholders are one of the primary stakeholders in an organization.
Shareholders need to be viewed as customers and communications therefore plays an important
role. Communications and the message sent to shareholders should not differ from the message
sent to other stakeholders such as employees or consumers. Disclosing marketing metrics forms
part of professional marketing of the corporate brand to investors. Management displaying and
sharing knowledge with shareholders on marketing metrics builds trust and the corporate brand
(Ambler, 2003:217).
From this we can conclude that the more market oriented and successful companies were, the
more likely they were to disclose marketing information and metrics.
3.3.1 Disclosure
A wide range of reasons exist for not divulging marketing information. Some of these are
competitive confidentiality, potential misuse by the press, different disclosure rules outside the
UK. The argument is that all of these could disadvantage multinational companies should they
disclose too detailed information on, for example, segmentation and customer metrics. Another
argument against disclosure of marketing metrics is that it could disadvantage the future year’s
performance in comparison as future goals would be raised each year. Other arguments are that
additional information would increase cost and the size of annual reports and shareholders did
not want the information and might not understand detailed marketing information (Ambler,
2002:48).
There is a debate on how much of the market metrics should be revealed in publicly available
documents such as annual reports. Arguments against displaying much relate to putting
competitors in an advantageous position. Research conducted by Ambler et al (2003:211) among
UK companies shows that although confidentiality was the reason for not disclosing market stats,
most companies acknowledged that their competitors already had the information. Another
argument is that shareholders are not interested in market metrics as they perceive this to be an
operational function. However, market metrics are key determinants of future cash flow and it is
management’s responsibility to give shareholders the information they require. Showing key
metrics shows that management is monitoring, evaluating and managing the business. Other
reasons are problems with point-in-time measurements neglecting change, consistency of
measures, irresponsible use by analyst and media (Ambler, 2003:218).
The inclusion of extended marketing metrics, as suggested by Ambler (2003:211), should not
increase the cost of preparing, printing and distributing annual reports as these metrics should
already be available and reported on internally. With the availability of internet and intranet
facilities it would be good practice to make the full annual reports (and analysts’ briefings)
COURSE REP-P: RESEARCH REPORT STUDENT 70822344
16
available in electronic format, making abbreviated and tailored versions available to
shareholders. Disclosure of confidential, target metrics with detailed future marketing intentions
should not form part of the report. Commercial confidentiality can be a real concern although
competitors are likely to know most metrics. Ambler (2003:254) suggests that companies could
review disclosure on a metric-by-metric basis with auditors.
3.3.2 Corporate Governance
The trend is to disclose more and to become more transparent. Corporate governance issues
causing the demise of companies such as Enron and WorldCom have increased the pressure for
companies to reflect more accurately the state of the company, improved accountability and
transparency. Disclosing a cross-section of professionally gathered marketing metrics will add to
transparency (Ambler, 2003:206). Shareholders are entitled to know the broad marketing
strategy, but specific tactics and the anticipated changes in metrics would give too much away to
competitors (Ambler, 2003:206). Non-disclosure, however, gives the impression of secrecy and
can lead to accusations of collaboration, even when stakeholders are unaware due to lack of
information. Even if shareholders do not know the individual market metrics, it is essential that the
board of directors knows of them.
In addition, companies with superior information transparency signal better corporate governance
according to signaling theory (Chiang and Chia, 2005:95). Their study in 2005 supports that
information transparency is one of the most important indicators for evaluating corporate
performance.
Other arguments for disclosing market information are achieving shareholder and investor
respect, thereby leading to higher share prices and improved investor relations. Ambler’s
research (2003:214) shows that companies who disclosed more information were more
respected by financial analysts and other peer senior executives. Standard and Poor also report
that there is a positive correlation between disclosure and share performance.
3.5 Creation of Shareholder Value
Tactical outcomes such as sales volumes and changes in awareness are relatively easily
measurable. Marketers have historically reported on sales related measures such as market share,
but have ignored focusing on shareholder value. Oosthuizen (2007:8) believes that marketers need
to take responsibility for spending shareholder funds and should become much more accountable
for business results. Marketing’s return on investment (ROI) is increasingly measurable, although
expectations have changed and stakeholders increasingly expect personalized, relevant
communication from companies (Greenyer, 2006:239).

COURSE REP-P: RESEARCH REPORT STUDENT 70822344
17
Hall (2002:13) points out three principles of value creation. The first principle is
knowing how the customer thinks, feels and acts because he/she is the source of value, i.e.
revenue, cash flow, profits. The second principle is that companies’ financial metrics should not
obscure the value of their customers. Good decisions are based on well allocated corporate
resources which is only possible if managers know how today’s decision affects tomorrow’s value.
The third principle is that financial reporting should provide insight into value creation, otherwise it
will eventually become inadequate because a problem needs to be identified to be solved.
Companies need to deliver better leading indicators by showing investors the value of customers.
Therefore “marketing plays a key role in impacting the current and future value of customer income
stream” (Hall, 2002:13).
3.5.1 Share Price
Traditional accounting measures, pressures from financial markets and senior managements’
performance drive caused many companies to emphasize short term outcomes. With a move
toward corporate governance the trend nowadays is to incorporate values of intangible assets in
establishing the worth of a company and to take a more long term view.
Kirschenheiter’s (1997) research results showed that more information about share values, such
as a well known brand, was positive for share prices despite the balance sheet not showing this.
Disclosing market information can achieve shareholder and investor respect, resulting in higher
share prices and improved investor relations. In addition, in their research Bowd and Bowd (2002,
showed that reputation can be attributed to a large degree to market valuation (i.e. share price).
3.5.2 The Value of a Brand
An argument for inclusion of brand equity in annual reports is that by the end of the 20th century
assets on the balance sheet of UK companies accounted for a declining share and therefore a
declining market value of companies. Excluding intangible assets such as brand values led to the
argument that the worth of companies was not fairly reflected. Consequently some companies put
the acquisition cost of acquired brands on their balance sheet, thereby avoiding technical
insolvency. Others such as the Institute of Chartered Accountants in England and Wales argued
that brand valuations are not reliable and objective enough to be reflected. The problem
nowadays is that the balance sheet does not reflect the worth which management has added to
building a brand.
Approximately 60% of shareholder value resided in intangible assets (Sampson, 2007:29).
Excluding brand value can lead to the worth of companies not being reflected fairly. In addition,
brands are resources that can generate future economic benefit for a company (Sinclair,
2007:26). A strong brand can be a competitive advantage and can for example result in
negotiating lower distribution costs. It is likely that 80% of the shareholder value comes from

COURSE REP-P: RESEARCH REPORT STUDENT 70822344
18
approximately 20% of brand market units (Ambler, 2003:35). Therefore managing
brand equity is a crucial role of marketing as it transfers value from the market to the shareholder.
In capital markets success is measured in terms of shareholder added value. This takes into
account the time value of money, cost of capital and the risk associated with strategies and
investments in the future (McDonald, 2006:427). Strong brands result in greater returns for
stockholders while doing so at a lower risk level (Madden, Fehle & Fournier, 2006:224).
Research by Madden et al (2006:225) correlated stock prices and brand value and showed that
changes in brand equity are associated with changes in the value of a company. Strong brands
result in a performance advantage, i.e. create shareholder value by achieving higher returns
relative to the relevant market benchmark. Their study showed that a brand can play a role in
reducing vulnerability and volatility of cash flow, therefore becoming a “powerful risk management
tool for companies” (Madden et al., 2006:233).
Earlier studies conducted by Interbrand ‘most valued brands’ in 1995/6 showed that a positive
relationship between financial brand value and market-to-book value ratios existed (Madden et
al., 2006:225). Further studies in 1998 showed that brand values are significantly and positively
related to stock prices and returns and a study in 1993 showed that brand equity made up a large
component (15%) of the replacement value of a company.
Another study by Conchar, Crask and Zinkhan in 2005 (Madden et al., 2006:227) showed a
significant positive relationship between a company’s advertising and promotional spend and the
market value of the company, therefore giving support to the brand-building activities and financial
performance of a company.
The empirical study conducted by Aaker and Jacobsen (1994) showed that brands create
shareholder value. However, creating shareholder value is not only created through higher stock
returns or better market capitalization, but only if a company’s returns are higher in comparison
with other investment opportunities, taking risk into account (Madden et al., 2006:231).
Approximately 85% of UK companies agreed that shareholders had the right to information about
brand equity which often was the company’s most valuable asset. However, only a few
companies displayed metrics to their shareholders. 40% of the sample had up to five market
performance indicators but the average number was two indicators. Half of the companies
surveyed used sales volume, product distribution (availability) and new product launches within
the year as their only indicators (Ambler, 2003).
One of senior management’s main priorities is to enhance shareholder value. Using resources
effectively to build a strong brand makes sense because strong brands can be used in a variety of
COURSE REP-P: RESEARCH REPORT STUDENT 70822344
19
ways. Investments into brand and loyalty building can create long term relationships
with customers. Customers’ positive attitudes to a brand result in quicker responses, leading to
accelerated cash flow and therefore greater shareholder value (Srivastava et al., 1998:10).
Brand extensions can also enhance revenues (Keller and Aaker 1992) by creating credibility and
enabling easier introduction of new products. A strong brand can command a price premium
(Farquhar 1989) and attain a greater market share (Bouldin, Lee & Staelin 1994) based on the
company’s power on customer loyalty and higher switching costs. In addition brand equity can
enhance loyalty (resulting in repeat business and barriers to competition) and develop more
efficient communication programmes because well-differentiated brands are more responsive to
advertising and promotions (Kamakura and Russell 1994) and improve the distribution clout in the
marketplace. Higher equity brands tend to have a lower marginal cost for sales and marketing
(Srivastava et al., 1998:11). The strong brands convey a clear and sustainable differentiated
positioning and enhance clarity within an organization and attract and keep high quality
employees (Davis, 2002:352). Relationship marketing such as good customer and supplier
relationships reduce the level of working capital and fixed investment and enhance cash flow
(Srivastava et al., 1998:11). Stability in cash flows can be enhanced by good relationships with
customers and channel partners (Srivastava et al.,1998:12).
A brand influences every step of a value chain (Henderson, 2004:6) and provides emotional and
rational reasons to customers. A strong brand enhances security, premium pricing and larger
market share. Henderson (2004:6) argues that in economic downturns, the difference between a
strong and weak brand is more prominent because a strong brand conveys trust.
3.6 Brand Equity
The current trend is to acknowledge and increasingly incorporate the worth of intangible assets.
70% of company value is linked to intangible assets, the largest being the brand (Henderson,
2004:6). Understanding a brand as a financial asset and key driver of shareholder value is gaining
in importance. One key indicator of a company’s performance on the stock market should be the
strength of a brand (Henderson, 2004:6). Companies with strong brands consistently outperform
their main stock market indices, while companies with weak brands underperform. This is
according to worldwide research, including stocks of S&P 500, Fortune 100 and FTSE 100
(Henderson, 2004:6).
A company’s financial performance cannot be property evaluated without considering brand equity
(Ambler, 2002:47). Brand equity often is the main reason for a company’s market capitalisation
exceeding its book value (Ambler, 2002:47). However, the move has been away from a single
measure, for example of a brand, to incorporate different aspects of a brand and market
performance. This is known as market metrics which should be reported to the board and
shareholders so they understand where the cash is coming from.

COURSE REP-P: RESEARCH REPORT STUDENT 70822344
20
The brand is the most valuable asset for many companies, but it is often not reflected in its balance
sheet, partially because there is no consistent measurement. Countries differ in their regulations
and approach as to what needs to be included in the balance sheet.
The new International Financial Accounting Standards define brands as assets and the Accounting
Standards Board in the UK guidelines in 2003 recommended that shareholders should be informed
about marketing investment and particularly brand equity. Ambler (2002:47) states that the issue
about a brand is not merely whether it should appear on the balance sheet but to inform
shareholders about the condition of assets and what the company is doing to build them.
Shareholders are entitled to know how their company approaches the creation and management of
cash flow (Ambler, 2002:47). It is less important where this information is disclosed, namely in the
balance sheet or in the operating and financial review, but Ambler (2002:47) suggests that the
operating and financial review might be more appropriate, because it is more flexible.
3.7 The Debate on Financial versus Marketing Measures
Very little marketing information is reported in annual reports (McDonald and Dunbar, 2004:4).
Ambler (2003:212) points out that unfamiliarity with marketing terms on behalf of shareholders is
one reason why limited information on marketing is available in annual reports. The business
community has come to the realization that too many executive boards have relied too heavily on
purely financial measures. The claim is that most boards are spending too much of their valuable
time on internal operational efficiency at the expense of external operational effectiveness
(McDonald, 2004). Ambler’s (2003:307) recommendations based on the research suggest that
companies and shareholders would gain from reporting on marketing performance and brand
equity in their annual reports. Shareholders would welcome more information and, according to the
executives of the 350 FTSE companies, it can and should be done (Ambler, 2002:49).
According to Webster (2005:6) there are few incentives for executives to move away from the
transaction based generally accepted accounting principles and securities regulations. Companies
and marketing practitioners should not limit themselves to the development of measurements of
marketing performance on a purely tactical level. The current notion is for marketing to move
towards a more integrated approach, covering a wide spectrum of disciplines and knowledge. If this
is the case, then measurements need to reflect this. These might be less precise but incorporate
marketing’s influence on strategic and cultural levels (Webster, 2005:5).
3.7.1 Historical Perspective
Financial accounting methods such as sales, cost and profits are all retrospective. Ambler
(2003:93) says that marketing indicators need to be more closely aligned with customers and
competitors. This necessitates non-financial information to be gathered, for example behavioural

COURSE REP-P: RESEARCH REPORT STUDENT 70822344
21
(consumer loyalty and market penetration) and cognitive information (people’s
attitudes and awareness). With these indicators it is easier to predict future performance. He adds
that to build a comprehensive database a formalized process needs to be in place.
3.7.2 Financial Literacy
A key problem in measuring marketing metrics is that marketing executives are not financially
literate and cannot express net value of expenditures. In addition, other managers are not
marketing literate and often marketing is seen as variable cost and not as a committed cost.
Sinclair (2007:26) points out that marketing professionals have not used accounting methods
such as discounted cash flow or net present value of future earnings calculations to demonstrate
the worth of marketing investments into a brand, for example.
Using established financial tools and incorporating them into marketing measurements will
provide a board of directors with financial measurements and assessments which they
understand. This will enable a marketing professional to justify a budget request. Marketing
practitioners need to understand and apply financial terms, whereas executives need to
understand what marketing entails and how it can be measured. A mutual understanding needs
to be created as to the company’s definition of brand equity, understanding, valuation and
agreement on usage of marketing metrics.
Executive managers need to understand the limitations when applying financial analysis to
marketing. Financial accounting methods such as sales, cost and profits are all retrospective.
McDonald (2006:429) argues that it is an “absurd assumption that particular marketing actions
can be linked directly to profitability”. Profits and corporate revenue cannot be equated with added
shareholder value. “Shareholder value analysis is a useful internal technique [for assessing best
strategic fit] but states nothing about the marketplace, …the source of cash flow nor how to
increase it” (Ambler, 2003:80).
3.7.3 Long term View
Investment guru, Warren Buffet, judges a business among others according to the attractiveness
of its long-term prospects and the firm's capacity to create value. Marketing can play a pivotal role
in achieving long term sustainable advantage and long term success. However, it is crucial to
measure marketing’s impact and performance.
Marketing executives need to take a long term view and not only focus on short term gains such
as improvement on monthly sales, stock prices, monthly market share etc. Intangible assets with
long term results such as a brand are difficult to measure and it is not the norm to reflect them in
annual reports.
COURSE REP-P: RESEARCH REPORT STUDENT 70822344
22
3.7.4 Customer Orientation
Experts state that marketing indicators need to be more closely aligned with customers and
competitors. Cash comes from customers (Ambler, 2003:23) but often companies do not know
their segment’s profitability and future intentions, according to Cranfield University School of
Management study of 500 leading European companies (McDonald and Dunbar, 2004:4). Senior
UK managers give nine times more attention to spending and counting cash flow than figuring out
where it came from or how to increase it (Ambler, 2003:1). But the source of cash flow, namely
the consumer is usually not mentioned. For the process to be effective an organization needs to
be customer driven which requires a long term perspective. Marketing executives should not only
focus on short term gains such as improvement on monthly sales, stock prices and monthly
market share, but should gather non-financial information which will assist in predicting future
performance more accurately.
Customer orientation has not received its due attention (Webster, 2005:4) and is often merely
paid lip service by companies. But customer orientation requires a long term perspective. In the
past decade research has established positive associations between customer orientation and
business performance (Narver and Slater, 1990). Customer orientation and innovativeness are
central to the long term success of a company.
3.7.5 Segmentation
By securing customer preferences, profits are obtained. Marketing refers to a company’s inward
cash flow (Ambler; 2003:21). It focuses on the reasons why customers spend and what causes
them to spend more and why they spent more frequently. By analyzing profitability of customer
segments a company can reduce its costs. Often companies do not give due credit to aspects of
marketing such as strategy, segmentation, positioning.
Although the cost of dealing with a customer determines profitability, the Cranfield University
School of Management study of 500 leading European companies has shown that very few
organizations measure segment or customer profitability (McDonald and Dunbar, 2004:4). The
annual report should give an indication of management’s understanding of and importance placed
on customers.
Nowadays it is possible to identify the more profitable consumer groups, with shareholders
demanding ever increasing profitability, this has led to the wider customer base being ignored
(Greenyer, 2006:239). Greenyer (2006:239) argues that often the mass of less profitable
customers are essential in keeping a company afloat. Research in the service industry conducted
by Reichheld has shown that indifferent and insufficient customer service has had a greater effect
on customers leaving than pricing or perceived superior products (Srivastava et al, 1998:12).

COURSE REP-P: RESEARCH REPORT STUDENT 70822344
23
3.7.6 Cash Flow
Madden et al (2006:224) point out the different schools of thought pertaining to functional areas of
finance and marketing, resulting in different tools for marketing performance measures. The
finance discipline focuses among others on shareholder value creation and decisions affecting
investor expectations which make up their main stakeholder group, while marketers concentrate
on consumer value creation and their attitudes and behaviours which drive the revenues of the
marketplace (Madden et al., 2006:224). The main performance metrics currently still reside with
the financial school of thought (Madden et al., 2006:225).
The Australian Marketing Institute (AMI) states that although selling creates the current cash flow,
marketing is more about creating future cash flow. The AMI defines a brand as a reservoir of
future cash flows (Uncles, 2005:413) and is necessary in maintaining marketing strength.
Therefore brand metrics are essential.
3.8 Measuring Marketing’s Performance
Various models for measuring marketing performance have been suggested. These include
Srivastava’s marketing based asset model, the discounted cash flow method, Kaplan and Norton’s
balanced scorecard, the Scandia navigator and economic value added (EVA) approach. These are
briefly discussed below.
3.8.1 Market Based Asset Model
Nearly two decades ago in 1988 Day and Fahey pointed out that marketing’s purpose should be
that of contributing to shareholder returns (Srivastava, Shervani & Fahey, 1998:2). Ten years later
Srivastava et al (1998:2) stated that in order to leverage from assets marketing professionals need
to expand their traditional analysis of the marketplace to understand the financial consequences of
marketing decisions. Marketers in their decision-making should encompass shareholders as well
as potential shareholders, necessitating input from other functional managers.
Srivastava et al. (1998:8) developed a framework for assessing the impact of marketing on
shareholder value by using market based assets. These assets (e.g. customers, channels, partner
relationships) improve shareholder value by accelerating and improving cash flow, lowering
vulnerability and volatility (i.e. risk) of cash flow and increasing residual value. A large proportion of
value of a company is based on perceived growth potential and associated risk, in other words, the
value is based on expectations of future performance (Brigham and Ehrhardt, 2005:706). A
challenge is to identify these assets. Marketing professionals therefore need to measure and
demonstrate their value creation of future performance. The authors suggest to use cross-
functional teams in establishing the assets and improve discussions on the assets’ impact on
financial performance and to leverage from cash flow.

COURSE REP-P: RESEARCH REPORT STUDENT 70822344
24
Madden et al.’s (2006:225) research supports Srivastava et al that market based
assets can increase shareholder value by lowering risk of cash flow. Reduced risk results in lower
cost of capital and lower discount rate, achieving a higher net present value (Brigham and Ehrhardt,
2005:353), thereby improving shareholder value. When customer satisfaction, loyalty and retention
are increased vulnerability of cash flow is reduced (Srivastava et al., 1998:12).
In their framework Srivastava et al (1998:12) state that market based assets can improve the
residual value of cash flow. Residual is the present value of a business attributable to the period
beyond the forecast period (Brigham and Ehrhardt, 2005:706). Residual value has been closely
linked to size and quality of the customer base. They state that the larger the customer base the
better the quality, the higher the loyalty and residual value. To grow shareholder value a company
must grow and refine its customer base, focus on longer term customer relationships and loyalty.
This will result in more stable business and therefore lower cost of capital, culminating in
shareholder value.
3.8.2 Discounted Cash Flow
Sinclair (2007:24) points out that marketing professionals have not used accounting methods
such as discounted cash flow (DCF) or net present value (NPV) of future earnings calculations to
demonstrate the worth of marketing investments into for example a brand. Using established
financial tools and incorporating them into marketing measurements will provide a board of
directors with financial measurements and assessments which they understand. This will enable
a marketing professional to justify a budget request.
Brands can create capabilities to build a superior business process (Doyle, 2001:21). Strong
brands, customer awareness, market share and satisfied customers are “not goals in their own
right but means to create shareholder value” (Doyle, 2001:21). Brands need to create
shareholder value by maximizing the discounted value of future cash flows (Doyle, 2001:29).
Creation of value depends on a company’s strategy and on the economics of the markets in
which these companies operate. Marketing, however, does play a key role in driving shareholder
value, but financial concepts have to be understood. The present value of a brand’s future cash
flow is a function of and should result in an increase in cash flow, in the speed of the cash flow as
well as extended duration of cash flow or reduction in risk of cash flow (Doyle, 2001:26). If this
does not occur, managers should not focus on the brand. Not understanding shareholder value
can lead to inappropriate allocation of resources preventing a company from finding new, more
profitable markets.
However, brands have to be invested in. Creating value according to Doyle (2001:26) depends on
three factors. Brands should create a differential advantage such as lower cost or perceived
superior quality (resulting in better cash flow). A brand strategy should also result in maximizing
present value of future cash flows. But market economies can make it difficult to obtain return on

COURSE REP-P: RESEARCH REPORT STUDENT 70822344
25
a brand’s cost of capital. Therefore future market economies have to be assessed
and sales objectives, prices and marketing expenditure have to be aligned before shareholder
value creation can occur. This encompasses more than market share or consumer awareness
and behaviour (Doyle, 2001:30). For example Porter’s five forces model (Grant, 2005:75) states
that attractiveness of a market depends on threat of competition’s entry and intensity of industry
rivalry, supplier power, threat of substitutes and customer’s buying power.
3.8.3 General Performance Models
Multinational companies are faced with the challenge of aligning worldwide actions with global
strategy (Yeniyurt, 2003:134). To assist them with the task of performance measurement and
strategic alignment, multinationals have made use of Kaplan and Norton’s balanced scorecard,
Scandia navigator and the economic value added (EVA) approach.
Two main approaches have evolved arising from the limitations of traditional accounting reporting
systems. The one approach focuses on better financial performance measures (e.g. EVA) while
the other highlights the importance of including non-financial measures, emphasizing longer term
measures such as customer satisfaction and defection rates and employee satisfaction. Kaplan
and Norton’s balanced scorecard takes a holistic view and increased cross-functionality by
integrating four perspectives, namely financial, customer, internal business and innovation/
learning (Yeniyurt, 2003:136). The scorecard assists management by translating the vision,
communicating the strategy and linking it to departmental and individual objectives, assisting with
the planning function and providing feedback measures. Ambler (2003) has used the same
principles to refine measurements specifically aimed at the marketing function.
The Scandia navigator was developed to incorporate the worth of intangible assets, namely
intellectual capital. It also places value in its measurement on the human perspective
emphasizing employees’ satisfaction (Yeniyurt, 2003:136). Ambler (2003:177) emphasizes
employees as an integral part of internal communication and suggests ways of measuring these.
However, he does not focus on measuring knowledge or intellectual capital. He does emphasize
the importance of measuring “innovation” which can be seen as part of the learning and
knowledge process.
McDonald (2006:428) proposes a model that incorporates marketing as a function for strategy
development as well as for tactical sales delivery. He proposes three levels of measurements.
Level one, the most important, defines the markets and understands its value. Level two and
three focus on the measurement of marketing metrics.
Level one assesses whether marketing strategies in the longer term destroy or create added
shareholder value. Only if customer markets value a company’s assets and competencies can
sustainable competitive advantage or added shareholder value be created and maintained.

COURSE REP-P: RESEARCH REPORT STUDENT 70822344
26
Level two links marketing expenditure and other functional activities to marketing
activities. It shows how actions designed to affect customer-critical success factors for each
product are linked to revenue and profit generation. Level three refers to the measurement of
promotional activities such as up- and cross-selling, customer churn, cost effectiveness etc.
Most companies do not have a clear understanding of their marketing performance. Brand equity is
the asset built by marketing and is more valuable than a brand’s tangible asset (Ambler, 2003:45).
However, only 40% of corporate executives review brand equity at board level and only
approximately a third (36%) of boards see data on customer satisfaction, according to a 30 month
metrics project in the UK sponsored by the Marketing Council, the Marketing Society, The Institute
of Practitioners in Advertising and the Sales Consultants Association (Ambler, 2003). Marketing
should be seen as the link between producers and consumers.
Marketing can be measured but it is simplified to want marketing to be directly linked to profit
(McDonald and Dunbar, 2004:4). Profits and corporate revenue cannot be equated with
shareholder value-added but there are ways of measuring the three types of cumulative risks,
namely market risk, strategy risk and profit risk. In other words, there is a process for assessing
whether marketing strategy creates or destroys value. The risk assessment process is based on a
company’s business plan and supporting data which forms part of the marketing due diligence
process. Proper due diligence in the marketing field will result in reasoned and substantiated
investment decisions.
The reason why marketing needs to be assessed is to take corrective action and to elevate the
marketing profession to its well deserved high ground.
To measure marketing performance sufficiently, a company has to routinely research consumer
behaviour Ambler (2003:255). This includes customer retention, acquisition, usage etc. and
reasons such as consumer awareness, satisfaction, perceived quality etc. The results should also
be routinely (annually or semi-annually) reported to the board in a format which integrates financial
marketing metrics. These results should be compared with forecast of the previous business plan
and should be compared with key competitors. The short-term performance needs to be adjusted
according to the change in the company’s market based assets.
Measuring hard financials need to be balanced with more qualitative market indicators such as
perceived quality. The information also needs to be assessed as a whole, for example, short term
profitability might have been gained by price cutting and therefore should be adjusted by any
changes in brand equity which could result from an image as a discounted brand.
“Good metrics reinforce implementation, while poor or misaligned metrics interfere with
implementation” and result in counterproductive behaviour from managers (Allio, 2006:255). The

COURSE REP-P: RESEARCH REPORT STUDENT 70822344
27
suggestion is to use a small set of critical multidimensional metrics which are aligned
to company strategy and which convey more than simple budgetary indications (Allio, 2006:255).
Uncles (2005:414) points out that deciding on metrics to use can be contentious as measurements
can be volume or value based, can be imprecise as they rely on perceptions and forecasts and
open to misleading inferences. Ambler (2003:29) states that there is not a universal approach to
metrics which every company can use. But challenges should not lead one to abandon the use of
metrics.
Metrics are necessary and add meaning to marketing terms. Measures should be related to
benchmarks or norms and expressed in relative terms to competing alternatives (Ambler, 2003:29;
Uncles, 2005:414) and an explanation should be provided on how for example brand loyalty is
calculated as it can be ambiguous otherwise. Yeniyurt’s (2003:139) research pertaining to
multinationals supports Ambler by stating that measures are not exhaustive nor generally
applicable because each company’s measures has to fit its strategic purpose.
3.8.4 Measuring a Brand
Brands have different meanings and can be interpreted as their value to the customer, value to
the company or value in terms of competitive advantage (Ambler, 2003:42). Experts (McDonald &
Dunbar 2004; Ambler, 2003) believe it is not sufficient quantifying, for example, brand equity into
traditional financial data.
Traditional accounting methods, pressures from financial markets and senior executive
managements’ performance drive cause many companies to emphasize short term outcomes.
Brand equity is a long term performance indicator and adjustment need to be made when using
the measure in the short term. If marketing is seen as an investment, then this should be
measured and reflect in an increase or decrease of brand equity. Brand valuation should be
assessed according to their worth, but should not be the sole measurement of brand equity. The
assessment needs to include non-financial drivers, take account of changing influences and
better alternatives and can include innovation possibilities.
To achieve a culture which portraits a longer term brand building focus that maximizes brand
asset value, measurement mechanisms which “make the intangible tangible” (Davis, 2002:355)
are necessary. Measurements assist managers with information in evolving brand efforts which
can lead to sustainable competitive advantage and which should result in supporting brands with
strong growth potential. Davis (2002:355) points out two forms of brand metrics, namely brand
impact (which measures the brand’s role in driving the health of a business) and brand image (the
overall awareness of a brand).

COURSE REP-P: RESEARCH REPORT STUDENT 70822344
28
Davis suggests the use of a brand asset management model and suggests that
brand metrics should be based on SMART (Davis, 2002:355), namely strategic alignment, must
be market driven (understanding the cause of measure through “the market’s eyes not company’s
internal lens”), give guidance as to action required, be repeatable and consistent and have touch
points covering customer experience. Davis emphasises strategic brand management,
suggesting brand responsibility should be at the highest level in an organization, so that a
cohesive strategy can be developed with a long term view on competitive advantage and
profitability and this necessitates monitoring and evaluating brand strength. For this purpose,
brand metrics should be presented in quantitative and qualitative format.
The way to measure a brand’s cash flow is affected by four factors, namely price, growth, cost
and investment. Brand leaders can charge a premium, have lower cost and lower investments
because of their leverage in the supply chain. Money has a time value and consumers are likely
to respond more quickly to the familiarity of brand leaders. Brand longevity also creates
shareholder value, while strong brands are seen to have lower risk profile and investors see the
cash flow as more stable and predictable (Doyle, 2001:27).
Performance measurement systems according to Yeniyurt (2003:138) should focus on a value
creation process which is rooted in the organizational culture, which should facilitate learning and
innovation in order to improve capabilities and build superior competitive advantage. By improving
abilities, better internal processes and productivity occur. This will enhance the company’s ability
to improve customer requirements, resulting in increased satisfaction and better financial
performance. Therefore, Yeniyurt (2003:138) argues that the measurement system should
involve five perspectives, namely financial, customer, internal processes, innovation and
organisational culture and climate, especially in multinational companies. Including organization
culture and climate in the measurement framework will complement forward-looking measures.
Uncles (2005:416) points out that “marketing is not a branch of financial accounting” and
marketers should not become amateur financial executives (Gordon, 2001:54) and lose their
creativity. Metrics should nurture innovation and entrepreneurial spirit (Uncles, 2005:417). Uncles
(200:418) further points out that people aspects such as people skills should not be ignored,
despite the difficulties in measuring them. The notion of measuring innovation and various
aspects relating to employees is also strongly advised by Ambler (2003:177).
3.8.5 Internal Marketing Measures
The two main internal indicators of marketing performance according to Ambler (2003:16) are
innovation and employees and should be included in marketing metrics.

COURSE REP-P: RESEARCH REPORT STUDENT 70822344
29
i. Innovation
Ambler cautions against the tunnel vision of rigorously applying metrics. Measurements
should not be on a purely tactical level. Moving towards a more integrated approach,
covering a wide spectrum of disciplines and knowledge and measurements might lead to
less precise metrics but incorporates marketing’s influence on strategic and cultural levels
(Webster, 2005:4) and enables innovation. Innovation is not driven by the external market
but arises from within the company. Strategic leadership is necessary as culture and
processes are only the enablers (Ambler, 2003:154).
According to Slater and Narver’s (1995) framework a sequential relationship occurs
between organizational culture and organizational learning, customer satisfaction and
sales growth/profitability. Culture, according to Slater and Narver (1995), has two aspects
related to learning, namely entrepreneurship and market orientation. Market orientation is
defined as customer orientation, competitor orientation and interfunctional coordination.
Other researchers such as Hurley and Hult (1998) define innovation as a mediator for
organizational learning and performance and describe organizational learning as an
aspect of culture. Therefore Yeniyurt (2003:136) argues that organisational culture should
be measured by looking at product and process innovation, because culture incorporates
human and intellectual capital. This will enhance the balanced scorecard and Scandia
navigator by introducing a forward looking approach Yeniyurt (2003:136). This is supported
by Ambler (2003).
ii. Employees
Creating a corporate brand requires a holistic approach. The external and internal
reputations of a brand are inextricably linked because customers form their impression
from interaction with employees (Ambler, 2003:188). Internal marketing can create
competitive advantage with employees committing to company goals and brand values
(Ambler, 2003:182). Sustainable advantage can be obtained through excellence of
execution, as this is where contact with the customer occurs and not through its strategy
(Brown, 2005:2). This leads to the need of internal marketing and empowering people in
the organization who are in direct contact with customers. The HCI research in 2002
(Ambler, 2003:181) on 1500 world’s leading companies showed that companies with best
people management practices created nearly twice as much value for shareholders as the
average competitor.
3.8.6 Evaluation of Marketing Mix
Luo and Donthu’s research (2006) show a positive influence of marketing communication
productivity (such as advertising and promotions) on shareholder value.

COURSE REP-P: RESEARCH REPORT STUDENT 70822344
30
Marketing mix is defined as elements which make a contribution to and strengthen
the brand equity and profit of a company. Each element has its own measurements. Before
deciding on the type and proportion of elements in the marketing mix, goals need to be set and
the cost established. The aim is not to assess the individual element’s contribution but to establish
whether the elements of the mix result in increasing or decreasing profit and brand equity
(Ambler, 2003:11). Profit analysis can assists with optimal expenditure across the mix.
The assessment of an individual campaign needs to occur in the context of the whole marketing
programme. Before starting an advertising campaign, its outcomes have to be clearly stipulated,
enabling payment by result if outsourced. When measuring performance of the web or internet,
marketers need to be sure to measure what they intend to measure. Establishing the impact of
activity and the appropriateness of measurement are important for public relations. With loyalty
programmes the aim should dictate the outcome, whereas the focus of customer relationship
management should be on the customer and not the company’s process. The objectives of a
sales promotion should dictate the effectiveness of its outcome.
3.8.7 Performance Measurement Characteristic
Before applying any measures, the company needs to have clearly defined its brand positioning,
target markets and segments. The meaning of these metrics should be clarified across the
organization to simplify complex challenges and to enhance alignment between individuals,
teams, departments and stakeholders. The metrics should direct management’s focus to the
marketplace, encourage strategic focus and behaviour and be the result of translating qualitative
goals to quantitative targets (Allio, 2006:255). Allio (2006:255) maintains that metrics often do not
give enough guidance and do not assist with setting priorities.
Performance can be assessed in terms of comparing current achievement against previously
determined internal goals (namely the baseline), against external benchmarks such as market
indicators and competitors (taking adjustments into account) (Ambler, 2003:26). Instead of
reporting in absolute numbers, companies should consider reporting in relative prices to their
competitors. Companies should spend less time planning and rather compare planned with actual
metrics and analyzing the differences (Ambler, 2003:29).
Metrics are essential for ensuring a common understanding of performance and to identify
performance gaps (Massheder and Finch, 1998:123). Metrics should include internal and external
comparison with other organisations.
Metrics assist with organisational learning and are the basis for resource allocation. Marketing
metrics assist managers with understanding their business and their customers and their markets
better. Metrics also enforce accountability and create credibility, but can also be used for
company political reasons (Uncles, 2005:414).

COURSE REP-P: RESEARCH REPORT STUDENT 70822344
31
Marketing metrics can be defined as “the measurement of the effects of marketing activities” but
occur at different levels (Uncles, 2005:412). There are metrics for effectiveness of marketing mix
activities, for product /service level assessing brand health and customer satisfaction and for
measuring general marketing investment pertaining to corporate and strategic business units.
Marketing metrics can be defined as “quantified marketing performance measure regularly
reviewed by top management” (Ambler, 2003:293). Lower level measures that explain variances
in metrics are diagnostic. Marketing metrics can be classified into six categories according to
Ambler (2003:293). These are consumer intermediate (e.g. consumer awareness and attitudes),
consumer behaviour (e.g. sales), direct trade customer (e.g. distribution availability), competitive
market measures (e.g. market share relative to competitor or market norm), innovation (e.g.
percentage of turnover due to new products) and financial measures (e.g. brand valuation or
advertising expenditure).
Metrics should provide direction in line with company strategy while enabling control. Metrics
need to add information and very volatile or static metrics should be excluded. Metrics need to be
prioritized and the sector that matters most gets preference. Metrics should provide usable
information which is of value to the organization. The measures should not only predict success
but should also point out potential problems. Performance factors should reflect internal and
external measures, relative to competitors and customers. Ambler (2003) supports this.
The industry life cycle also needs to be taken cognizance of (Allio, 2006: 257). For example, in a
start-up high technology business the emphasis would be on reliability, speed and efficiency and
while gaining new customers are important in the growth phase, price and production cost
become the main consideration factors in a mature industry (Bender and Ward, 2002:88).
3.8.8 Choosing the Right Performance Measure Metrics
Approximately 75% of top measures deemed to be important by executives are shown to be
external and internal marketing metrics according to two independent research studies (Ambler,
2003:120).
The basic criteria for assessment are compared to what is expected by the company and to an
external benchmark (with competitors or industry norm) and adjusted to any changes in brand
equity to compare like with like (Ambler, 2003:26). Well managed companies use a combination
of metrics such as quantitative, qualitative, internal, external, short and long term. Metrics should
be “grounded in the realities of marketplace” (Allio, 2006:258) as performance metrics are
powerful instruments in shaping behaviour. Difficulties lie with measuring too little too infrequently
(reducing effective responsiveness) or measuring too much too often (resulting in “”overkill” of
data). Therefore a well designed performance measurement system should take a project
management approach. It should state the level of variance acceptable and indicate the person(s)

COURSE REP-P: RESEARCH REPORT STUDENT 70822344
32
responsible for tracking, monitoring and diagnosing the problem, as well as stating
what corrective action to take (Allio, 2006:258).
Allio (2006) sets out seven guidelines when formulating performance metrics:
- Measure metrics that are important
- Align metrics with those of key stakeholders (e.g. customers, suppliers, shareholders)
- Translate qualitative into quantitative metrics
- Adopt early warning signs
- Establish a common language with simple, clearly defined metrics
- Use a balanced portfolio of metrics (e.g. short/long term and internal/ external)
When measuring metrics managers should not search for the single magic bullet but use existing
toolkit of measures but appraise and refine them (Uncles, 2005:416). Different metrics can be
used for different levels of analysis. For example, Australian Marketing Institute (AMI) looks at
strategic positioning metrics suitable for discussion at board level and operational metrics, more
useful for functional divisions of marketing. AMI also suggests to use different metrics for different
purposes, for example, sales promotion metrics and loyalty programme metrics (Uncles,
2005:416). The stance of using different metrics is supported by Ambler (2003). He suggests
using three basic metric packages, namely financial, non-financial and company specific.
Ambler (2003:119) suggests that companies should state the usual three financial measures
(sales, cost, profit) with six general brand equity measures, adding approximately twelve tailored
corporate specific metrics to the measurement. This enables industry comparison while retaining
company specific performance measures.
i. Financial Metrics
Multinationals such as Ford, Henkel, Procter & Gamble, Kraft Foods, Hewlett-Packard and
IBM state that marketing measurements of success need to be linked explicitly to financial
measures (namely company value, profits and share/stock performance) (Uncles,
2005:412). However, financial metrics do not state much about the marketplace or the
customers (Ambler, 2003:103).
Financial metrics only make sense when compared to the previous year’s performance, to
the projected business plan metrics and to competitive performance (Ambler, 2003:126).
ii. General Metrics
Aspects which should be assessed in the general measurement of brand equity are linked
to positioning and are familiarity (relative to other brands), penetration (active customers as
percentage of intended market), customer satisfaction (what consumers think of and feel
about the brand relative to others), brand loyalty (behavioural) and availability (assessing

COURSE REP-P: RESEARCH REPORT STUDENT 70822344
33
distribution). Awareness is important for growing companies but less so for
mature ones. Relative familiarity (to the competitor) is a better indicator. Research
indicates that relative perceived quality is a better indication than market share of future
profits (Ambler, 2003:132).
iii. Company Specific Metrics
There are several techniques for a company to create its own metrics. One is Kaplan and
Norton’s (Ambler, 2003:137) success mapping which starts with the medium results to be
achieved and works backward to define marketing actions and performance metrics.
Another option is identifying marketing metrics or deducting key marketing issues based
on a company’s strategy. The emphasis should be more on effectiveness (doing the right
thing) than efficiently doing the wrong thing. The function of metrics as indicators of
direction is far more important than their control function (Ambler, 2003:143).
3.9 Implementation of Metrics
Successful implementation of professional marketing metrics can be enhanced if the following
issues are addressed.
3.9.1 Steps in Measuring Metrics
An audit should be conducted to assess the stage of market orientation within the organization
and its current use of metrics. The executive team to re-define goals (whether it is new marketing
metrics, more innovation, better internal employee communication etc) and metrics and
benchmark performance.
In order to choose metrics, candidate metrics need to be compiled, verified by the chief financial
and chief marketing manager. The executive team has to decide on units of measurement
incorporating brands (products), markets (countries) and customer segments. Preference of
these reporting units should be given to the value they add to shareholders, in other words only
major ones need to be reported on and minor ones in aggregate. The major units need to be
reported on individually while minor ones are averaged.
The responsibility of compiling metrics should lie with the marketing executive although input and
team work from other functional units is essential. The final decision on what metrics to use
should lie with the senior executive team with input from the board of directors. A new revised
metric system should evolve in line with corporate strategy, be communicated throughout the
organization and become part of the process.

COURSE REP-P: RESEARCH REPORT STUDENT 70822344
34
3.9.2 Integration
For marketing to be perceived as playing a central role in an organization, it must integrate across
specialized silos within marketing and across functional business units and other managerial
disciplines in order to leverage from synergies, to provide value to the customer (Brown, 2005:)
and to report on metrics. Large organizations can have an overflow of market information but the
“silo mentality” is not conducive to organisational learning and knowledge management. The
better the available information, the better the forecasting can be. This necessitates team work
and cross functional communication.
3.9.3 Structure
Consistency in measuring is essential, otherwise it looses its meaning (Ambler, 2003:123).
Standardization in multinational companies is complex. Ambler (2003) suggests that the chief
financial officer is best suited to integrate financial and non-financial marketing metrics. Some of
the reasons are that marketing information is widely dispersed within the organization, credible
and independent results are obtained, alignment and consistency prevails and a better
understanding of marketing issues (Ambler, 2003:9).
Doyle (2001:24) maintains that brand management should form part of the total management
process and should not be left only to marketing specialists. In his opinion (Doyle, 2001:26)
marketing practitioners often focus on sales, market share, customer awareness or favourable
attitudes which has the potential of destroying rather than adding value. According to Doyle one of
the main problems is for marketing practitioners’ objectives (for example increase in sales
volume, market share or customer awareness) to connect to CEO’s objectives (which is increase
in shareholder value).
i. Chief Marketing Officer
Some experts claim that marketing has revived and undergone a renaissance. 47% of
Fortune 1000 companies in the USA in 2005 employ a chief marketing officer (Kerin,
2005). Only 14% of chief marketing officer’s (CMO) had been at their companies
representing top brands for more than three years and less than half had held the position
for more than one year (Welch, 2004). Insufficient formal authority and unrealistic
corporate expectations were some reasons given. Kerin (2005) points out that another
factor could however be that few marketing specialists are able to sufficiently execute their
task.
During the 1980s many enterprises expanded by undergoing mergers and acquisitions. In
the 2000s companies divested unrelated businesses and pruned less profitable product
lines and brands. This has lead to senior management focusing more on generating

COURSE REP-P: RESEARCH REPORT STUDENT 70822344
35
growth from existing businesses (Varadarajan, Jayachandran & White,
2001). Kerin (2005) maintains that today’s chief executive officers (CEO) have significant
marketing and sales experience and recognize the potential role and strategic contribution
which marketing can make at an executive level. In addition, previously strategic business
units have become less autonomous and had to conform to the company’s benchmarking
and best practices. All of these had a positive effect on elevating marketing to a corporate
level. However, the chief marketing officer position was often not held by marketing experts
and required a broad business outlook, multi industry experience and cross-functional
management expertise (Kerin, 2005).
ii. Board Level Representation
Ideally marketing should be represented at board level. Regardless whether chief financial
officer or chief marketing officer, it is essential to inform the board annually or bi-annually
on key marketing performance metrics in relation to best practice or industry benchmarking
and the longer term implications thereof. This gives an opportunity for assessing
shareholder needs and improving relations.
3.9.4 Budgeting & Expenditure
Fine-tuning metrics is necessary but inhibiting factors exist. For example, budgets should not
“imprison” management . Budgets should be more flexible and instead of dictating strategy should
result from strategy which should take external factors into account. In capital markets success is
measured in terms of added shareholder value. This takes into account the time value of money,
cost of capital and the risk associated with strategies and investments in the future (McDonald;
2006). The traditional way of budgeting according to historical expenditure is not necessarily
optimal, depending on the strategic aim. The company needs to look at strategic alternatives and
their outcomes in combination with financial evaluation. The levels of expenditure necessary to
achieve higher income need to be assessed, aligned and correctly allocated.
3.10 Conclusion
The annual reports will be assessed based on inclusion of financial marketing metrics and non-
financial information on brand equity and market performance, based on Ambler’s (2003)
suggestions of analyzing annual reports.
The financial criteria consists of sales and profit in comparison to competitor or benchmark and
marketing investment. Brand equity is made up of six components, brand awareness, penetration,
reputation, customer satisfaction and loyalty and distribution channel, all of which are individually
assessed as well as the total. Other non-financial marketing aspects include other customer and
segmentation measures and information pertaining to them. Annual reports will also be assessed
according to information provided on competition, innovation, environmental and strategic aspects

COURSE REP-P: RESEARCH REPORT STUDENT 70822344
36
pertaining to marketing. Each company is rated according to these criteria and
general comments as to trends in annual reports will be made.
COURSE REP-P: RESEARCH REPORT STUDENT 70822344
37
CHAPTER 4: Research Design & Analysis
4.1 Introduction
In conducting qualitative research several options such as in-depth case studies and interviews are
methods available to obtain data. The content analysis of annual reports has been chosen
because information is readily available and because content analysis a good explorative method
in identifying possible patterns or themes in annual reports. Annual reports are one of the main
showcase communication tool for stakeholders. Assessing the amount and content of marketing
related issues in annual reports can be seen as a reflection of the marketing maturity of South
African listed companies.
4.2 Methodology
This report follows the content analysis methodology and gives a point in time view of the state of
marketing disclosure in listed corporate companies in South Africa. Content analysis is a detailed
and systematic examination of the reflection of marketing aspects as presented in annual reports
giving an indication of the extent of companies’ market orientation.
The analysis is using Ambler’s (2003) marketing metrics guideline as a basis for analysis. Ambler is
one of the leading academics in the field of measuring and assessing marketing productivity. As
there is no generally accepted format or set of metrics available nationally or internationally, Ambler
compiled a set of measurements and guidelines specifically aimed at senior executives. The aim is
to establish how marketing performance measures and aspects are reflected and whether the
information contained in annual reports is sufficient for potential investors, shareholders and other
stakeholders to gain to make better investment decisions.
A study conducted in 2002 in the United Kingdom (McDonald and Dunbar; 2004:3) revealed that
over the years from 1979 to 2000, since companies performed at their peak, 25% subsequently
closed down and 33% were acquired. This shows that there is no guarantee for even well
performing companies to survive over the years. Investors are interested in long term gain and
need to know how trends affect a company and how management responds to these challenges.
In order to do this type of assessment, information on marketing is essential.
The Institute of Chartered Accountants of England and Wales’ (ICAEW) report (Ambler; 2003:264)
suggests to include the following non-financial performance indictors for shareholder evaluation:
Market share and market growth, customer satisfaction and retention, price, distribution, new
product launches and corporate reputation and brand equity. These aspects will form part or the
analysis.
COURSE REP-P: RESEARCH REPORT STUDENT 70822344
38
There are no formal requirements for listed companies in South Africa pertaining to
reporting on marketing matters in annual reports. Ambler (2003) mentions the tendency of
managers not to measure if it is not a requirement, which increases the risk of ignoring potential
problems. Investors have a right to be informed of how and why cash flows from customers
(Ambler;2003:252).
4.3 The Assessment Method
The method involves assessing the financial as well as non-financial marketing disclosure. The
content methodology has been adopted because marketing issues are likely to be reported in a
non-financial, qualitative, descriptive format and content analysis might reflect the extent better. We
initially establish the intensity and nature of marketing related information. The aim is to assess
whether companies in certain sectors disclose specific type of marketing information, where it is
disclosed and how much is disclosed.
The information gathered has a mixed methodology with a quantitative and qualitative part. The
quantitative section refers to the statistical analysis resulting from assessing the marketing metrics
used in annual reports, the proportion and the extent to which the marketing metrics are used. The
full annual report, including the operational review, the financial review and sustainability report has
been investigated. The qualitative part assesses the awareness and maturity level of marketing as
projected and communicated to shareholders in the annual reports.
4.4 The Sample
This research is based on cross-sectional data using secondary data, namely 2006/2007 annual
reports of companies listed on the Johannesburg Stock Exchange (JSE). We analyze in detail the
annual reports of thirty out of 455 companies (7% of the population). The companies are spread
across major sectors such as retail, food, financial services, media, technology &
telecommunications, leisure & travel, construction & materials and chemicals. The sample consists
of the following (refer to appendix 4):
7 x retail (23%)
7 x food & beverage (23%)
5 x financial services (17%)
3 x media (10%)
3 x technology and telecommunications (10%)
2 x travel & leisure (7%)
2 x construction & materials (7%)
1 x chemicals (3%)

COURSE REP-P: RESEARCH REPORT STUDENT 70822344
39
The sample is derived from the JSE super sector group which forms part of the
industry group but is more specific. The chosen sectors are retail, food & beverage, financial
services, banks, insurance, media, technology, telecommunication, travel & leisure, construction &
materials and chemicals. These sectors are chosen because the companies are likely to have a
more direct influence on the end consumer’s daily lives. In addition, marketing requirements are
critical to these sectors. The sectors ‘construction’ and ‘chemicals’ are included to give a more
holistic overview of the spectrum of companies. Eleven out of twenty super sector groups are
chosen.
The sectors ‘debt’ and ’associated backed securities’ are excluded because these sectors deal with
a very specialized offering, not conducive to this survey. Industrial sectors such as ‘industrial goods
and services’, ‘oil & gas’ and ‘basic resources’ are not included because their product offerings are
aimed at wholesalers and not end consumers. Only three companies were listed under ‘automobile
parts’, subsequently this sector has been omitted. Other sectors such as ‘health care’ and ‘personal
& household goods’ are excluded because several companies listed under retail also offer these
products and services and are therefore already contained in the sample.
The retail super sector comprises of companies offering general, food, drug, apparel, furniture,
home ware and health retail. The food & beverage sector includes company samples in farming,
fishing, production, brewery and distillery. Some companies are horizontally integrated while others
are vertically integrated. The media sector includes the categories publishing, broadcasting and
entertainment. The sectors technology and telecommunications are grouped together and financial
services, banks, investment and insurance sectors are grouped together in order to enable better
industry sector comparison. (For more detailed description of companies refer to annexure 4).
Some companies for example in the retail, media and food & beverage sectors comprise of
national and multinational companies, causing the size of the companies and number of brands to
vary substantially. In addition the financial year ends differ and some companies 2007 annual
reports are used, although the majority is dated the year 2006.
4.5 Data Analysis
Initially a randomly selected stratified sample has been chosen from the JSE list by choosing two
samples of each industry group. I decided to omit the basic resources sector and automobile &
parts sector as no marketing information is expected to arise from these sectors and to make the
other sectors slightly more representative. The aim is also to keep the sampling size below 40 due
to manpower and time constraints. In addition I have included three more financial services
(banking) sector samples and two more food company samples to give a more balanced approach.
Food, retail and financial services are deemed to be more brand or end-user orientated than for
example basic resources. Each stratum is not sampled in proportion to its size in the overall
population. A proportionate stratified sampling has not occurred. Two company samples initially

COURSE REP-P: RESEARCH REPORT STUDENT 70822344
40
chosen (in the financial services i.e. banking sector) could not be pursued as the
information could not be downloaded from the website and the companies did not have the annual
reports readily available. Other companies in the same stratum have been chosen instead.
The companies’ annual reports will be evaluated according to the following problem statements and
assessment criteria. The information will be summarized in tables and percentages, frequencies
and statistical calculations. It is expected that the information resulting from the sample will mainly
be represented in bar or pie charts. Possible comparison between industries may be made,
although due to a small sample per industry validity might not be achieved. From the results we can
extrapolate the importance senior executives place on marketing as a strategic tool by conveying
marketing information to shareholders.
4.6 Measuring Instruments and Assessment Criteria
The criteria used in annual reports will be based on Ambler’s (2003:305) “recommendations for
marketing disclosures in companies’ annual reports to shareholders”. These recommendations are
based on guidelines drawn up by the Accounting Standards Board in London 2002. The United
Kingdom guidelines emphasize shareholders “seeing the business through eyes of management”
(Accounting Standards Board: London; 2002). The annual reports will be assessed based on
inclusion of financial marketing metrics and non-financial information on brand equity and market
performance, based on Ambler’s (2003) suggestions of analyzing annual reports.
4.6.1. Financial Metrics
Financial marketing performance indicators are assessed according to whether sales, marketing
investment in brand equity, profit/loss and market/customer profitability are mentioned and whether
they were compared to competitors.
4.6.2 Brand Equity
Brands have different meanings and can be interpreted as their value to the customer, value to the
company or value in terms of competitive advantage. Brand valuation should be assessed
according to their worth but should not be the sole measurement of brand equity. Brand equity is
assessed based on Ambler’s criteria (2003:126) and includes information on the brand, namely
familiarity of brand, penetration, what customers think of brand, what customers feel about brand
(end user satisfaction indexed against satisfaction with competitors’), customer loyalty and retention
(% of customers still active at end of year), availability/ distribution channel.
• Brand awareness gives an indication of the extent of how well known the
company is and its distinctiveness (personality). It assesses the customer’s perceived
value for money (in comparison to the competition) and differentiation through the
company’s image. Brand strength is associated not only with the product but also with the
COURSE REP-P: RESEARCH REPORT STUDENT 70822344
41
corporate brand. It therefore is important to measure a customer’s trust and
admiration of the business because, out of brand awareness arises customer loyalty and
buying behaviour.
• Penetration refers to active customers as a percentage of intended market and
gives an indication of growth potential for a company and what strategy a company should
follow.
• What customers think (reputation) of a brand refers to perceived quality and brand
preference relative to competition. For example, brands can be known as category leaders
or can be respected for their innovation. This would give an indication of where a
company’s perceived strengths or weaknesses lie.
• Customer satisfaction refers to what customers or end-users feel and is reflected in market
share trends and can be an indication of long term movements.
• Customer loyalty can be assessed by measuring repeat buys, customer retention versus
churn and bonding. The objective of a marketing strategy is to attract, satisfy and retain
target customers. A lack of customer focus can result in an unfocused, generic value
proposition, declining customer satisfaction and reduced loyalty, higher customer turnover
and higher marketing expenses and a decline in profit performance and at best stagnant
shareholder performance.
• Information pertaining to availability and distribution channel should give an indication as to
the accessibility of a brand to the customer and can be recorded for example as weighted
average of retail outlets carrying the brand. Depending on the sector this could highlight
opportunities or threats for a company.
4.6.3. Other Customer Metrics
Ambler (2003:306) points out that the metric which summarizes brand equity and market
performance can vary according to sector as some might use volume and others value terms.
Apart from sales (which is a requirement), market definition and size, other customer metrics
should include information on market share or market presence (by value or volume and brief
definition of ‘market’), relative price (value of market share divided by volume of market share) or
pricing strategy and sales to new customers as a percentage to turnover (Ambler;2003:306). This
will give an indication of competitiveness and growth prospects.
COURSE REP-P: RESEARCH REPORT STUDENT 70822344
42
4.6.4. Segmentation
Profitability is determined by the cost of dealing with a customer (McDonald & Dunbar; 2004:4).
Customer segmentation strategies are the more basic form and can evolve into customer
relationship marketing strategies (Best; 2005:158) which result in economic gain for a company by
improving customer retention and customer life time value. This can only happen when a company
knows which customer segment or customers to pursue and which to abstain from. By showing an
understanding of their target segments companies can reassure investors that their marketing
focus is in alignment with their overall business strategy.
Annual reports are investigated according to information pertaining to segmentation, which is
deemed important by the financial community to make investment decision. These aspects relate
to % of profits in total market produced by segment, ratio of profit produced by segment to weight of
segment in total population, % defection rate and customer retention rate by market segment,
extent to which profitability of top ten customers are known and reflected, extent to which financial
impact of marketing expenditure is known and reflected.
4.6.5. Innovation
The assessment is based on whether initiatives in process were mentioned, whether innovation
launched are mentioned and % revenue gained owing to launches in past three years. Innovation
creates differentiation and uniqueness compared to competitors.
4.6.6. Competitors
A company needs to understand its key competitors and competitive forces to assess its own
positioning and differentiation in terms of pricing, product quality and customer satisfaction.
The research will assess whether key competitors are mentioned, whether % of market share of
competitors is mentioned, brands used by competitors, their message or medium used or whether
any number of competitor launches during the past year are mentioned.
4.6.7. Environmental and Strategic Factors
Aspects which fall within this category pertain to whether external factors influencing marketing
trends are mentioned and discussed and whether risk factors influencing cash flow are mentioned.
Other aspects include whether key marketing performance indicators are stipulated and aligned to
company strategy, whether the chairman’s review involves quantifying the main marketing assets
(e.g. brand equity) and how these assets have changed compared to previous year(s).
COURSE REP-P: RESEARCH REPORT STUDENT 70822344
43
4.6.8. Glossary of marketing and brand terminology
Marketing is often defined in various ways, ranging from advertising and promotions to making the
customer the focus of the whole organization which has been exasperated by unfamiliarity with the
marketing terminology (Ambler; 2003:277). Ambler therefore recommends inclusion of a marketing
glossary in annual reports. Annual reports are assessed whether they include a marketing glossary.
4.6.9. Other Aspects
General comments or other aspects which might arise will be noted and commented on.
4.6.10. Maturity Model
We also intend to incorporate the assessment criteria used by use by Payne and Davidson at
Cranfield University School of Management (McDonald & Dunbar; 2004:4) which gives an
indication of the type of marketing information the financial community needs to make an
investment decision. In addition we assess the companies by using our own Grand Total
measurement model based on Ambler’s (2003:94) level of maturity model which displays five levels
of sophistication in terms of companies’ marketing orientation. However, we will adapt Ambler’s
model to reflect the level of maturity as reflected in annual reports.
4.7 Rating Scale Procedure
The researcher has used the following process to evaluate the marketing information contained in
annual reports. A checklist has been used consisting of the categories financial metrics, brand
equity, customer metrics, segmentation, innovation, competitors and internal/external factors,
strategy and glossary.
Each category is made up of subcategory. The researcher directly rates each subcategory,
allocating an itemized rating scale for each subsection. The rating is done as follows:
1 = very poor (No information available)
2 = poor (Some general and vague information or statement is
made but not substantiated)
3 = average (Some information is given with explanation or
substantiation)
4 = good (Good and relevant information is provided)
5 = excellent (A lot of information and detail is provided with
examples and well presented)
COURSE REP-P: RESEARCH REPORT STUDENT 70822344
44
At times direct quotes from various companies will be used as examples to support
the rating. If companies have not been specific and only mentioned the topic in general, this will be
included as part of the qualitative analysis.
The glossary will be assessed according to its presence or not.
Each company will be given an overall rating. The rating scale will assist with comparison of the
data and correlations within the scores can be inferred from the data.
From the results we can extrapolate the importance senior executives place on marketing as a
strategic tool by conveying marketing information to shareholders. It can be inferred that the more
information is displayed, the more market orientated the company is.
4.8 Qualitative Method
The data collected is based on a checklist containing Ambler’s marketing metrics framework
pertaining to annual reports. However, because numerical rating scales are very limiting for content
analysis, any information deemed useful and pertaining to marketing issues will be collected. The
researcher records this data as thoroughly, accurately and systematically as possible by reading
through each annual report from beginning to end. Quotes are collected and will be used as
examples in the results section to substantiate findings and to highlight issues which might not be
sufficiently covered in Ambler’s framework.
4.9 Research Questions
This research examines the use of marketing metrics and marketing issues reflected in annual
reports of SA listed companies in an attempt to assess the level and quality of information provided
and its worth to investors and stakeholder. The research question focus on qualitative and
quantitative aspects of marketing as portrayed in annual reports. The research problems are as
follows.
4.9.1 Research Question 1 (Quantitative):
To what extent are quantitative marketing performance measures (metrics)
reflected in annual reports?
Research by the Marketing Leadership Council in the USA in 2001 (Ambler:2003:17) has shown
that 63% of blue chip member companies are dissatisfied with their marketing performance
measurement system, wasting an estimated 26% of their budgets. Guidelines in 2003 by the
Accounting Standards Board stated that more information about marketing investment and brand
equity should be provided to shareholders but in practice “annual reports have very little

COURSE REP-P: RESEARCH REPORT STUDENT 70822344
45
information on these topics” (Ambler; 2003:277). This study aims to assess the
current state of marketing metrics reflected in annual reports in listed SA companies.
4.9.1.1 Secondary question (Financial metrics): How are financial marketing metrics
reflected in the annual report?
To be of value financial metrics should be compared to the company’s internal benchmark
or goals and/or to its previous year’s performance and to competitors (Ambler;2003:264).
The study will assess how common this best practice is.
Each company’s representation of financial marketing metrics will be compared to
Ambler’s financial metrics (2003:305) to check whether the current year’s metrics (namely
sales, marketing investment, profit/loss) are compared to the company’s own benchmark
and/or prior year and comparison with competition as this constitutes best practice. The
ICAEW report (Ambler; 2003:264) has added two more indicators, namely return on capital
and market/ customer profitability which we have added to the checklist (refer to
annexure 2).
Each company will be assessed according to a checklist (refer to annexure 2). The
checklist for brand equity measurement assessment is based on several guidelines as
suggested by Ambler (2003:306). The study will address the percentage of companies
giving quantitative, measurable information on these.
4.9.1.2 Secondary research question (Brand Equity marketing metrics):
What % of elements on customer metrics are reflected in the annual report?
How is total brand equity reflected in the annual report?
4.9.1.2 Secondary research question: What % of elements on other customer metrics
are reflected in the annual report?
4.9.1.3 Secondary research question: What % of elements on segmentation metrics
reflected in the annual report?
4.9.1.4 Secondary research question: What % of elements pertaining to competition
are reflected in the annual report?
4.9.1.5 Secondary question: What % of elements on innovation metrics are reflected in
the annual report?
4.9.1.6 Secondary question: What % of elements on environmental aspects and
strategy are reflected in the annual reports?
In addition, a more detailed analysis of types of metrics used will be done. These will refer
to the following:
COURSE REP-P: RESEARCH REPORT STUDENT 70822344
46
• Assessment of how the brand is reflected in annual reports will be
based on Ambler (2003:136) (refer to annexure 1 and 2)
• Assessment on how much information on customer segmentation reflected in the
annual report will be based on Payne’s segmentation (McDonald & Dunbar
2004:4).
• Assessment of innovation as reflected in the annual report will be based on
Ambler’s evaluation (2003:16)
4.9.2. Research Question 2 (Qualitative):
To what extent are qualitative marketing issues reflected in annual reports
4.9.2.1 Secondary question: What type of marketing aspects are reflected in the
annual report?
4.9.2.2. Secondary question: To what extend are marketing aspects reflected?
A brief descriptive, qualitative summary shows what marketing issues are deemed important
enough by companies to be mentioned to shareholders and other stakeholders. An assessment is
made as to the detailed description concerning each marketing aspect based on a similar checklist
as in qualitative assessment to determine the depth of marketing issues reflected upon. An overall
grand total score will result for each company, giving an indication as to the worth it places on
communicating its role of marketing. The topics covered pertain to:
4.9.2.1 Brand : How is the brand reflected?
: What aspects of the brand are highlighted in the reports?
4.9.2.2 Customer : What aspects of the customer are reflected upon?
4.9.2.3 Segmentation : What do annual reports state about segmentation?
4.9.2.4 Competition : How much information and what type is provided on
competition?
4.9.2.5 Innovation : What role does innovation play in terms of marketing?
4.9.2.6 Environment & : Are external and mentioned with direct reference to marketing?
Strategy : Is marketing aligned to the company’s strategy?
: Does and how does the chairperson mention marketing?
4.9.2.7 Source : Under what section of the annual report (i.e. source) are aspects
pertaining to marketing reflected upon?
4.9.2.8 General : Does the annual report provide a glossary of marketing terms?
: What general remarks or trends arise when assessing this
sample of annual reports?
: Have the quantitative marketing measures been supplemented
by comments?
: Have marketing issues been supplemented by auditable
quantitative measures?

COURSE REP-P: RESEARCH REPORT STUDENT 70822344
47
4.9.3 Research Question 3 (Maturity Level):
How much emphasis is placed by companies on marketing performance
assessment as reflected in annual reports
The management team, employees and shareholders should know what marketing is suppose to
achieve and whether it is doing so (Ambler:2003:95). The companies will be graded according to
level and depth of information obtained to give an indication of their level of sophistication regarding
their use of marketing metrics. This will give an indication as to the importance companies place on
overall marketing assessment. Based on the information gained during the analysis, the companies
will be rated and evaluated according to the “grand total maturity model” which is based on
Ambler’s (2003:94) five stage maturity model (refer to annexure 3).
The grand total maturity model is derived by obtaining total rating score per company by summing
up all the 23 elements assessed in this analysis. The five levels of the model (ranging from level 1
“poor” to level 5 “excellent”) assist with depicting the overall information on marketing metrics and
marketing information contained in annual reports of JSE listed companies.
The brand equity elements which are assessed pertain to familiarity/ awareness, penetration,
reputation, customer satisfaction, customer loyalty, availability/ distribution channel. Further aspects
(each with their own elements) which form part of the 23 elements of the grand maturity model are
other customer metrics, segmentation, competition, innovation and environmental and strategic
aspects. Other customer metrics refer to market share or market presence, relative price or pricing
strategy and sales to new customers. Segmentation elements are based on McDonald and Dunbar
(2004) and include % of profits in total market produced by segment, ratio of profit produced by
segment to weight of segment in total population, % defection rate and customer retention rate by
market segment, extent to which profitability of top ten customers are known and reflected.
Environmental and strategic aspects assess whether external factors influencing marketing trends
are discussed and whether risk factors influencing cash flow are mentioned. Other aspects include
whether key marketing performance indicators are stipulated and aligned to company strategy,
whether the chairman’s review supports marketing and quantifies the main marketing assets.
The aim is to assess whether companies make use of sophisticated marketing metrics, leading to
improved decision making on behalf of external stakeholders. Assigning brand equity could be an
indication that companies place more value on marketing than those who do not. If the annual
report reflects only the essential marketing measurements, it can be deducted that the level of
marketing sophistication is not high.

COURSE REP-P: RESEARCH REPORT STUDENT 70822344
48
4.9.3.1 Secondary research question (Worth to Shareholder):
Are the marketing aspects communicated to shareholders sufficient for good investment
decision?
By analyzing the reports we can assess whether the information displayed sufficiently
reflects all the information necessary to make a good investment decision. This question
will be addressed based on information required by investors as stated in the Davidson
1999 model (McDonald & Dunbar; 2004:6).
4.5 Limitations of Study
The sample size is relatively small as it represents less than ten percent of listed companies,
covering several sectors. The research is not confined to one industry sector as it aims to convey a
general overview towards the field of marketing. However, it reduces the sample representation of
sectors sometimes to only one or two. A more in-depth industry specific approach may be
considered at a later stage should certain trends be found.
The sizes of the companies vary substantially from national to multinational companies and from
single to multi-brand. This research covers a broader spectrum of companies rather than in-depth
analysis of one type of company or sector. This research does not cover the small and medium
enterprise (SME) sector.
The research is based on secondary information, limited to publicly available printed annual reports.
Any updated information or electronic versions of annual reports or supporting material has not
been used. The main constraint however is time.
4.6 Conclusion
The research design follows a content analysis methodology and makes use of assessing
quantitative and qualitative marketing information obtained in annual reports. The sample of
companies is drawn from a range of sectors mainly retail, food, financial services, media and
technology and all are listed on the JSE.
The assessment criteria is based on a checklist which consist of several factors such as financial
and brand equity metrics, other customer and segmentation metrics and information pertaining to
innovation, competition, environmental and strategic factors, glossary of marketing terminology as
well as other aspects or trends which might arise.
Each company is rated per category on the checklist by using a five point rating scale (1 = very
poor, 5 = excellent). In addition each company is allocated an overall score for brand equity and for
the grand total to make comparison possible and to detect trends.

COURSE REP-P: RESEARCH REPORT STUDENT 70822344
49
The research questions aim to establish to what extent quantitative marketing
performance measures and qualitative marketing information are reflected in annual reports and to
assess whether marketing aspects communicated to investors are sufficient for good investment
decisions. The following section discusses the research results.

COURSE REP-P: RESEARCH REPORT STUDENT 70822344
50
CHAPTER 5: Research Results
5.1 Introduction
The results pertaining to this research are set out below. They refer to the quantitative and
qualitative aspects of marketing issues as presented in annual reports of companies listed on the
JSE. Financial aspects (sales and profit, marketing expenditure/ investment), brand equity aspects
(comprising of brand awareness, penetration, reputation, customer satisfaction and loyalty,
distribution channel) form part of the assessment criteria. In addition other customer and
segmentation metrics are assessed as well as information provided on competition, environmental
and strategic issues pertaining to marketing, prevalence of a marketing glossary and source of
origin. The results obtained are based on rating scales between level 1 (very poor) to level 5
(excellent). These ratings are based both on qualitative and quantitative information. Total brand
equity and total grand score are also measured to enable easier comparison.
5.2 Financial Aspects
Ambler (2003:264) suggests that financial marketing measurements should be compared to a
company’s internal benchmark or goals and/or to its previous year’s performance and to
competitors.
5.2.1 Sales and profit growth in comparison to competitors
All companies report on sales growth and profit/loss growth is compared to prior year (as
stipulated by regulatory requirements). Only one company, a media company, compares % sales
growth to its competitors. No other company benchmarks itself against competitors or mentions
any competitor activity.
5.2.2 Marketing Investment
Not one of the companies mentions their value, volume or percentage of marketing investment.
5.3 Brand Equity
Brand equity is measured according to six factors namely awareness/familiarity, penetration, what
customers think (reputation), what customers feel (customer satisfaction), customer loyalty,
availability/distribution. The total brand equity results are shown below, followed by results for each
individual brand equity component.

COURSE REP-P: RESEARCH REPORT STUDENT 70822344
51
5.3.1 Total Brand Equity
Factor analysis has validated this generally accepted measure of brand equity, summing
these six items into one single measure. The results confirm the feasibility of having one
general factor that is driving the responses to these six items. This is due to the fact that all
six items load highly on the first factor, and also the fact that the first factor explains over
93% of the variation in the data.
Table 5.1: Explanation of Brand Equity Rating Scale
Rating Scale Explanation
1 - 1.5 Very poor No information available
1.5 - 2.5 Poor Some general and vague information or statement is made but not substantiated
2.5 – 3.5 Average Some information is given with explanation or substantiation
3.5 – 4.5 Good Good and relevant information is provided
4.5 - 5 Excellent A lot of information and detail is provided with examples and well presented
The total brand equity is tabulated as follows:
Table 5.2: Frequency and percentage distribution of Total Brand Equity ratings
Total Brand Equity Rating
Frequency
Percentage
Cumulative
1 10 33% 33
2 9 20% 53
3 3 10% 63
4 4 13% 76
5 7 23% 100
Grand Total 30 100
The table 5.2 above and pie chart figure 5.1 below show that 53% of listed companies on the JSE
supply no or poor information on their brand equity which is measured by elements such as brand
awareness, penetration, reputation, customer satisfaction, loyalty and distribution channels.
The table and pie chart reflect that 33% of companies are rated “very poor” in terms of brand equity.
This means that no information was presented by the companies’ annual reports pertaining to
brand equity. 20% of companies were rated “poor” providing poor or vague information. 10% of
companies are rated average providing some information, whilst 13% of companies were rated
good and nearly a quarter (23%) are rated excellent, disclosing a substantial amount and detailed
information with examples. This shows a bi-polar tendency with companies either not supplying
information or providing very good information on their brand equity.
The food sector performed best with the highest mean (2,95), followed by retail sector (mean 3),
technology/ telecommunications (mean 2,78) and financial services with a mean of 2,03.

COURSE REP-P: RESEARCH REPORT STUDENT 70822344
52
Figure 5.1: Pie chart showing rating percentage of companies’ Total Brand Equity
The histogram figure 5.2 below is another way of showing the information obtained in annual
reports on total brand equity measures. The components of brand equity comprise of brand
awareness, penetration, what customers think (reputation), customer satisfaction, customer loyalty
and availability and distribution channel. The majority of companies provide no information,
although a quarter of companies give excellent information on all aspects of brand equity. The
histogram shows a non normal distribution with a bi-modal tendency and low middle density.
Figure 5.2: Histogram showing rating level results of brand equity
0.2
.4.6
.8D
ensi
ty
1 2 3 4 5TotBrandEquity
Very poor (33%)
Poor (20%)
Average (10%)
Good (13%)
Excellent (23%)
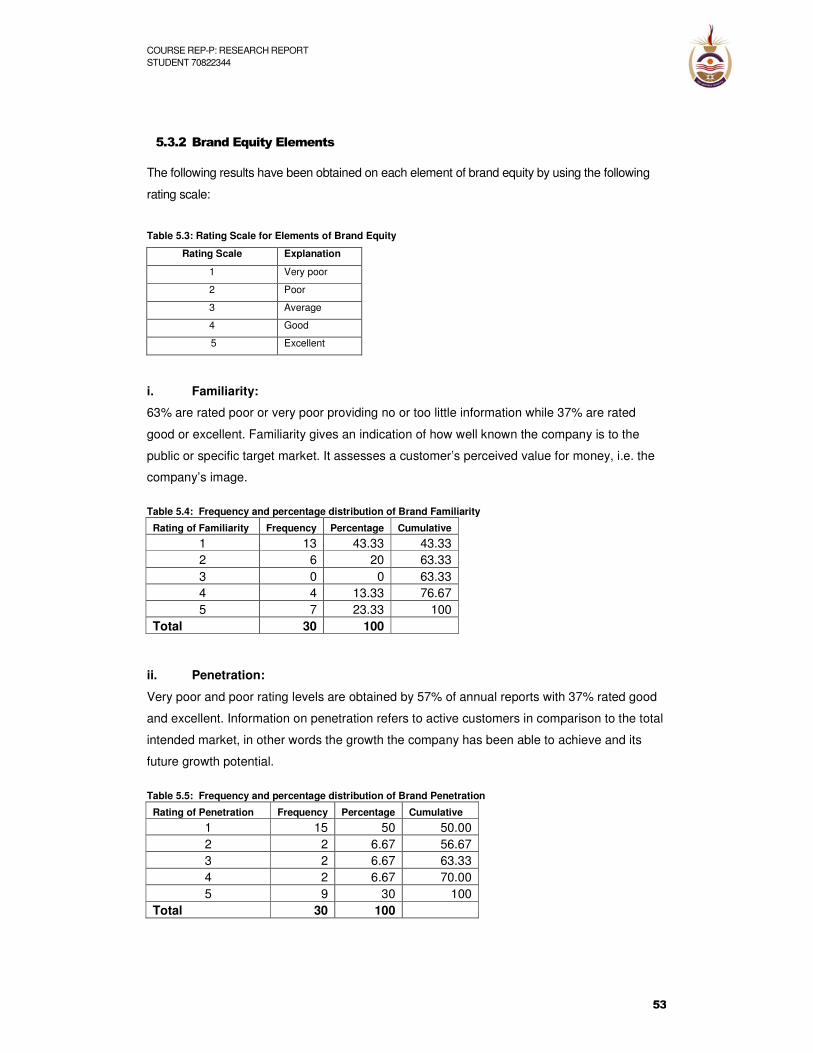
COURSE REP-P: RESEARCH REPORT STUDENT 70822344
53
5.3.2 Brand Equity Elements
The following results have been obtained on each element of brand equity by using the following
rating scale:
Table 5.3: Rating Scale for Elements of Brand Equity
Rating Scale Explanation
1 Very poor
2 Poor
3 Average
4 Good
5 Excellent
i. Familiarity:
63% are rated poor or very poor providing no or too little information while 37% are rated
good or excellent. Familiarity gives an indication of how well known the company is to the
public or specific target market. It assesses a customer’s perceived value for money, i.e. the
company’s image.
Table 5.4: Frequency and percentage distribution of Brand Familiarity
ii. Penetration:
Very poor and poor rating levels are obtained by 57% of annual reports with 37% rated good
and excellent. Information on penetration refers to active customers in comparison to the total
intended market, in other words the growth the company has been able to achieve and its
future growth potential.
Table 5.5: Frequency and percentage distribution of Brand Penetration
Rating of Penetration Frequency Percentage Cumulative
1 15 50 50.00 2 2 6.67 56.67 3 2 6.67 63.33 4 2 6.67 70.00 5 9 30 100
Total 30 100
Rating of Familiarity Frequency Percentage Cumulative
1 13 43.33 43.33 2 6 20 63.33 3 0 0 63.33 4 4 13.33 76.67 5 7 23.33 100
Total 30 100

COURSE REP-P: RESEARCH REPORT STUDENT 70822344
54
iii. What customers think (Reputation):
Very poor and poor rating is obtained by 57% of annual reports whereas 37% provide good
and excellent information. Reputation of a brand refers to individual brands as well as
corporate brands which can be measured by target markets or customers’ perceived quality
and brand preference.
Table 5.6: Frequency and percentage distribution of Reputation
iv. Customer Satisfaction:
Results show nearly even distribution in annual reports between very poor/ poor at 50% and
good/ excellent rating at 47%. Customer satisfaction measures what end consumer feel and
is reflected in market trends and movements.
Table 5.7: Frequency and percentage distribution of Customer Satisfaction
v. Customer Loyalty:
Nearly two thirds (60%) of companies do not provide any or only insufficient information in
their annual reports on customer loyalty. One third (33%) provide good and excellent
information.
Table 5.8: Frequency and percentage distribution of Customer Loyalty
Rating of reputation Frequency Percentage Cumulative
1 12 40 40 2 5 16.67 56.67 3 2 6.67 63.33 4 3 10 73.33 5 8 26.67 100
Total 30 100
Rating of Satisfaction Frequency Percentage Cumulative
1 12 40 40 2 3 10 50 3 4 13.33 63.33 4 1 3.33 66.67 5 10 33.33 100
Total 30 100
Rating of Loyalty Frequency Percentage Cumulative
1 15 50 50 2 3 10 60 3 2 6.67 66.67 4 2 6.67 73.33 5 8 26.67 100
Total 30 100
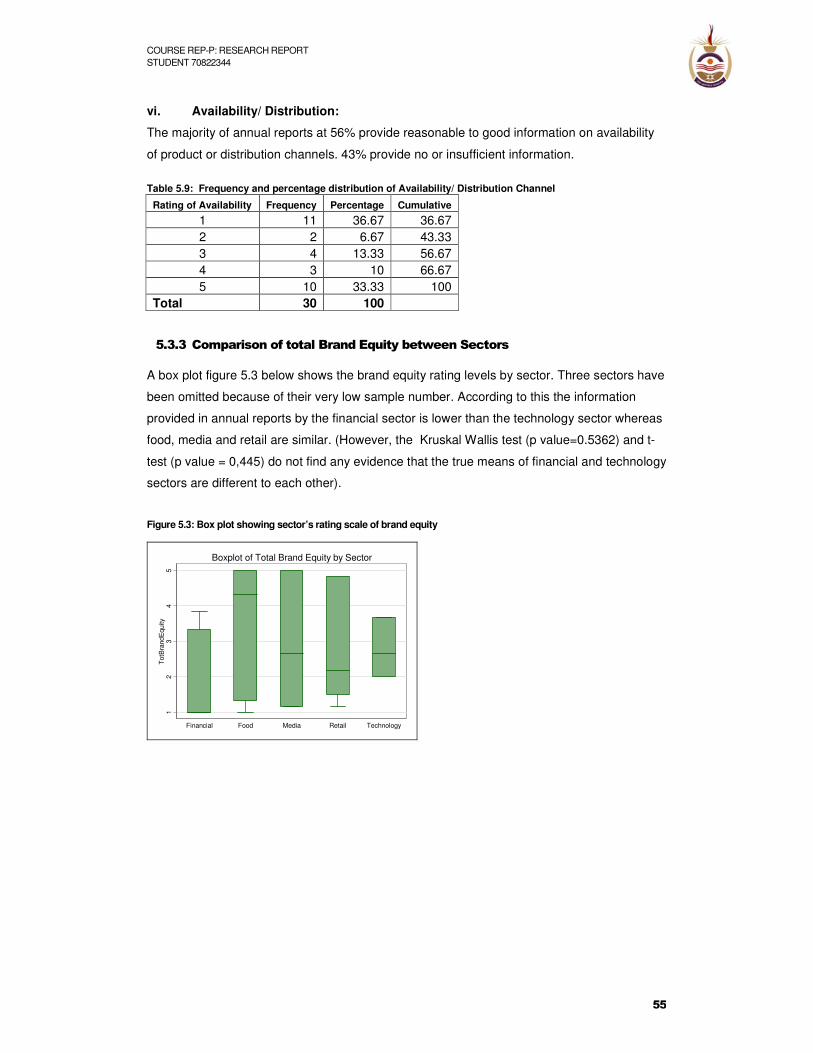
COURSE REP-P: RESEARCH REPORT STUDENT 70822344
55
vi. Availability/ Distribution:
The majority of annual reports at 56% provide reasonable to good information on availability
of product or distribution channels. 43% provide no or insufficient information.
Table 5.9: Frequency and percentage distribution of Availability/ Distribution Channel
5.3.3 Comparison of total Brand Equity between Sectors
A box plot figure 5.3 below shows the brand equity rating levels by sector. Three sectors have
been omitted because of their very low sample number. According to this the information
provided in annual reports by the financial sector is lower than the technology sector whereas
food, media and retail are similar. (However, the Kruskal Wallis test (p value=0.5362) and t-
test (p value = 0,445) do not find any evidence that the true means of financial and technology
sectors are different to each other).
Figure 5.3: Box plot showing sector’s rating scale of brand equity
12
34
5T
otB
rand
Equ
ity
Financial Food Media Retail Technology
Boxplot of Total Brand Equity by Sector
Rating of Availability Frequency Percentage Cumulative
1 11 36.67 36.67 2 2 6.67 43.33 3 4 13.33 56.67 4 3 10 66.67 5 10 33.33 100
Total 30 100

COURSE REP-P: RESEARCH REPORT STUDENT 70822344
56
5.4 Other Customer Metrics
Below are the results of some other customer metrics (market share, relative price, sales to new
customers) which do not form part of brand equity measurement but are validated as important
measurements according to various research. The rating scale used is as follows:
Table 5.10: Explanation of Rating Scale for Customer Metrics
Rating Scale Explanation
1 Very poor
2 Poor
3 Average
4 Good
5 Excellent
i. Overall market share/ market presence:
Very poor or poor rating is obtained for 57% of the sample with 23% obtaining a rating of
excellent at level 5.
Table 5.11: Frequency and percentage distribution of Market Share or Market Presence
ii. Relative price:
Nearly all companies (90%) do not provide any or poor information on pricing.
Table 5.12: Frequency and percentage distribution of Relative Price
Rating of Market Share or Market Presence Frequency Percentage Cumulative
1 16 53.33 53.33 2 1 3.33 56.67 3 3 10 66.67 4 3 10 76.67 5 7 23.33 100
Total 30 100
Rating of Relative Price Frequency Percentage Cumulative
1 26 86.67 86.67 2 1 3.33 90 3 1 3.33 93.33 4 1 3.33 96.67 5 1 3.33 100
Total 30 100

COURSE REP-P: RESEARCH REPORT STUDENT 70822344
57
iii. Sales to new customers:
Of the sample 83% does not provide any information but four out of 30 companies provide full
details.
Table 5.13: Frequency and percentage distribution of Sales to New Customers
5.5 Segmentation Metrics
These measures are based on research conducted by Payne (McDonald & Dunbar 2004:4). The
rating scale used in assessing information obtained from annual reports pertaining to segmentation
is as follows:
Table 5.14: Rating Scale for Segmentation
Rating Scale Explanation
1 Very poor
2 Poor
3 Average
4 Good
5 Excellent
i. Percentage of market represented by segment:
Forty percent of annual reports do not report on percentage of market represented by
segment and 10% vaguely mention it. Nearly half (47%) of the sample achieve rating of good
or excellent.
Table 5.15: % of market represented by segment
Rating of Sales to New Customers Frequency Percentage Cumulative
1 25 83.33 83.33 2 0 0 0 3 1 3.33 86.67 4 0 0 0 5 4 13.33 100
Total 30 100
% of market represented by segment Frequency Percentage Cumulative
1 12 40 40 2 3 10 50 3 1 3.33 53.33 4 4 13.33 66.67 5 10 33.33 100
Total 30 100
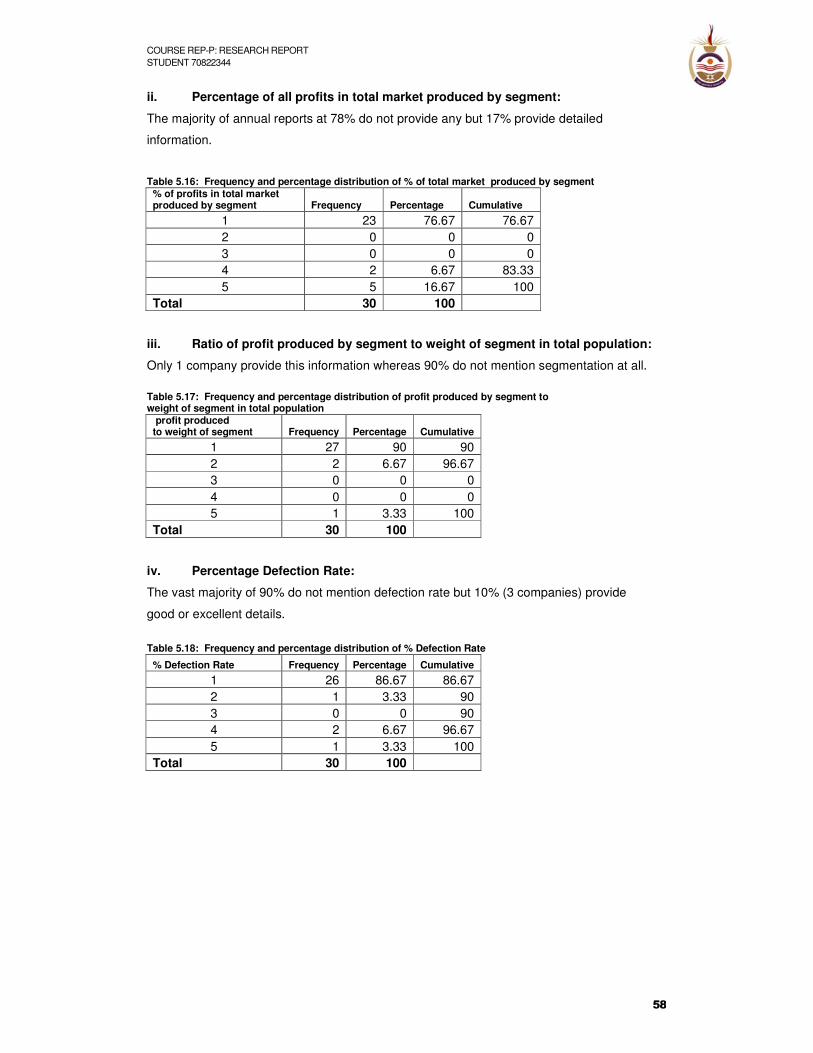
COURSE REP-P: RESEARCH REPORT STUDENT 70822344
58
ii. Percentage of all profits in total market produced by segment:
The majority of annual reports at 78% do not provide any but 17% provide detailed
information.
Table 5.16: Frequency and percentage distribution of % of total market produced by segment
iii. Ratio of profit produced by segment to weight of segment in total population:
Only 1 company provide this information whereas 90% do not mention segmentation at all.
Table 5.17: Frequency and percentage distribution of profit produced by segment to weight of segment in total population
iv. Percentage Defection Rate:
The vast majority of 90% do not mention defection rate but 10% (3 companies) provide
good or excellent details.
Table 5.18: Frequency and percentage distribution of % Defection Rate
% of profits in total market produced by segment Frequency Percentage Cumulative
1 23 76.67 76.67 2 0 0 0 3 0 0 0 4 2 6.67 83.33 5 5 16.67 100
Total 30 100
profit produced to weight of segment Frequency Percentage Cumulative
1 27 90 90 2 2 6.67 96.67 3 0 0 0 4 0 0 0 5 1 3.33 100
Total 30 100
% Defection Rate Frequency Percentage Cumulative
1 26 86.67 86.67 2 1 3.33 90 3 0 0 90 4 2 6.67 96.67 5 1 3.33 100
Total 30 100
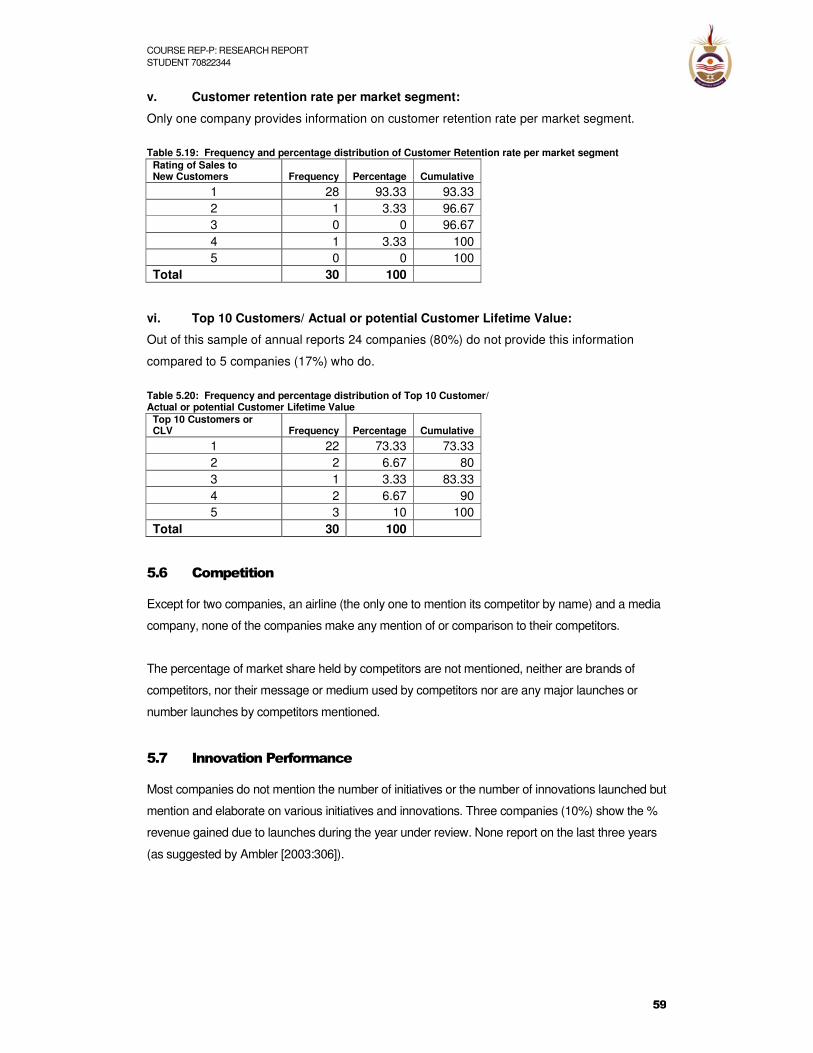
COURSE REP-P: RESEARCH REPORT STUDENT 70822344
59
v. Customer retention rate per market segment:
Only one company provides information on customer retention rate per market segment.
Table 5.19: Frequency and percentage distribution of Customer Retention rate per market segment
vi. Top 10 Customers/ Actual or potential Customer Lifetime Value:
Out of this sample of annual reports 24 companies (80%) do not provide this information
compared to 5 companies (17%) who do.
Table 5.20: Frequency and percentage distribution of Top 10 Customer/ Actual or potential Customer Lifetime Value
5.6 Competition
Except for two companies, an airline (the only one to mention its competitor by name) and a media
company, none of the companies make any mention of or comparison to their competitors.
The percentage of market share held by competitors are not mentioned, neither are brands of
competitors, nor their message or medium used by competitors nor are any major launches or
number launches by competitors mentioned.
5.7 Innovation Performance
Most companies do not mention the number of initiatives or the number of innovations launched but
mention and elaborate on various initiatives and innovations. Three companies (10%) show the %
revenue gained due to launches during the year under review. None report on the last three years
(as suggested by Ambler [2003:306]).
Rating of Sales to New Customers Frequency Percentage Cumulative
1 28 93.33 93.33 2 1 3.33 96.67 3 0 0 96.67 4 1 3.33 100 5 0 0 100
Total 30 100
Top 10 Customers or CLV Frequency Percentage Cumulative
1 22 73.33 73.33 2 2 6.67 80 3 1 3.33 83.33 4 2 6.67 90 5 3 10 100
Total 30 100

COURSE REP-P: RESEARCH REPORT STUDENT 70822344
60
i. Initiatives in process:
Half of the companies’ annual reports do not mention initiatives, but 40% cover the topic well.
Table 5.21: Frequency and percentage distribution of Initiatives in Process
ii. Percentage Revenue due to launches:
90% do not mention this, while three companies cover it well or very well.
Table 5.22: Frequency and percentage distribution of % revenue due to launches during last year
iii. Innovations launched:
50% do not or only vaguely mention innovations while 27% cover the topic well or very well.
Table 5.23: Frequency and percentage distribution of Innovations launched
5.8 Environmental and Strategic Aspects
The question addressed aspects mentioned in annual reports such as external factors influencing
marketing trends, internal factors influencing marketing performance, key risk factors influencing
cash flow, whether marketing is in alignment with strategy and whether marketing or the customer
is supported or mentioned by the chairperson. The results are as follows:
Rating of Initiatives in Process Frequency Percentage Cumulative
1 11 36.67 36.67 2 4 13.33 50 3 3 10 60 4 5 16.67 76.67 5 7 23.33 100
Total 30 100
Rating of % revenue due to launch Frequency Percentage Cumulative
1 27 90 90 2 0 0 90 3 0 0 90 4 2 6.67 96.67 5 1 3.33 100
Total 30 100
Rating of Innovations launched Frequency Percentage Cumulative
1 12 40 40 2 3 10 50 3 4 13.33 63.33 4 3 10 73.33 5 8 26.67 100
Total 30 100

COURSE REP-P: RESEARCH REPORT STUDENT 70822344
61
Table 5.24: Rating Scale for environmental and strategic aspects
Rating Scale Explanation
1 Very poor
2 Poor
3 Average
4 Good
5 Excellent
i. External factors influencing market trends:
A third of companies’ response is poor, but 63% answer it satisfactorily, well and very well.
Table 5.25: Frequency and percentage distribution of External Factors influencing Market Trends
ii. Environmental influences on marketing:
37% do not provide any information whereas nearly half (47%) of answers are good or
excellent. Two thirds (63%) give information pertaining to this topic.
Table 5.26: Frequency and percentage distribution of Environmental influences on marketing
iii. Key risk factors influencing cash flow or risk assessment per segment:
Nearly half (48%) of the sample give no or insufficient information.
Table 5.27: Frequency and percentage distribution of Key Risk Factors influencing Cash Flow or Risk assessment per segment
Rating of External Factors Frequency Percentage Cumulative
1 6 20 20 2 5 16.67 36.67 3 7 23.33 60 4 4 13.33 73.33 5 8 26.67 100
Total 30 100
Rating of Environmental Frequency Percentage Cumulative
1 11 36.67 36.67 2 0 0 36.67 3 5 16.67 53.33 4 6 20 73.33 5 8 26.67 100
Total 30 100
Rating of Risk on Cash Flow Frequency Percentage Cumulative
1 8 26.67 26.67 2 6 20 46.67 3 4 13.33 60 4 4 13.33 73.33 5 8 26.67 100
Total 30 100

COURSE REP-P: RESEARCH REPORT STUDENT 70822344
62
iv. Is marketing stipulated and aligned to strategy:
41% do not make a connection between marketing and strategy. However, 59% of companies
mention marketing/ customer in their annual report with 41% providing good or excellent
input.
Table 5.28: Frequency and percentage distribution of Marketing’s alignment to Strategy
v. Does chairman report mention marketing, quantify market assets and
how it has changed:
47% of chairman’s reports do not mention or only vaguely refer to marketing or customer.
A third (33%) of chairpersons’ reports support, outline or highlight aspects of marketing.
Table 5.29: Frequency distribution of Chairman mentioning marketing or quantifying market assets
In addition when looking at the figure below the spearman correlation confirms a strong linear
association between marketing’s alignment to strategy and brand equity. This correlation
shows that, in the annual reports of companies studied, brand equity is strongly related to
marketing’s alignment to strategy. In other words, where marketing is aligned to a company’s
strategy, information on brand equity is also well presented in annual reports. 1 is a perfect
correlation and this value is 0.91. The scatter plot below illustrates this:
Figure 5.4: Correlation between Marketing’s alignment to Strategy and Brand Equity
12
34
5S
trat
egy
1 2 3 4 5TotBrandEquity
Rating of Marketing alignment to Strategy Frequency Percentage Cumulative
1 11 36.67 36.67 2 1 3.33 40 3 5 16.67 56.67 4 2 6.67 63.33 5 11 36.67 100
Total 30 100
Rating of Chairman’s support for marketing Frequency Percentage Cumulative
1 12 40 40 2 2 6.67 46.67 3 4 13.33 60 4 2 6.67 66.67 5 10 33.33 100
Total 30 100

COURSE REP-P: RESEARCH REPORT STUDENT 70822344
63
5.9 Reporting Standard
No uniform reporting standard exists in any annual reports.
In most cases information pertaining to the brand is mentioned under the CEO’s report and less
frequently in operational review. One company chooses to report brand in its sustainability report.
In most reports the sections where customer satisfaction is mentioned, differs substantially, varying
from chairman’s, CEO’s, managing director’s report, selling section, sustainability report,
operational review, corporate governance, chief financial officer’s report, stakeholder relations and
service section. Segmentation is mainly dealt with under corporate governance, operating review,
financial review or CEO report. Innovation is covered under CEO report, operational review or
sustainability report. Issues pertaining to strategy or risk assessment are mainly covered under
chairman’s and/or CEO’s report.
5.10 Glossary
None of the companies have a glossary with marketing definitions or brand terminology.
5.11 Information required by Investors
A study by the Cranfield University School of Management (McDonald and Dunbar, 2004:6)
investigated what type of information is necessary for external financial community to make a
decision. By using the Cranfield University research criteria on marketing aspects deemed
important to investors, my research results show the following number and percentage of
companies (rated excellent) who reported well or very well (rating level 4 and 5) on the following:
Table 5.30: Information deemed important by investors versus information supplied by companies’ annual reports
Information deemed important by investors
Number of Companies % of Companies
market share 10 33%
key competitors 1 3%
marketing investment 0 0%
innovations (new product statistics) 11 37%
brand awareness 11 37%
customer satisfaction 11 37%
distribution coverage 13 43%
relative price (price elasticity) 1 3%

COURSE REP-P: RESEARCH REPORT STUDENT 70822344
64
5.12 Grand Total Maturity Model
Ambler (2003:94) has developed a marketing performance assessment model which has been
adapted to assess how much emphasis is placed by companies on marketing performance and
elements as reflected in annual reports. (Refer to annexure 3).
Table 5.31: Rating scale of annual reports’ grand total maturity level
Rating Scale Mark Allocation Percentage Explanation
Level 1 23 - 34 < 33% Very poor
Level 2 35-57 33-49% Poor
Level 3 58-79 50-69% Average
Level 4 80-91 70-80% Good
Level 5 93-115 80-100% Excellent
The results in table 5.32 below and figure 5.5 below depict the grand total of all 23 marketing
elements measured in this research. It reflects the checklist and comprises of all the components of
brand equity, other customer measurements, segmentation, innovation metrics, competitors and
environmental and strategic factors. The brand equity elements are based on information provided
in annual reports pertaining to familiarity/ awareness, penetration, reputation, customer satisfaction,
customer loyalty, availability/ distribution channel. Other customer metrics refer to market share or
market presence, relative price or pricing strategy and sales to new customers. Segmentation
elements include % of profits in total market produced by segment, ratio of profit produced by
segment to weight of segment in total population, % defection rate and customer retention rate by
market segment, extent to which profitability of top ten customers are known and reflected.
Environmental and strategic aspects assess whether external factors influencing marketing trends
are discussed and whether risk factors influencing cash flow are mentioned. Other aspects include
whether key marketing performance indicators are stipulated and aligned to company strategy,
whether the chairman’s review supports marketing and quantifies the main marketing assets. The
results are as follows:
Table 5.32: Frequency and percentage distribution of annual reports’ rating level as per Grand Total Maturity Model
Rating Frequency Percentage Cumulative
1 10 33.32 33.32 2 8 26.65 60 3 4 13.32 73.29 4 6 20.00 93.29 5 2 6.66 100
Total 30 100
The overall grand total score shows that 60% of JSE listed companies in this sample provide
insufficient marketing information in their annual reports. One third of the companies (33%) provide
no or hardly any information on the 23 elements. Of the annual reports 27% provide poor and
insufficient information. Of the sample thirteen percent provide average and sufficient information

COURSE REP-P: RESEARCH REPORT STUDENT 70822344
65
but much of the information can be improved. 20% of companies provide good
information and 7% provide excellent information. This shows that most companies (60%) are at
maturity level 1 and 2 which indicates a “poor” rating with few at maturity level 5 (rated “excellent”).
This shows a strongly negative trend in maturity level. These results are shown in the histogram
below:
Figure 5.5: Frequency of Annual Reports rated as per Grand Total Maturity Model
0
2
4
6
8
10
12
1 2 3 4 5
Category
Fre
qu
en
cy
5.12.1 Comparison of Grand Total by Sector
By adding up all the scores we arrive at a grand total score. The total grand score is made up
of all 23 elements under review. These are brand equity, other customer measurements,
competitors, segmentation, innovation and environmental and strategic factors.
The box plot figure 5.6 below shows comparison by sector (excluding the sectors which are
only presented by one or two companies), by highlighting the data of the middle 50% (i.e.
between the 25th and75th percentile). As can be seen, the food sector has the highest
median, followed by media and retail whose median is nearly the same. The sectors seem to
depict similar results. Although the food sector has the highest grand total mean, it is also
highly variable within the sector. It can also be is seen that media companies vary greatly in
their total grand score. Because of the high degree of similarity or overlap of boxes, no
conclusive statement can be made. However, the box plot shows that the financial sector has
the lowest mean, lowest overall score and is performing substantially worse than the
technology sector. The dot indicates an outlier and extreme value of one bank. (However, the
results are statistically not significant due to relatively low sample number and probability of
0,689).

COURSE REP-P: RESEARCH REPORT STUDENT 70822344
66
Figure 5.6: Box plot depicting rating scale of all elements by sector
2040
6080
100
Financial Food Media Retail Technology
Boxplot of Grand Total by Sector
The histogram, figure 5.7, below shows the proportion of distribution of companies’ annual reports
according to the rating level of the grand total maturity model. The results show a non-normal
distribution with high density at the extremes (as oppose to a normal symmetric, bell shaped curve).
The histogram shows that the majority of annual reports are rated very low, few obtain middle
(average) ratings, displaying low density in the middle, whereas some annual reports are rated
highly, resulting in increased density at a high maturity level of 4 and 5.
Figure 5.7: Histogram depicting Grand Total
0.0
1.0
2.0
3D
ensi
ty
20 40 60 80 100GrandTotal
Although the histogram (refer to figure 5.2) and box plot (refer to figure 5.3) of total brand equity
shows slightly different results to the histogram (refer to figure 5.7) and box plot (refer to figure 5.6)
above of the grand total maturity model, the trend is similar. Both histograms show a high extreme
value at the lowest rating level, with low density in the middle and higher density towards the well

COURSE REP-P: RESEARCH REPORT STUDENT 70822344
67
performing side of the graph, displaying a bi-modal tendency. This means that either
no information or good or very good information is provided in annual reports.
5.13 Summary of Findings
The trend appears to be that the majority of companies supply very limited information on
marketing metrics and marketing information.
The quantitative information in general is not answered well, with none of the companies
mentioning marketing investment.
The research findings of this sample of JSE listed companies show a bi-modular tendency
pertaining to brand equity metrics. The results on overall brand equity show that half (53%) of the
companies do not provide any or poor information on their brand and customer attitudes and
feelings towards it. However, 26% of companies supplied good and excellent information.
The findings for elements of brand equity are as follows: The majority of companies reported poorly
on brand familiarity (63%), penetration (57%) and reputation (57%) and customer loyalty (60%).
Slightly improved results are obtained for customer satisfaction where nearly half of the companies
(47%) provide good or excellent information. The aspect of availability is answered by more than
half of the companies (56%).
When comparing sectors the food, media and retail perform similarly, although results show that
the financial sector performs worse than the technology sector.
Nearly a quarter of the companies (23%) provided good information on overall market share or
presence, whereas only three (10%) companies provide information on pricing and only five (17%)
provide information on sales to new customers.
Segmentation metrics are generally not reflected in annual reports.
The vast majority of companies (93%) do not mention competitors. Only 2 companies (7%) refer to
their competitors.
Half of the companies provide information on aspects pertaining to innovation, although the vast
majority (90%) do not show revenue gained due to launches during the past year.
Environmental aspects influencing market trends are covered by two thirds of the sample, however
a third of the sample does not provide information or only insufficiently. However, when referring
specifically to risk factors influencing cash flow or market segments, companies perform less well
with nearly half (49%) not providing any or insufficient information. A bipolar tendency is evident

COURSE REP-P: RESEARCH REPORT STUDENT 70822344
68
when assessing whether marketing is stipulated and aligned to strategy. Eleven
companies (38%) did not provide any information as opposed to eleven companies (38%) which
gave excellent information and where alignment between strategy and marketing was evident.
Similar results are obtained when reviewing whether the chairperson’s report mentions aspects
pertaining to marketing. The findings show that there is a direct correlation between strategy and
brand equity.
Other findings include that no standard reporting format exists. Information pertaining to marketing
is spread throughout the annual reports. None of the companies provide a glossary of marketing
definition or brand terminology.
When comparing these research results to information required by investors, this study shows that
sometimes none of the companies provide information whereas at best just over 40% of the
companies provide the relevant information necessary for investors to make a good investment
decision.
When combining all the marketing related elements (financial, brand equity, other customer and
segmentation metrics, competitors, innovation and aspects pertaining to environmental and
strategic aspects) analyzed in this research and summing them up into a grand total score, it
becomes evident that nearly two thirds (60%) of companies obtain a score of less than 50%, in
other words providing insufficient information. On the other hand, 27% of companies provide good
and excellent information.

COURSE REP-P: RESEARCH REPORT STUDENT 70822344
69
CHAPTER 6: Discussion, Conclusion, Recommendations
6.1 Introduction
Marketing performance should be reflected by metrics and marketing information to indicate the
progress the company is making in comparison to industry norm. By using generally accepted
marketing metrics it is possible to value marketing’s output such as increased market share,
improved brand awareness, market penetration and customer retention ratios. In this way
marketing will be able to guide a company’s strategic positioning and improve competitiveness.
These measures and trends should be reflected in annual reports to give a better understanding of
the industry and type of business which will enable investors to make a better and well informed
decision about the company.
Below research findings are discussed by referring to financial aspects, brand equity, other
customer metrics, competition, environmental and strategic aspects, concluding with general
comments. Examples of annual reports are included under each section.
6.2 Financial Aspects
In order to benchmark a company’s performance it is essential to compare it to the industry norm or
against its competitors. Ambler (2003) suggests that financial metrics should be reported in relative
terms (and not absolute numbers). Performance can be assessed in terms of comparing current
achievement against previously determined internal goals (namely a baseline), against external
benchmarks such as market indicators and competitors (taking adjustment into account) (Ambler,
2003:26).
6.2.1 Sales and profit growth in comparison to competitors
The results of the “sales and profit growth” analysis in this research show that, although sales and
profit performance is compared to previous year, none of the companies compare them with their
own goals or to competitors. A lack of comparison could point towards a company not having an
explicit marketing strategy with quantifiable milestones or measurements or not having a clear
understanding of its overall marketing performance.
6.2.2 Marketing Investment
Investment into brand and brand loyalty can create a long term relationship with the customer
because a positive customer attitude towards a brand results in quicker response, thereby
accelerating cash flow and therefore increasing shareholder value. Marketing expenditure is an

COURSE REP-P: RESEARCH REPORT STUDENT 70822344
70
investment into an asset which often is the most valuable one a company owns
(Sinclair, 2007:26).
To assess a brand’s contribution, the marketing expenses have to be deducted from the gross
profit. It is therefore essential for a company to know the marketing expenses (or investment) and
to reflect the percentage in the annual report. An indication as to percentage of marketing
investment can give an indication of how a company values its brand building activities. As brand
equity evolves over time, it can only create substantial value for a company if investment occurs.
Realistic expectations by for example investors and stakeholders can only occur if initial
investment is known, measured and benchmarked against industry norms.
The result of this research shows that there is a lack of information on investment into brand
building and marketing activities because none of the companies report on it. Therefore
companies create the impression that they do not value marketing activities or that they do not
measure marketing’s worth.
A study in the United Kingdom in 2002 conducted by the Cranfield University School of
Management (McDonald and Dunbar, 2004:6) showed a lack of knowledge by senior marketing
practitioners and company executives about financial impact of marketing expenditure. Nearly a
third (31%) did not know, did not measure and did not report to these to the board whereas only
1% had complete knowledge. This shows that if companies do not show their marketing
investment expenditure in annual reports, there is a likelihood that they do not measure nor report
it to their board.
This research shows that only two companies mention percentage increase in advertising spend,
which forms part of the marketing mix and is only one element in building brand equity and
therefore does not provide the overall information on marketing investment. Advertising forms part
of the marketing mix which contributes to strengthening the brand equity and profit of a company.
An individual element’s contribution however, is not sufficient because optimal expenditure should
be seen across the marketing mix. Expenditure on all elements need to be taken into
consideration in order to assess the contribution to building of brand equity.
Example
Spar (2006) mentions that media spend for brand “Tops” increased by 54% and television
advertising was introduced and “for the first time Tops brand awareness continues to improve”
(Spar, 2006). However, it is not clear whether the reason is the medium TV or because of general
increase inn advertising spend.
In another example, a producer and marketer of alcoholic beverages (Distell, 2006) mentions
substantial increase in marketing investment in pursuit of improving quality (including packaging),
COURSE REP-P: RESEARCH REPORT STUDENT 70822344
71
supported by advertising campaigns to stimulate demand. However, no indication is
made as to percentages or amounts of marketing investment or anticipated benefits resulting
from the campaigns. The company states however that “new levels of brand visibility were
achieved with expansion of the market activation team and roll-out of focused trade channel
merchandising drive” (Distell, 2006:23).
Although financial measurements are important, they do not fully depict reality and future potential
of a company. Therefore it is essential to include information on brand equity in annual reports.
6.3. Brand Equity
A brand name creates a customer’s response and is for many companies its most valuable asset.
A brand is nothing without the customer. For a company to move towards market orientation and
becoming more customer focused means that it needs to understand the role the brand is playing
in creating value for the company. Managing brand equity is important as it transfers value from the
market to the shareholder.
Brand equity elements are closely related to positioning (Ambler, 2003:126). Understanding the
elements of brand equity and monitoring any changes in brand equity metrics allows a company to
define its product benefits, more closely define its target market, create a competitive advantage
through differentiation and improve its distribution strategy. The United Kingdom’s Accounting
Standards Board suggested in 2003 that shareholders should be informed about marketing
investment and brand equity (Ambler, 2003:277).
6.3.1 Total Brand Equity
The results pertaining to total brand equity (refer to table 5.2, figure 5.2 and annexure 6) show a
tendency of bimodal distribution. Results show that 53% (refer to table 5.2) of annual reports (rating
level 1 and 2) give insufficient information about their brand equity, while just over a third (36%)
obtained rating level 4 and 5 displaying good or excellent information, for example Massmart, SAB
Miller and AVI (refer to annexure 11.1 to 11.3). These results indicate that the majority of
companies create the perception that they do not place value on managing their brand equity. In
addition results show that the majority of companies create the impression that they do not know
their target market, positioning or competitive advantage. By including and documenting brand
equity aspects, companies can create a more positive perception about their capabilities and
growth prospects.
6.3.2 Variance in Rating of Brand Equity Components
Several companies display a substantial variance in rating scales within the brand equity
components (refer to annexure 6). Some companies (e.g. Spar, Nedbank, Naspers, Dimension
Data) have scores varying from 1 to 5 for the various elements measuring brand equity. All six

COURSE REP-P: RESEARCH REPORT STUDENT 70822344
72
elements contribute to measuring the performance of brand equity. However, some
companies do not mention some elements “brand equity” in their annual reports, resulting in a
lower overall brand equity score. The variance in rating of elements would reduce the overall brand
equity rating, not because the company is less brand orientated but because the company does not
mention a certain element (for example Naspers on reputation, Metropolitan on customer retention,
Afrox on familiarity and penetration. Because of the detailed information given on other brand
aspects and overall good brand rating, for some companies it can be deducted that they have the
information available internally (for example Spar and Dimension Data). However, it could also
point to a problem with the company’s structure. This is likely to be the case with a large financial
services company (Nedbank, 2006). Nevertheless, the aim of this research is to assess how much
and what type of information is reflected in annual reports of listed companies.
Example:
Dimension Data (2006) for example do not elaborate on brand familiarity/ awareness. However, the
company states in a section “help our clients” how each product offering (e.g. network integration,
security, data centre, storage and converged communications) can assist clients (Dimension Data,
2006:3). Sections on customer interactive solutions, “our approach with clients” and “the business
value we bring” lists how the company helps clients to address critical business issues. The
company sees the client as important and states that the client experience with the company will
determine customer satisfaction, spend level and whether client becomes a life-long client. The
CEO states, “[we] will improve our focus on account penetration to strengthen client relationships
and service adoption within our client base” (Dimension Data, 2006:13).
6.3.3 Brand Architecture & Structure
Companies with a well defined and clearly depicted brand and corporate structure convey a more
professional impression and with reference to the examples below are less likely to encounter
potential problems.
Example: Rating Level 1
A company in the fishing industry (Oceana; 2006) does not elaborate on marketing’s position in the
company structure. However, in assessing the annual report it becomes evident that this company
is lacking in brand structure. The fishing, processing and cold storage company is a vertically
integrated with some well known brands such as “Lucky Star” and “Glenryck” in the United
Kingdom. It seems that more synergies can be gained by better aligning brand architecture and
product branding. The structure and naming of divisions is confusing and misleading. The
corporate brand (“Oceana Brand”) is not appropriately used as it refers to the supply chain and
includes fishing fleet with some (but not all) marine products, marketing and distribution of some
unbranded products (fishmeal) and some branded caned fish products, as well as referring to
activities in some (e.g. Namibia) but not all countries. Another brand, the “Blue Continent Products”
COURSE REP-P: RESEARCH REPORT STUDENT 70822344
73
includes other types of marine products (e.g. mackerel, hake, tuna) whereas
commercial cold storage forms part of a third division.
Example: Rating Level 5
AVI is a consumer brands company with a focus on food, beverage and fashion brands. The
company has implemented a new structure with five business units, namely the beverage brands,
retail snacking brands, fashion brands, chilled and frozen convenience brands and out-of-home
brands (AVI, 2006:13). The group has a strong portfolio of market-leading brands such as I&J,
Denny, Indigo, Spitz etc. Each of these brands has a detailed report on revenue and volume %
change with explanations. Each brand category is broken down into product groups and revenue
and volume is provided with explanations. Pricing, capital expenditure (however not marketing
specific), innovations and market share are explained.
Brand Equity Elements
Discussions on findings pertaining to each brand equity component (i.e. brand awareness,
penetration, reputation, customer satisfaction, loyalty, availability) are described below. The majority
of companies report poorly on brand familiarity (63%), penetration (57%) and reputation (57%) and
customer loyalty (60%). Slightly improved results are obtained for customer satisfaction where
nearly half of the companies (47%) provide good or excellent information. The aspect of availability
or distribution channel is answered satisfactorily, well or very well by more than half of the
companies (56%).
6.3.4 Brand Equity: Awareness/ Familiarity
Brand awareness and familiarity is an indication of a customer’s knowledge of the company. It
measures a company’s distinctiveness out of which arises loyalty and buying behaviour (a
customer’s purchase intention). Not knowing the extent of brand awareness can lead to poor
positioning of a company and improper allocation of marketing investment. High brand awareness
makes introduction of new products or product extension easier. It is therefore important for a
company to show investors that it has a clear positioning strategy which it communicates and which
is understood by consumers.
A company’s life cycle is likely to influence the extent of awareness/familiarity. Brand awareness
plays a more important role for companies which are in an expansion phase whereas familiarity is a
better indication for more mature companies. In multinational companies this can vary between
countries. Nevertheless, measuring brand familiarity and reporting on it is a very important aspect
of the marketing function and should not be ignored.
The finding of this research (refer to table 5.4 and annexure 6) is worthwhile noting as they show
that nearly two thirds (63%) of the companies refer to brand awareness or familiarity in an

COURSE REP-P: RESEARCH REPORT STUDENT 70822344
74
insufficient manner as no (43%) or insufficient (20%) information is provided. The
tendency is to describe the company’s product offering and brand architecture rather than referring
to brand awareness. On the other hand, 37% of the sample present their knowledge on brand
awareness/familiarity in a good or excellent way. The highest mean or average score (at 3,29) was
obtained by the food sector, followed by retail and media, both at a mean of 3.
Example: Rating Level 5
A good example of depicting brand and brand awareness is Ellerine’s which has13 retail brands in
the furniture and appliance sector. All Ellerine’s (2006) brands are depicted by LSM positioning.
Under the annual report’s operation division each brand is discussed in detail, stating product
offering, presence in countries, target market, growth of stores and upgrades, competitive edge,
operating margin and position as brand leader. Brand’s familiarity is verified by external surveys
such as Markinor Brand Awareness and Sunday Times surveys.
6.3.5 Brand Penetration
Information on brand penetration should indicate whether a customer segment is growing or
declining and reasons due to for example expansion of customer base or greater demand from the
same customer base should be known. Indication as to penetration and reasons would ensure that
the company follows the right strategy.
In this sample companies have the tendency to either answer this section very well 30% (9
companies rated excellent at level 5) and 50% not at all (15 companies rated at poor at level 1)
(refer to table 5.5). Those companies that obtained a high score for “awareness/familiarity” also
tended to get a high score for “penetration”, because both of these measures refer to the brand (as
oppose to customer or distribution channel).
The lower rated companies tend to use a general term such as “market leader” and had a tendency
to confuse penetration with distribution channel. This shows a lack of understanding of the term
market penetration.
Example: Rating Level 1
For example, one company rated level 1 mentions “Oceana International has for years been
promoting brand recognition and developing structured and reliable distribution and logistics
channels to improve market penetration and margins” (Oceana, 2006:22). The company does not
mention how the division “Oceana International” fits into the structure. Neither does the company
elaborate on how the brand was promoted or which distribution channels were pursued.

COURSE REP-P: RESEARCH REPORT STUDENT 70822344
75
6.4 Brand Equity: What customers think (Reputation)
A strong brand can command a price premium and increase market share based on a company’s
power based on customer loyalty and higher switching costs. Brand equity can enhance loyalty
(resulting in repeat business and increased barriers to competition). Well differentiated brands are
more responsive to advertising and promotion and can improve distribution channel clout in the
market place. Higher equity brands tend to have a lower marginal cost of sales and marketing.
Strong brands convey a clear and sustainable differentiated position and enhance clarity within an
organization and attract and keep high quality customers.
6.4.1 The Customer Orientation
It is important to know what customers think to enable assessment of the strength of a brand and to
adjust to change. A brand is a long term investment. Investors therefore should be interested in the
effect of a brand on the end consumer as this can give an indication of future trends which can be
compared to the direction and action the company is planning to take.
In this sample (refer to table 5.6 and annexure 6) 40% of companies did not mention reputation and
17% only referred to reputation, resulting in a total of 57% unsatisfactory information. However,
37% of companies information is good or excellent (level 4 and 5).
Several companies mention mechanisms of obtaining information on customers (e.g. call centre,
surveys, focus group discussions, direct mail) but do not provide any data on customer needs,
market segment share, percentage satisfaction or complaints.
Example
Two companies mention customers in their mission or value statement but nothing further about
the client is stated in the annual report. Lower rating levels 1 or 2 tend to use general statements,
for example a retail company stating in its mission “To maintain prominent position… through
marketing of branded merchandise supported by fine customer service…” (Rextrueform, 2006).
The marketing strategy envisaged by a retail company includes “improving customer perception of
the company” (Pick n Pay, 2007) but is not further elaborated upon. A market (or customer)
orientated company would focus on understanding and attending to customer needs and achieving
customer satisfaction by building strategies which attract, satisfy and retain customers. Companies
should have a customer-first attitude (Ambler, 2005:21) because customers are the source of cash
flow.
One example in the financial services sector shows that the focus is not on the customer, but that
an inward looking approach prevails. For example, during the year under review the company re-
positioned itself to “demonstrate a deeper understanding of financial needs and cares about the

COURSE REP-P: RESEARCH REPORT STUDENT 70822344
76
communities and our country” (Nedbank, 2006:63). The by-line is “Make things
happen”, supported by above and below the line campaigns, sponsorships and increased social
investments. The aim is to present the group as a caring brand. The report states that this new
strategic focus arose from a dynamic process with input from 500 senior managers (Nedbank,
2006:63). It seems that external stakeholders, such as customers, were not involved in
establishing the strategy. Defining the brand as “a caring brand” arose from internal input only. It
would be desirable and advisable to establish whether banking clients see “caring” as a priority for
their financial needs. Not having involved clients or not having conducted research pertaining to the
new brand strategy highlights a weakness. Keeping the function of branding separate from the
operational service divisions and thereby the end consumer is unlikely to enhance the situation. In
addition, the annual report in its operational review section states that a key part of strategy was to
be seen as “a bank for all” (and not as a “caring brand”). This shows some confusion as to the
company’s strategy.
6.5 Brand Equity: What customers feel (Customer Satisfaction)
Ambler (2003:306) points out that relative end-user satisfaction should be measured and reflected
with trends in annual reports. The term relative refers to customers’ satisfaction with company’s
product or service indexed against satisfaction with the competitors. In this research none of the
companies did this. In addition Ambler (2003:306) suggests perceived product quality (as
perceived by end user) to form part of the metrics. The emphasis is on end user which in some
industry sectors is not the same as immediate trade customer.
As can be seen (refer to table 5.7 and annexure 6) companies reporting on customer satisfaction
show a clear bimodal tendency with 50% reporting not at all or poorly on customer satisfaction,
whereas 47% of companies do well or very well. At a lower rating level of 2 statements about
customer satisfaction are not verified and common phrases such as “substantial increase in
customer base” and offering “world-class solutions at competitive prices” (Data Pro, 2006:5) are
predominantly used.
Example: Rating level 2 and 3
Pick ‘n Pay (2007) states as one of its key values their passion for their customer and that “[we] will
fight for their rights” (Pick ’n Pay, 2007:3), but apart from mentioning an in-depth customer research
resulting in two major target groups of which one is an untapped opportunity, little is said about the
customer in the annual report. The report mentions that the strategic focus is on sustainable
development (as oppose to for example, the customer).
A retail company (rating level 2) has a section called “our customer” where it highlights its strategy
to encourage cross-selling between its various product offerings and its focus on attracting and
retaining more loyal customers with high disposable income whilst being accessible to aspirational
customers with lower disposable income (Woolworths; 2006:36). However, the company gives no

COURSE REP-P: RESEARCH REPORT STUDENT 70822344
77
indication of the process of how to attain these objectives and states that its strategic
focus is on innovative products.
One company (Woolworths, 2006) mentions under customer service that a key requirement is
ensuring product availability and attending to length of till queues and improving check-out
experience as “customer satisfaction remains key” (Woolworths, 2006:42). These aspects should
form part of a “standard” service and are not going to build sustainable competitive advantage. This
example shows an insufficient understanding of the worth of marketing as well as showing non-
alignment to strategy.
Example: Rating Level 5
The company in this example sees the consumer is as a key stakeholder. The various types of
dialogue channels, customer interaction and research interaction (e.g. hotline, product surveys,
consumer immersions) are mentioned. One of the company’s strategic initiatives is to have
consumer insight which refers to having “an intimate understanding of our consumers’ lives, habits,
needs …” (Rainbow Chicken, 2007:10). Customer focus refers to a win-win partnership where
“products need to be within easy reach of our consumers every day” (Rainbow, 2007) (refer to
annexure 11.4).
The sustainability report of this company (Rainbow) displays a section on consumer insight,
consumer care service and meeting customer requirements. Statistics show number of calls
(queries, compliments, complaints, % complaints versus total number of calls) and how complaints
were and how a product recall was dealt with.
6.6 Brand Equity: Customer Loyalty
Relationship marketing such as good customer and supplier relationship can reduce the level of
working capital and fixed investment and enhance cash flow. Stability of cash flow can be
enhanced by a good relationship with customers and channel partners. According to Reichheld
(2000) a loyalty based company should be delivering superior value to the customer. This has a
positive effect amongst others in terms of increased revenue (because of repeat purchase and
referrals) and reduced cost (because of lower acquisition cost, guaranteed base profit and
improved commitment and trust in a relationship). Improved retention can result 25% to 85%
improvement in net present value of a customer (Ahmed and Buttle; 2001). Customer retention
should be an important business goal because is can increase long term profit. A company which
displays some trends or information on customer loyalty and retention shows that it is professionally
managing its customer relationships.
Ambler (2003:306) suggests measuring customer loyalty/ retention as percentage of start-of year
customers still active at year end. None of the companies surveyed showed this measurement.

COURSE REP-P: RESEARCH REPORT STUDENT 70822344
78
Findings (refer to table 5.8 and annexure 6) further show that that one third of
companies report on customer loyalty, but 60% do not refer to or only poorly refer to loyatly. The
Institute of Chartered Accountants of England and Wales (ICAEW) report (Ambler; 2003:264)
suggests to include metrics on customer retention. Only one company in this sample reports
specifically on customer retention.
The strategy to focus on growth and new customers or on customer retention and loyalty will vary
depending on the life cycle of the companies. In multinational companies the strategy also varied
amongst countries, with some countries loosing customers and market share, causing the
company to enter and build a new market in other countries. However, information on customer
loyalty and the company’s approach towards it can give the investor or stakeholder a better
indication as to management’s ability to optimally operate their company.
Example: Rating Level 5
One food company (Rainbow Chicken, 2007) mentions its new implementation of category
management in fresh and frozen division for selected customers and Food Solutions division
strategy of building partnerships with key customers, indicates a focus on customer relationship
management initiative by the company. This is the only report mentioning key customers by name.
Another company [rated highly in total brand equity (Ellerine, 2006)] mentions its credit retail
division implementing customer relationship management initiatives. The report states that “loyalty
of the brand remains high as shown by the reserve rates” (Ellerine, 2006:34) and has been
enhanced by implementation of customer for life concept. However, quantitative data is not given,
although it can be assumed that the company has these internally available.
One company in the telecommunications sector specifically mentions its company-wide campaign
aimed at instilling a sense of ownership in staff towards the customer, called EOTC (‘Everyone
Owns the Customer’) based on an outstanding service charter (Altron, 2007:66). This company has
a section under “stakeholder relations” called ‘customer relations’, thereby substantiating the
importance the company places on its customers. This company also understands the importance
employees play in creating brand equity.
6.7 Brand Equity: Availability/ Distribution Channel
Availability or distribution shows the extent to which products are available for purchase to the end
consumer. With reference to annexure 6 and table 5.9, in general this aspect of brand equity was
described fairly well (56% provided reasonable to good information), stating the supply chain and
depending on the sector, either new retail outlets or processes and systems (e.g. enterprise
resource planning systems) in the technology sector.
COURSE REP-P: RESEARCH REPORT STUDENT 70822344
79
6.8 Other Customer Performance Indicators
Market share and market value and price elasticity are mentioned as information needed by
investors to make an investment decision according to a study conducted by Cranfield University
School of Management in 2002 (McDonald and Dunbar, 2004:6).
6.8.1 Market Share
Table 5.11 and annexure 7 show that very poor or poor rating was obtained by 57% of companies
which means that these companies do not give an indication to their total market size (measured in
value or volume). However 23% obtained high rating scores of 5.
6.8.2 Pricing
Pricing strategy should form part of competitor analysis and give an indication as to a company’s
positioning and target market. Referring to table 5.12 we can see that only one company explicitly
reported on relative price (value of market share divided by volume of market share). Apart from
companies in the food sector most did not refer to pricing strategy (refer to annexure 7 and table
5.12).
Example:
Distell (2006:24) mentions its pricing strategy in the UK being a concern and margins being under
pressure in Germany resulting in pursuing a strategy of targeting other markets in Europe and
North-America for their wines. The company AVI (2006:22) also addresses pricing per brand unit
and gives explanations, for example it had to reduce its pricing for the brand Denny to protect its
market share and to ensure that all products are sold.
6.8.3 New Sales
Reflecting sales to new customers (as percentage of total turnover) indicates the growth of the
company during the past year and gives an indication whether marketing strategy and tactical
activities the company employed are suitable.
Results from table 5.13 (and with reference to annexure 7) show that only four companies (13%)
report on sales to new customers, whereas 83% did not report on this. However, one company
mentions the potential of new sales arising from new stores. Not disclosing any information on new
sales could point towards companies not measuring this or creating the impression of avoiding
disclosure due to inefficiencies in its operations such as misallocation of marketing resources into
sub-optimal markets.

COURSE REP-P: RESEARCH REPORT STUDENT 70822344
80
6.9 Segmentation
Successful brand management can only occur if a company is market orientated, has segmented
its target market and records customer behaviour (Ambler, 2003:213) and preferences.
Segmentation of customer target groups is important because their relative attractiveness differs.
Companies can gain by focusing on high value segments which are aligned to corporate strategy.
However, the Cranfield University School of Management study of 500 leading European
companies shows that few companies measure customer segment or profitability or retention rate
(McDonald and Dunbar, 2004:4). A research conducted in the United Kingdom during 1979-2000
reveals that since a company’s peak performance year, over 25% of companies do not exist any
longer and nearly 33% have been acquired (McDonald and Dunbar, 2004:3). McDonald and
Dunbar argue that much is due to poor segmentation practice.
This research (refer to table 5.14 to table 5.20 and annexure 8) shows that results on segmentation
metrics and qualitative information pertaining to segmentation in annual reports is poor. Analysis
shows that the tendency is for companies to describe their brands and product offerings and not
their key customer target markets. There are some good examples (34% rated level 5) for example
a retail company (Ellerine, 2006), which clearly shows visually the brand segmentation with number
and % of households, average income and LSM level, number of outlets and geographical spread
(refer to annexure 11.5).
An argument can be made that for example ‘% of all profits in total market produced by segment’
and ‘ratio of profit produced by segment weight of segment in total population’ are measurements
which should be presented at board level but not necessarily in annual reports. This can explain
why companies in this sample did not report on % of profit produced by segment (77%), ratio of
profits by segment (90%) and defection (87%). In addition 80% of companies did not provide
knowledge on their top ten customers or customer lifetime value. However, it can also be an
indication that companies do not measure this and do not know their top customers.
6.10 Competition
Good positioning and competitive advantage is only possible with competitor knowledge. .
Knowledge on key competitors is essential for industry analysis to enable a company’s positioning
and strategy and should form part of the marketing function.
It is remarkable that this topic is not addressed by companies in their annual reports (with two
exceptions), especially as knowledge on competitive activities is essential for well planned and
implemented marketing and corporate strategies and activities. Taking advantage of strengths and
opportunities and avoiding threats and limiting weaknesses can only occur with competitor and
industry knowledge. Annual reports should give an overview of a company’s performance,
achievements, positioning and strategies which is very limiting without industry and competitor
COURSE REP-P: RESEARCH REPORT STUDENT 70822344
81
analysis. An overview of or comparison to competitors in annual reports is necessary
and should be possible without divulging confidential information and incurring a competitive
disadvantage.
Except for two companies, an airline (Comair, 2006) (the only one to mention its competitor by
name) and media company (Kagiso, 2006), none of the companies made any mention of or
comparison to their competitors. Kagiso Media (2006) graphically states share of revenue and
reach of customer per alternative competitive media channel (i.e. print, TV, Radio, outdoor, cinema,
internet, direct mail) and mentions its main competition, giving reasons as to it not being a risk
factor (refer to annexure 11.6).
The tendency is for companies to mention their differentiation or competitive edge in general terms,
for example, “the competitive edge of the brand is its bedding and bedroom merchandise which are
complemented by a wide range of appliances and high-tech goods (Ellerine, 2006:35).
In most instances competition is referred to in very general terms such as “commercial printing
remained highly competitive “(Caxton, 2006:4) or “despite competitive action” (Oceana, 2006) or
“the domestic market for alcoholic beverages will remain fiercely competitive” (Distell, 200614). One
company (Dimension Data, 2006) mentions that it uses a global service centre as a benchmark
against competitors but gives no further information on its competition.
It is likely that companies have information available on their competitors. In order for companies to
convey a benchmark as to positioning and competitive advantage, it is advisable to include some
information in relation to key competitors.
6.11 Innovation
Marketing capabilities drive innovation and enables a company to gain sustainable competitive
advantage (Weerawardena, 2003) by differentiating its product and services through timely
responses and initiatives. Ambler (2003:172) points out that key components of innovation are
strategy, process and culture. Innovation does not arise form the market but is driven by the
company internally. Companies elaborating on their innovation capabilities in annual reports
therefore demonstrate their commitment to change.
Ambler (2003:306) suggests that innovation can be measured by share of turnover represented
products launched during the past three years, measured incrementally to exclude cannibalization.
Ambler also suggests showing the change in sales of products already being marketed three years
before. In this sample none of the companies report on the past three years. Only one company
mentions revenue increase in sales resulting from the past financial year. Half of the annual reports
cover the topic ‘innovation’ and ‘initiatives’. Half of the companies do not mention any initiatives but
COURSE REP-P: RESEARCH REPORT STUDENT 70822344
82
40% covered the topic well (refer to table 5.21 to table 5.23 and annexure 9). Retail
companies refer to “initiatives” as new store openings.
Product innovation is seen by more than a quarter of companies as a differentiator and 27% of
annual reports cover the topic well, for example, New Clicks’ Body Shop brand. However, half of
the companies present inadequate information. Product extensions (e.g. New Clicks’ Musica e-
commerce business for online purchase, home delivery and download of music) and joint ventures
(e.g. Virgin Mobile with New Clicks’ Musica Brand stores) are included in this section referring to
innovation.
Example:
A food processor and distributor (Rainbow Chicken, 2006) mentions the number of new products
launched in the individual quick frozen category and various new flavour meals. It also mentions
how these launches were supported through which medium (e.g. TV advertising, in-store
promotion, point-of-sale activity etc).
Despite Ambler’s recommendation on monitoring the number of initiatives and innovations,
depending on the type of industry and size of company, quantifying in numbers might not be
practical for some multinational companies. Those rated excellent at level 5 (27%) have addressed
innovation as part of their strategy, for example, at a technology company innovation forms part of
its strategy (Dimension Data, 2006:6). The company mentions that differentiation comes from its
ability to identify and capitalize on market trends of which the company has chosen four core areas
to focus on.
6.12 Environmental and Strategic Analysis
Marketing strategy and goals should be based on and closely aligned to corporate strategy.
Marketing should be seen as essential in providing input to corporate strategy as the role of
marketing involves (amongst others) performing industry analysis and competitive advantage,
market segment attractiveness and market accessibility. All of these are strategic concepts which
form part of marketing. Marketing also has the role of conducting internal assessment of current
business performance, for example, internal competitive cost advantage, differentiation advantage
or market advantage (Best, 2005:333). Marketing strategy arises out of the analysis and can take
various forms such as investment to grow, new market entry, protecting or optimizing position or
harvesting and divesting. Environmental and strategic factors are closely linked to marketing, and
therefore it is essential to clearly indicate in annual reports their influence and effect on the market
and the marketing function.
This section (refer to table 5.25 to table 5.29 and annexure 10) assesses the following aspects:
External factors influencing marketing trends, whether environmental influences on marketing

COURSE REP-P: RESEARCH REPORT STUDENT 70822344
83
performance are discussed, whether key risk factors pertaining to cash flow are
mentioned, how marketing is in alignment with strategy and how the chairperson’s report mentions
marketing/ customers.
6.12.1 Environment and Strategy
Table 5.26 shows that approximately two thirds (63%) of companies deal with external and
environmental factors influencing marketing trends sufficiently, well or very well. A direct influence
of environmental factors on marketing performance measures or direct reference to cash flow (as
suggested by Ambler, 2003) is not made. Although not always explicitly referring to effects on
marketing or cash flow, in companies rated level 4 good or 5 excellent (38% of companies) it can
be deducted from the information provided.
Example: Rating level 5
A good example is Distell (2006), producer and marketer of alcoholic beverages, whose managing
director and chairperson state that increased competition and global oversupply and a stronger
Rand resulted in many producers returning to the domestic market (Distell, 2006:27) and that a
threat prevails of unscrupulous traders diminishing the quality of SA wines raising concern about
negative effect on the efforts of long term brand building (Distell, 2006:14). The company also
discusses in detail environmental influences and the trends influencing purchasing power of
consumers, both domestic and export market. For example, “customer discretionary spending
remained high, helped by personal tax cuts, … and number of home owners continues to rise”
(Distell, 2006:19).
Another example is an integrated, full-spectrum gases and welding production business (Afrox,
2006), who under the section ‘medical gases and products’ mention an underdeveloped home care
market and niche emergency services market as growing opportunities. The ‘personal protective
equipment market ’is described as being potentially 50% bigger than the existing industry’s product
market (Afrox, 2006:30). Although no further details are given the company has clearly targeted its
growth markets.
6.12.2 Key Risk Factors
Table 5.27 shows (and with reference to annexure 10) that nearly half (47%) of companies
surveyed do not cover this aspect or raise a problem without mentioning course of action.
Companies following international benchmark standards and King II guidelines generally covered
this topic well (40% of companies) as key risk management forms part of the corporate governance
report. None however refer to risk assessment per segment.

COURSE REP-P: RESEARCH REPORT STUDENT 70822344
84
6.12.3 Marketing Alignment to Strategy
Of the companies in the sample (refer to table 5.28) 40% did not mention or did not make any
connection between marketing and their strategy whereas 44% provide good and excellent
information and in alignment to strategy. Altogether nearly two thirds (61%) of companies mention
marketing or the customer in their annual report.
It is interesting to note (refer to figure 5.4) that a strong correlation exists between brand equity and
strategy. This shows that companies who emphasis brand equity and score highly on brand equity
tend to have a well formulated marketing strategy which is aligned to the company’s strategy. The
companies who provide poor information on brand equity also tend to have non-alignment of
marketing and strategy.
Example: Rating Level 3: Non-Integrated Marketing Strategy
In one example, a financial company customer services (which is dealt with by the retail division
and gives support to other business divisions) is separated from the “brand” which is dealt with by
‘group strategy and corporate affairs’. This results in very selective and confusing reporting.
Customer attrition rate is a concern according to the company. The company is an example where
various marketing aspects such as customer service and company image are not well integrated.
The only division to report very limited data on customer segments (as opposed to product/ service
offering) is the retail division which mentions only its five primary client segments. But no further
descriptions are given, apart from stating the divisions’ key product areas. The brand, on the other
hand, is said to “play a major role in managing the group’s image and reputation” (Nedbank,
2006:62). Because the report does not say anything about customer needs or marketing aspects
(apart from a brand building campaign) it is an indication that no corporate marketing department
exists, resulting in strategic misalignment.
Example: Rating Level 5: Holistic, integrated Strategy
Marketing strategies which are well aligned clearly set out the focus of marketing strategies. The
Spar group, for example, state clearly its four marketing focus areas (driving the brand, improving
price perception, being best in fresh and promoting healthy living). These link up well with the
company’s tagline “Good for you”. The strategic approach is holistic and addresses the distribution
system by encouraging the groups’ retailers to improve the customers’ shopping experience and
improve ranges. The company supports this by implementing a new technological system based
on radio frequency, voice activated picking process for inbound stock and inventory and new
advance retail point-of-sale system and new mega distribution facility.
SA’s largest processor and marketer of chicken (Rainbow Chicken, 2007) describes its strategy in
detail as well as its process and how for example customer satisfaction is performed. The chief
executive officer’s report includes a table showing the company’s strategy framework centered
around five key initiatives of which the first two are consumer insight and customer focus. The

COURSE REP-P: RESEARCH REPORT STUDENT 70822344
85
company states that central to its strategy is recognizing that the consumer is at the
heart of the business and to deliver meaningful innovation and long term shareholder value, it
requires an intimate understanding of consumer needs (Rainbow Chicken, 2007). This shows the
company’s long term perspective and emphasizes that people and great brands are key enablers.
The strategy also explains how each of the three core brands are positioned, for example, for
Rainbow Chicken to become preferred choice by “taking ownership of all customer contact points”.
Here the emphasis is on channel distribution. Farmer Brown want to be the leader (“premium
choice in fresh and value added chicken” while Rainbow Food Solution aim at food service,
emphasizing quality and innovation. Clear positioning assists the company in focusing on the
unique value proposition for each of its brands.
One of Distell’s (2006) values for example is “customer service orientation”. The company has a
section in the annual report depicting “our brands at a glance”, they refer to themselves as “brand
crafters” and state “We create brands quite literally from the ground up… and shape into brands
that have become icons” (Distell, 2006:1). The performance of their leading brand (Amarula) is
shown per country. The report mentions the increase in awareness of the brand and improved
recognition. The improved presence and distribution channels of brand Savanna is highlighted and
mention of Africa’s sales volume being driven by key brand recognition is mentioned as well as
brand leaders and awards.
Dimension Data (2006:7) is a good example of marketing alignment with company’s business
strategy which links the four main areas of strategy to its clients. One of the four operational
strategies is “client experience”. The company states how its offering will assist the client and how it
has the potential to “build a stronger, long standing client relationship” Dimension Data (2006:7) by
the company becoming more engrained in a client’s business.
6.12.4 Chairperson’s Support
Leadership literature states that senior executives have much impact on the effectiveness of
an organisation (Yukl, 2006:380) and through their power and authority can influence attitude
and behaviour of people. The chairperson’s level of support towards marketing and
customers in annual reports gives a good indication of the importance a company places on
marketing and its customers. It can also give an indication whether marketing is aligned to
strategy as senior executives emphasise strategic as oppose to tactical issues.
Nearly half (47%) of chairperson’s reports (refer to table 5.29 and annexure 10) do not
mention or vaguely refer to marketing or customer. However, a third (33%) of chairpersons’
reports (rated level 4 and 5) supported marketing, outlined it well and gave it strategic
emphasis. None of the chairpersons’ reports quantify marketing assets or how the marketing
asset (brand equity) has changed compared to previous year, industry benchmark or
competitors (as suggested by Ambler,2003). However quantifying complex measures such as

COURSE REP-P: RESEARCH REPORT STUDENT 70822344
86
brand equity into one number can be misleading. The information provided in
annual reports is of a more descriptive nature.
As can be expected a strong correlation exists between marketing being strategically aligned
and mentioned in chairperson’s report. The companies where the chairperson emphasizes
the importance of the customer seem to be more market orientated and marketing tends to be
well aligned with the company’s business strategy. (This is confirmed by the high correlation
between strategy and brand equity). The higher rated companies also either have
implemented or are in the process of implementing a more customer orientated strategy.
Example: Rating Level 5
For example, Distell’s managing director report states that during the year under review the
company redesigned its operating system to “build a stronger marketing focus” (Distell, 2006:23),
establishing multi-functional teams which resulted in progress towards “a truly customer- and
consumer-orientated organization”. The company also states that to compete successfully globally
a strongly market-orientated approach which “places customer and consumer at centre of our
thinking” (Distell, 2006:25) is essential.
AVI’s (2006:7) chairperson comments that the company’s core strength is AVI’s brand
management and marketing expertise and the company’s aim is to “aggregate brand portfolio’s into
groupings where core skills, market instincts and business activities are as similar as possible”.
The chairperson’s report of a retail company (Ellerine, 2006) dedicates a full paragraph to the
customer and states “we are proud to have several generations of the same families [as
customers]” (Ellerine, 2006).
6.13 General Comments
Some general trends pertaining to annual results are briefly discussed below. These are selective
reporting, lack of knowledge on marketing, no uniform reporting standard, use of general
terminology and misuse of marketing terminology and raising problems without providing
suggestion of improvement.
6.13.1 Selective Reporting
The tendency for companies is to selectively report in annual reports on their brand performance or
market share growth or to report on results for certain divisions only. There sometimes is a lack of
uniformity in divisional reporting (for example Nedbank).
Companies rated highly in brand equity give reasons how sales growth is driven and some mention
all elements of the marketing mix including in-store-point of sale, store navigation, media mix,

COURSE REP-P: RESEARCH REPORT STUDENT 70822344
87
window display, quality of advertising (e.g. New Clicks Musica Brand). The tendency
was however, to highlight and give detailed examples of certain brands only.
Ambler (2003:34) suggests that multinational companies who have many brands, should divide the
whole organization into brand market units. The equity value of these larger brands (often 80% of
shareholder value comes from 20% of major brand market units), can be reflected individually,
whereas one brand equity value should be taken as an average of many smaller brands. It
therefore is possible for global companies to represent brand equity.
Example:
Distell (2006) for example highlights the international performance of one of its major brands
(Amarula) in value, volume, % of total exports and shows the same statistics for its wine (but not
brand specific) (Distell, 2006:8). The report states general highlights eg. “outperformed industry
growth rate of bottled wine exports” and mentions that 1 brand (Savanna) achieved new listing in
the UK” (Distell, 2006:8). This report also states sales revenue % increase in Rand value and %
increase in sales volume, locally, internationally and in Africa. Locally growth is compared to the
previous year and the report states that spirits and ready-to-drink performed better than its wine
category.
6.13.2 Lack of Knowledge on Marketing Concept
McDonald (2006:427) states that some companies have the tendency to equate the marketing
function as mainly being concerned with promotions and advertising. A few (three) companies in
this sample confirm this.
Example:
A financial company (Nedbank, 2006) seeks to mainly build its image via promotions and
advertising. The CEO report states that the company invested in a brand building campaign to
make the brand more accessible, aspirational and caring. The CEO states that “repositioning the
brand extends beyond just marketing and is part of the broader strategy that includes pricing,
distribution and product innovation” (Nedbank, 2006:36). However, the marketing mix and the 4 P’s
(product, price, place, promotion) form part of marketing. This shows that the understanding of the
marketing function is limited and confusion prevails between marketing function and marketing
concept.
6.13.3 Reporting Standard
Companies do not use a standard reporting format. In general, finding comprehensive information
in the annual reports pertaining to market strategy, the brand equity and customers is not easy
because the information is spread throughout the annual reports.

COURSE REP-P: RESEARCH REPORT STUDENT 70822344
88
Because brand equity does not constitute a uniform understanding, information is
made up of several elements and is made more difficult by companies having several brands in
various sectors and is especially complex with multinational companies operating in several
countries. This could lead to loss of information on behalf of the reader and makes comparison
between companies more difficult.
Example:
Distell (2006) in its social responsibility section for example states its advertising principles and
rules applying to promotional events in detail, “advertisements will be directed towards brand selling
with a view of establishing brand loyalty” (Distell, 2006:38).
6.13.4 Use of General Terminology
Generalization and vague statements are prevalent in many annual reports. For example, product
segment profitability is stated as “menswear continued to loose market share” and “toddler wear
has seen large volume growth” (Woolworths, 2006:37). Other examples include “fresh line produce
and bakery are major contributors to the company’s fresh offering” (Spar, 2006) and “exclusive
brands captured significant share of the categories in which they trade” (Spar, 2006:9). The term
“one of the leading brands” is a meaningless statement but is regularly used in annual reports.
The CEO of food processing and distribution company states that “average occupancy and activity
levels [in the commercial cold storage division] were good, mostly in poultry, fish, meat, vegetables
and fruit products” (Oceana, 2006:23) and “demand and prices were good” (Oceana, 2006:21) .
6.13.5 Misuse of Marketing Terminology
Companies rated overall brand level 1 (very poor) and level 2 (poor) at times used incorrect
terminology.
Examples:
“The group has positioned the hotels as conference facilities” (Gooderson, 2007:8) and made
vague and unsubstantiated statements such as “the hotel and leisure industry has shown immense
growth these last few years and we expect revenue to continue to increase in line with the growth
expectations of the economy” (Gooderson, 2007:13).
A CEO of a retailing company called the phrase LSM (lifestyle measure) “living standard measure”.
The same company mentioned “we endeavour to reach customers by continuously restocking with
new merchandise” but states in the next sentence that “turnover growth did not meet expectations”,
indicating that the company does not know its target market needs.
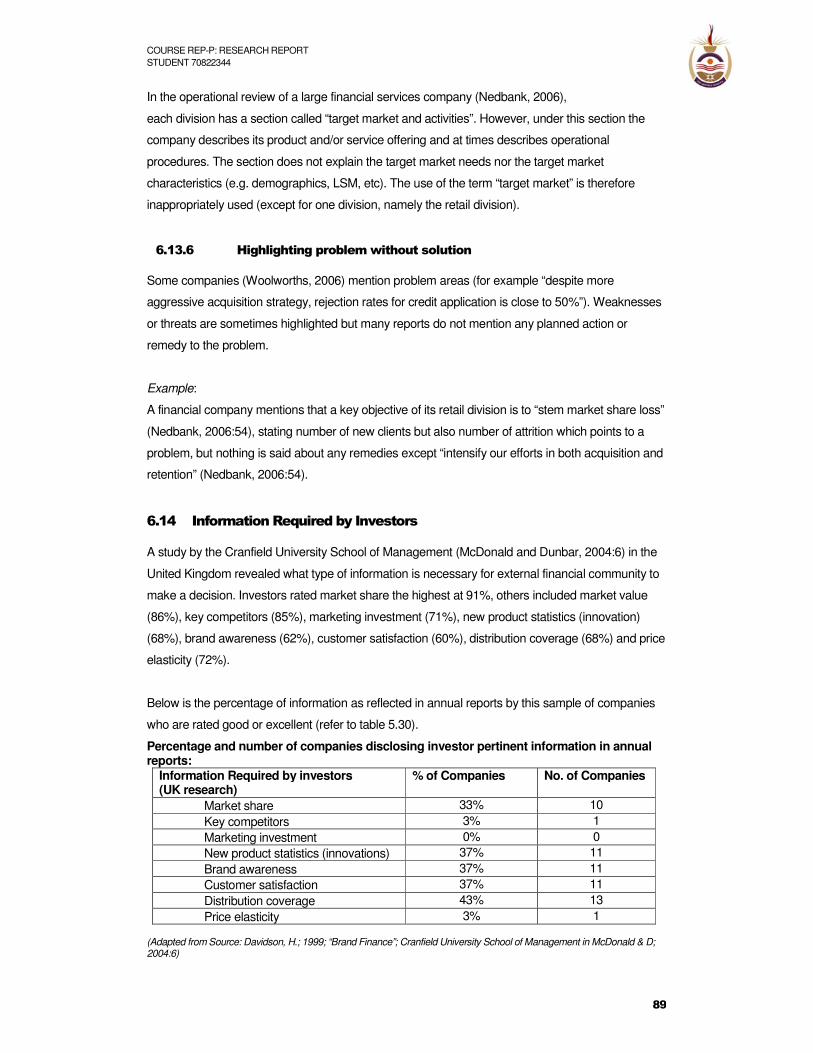
COURSE REP-P: RESEARCH REPORT STUDENT 70822344
89
In the operational review of a large financial services company (Nedbank, 2006),
each division has a section called “target market and activities”. However, under this section the
company describes its product and/or service offering and at times describes operational
procedures. The section does not explain the target market needs nor the target market
characteristics (e.g. demographics, LSM, etc). The use of the term “target market” is therefore
inappropriately used (except for one division, namely the retail division).
6.13.6 Highlighting problem without solution
Some companies (Woolworths, 2006) mention problem areas (for example “despite more
aggressive acquisition strategy, rejection rates for credit application is close to 50%”). Weaknesses
or threats are sometimes highlighted but many reports do not mention any planned action or
remedy to the problem.
Example:
A financial company mentions that a key objective of its retail division is to “stem market share loss”
(Nedbank, 2006:54), stating number of new clients but also number of attrition which points to a
problem, but nothing is said about any remedies except “intensify our efforts in both acquisition and
retention” (Nedbank, 2006:54).
6.14 Information Required by Investors
A study by the Cranfield University School of Management (McDonald and Dunbar, 2004:6) in the
United Kingdom revealed what type of information is necessary for external financial community to
make a decision. Investors rated market share the highest at 91%, others included market value
(86%), key competitors (85%), marketing investment (71%), new product statistics (innovation)
(68%), brand awareness (62%), customer satisfaction (60%), distribution coverage (68%) and price
elasticity (72%).
Below is the percentage of information as reflected in annual reports by this sample of companies
who are rated good or excellent (refer to table 5.30).
Percentage and number of companies disclosing investor pertinent information in annual reports:
Information Required by investors (UK research)
% of Companies
No. of Companies
Market share 33% 10 Key competitors 3% 1 Marketing investment 0% 0 New product statistics (innovations) 37% 11 Brand awareness 37% 11 Customer satisfaction 37% 11 Distribution coverage 43% 13 Price elasticity 3% 1 (Adapted from Source: Davidson, H.; 1999; “Brand Finance”; Cranfield University School of Management in McDonald & D; 2004:6)

COURSE REP-P: RESEARCH REPORT STUDENT 70822344
90
Despite 91% of investors in a United Kingdom survey (McDonald and Dunbar, 2004:6) wanting
information on market share, only a third of companies in this sample provided this information.
None reported on marketing investments and only 1 on competitors, both highly desired information
by investors. This research shows that the information deemed important by investors is at best
provided by 43% of companies and in the worst case (namely marketing investment) by none of
the companies. Information provided in annual reports is therefore insufficient for investors. Similar
findings pertaining to very little information displayed in annual reports of United Kingdom
companies have been found in the Cranfield University School of Management research
(McDonald and Dunbar, 2004:6).
Approximately 85% of UK companies (Ambler, 2003) agree that shareholders have the right to
information about brand equity which often is the company’s most valuable asset. However, only a
few companies display metrics to their shareholders. Of the UK sample 40% have up to five market
performance indicators but the average number is two indicators. Half of the companies in the UK
survey use sales volume, product distribution (availability) and new product launches within the
year as their only indicators (Ambler, 2003). This research of SA listed companies shows that sales
is obligatory and therefore stated by all companies. Information on distribution is stated well or very
well by 43% of the companies whereas new product launches by 37% of companies, which is
slightly lower than the UK sample.
6.15 Grand Total Maturity Model
On average 27% of UK’s top 1000 companies in 2004 are effective in using their annual reports as
key marketing documents, according to Corporate Mailing Matters research (Greenyer, 2006:240).
According to the research findings in this sample of companies listed on the JSE, 28% provide
good or very good information based on the grand total maturity score.
The findings (refer to table 5.32, figure 5.5 and figure 5.6) are based on 23 equally weighted
factors. These factors include all elements of brand equity, elements of segmentation, innovation,
competition and environmental and strategic factors. When combining all these elements into a
grand total score, it becomes evident that nearly two thirds of companies (61%) provide insufficient
information, while less than a third (28%) provide good or excellent marketing related information in
their annual reports (refer to table 5.32). The Research Strategy Management Inc. for the Public
Relations Society of America survey (2000) revealed that investors rated annual reports as the
most important source on which to base an investment decision. The results of this survey of
annual reports in SA listed companies shows a lack of information on marketing metrics and other
marketing related aspects and highlights the need for improved disclosure.
COURSE REP-P: RESEARCH REPORT STUDENT 70822344
91
Grand Total Maturity Level 1
More than one third (36%) of companies are rated at level 1 and obtain 33% or less for all the
marketing information provided in annual reports. This means that no or very poor information
pertaining to marketing was provided. These companies seems to be unaware of marketing as an
asset. Based on the very poor information provided in the annual report it can be deducted that
marketing does not receive formal attention by senior executives and in the company’s perspective
does not require mentioning in the annual report.
Grand Total Maturity Level 2
One quarter of companies (25%) achieved rating level 2, i.e. between 33% - 49% , providing
insufficient information. The information provided is poor with general or vague, unsubstantiated
statements. Marketing concepts and terminology is misunderstood and inappropriately used.
Grand Total Maturity Level 3
Eleven percent of companies achieved average rating at level 3, between 50% – 69%. These
companies provide some information with some explanation or substantiation and some
measurements exist, but most of the information and examples are used selectively, not providing
a general overview.
Grand Total Maturity Level 4
Just over one fifth (21%) of companies are rated level 4 for their grand total and obtaining between
70%-80%. These companies display a market focus. Good and relevant information is provided for
most of the 23 elements. Non-financial and quantitative measurements are both present.
Grand Total Maturity Level 5
Companies rated excellent (between 80% - 100%) at level 5 were only 7%. These companies
provide excellent information with substantial amount of information and detail, supported by
examples. Information is substantiated, scientifically analyzed and professionally presented.
6.16 Conclusion
The objective of marketing should be to increase long term cash flow because increase in cash
flow determines shareholder value (Doyle, 2000:257). The present value of cash flow is based on
the level of cash flow, its speed, duration and risk. By reading an annual report an investor should
be able to assess whether a company has an effective customer value proposition, whether the
brand is integrated into a business value chain, the brand’s attractiveness compared to competitors
and whether brand strategy is geared towards maximizing shareholder value, by for example, using
the optimal marketing mix to achieve maximum net present value of a brand’s future cash flow.
This research shows that the extent to which quantitative metrics and qualitative marketing
information disclosed in 2006/7 annual reports of companies listed on the JSE is not sufficient in

COURSE REP-P: RESEARCH REPORT STUDENT 70822344
92
giving an overview of marketing performance and therefore not sufficient for investors
to make a well informed investment decision.
It is worthwhile noting that the majority of companies (53% [refer to table 5.2] when taking the total
brand equity and 60% [refer to table 5.32] when taking the grand total maturity score into
consideration) provide insufficient information on marketing in their annual reports. This shows that
the majority of companies do not display marketing metrics and marketing information in a
meaningful and useful manner.
The majority of companies do not display quantitative metrics such as financial, brand equity, other
customer and competition metrics as suggested by Ambler (2003) and on which this research is
based. The vast majority of companies present no or very little information on segmentation as
suggested by McDonald and Dunbar (2004). More and better information is presented in annual
reports on innovation and environmental and strategic issues pertaining to marketing, with
environmental and strategic aspects taking a more narrative form. The tendency is for companies
to display more in-depth and better qualitative information than disclosing quantitative information in
their annual reports. Major differences by sectors are not prevalent (although the financial sector
performed the poorest) but more sector specific future research might be advisable to substantiate
conclusive findings.
Information pertaining to marketing investment, competition and segmentation has not been
mentioned by the vast majority of companies. Marketing investment is important in the creation of
long term gain such as stronger brand equity and enhanced customer loyalty. Knowledge on key
competitors should form part of the marketing function and is essential for industry analysis to
enable a company’s positioning and strategy. Segmentation forms an essential part of marketing as
relative attractiveness of target segments differ and companies should focus on segments which
are aligned to their corporate strategy and create optimal value to their company. By not providing
sufficient information pertaining to marketing investment, competition and segmentation in annual
reports, companies create the impression that management does not know how to measure these
aspects or does not value these aspects sufficiently to reflect upon them in annual reports. Not
providing sufficient information can also be interpreted as a lack of responsibility towards external
investors and stakeholders.
However, apart from marketing investment all other qualitative aspects analyzed in this research
are reported upon by some companies (for example one third of annual reports contain good or
excellent information on brand equity). Therefore, despite the challenges of reflecting marketing
metrics and marketing information, it is possible for companies in their annual reports to disclose
suitable marketing metrics and information.
COURSE REP-P: RESEARCH REPORT STUDENT 70822344
93
Shareholders should be viewed as customers and communications therefore plays
an important role. Communications and the message sent to shareholders should not differ from
the message sent to other stakeholders such as employees or consumers. Disclosing marketing
metrics forms part of professional marketing of the corporate brand to investors. Management can
build trust and build the corporate brand by displaying and sharing knowledge with shareholders on
marketing metrics (Ambler, 2003:217).
The understanding of the role and function of marketing and brand equity varies amongst corporate
companies as stated in the literature review. This is evident in some annual reports where a high
variance of scores amongst brand equity elements is apparent. Those companies that do not have
a good understanding of the role marketing can play and the importance of integrating the worth of
the brand into the whole organization, have displayed a sub-optimal brand structure and non-
alignment of strategic goals. This is supported by the high correlation between brand equity and
marketing alignment to strategy. A lack of marketing knowledge can result in a potential loss of
income. This could be a conclusion by the reader if companies do not reflect the marketing
information and explanations sufficiently in annual reports.
Those companies who have demonstrated a holistic approach and inclusion of the marketing
function in long term strategic goal setting, have created a good base for investor confidence. The
majority of annual reports however make it difficult for an investor to make an informed decision
because of the limited knowledge provided.
There seems to be some lack of understanding of the value in assessing or reporting on what
customers think, feel and customer loyalty and how marketing can add to the worth of an
organization. Brand familiarity or awareness presents the customer’s or target market’s knowledge
of the company giving an indication as to long term trends such as loyalty and purchase behaviour.
Penetration gives an indication whether a segment is growing or declining and good reputation and
high customer loyalty can provide a company with competitive advantages. All of these factors give
an indication as to the company’s future strategy, goals and growth potential, all of which are
important to investors’ long term interests. Despite these advantages, nearly two thirds of
companies (between 57% and 63%) report poorly on these elements of brand equity (refer to
tables 5.4 to 5.9).
Marketing can function as the link between understanding the consumer’s point of view and assist
with creating a consumer-first attitude. Marketing can assist with building up brand asset. Only by
consistently reporting on all brand equity elements can marketing become better understood,
adding to good corporate governance and providing the information necessary for good investment
decision.

COURSE REP-P: RESEARCH REPORT STUDENT 70822344
94
Annual reports should give some indication as to the future growth prospects and
strategy of a company to entice or inform investors and stakeholders. It is therefore advisable to
incorporate information on innovation, environmental and strategic aspects and their effect on
marketing.
Innovation can be the differentiating factor in creating competitive advantage for a company.
Ambler (2003:172) argues that innovation does not arise from the external market but is driven by
the company internally. Companies elaborating on their innovation capabilities in annual reports
demonstrate their commitment to continuous adaptation and change. Despite the importance
innovation can contribute to a company’s success, the results of this research show that only half of
the annual reports cover the topic ‘innovation’ and ‘initiatives’.
External factors influencing marketing trends and environmental influences on marketing
performance are highlighted by two thirds of annual reports. Key risk factors affecting marketing
and chairperson’s support for marketing or customers is addressed in just over half of the annual
reports, whereas nearly half of companies do not show any marketing alignment to strategy.
Marketing goals and strategy arise out of analysis of current business performance, market
attractiveness and competitive advantage (Best, 2005:339). Not disclosing marketing alignment to
corporate strategy can be an indication that marketing analysis (or business strategy analysis) is
not performed properly, which in the long term is likely to result in deterioration of business
performance.
Some general trends which become evident in annual reports are selective reporting on for
example certain segments or brands, no uniform reporting standard, lack of knowledge on
marketing, use of general terminology and misuse of marketing terminology and at times raising
problems without providing solutions. These trends encompass a wide spectrum of challenges
which cannot all be solved by improving on marketing information in annual reports, but some can
be avoided or limited.
The percentage of companies providing the required information in annual reports as stipulated by
investors varied from nil to 43% (refer to table 5.30). In other words, less than half of the listed
companies provide the information deemed necessary by investors to make an investment
decision. In this research marketing investment is not mentioned at all, whereas pricing and key
competitors are each only addressed by one company. Market share, innovation, brand awareness
and customer satisfaction is answered well or very well by less than 40% of annual reports
analyzed in this research. These results show a poor level of reporting in annual reports and
substantiate previous research by the Cranfield University School of Management (McDonald and
Dunbar, 2004:6) and others.

COURSE REP-P: RESEARCH REPORT STUDENT 70822344
95
The scoring as per the grand total maturity model shows that a third of companies
are at a very low maturity level 1, implying that no information is provided and companies are
unaware of marketing as an asset. More than one quarter of annual reports are rated at maturity
level 2, indicating insufficient information and tendency to generalize and to use vague statements.
On the other hand, one quarter of companies are rated at maturity level 4 and 5, providing good or
excellent information displaying a distinct market focus and providing substantiated qualitative and
quantitative information. Although the level is low of companies providing sufficient information in a
their annual reports on all 23 marketing aspects measured in this, these companies are from
various industry sectors which shows that it is possible for companies to progress to a higher level
and to display good marketing information, regardless of the industry sector.
Although more research needs to be done on correlation between market orientation, marketing
disclosure in annual reports and company performance, this research seems to indicate that the
more market oriented companies are, the more likely they are to disclose marketing information
and metrics and the more successful they seem to be.
Annual reports can become more valuable to investors, analysts, other stakeholders and ultimately
improve the company’s performance if companies disclose financial and non-financial marketing
measures and provide information on their brand, competitors, customers and marketing strategy in
a more in-depth, substantiated manner supported by a long term view.
6.17 Recommendations
Shareholders own the assets of a company and it is managements’ duty and responsibility to
protect and create shareholder wealth. The main recommendations pertain to improved disclosure
of marketing metrics and marketing aspects in annual reports. In summary, it is recommended to
develop and use a standard format. Some suggestions as to inclusion are made below. In addition
it is recommended for the JSE to revise and refine its reporting criteria in terms of a marketing
report. It is recommended for companies to assess their own level of maturity, to compile their own
reporting criteria in order to strive for a higher level of reporting maturity.
6.17.1 Disclosure of Marketing Metrics and Marketing Information
Marketing metrics and marketing information are key determinants of future cash flow and indicate
that management is monitoring, evaluating and managing the business. Companies are advised to
communicate their marketing approach and to use standard marketing metrics in annual reports.
These should include financial as well as non-financial performance measures and qualitative
information and pertain to strategic marketing goals, objectives, achievements and performances
(benchmarked against industry norm or competitor activity). All companies are advised to disclose

COURSE REP-P: RESEARCH REPORT STUDENT 70822344
96
information on their marketing investment, brand equity, competitors, customer
measurements and segmentation, innovation and environmental and strategic aspects.
Core marketing metrics should be reflected upon in annual reports (preferably with trends) and
supplemented by narrative explanation. It is suggested that some measurements should be
benchmarked against company specific criteria, benchmarked against industry norm or against key
competitors. Metrics should be consistent over time, highlight the trends and be auditable, i.e.
reliable and professionally sourced (Ambler, 2003:305). The aim should be for annual reports to
become more valuable and for companies to show an understanding of brand equity and other
marketing aspects and to take a more long term approach. Below are some suggestions for
inclusion in annual reports:
• Financial Aspects such as sales or profit growth should be compared with internal goals
and against external benchmarks (either industry norm or key competitors).
• Some indication should be given as to percentage of total investment into marketing and
possibly proportion of investment into certain aspects of marketing.
• By including and documenting brand equity aspects, companies can create a more
positive perception about their capabilities and growth prospects.
o Brand specific metrics include an indication of total brand equity. Companies
which have many brands can select the few major brands which constitute most
of the company’s profit and report on them individually while reporting on an
aggregate for the remaining smaller brands (Ambler, 2003:111).
o All elements of brand equity, namely awareness/familiarity, penetration,
reputation, customer satisfaction, customer loyalty and availability/distribution
channels, should be reported on for major brands or for the corporate brand as a
whole.
o It is recommended to give a brief outline of brand architecture and structure with
an explanation of how the brand fits into the company’s corporate strategy.
• It is strongly recommended to include a brief analysis of the competitive environment and
key competitors. This will give a better overview as to the company’s positioning and
competitive advantage. Examples of information for inclusion in annual reports can be
percentage of market share held by competitors, competitors’ brands and their message or
medium used or any major launches performed by competitors during the year under
review (Ambler, 2003).

COURSE REP-P: RESEARCH REPORT STUDENT 70822344
97
• Annual reports should give some indication as to company’s various customer segments
and possibly their attractiveness and trends in performance. This section could include
metrics on market share (in relation to total market size) and sales to new customers to
give an indication of growth prospects.
• Innovation is an indicator of how well a company adapts to change and should be
included, although its emphasis depends on the type of industry sector.
• It is recommended to include a section giving an overview of marketing strategy. This
section should include how environmental factors influence market trends and marketing
performance and what measures the company has taken or is taking in overcoming any
major challenges. In addition, this section should indicate how marketing is aligned to
corporate strategy and give an overview of marketing’s performance during the year under
review and an indication of marketing’s longer term vision and objectives.
• Marketing is defined in various ways and therefore annual reports include a marketing
glossary and marketing terminology index to create uniformity and a better understanding
of the marketing construct.
Many of the marketing metrics and aspects suited for publication in annual reports should already
be internally available (Ambler, 2003:307). Incorporating them into the annual reports should not
create excessive cost or effort. In addition to ensure commercial confidentiality company’s
management can with their auditors assess metrics for inclusion on an individual basis (Ambler,
2003:307).
6.17.3 Standard Reporting Format
Based on this sample of JSE listed companies no uniform standard format exists. It is
recommended that a standard reporting format be developed which includes qualitative and
quantitative criteria, as suggested above.
A standard format will improve communications and make it easier for investors and stakeholders
to find marketing information in annual reports.
A suggested format can be based on above recommendations or on existing guidelines such as
Ambler’s (2003). A more inclusive option is to compile a format with the assistance of, for example
Marketing Association of South Africa. Alternatively, the global reporting initiative guidelines (GRI)
which are endorsed by the United Nations and which provide an international framework for
information to stakeholders of a company on its economic, social and environmental performance
(i.e. the triple bottom line) can be reviewed to include more specific marketing related guidelines.

COURSE REP-P: RESEARCH REPORT STUDENT 70822344
98
6.17.2 JSE Reporting Criteria
It is recommended that all companies listed on the JSE should be obliged to report on specific
marketing items.
These could for example include information sought by investors (McDonald and Dunbar, 2004:6)
such as market share and market value, key competitors, marketing investment, new product
statistics (innovation), brand awareness, customer satisfaction, distribution coverage and price
elasticity. Alternatively, research pertaining to South Africa could establish a slightly different need
amongst investors on which these items should be based.
More stringent criteria in terms of marketing reporting should be made obligatory by the JSE for
listed companies. In particular, attention should be given to market share, marketing investment,
key competitors and customer measurements, whilst keeping cognizance of commercial
confidentiality.
It is suggested that marketing academics and professionals in South Africa compile suitable
measures appropriate to each industry sector to create better implementation and more uniformity.
6.17.5 Maturity Model
By taking the needs of the investor community into account and by identifying company specific
needs, companies can assess their current status in terms of the grand total maturity level as
reflected in their annual reports. Being aware of their current status and baseline can assist
companies in driving towards improved marketing knowledge disclosure and possibly higher level
of market orientation.
Properly reflecting marketing performance measures and strategic marketing factors in annual
reports will result in improved monitoring of performance, improved transparency and corporate
governance and better investor relations.

COURSE REP-P: RESEARCH REPORT STUDENT 70822344
99
CHAPTER 7: Abstract
Examining the use of marketing metrics in annual reports
of SA listed companies
Hilke Gartz and Prof. Peet Venter (SBL, University of South Africa, RSA)
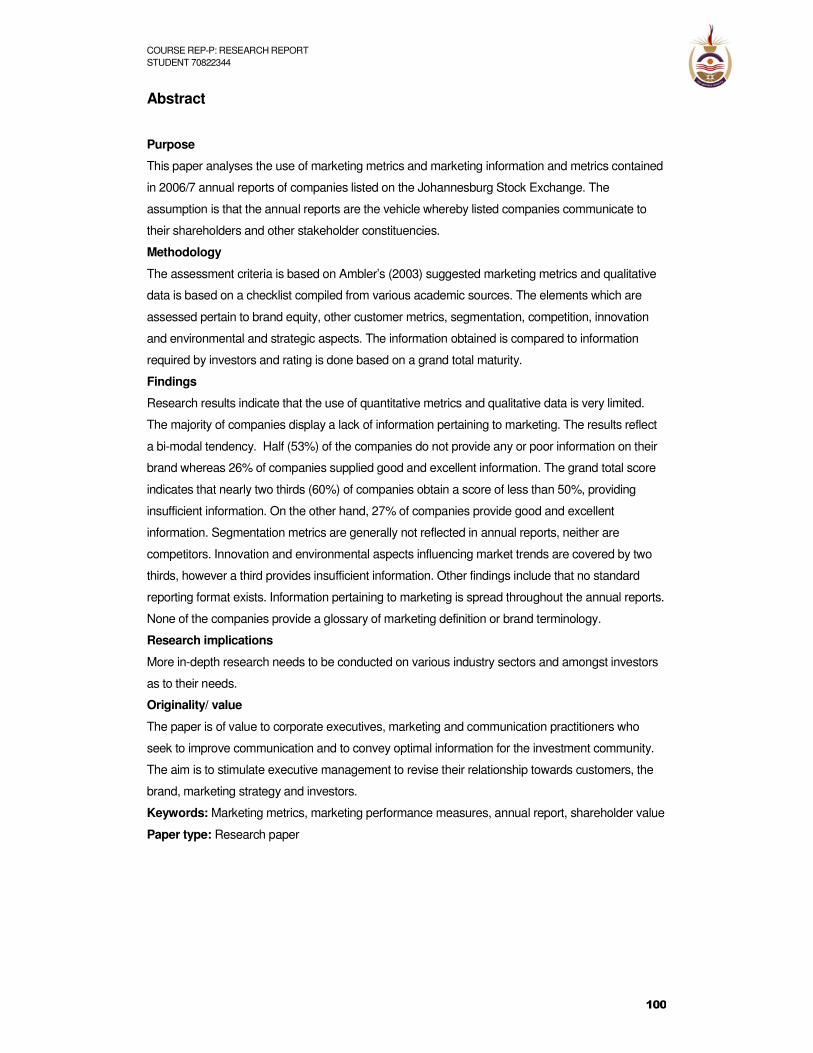
COURSE REP-P: RESEARCH REPORT STUDENT 70822344
100
Abstract
Purpose
This paper analyses the use of marketing metrics and marketing information and metrics contained
in 2006/7 annual reports of companies listed on the Johannesburg Stock Exchange. The
assumption is that the annual reports are the vehicle whereby listed companies communicate to
their shareholders and other stakeholder constituencies.
Methodology
The assessment criteria is based on Ambler’s (2003) suggested marketing metrics and qualitative
data is based on a checklist compiled from various academic sources. The elements which are
assessed pertain to brand equity, other customer metrics, segmentation, competition, innovation
and environmental and strategic aspects. The information obtained is compared to information
required by investors and rating is done based on a grand total maturity.
Findings
Research results indicate that the use of quantitative metrics and qualitative data is very limited.
The majority of companies display a lack of information pertaining to marketing. The results reflect
a bi-modal tendency. Half (53%) of the companies do not provide any or poor information on their
brand whereas 26% of companies supplied good and excellent information. The grand total score
indicates that nearly two thirds (60%) of companies obtain a score of less than 50%, providing
insufficient information. On the other hand, 27% of companies provide good and excellent
information. Segmentation metrics are generally not reflected in annual reports, neither are
competitors. Innovation and environmental aspects influencing market trends are covered by two
thirds, however a third provides insufficient information. Other findings include that no standard
reporting format exists. Information pertaining to marketing is spread throughout the annual reports.
None of the companies provide a glossary of marketing definition or brand terminology.
Research implications
More in-depth research needs to be conducted on various industry sectors and amongst investors
as to their needs.
Originality/ value
The paper is of value to corporate executives, marketing and communication practitioners who
seek to improve communication and to convey optimal information for the investment community.
The aim is to stimulate executive management to revise their relationship towards customers, the
brand, marketing strategy and investors.
Keywords: Marketing metrics, marketing performance measures, annual report, shareholder value
Paper type: Research paper

COURSE REP-P: RESEARCH REPORT STUDENT 70822344
101
Introduction In recent years the need to show what marketing contributes to business success has been raised
time and time again. The Marketing Science Institute has stated that marketing performance
measures (metrics) have for consecutive years in mid-2000 been identified as one of the top
priorities which need to be attended to (Ambler, 2003:xiii). Marketing is confronted with many
challenges and needs to be clarified. Marketing metrics can assist with achieving this. One way of
assessing a company’s perception of the importance of marketing, is to assess the marketing
content of publicly available documents such as annual reports.
Marketing’s traditional role has been that of the key enabler between the customer and the
company and annual reports are one of the key communication tools with investors and
stakeholders. To give the marketing function its due credit (and more importantly, allow it to play its
proper role), marketing has to become a strategic function which can be measured, researched
and developed. Traditional accounting methods, pressures from financial markets and senior
executive management’s performance drive have caused many companies to emphasize short
term outcomes. With a move towards more stringent corporate governance and increased
transparency the trend nowadays is to incorporate values of intangible assets and to take a more
long term view in establishing the worth of a company. Executives need to be well informed and
knowledgeable, thereby enabling good decision-making, while investors need to be assured that
management is monitoring, evaluating and managing the business as best as possible.
Shareholders need to base their decisions on facts and best practice and to have access to
information regarding their investment. Research suggests that companies and shareholders gain
from disclosing marketing related information in their annual reports.
Research (Ambler, 2002:48; McDonald and Dunbar, 2004:4; Greenyer, 2006:240) has shown that
little information on marketing is shown in annual reports and that more can be done. To make
good decisions, measures such as quantifying and assessing the value of marketing metrics are
necessary.
The main assumption of the study is that annual reports are seen as vehicles whereby listed
companies communicate with their stakeholder constituencies. The researcher hopes to stimulate
new ways of thinking about the importance of marketing metrics with a view to improving the
perception of the importance of the marketing function.
The primary objective of this research is to determine the quality and type of disclosure pertaining to
aspects of marketing and usage of marketing metrics in annual reports of companies listed on the
JSE.
COURSE REP-P: RESEARCH REPORT STUDENT 70822344
102
Assessment will be done by evaluating the quantitative aspects based on Ambler’s
(2003) suggested marketing metrics measurements and other measurements such as McDonald
and Dunbar’s (2004) segmentation analysis. Secondly, assessment of the qualitative criteria will be
based on the extent and quality of the marketing contents in annual reports. Aspects such as
brand, customers, competition, segmentation and strategic marketing information will be
addressed. Trends and general tendencies observed in annual reports will also be reported on.
The qualitative and quantitative aspects will be combined to result in a rating per company for total
brand equity and for a grand total score. This overall level of maturity as depicted in annual reports
will give an indication of the importance companies assign to marketing in their communication with
shareholders and whether sufficient marketing metrics and aspects are communicated for investor
and other external stakeholder purposes.
Literature Review The perception of the value which the marketing function can add to a company has seemingly
deteriorated in recent years. The approach of this research is to establish whether sufficient
information on marketing is provided in annual reports for investors and other stakeholders and to
highlight some of the challenges which need to be overcome. Suggestions are made as to what
type of marketing metrics to use in annual reports and which elements to use in evaluating brand
equity and other marketing measures.
Annual reports are one of the main showcase communication tools for stakeholders. Assessing the
amount and content of marketing related aspects in annual reports can be seen as a reflection of
the marketing maturity of South African listed companies. The aim is to get a better understanding
of the importance companies place on marketing in their annual reports, to highlight marketing
aspects which lack information and to recommend areas of improvement.
The Origins of Marketing
Traditional marketing tools originated in the 1960’s and had a more strategic approach. Limited
understanding and application by marketers led to inappropriate use of tools, particularly the sole
emphasis on the 4 P’s (Grönroos, 1994:5). The result is that marketing decisions are taken on an
operational level, thereby emphasizing short term results and taking a transactional, short term
focus rather than incorporating long term goals which emphasizes sustainable business growth.
Role and Status of Marketing
There seems to be a lack of understanding of what constitutes marketing and its importance to
contribution to the success of an organization. The role and status of marketing has diminished in
many companies (Brown, 2005). In contrast, creating and delivering value to customers is seen as

COURSE REP-P: RESEARCH REPORT STUDENT 70822344
103
one of the top business priorities (Brown, 2005). There are several reasons, some of
which are mentioned below, which have led to the marketing discipline not delivering its full
potential.
The American Marketing Association (2007) defines marketing as “a process of planning and
executing the conception, pricing, promotion and distribution of ideas, goods and services to create
exchange and satisfy individual and organisational objectives”. However, there is a lack of
understanding of what marketing entails. Key responsibilities of marketers vary, depending on the
company. Some marketers are accountable for profits, product specification, pricing and sales
while others have been downgraded to a sales support function in charge of advertising and
promotions (McDonald, 2003). Strategically important aspects of marketing such as price, new
product decision, advertising budgeting have been taken over by other functions in an organisation
(Sheth and Sisodia, 2005).
The traditional style where push model characterized marketing (between 1950 to 2000) is moving
towards trust-based marketing (Sheth and Sisodia, 2005:11) where companies work closely with
customers and stakeholders to enhance their success. The implication is for companies to form a
closer collaboration with customers and stakeholders, and annual reports are one of the main
communication points.
Strategic and tactical marketing tools have been available for more than 40 years (Baker and Holt,
2004:561), but have at times not been employed by corporate companies. Customer key account
profitability for example states that marketing spend should focus on profitable customer segments,
but knowledge of real profitability remains low (Denison and McDonald, 1995:18).
In South Africa approximately R18 billion was spent on above the line media during the year ending
in June 2006 according to ACNielsen’s Adex (Sinclaire, 2007:25). International guidelines state that
about a third of total marketing investments are used for above the line exposure. This would
translate to marketing professionals in South Africa spending about R55 billion which constitutes
4,5% of its gross domestic product (Sinclair, 2007). Marketing expenditure is therefore substantial
and executives query whether their companies receive value for their money from their marketing
initiatives.
The general consensus is that marketing is difficult to measure. According to Sinclair (2007) and
other academics (McDonald, 2006; Ambler; 2003) it is possible to place a value on the output of
marketing activity such as increased distribution, improved brand awareness and strengthening the
key attributes in relation to competitors. When data such as market share, penetration, retention
ratios or awareness is properly collected and analyzed it is measurable and reliable (Ambler; 2003).
Reporting on marketing metrics will achieve a better understanding of why and how the business
works (Ambler, 2003:142) and functions as a measure of control.

COURSE REP-P: RESEARCH REPORT STUDENT 70822344
104
For marketing performance to be seen as a leading discipline in corporate companies (on pr with
other main functions such as finance) and to be recorded accordingly in annual reports, marketing
metrics and marketing information need to be consistently applied. To do so we need to understand
some of the challenges.
Accounting Regulations
Countries differ in their regulations and approach as to what needs to be included in the balance
sheet. Canadian and British accounting regulations suggest that annual reports should not only
reflect historical perspectives but also express to shareholders prospective analysis and
expectations of the future.
Brands are defined as assets according to the new International Financial Accounting Standards
(IFRS), but do not have to be displayed on the balance sheet. The Accounting Standards Board in
the UK published new guidelines in 2003 for the “Operating and Financial Review” section(s) of
company annual reports (Ambler, 2003:209) and recommend that shareholders should be informed
about marketing investment and particularly brand equity.
Marketing experts such as McDonald and Ambler believe that quantifying for example brand equity
into traditional financial data is not sufficient and a different approach is necessary to make sense.
The balance sheet in the annual report is not the only part providing information necessary for
shareholders to take a decision. The other parts in the annual report such as chairman’s and chief
executive reports, operational review and sustainability reports can play a major role in giving more
in-depth understanding of the company’s activities and future prospects.
The Role of Annual Reports
A corporate annual report is the main statement reflecting a company’s financial reporting system.
Annual reports are seen as a “barometer of a company’s fortune and future” and not as purely
financial reports (Greenyer, 2006:240) and its purpose is to communicate information to
shareholders and other interested parties. Shareholders own the assets of a company and it is
managements’ duty and responsibility to report on, protect and create shareholder wealth.
According to the American Institute of Certified Public Accountings’ Special Committee on Financial
Reporting (Ho and Wong, 2004:62) effective functioning of capital markets depends on effective
information sharing amongst companies, securities analysts and shareholders. Improvements in
information sharing should increase management’s credibility, analyst’s understanding of a
company, investor’s confidence and patience and potentially shareholder value (Ho and Wong,
2004:69).

COURSE REP-P: RESEARCH REPORT STUDENT 70822344
105
“Financial reports need to take on the role of marketing documents” (Greenyer,
2006:240), especially considering the trend of growing number of small shareholders and
shareholders increasingly being customers of a company (Greenyer, 2006:240). In order to reflect
these marketing messages, data-driven marketing is becoming necessary.
Research on Annual Reports
On average 27% of UK’s top 1000 companies in 2004 are effective in using their annual reports as
key marketing documents, according to Corporate Mailing Matters research (Greenyer, 2006).
According to a survey by Research Strategy Management Inc. for the Public Relations Society of
America (2000) investors rated annual reports as the most important source on which to base an
investment decision.
On behalf of the Centre for Business Performance the Institute of Chartered Accountants in
England and Wales researched annual reports and surveyed executives of 350 FTSE companies
in 2002. Results show that low levels of reporting on intangible assets occurred and only limited
reasons were provided (Ambler, 2002). According to this research many annual reports give
general information on brands and marketing but marketing metrics (quantitative measures
normally viewed internally) are not regularly and consistently reported upon (Ambler, 2002:48).
Despite the poor disclosure on marketing, most executives agreed that more marketing information
could be given and 85% of executives agreed that shareholders were ”entitled” to be informed
about a company’s main assets which includes brand equity. Analysts questioned also agreed that
more information on market and brand equity should prevail in annual reports.
The research showed that the most admired companies were those displaying the most marketing
information. In addition, the research showed that analysts confirmed that companies who
consistently disclosed marketing related information were outperforming the FTSE index. From the
shareholders point of view disclosure meant that management saw a professional understanding of
the market as important (Ambler, 2002:48), thereby increasing transparency.
Disclosure
There is a debate on how much of the market metrics should be revealed in public available
documents such as annual reports. Arguments against divulging marketing information are
competitive confidentiality, potential misuse by the press, different disclosure rules per country and
multinational companies disclosing too detailed information for example on segmentation and
customer metrics. Research (Ambler, 2003:211) amongst UK companies shows that although
confidentiality was the reason for not disclosing market statistics, the majority of companies
acknowledged that the competitors already had the information. Commercial confidentiality can be
a real concern and Ambler (2003:254) suggests that companies could review disclosure on a
metric-by-metric basis with auditors. Marketing metrics and marketing information are key

COURSE REP-P: RESEARCH REPORT STUDENT 70822344
106
determinants of future cash flow. Showing key metrics shows that management is
monitoring, evaluating and managing the business.
Corporate Governance
Corporate governance issues causing the demise of companies such as Enron and WorldCom
have increased the pressure for companies to reflect more accurately the state of the company,
improved accountability and transparency. Disclosing a cross-section of professionally gathered
marketing metrics will add to transparency (Ambler, 2003). Companies with superior information
transparency signal better corporate governance (Chiang and Chia, 2005:95). Other arguments for
disclosing market information are achieving shareholder and investor respect, thereby leading to
higher share prices and improved investor relations. (Ambler, 2003:214).
Creation of Shareholder Value
Approximately 60% of shareholder value resided in intangible assets (Sampson, 2007:29).
Excluding brand value can lead to the worth of companies not reflected fairly. In addition, brands
are resources that can generate future economic benefit for a company (Sinclair, 2007:26). A
strong brand can be a competitive advantage and can for example result in negotiating lower
distribution costs. It is likely that 80% of the shareholder value comes from approximately 20% of
brand market units (Ambler, 2003:35). Therefore managing brand equity and reflecting this in
annual reports is a crucial as it transfers value from the market to the shareholder.
Understanding a brand as a financial asset and key driver of shareholder value is gaining in
importance. The current trend is to acknowledge and increasingly incorporate the worth of
intangible assets. 70% of company value is linked to intangible assets, the largest being the brand
(Henderson, 2004:6). One key indicator of a company’s performance on the stock market should
be the strength of a brand (Henderson, 2004:6). Companies with strong brands consistently
outperform their main stock market indices while companies with weak brands underperform. This
is according to worldwide research, including stocks of S&P 500, Fortune 100 and FTSE 100
(Henderson, 2004:6). Disclosing market information can achieve shareholder and investor respect,
resulting in higher share prices and improved investor relations. Kirschenheiter’s (1997) research
results show that the more information about share values such as a well known brand was
available, the more positive it impacted on share prices despite the balance sheet not showing this.
In addition, in their research Bowd and Bowd (2002) showed that reputation can be attributed to a
large degree to market valuation (i.e. share price).
In capital markets success is measured in terms of shareholder added value. Strong brands result
in greater returns for shareholders while doing so at a lower risk level (Madden, Fehle and Fournier,
2006:224). Research by Madden et al (2006:225) correlated stock prices and brand value and
showed that changes in brand equity are associated with changes in the value of a company.
Strong brands result in a performance advantage i.e. create shareholder value by achieving higher
returns relative to the relevant market benchmark. Studies conducted by Interbrand ‘most valued

COURSE REP-P: RESEARCH REPORT STUDENT 70822344
107
brands’ in 1995/6 showed that a positive relationship between financial brand value
and market-to-book value ratios existed (Madden et al., 2006:225). Further studies in 1998 showed
that brand values are significantly and positively related to stock prices and returns and a study in
1993 showed that brand equity made up a large component (15%) of the replacement value of a
company. Another study by Conchar, Crask, Zinkhan in 2005 (Madden et al., 2006:227) showed a
significant positive relationship between a company’s advertising and promotional spend and the
market value of the company, therefore giving support to the brand-building activities and financial
performance of a company. The empirical study conducted by Aaker and Jacobsen (1994) showed
that brands create shareholder value. However, creating shareholder value is not only created
through higher stock returns or better market capitalization, but only if company’s returns are higher
in comparison to other investment opportunities, taking risk into account (Madden et al., 2006:231).
Approximately 85% of UK companies agreed that shareholders had the right to information about
brand equity which often was the company’s most valuable asset. However, only a few companies
displayed metrics to their shareholders. 40% of the sample had up to five market performance
indicators but the average number was two indicators. Half of the companies surveyed used sales
volume, product distribution (availability) and new product launches within the year as their only
indicators (Ambler, 2003).
A company’s financial performance cannot be property evaluated without considering brand equity
(Ambler, 2002:47). Brand equity often is the main reason for a company’s market capitalisation
exceeding its book value (Ambler, 2002:47). However, the move is away from a single measure to
incorporate different aspects of a brand and market performance. This is known as marketing
metrics which should be reported to shareholders in order for them to understand where the cash is
coming from. Ambler (2002:47) states that the issue about a brand is not merely whether it should
appear on the balance sheet but to inform shareholders about the condition of assets and what the
company is doing to build them. Shareholders are entitled to know how their company approaches
the creation and management of cash flow (Ambler, 2002:47).
Challenges to overcome
Very little marketing information is reported in annual reports (McDonald & Dunbar, 2004:4).
Ambler’s (2003:307) recommendations based on the research suggested that companies and
shareholders would gain from reporting on marketing performance and brand equity in their annual
reports.
Some of the challenges according to Webster (2005:6) are that there are few incentives for
executives to move away from the transaction based generally accepted accounting principles and
securities regulations which often ignore to support customers’ interests.

COURSE REP-P: RESEARCH REPORT STUDENT 70822344
108
Non-financial Information & Terminology
This necessitates non-financial information, for example behavioural (consumer loyalty and market
penetration) and cognitive information (people’s attitudes and awareness) to be gathered and
reflected in annual reports. In addition marketing practitioners need to understand and apply
financial terms, whereas executives need to understand what marketing entails and how it can be
measured. A mutual understanding needs to be created as to the company’s definition of brand
equity, understanding, valuation and agreement on usage of marketing metrics and their reflection
in annual reports.
Long term perspective
Investment guru, Warren Buffet, judges a business amongst others according to attractiveness of
its long-term prospects and the firm's capacity to create value. Executives need to take a long term
view and not only focus on short term gains.
Customer Orientation
Experts state that marketing indicators need to be more closely aligned to customers and
competitors. Cash comes from customers (Ambler, 2003:23) but often companies do not know their
segment’s profitability and future intentions, according to Cranfield University School of
Management study of 500 leading European companies (McDonald and Dunbar, 2004:4). Senior
UK managers give nine times more attention to spending and counting cash flow than figuring out
where it comes from or how to increase it (Ambler, 2003:1). Customer orientation and
innovativeness is central to long term success of a company.
Segmentation
Although the cost of dealing with a customer determines profitability, the Cranfield University
School of Management study of 500 leading European companies has shown that very few
organizations measure segment or customer profitability (McDonald and Dunbar, 2004:4). The
annual report should give an indication of management’s understanding of and importance placed
on customers.
Measuring Marketing’s Performance
Madden et al (2006:224) point out the different schools of thought pertaining to functional areas of
finance and marketing, resulting in different tools for marketing performance measures. These
include Srivastava’s marketing based asset model, the discounted cash flow method, Kaplan and
Norton’s balanced scorecard, the Scandia navigator and economic value added (EVA) approach.
EVA focuses on better financial performance measures while tehbalanced Scorecard highlights the
importance of including non-financial measures, emphasizing longer term measures such as
customer satisfaction and defection rates and employee satisfaction.
COURSE REP-P: RESEARCH REPORT STUDENT 70822344
109
Marketing based Asset Model
Srivastava et al (1998:8) developed a framework for assessing the impact of marketing on
shareholder value by using market based assets. These assets (e.g. customers, channels, partner
relationships) improve shareholder value by accelerating and improving cash flow, lowering
vulnerability and volatility (i.e. risk) of cash flow and increasing residual value. Marketing
professionals therefore need to measure and demonstrate their value creation of future
performance. To grow shareholder value a company must grow and refine its customer base, focus
on longer term customer relationships and loyalty. This will result in more stable business and
therefore lower cost of capital, culminating in shareholder value.
Balanced Scorecard
Kaplan and Norton’s balanced scorecard takes a holistic view and increased cross-functionality by
integrating four perspectives, namely financial, customer, internal business and innovation/ learning
(Yeniyurt, 2003:136). The scorecard assists management by translating the vision, communicating
the strategy and linking it to departmental and individual objectives, assisting with the planning
function and providing feedback measures. Ambler (2003) has used the same principles to refine
measurements specifically aimed at the marketing function.
Scandia Navigator
The Scandia navigator was developed to incorporate the worth of intangible assets, namely
intellectual capital. It also places value in its measurement on the human perspective emphasizing
employees’ satisfaction (Yeniyurt, 2003:136). Ambler (2003:177) emphasizes employees as an
integral part of internal communication and suggests ways of measuring these. However, Ambler
does not focus on measuring knowledge or intellectual capital, but emphasizes the importance of
measuring “innovation” which can be seen as part of the learning and knowledge process.
McDonald’s Model
McDonald (2006:428) proposes a model that incorporates marketing as a function for strategy
development as well as for tactical sales delivery. He proposes three levels of measurements.
Level one, the most important, defines the markets and understands its value. Level two and three
focus on the measurement of marketing metrics.
Discounted Cash Flow
Strong brands, customer awareness, market share and satisfied customers are “not goals in their
own right but means to create shareholder value” (Doyle, 2001:21). Brands need to create
shareholder value by maximizing the discounted value of future cash flows (Doyle, 2001:29).
Creation of value depends on a company’s strategy and on the economics of the markets in which
these companies operate. Marketing, however, does play a key role in driving shareholder value,
but financial concepts have to be understood. The present value of a brand’s future cash flow is a
function of and should result in an increase in cash flow, in the speed of the cash flow as well as
COURSE REP-P: RESEARCH REPORT STUDENT 70822344
110
extended duration of cash flow or reduction in risk of cash flow (Doyle, 2001:26). If
this does not occur, managers should not focus on the brand. Not understanding shareholder value
can lead to inappropriate allocation of resources preventing a company to find new more profitable
markets. However, brands have to be invested in.
Measuring Brand Equity
Brands have different meanings and can be interpreted as their value to the customer, value to the
company or value in terms of competitive advantage (Ambler, 2003:42). Experts (McDonald &
Dunbar 2004; Ambler, 2003) believe that quantifying for example brand equity into traditional
financial data is not sufficient. Brand equity is a long term performance indicator and adjustment
need to be made when using the measure in the short term. If marketing is seen as an investment,
then this should be measured and reflected in an increase or decrease of brand equity. Brand
valuation should be assessed according to their worth, but should not be the sole measurement of
brand equity. The assessment needs to include non-financial drivers, take account of changing
influences. Measures should be related to benchmarks or norms and expressed in relative terms to
competing alternatives (Ambler, 2003:29; Uncles, 2005:414) and an explanation should be
provided on how for example brand loyalty is calculated as it can be ambiguous otherwise.
Uncles (2005:414) points out that deciding on which metrics to use can be contentious. Allio
(2006:255) suggests to use a small set of critical multidimensional metrics which are aligned to
company strategy and which convey more than simple budgetary indications. Davis (2002:355)
suggests the use of a brand asset management model and that brand metrics should be based on
SMART, namely strategic alignment, must be market driven (understanding the cause of measure
through “the market’s eyes not company’s internal lens”), give guidance as to action required,
repeatable and consistent and have touch points covering customer experience. Brand metrics
should be presented in quantitative and qualitative format. Performance measurement systems
according to Yeniyurt (2003:138) should focus on value creation process and the measurement
system should involve five perspectives, namely financial, customer, internal processes, innovation
and organisational culture and climate, especially in multinational companies. Including
organization culture and climate in the measurement framework will complement forward-looking
measures. Uncles (2005:416) points out that marketers should not loose their creativity. Metrics
should nurture innovation and entrepreneurial spirit (Uncles, 2005:417) and people skills should not
be ignored, despite difficulties in measuring them. The notion of measuring innovation and various
aspects relating to employees is also strongly supported by Ambler (2003:177).
Internal Marketing
The two main internal indicators of marketing performance according to Ambler (2003) are
innovation and employees and should be included in marketing metrics. Innovation is not driven by
the external market but arises from within the company. Strategic leadership is necessary as
culture and processes are only the enablers (Ambler; 2003:154). Creating a corporate brand
requires a holistic approach. The external and internal reputations of a brand are inextricably linked
COURSE REP-P: RESEARCH REPORT STUDENT 70822344
111
because customers form their impression from interaction with employees (Ambler;
2003). Sustainable advantage can be obtained through excellence of execution as this is where
contact with the customer occurs and not through its strategy (Brown; 2005). This leads to the need
of internal marketing and empowering people in the organization who are in direct contact with
customers.
Performance Measure Characteristics
Before applying any measures, the company needs to have clearly defined its brand positioning,
target markets and segments. Performance can be assessed in terms of comparing current
achievement against previously determined internal goals (namely the baseline), against external
benchmarks such as market indicators and competitors (taking adjustments into account) (Ambler;
2003:26). Instead of reporting in absolute numbers, companies should consider reporting in relative
prices to their competitors. Metrics should provide direction in line with company strategy while
enabling control. Metrics need to add information and very volatile or static metrics should be
excluded. Metrics need to be prioritized and the sector that matters most gets preference. Metrics
should provide usable information which is of value to the organization. The measures should not
only predict success but should also point out potential problems. Companies should spend less
time planning and rather compare planned with actual metrics and analyzing the differences
(Ambler; 2003:29).
Ambler (2003) suggests that companies should state the usual three financial measures (sales,
cost, profit) with six general brand equity measures, adding approximately twelve tailored corporate
specific metrics to the measurement. This enables industry comparison while retaining company
specific performance measures.
Implementation of Metrics
Successful implementation of professional marketing metrics can be enhanced if an audit is
conducted to assess the stage of market orientation within the organization and its current use of
metrics. In order to choose metrics, candidate metrics need to be compiled and verified. Preference
of these reporting units should be given to the value they add to shareholders. The major units
need to be reported on individually while minor ones are averaged. For marketing to be perceived
as playing a central role in an organization, it must integrate across specialized silos within
marketing and across functional business units and other managerial disciplines in order to
leverage from synergies, to provide value to the customer (Brown, 2005) and to report on metrics.
Consistency in measuring is essential, otherwise it looses its meaning (Ambler; 2003:123). Ideally
marketing should be represented on board level and to inform the board annually or bi-annually on
key marketing performance metrics. This gives an opportunity for assessing shareholder needs
and improving relations. The traditional way of budgeting according to historical expenditure is not
necessarily optimal, depending on the strategic aim. The company needs to look at strategic

COURSE REP-P: RESEARCH REPORT STUDENT 70822344
112
alternatives and their outcomes in combination with financial evaluation. The levels of
expenditure necessary to achieve higher income need to be assessed, aligned and correctly
allocated.
Methodology
To achieve the objectives of this study 2006/7 annual reports are analyzed from a cross-sectional
sample of 30 companies listed on the Johannesburg Stock Exchange (JSE). The sample
constitutes 7% of the population of 455 companies. The main sectors include retail, food and
beverage, financial services and media, although samples from technology and
telecommunications, travel and leisure, chemicals and construction are also present.
Quantitative and qualitative data is analyzed via content analysis assessing all the sections of the
annual report, including chairpersons and chief executive officer’s report, operational review,
sustainability report and other sections. The data is evaluated based on a checklist. Each element
on the checklist is allocated a mark according to a five point rating scale (ranging from level 1 very
poor to level 5 excellent). In addition general trends are noted with examples as reference. The
quantitative checklist is based on Ambler’s (2003) suggested marketing metrics which are based on
guidelines drawn up by Accounting Standards Board in London in 2002. The qualitative data is
compiled from various academic sources.
In addition, the information obtained is compared to information required by investors and to arrive
at a grand total maturity model. A total rating score per company is obtained by summing up all the
23 elements assessed in this analysis to arrive at a grand total maturity model. The five levels of the
model assist with depicting the overall information on marketing metrics and marketing information
contained in annual reports of JSE listed companies.
The brand equity elements which are assessed pertain to familiarity/ awareness, penetration,
reputation, customer satisfaction, customer loyalty, availability/ distribution channel. Further aspects
(each with their own elements) which are assessed are other customer metrics, segmentation,
competition, innovation and environmental and strategic aspects. Other customer metrics refer to
market share or market presence, relative price or pricing strategy and sales to new customers.
Segmentation elements are based on McDonald and Dunbar (2004) and include % of profits in
total market produced by segment, ratio of profit produced by segment to weight of segment in total
population, % defection rate and customer retention rate by market segment, extent to which
profitability of top ten customers are known and reflected. Environmental and strategic aspects
assess whether external factors influencing marketing trends are discussed and whether risk
factors influencing cash flow are mentioned. Other aspects include whether key marketing
performance indicators are stipulated and aligned to company strategy, whether the chairman’s
review supports marketing and quantifies the main marketing assets.

COURSE REP-P: RESEARCH REPORT STUDENT 70822344
113
Research Results
The trend appears to be that the majority of companies supply very limited information on
marketing metrics and marketing information.
The quantitative information in general is not answered well, with none of the companies
mentioning marketing investment.
The research findings of this sample of JSE listed companies show a bi-modular tendency
pertaining to brand equity metrics. The results on overall brand equity show that half (53%) of the
companies do not provide any or poor information on their brand and customer attitudes and
feelings towards it. However, 26% of companies supplied good and excellent information.
The findings for elements of brand equity are as follows: The majority of companies reported poorly
on brand familiarity (63%), penetration (57%) and reputation (57%) and customer loyalty (60%).
Slightly improved results are obtained for customer satisfaction where nearly half of the companies
(47%) provide good or excellent information. The aspect of availability is answered by more than
half of the companies (56%).
When comparing sectors the food, media and retail perform similarly, although results show that
the financial sector performs worse than the technology sector.
Nearly a quarter of the companies (23%) provided good information on overall market share or
presence, whereas only three (10%) companies provide information on pricing and only five (17%)
provide information on sales to new customers.
Segmentation metrics are generally not reflected in annual reports.
The vast majority of companies (93%) do not mention competitors. Only 2 companies (7%) refer to
their competitors.
Half of the companies provide information on aspects pertaining to innovation, although the vast
majority (90%) do not show revenue gained due to launches during the past year.
Environmental aspects influencing market trends are covered by two thirds of the sample, however
a third of the sample does not provide information or only insufficiently. However, when referring
specifically to risk factors influencing cash flow or market segments, companies perform less well
with nearly half (49%) not providing any or insufficient information. A bipolar tendency is evident
when assessing whether marketing is stipulated and aligned to strategy. Eleven companies (38%)
did not provide any information as opposed to eleven companies (38%) which gave excellent
information and where alignment between strategy and marketing was evident. Similar results are
COURSE REP-P: RESEARCH REPORT STUDENT 70822344
114
obtained when reviewing whether the chairperson’s report mentions aspects
pertaining to marketing. The findings show that there is a direct correlation between strategy and
brand equity.
Other findings include that no standard reporting format exists. Information pertaining to marketing
is spread throughout the annual reports. None of the companies provide a glossary of marketing
definition or brand terminology.
When comparing these research results to information required by investors, this study shows that
sometimes none of the companies provide information whereas at best only one third of the
companies provide the relevant information necessary for investors to make a good investment
decision.
When combining all the marketing related elements (financial, brand equity, other customer and
segmentation metrics, competitors, innovation and aspects pertaining to environmental and
strategic aspects) analyzed in this research and summing them up into a grand total score, it
becomes evident that nearly two thirds (60%) of companies obtain a score of less than 50%, in
other words providing insufficient information. On the other hand, 27% of companies provide good
and excellent information.
Conclusion and Implications The objective of marketing should be to increase long term cash flow because increase in cash
flow determines shareholder value (Doyle, 2000:257). The present value of cash flow is based on
the level of cash flow, its speed, duration and risk. By reading an annual report an investor should
be able to assess whether a company has an effective customer value proposition, whether the
brand is integrated into a business value chain, the brand’s attractiveness compared to competitors
and whether brand strategy is geared towards maximizing shareholder value, by for example, using
the optimal marketing mix to achieve maximum net present value of a brand’s future cash flow.
This research shows that the extent to which quantitative metrics and qualitative marketing
information disclosed in annual reports of companies listed on the JSE during 2006/7 is not
sufficient in giving an overview of marketing performance and therefore not sufficient for investors to
make a well informed investment decision.
The majority of companies do not display quantitative metrics such as financial, brand equity, other
customer and competition metrics as suggested by Ambler (2003) and on which this research is
based. The vast majority of companies present no or very little information on segmentation as
suggested by McDonald and Dunbar (2004). More and better information is presented in annual
reports on innovation and environmental and strategic issues pertaining to marketing, with
environmental and strategic aspects taking a more narrative form. The tendency is for companies

COURSE REP-P: RESEARCH REPORT STUDENT 70822344
115
to display more in-depth and better qualitative information than disclosing quantitative
information in their annual reports. Major differences by sectors are not prevalent but more sector
specific future research might be advisable to substantiate conclusive findings.
It is worthwhile noting that the majority of companies (53% when taking the total brand equity and
60% when taking the grand total maturity score into consideration) provide insufficient information
on marketing in their annual reports. This shows that the majority of companies do not display
marketing metrics and marketing information in a meaningful and useful manner.
Information pertaining to marketing investment, competition and segmentation has not been
reported on by the vast majority of companies. Marketing investment is important in the creation of
long term gain such as stronger brand equity and enhanced customer loyalty. Knowledge on key
competitors should form part of the marketing function and is essential for industry analysis to
enable a company’s positioning and strategy. Segmentation forms an essential part of marketing as
relative attractiveness of target segments differ and companies should focus on segments which
are aligned to their corporate strategy. By not providing sufficient information pertaining to
marketing investment, competition and segmentation in annual reports, companies create the
impression that management does not know how to measure these aspects or does not value
these aspects sufficiently to reflect upon them in annual reports. Not providing sufficient information
can also be interpreted as a lack of responsibility towards external investors and stakeholders.
However, apart from marketing investment all other qualitative aspects analyzed in this research
are reported upon by some companies (for example one third of annual reports contain good or
excellent information on brand equity). Therefore, despite the challenges of reflecting marketing
metrics and marketing information, it is possible for companies in their annual reports to disclose
suitable marketing metrics and information.
Shareholders should be viewed as customers and communications therefore plays an important
role. Communications and the message sent to shareholders should not differ from the message
sent to other stakeholders such as employees or consumers. Disclosing marketing metrics forms
part of professional marketing of the corporate brand to investors. Management can build trust and
build the corporate brand by displaying and sharing knowledge with shareholders on marketing
metrics (Ambler, 2003:217).
The understanding of the role and function of marketing and brand equity varies amongst corporate
companies. This is evident in some annual reports where a high variance of scores amongst brand
equity elements is apparent. Those companies that do not have a good understanding of the role
marketing can play and the importance of integrating the worth of the brand into the whole
organization, have displayed a sub-optimal brand structure and non-alignment of strategic goals.
This is supported by the high correlation between brand equity and marketing alignment to strategy.
COURSE REP-P: RESEARCH REPORT STUDENT 70822344
116
A lack of marketing knowledge can result in a potential loss of income. This could be
a conclusion by the reader if companies do not reflect the marketing information and explanations
sufficiently in annual reports.
Those companies which have demonstrated a holistic approach and inclusion of the marketing
function in long term strategic goal setting, have created a good base for investor confidence. The
majority of annual reports however make it difficult for an investor to make an informed decision
because of the limited knowledge provided.
There seems to be some lack of understanding of the value in assessing or reporting on what
customers think, feel and customer loyalty and how marketing can add to the worth of an
organization. Brand familiarity or awareness presents the customer’s or target market’s knowledge
of the company giving an indication as to long term trends such as loyalty and purchase behaviour.
Penetration gives an indication whether a segment is growing or declining and good reputation and
high customer loyalty can provide a company with competitive advantages. All of these factors give
an indication as to the company’s future strategy, goals and growth potential, all of which are
important to investors’ long term interests. Despite these advantages, nearly two thirds of
companies (between 57% and 63%) report poorly on these elements of brand equity. Other
customer metrics such as price elasticity or pricing and sales to new customers is not mentioned by
the vast majority of companies, despite sales to new customers being a direct indication of growth
achievements during the past year.
Marketing can function as the link between understanding the consumer’s point of view and assist
with creating a consumer-first attitude. Marketing can assist with building up brand asset. Only by
consistently reporting on all brand equity elements can marketing become better understood,
adding to good corporate governance and providing the information necessary for good investment
decision.
Annual reports should give some indication as to the future growth prospects and strategy of a
company to entice or inform investors and stakeholders. It is therefore advisable to incorporate
information on innovation, environmental and strategic aspects and their effect on marketing.
Innovation can be the differentiating factor in creating competitive advantage for a company.
Ambler (2003:172) argues that innovation does not arise from the external market but is driven by
the company internally. Companies elaborating on their innovation capabilities in annual reports
demonstrate their commitment to continuous adaptation and change. Despite the importance
innovation can contribute to a company’s success, the results of this research show that only half of
the annual reports cover the topic ‘innovation’ and ‘initiatives’.

COURSE REP-P: RESEARCH REPORT STUDENT 70822344
117
External factors influencing marketing trends and environmental influences on
marketing performance are highlighted by two thirds of annual reports. Key risk factors affecting to
marketing and chairperson’s support for marketing or customers is addressed in just over half of
the annual reports, whereas nearly half of companies do not show any marketing alignment to
strategy. Marketing goals and strategy arises out of analysis of current business performance,
market attractiveness and competitive advantage (Best, 2005:339). Not disclosing marketing
alignment to corporate strategy can be an indication that marketing analysis (or business strategy
analysis) is not performed properly, which in the long term is likely to result in deterioration of
business performance.
Some general trends which become evident in annual reports are selective reporting on for
example certain segments or brands, no uniform reporting standard, lack of knowledge on
marketing, use of general terminology and misuse of marketing terminology and at times raising
problems without providing solutions. These trends encompass a wide spectrum of challenges
which cannot all be solved by improving on marketing information in annual reports.
The percentage of companies providing the required information in annual reports as stipulated by
investors varied from nil to 43%. In other words, less than half of the listed companies provide the
information deemed necessary by investors to make an investment decision. In this research
marketing investment is not mentioned at all, whereas pricing and key competitors are each only
addressed by one company. Market share, innovation, brand awareness and customer satisfaction
is answered well or very well by less than 40% of annual reports analyzed in this research. These
results show a poor level of reporting in annual reports and substantiate previous research by the
Cranfield University School of Management (McDonald and Dunbar, 2004:6) and others.
The scoring as per the grand total maturity model shows that a third of companies are at a very low
maturity level 1, implying that no information is provided and companies are unaware of marketing
as an asset. More than one quarter of annual reports are rated at maturity level 2, indicating use of
generalization and vague statements and at times misuse of marketing concept and terminology.
On the other hand, one quarter of companies are rated at maturity level 4 and 5, providing good or
excellent information displaying a distinct market focus and providing substantiated qualitative and
quantitative information. Although the level of companies providing sufficient information on all
marketing aspects measured in this research in their annual reports is low, these companies are
from various industry sectors which shows that it is possible for companies to progress to a higher
level and to display good marketing information in annual reports.
Annual reports can become more valuable to investors, analysts, other stakeholders and ultimately
the company’s performance if companies disclose financial and non-financial marketing measures
and providing information on their brand, competitors, customers and marketing strategy in a more
in-depth, substantiated and long term view.

COURSE REP-P: RESEARCH REPORT STUDENT 70822344
118
Recommendation
Shareholders own the assets of a company and it is managements’ duty and responsibility to
protect and create shareholder wealth. The main recommendations pertain to improved disclosure
of marketing metrics and marketing aspects in annual reports. These are as follows:
Companies are advised to communicate their marketing approach and to use standard marketing
metrics in annual reports. These should include financial as well as non-financial performance
measures and qualitative information. Companies are advised to disclose information on their
marketing investment, brand equity, competitors, customer measurements and segmentation,
innovation and environmental and strategic aspects and to report on them in the following manner:
• Financial Aspects such as sales or profit growth should be compared with internal goals
and against external benchmarks (either industry norm or key competitors).
• Some indication should be given as to percentage of total investment into marketing.
• By including and documenting brand equity aspects, companies can create a more
positive perception about their capabilities and growth prospects. Total brand equity and
brand equity elements should be reflected as well as brand architecture and structure.
• It is strongly recommended to include a brief analysis of the competitive environment and
key competitors.
• Annual reports should give some indication as to company’s various customer segments.
• It is recommended to include a section giving an overview of marketing strategy.
• Marketing is defined in various ways and therefore annual reports should include a
marketing glossary and marketing terminology index to create uniformity and a better
understanding of the marketing construct.
In addition it is recommended that a standard reporting format be developed to improve
communications and to make it easier for investors and stakeholders to find marketing information
in annual reports.
It is also recommended that all companies listed on the JSE should be obliged to report on specific
marketing items. These could for example include information sought by investors.

COURSE REP-P: RESEARCH REPORT STUDENT 70822344
119
Finally, companies can assess their current status in terms of the grand total maturity
level as reflected in their annual reports. Being aware of their current status and baseline can assist
companies in driving towards improved marketing knowledge disclosure.
Properly reflecting marketing performance measures and strategic marketing factors in annual
reports will result in improved monitoring of performance, improved transparency and corporate
governance and better investor relations.
References
Articles Allio, M. 2006. ‘Metrics that matter: seven guidelines for better performance
measurement’, Handbook of Business Strategy, 7(1): 255-263 Ambler, T.2002. ‘Market metrics: what should we tell the shareholders’, Balance Sheet,
10(1):47-50 Baker, S and Holt S. 2004. “Making marketers accountable: a failure of marketing
education?”Marketing Intelligence & Planning, 22( 5): 557 – 567 Brown, SW. 2005. ‘When Executives Speak, We Should Listen and Act Differently’ in
Marketing Renaissance: Opportunities and Imperatives for Improving Marketing Thought, Practice, and Infrastructure. Journal of Marketing, American Marketing Association, 69 (Oct) :1-4
Doyle P. 2001. ‘Building value-based branding strategies’. Journal of Strategic
Marketing, 9: 255-268 Doyle, P. 2001. ‘Shareholder-value-based brand strategies’, Brand Management,
9(1): 20-30 Doyle, P.2000. ‘Valuing marketing’s contribution’, European Management Journal,
18(3): 233-245 Greenyer, A. 2006. ‘Measurable marketing: a review of developments in marketing’s
measurability’, Journal of Business & Industrial Marketing, 21(4): 239-242 Grönroos, C. 1994. ‘From Marketing Mix to Relationship Marketing: Towards a
Paradigm Shift in Marketing’, Management Decision, 32(2): 5-9 Henderson, L.. 2004. ‘For what it’s worth What’s in a name?’ Financial Times, Feb.(3): 6 Ho, S.S.M. and Wong K.S. 2004. ‘Investment analysts’ usage and perceived usefulness
of corporate annual reports’, Corporate Ownership & Control, 1(3): 61-69 Jenkins M, McDonald M, 1997. ‘Market segmentation: organizational archetypes and
research agendas’. European Journal of Marketing, 31(1): 17-32 Madden, T.J., Fehle F. and Fournier, S. 2006. ‘Brands Matter: An empirical demonstration of the creation of shareholder value through branding’ Journal of the Academy of Marketing Science, 34(2): 224-235 McDonald M. 2006. ‘How to get marketing back in the boardroom’. Marketing
Intelligence & Planning, 24(5): 426 -431

COURSE REP-P: RESEARCH REPORT STUDENT 70822344
120
Sampson, J. 2007. ‘Play by global rules’. Journal of Marketing (South Africa),
Feb/Mar:28-29 Sheth, J.N. and Sisodia R.S. 2005. ‘Does Marketing Need Reform’ in Marketing
Renaissance: Opportunities and Imperatives for Improving Marketing Thought, Practice, and Infrastructure. Journal of Marketing, American Marketing Association, 69(Oct): 10-12 Sinclair, R. 2007. ‘Risk Taking’. Journal of Marketing (South Africa), Feb/Mar: 24-26 Srivastava, R.K., Shervani, T.A.and Fahey, L.. 1998. ‘Market-based Assets and
shareholder value: a framework for analysis’, Journal of Marketing, 62(1): 2-18 Uncles, M. 2005. ‘Marketing metrics: A can of worms or the path to
enlightenment?’Brand Management, 12(6): 412-418 Webster, F.E. 2005. ‘Back to the Future: Integrating Marketing as Tactics, Strategy, and
Organizational Culture’ in Marketing Renaissance: Opportunities and Imperatives for Improving Marketing Thought, Practice, and Infrastructure. Journal of Marketing, American Marketing Association, 69(Oct): 4-6
Yeniyurt, S. 2003. ‘A literature review and integrative performance measurement
framework for multinational companies’, Marketing Intelligence & Planning, 31(3):134 -142 Books Ambler, T. 2003. Marketing and the Bottom Line the marketing metrics to pump up cash
flow (Second edition). Prentice Hall. Best, R.J. 2005. Market-based Management Strategies for Growing Customer Value and
Profitability .(Fourth Edition). Pearson Prentice Hall McDonald, M and Dunbar, IK. 2004. Market Segmentation: How to do it How to profit
from it. Elsevier Butterworth Heinemann Websites American Marketing As
COURSE REP-P: RESEARCH REPORT STUDENT 70822344
121
References
Articles Allio, M. 2006. ‘Metrics that matter: seven guidelines for better performance measurement’,
Handbook of Business Strategy, 7(1): 255-263 Ambler, T.2002. ‘Market metrics: what should we tell the shareholders’, Balance Sheet ,
10(1):47-50 Baker, S and Holt S. 2004. “Making marketers accountable: a failure of marketing education?”
Marketing Intelligence & Planning, 22( 5): 557 – 567 Brown, SW. 2005. ‘When Executives Speak, We Should Listen and Act Differently’ in Marketing
Renaissance: Opportunities and Imperatives for Improving Marketing Thought, Practice, and Infrastructure. Journal of Marketing, American Marketing Association, 69 (Oct) :1-4
Chiang, H. and Chia F. 2005. ‘An empirical study of corporate governance and corporate
performance’, The Journal of American Academy of Business, 6(1) :95-101 Denison, T and McDonald M. 1995. ‘The role of marketing past, present and future’. Journal of
Marketing Science, 1(1) :54-72 Doyle P. 2001. ‘Building value-based branding strategies’. Journal of Strategic Marketing,
9: 255-268 Doyle, P. 2001. ‘Shareholder-value-based brand strategies’, Brand Management, 9(1): 20-30 Doyle, P.2000. ‘Valuing marketing’s contribution’, European Management Journal, 18(3): 233-245 Gordon, R.M. 2001. ‘Value based marketing: Marketing strategies for corporate growth and
shareholder value’ by Doyle P, 2000, John Wiley & Sons, Marketing Management, 10(2): 53
Greenyer, A. 2006. ‘Measurable marketing: a review of developments in marketing’s
measurability’, Journal of Business & Industrial Marketing, 21(4): 239-242 Grönroos, C. 1994. ‘From Marketing Mix to Relationship Marketing: Towards a Paradigm Shift in
Marketing’, Management Decision, 32(2): 5-9 Hall, R. 2002. ‘Marketing’s new role in financial reporting’, ABA Bank Marketing, 34(3): 13 Henderson, L.. 2004. ‘For what it’s worth What’s in a name?’ Financial Times, Feb.(3): 6 Ho, S.S.M., and Wong K.S. 2004. ‘Investment analysts’ usage and perceived usefulness of
corporate annual reports’, Corporate Ownership & Control, 1(3): 61-69 Jenkins M, McDonald M, 1997. ‘Market segmentation: organizational archetypes and research
agendas’. European Journal of Marketing, 31(1): 17-32 Kerin R.A. 2005. ‘Strategic Marketing and the CMO’ in Marketing Renaissance: Opportunities and
Imperatives for Improving Marketing Thought, Practice, and Infrastructure. Journal of Marketing, American Marketing Association, 69 (Oct): 12-14
Lajili, K, Zeghal, D. 2005. ‘A content analysis of risk management disclosures in Canadian annual
reports’, Canadian Journal of Administrative Sciences, 22(2): 125-142

COURSE REP-P: RESEARCH REPORT STUDENT 70822344
122
Luo, X. and Donthu N. 2006. ‘Marketing’s credibility: a longitudinal investigation of marketing communication productivity and shareholder value’, Journal of Marketing, 70(4)
Madden, T.J., Fehle F. and Fournier, S. 2006. ‘Brands Matter: An empirical demonstration of the
creation of shareholder value through branding’ Journal of the Academy of Marketing Science, 34(2): 224-235
McDonald M. 2006. ‘How to get marketing back in the boardroom’. Marketing Intelligence &
Planning, 24(5): 426 -431 McDonald, M., de Chernatony, L and Harris, F. 2001.’Corporate Marketing and Service Brands:
Moving beyond the fast-moving consumer goods model’. European Journal of Marketing. 35(3/4): 335-352
MacInnes D.J. 2005. ‘Them Versus Us: Woes in the Bifurcation of the Academic Marketing
Discipline’ in Marketing Renaissance: Opportunities and Imperatives for Improving Marketing Thought, Practice, and Infrastructure. Journal of Marketing, American Marketing Association, 69(Oct): 14-16
Narver, J.C. and Slater S.F. 1990. ‘The Effect of a Market Orientation on Business Profitability’.
Journal of Marketing, Oct Oosthuizen, T. 2007. ‘Meet the marketer’. Journal of Marketing (South Africa), Feb/Mar Parvinen, P., Tikkanen, H. and Aspara J. 2007. ‘Corporate strategic marketing: a new task to the
top’. Business Strategy Series, 8(2):132-141 Sampson, J. 2007. ‘Play by global rules’. Journal of Marketing (South Africa), Feb/Mar: 28-29 Sheth, J.N. and Sisodia R.S. 2005. ‘Does Marketing Need Reform’ in Marketing Renaissance:
Opportunities and Imperatives for Improving Marketing Thought, Practice, and Infrastructure. Journal of Marketing, American Marketing Association, 69(Oct): 10-12
Sinclair, R. 2007. ‘Risk Taking’. Journal of Marketing (South Africa), Feb/Mar: 24-26 Srivastava, R.K., Shervani, T.A.and Fahey, L.. 1998. ‘Market-based Assets and shareholder value: a framework for analysis’, Journal of Marketing, 62(1): 2-18 Investor Relations Business.2000.’Annuals Remain Top Info Source: Investors rate annual over
financial media or analysts reports’, Investor Relations Business, 3:1 Uncles, M. 2005. ‘Marketing metrics: A can of worms or the path to enlightenment?’Brand
Management, 12(6): 412-418 Weerawardena, J. 2003. ‘The role of marketing capability in innovation-based competitive strategy’
Journal of Strategic Marketing, 11(1): 15-35 Webster, F.E. 2005. ‘Back to the Future: Integrating Marketing as Tactics, Strategy, and
Organizational Culture’ in Marketing Renaissance: Opportunities and Imperatives for Improving Marketing Thought, Practice, and Infrastructure. Journal of Marketing, American Marketing Association, 69(Oct): 4-6
Yeniyurt, S. 2003. ‘A literature review and integrative performance measurement framework for
multinational companies’, Marketing Intelligence & Planning, 31(3):134 -142 Zinkhan, G.M. and Verbrugge, J.A. 2000. ‘The marketing and finance interface: two divergent and
complementary views of the firm’, Journal of Business Research, 50(2):143-148

COURSE REP-P: RESEARCH REPORT STUDENT 70822344
123
Books Ambler, T. 2003. Marketing and the Bottom Line the marketing metrics to pump up cash flow
(Second edition). Prentice Hall. Bender, R. and Ward, K.. 2002. Corporate Financial Strategy. (Second Edition). Butterworth-
Heinemann Best, R.J. 2005. Market-based Management Strategies for Growing Customer Value and
Profitability .(Fourth Edition). Pearson Prentice Hall Brigham, E.F. and Ehrhardt, M.C. 2005. Financial Management: Theory and Practice (International
Student Edition).South Western Thompson Corporation Grant, R.2005. Contemporary Strategy Analysis (Fifth Edition). Blackwell Publishing McDonald, M and Dunbar, IK. 2004. Market Segmentation: How to do it How to profit from it.
Elsevier Butterworth Heinemann Yukl, G.; 2006. Leadership in Organizations. (Sixth Edition). Pearson Prentice Hall Conference Notes McDonald, M. 2007. ‘Getting Marketing back into the Boardroom’. National Marketing Conference:
Marketing in Crisis – the debate begins. March 14, Johannesburg, RSA.
Websites American Marketing Association; 2007.
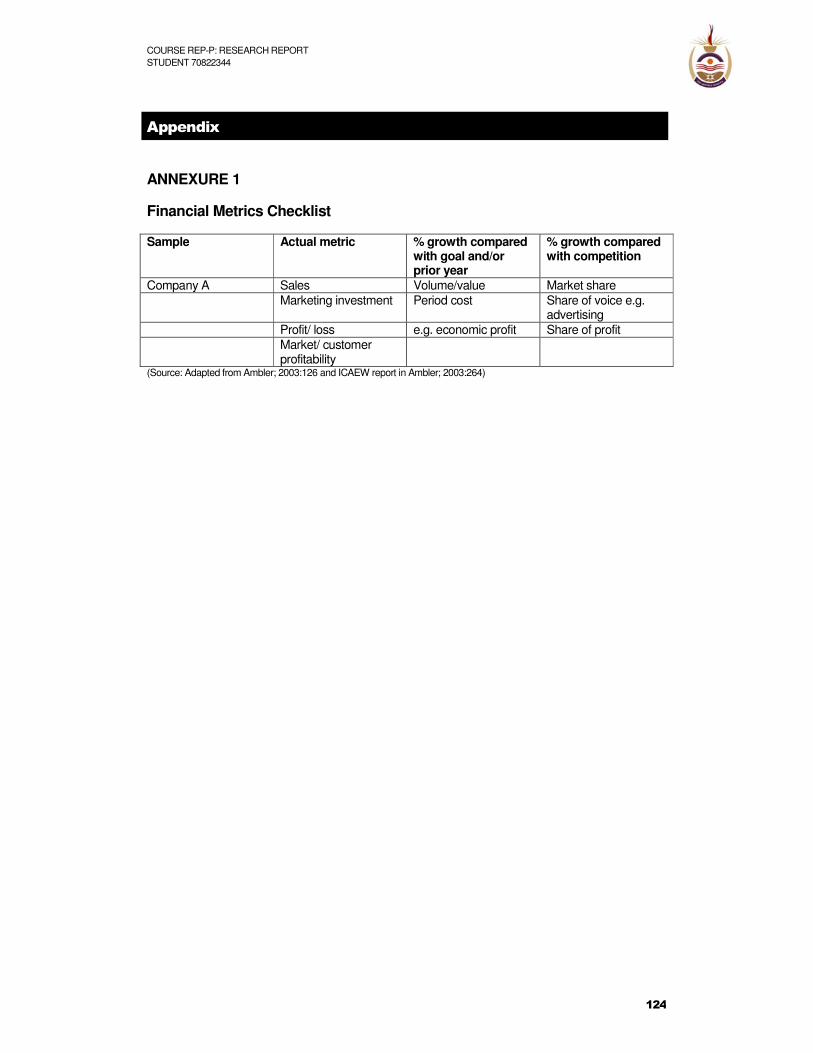
COURSE REP-P: RESEARCH REPORT STUDENT 70822344
124
Appendix
ANNEXURE 1
Financial Metrics Checklist Sample Actual metric % growth compared
with goal and/or prior year
% growth compared with competition
Company A Sales Volume/value Market share Marketing investment Period cost Share of voice e.g.
advertising Profit/ loss e.g. economic profit Share of profit Market/ customer
profitability
(Source: Adapted from Ambler; 2003:126 and ICAEW report in Ambler; 2003:264)

COURSE REP-P: RESEARCH REPORT STUDENT 70822344
125
ANNEXURE 2 General Marketing Metrics Checklist (Adapted from Source: Ambler; 2003:136, and ICAEW report (Ambler;2003:264) and Payne, A (1999) in McDonald & Dunbar; 2004:6) )
Source Brand Equity Metric
Measured by
1. Ambler, T Degree of familiarity
Salience, i.e. familiarity to other brands in the consideration set
2. Ambler, T Penetration
Number of customers or number of active customers as % of intended market ; What customer groups/ segments make up sales
3. Ambler, T What customers think about brand (degree of image/reputation)
Brand preference as a % of preference of other brands within the consideration set or intention to buy or brand knowledge
4. Ambler, T What customers feel about brand (audience perception/ customer satisfaction)
Customer satisfaction as % average for the consideration set
5. Ambler, T Customer loyalty and retention
This may be behavioural (Share of category requirements, repeat buying, retention, churn) and/or intermediate (commitment, engagement or bonding)
6. Ambler, T Availability/ distribution channel
Distribution, e.g. weighted percentage of retail outlets carrying the brand
Other Customer Metrics
Ambler, T Market share/ market presence Ambler, T Relative Price Ambler, T Sales to new customers
Customer Segmentation Metrics
Payne, A. % of market represented by segment
Payne, A. % of all profits in total market produced by segment
Payne, A. Ratio of profit produced by segment to weight of segment in total population
Payne, A. Defection rate (%) Cranfield
University Customer retention rate by market segment
Actual/ potential customer or segment/ customer lifetime value/ Top 10 customers known
Innovation Metrics
Ambler, T Number of initiatives in process

COURSE REP-P: RESEARCH REPORT STUDENT 70822344
126
Ambler, T Number of innovations launched
Ambler, T % revenue due to launches during last three years
Competitors
Are key competitors mentioned Is the % of market share of
competitor mentioned
Are the brands of competitors mentioned
What message and/or medium do the competitors use
Are the number of launches by competitor mentioned
External / Internal Factors
Are current external factors influencing the market trend mentioned?
Are the environmental influences on performance measures discussed?
What are the key risk factors influencing cash flow/ Is the risk assessment performed for each segment
Are the marketing performance indicators stipulated and aligned with company strategy milestones?
Does the chairman’s report involve quantified review of the main marketing assets and how it has changed?
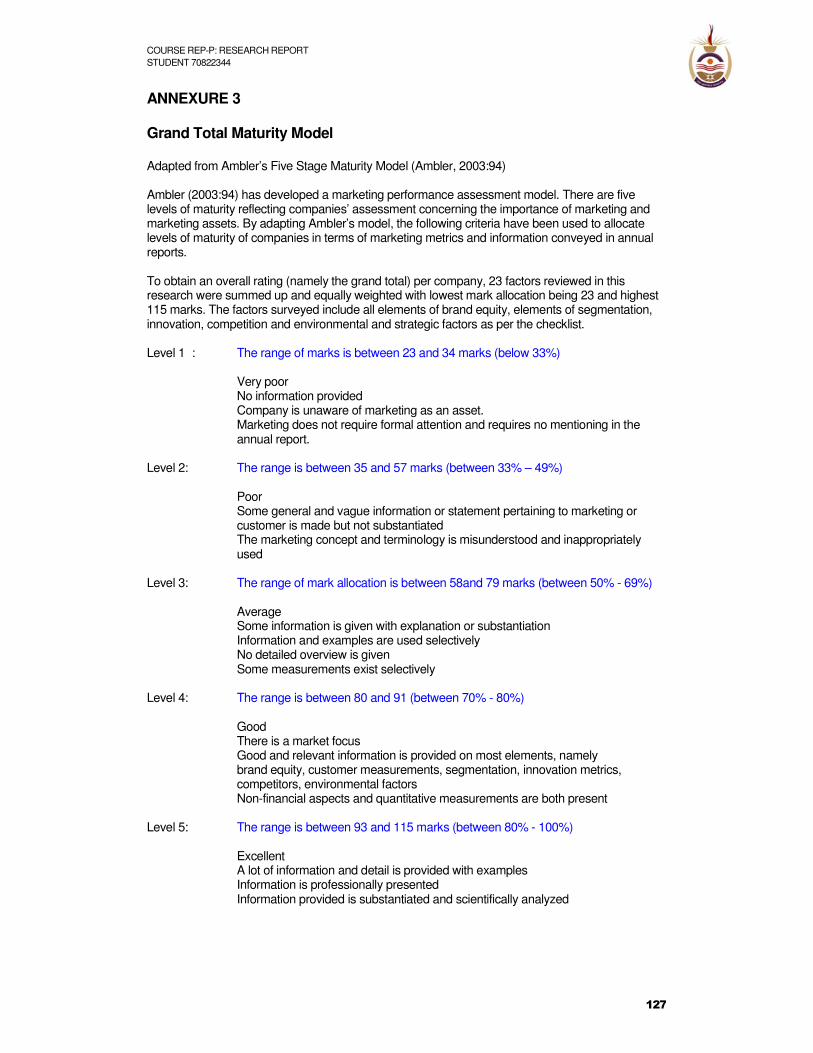
COURSE REP-P: RESEARCH REPORT STUDENT 70822344
127
ANNEXURE 3 Grand Total Maturity Model Adapted from Ambler’s Five Stage Maturity Model (Ambler, 2003:94) Ambler (2003:94) has developed a marketing performance assessment model. There are five levels of maturity reflecting companies’ assessment concerning the importance of marketing and marketing assets. By adapting Ambler’s model, the following criteria have been used to allocate levels of maturity of companies in terms of marketing metrics and information conveyed in annual reports. To obtain an overall rating (namely the grand total) per company, 23 factors reviewed in this research were summed up and equally weighted with lowest mark allocation being 23 and highest 115 marks. The factors surveyed include all elements of brand equity, elements of segmentation, innovation, competition and environmental and strategic factors as per the checklist. Level 1 : The range of marks is between 23 and 34 marks (below 33%)
Very poor No information provided Company is unaware of marketing as an asset. Marketing does not require formal attention and requires no mentioning in the annual report.
Level 2: The range is between 35 and 57 marks (between 33% – 49%)
Poor Some general and vague information or statement pertaining to marketing or customer is made but not substantiated The marketing concept and terminology is misunderstood and inappropriately used
Level 3: The range of mark allocation is between 58and 79 marks (between 50% - 69%)
Average Some information is given with explanation or substantiation Information and examples are used selectively No detailed overview is given Some measurements exist selectively
Level 4: The range is between 80 and 91 (between 70% - 80%)
Good
There is a market focus Good and relevant information is provided on most elements, namely brand equity, customer measurements, segmentation, innovation metrics, competitors, environmental factors
Non-financial aspects and quantitative measurements are both present Level 5: The range is between 93 and 115 marks (between 80% - 100%)
Excellent A lot of information and detail is provided with examples Information is professionally presented
Information provided is substantiated and scientifically analyzed

COURSE REP-P: RESEARCH REPORT STUDENT 70822344
128
Annexure 4 List and Description of Companies Sector
Company
Description
Retail RexTrueform The company manufacturing and retailing men and women fashion, the “Queenspark” brand with outlets in SA and Australia and two franchises in Namibia and Botswana.
Massmart Massmart is a managed portfolio of 9 wholesale and retail chains. These are “Game”, “Makro”, ”Builders Warehouse”, “CBW”.
Woolworths Woolworth’s Holdings includes Woolworth’s retail (mainly food, clothing, home ware), and Woolworth’s financial services, Country Road Ltd which operates in Australia, New Zealand and SE Asia.
New Clicks The company is made up of brand retail stores: “Clicks”, “Diskom”, “Musica”, “The Body Shop”, “Style Studio” with 660 stores in southern Africa, focusing on home ware , health, entertainment and beauty.
Pick n Pay It has three main divisions, namely retail, group enterprise and Franklin’s in Australia.
Ellerine The group has 13 retail brands in furniture and appliances sector with 1156 outlets. Its five divisions consist of credit retail (e.g. “Rainbow Loans”, “Green & Richards”), value retail and decorating (e.g. “Wetherlys”, Ösiers”, “Furniture City””, “Mattress Factory”), financial services and services (e.g. “Early Bird”).
Spar Spar is present in southern Africa and consists of the food retail brands “Superspar”, “Kwikspar”, “Spar” and “Build It” (retailer in hardware and building material) and “Top Spar” (liquor retail).
Food & Beverage Oceana Fishing, production, distribution of fishmeal and marine products and commercial cold storage. Company has various brands, including “Lucky Star” and “Glenryck”, export and distribution to UK and Africa.
Rainbow Chicken SA’s largest processor and marketer of chicken. Main brands are “Rainbow Chicken”, “Farmer Brown”, “Rainbow Food Solutions”
SAB Miller One of world’s largest brewers with brewing interests and distribution agreements in over 60 countries across 6 continents. Six of its brands are part of the world’s top 50 beer brands; also one of largest bottlers of Coca-cola products in the world.
Astral Foods Is a SA food group with key activities in animal feed, animal feed pre-mix, broiler genetics and broiler operations, production and sales of day-old broilers and hatching eggs. The group activities are performed under various brand names e.g. “Country Fair”, “NuTec”.
All Joy Develops, procures, produces a range of tomato sauces, mayonnaise, salad creams, special sauces, drinking chocolates, other condiments and preserves. Annual report does not mention any brand names.
AVI AVI is a consumer brands company focusing on food, beverage, fashion brands. These include “I&J”, “Denny”, “National Brands Ltd”, The Real Beverage Company”, Ä&D Spits”, ”Ïndigo Cosmetics”.
Distell Produce and market wines, spirits, ready-to-drink alcoholic beverages and export internationally
Financial Services Brait Brait is an international investment and financial services group focused on private equity, corporate finance, group investments and specialized funds. Clients are listed and unlisted companies, government institutions, high net worth individuals. Investments are made in southern Africa, Europe and North America.
Brimstone This investment corporation invests private equity into mainly branded consumer goods, healthcare, fishing and financial services sector.
Nedbank It is one of the four largest banks in SA and offers wholesale and retail banking through 3 main business divisions. These are Nedbank Corporate, Nedbank Capital, Nedbank Retail and include a joint venture with Imperial Bank offering motor vehicle

COURSE REP-P: RESEARCH REPORT STUDENT 70822344
129
financing under the brand “Motor Finance Corporation”.
Mercentile This banks forms part of a holding company in Portugal and provides international and domestic banking services and insurance brokerage services.
Metropolitan Transformed from life insurance to financial services group in SA consisting of health, retail, government employees medical scheme, asset management, collective investments.
Media Caxton A publishing company in SA
Kagiso A SA broadcasting and entertainment company with three main divisions consisting of radio (East-Coast, Jacaranda, Heart 104.9, Kaya FM, etc) , online information solution “Lexis Nexus” and exhibition business.
Naspers It is a multinational media entity with operations in Africa, Europe, USA, South America, South-East Asia, Russia. They have operations in pay TV, internet, instant messaging subscriber platforms and provision of related technology, printing and distribution and publishing of magazines, newspapers and books.
Technology & Dimension Data The company plans, builds, supports and manages IT infrastructure solutions. It specializes in network infrastructure and solutions based on network-reliant technologies like security, IP telephony, storage and contact centres. IT is an IT service and solutions provider in 35 countries with approximately 6000 clients and 10 000 employees.
Telecommunications DataPro Integrated telecommunications, an alternative telecom operator in SA providing voice and data services to southern Africa. It’s primary brands are “Data Pro”, “@tlantic International Services” and “VoxTelecom”.
Altron The company works towards consolidating its position as leader in the telecommunications, power electronics, multi-media and info-technology sector in SA. It has 3 main operating groups: Altech, Bytes and Powertech.
Travel & Comair The airline has two leading brands, namely “British Airways” and “Kulula.com”. The company refers to itself as “SA’s biggest on-line retailer”.
Leisure Gooderson Provides accommodation, food and beverage and restaurant services to leisure, international and conference tourists. Their product and service offering includes time share resorts, financial services, properties, hotel and lodge management.
Construction PPC The Pretoria Portland Cement (PPC) company provides cement (e.g. under brand “Surebuild”) and is a subsidiary of Barlworld Ltd.
WBHO Wilson Bayly Holmes-Ovcon Ltd (WBHO) are one of the leading building and civil engineering contractors in southern Africa.
Chemicals Afrox African Oxygen Ltd (Afrox) is SA’s market leader in gases and welding products and is a subsidiary to an international group who are world leaders in industrial gases and engineering.

COURSE REP-P: RESEARCH REPORT STUDENT 70822344
130
Annexure 5 Detailed notes per company and as per checklist is available on request

COURSE REP-P REPORT STUDENT 70822344
Annexure 6 Annual Reports’ Ratings: Brand Equity Rating of Brand Equity Elements and Total per Company
Sector Familiarity Penetration Reputation
Customer Satisfaction Loyalty
Availability/ Distribution
Total Brand Equity
Rex Truform Retail 1 1 2 1 1 1 1.17
Massmart Retail 4 5 5 5 5 5 4.83
Woolworths Retail 1 1 3 3 2 1 1.83
New Clicks Retail 5 5 4 5 4 5 4.67
Pick n Pay Retail 1 1 2 1 1 3 1.50
Ellerine Retail 5 4 5 5 5 5 4.83
Spar Retail 4 3 2 1 1 2 2.17
Oceana Food 1 2 1 1 1 2 1.33
Rainbow Chicken Food 4 5 5 5 5 5 4.83
SAB Miller Food 5 5 5 5 5 5 5.00
Astral Foods Food 2 1 1 2 1 1 1.33
All Joy Food 1 1 1 1 1 1 1.00
AVI Food 5 5 5 5 5 5 5.00
Distell Food 5 5 5 5 1 5 4.33
Brait Financial 1 1 1 1 1 1 1.00
Brimstone Financial 1 1 1 1 1 1 1.00
Nedbank Financial 5 4 2 2 3 4 3.33
Mercentile Bank Financial 1 1 1 1 1 1 1.00
Metropolitan Financial 4 5 4 3 2 5 3.83
Caxton Media 2 1 1 1 1 1 1.17
Kagiso Media 5 5 5 5 5 5 5.00
Naspers Media 2 3 1 3 3 4 2.67
Altron Technology 1 1 4 5 4 1 2.67
Dimension Data Technology 2 5 3 4 5 3 3.67
Data Pro Technology 2 2 2 2 1 3 2.00
Comair Travel 2 1 1 3 1 3 1.83
Gooderson Leisure 1 1 1 1 2 5 1.83
Afrox Chemicals 1 1 5 5 5 4 3.50
PPC Construction 1 1 1 1 1 1 1.00
WBHO Construction 1 1 1 1 1 1 1.00

COURSE REP-P: RESEARCH REPORT STUDENT 70822344
132
Annexure 7 Annual Reports’ Annual Reports’ Ratings: Other Customer Metrics Rating of Other Customer Metrics per Company
Sector Market Share/ Market Presence Relative Price
Sales to New Customers
Rex Truform Retail 1 1 1
Massmart Retail 5 1 5
Woolworths Retail 1 1 1
New Clicks Retail 4 1 1
Pick n Pay Retail 1 1 1
Ellerine Retail 5 1 3
Spar Retail 4 1 1
Oceana Food 1 2 1
Rainbow Chicken Food 5 1 1
SAB Miller Food 5 1 5
Astral Foods Food 1 1 1
All Joy Food 1 1 1
AVI Food 3 5 1
Distell Food 5 4 1
Brait Financial 3 1 1
Brimstone Financial 1 1 1
Nedbank Financial 1 1 1
Mercentile Bank Financial 1 1 1
Metropolitan Financial 5 3 5
Caxton Media 1 1 1
Kagiso Media 5 1 1
Naspers Media 2 1 1
Altron Technology 1 1 1
Dimension Data Technology 1 1 1
Data Pro Technology 4 1 5
Comair Leisure 1 1 1
Gooderson Leisure 1 1 1
Afrox Chemicals 3 1 1
PPC Construction 1 1 1
WBHO Construction 1 1 1

COURSE REP-P: RESEARCH REPORT STUDENT 70822344
133
Annexure 8 Annual Reports’ Ratings: Segmentation Rating of Segmentation per Company
Sector
% of Market represented by segment
Customer or segment profitability/ % of all profits in total market produced by segment
Ratio of Profit produced by segment to weight of segment in total population
% defection rate
Customer retention rate by market segment
Actual / potential Customer or segment CLV or top 10 customers
Rex Truform Retail 1 1 1 1 1 1
Massmart Retail 5 1 1 1 1 1
Woolworths Retail 1 1 1 1 1 2
New Clicks Retail 5 1 1 1 1 1
Pick n Pay Retail 2 1 1 1 1 1
Ellerine Retail 5 1 1 1 1 1
Spar Retail 4 1 1 1 1 1
Oceana Food 1 1 1 2 2 1
Rainbow Chicken Food 5 1 1 1 1 5
SAB Miller Food 5 4 1 1 1 1
Astral Foods Food 2 1 1 1 1 1
All Joy Food 1 1 1 1 1 1
AVI Food 5 5 1 4 1 1
Distell Food 5 5 1 1 1 1
Brait Financial 4 4 1 1 1 1
Brimstone Financial 1 1 1 1 1 1
Nedbank Financial 2 1 1 5 1 1
Mercentile Bank Financial 1 1 1 1 1 1
Metropolitan Financial 5 5 1 1 1 4
Caxton Media 1 1 1 1 1 1
Kagiso Media 5 5 5 1 1 5
Naspers Media 4 1 2 1 1 3
Altron Technology 1 1 1 1 1 1
Dimension Data Technology 4 1 1 1 1 4
Data Pro Technology 5 5 2 1 1 1
Comair Leisure 1 1 1 1 1 1
Gooderson Leisure 1 1 1 1 1 2
Afrox Chemicals 3 1 1 4 4 5
PPC Construction 1 1 1 1 1 1
WBHO Construction 1 1 1 1 1 1

COURSE REP-P: RESEARCH REPORT STUDENT 70822344
134
Annexure 9 Annual Reports’ Ratings: Innovation Rating of Innovation Metrics per Company
Sector
No. of initiatives in process
No. of innovations launched
% revenue due to launches during last year
Rex Truform Retail 2 2 1
Massmart Retail 5 5 4
Woolworths Retail 3 3 1
New Clicks Retail 4 5 1
Pick n Pay Retail 3 3 1
Ellerine Retail 5 4 1
Spar Retail 4 4 1
Oceana Food 2 1 1
Rainbow Chicken Food 5 5 1
SAB Miller Food 4 5 1
Astral Foods Food 1 1 1
All Joy Food 1 1 1
AVI Food 5 5 1
Distell Food 2 2 1
Brait Financial 1 1 1
Brimstone Financial 1 1 1
Nedbank Financial 1 1 1
Mercentile Bank Financial 1 1 1
Metropolitan Financial 4 3 1
Caxton Media 1 1 1
Kagiso Media 5 5 5
Naspers Media 4 4 4
Altron Technology 5 5 1
Dimension Data Technology 5 5 1
Data Pro Technology 1 2 1
Comair Leisure 3 3 1
Gooderson Leisure 2 1 1
Afrox Chemicals 1 1 1
PPC Construction 1 1 1
WBHO Construction 1 1 1
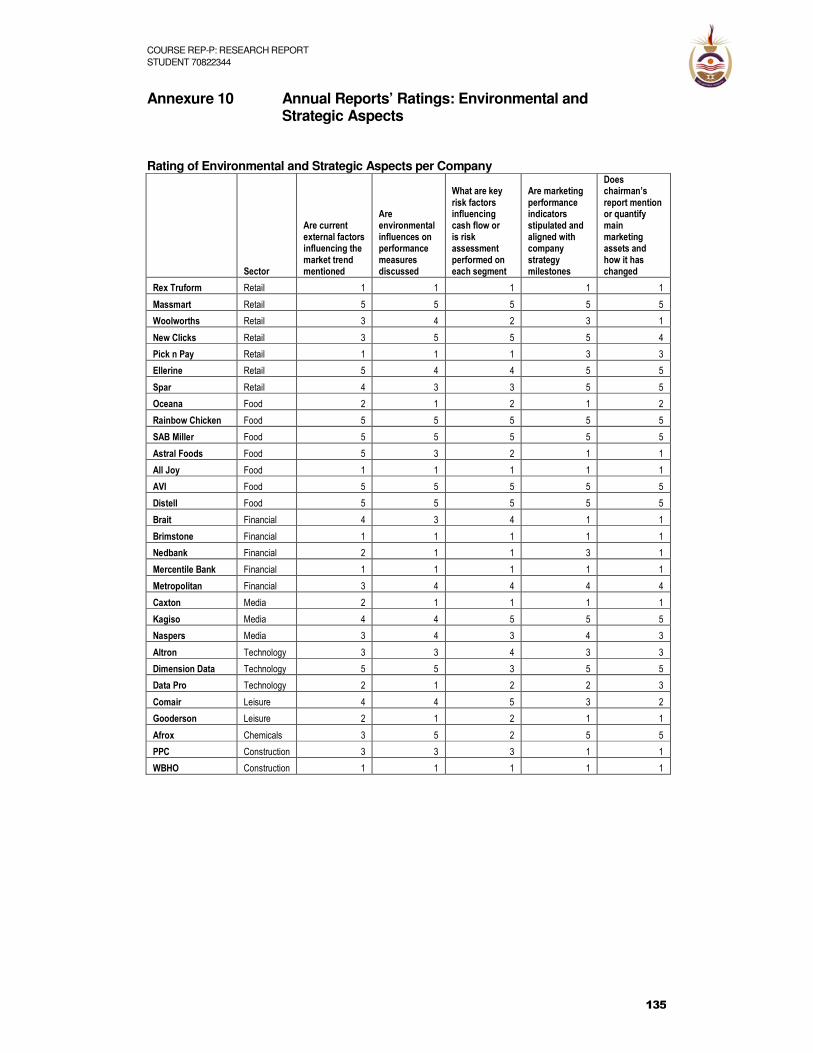
COURSE REP-P: RESEARCH REPORT STUDENT 70822344
135
Annexure 10 Annual Reports’ Ratings: Environmental and Strategic Aspects Rating of Environmental and Strategic Aspects per Company
Sector
Are current external factors influencing the market trend mentioned
Are environmental influences on performance measures discussed
What are key risk factors influencing cash flow or is risk assessment performed on each segment
Are marketing performance indicators stipulated and aligned with company strategy milestones
Does chairman’s report mention or quantify main marketing assets and how it has changed
Rex Truform Retail 1 1 1 1 1
Massmart Retail 5 5 5 5 5
Woolworths Retail 3 4 2 3 1
New Clicks Retail 3 5 5 5 4
Pick n Pay Retail 1 1 1 3 3
Ellerine Retail 5 4 4 5 5
Spar Retail 4 3 3 5 5
Oceana Food 2 1 2 1 2
Rainbow Chicken Food 5 5 5 5 5
SAB Miller Food 5 5 5 5 5
Astral Foods Food 5 3 2 1 1
All Joy Food 1 1 1 1 1
AVI Food 5 5 5 5 5
Distell Food 5 5 5 5 5
Brait Financial 4 3 4 1 1
Brimstone Financial 1 1 1 1 1
Nedbank Financial 2 1 1 3 1
Mercentile Bank Financial 1 1 1 1 1
Metropolitan Financial 3 4 4 4 4
Caxton Media 2 1 1 1 1
Kagiso Media 4 4 5 5 5
Naspers Media 3 4 3 4 3
Altron Technology 3 3 4 3 3
Dimension Data Technology 5 5 3 5 5
Data Pro Technology 2 1 2 2 3
Comair Leisure 4 4 5 3 2
Gooderson Leisure 2 1 2 1 1
Afrox Chemicals 3 5 2 5 5
PPC Construction 3 3 3 1 1
WBHO Construction 1 1 1 1 1

COURSE REP-P: RESEARCH REPORT STUDENT 70822344
136
Annexure 11 Example of Annual Reports 11.1 Massmart: A good example of rating level 5 (excellent) for brand equity,
disclosing marketing specific information, substantiated and well presented.
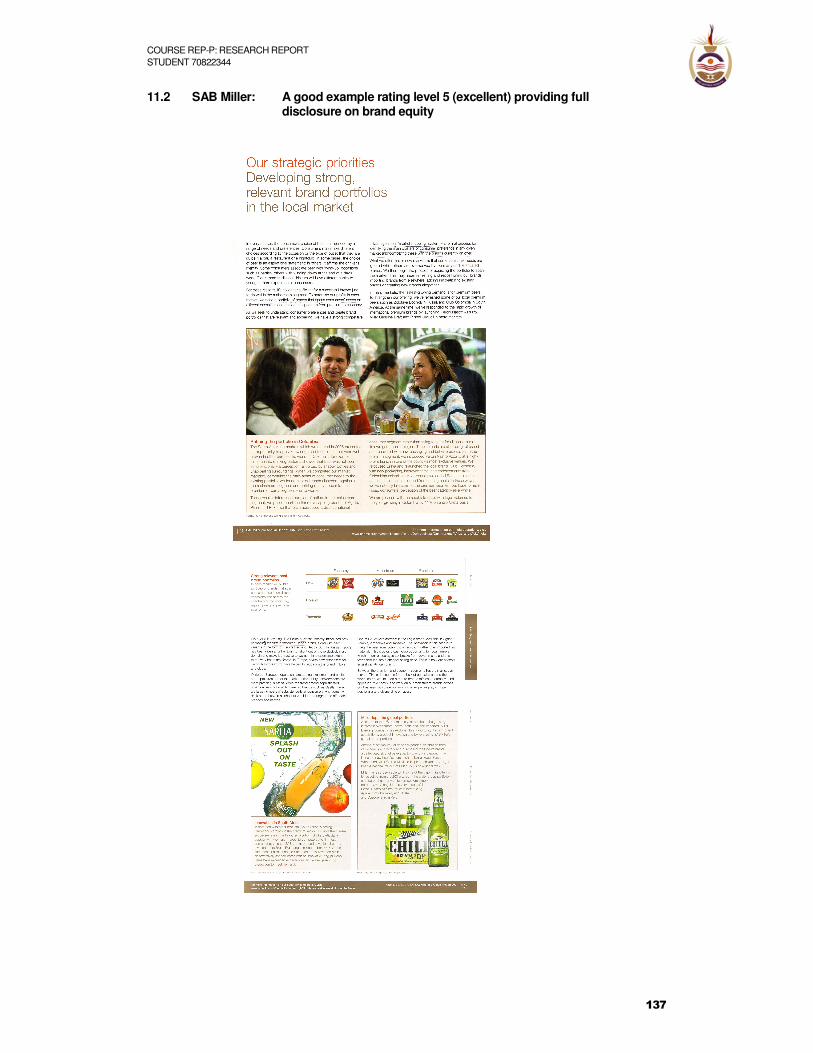
COURSE REP-P: RESEARCH REPORT STUDENT 70822344
137
11.2 SAB Miller: A good example rating level 5 (excellent) providing full disclosure on brand equity

COURSE REP-P: RESEARCH REPORT STUDENT 70822344
138
11.3 AVI: A good example rating level 5 (excellent) of the customer forming part of strategy and marketing receiving chairperson’s full support
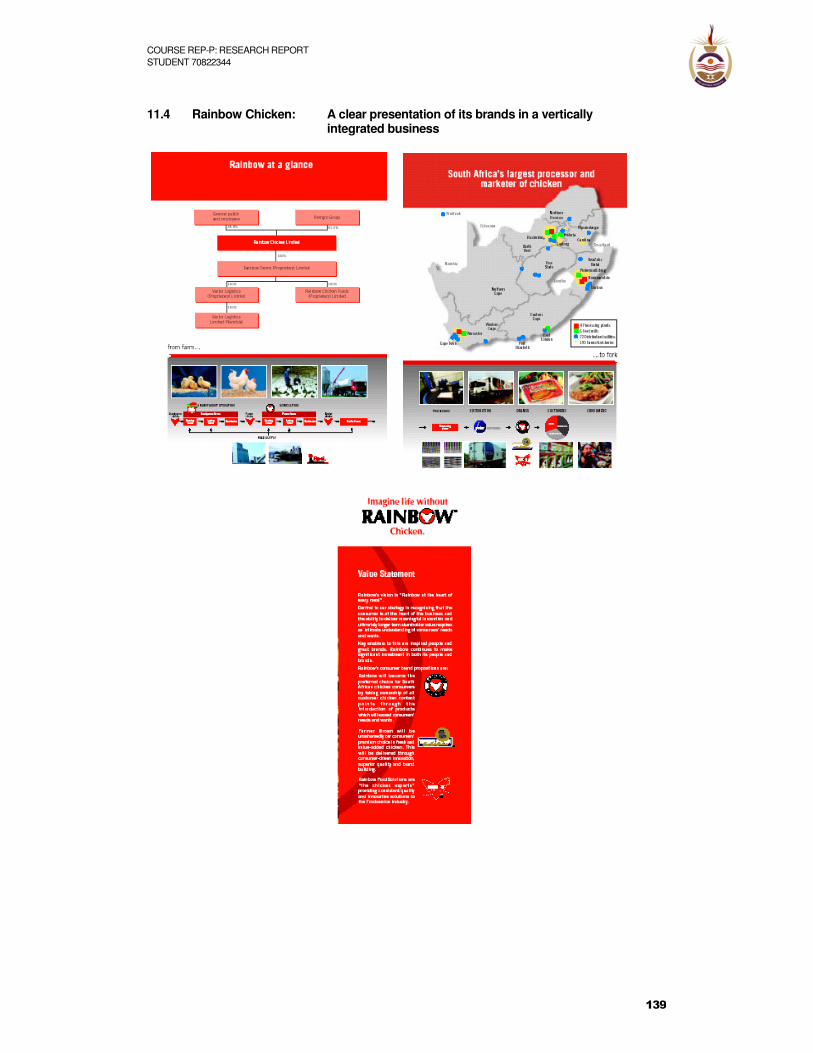
COURSE REP-P: RESEARCH REPORT STUDENT 70822344
139
11.4 Rainbow Chicken: A clear presentation of its brands in a vertically
integrated business

COURSE REP-P: RESEARCH REPORT STUDENT 70822344
140
11.5 Ellerine Holding’s excellent example of brand and % market represented by Segment

COURSE REP-P: RESEARCH REPORT STUDENT 70822344
141
11.6 Kagiso Media’s Comparison with Competitors

COURSE REP-P: RESEARCH REPORT STUDENT 70822344
142
11.7 Distell’s is a very good example of Brand and Customer Focus and integration with strategy

COURSE REP-P: RESEARCH REPORT STUDENT 70822344
143
11.8 Naspers is an example of the tendency in annual reports to use general terminology

COURSE REP-P: RESEARCH REPORT STUDENT 70822344
144
Annexure 12 List of Tables and Figures List of Tables Table 5.1 Explanation of Total Brand Equity Rating Scale Table 5.2 Frequency and percentage distribution of Total Brand Equity ratings Table 5.3 Rating scale for Elements of Brand Equity Table 5.4 Frequency and percentage distribution of Brand Equity Elements Table 5.5 Frequency and percentage distribution of Brand Penetration Table 5.6 Frequency and percentage distribution of Reputation Table 5.7 Frequency and percentage distribution of Customer Satisfaction Table 5.8 Frequency and percentage distribution of Customer Loyalty Table 5.9 Frequency and percentage distribution of Availability/ Distribution Channel Table 5.10 Rating scale for Customer Metrics Table 5.11 Frequency and percentage distribution of Market Share Table 5.12 Frequency and percentage distribution of Relative Price Table 5.13 Frequency and percentage distribution of Sales to New Customers Table 5.14 Rating scale for Segmentation Table 5.15 Frequency and percentage distribution of percentage of market represented by
segment Table 5.16 Frequency and percentage distribution of percentage of total market produced by
segment Table 5.17 Frequency and percentage distribution of profit produced by segment to weight of
segment in total population Table 5.18 Frequency and percentage distribution of percentage defection rate Table 5.19 Frequency and percentage distribution of Customer Retention rate per market
segment Table 5.20 Frequency and percentage distribution of Top 10 customers/ Actual or potential
Customer Lifetime Value Table 5.21 Frequency and percentage distribution of Initiatives in Process Table 5.22 Frequency and percentage distribution of percentage revenue due to launches Table 5.23 Frequency and percentage distribution of Innovations launched Table 5.24 Rating scale for environmental and strategic aspects Table 5.25 Frequency and percentage distribution of External Factors influencing market
trends Table 5.26 Frequency and percentage distribution of Environmental influences on marketing Table 5.27 Frequency and percentage distribution of Key Risk Factors influencing cash flow
or risk assessment per segment Table 5.28 Frequency and percentage distribution of Marketing’s alignment to Strategy Table 5.29 Frequency and percentage distribution of Chairperson mentioning marketing or
quantifying marketing assets Table 5.30 Information deemed important by investors versus information supplied in annual
reports Table 5.31 Rating scale of annual reports’ Grand Total Maturity Level Table 5.32 Frequency and percentage distribution of annual reports’ rating level as per Grand
Total Maturity Level List of Figures Figure 5.1 Pie Chart showing rating percentage per companies’ Total Brand Equity Figure 5.2 Histogram showing rating level results of Brand Equity Figure 5.3 Box plot showing sector’s rating scale of Brand Equity Figure 5.4 Correlation between Marketing’s alignment to Strategy and Brand Equity Figure 5.5 Frequency of annual reports rated as per Grand Total Maturity Model Figure 5.6 Box plot depicting rating scale of all elements by sector

COURSE REP-P: RESEARCH REPORT STUDENT 70822344
145
Annexure 13 Statistical Analysis
. gen GrandTotal= familiarity+ penetration+ customerthink+ customerfeel+ loyalty+ a
> vailability+ marketshare+ relativeprice+ newsales+ segment+ profitability+ ratio+
> defection+ retention+ clv+ initiatives+ innovations+ revenue+ external+ internal
> + cashflow+ strategy+ chairman
(2 missing values generated)
factor analysis validates summing these 6 items into 1 single measure.
. factor familiarity- availability
(obs=30)
(principal factors; 3 factors retained)
Factor Eigenvalue Difference Proportion Cumulative
------------------------------------------------------------------
1 4.51671 4.02994 0.9315 0.9315
2 0.48677 0.45834 0.1004 1.0318
3 0.02843 0.06793 0.0059 1.0377
4 -0.03950 0.01879 -0.0081 1.0296
5 -0.05829 0.02673 -0.0120 1.0175
6 -0.08502 . -0.0175 1.0000
Factor Loadings
Variable | 1 2 3 Uniqueness
-------------+-------------------------------------------
familiarity | 0.83820 0.38293 -0.05693 0.14755
penetration | 0.89244 0.30084 0.03276 0.11197
customerth~k | 0.90645 -0.21543 -0.09501 0.12290
customerfeel | 0.90277 -0.30732 -0.03437 0.08938
loyalty | 0.83062 -0.29269 0.09872 0.21467
availability | 0.83133 0.15201 0.06452 0.28162
Basic tabulations from here:
. tab familiarity
Familiarity | Freq. Percent Cum.
------------+-----------------------------------
1 | 13 43.33 43.33
2 | 6 20.00 63.33
4 | 4 13.33 76.67
5 | 7 23.33 100.00
------------+-----------------------------------
Total | 30 100.00
. tab penetration
Penetration | Freq. Percent Cum.
------------+-----------------------------------
1 | 15 50.00 50.00
2 | 2 6.67 56.67
3 | 2 6.67 63.33
4 | 2 6.67 70.00
5 | 9 30.00 100.00
------------+-----------------------------------
Total | 30 100.00
. tab customerthink
Customerthi |
nk | Freq. Percent Cum.
------------+-----------------------------------
1 | 12 40.00 40.00
2 | 5 16.67 56.67
3 | 2 6.67 63.33
4 | 3 10.00 73.33
5 | 8 26.67 100.00
------------+-----------------------------------
Total | 30 100.00
. tab customerfeel
Customerfee |
l | Freq. Percent Cum.
------------+-----------------------------------
1 | 12 40.00 40.00

COURSE REP-P: RESEARCH REPORT STUDENT 70822344
146
2 | 3 10.00 50.00
3 | 4 13.33 63.33
4 | 1 3.33 66.67
5 | 10 33.33 100.00
------------+-----------------------------------
Total | 30 100.00
. tab loyalty
Loyalty | Freq. Percent Cum.
------------+-----------------------------------
1 | 15 50.00 50.00
2 | 3 10.00 60.00
3 | 2 6.67 66.67
4 | 2 6.67 73.33
5 | 8 26.67 100.00
------------+-----------------------------------
Total | 30 100.00
. tab availability
Availabilit |
y | Freq. Percent Cum.
------------+-----------------------------------
1 | 11 36.67 36.67
2 | 2 6.67 43.33
3 | 4 13.33 56.67
4 | 3 10.00 66.67
5 | 10 33.33 100.00
------------+-----------------------------------
Total | 30 100.00
. tab marketshare
Marketshare | Freq. Percent Cum.
------------+-----------------------------------
1 | 16 53.33 53.33
2 | 1 3.33 56.67
3 | 3 10.00 66.67
4 | 3 10.00 76.67
5 | 7 23.33 100.00
------------+-----------------------------------
Total | 30 100.00
. tab relativeprice
Relativepri |
ce | Freq. Percent Cum.
------------+-----------------------------------
1 | 26 86.67 86.67
2 | 1 3.33 90.00
3 | 1 3.33 93.33
4 | 1 3.33 96.67
5 | 1 3.33 100.00
------------+-----------------------------------
Total | 30 100.00
. tab newsales
Newsales | Freq. Percent Cum.
------------+-----------------------------------
1 | 25 83.33 83.33
3 | 1 3.33 86.67
5 | 4 13.33 100.00
------------+-----------------------------------
Total | 30 100.00
. tab segment
Segment | Freq. Percent Cum.
------------+-----------------------------------
1 | 12 40.00 40.00
2 | 3 10.00 50.00
3 | 1 3.33 53.33
4 | 4 13.33 66.67
5 | 10 33.33 100.00
------------+-----------------------------------

COURSE REP-P: RESEARCH REPORT STUDENT 70822344
147
Total | 30 100.00
. tab profitability
Profitabili |
ty | Freq. Percent Cum.
------------+-----------------------------------
1 | 23 76.67 76.67
4 | 2 6.67 83.33
5 | 5 16.67 100.00
------------+-----------------------------------
Total | 30 100.00
. tab ratio
Ratio | Freq. Percent Cum.
------------+-----------------------------------
1 | 27 90.00 90.00
2 | 2 6.67 96.67
5 | 1 3.33 100.00
------------+-----------------------------------
Total | 30 100.00
. tab defection
Defection | Freq. Percent Cum.
------------+-----------------------------------
1 | 26 86.67 86.67
2 | 1 3.33 90.00
4 | 2 6.67 96.67
5 | 1 3.33 100.00
------------+-----------------------------------
Total | 30 100.00
. tab retention
Retention | Freq. Percent Cum.
------------+-----------------------------------
1 | 28 93.33 93.33
2 | 1 3.33 96.67
4 | 1 3.33 100.00
------------+-----------------------------------
Total | 30 100.00
. tab clv
CLV | Freq. Percent Cum.
------------+-----------------------------------
1 | 22 73.33 73.33
2 | 2 6.67 80.00
3 | 1 3.33 83.33
4 | 2 6.67 90.00
5 | 3 10.00 100.00
------------+-----------------------------------
Total | 30 100.00
. tab initiatives
Initiatives | Freq. Percent Cum.
------------+-----------------------------------
1 | 11 36.67 36.67
2 | 4 13.33 50.00
3 | 3 10.00 60.00
4 | 5 16.67 76.67
5 | 7 23.33 100.00
------------+-----------------------------------
Total | 30 100.00
. tab revenue
Revenue | Freq. Percent Cum.
------------+-----------------------------------
1 | 27 90.00 90.00
4 | 2 6.67 96.67
5 | 1 3.33 100.00
------------+-----------------------------------
Total | 30 100.00

COURSE REP-P: RESEARCH REPORT STUDENT 70822344
148
. tab innovations
Innovations | Freq. Percent Cum.
------------+-----------------------------------
1 | 12 40.00 40.00
2 | 3 10.00 50.00
3 | 4 13.33 63.33
4 | 3 10.00 73.33
5 | 8 26.67 100.00
------------+-----------------------------------
Total | 30 100.00
. tab external
External | Freq. Percent Cum.
------------+-----------------------------------
1 | 6 20.00 20.00
2 | 5 16.67 36.67
3 | 7 23.33 60.00
4 | 4 13.33 73.33
5 | 8 26.67 100.00
------------+-----------------------------------
Total | 30 100.00
. tab internal
Internal | Freq. Percent Cum.
------------+-----------------------------------
1 | 11 36.67 36.67
3 | 5 16.67 53.33
4 | 6 20.00 73.33
5 | 8 26.67 100.00
------------+-----------------------------------
Total | 30 100.00
. tab cashflow
Cashflow | Freq. Percent Cum.
------------+-----------------------------------
1 | 8 26.67 26.67
2 | 6 20.00 46.67
3 | 4 13.33 60.00
4 | 4 13.33 73.33
5 | 8 26.67 100.00
------------+-----------------------------------
Total | 30 100.00
. tab strategy
Strategy | Freq. Percent Cum.
------------+-----------------------------------
1 | 11 36.67 36.67
2 | 1 3.33 40.00
3 | 5 16.67 56.67
4 | 2 6.67 63.33
5 | 11 36.67 100.00
------------+-----------------------------------
Total | 30 100.00
. tab chairman
Chairman | Freq. Percent Cum.
------------+-----------------------------------
1 | 12 40.00 40.00
2 | 2 6.67 46.67
3 | 4 13.33 60.00
4 | 2 6.67 66.67
5 | 10 33.33 100.00
------------+-----------------------------------
Total | 30 100.00

COURSE REP-P: RESEARCH REPORT STUDENT 70822344
149
. tab totbrandequity
TotBrandEqu |
ity | Freq. Percent Cum.
------------+-----------------------------------
1 | 6 20.00 20.00
1.17 | 2 6.67 26.67
1.33 | 2 6.67 33.33
1.5 | 1 3.33 36.67
1.83 | 3 10.00 46.67
2 | 1 3.33 50.00
2.17 | 1 3.33 53.33
2.67 | 2 6.67 60.00
3.33 | 1 3.33 63.33
3.5 | 1 3.33 66.67
3.67 | 1 3.33 70.00
3.83 | 1 3.33 73.33
4.33 | 1 3.33 76.67
4.67 | 1 3.33 80.00
4.83 | 3 10.00 90.00
5 | 3 10.00 100.00
------------+-----------------------------------
Total | 30 100.00
. tab GrandTotal
Grand Total | Freq. Percentile Cum.
Mark Allocation
------------+-----------------------------------
23 | 4 13.33 13.33
25 | 1 3.33 16.67
26 | 1 3.33 20.00
29 | 1 3.33 23.33
32 | 2 6.67 30.00
33 | 1 3.33 33.33
35 | 1 3.33 36.67
39 | 1 3.33 40.00
41 | 1 3.33 43.33
45 | 2 6.67 50.00
51 | 1 3.33 53.33
52 | 1 3.33 56.67
57 | 1 3.33 60.00
61 | 1 3.33 63.33
67 | 1 3.33 66.67
71 | 1 3.33 70.00
76 | 1 3.33 73.33
80 | 2 6.67 80.00
81 | 1 3.33 83.33
86 | 1 3.33 86.67
89 | 2 6.67 93.33
92 | 1 3.33 96.67
97 | 1 3.33 100.00
------------+-----------------------------------
Total | 30 100.00
. summ GrandTotal totbrandequity, detail
GrandTotal
-------------------------------------------------------------
Percentiles Smallest
1% 23 23
5% 23 23
10% 23 23 Obs 30
25% 32 23 Sum of Wgt. 30
50% 48 Mean 53.43333
Largest Std. Dev. 25.10074
75% 80 89
90% 89 89 Variance 630.0471
95% 92 92 Skewness .2912199
99% 97 97 Kurtosis 1.608792
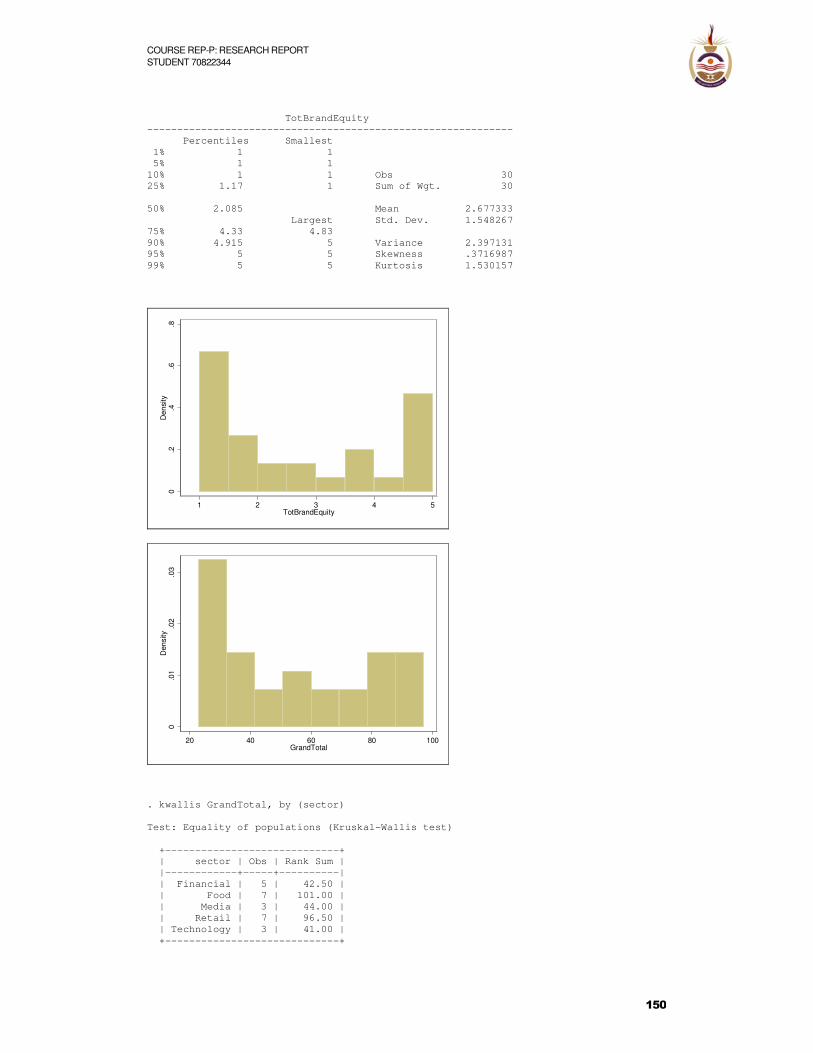
COURSE REP-P: RESEARCH REPORT STUDENT 70822344
150
TotBrandEquity
-------------------------------------------------------------
Percentiles Smallest
1% 1 1
5% 1 1
10% 1 1 Obs 30
25% 1.17 1 Sum of Wgt. 30
50% 2.085 Mean 2.677333
Largest Std. Dev. 1.548267
75% 4.33 4.83
90% 4.915 5 Variance 2.397131
95% 5 5 Skewness .3716987
99% 5 5 Kurtosis 1.530157
0.2
.4.6
.8D
ensi
ty
1 2 3 4 5TotBrandEquity
0.0
1.0
2.0
3D
ensi
ty
20 40 60 80 100GrandTotal
. kwallis GrandTotal, by (sector)
Test: Equality of populations (Kruskal-Wallis test)
+-----------------------------+
| sector | Obs | Rank Sum |
|------------+-----+----------|
| Financial | 5 | 42.50 |
| Food | 7 | 101.00 |
| Media | 3 | 44.00 |
| Retail | 7 | 96.50 |
| Technology | 3 | 41.00 |
+-----------------------------+

COURSE REP-P: RESEARCH REPORT STUDENT 70822344
151
chi-squared = 2.391 with 4 d.f.
probability = 0.6642
chi-squared with ties = 2.397 with 4 d.f.
probability = 0.6632
. gen ind1=(sector=="Technology")
. replace ind1=(sector=="Financial")*2 if ind1==0
(5 real changes made)
. replace ind1=. if ind1==0
(17 real changes made, 17 to missing)
. ranksum GrandTotal, by(ind1)
Two-sample Wilcoxon rank-sum (Mann-Whitney) test
ind1 | obs rank sum expected
-------------+---------------------------------
1 | 3 18 13.5
2 | 5 18 22.5
-------------+---------------------------------
combined | 8 36 36
unadjusted variance 11.25
adjustment for ties -0.13
----------
adjusted variance 11.12
Ho: GrandT~l(ind1==1) = GrandT~l(ind1==2)
z = 1.350
Prob > |z| = 0.1771
. log close
log: C:\Documents and Settings\gregd\My Documents\Consulting\Hilke Gart
> z\Log2.smcl
log type: smcl
closed on: 15 Nov 2007, 16:23:04
---------------------------------------------------------------------
Here are summary stats for the 6 brand equity items, firstly overall and then by
sector:
. tabstat familiarity-totbrandequity, statistics(mean p50 sd n) f(%9.2f)
stats | famili~y penetr~n custom~k custom~l loyalty availa~y totbra~y
---------+----------------------------------------------------------------------
mean | 2.53 2.60 2.67 2.80 2.50 2.97 2.68
p50 | 2.00 1.50 2.00 2.50 1.50 3.00 2.09
sd | 1.70 1.81 1.71 1.77 1.76 1.75 1.55
N | 30.00 30.00 30.00 30.00 30.00 30.00 30.00
--------------------------------------------------------------------------------
. bysort sector: tabstat familiarity-totbrandequity, statistics(mean p50 sd n) f(%
> 9.2f)
-----------------------------------------------------------------------------------
-> sector = Construction
stats | famili~y penetr~n custom~k custom~l loyalty availa~y totbra~y
---------+----------------------------------------------------------------------
mean | 1.00 1.00 1.00 1.00 1.00 1.00 1.00
p50 | 1.00 1.00 1.00 1.00 1.00 1.00 1.00
sd | 0.00 0.00 0.00 0.00 0.00 0.00 0.00
N | 2.00 2.00 2.00 2.00 2.00 2.00 2.00
--------------------------------------------------------------------------------
-----------------------------------------------------------------------------------
-> sector = Financial
stats | famili~y penetr~n custom~k custom~l loyalty availa~y totbra~y

COURSE REP-P: RESEARCH REPORT STUDENT 70822344
152
---------+----------------------------------------------------------------
------
mean | 2.40 2.40 1.80 1.60 1.60 2.40 2.03
p50 | 1.00 1.00 1.00 1.00 1.00 1.00 1.00
sd | 1.95 1.95 1.30 0.89 0.89 1.95 1.42
N | 5.00 5.00 5.00 5.00 5.00 5.00 5.00
--------------------------------------------------------------------------------
-----------------------------------------------------------------------------------
-> sector = Food
stats | famili~y penetr~n custom~k custom~l loyalty availa~y totbra~y
---------+----------------------------------------------------------------------
mean | 3.29 3.43 3.29 3.43 2.71 3.43 3.26
p50 | 4.00 5.00 5.00 5.00 1.00 5.00 4.33
sd | 1.89 1.99 2.14 1.99 2.14 1.99 1.92
N | 7.00 7.00 7.00 7.00 7.00 7.00 7.00
--------------------------------------------------------------------------------
-----------------------------------------------------------------------------------
-> sector = Leisure
stats | famili~y penetr~n custom~k custom~l loyalty availa~y totbra~y
---------+----------------------------------------------------------------------
mean | 1.50 1.00 1.00 2.00 1.50 4.00 1.83
p50 | 1.50 1.00 1.00 2.00 1.50 4.00 1.83
sd | 0.71 0.00 0.00 1.41 0.71 1.41 0.00
N | 2.00 2.00 2.00 2.00 2.00 2.00 2.00
--------------------------------------------------------------------------------
-----------------------------------------------------------------------------------
-> sector = Media
stats | famili~y penetr~n custom~k custom~l loyalty availa~y totbra~y
---------+----------------------------------------------------------------------
mean | 3.00 3.00 2.33 3.00 3.00 3.33 2.95
p50 | 2.00 3.00 1.00 3.00 3.00 4.00 2.67
sd | 1.73 2.00 2.31 2.00 2.00 2.08 1.93
N | 3.00 3.00 3.00 3.00 3.00 3.00 3.00
--------------------------------------------------------------------------------
-----------------------------------------------------------------------------------
-> sector = Resources
stats | famili~y penetr~n custom~k custom~l loyalty availa~y totbra~y
---------+----------------------------------------------------------------------
mean | 1.00 1.00 5.00 5.00 5.00 4.00 3.50
p50 | 1.00 1.00 5.00 5.00 5.00 4.00 3.50
sd | . . . . . . .
N | 1.00 1.00 1.00 1.00 1.00 1.00 1.00
--------------------------------------------------------------------------------
-----------------------------------------------------------------------------------
-> sector = Retail
stats | famili~y penetr~n custom~k custom~l loyalty availa~y totbra~y
---------+----------------------------------------------------------------------
mean | 3.00 2.86 3.29 3.00 2.71 3.14 3.00
p50 | 4.00 3.00 3.00 3.00 2.00 3.00 2.17
sd | 1.91 1.86 1.38 2.00 1.89 1.86 1.69
N | 7.00 7.00 7.00 7.00 7.00 7.00 7.00
--------------------------------------------------------------------------------
-----------------------------------------------------------------------------------
-> sector = Technology
stats | famili~y penetr~n custom~k custom~l loyalty availa~y totbra~y
---------+----------------------------------------------------------------------
mean | 1.67 2.67 3.00 3.67 3.33 2.33 2.78
p50 | 2.00 2.00 3.00 4.00 4.00 3.00 2.67
sd | 0.58 2.08 1.00 1.53 2.08 1.15 0.84
N | 3.00 3.00 3.00 3.00 3.00 3.00 3.00
--------------------------------------------------------------------------------

COURSE REP-P: RESEARCH REPORT STUDENT 70822344
153
The spearman correlation below
12
34
5S
trat
egy
1 2 3 4 5TotBrandEquity
. spearman strategy totbrand
Number of obs = 29
Spearman's rho = 0.9142
Test of Ho: strategy and totbrandequity are independent
Prob > |t| = 0.0000

COURSE REP-P: RESEARCH REPORT STUDENT 70822344
154
Boxplot of the Brand equity score by sector
. preserve
. drop if sector=="Leisure" | sector=="Construction" | sector=="Resources"
(5 observations deleted)
. graph box totbrandequity, over(sector) title(Boxplot of Total Brand Equity by
Sector)
12
34
5T
otB
rand
Equ
ity
Financial Food Media Retail Technology
Boxplot of Total Brand Equity by Sector
. kwallis totbrandequity, by (sector)
Test: Equality of populations (Kruskal-Wallis test)
+-----------------------------+
| sector | Obs | Rank Sum |
|------------+-----+----------|
| Financial | 5 | 39.50 |
| Food | 7 | 104.50 |
| Media | 3 | 43.00 |
| Retail | 7 | 97.50 |
| Technology | 3 | 40.50 |
+-----------------------------+
chi-squared = 3.105 with 4 d.f.
probability = 0.5404
chi-squared with ties = 3.131 with 4 d.f.
probability = 0.5362
The last part conducts a ttest between technology and financial and again does not
find evidence that the true means are different (p=0.445).
. gen ind1=(sector=="Technology")
. replace ind1=(sector=="Financial")*2 if ind1==0
(5 real changes made)
. replace ind1=. if ind1==0
(22 real changes made, 22 to missing)
. ranksum totbrandequity, by(ind1)
Two-sample Wilcoxon rank-sum (Mann-Whitney) test
ind1 | obs rank sum expected
-------------+---------------------------------
1 | 3 16 13.5
2 | 5 20 22.5
-------------+---------------------------------
combined | 8 36 36
unadjusted variance 11.25
adjustment for ties -0.54

COURSE REP-P: RESEARCH REPORT STUDENT 70822344
155
----------
adjusted variance 10.71
Ho: totbra~y(ind1==1) = totbra~y(ind1==2)
z = 0.764
Prob > |z| = 0.4450
Grand Total score
. graph box GrandTotal, over(sector) title(Boxplot of Grand Total by Sector)
2040
6080
100
Financial Food Media Retail Technology
Boxplot of Grand Total by Sector
. kwallis GrandTotal, by (sector)
Test: Equality of populations (Kruskal-Wallis test)
+-----------------------------+
| sector | Obs | Rank Sum |
|------------+-----+----------|
| Financial | 5 | 41.50 |
| Food | 7 | 97.00 |
| Media | 2 | 28.00 |
| Retail | 7 | 93.50 |
| Technology | 3 | 40.00 |
+-----------------------------+
chi-squared = 2.256 with 4 d.f.
probability = 0.6887
chi-squared with ties = 2.262 with 4 d.f.
probability = 0.6876
. ranksum GrandTotal, by(ind1)
Two-sample Wilcoxon rank-sum (Mann-Whitney) test
ind1 | obs rank sum expected
-------------+---------------------------------
1 | 3 18 13.5
2 | 5 18 22.5
-------------+---------------------------------
combined | 8 36 36
unadjusted variance 11.25
adjustment for ties -0.13
----------
adjusted variance 11.12
Ho: GrandT~l(ind1==1) = GrandT~l(ind1==2)
z = 1.350
Prob > |z| = 0.1771
. restore

COURSE REP-P: RESEARCH REPORT STUDENT 70822344
156
.
end of do-file