Wenliang Du Syracuse University Vicky Singh Syracuse University Hao Syracuse University.

Examining the historical and present energy metabolismof a Rust Belt City: Syracuse, NY 1840–2005
Stephen Balogh & Charles A. S. Hall & Drew V. Gamils &Alexander M. Popov & Ryan T. Rose
# Springer Science+Business Media New York 2014
Abstract Early cities depended on local, solar-based energy resources for their metabolism.Over time, cities have become increasingly dependent on fossil fuels, both directly andindirectly, as they facilitate exploitation of solar resources from much farther away.Alternatives to fossil fuels, typically generated locally, often provide lower surplus energy tosociety. As cities consider the transition back to solar-based energy resources, it becomesnecessary to understand the capability of the solar-based economy to provide e.g. energy(including food) from nearby lands. To do so, we compared the energy metabolism(respiration) of a typical rust-belt city, Syracuse, NY, with the net primary production in thesurrounding county (production) over its development (1840–2005). We calculated the ratio ofrespiration to production (R:P) and examined how this ratio changed during the periods ofindustrialization, shifts in major fuel types, and deindustrialization. We found that from 1840to 1950 respiration became increasingly centralized in the urban core; since then it has becomemore diffused. Urban respiration exceeded production in the county by 9:1 in 1930, and itremains just under 2:1 today. Respiration reached an absolute (67 PJ) and a per capita (339 GJ)maximum in 1970, then fell by 40 % and 20 % respectively, due to deindustrialization andpopulation losses. Conversely, production increased 480 % from its lows in 1930 because ofreforestation and improved agricultural yields. What this means is that to achieve a higher P:Rratio requires either increased production of food and fuels in areas surrounding the city, ordecreased per capita energy consumption.
Keywords Urbanmetabolism . Energy . Food . Respiration . Production
Urban EcosystDOI 10.1007/s11252-013-0342-z
S. Balogh (*)Graduate Program in Environmental Science, State University of New York, College of EnvironmentalScience and Forestry (SUNY-ESF), 1 Forestry Drive, Syracuse, NY 13210, USAe-mail: [email protected]
C. A. S. HallDepartment of Environmental and Forest Biology, State University of New York, College of EnvironmentalScience and Forestry (SUNY-ESF), Syracuse, NY, USAe-mail: [email protected]
D. V. Gamils : A. M. Popov : R. T. RoseState University of New York, College of Environmental Science and Forestry (SUNY-ESF),Syracuse, NY, USA

Abbreviations
CHP Combined heat and powerDEC Domestic energy consumptionGJ Gigajoules = 109 joulesha HectareLULUC Land use land use changeMEFA Materials and energy flow analysisNPP Net primary productionPJ Petajoules = 1015 joulesR:P Respiration to production ratio
Introduction
Historically, cities depended principally on solar energy falling on their immediate environ-ments, or resource-sheds, to provide them with the food and energy necessary to support theirmaintenance, productivity, and growth (Cottrell 1955). Today’s cities, however, have becomehighly dependent on fossil fuels, especially oil, for their metabolism, both directly andindirectly, as they facilitate exploitation of solar resources from much farther away. Thetransition from local fuels derived exclusively from solar energy flows to fossil fuels andlarger resource sheds had wide ranging effects on urban development and land use, as well asthe impact of cities on natural environments. This transition increased substantially the netenergy available to society, removed the prior constraints of the regionally available food,wood, wind, and flowing water resources, and expanded the boundaries of their resource-shedsto a national and eventually a global scale. The population and economic output of citiesincreased concurrently with the increase in net energy availability.
Thus today’s cities rely on material and energy resources, goods, and services provided byboth local and distant areas exploiting diverse ecosystems. The economic “engines” of citiesare fueled mainly by fossil energy. Many environmental scientists and activists have longquestioned the sustainability of the increasingly globalized economic system to supply theneeded resources and the ability of the atmosphere, land, and oceans to act as a sink for theindustrial and consumer wastes frommodern society (Meadows and Club of Rome 1972; Daly1974; Daly and Farley 2003; Cleveland et al. 1984; Hall et al. 1986; Hall and Klitgaard 2012).For decades some have sounded alarm bells about the finite nature of important energy andmineral resources and criticized neoclassical economists for failing to understand the biophys-ical underpinnings of economic production (see especially Daly and Farley 2003; Hall andDay 2009; Hall and Klitgaard 2012). Nearly all politicians and economic leaders have ignoredthese warnings. Over the past decade, however, the importance of energy in the economicprocess became increasingly visible. Global oil production failed to increase with increasedprices and growing demand from developing nations. The price of food, commodities, andother processed materials increased simultaneously with the price of oil. Additionally, whenthe price of oil increases sharply, there is also a lagged, non-linear response of GDP contrac-tion, which seems to have happened during the last 10 out of 11 recessionary periods for mostof the Western economies (Hamilton 2003, 2011). There are many who believe that we havereached “peak oil”, that time at which the globe reaches its maximum production of oil(Campbell and Laherrère 1998; Deffeyes 2001; Aleklett and Campbell 2003; Deffeyes2006; Aleklett et al. 2010). While it is not clear that this has occurred at this point what isclear is that the growth of conventional sources oil, formerly at three or more percent a year,
Urban Ecosyst

has decreased to close to zero. While the timing is less clear for natural gas and for coal it isclear that the peaks of each are coming eventually. Peak oil, especially, will constrict our abilityto maintain the resource flows to our city.
Additionally, constraints on the use of fossil fuels may result from coordinated efforts at thelocal and global level that are designed to reduce carbon dioxide and other GHG emissions. Areport by UN-HABITAT (2011) estimates that 40–70 % of GHG emissions are directly emittedby cities, and 60–70 % of GHG can be attributed to consumption in urban areas. While there isless doubt about the urgency with which we need to address climate change collectively, thereis, however, considerable uncertainty about how climate change mitigation plans might impacturban material and energy flows, and periurban land use.
There are, of course, alternatives to fossil fuels, although often they provide lower surplusenergy to society and typically they are generated locally (Gupta and Hall 2011; Lambert et al.2013a). Thus the widespread introduction of renewable energy technologies would reverse thetrend of increasing dependence on global supplies of energy and refocus our attention onceagain on local environmental conditions and the productive capacity of local resource-sheds tomeet the needs of our cities. In essence, cities that once relied on local solar energy flows mayneed to again. But this transition would be accompanied with lower net flows to run oureconomies, which would probably have economic impacts.
To understand a city’s reliance on fossil fuels better, cities need to understand the capabilityof the surrounding lands to provide energy and fuel, as well as the trade-offs and potentialimplications of the transition from fossil fuels to alternative fuels. These issues should not beconsidered independently, but instead with respect to how the systems that provide humannecessities are imbedded within the broader ecological and social systems. While some earlierresearchers (Odum 1962; Wolman 1965; Duvigneaud and Denaeyeyer-De Smet 1975) used asystems approach to examine cities as metabolic or socio-ecological systems, these metabolicstudies have evolved from static tallies of the material and energetic needs of cities and theproduction of metabolic wastes, to consideration of the socio-economic drivers and emergentproperties of cities (see e.g. Folke et al. 1997; Krausmann and Haberl 2002; Huang and Hsu2003; Kennedy et al. 2007; Ngo and Pataki 2008; Hall 2011). Haberl et al. (2006) reasoned forthe inclusion of the human dimension into long term ecological research. Practitioners in theemerging interdisciplinary field of Long-Term Socio-Ecological Research (LTSER) study howsocieties interact with their environment over decades or centuries in order to answer questionsabout socio-ecological sustainability and environmental change (see e.g. Chapters 1, 10–15 inSingh et al. 2013). Ongoing LTSER research in Baltimore, Phoenix, and over 30 Europeancities evolved from long term ecological studies in these urban areas (Grove et al. 2013; Mirtlet al. 2013, in Singh et al. 2013). Novel work by Seto et al. (2012) describes the‘teleconnections’ between cities and distant resource sheds and emphasizes a process-basedcategorization along a gradient of rural to urban land uses. These authors discuss theimportance of the ‘periurban’ interface—spatially and structurally dynamic transition zonesoutside of cities which can be affected by local as well as distant socio-economic drivers.
Kennedy et al. (2011) categorized the current state of urban metabolism research as containingtwo related but non-conflicting schools of study. The first, based on the work of Odum (1962,1970, 1973) and Odum et al. 1995 describes metabolism in units of embodied solar energy, oremergy, and analyzes the stocks and flows from all components of the environment through theurban ecosystem, just as one might analyze the flow of solar energy through the food web in anestuary (e.g. Zucchetto 1975; Huang et al. 2001; Huang and Hsu 2003; Huang and Chen 2005).The second has its roots in industrial ecology and assesses the mass fluxes of materials to analyzeurban socio-ecological systems (e.g. Decker et al. 2000; Hammond et al. 1997; Eurostat 2001). Itis onlymore recently that authors examined changes in urbanmetabolism over time and quantified
Urban Ecosyst

the dynamic interactions between the city and its hinterlands (Barles 2007; Haberl et al. 2011;Balogh et al. 2012; Kim and Barles 2012; Billen et al. 2009; Billen et al. 2012). Haberl and Erb(2006) performed a similar analysis at the national level. Barles (2010) discusses the fractionatedstate of urbanmetabolism research and among other suggestions the author stresses the importanceof considering the “spatial and territorial contexts, as well as the agriculture—industry—citytriptych.” Krausmann (2013) bridges the gap between the Odum and industrial ecology method-ologies by analyzing the transitions in energetic metabolism and changes in the spatial relationsbetween city and its hinterlands over the 19th and 20th centuries in the city of Vienna, Austriausing an energy flow analysis consistent with materials and energy flow analysis (MEFA).
Climate change mitigation efforts are readily framed within an urban metabolism constructalso. Urban metabolism studies that are performed over time can provide insight about whether acity is becoming more or less sustainable from an energetic or climate change perspective (Sahelyet al. 2003; Ngo and Pataki 2008). These analyses also can provide practical information todecision makers e.g. by denoting the major material or energy flows or centers of respiration (andthus CO2 emissions), and depending on the boundaries, can also include impacts due to local orregional land use change or ‘teleconnected’ changes in distant lands (Seto et al. 2012).
To better understand the potential to substitute natural for fossil energy, Hall (2011)examined the metabolism of a “Rust Belt” city at the neighborhood scale over a gradient ofsocio-economic conditions. The author compared the natural energy production of urban forests(P) to the fossil energy consumed, or respired (R), in three Syracuse, NY neighborhoods andfound that the fossil energy consumed was 200 to 700 times the net primary production,implying that it would be very difficult to replace the services of fossil fuels. Higher ratioswere correlated with higher socio-economic status, i.e. the neighborhood with the highest percapita income had the largest R:P ratio, approximately 700:1. Urban metabolism metrics suchas the R:P ratio or measures of the ability of periurban land to support the food requirements ofan urban population (Billen et al. 2009; Balogh et al. 2012, Swaney et al. 2012) are tied tospecific locations that have unique combinations of land productivity, economic energyintensities, fuel prices, built environments, and climate. Although they may involve more effort(mainly to collect or derive local data), these empirical studies may provide a more locallyrelevant measure than e.g. a more aggregated calculation of a city’s eco-footprint.
In addition to the two long-term ecological research sites located in U.S. urban areas (Phoenix,Arizona and Baltimore, Maryland), Syracuse, NY was one of 21 cities selected to receive anUrban Long-Term Research Area exploratory grant (ULTRA-Ex) from the NSF. Two majorquestions drive this interdisciplinary research: “What is the socio-ecological metabolism (SEM)of a rust belt city, how has it changed over time, how might it be vulnerable to future externalfactors such as restrictions in oil availability?” and “how might city revitalization emphasizingnatural ecosystem processes via green infrastructure affect SEM at both the city/regional and thehousehold/neighborhood level in the future?” Our research contributes to the efforts to answerthese questions.We believe rust-belt cities provide interesting case studies, as their decentralizing,“post-industrial” nature presents a stark comparison to the urban metabolism literature that hasfocused mainly on growing mega-cities. We are interested too in the potential for this research toinform other cities which may undergo a similar deindustrialization in the future. Additionally,climate changemay encourage a reversemigration from increasingly drought-stressed cities in thedesert Southwest to the water-rich Rust Belt cities in the Northeast. This may lead to anopportunity for economic growth, but also increased ecological stresses and new challengesrelated to the increased energy and material requirements of a growing population.
The goals of this study were to expand the area of focus for metabolic analysis from theconsumption at the neighborhood scale to include the greater City of Syracuse, and expand theboundaries of natural production to the regional (county) level. Also, our goal was to
Urban Ecosyst

understand the potential for solar-based energy flows to replace fossil fuels better, anddetermine whether the balance between city respiration and natural production has beenimproving or worsening. Our objectives were to answer the following questions: (1) Howdoes the respiration of food and fossil energy (R) in the City of Syracuse compare with the netprimary productivity (P) of its original resource-shed (i.e. Onondaga County) over its history?(2a) How has the ratio of city respiration to county production (R:P) changed during the periodof industrialization, during shifts in major fuel types, and during deindustrialization? Is the R:Pratio improving (i.e. becoming smaller)? (2b) Similarly, how has forest and agricultural landcover and their net production changed in the county during these transitions?
The practical meaning of these ratios are still being understood, but it is clear that a higherR:P ratio indicates a less energetically sustainable city, and that energy security may beimproved through measures to reduce the numerator or increase the denominator (Hall2011). The answers to these questions can help inform us about the ultimate potential forsolar energy flows to replace urban fossil fuel consumption. Additionally, an analysis of theflows which make up the numerator (energy use) can help decision-makers understand thelargest energy demands and how they might be curtailed, or to understand the magnitude ofrenewable technologies e.g. solar or wind that would need to be installed to make a measurabledifference in sustainability. The results would also provide information to decision-makersabout the potential to increase productivity from urban and periurban land.
The city of Syracuse and Onondaga County—Study boundaries
The City of Syracuse lies within Onondaga County in Central New York State (Fig. 1).The boundary for the City of Syracuse has changed over time: Syracuse began as a smallsettlement near the current downtown area and later expanded to include sections ofnearby towns. We defined the urban boundary for this study as the current Syracuse metropol-itan area as defined by the Syracuse-Onondaga County Planning Agency1, which encompasses65 km2 (see map, Fig. 1). We chose to define Onondaga County as the regional area ofproduction, as this area once provided the city with nearly all of its materials and energy, andbecause county and city leaders have jointly promoted efforts for implementing green infra-structure and other sustainability programs. Syracuse is located centrally within the county andthe average distance to the county border is approximately 25 km. The area within the countycontains 2,016 km2.
Population
The Onondagas (local Native Americans) lived in small family-based clans throughout thearea which became Onondaga County. Their maximum population was estimated at approx-imately 2,700 (Jones 2008). By the turn of the 19th century, European immigrants andmigrants from outside of the area had formed nine small towns in Onondaga County andthe population reached 7,406 US citizens (which then did not include Native Americans) (USCensus 1800). By 1822, the Onondagas had lost nearly 95 % of their land and their populationhad declined to 309 (Geddes 1859).
Initially, the population living in Syracuse made up only a small proportion of the countypopulation. However, the city continued to grow in importance and by 1930 city residents
1 The area immediately adjacent to the west of the city which includes the former Solvay Process Company/Allied Chemical has also been included in the respiration (consumption) calculations, as this was a vital part ofthe industrial and economic growth of the city.
Urban Ecosyst

made up almost three quarters of the county population. The industrial economy grew rapidlyand included automobile, ceramics, chemical and many other industries (Chase 1924). The cityreached a maximum recorded population of 220,583 in 1950 (U.S. Bureau of the Census1950). Like many cities in the Rust Belt, the urban population began to decline as industryincreasingly faltered and as residents relocated to the suburbs (Hevesi 2004). The citypopulation decreased to 145,170 in 2010, a decline of 34 % from its peak. The OnondagaCounty population peaked in 1970 at nearly 473,000 (US Census Bureau 2013). Since thattime, the county’s population has declined slightly and stabilized.
Economy
Over its history, the economy of the city has been highly dependent on the extraction of locally-derived natural resources (brine and limestone) and energy from solar flows (mainly stocks ofbiomass that had accumulated over hundreds of years, i.e. the old growth forests that were originallyprevalent in the county, but also the direct use of solar energy). After local energy sources weredepleted, fuels had to be imported from larger distances. The completion of the Erie Canal in 1825allowed increased trade with increasingly distant areas, including New York City and Canada,which facilitated the import of both raw materials and finished goods. Railroad connections to thecity followed soon after and increased the amount and speed at which goods could be transported.Eventually fossil fuels replaced solar-based energy flows (animal and animal-drawnwater transport,plus wood and direct solar for evaporation) as the dominant form of energy used in the urbanecosystem, allowing the city to develop into one of the most important industrial centers in all ofNew York State. This prosperity and growth continued through the 1950s.
Two extractive industries were the major drivers of economic development of the City ofSyracuse: First, salt production, and later the production of soda ash and other chemicals. Both
Fig. 1 Map of Onondaga County with City of Syracuse and town boundaries. N.Y. State with Onondaga Countyindicated in black (inset). The village of Solvay is located adjacent to the city in the Town of Geddes. Source:Wikimedia Commons. Based on Sub-County Map, Source: http://libremap.org/data/boundary/
Urban Ecosyst

relied on local deposits of brine which had formed from ancient seas over geologic time. Thechemical industry also required large amounts of limestone, which was and still is abundantwithin the county. Salt production was central to economic growth in Syracuse in the 19thcentury. Most salt was produced by boiling brine in large iron kettles (Bell 1998). Initially, the saltworks were fuelled by wood, which was locally abundant. The nearby forests were quicklydepleted and wood had to be shipped in from further and further away in and eventually outsidethe county. By the mid-20th century, fuel wood supplies in the surrounding Onondaga Countywere exhausted and coal imports became competitive with imported wood (Geddes 1859). By thelate-19th century, much of the boiled salt production used coal (Underhill 1868; Cook 1853).Starting in about 1840, salt made from solar evaporation replaced some of the boiled productionfrom wood, an early example of replacing industrial fuel consumption with direct solar energy.
As the salt trade waned, the economic development of Syracuse turned to other industriesthat were similarly reliant on the extraction and processing of local resources. The mostimportant of these was the Solvay Process Company (beginning in the 1880s) which generatedsoda ash (Na2 CO3) from brine (NaCl) imported via pipelines from wells in southernOnondaga County and limestone (CaCO3) from local quarries. These local resources weretransformed into soda ash and other products by importing and consuming vast amounts ofcoal. Although the Solvay Process Co. was located just outside of the city boundaries, weinclude it in our calculations because it was such an important part of the city’s industrialhistory, and the largest consumer of materials and energy.
In the post-WorldWar II period, as in many of the former industrial cities in from theMidwestto the Northeast, industrial production declined and like many other Rust Belt cities, the economybecame increasingly service-oriented. Many of the former industrial giants in Syracuse relocatedtheir factories to the Southern U.S. and then out of the country. The “rusting” of Syracuse andother former industrial cities situated around the Great Lakes took place for many reasons,including the liberalization of trade, falling labor participation, rising energy prices, globalizationof production, and also a decline in consumer demand as discretionary income fell, among otherreasons (for a good review of economic and demographic changes in Rust Belt cities see Vey2007). Syracuse was left with a declining urban core, post-industrial waste and environmentaldamage, and sprawling suburban development—a situation that is little changed today.
Methods and data sources
We quantified the energy metabolism (i.e. energy used and produced) of the City of Syracuse,using material and energy flow accounting methods (MEFA) developed most fully in the fieldof industrial ecology (Fischer‐Kowalski and Hüttler 1998; Daniels and Moore 2001; Eurostat2001) and energy flow accounting as developed by Odum (1956, 1962). We derived recentlocal energy consumption from state and federal data and used various historical records forearlier times (Table 1). We included industrial energies as well as traditional energy carrierssuch as food, biomass, and hydropower. We calculate the indicator Domestic EnergyConsumption (DEC), which is a measure of the apparent energy consumption of food andfinished fuels in a socio-ecological system (Krausmann 2013). Consistent with the methodol-ogy in Krausmann (2013), we convert common units of energy carriers (gallons, barrels,kilowatts) into joules. Since the energy intensity of the salt production and Solvay processindustries were well above the historical mean, we relied more heavily on local data tocalculate DEC for the period of 1840–1900; much more than for subsequent periods (SeeAppendix for details). DEC is defined by Eq. 1 below, and includes mainly imported finalenergy carriers such as petroleum and some smaller conversions of primary energy to final
Urban Ecosyst

energy within the defined boundaries of the city. We assume all net energy imports areconsumed.
DEC ¼X
Extraction of energy carriersð Þ within the boundaries of the socioeconomic system
þX
Energy imports−Exports of energy
ð1Þ
We estimated annual natural energy production in Onondaga County by classifying landcover into the following categories: forest, agricultural lands, and other (wetland, urban/developed, and unknown) and multiplying the area of each by the production of land of thattype. For the purposes of this study, we excluded net production from the “other” categoriesbecause typically resources do not enter “useful” urban metabolism flows (such as fire woodand food) from these land cover/land uses; although it is true that wetlands and some pocketsof urbanized area can be very productive and do provide important ecosystem services (Kibbyet al. 1980; Nowak and O’Connor 2001). To estimate total net primary production, wecalculated the production from agriculture and forests in Onondaga County by multiplyingtime series estimates of the land area in each category by appropriate estimates of productivity(See Appendix for details). Zipperer et al. (1990), Nyland et al. (1986), Hill (1985), Smith et al.(1993) and Zipperer (2002) have published estimates of historical land use change includingforest removal, conversion to agriculture, and regeneration. Tetra Tech EM (2010) compiledthese land use data and data from GIS analyses to determine land cover change over time inOnondaga County. We calculated annual net primary production from forests usingempirically-derived forest growth rates in New York State from Brown and Schroeder (1999),assuming a species mix of 75 % hardwoods and 25 % softwoods (Reynolds and Pierson 1942).Due to the uncertainty in estimates of forest net primary production and mortality data in NewYork State by Brown and Schroeder (1999), we performed a sensitivity analysis to determine theeffects of that uncertainty on total county productivity and on the R:P ratio. We also compare ourestimates of NPP with those derived using formulas from Lieth (1975), which uses yearly meantemperature and precipitation to estimate total NPP per unit area2.
We calculated the ratio of urban respiration to county production (R:P) dividing DEC as ameasure of total respiration by the summed net production from forests and farms (includingcrop residual biomass). We plotted this ratio over time to examine the R:P trend over theevolution of energy metabolism during industrialization, shifts in major fuel types, anddeindustrialization. We identified major contributors to respiration in the city and productionin the county. We calculate the energy demand from livestock within the county and compare itto city respiration and total county net primary production.
To explore energy consumption and fossil fuel dependency in Syracuse and OnondagaCounty further, we calculated other indicators of sustainability including per capita energyconsumption and included a preliminary examination of Syracuse’s energy footprint. Weexamined the effects of excluding renewable fuel consumption from total respiration and alsothe effects of spatial changes in energy consumption by estimating DEC for Onondaga Countyresidents living outside of the city boundaries. We calculated per capita energy direct energyconsumption by dividing total DEC by population. We estimated the energy footprint of theCity of Syracuse by calculating the land area needed to provide an equivalent amount ofnatural energy production per acre of urban respiration.
2 Lieth formula for NPP based upon mean temperature: NPP ¼ 30001þe1:315−0:119 tempð Þ . Lieth formula for NPP based
upon annual precipitation: NPP=3000(1−e−0.000664(Precip)). Mean temperature for Syracuse=8.6 deg C; Annualprecip. = 988.1 mm per year (NOAA 2013).
Urban Ecosyst

Table1
Datasourcesby
sector
used
tocalculateenergy
consum
ptionstatisticsfortheCity
ofSy
racuse
End
usesector
Early
industrial(1840–1900)
Peak
industrial(1900–1970)
Post-industrial(1970–2010)
Residential
Woodandcoal:Monographs,localnewspapersand
journalarticles.Per
capitafirewoodconsum
ption
from
natio
nallevelestim
ates.
Woodandcoal:percapitaUSand
stateleveldata,S
tatecommission
reports,journalarticles.
Naturalgas:Localutility
data,o
rstatelevelpercapitadata
Electricity:Localutility
data,o
rper
capitaandpopulatio
nadjusted
regionalandstateleveldata)
Allfuelsandelectricity:S
tateleveldatacorrected
forpopulation,climatedifferences,andhome
heatingfuelchoice
Com
mercial/Industrial
Woodandcoal:Monographs,localnewspapersand
journalarticles.Per
capitafirewoodconsum
ption
from
natio
nallevelestim
ates.
Coal:Industry
data,p
ercapitaand
populatio
nadjusted
regional,state,
andfederalleveldata
Naturalgas:Localutility
data,o
rfederalpercapitadata
Allfuelsandelectricity
:Stateleveldatacorrected
forpopulatio
n,clim
atedifferences,andhome
heatingfuelchoice
Transportation
Horses:Countylevelpercapitaow
nership
Trains:Nationalor
regionalstatisticson
energy
consum
ptionpermile
oftrack
Trains:regionalstatisticson
energy
consum
ptionpermile
oftrack.
Somelocalutility
dataavailable
forelectrictrains
andtrolleys
Personalvehicles:Nationalandstate
levelregistratio
n,milestravelled,
andfuelefficiency
Airplanes:Nationalandstatelevel
fuelconsum
ptionstatistics,corrected
bypopulatio
nandairtraffic
Allfuelsandelectricity
:Stateleveldatacorrected
forpopulatio
n,clim
atedifferences,andhome
heatingfuelchoice.S
tatelevelgasolin
econsum
ption
Food
demand
Nationallevelpercapitadaily
food
availabilityestim
ates
References
Respiration:
Syracuse
Journal(new
spaper)
(various
years),N
.Y.D
epartm
entof
StateCensus
(1807-1925),U.S.C
ensus(1840-2010),Hunt
etal.(1848),Tappan
(1853),C
ook(1853),
Tenney
andLeeds
(1855),F
isher(1858),G
eddes
(1859),U
nderhill(1868),N
ewYork
Constitu
tionalConvention(1868),V
ose(1873),
The
American
Railway
Tim
es(1870),C
layton
(1878),B
arr(1879),Journalof
theSo
cietyof
Production:
N.Y.D
epartm
entof
State
Census(1807-1925),U.S.C
ensus
(1840,
1850,1
860,
1870,1
880,
1890,
1900-2010),B
rownandSchroeder
(1999),Z
ipperer,Burgess
andNyland
(1990),Nyland,
ZippererandHill
(1986),H
ill(1985),S
mith
,Marks
and
Gardescu(1993),Z
ipperer(2002),
Eurostat(2007),reportsfrom
theUS
Urban Ecosyst

Table1
(contin
ued)
End
usesector
Early
industrial(1840–1900)
Peak
industrial(1900–1970)
Post-industrial(1970–2010)
ChemicalIndustry
(1896),U
.S.C
ensus(1901),
NYSPu
blicServiceCom
mission
(1907-1922),
Smith
(1916),S
mith
(1916),H
ydro-Electric
Power
Com
mission
ofOntario
(1919),S
churr
(1960),W
hite(1979),H
erbert(1992),B
ell
(1998),M
cShane
andTarr(2007),T
heNational
Academies(2007),B
alogh(2010),N
YSE
RDA
(2011),E
RS2012;EIA
(2013),A
llied
Chemical(n.d.)
ForestSerivce
(USF
S2012),andreports
forthecounty
government(Tetra
Tech
EM
2010),University
ofMissouri
Extension
(2010),B
aloghetal.(2012),
USD
A(2012)
Urban Ecosyst

Data sources
We use a broad range of data sources in our attempt to provide a nearly complete history ofenergy flows, including agricultural and natural production, in the City of Syracuse andOnondaga County over their history. References used to derive energy consumption in thecity and county-wide production from forests and farms are included in Table 1. Where annualtime series for energy consumption or imports did not exist or were incomplete, we adjust thelocal data with per capita estimates for the same years for New York State or U.S. energyconsumption per the methodology in Ngo and Pataki (2008) and undertook linear interpolationbetween existing data points. Our detailed methods for estimating city level energy consump-tion are included in Appendix.
Results
The respiration in the City of Syracuse exceeded the net primary production in OnondagaCounty except for its formative years during the 1840s and 1850s, and remains nearly twice ashigh today. Without fossil fuels, the energy demand from city residents and their economicactivity could not be met by natural production in the county—even though the county is some31 times greater in area than the city. The ratio of respiration to production has steadilydecreased since the 1960s reflecting the deindustrialization and depopulation of the city.
The direct energy consumption in Syracuse (respiration) was 2.1 Petajoules * yr−1 (PJ) in1840, equivalent to about 358,000 barrels of oil3. Urban respiration reached an absolute (67 PJ)and per capita maximum in 1970 (Figs. 2 and 4), then declined by 40 % to 40 PJ * yr−1 in2007—the equivalent of about 6.8 million barrels of oil. When respiration (DEC) is adjusted toinclude only non-renewable energy consumption, the R:P ratio is reduced but only slightly,around 10 % on average (Fig. 3). Production in Onondaga County farms and forests measuredin energy units, remained at or around 5 PJ * yr−1 from 1840 to 1920, then declined to a low ofabout 4.3 PJ * yr−1 in 1930 (Fig. 2). After 1930, the area in farms began to decrease and forestedland increased, which resulted in an increase in net production from 1930 to 2000, in part due toimprovements in agricultural yields and forest regeneration. Annual increases in biotic produc-tion took place until reaching a plateau at about 20 PJ* yr−1 from 2000 to 2007 (Fig. 2).
The energy demand from livestock in Onondaga County ranged from 2.6 PJ in 1860, to 1.4PJ in 2000. Thus livestock demanded over half of the available net primary production in thecounty in the 19th century when forest cover was reduced and farm yields were low. In the2000s, livestock consumed around 7 % of the county’s NPP annually.
Changes in the R:P ratio
The ratio of respiration in the city to the net primary production in the county exceeded 1:1 by1860, due to the rapid growth of both the salt industry and the city’s population. After a periodof intensive industrialization and land use conversion from forests to farms, the R:P ratioreached a maximum of 9:1 in 1930 (Fig. 3). The combination of increased forest cover andimproved agricultural yields, as well as the declining urban population and deindustrialization,reduced the R:P ratio from a high of 9:1 to just under 2:1 by the 2000s. The rate of decrease
3 A petajoule is 10^15 joules, and is equivalent to the energy contained in 280 GWh of electricity, approximately171,000 barrels of oil, 32 million cubic meters of natural gas, or 29 million liters (7.6 million gallons) of gasoline(Australian Department of Resources, Energy and Tourism 2012).
Urban Ecosyst

has slowed over the past decade or so (Fig. 3). Adjusting respiration (DEC) to include onlynon-renewables reduces the maximum R:P ratio to 8:1 in 1930, and the 2005 value by 12 %(Fig. 3).
Per capita energy consumption
Due to the relatively low population and high energy requirements of the salt industry, percapita energy consumption was nearly 190 GJ * year−1 about the time of the incorporation ofthe City of Syracuse in 1847, nearly twice the per capita estimate for that period for the entireU.S. (Schurr 1960). Due to the rapid growth in population and the decline in the salt trade, theper capita energy consumption in Syracuse fell by half by 1885. From 1885 to 1900, ourestimates of per capita energy consumption for Syracuse that were derived from local datawere similar to those of Schurr (1960) for the United States. By 1940, annual per capita energyconsumption reached 180 GJ * year−1 again, and then increased to a maximum of 339 GJ *year−1 by the 1970s (Fig. 4). For comparison, the maximum per capita total primary energyconsumption for the U.S. was 379 GJ * year−1 in 1978–1979 (U.S. EIA 2012). Per capita
-
10
20
30
40
50
60
70
80
1820
1840
1860
1880
1900
1920
1940
1960
1980
2000
2020
PJ
(10^
15 J
)
Respiration Production
Fig. 2 Respiration in the City of Syracuse and production in Onondaga County (including Syracuse) inPetajoules (10^15 J) from 1840 to 2007. The respiration of non-renewable energies (fossil fuels and nuclear)is indicated by the gray circles and dotted line
-
1
2
3
4
5
6
7
8
9
10
1820 1840 1860 1880 1900 1920 1940 1960 1980 2000 2020
R:P
Rat
io
R:P ratio 1:1 (R-renewables):P
Fig. 3 Ratio of respiration in the City of Syracuse (energy and food consumption) to the production inOnondaga County from 1840 to 2007. The R:P ratio of non-renewable fuel consumption to production isindicated by the gray circles and dotted line
Urban Ecosyst

energy consumption in Syracuse fell to 271 GJ * year−1 in 2005. It is important to note that adirect comparison between our estimates and those of the EIA was not possible, as thecalculated value for Syracuse energy consumption was for refined energy carriers (e.g.gasoline, diesel, electricity), which require substantially larger amounts of primary energybefore they are transformed or refined into finished products.
The energy metabolism of Syracuse experienced three major transitions in dominant fueltypes: from wood to coal, from coal to oil and gas, and from oil and gas to a greater diversity offuels and increased electrification (see Appendix, Fig. 8). Similarly, Krausmann (2013)describes four major phases in the evolution of the energy metabolism of Vienna, Austria:the Biomass phase (pre-1865), Coal phase (1865–1928), Oil driven growth (1934–1973), andIndustrial metabolism (1973-present). The City of Syracuse experienced similar phases inenergy metabolism over its history, with one significant difference: instead of the sloweconomic and population growth that continued in Vienna after the Oil driven growth phase,Syracuse experienced a slowing in economic growth, population decline, and a transition to apost-industrial service-based economy. Despite this, the annual per capita energy consumptionin 2005 in Syracuse (272 GJ) is 2.5 times higher than the value reported by Krausmann forVienna (110 GJ).
During theBiomass phase (pre-1860), the population in Syracuse increased as peoplemigratedinto the city during a period of rapid industrialization. The result was a consolidation of energyconsumption in the urban center. The consumption of wood energy doubled from 1840 to 1855.From 1850 to 1885, however, the energy availability per capita declined by half as the populationincreased more rapidly than available energy (Period 1 on Fig. 4). Prior to the widespread
0
50
100
150
200
250
300
350
400
- 50,000 100,000 150,000 200,000 250,000
GJ
per
cap
ita
Syracuse Population
1840
1885
1940
1970
2005
12
3
4
Fig. 4 Syracuse population vs. per capita energy consumption. Four periods with distinct trends in per capitaenergy consumption are noted, and are described in the text. These periods correspond fairly well to transitions inthe major fuel types indicated in Fig. 8 in the Appendix
Urban Ecosyst
availability of coal, Syracuse residents wrote editorials complaining of the scarcity and increasedprices of wood and alternative fuels (Syracuse Journal (newspaper), multiple years).
In theCoal phase, (1860–1920), fuel inputs to the urban metabolism of Syracuse shifted fromsolar based fuels to coal, and its population, industry, and the built environment grew rapidly.Energy availability per capita nearly doubled during this period (Period 2 on Fig. 4), and fuelprices were volatile but generally less expensive than previously. By the 1870s, over half of theenergetic metabolism of the city was fueled by coal, with boiled salt production consumingapproximately 70 % of coal imports. Peak boiled salt production occurred in 1870 at 5.9 millionbushels, requiring the energy equivalent of 167,000 tons of coal. As the salt trade waned, theSolvay Process Company, established in 1884, began to consume large amounts of coal. Coalwas the predominant fuel during the early 20th century—providing 73% of all energy consumedin the city by 1910. Prior to natural gas discoveries and the construction of delivery pipelines,coal-derived gas provided light and heat to Syracuse streets, homes and businesses. For example,in 1920 Syracuse residents consumed 1.5 billion cubic feet of coal-derived gas and an additional29,000 short tons of coal to generate electricity locally (NYS Public Service Commission 1907–1922). The Solvay Process Co./Allied Chemical consumed approximately 547,000 short tonsper year (1,500 t per day) at peak production (Allied Chemical n.d.). Total coal consumptionpeaked in 1960 at 25 PJ/year, during the transition to petroleum fuels.
During the Oil driven growth phase (1920–1970), coal was replaced primarily by oil andnatural gas. Further diversification of energy carrier type took place over the latter half of the20th century. Per capita energy consumption doubled without a concurrent increase in popu-lation (Period 3 on Fig. 4). Natural gas pipelines supplied gas from local wells, Pennsylvania,and points further south. Demand for finished petroleum products surged after the introductionof kerosene and other petroleum products for lighting and home heating and production ofautomobiles. By 1950, there was one vehicle for every 5 residents (US FHWA 1995). Fuel oiland natural gas furnaces replaced coal boiler heating systems in homes. The importance of localelectricity production decreased after Syracuse was connected to the transmission lines fromNiagara Falls in Western New York in 1906 (Kolkin 1906). This abundant source of electricitylowered costs and increased demand for electricity in Syracuse homes and businesses.
During the final energy metabolism phase in Syracuse (1970 to present), total urbanrespiration decreased rapidly as the city deindustrialized and depopulated (Fig. 2). Energyconsumption became decentralized as the county developed relative to the city and thedeindustrialization of the economy continued. Per capita energy consumption and populationdecreased (Period 4 on Fig. 4). These transitions changed the spatial distribution of urbanmetabolism, which we discuss in detail below. The final major energy source, nuclearelectricity generation, began in the region in 1969 with the completion of Nine Mile Point 1facility in Oswego, NY. Today nuclear power supplies approximately 4 % of total final energydemand in Syracuse. Some small wind and solar electricity generators have been added withinthe city limits and surrounding county, but this energy is negligible compared with themagnitude of the large urban energy flows.
Effects of spatial changes on the R:P ratio
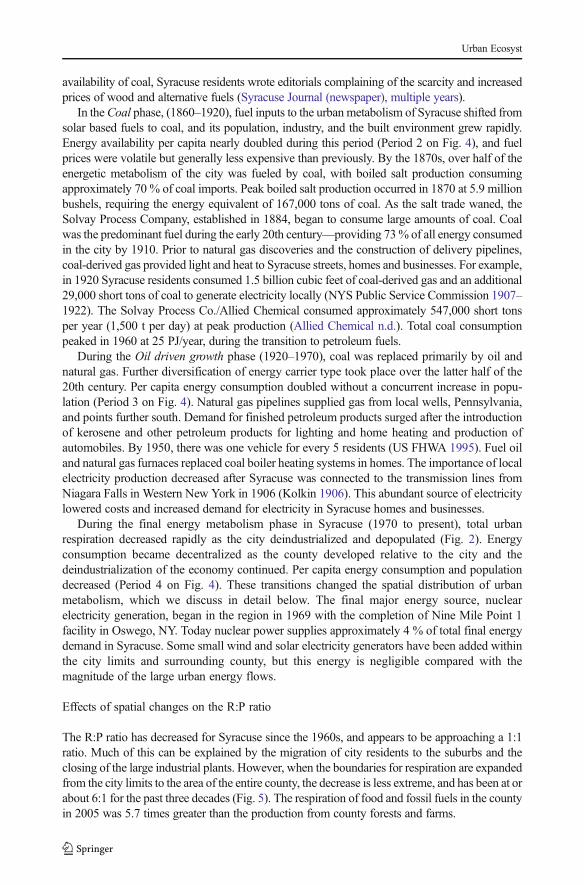
The R:P ratio has decreased for Syracuse since the 1960s, and appears to be approaching a 1:1ratio. Much of this can be explained by the migration of city residents to the suburbs and theclosing of the large industrial plants. However, when the boundaries for respiration are expandedfrom the city limits to the area of the entire county, the decrease is less extreme, and has been at orabout 6:1 for the past three decades (Fig. 5). The respiration of food and fossil fuels in the countyin 2005 was 5.7 times greater than the production from county forests and farms.
Urban Ecosyst

Sensitivity analysis
We performed a sensitivity analysis on annual net primary production (NPP) from forests. Wesubstituted both the high and low estimates for NPP in Onondaga County, which we derived fromthe range of estimates of aboveground production and mortality in hardwoods and softwoods byBrown and Schroeder (1999). The results indicate that, depending on the year, the R:P ratiomay be15–24% higher to 4–11% lower than our estimates, however the long-term trend for the R:P ratioin Syracuse was preserved. Estimates of net primary production derived using the annual meantemperature and precipitation equations by Lieth (1975) were 43 % higher than our estimates.These estimates would include small perennial plants, non-marketable trees and herbs that wouldnot be included using our methods. If this additional net primary production was included, the R:Pratio would decrease slightly e.g. from 1.9:1 to 1.7:1 in 2005. There are larger uncertainties inenergy consumption estimates, especially for early years in the city’s history. However, we wereable to validate our estimates of per capita energy consumption derived from local data againstother per capita estimates when data were available (e.g. see Fig. 10 in Appendix).
Discussion
The disparity between urban energy consumption and production in the surrounding countyindicates that to meet the city’s current fossil energy needs from solar-based energy sources wouldrequire a productive area more than twice the size of Onondaga County, assuming an equivalentaverage net primary production per unit area and the ability to utilize in some way all the netecosystem production. Finished oil products and natural gas constitute about 70 % of the directenergy consumption (DEC), indicating that the city and its periurban areas are vulnerable topetroleum supply disruptions and price increases. Renewable energy technologies are our onlycurrent alternative to increasingly lower quality, polluting, and CO2-emitting fossil fuels. However,the percent of renewable energy use in DEC has remained about 8 % since the late 1980s; nearlyall of that total from hydropower and biomass. More recent solar and wind installations have notmade a noticeable impact on the urban metabolism of Syracuse, and this study indicates that asubstantial increase inwind or solar generationwould be required tomeaningfully improve the R:Pratio (i.e. substituting for non-renewable energy use included in DEC).
In 2005, annual energy consumption per hectare within the city (6,940 GJ) requires 41 ha ofproductive land in the resource-shed, with an average net production of 168 GJ per hectare. As
-
2
4
6
8
10
12
1960 1970 1980 1990 2000 2010
R:P
rat
io
R:P Onon R:P Syr
Fig. 5 The ratio of respiration to the production from farms and forests in Onondaga County in Syracuse (gray)and Onondaga County (black), 1960–2005. The 1:1 ratio is indicated by the dashed black line
Urban Ecosyst

Hall (2011) notes, this assessment can be misleading because, while trees and some agricul-tural residues are good for providing heat and even electricity, their conversion to liquid fuelshave poor efficiencies (energy out/energy in). Two factors can influence the amount of energyservices delivered to society from a given amount of primary energy: the ways which societieschoose to allocate their available energy, and the state of technology. We do not suppose thatagricultural residuals could replace highly refined electricity or transportation fuels on a unitfor unit basis. Rather, the calculation of total available net primary production on an annualbasis provides an upper limit to the energy feedstock available from biomass. In practice,transforming biomass from its raw state to finished fuel products requires energy, which can beprovided in part from biomass itself. The efficiency of the production of finished fuels frombiomass varies from 12 to 35 % for biofuels (IEA 2008), to 22–45 % for electricity (IEA2009), to 85–90 % for combined heat and power systems (IEA 2009). Thus the potential forreplacing domestic energy consumption (DEC) could be several times lower than annual NPPdepending on its allocation, and the land area needed (energy footprint) may be much largerthan our 41:1 estimate. The R:P metric highlights the net primary production of local landwhich depends e.g. on climate, soils, land use, agricultural techniques, etc. Including assump-tions about the transformation efficiencies for delivered energy services could conceal impor-tant differences in productivity over time and between locations.
It is difficult to determine also whether the fall in per capita energy use in Syracuse since1970 is due to improvements in energy efficiency or solely to the closing down of heavyindustry. The indirect use of energy, that is the energy embodied in the finished goods andservices that enter the city boundary, is not considered in this analysis. Weisz and Steinberger(2010), link higher income lifestyles with increasing indirect energy use. It is conceivable thatthe per capita indirect energy use from the consumption of material goods by city residentscould have increased during this period, even as total direct energy use per person declined asindustry departed. Certainly, the import of beef, pork and other meat reduces the local demandon net primary production in the county and represents a significant source of indirect energyuse. If the countywere to raise all of the livestock to support the current meat demand of the city,a large proportion of county productivity would need to be redirected support the increasedpopulation of these animals. However, given the lack of economic growth in Syracuse and otherRust Belt cities in comparison to other US cities, the potential effects of indirect energyconsumption on the R:P ratio overall may have been commensurately muted in these areas.
Practical uses for the R:P ratio
Although the practical implications of the R:P ratio are still being understood, we believe theR:P ratio is a useful tool that can be used alongside other metrics of urban metabolism (e.g.material and energy flow analysis, food-print analysis, net energy analysis) to better under-stand the degree to which a metropolitan area is able to be supported by local solar-basedenergy flows, and if examined over time using long-term socio-ecological research methods,whether it is becoming more or less sustainable. For example, the two measures (R and P) canbe plotted against one another over time (Fig. 6). If one assumes that anything below a 1:1ratio of respiration to production is sustainable, one can determine the degree to which a cityexceeds its local production, and whether the relation is improving.
Spatial transitions in population and energy consumption
The respiration and production of energy in Onondaga County has varied spatially over itshistory, from small dispersed settlements supported by local production, to a centralized center
Urban Ecosyst

of respiration that outgrew the ability of the surrounding area to supply its energy and materialneeds. Later, this trend reversed. Since 1950, there has been a decentralization and diffusion ofrespiration. Pendall (2003) describes this phenomenon as “sprawl without growth”. However,respiration still exceeds greatly the ability of the original resource-shed to provide sufficientenergy for the inhabitants’ socio-ecological metabolism. This is true especially when weconsider the total population of Onondaga County and also the large conversion losses thatwould be needed.
Transitions in the dominant fuel type consumed in urban respiration can influence landcover and land use in a city’s resource-shed, as can the development of new agriculturaltechnologies (Krausmann 2013). The transition from wood fuel to coal had profound effectson land use in Onondaga County. The forested area declined through the 19th century, and sodid per capita energy availability. Coal imports reduced the constraints in energy availability,and reduced pressure for wood harvesting (although the forested land continued to declinethrough the 1930s). It is possible to calculate the equivalent forest area needed to provide theenergy equivalent in imported coal (Krausmann 2013). Assuming that approximately 0.57metric tons * hectare−1 * year−1 (approximately 21 GJ) of wood could be harvested sustainablyfrom Central New York woodlands (Woodbury 2010), we calculated that the area of this‘virtual woodland’ was nearly 714 km2 in 1860, and grew to over 7,000 km2 by 1910 (Fig. 7).This is equivalent to 300 % of Onondaga County and 16 % of the land area of all of New YorkState. In comparison, between 1855 and 1910 there were approximately 18 to 19 km2 ofstanding forest out of 2,016 km2 in Onondaga County; the majority of the remaining land hadbeen cleared for fuel and converted to farms. Coal and hard wood were and continue to beinterchangeable for many industrial and power generation uses, mainly to generate heat energyfor converters (i.e. steam trains able to be powered by coal or wood, modern coal plants “co-fired” with biomass). In periods of scarcity, usually due to high prices or economic recession,biomass from wood is an easily substitutable form of energy and a populace with littlealternatives often turns to wood for heating and cooking fuels (see e.g. Zezima 2008;Papachristou 2011; Stamouli and Bouras 2013).
1
10
100
1 10 100
Res
pir
atio
n (
PJ)
Production (PJ)
1840
2005
1970
1930
Fig. 6 Respiration in Syracuse, NY vs. net primary production in Onondaga County plotted on a log-log scalefrom 1840–2005. The 1:1 ratio is indicated by the dashed black line. Sustainable socio-ecological systems areassumed to be those that have R:P ratios equal to or less than one
Urban Ecosyst

By 1930, 72 % of Onondaga County residents lived in Syracuse, at a density of approx-imately 3,220 people per km2. In contrast, the population density of the remaining county areawas around 42 people per km2, although most of these residents lived in towns that surroundedthe city. Assuming equivalent per capita energy consumption, energy consumption in the citywas 77 times greater per unit area than in the surrounding county. This disparity was mostlikely greater, as typically rural towns and villages did not have heavy industry, nor were theyconnected to the delivery systems for coal gas or electricity. They cut a lot of firewood.Conversely, comparatively little primary production took place in the city, except for theremaining urban forests and small pockets of urban vegetable gardens, while the bulk of theproduction took place in the farms and remaining forests around Syracuse.
From the 1950s to the present, the trend in the spatial distribution of urban metabolismreversed. Instead of consolidating respiration in the city’s urban core, energy consumptionbecame more diffuse. This can be attributed partially to the economic forces behind the“rusting” of the city and also the red-lining practices adopted by the Federal HousingAuthority (Jackson 1985; Hillier 2003; Vey 2007). During its formative years, the cityconsumed many times the amount of energy that the inhabitants of the surrounding countydid. By 1980, those living outside the city began to consume more energy than Syracuseresidents. Based on our estimates of DEC for those living within Onondaga County but outsideof the city, in 2005 residents in the area of Onondaga County outside of Syracuse as a wholeconsumed 68 % more energy than the city annually.
Limitations of the study
Data
Other studies of urban metabolism over the history of a city have relied on tax records torecreate the energy and material flows (Kim and Barles 2012; Krausmann 2013). Material andenergy flows at the national level can be recreated by using industry specific value added andimport and export data. Since similar records were not kept for Syracuse, we estimated theflows of energy from local and state energy data itself, and where this was unavailable, we
-
2
4
6
8
10
12
1840
1845
1850
1855
1860
1865
1870
1875
1880
1885
1890
1895
1900
1905
1910
1915
1920
Th
ou
san
d s
q. k
m.
Wood (woodland) Coal (virtual woodland) Area Onon Co.
Fig. 7 Actual and virtual forest area required to supply Syracuse with wood and coal, calculations perKrausmann (2013), data from authors’ calculations, and sustainable woodland harvest rate from Woodbury(2010). The area of Onondaga County is included for comparison
Urban Ecosyst

estimated energy flows from peer-reviewed journal articles, historical documents, mono-graphs, newspapers, fact sheets and publications published by industries. Data for severalimportant fuels were unavailable from 1910 to 1960 (e.g. the amount coal imported forelectricity generation and coal gas could be derived, but coal use in homes and businesseswas unavailable, and scant data existed on coal or electric consumption by area railroadcompanies), so we had to use per capita estimates of energy consumption at a national level(Schurr 1960). We do not believe that the interpolation between data points or the substitutionof state or national level energy consumption estimates (See Appendix for details) hinderedour analysis of energy consumption over the longer term. For example, from 1880 to 1900, ourestimates of total energy consumption in Syracuse are similar to those derived from Schurr(1960) (see Fig. 10 in Appendix). For the prior to 1880, however, we rely more heavily onlocal data than in subsequent years because the energy consumed in the salt industry wassignificant. Using aggregated state and national level indicators during this period would haveunderestimated urban respiration by 22–74 %. Similarly, while the majority of US citiesmoved away from electricity produced in coal power plants and thus the proportion of coalin national and state energy mix fell over the mid 20th century, coal use in Syracuse remainedhigh due to consumption in the Solvay process and local co-generation for industry; it wasconsidered separately from the disaggregated state data (see Table 8 in Appendix).
Limitations of the R:P metric
It would be more challenging to determine the appropriate boundaries when applying thisconcept to a mega-city, which, even in its formative years, may have relied on resource-shedsthat extended to the entire state or nation. The formation of these cities may have begun centuriesago, and therefore the former resource-shed may have little relevance today. Similarly, thosecities that developed in very arid or unproductive environments have relied on imports of foodand energy throughout their history. Perhaps, even though it may be futile to consider metro-politan areas like New York, NYor Tuscon, AZ garnering a substantial portion of their food andenergy supply from areas immediately surrounding their urban cores, calculating the R:P ratio forthese cities could draw attention to their dependence on remote areas to continue their urbanmetabolic functions and the difficulties inherent in sustainability efforts in those cities.
For Syracuse the county border represented a practical boundary for assessing productivity,as many of the sustainability initiatives involving the city were developed at or in conjunctionwith the county government. Future studies could examine how expanding the boundaries ofanalysis might affect either the numerator or denominator in the R:P ratio. One might assumethat the R:P ratio would decrease (i.e. improve; become more sustainable) as the boundary isexpanded to include more distant hinterlands. However, the extent to which this is true at themargin may differ from city to city, for example, cities located on or at the base of mountainsmight add less productive land to the analysis as the boundary is moved up in altitude.Additionally, it is important to consider that biomass is less energy dense than fossil fuels,and therefore has higher energy costs for transportation. Caputo et al. (2013) e.g. found thatincreasing haul distance from 75 to 195 km nearly doubled energy costs of a short-rotationwoody biomass system. Ultimately there exists some boundary where the marginal energybenefit of importing the biomass would equal its marginal energy cost. Since the minimumenergy return on investment (EROI) for transportation fuels is 3:1 or greater (Hall et al. 2009;Lambert et al. 2013b), perhaps the geographical distance that allows for at least a 3:1 EROI fordelivered biomass might be ultimately a more appropriate energetic boundary. Of course, thiscalculation would be difficult to generalize too because it depends on local conditions (i.e. roaddensity, the availability of water or rail transport, elevation changes, etc.).
Urban Ecosyst

Conclusions
Cities are complex systems which rely on energy and materials from outside of their bound-aries. Our analysis demonstrates the magnitude to which cities are dependent on fossil fuels andthe degree to which solar-based energy flows in nearby areas are insufficient to satisfy theirenergy metabolism.While this research focuses on a specific city and county, it is representativeof an entire region of our country that once thrived on a solar-based economy, and may need toagain. Syracuse is an example of a rust-belt city that has undergone significant industrializationand population loss, yet it remains vulnerable to changes in surplus energy availability.
Our historical analysis of energy metabolism reinforces the notion that land cover in a city’sresource-shed can be affected negatively by dependence on solar-based energy. The region’sforests were depleted quickly at a time when Syracuse had only a fraction of its current populationand industrial production. During this period, per capita energy availability fell by 50 % and onlybegan to increase after fossil fuels became available and inexpensive. Today, except for someagricultural products and a small amount of cord word, little of the natural production inOnondaga County is imported to or consumed in the city. There are, however, some extantopportunities to improve the energy production in Syracuse’s resource-shed and the amount ofsolar-based energy entering the city’smetabolism. These include: (1) Reducingmeat consumptioncould lead to a decreased demand for forage crops, and increase the cultivated land available forfood and energy crops which could be consumed directly. For example, Balogh et al. (2012)found that the food demands of Syracuse residents could bemet from existing county farms if theychose a low-meat or vegetarian diet. Peters et al. (2009) found that Upstate NewYork cities couldbe supported by regional food-sheds. (2) Some short-rotation woody biomass crops, such as Salix(willow) have net energy returns greater than 50:1 (18:1 to 43:1 delivered) and can be grown onmarginal land (Caputo et al. 2013), although an increase in willow production would require aconcurrent increase in demand for biomass. (3) Electricity plants or combined heat and power(CHP) systems can be fueled by forest biomass. Castellano et al. (2009) estimate that there is thepotential to generate 35.1–61.4 MW of electricity sustainably from forests within 40 km ofSyracuse. (4) Renewable technologies such as solar PV and wind produce electricity and thushave the potential to directly contribute to the energy metabolism. These technologies can beinstalled in urban environments and are less reliant on local land conditions than energy fromNPP.
There are opportunities, also, to improve urban energy metabolism. Researchers describediminishing marginal returns for well-being above a certain threshold of ecological footprintand per capita GDP (Niccolucci et al. 2007;Max-Neef 1995).Manno (2011) hypothesizes that asimilar threshold exists for the relation between energy consumption and well-being, anddiscusses the potential opportunities for social change that may arise from declining surplusenergy availability to society. European cities e.g. have comparatively high standards of living,yet use less than half of the energy consumed per capita in Syracuse, demonstrating that a lowerenergy lifestyle is feasible and perhaps even desirable. The answer to improving the R:P ratio,and thus the sustainability of these cities, may lie then in the revitalization of downtown areas,especially withmixed use (residential and commercial) neighborhoods that could reduce energyconsumption for transportation and provide other opportunities for increasing the efficiency ofthe delivery of energy services (e.g. district heating, combined heat and power systems). Theability of renewable technologies to produce energy locally and replace fossil fuel consumption(e.g. solar photovoltaic, wind power) vary based on the climate in the city and its resource-shed.The viability of applying these technologies in urban sustainability efforts, given the loweramount of surplus energy they provide, should be examined in future analyses.
Systems analyses that examine urban energy metabolism for a particular city in the contextof regional production, like the one undertaken in this study, examine a city’s ability to replace
Urban Ecosyst

fossil fuels with solar-based energy. This study provides a baseline measurement of urbanenergy metabolism, examines the ability of the local resource-shed to produce food and fuel,and considers both of these with a historical perspective. Our results imply that if, as somehave suggested, Syracuse will face the reduced availability of energy in the future and mustagain turn to locally available sources of solar-based energy, the socio-economic metabolismof the city and county will have to contract significantly from its current levels.
Acknowledgments We gratefully acknowledge support from the National Science Foundation Award BSC-0948952 for an Urban Long Term Research Area Exploratory project (ULTRA-EX) that supported and inspiredthis research. We also would like to thank David Nowak for his help with the forest net production calculations,the Onondaga Historical Association for their research assistance and access to their collection, and Myrna Halland several anonymous reviewers for their comments on early drafts of this article.
Appendix
Respiration calculations
1840–1900
A combination of local, state and national level data were used to estimate respiration fromhomes, businesses, transportation systems (including horses), and livestock (Table 2).
Wood Home and commercial use: consumption assumed to be 4.5 cords per capita * Syracusepopulation. Reduced to 1.5 cords per capita by 1900 (derived from Schurr 1960)
Salt production: we assumed that 0.024 cords were consumed per bushel of salt in 1840,and efficiency increased to 0.020 cords/bushel by 1900. We assumed a transition from wood tocoal fuel for boiled salt from 1865 to 1900.
Coal We found total coal consumption estimates in historical literature and newspaper articles.To calculate boiled salt production, we assumed 75 lbs. (34 kg) of coal per bushel in 1865, toan increased efficiency of 55 lbs. (35 kg) per bushel in 1900.
Food demand We calculated food demand from the residents of Syracuse following themethodology in Balogh et al. (2012), by multiplying the U.S. Department of Agriculture dailyper capita food availability4 in kcal for a given year (ERS 2012) by 365 days, and then by therespective annual population. Results were then converted from kcal to Joules per year. Foryears prior to 1909, we assumed that food demand was 2,868 kcal per day.
Horses To estimate transportation energy demand from horse drawn carriages, we used the dailyfeed requirements for horses under a moderate workload to calculate the yearly demand (Table 2)and thenmultiplied by per capita horse ownership, derived from census data and estimates of horseownership in Northeastern U.S. cities (McShane and Tarr 2007; The National Academies 2007).
Livestock To estimate the food energy demand (metabolisable energy) for livestock (beefcattle, dairy cows, pigs, and chicken) we multiplied the daily feed requirements (in kcalconverted to joules) (Chiba 2009; Balogh et al. 2012) by the population of each of the three
4 A measure of the food available to U.S. residents prior to waste in the retail system and home (ERS 2012)
Urban Ecosyst

largest livestock populations: cattle including dairy cows, pigs and sheep. All other forms oflivestock were excluded (Table 3).
We note that our estimates for the feed demand for livestock in the past may be low, as thecurrent population of horses and livestock have been bred and managed to be more efficientthan their historical counterparts. We were unable to find information on feed requirements forthese earlier populations and breeds, thus we relied on contemporary data.
Trains We calculated the U.S. per capita energy consumption by railroads from 1840 to 1900.We assume that trains consumed only wood until 1850, 90 % wood in 1860, 50 % wood in1870, and all coal by 1890.
Solvay process Production of soda ash began in 1884 and increased to approximately 200,000 tby 1905.We assume production increased linearly, and that 2 t of coal was required per ton of sodaash (to account for the production of additional chemicals at the plant) (Allied Chemical n.d.).
Table 2 Estimated annual energy demand by end use (in PJ) for Syracuse, NY, 1840–1900
Year Wood (total) Coal (total) Food demand Horses Trains Solvay process coal (est.) Total
1840 2.06 – 0.02 – 0.00 2.09
1845 2.80 – 0.06 – 0.01 2.87
1850 3.34 – 0.12 0.02 0.03 3.51
1855 4.19 0.05 0.13 0.03 0.05 4.45
1860 3.47 1.59 0.15 0.05 0.08 5.34
1865 2.29 3.12 0.17 0.07 0.11 5.76
1870 2.64 3.90 0.18 0.10 0.15 6.97
1875 2.50 2.84 0.21 0.10 0.18 5.82
1880 2.59 3.27 0.23 0.06 0.21 6.36
1885 2.94 3.13 0.31 0.02 0.31 – 6.70
1890 3.02 4.16 0.39 0.47 0.50 8.04
1895 2.81 5.53 0.43 0.53 1.00 9.29
1900 2.62 7.35 0.47 0.58 1.75 11.02
Table 3 Daily and annual energy (feed) requirements for work horses and livestock
Daily requirement Annual requirement
Horsesa 23.31 Mcal/day (97.6 MJ/day) 8,508 Mcal * horse−1 * yr−1 (35.6 GJ * horse−1 * yr−1)
Dairy Cattleb ~27.9 Mcal/day (67.8 MJ/day) 10,183 Mcal * head−1 * yr−1 (42.7 GJ * head−1 * yr−1)
Pigsc ~6.5 Mcal/day (27.2 MJ/day) 2372.5 Mcal * pig−1 * yr−1 (10.0 GJ * pig−1 * yr−1)
Sheepd ~4.0 Mcal/day (16.7 MJ/day) 1460 Mcal * sheep−1 * yr−1 (6.1 GJ * sheep−1 * yr−1)
a Assumes 500 kg horse, min requirements moderate work intensity daily. Nutrient Requirements of Horses. TheNational Academies (2007)b National Research Council (2001)c Augenstein et al. (1994)d Chiba (2009)
Urban Ecosyst

1900–1960
Syracuse energy consumption was estimated using per capita consumption from Schurr(Table 4), augmented with consumption from Solvay Process/Allied Chemical. Food demandwas calculated as outlined above. Results displayed below (Table 5).
1960–2005
The Energy Information Administration reports primary energy consumption in four majorcategories of end use: Residential, Commercial, Industrial and Transportation. A fifth majorcategory of energy consumption in the City of Syracuse is food demand by humans. Using thesefive categories and the final energy consumed by each sector, we estimated total energy consump-tion by humans in Syracuse from 1960–2005 using a FORTRAN model. To calculate energydemand for Syracuse and also for Onondaga County as a whole, we used the methodology in Ngoand Pataki (2008), who adjusted state level consumption based on population. We then makefurther adjustments based on climate, population density, etc. For example, the high populationdensity and temperate coastal climate in the metropolitan New York City area mean that the percapita consumption value for New York State probably does not represent well that of the coolerand less densely populated counties in Upstate New York. In order to correct for these differencesin means of home heating requirements and transportation fuel use (e.g. a much greater percentageof New York City residents use public transportation, and the climate in Syracuse, N.Y. is colderand snowier in the winter), adjustments to statewide rates of per capita consumption wereemployed as detailed in Balogh (2010), and are summarized for each sector below.
Residential We estimated city energy consumption from state-level energy consumption statistics(US EIA 2013) for each fuel type using the ratio of city population to the state population(Table 6). Some fuels required a further adjustment. Home heating oil and natural gas consump-tion were also corrected for the difference in heating degree days between Syracuse and the stateaverage. The City of Syracuse averages 6,803 heating degree days5 per year, while the state as a
Table 4 Estimates of U.S. per capita energy consumption, in GJ (109 Joules)
Year Coal Oil Dry Nat. Gas Hydropower Wood
1900 78.82 3.18 3.24 0.13 28.53
1905 104.36 7.65 4.34 0.22 24.61
1910 119.68 11.50 5.70 0.33 21.34
1915 115.16 14.81 6.53 0.50 18.95
1920 126.22 26.13 7.74 0.67 16.99
1925 109.12 37.82 10.43 0.83 14.81
1930 95.48 48.22 15.91 1.09 13.29
1935 72.00 45.46 15.29 1.25 12.41
1940 81.34 59.54 20.46 1.42 11.54
1945 97.62 72.63 28.07 2.25 10.02
1950 72.54 87.93 39.92 2.40 8.71
Schurr (1960)
5 A heating degree day is defined as the number of degrees that the daily average temperature falls below 65 °F(NYSERDA 2011), and when summed over a heating season is a measure used to indicate the demand for energyneeded to heat a home at a particular location
Urban Ecosyst

whole averages 6,116. Therefore, in order to heat a residence in Syracuse to a comfortabletemperature requires, all other things equal, approximately 11.2 % more energy to be consumed.These fuels were also corrected to reflect the regional differences in home heating fuel preference.In 2008, NewYork State residents on average use 52% natural gas, 33% fuel oil or kerosene, and15% other fuels (wood, propane, etc.). Onondaga County residents, in particular, use 76% utilitygas, 6 % fuel oil or kerosene, and 18 % other fuels (NYSERDA 2011).
Commercial/Industrial To estimate commercial and industrial energy consumption inSyracuse during the 19th century, we adjusted per capita energy consumption estimates forthe U.S. and New York. We also included the city’s top energy industrial energy consumers ofthe time, Solvay Process/Allied Chemical energy use (which was derived from data fromcorporate literature. As done with the residential consumption calculations, we refined ourenergy consumption estimates. Syracuse and Onondaga County employment was compared tostatewide employment in these sectors, and we adjusted per capita energy consumption figuresbased on the differences in the employment ratio (Table 7). We defined industrial employmentas those workers in the manufacturing, construction, and mining/agriculture/forestry/fisheriessectors, while commercial occupations refer to workers in all other employment. To estimatelocal industrial and commercial energy consumption, the New York state-level industrial and
Table 5 Estimated energy consumption in Syracuse, by fuel, 1900–1950
Year Coal Crude oil Natural gas, dry Hydropower Fuel wood Food Total
1900 9.30 0.34 0.35 0.01 2.62 0.58 11.26
1905 12.82 0.94 0.53 0.03 3.02 0.66 17.99
1910 16.43 1.58 0.78 0.05 2.93 0.73 22.50
1915 17.79 2.29 1.01 0.08 2.93 0.83 24.92
1920 21.67 4.49 1.33 0.11 2.92 0.92 31.46
1925 20.79 7.20 1.99 0.16 2.82 1.02 34.02
1930 19.99 10.09 3.33 0.23 2.78 1.12 37.63
1935 14.95 9.44 3.17 0.26 2.58 1.11 31.57
1940 16.75 12.26 4.22 0.29 2.38 1.10 37.10
1945 20.82 15.49 5.99 0.48 2.14 1.14 46.22
1950 16.00 19.40 8.81 0.53 1.92 1.18 48.09
Table 6 New York State and Syracuse Population and coefficient used to adjust New York State to Syracuseenergy consumption
Year New York State Pop. Syracuse population Population coefficient used to pro-rate N.Y.consumption to Syracuse consumption(Syr. pop/N.Y. pop.)
1960 16,782,304 423,028 0.013
1970 18,237,000 472,835 0.011
1980 17,558,000 463,920 0.010
1990 17,558,000 463,920 0.009
2000 18,976,457 147,306 0.008
2010 19,378,102 145,170 0.007
U.S. Census (1960–2010)
Urban Ecosyst

commercial energy consumption of natural gas, oil, electricity, and renewables/biomass in thissectors are multiplied by commercial or industrial employment as a percent of state total, e.g.the number employed in the commercial sector in Syracuse divided by the total commercialworkers in N.Y. State.
Transportation We calculated transportation energy demand by pro-rating state consumptiondata (US EIA 2013) by the number of registered vehicles and average miles travelled per vehicle.
Allied chemical and Trigen co-generation plant Additionally, we included the energy con-sumption from Allied Chemical (the former Solvay Process Co.) and Trigen-Syracuse EnergyCorp., a coal-fueled heat and electricity generating plant (Table 8). These two companies werethe largest direct consumers of coal. Allied Chemical operated until 1985. Production statistics
Table 7 Ratio of Onondaga County and Syracuse industrial and commercial workers to the New York State totalworkers in those categories
Industrial Commercial
Onondaga Co. Syracuse Onondaga Co. Syracuse
1960 0.044 0.022 0.021 0.012
1965 0.041 0.020 0.021 0.011
1970 0.039 0.018 0.022 0.011
1975 0.036 0.015 0.022 0.010
1980 0.034 0.013 0.022 0.010
1985 0.034 0.012 0.023 0.009
1990 0.033 0.011 0.024 0.009
1995 0.033 0.009 0.024 0.008
2000 0.033 0.008 0.025 0.007
2005 0.033 0.008 0.024 0.007
2010 0.033 0.007 0.023 0.006
U.S. Census Bureau (1960–2010), interpolation between decadal reports
Table 8 Additional energy consumption in Syracuse from Allied Chemical and Trigen-Syracuse Energy Corp
Year Allied chemical Trigen-Syracuse Total
Coal (tons)a PJ Coal (tons) PJ PJ
1960 559,090 12.30 12.30
1965 12.97 12.97
1970 13.63 13.63
1975 650,000 14.30 14.30
1980 13.10 12.65
1985 500,000 11.00 11.00
1990 8.27 8.27
1995 5.53 153,550 4.20 9.73
2000 127,272 2.80 153,550 4.20 7.00
2005 0 0 172,528 4.73 4.73
a From historical literature and Allied Chemical (n.d.)
Urban Ecosyst

and coal consumption data were published in company documents, and we interpolatedbetween data points. The Trigen coal-fired cogeneration plant began operation in 1991(91 MW), and additional capacity was brought on-line in 2002 (11 MW). Coal consumptionestimates were derived from EIA data (US EIA 2010).
Food Calculated as outlined above
-
10
20
30
40
50
60
70
80
1840
1850
1860
1870
1880
1890
1900
1910
1920
1930
1940
1950
1960
1970
1980
1990
2000
PJ
(10^
15 J
)
Food
Other elec
Nuclear
Fuel Wood
Hydropower
Natural Gas, Dry
Oil
Coal
1 2 3 4
Fig. 8 Major fuels in the energy metabolism of Syracuse, NY. The dashed lines indicate transitions in major fueltypes. Four periods are designated by dominant fuel type: 1. Biomass, 2. Coal, 3. Oil and gas, 4. Oil and gas withincreased electrification and diversification of fuels
-
100
200
300
400
1840
1850
1860
1870
1880
1890
1900
1910
1920
1930
1940
1950
1960
1970
1980
1990
2000
Gig
ajo
ule
s (1
0^9
Jou
les)
FoodOther elecNuclearHydropowerNatural Gas, DryOilCoalFuel Wood
Fig. 9 Per capita energy and food consumption (urban energy metabolism) in Syracuse, NY, 1840–2005
Urban Ecosyst

Calculation of non-renewable respiration and R:P ratio
To calculate the non-renewable respiration in Syracuse from 1930 to the present, we subtractedhydropower, biomass, and other renewable energy consumption from the direct energy con-sumption calculated above.We divided this number by the net primary production in Onondagacounty to derive the adjusted R:P ratio for non-renewable fuels (i.e. fossil and nuclear energy).
Results
There were four major periods in the urban metabolism of Syracuse, differentiated by themajor fuel type (Figs. 4 and 8). Total energy consumption increased steadily to a maximum in1970 (Fig. 8) before declining, while per capita energy use initially fell from 1860s to the1890s and then increased again from 1890 to 1970 (Fig. 9). Per capita energy use alsodemonstrated a similar trend to total energy use; declining from 1970 to the present exceptfor a brief period of lower energy prices in the early to mid-1990s (Figs. 4 and 9).
-
2
4
6
8
10
12
14
1840
1845
1850
1855
1860
1865
1870
1875
1880
1885
1890
1895
1900
PJ
(10^
15 J
)
Oil
Horses
Food demand
Trains
Solvay Process Coal(est.)
Coal
Wood
Fig. 10 Comparison of energy consumption in Syracuse from 1835–1900, derived from local data (the stackedgraph) and based upon U.S. per capita energy consumption estimates from Schurr (1960) (the dashed line).Syracuse appears to have been an especially energy intense city in its early years, prior to 1880. This is consistentwith the consumption of large amounts of wood in salt production and other industries
Table 9 Variables used to deriveannual net primary production inOnondaga County forests, reportedin metric tons per hectare per year
Aboveground production Low High
Hardwood 4.1 6.0
Softwood 2.1 4.0
Mortality
Hardwood 0.7 0.9
Litterfall
Hardwoods 4.5
Softwoods 4.0
Urban Ecosyst

Initially, Syracuse residents consumed, on average, nearly 75 % greater energy per capitathan the average US citizen (Schurr 1960), however, by the 1890s the average Syracusanconsumed as much per capita as the average US citizen (Fig. 10).
Production calculations and results
We defined production as the sum of the annual NPP of forests and farms in OnondagaCounty. Our detailed methodology follows.
Table 10 Major crops in Onondaga County and volume or production-based conversion factors to calculateenergy content
Major crops Conversion factor(volume-based)a
Conversion factor(production-based)b
Energy contentconversion factorc,d
Corn (Maize) 56 lbs.* bushel−1 – 3,650 kcal * kg−1
Wheat 60 lbs. * bushel−1 – 3,640 kcal * kg−1
Oats 32 lbs. * bushel−1 – 3,890 kcal * kg−1
Soybeans 60 lbs. * bushel−1 – 3,380 kcal * kg−1
Potatoes cwt=100 lbs. ~7.5 tonnes * ha−1
(pre-industrial fertilizers)to ~26.0 tonnes * ha−1
(modern farmingmethods)
690 kcal * kg−1
Silage (65 % moisturecontent assumede)
– ~27.2 tonnes * ha−1
(pre-industrial fertilizers)to ~44.0 tonnes * ha−1
(modern farming methods)
4 Gcal * dry metric ton-1
Rye – 1 tonnes * ha−1
(pre-industrial fertilizers)to ~2.5 tonnes * ha−1
(modern farming methods)
3,380 kcal * kg−1
Alfalfa (15 % moisturecontent assumedf)
– ~4.3 tonnes * ha−1
(pre-industrial fertilizers)to ~5.7 tonnes * ha−1
(modern farming methods)
4 Gcal * dry metric ton−1
Grass/Hay (15 % moisturecontent assumedf )
– ~2.8 tonnes * ha−1
(pre-industrial fertilizers)to ~4.5 tonnes * ha−1
(modern farming methods)
4 Gcal * dry metric ton−1
Beans cwt=100 lbs. ~1.5 tonnes/ha 3,330 kcal * kg−1
Data sources: a University ofMissouri Extension (2010), b Balogh et al. (2012), c USDA (2012), d total energy contentof forage assumed to be 4 kcal per g of dry weight, e Cornell University Cooperative Extension (2013) f Porter (2009)
Table 11 Harvest index used toestimate annual residual biomassproduction from major crop types(Eurostat 2007)
Crop Harvest factor Recovery weight
Corn 1.2 0.9
Wheat 1.0 0.7
Potatoes 1.0 0.0
Beans 1.0 0.0
Soybeans 1.2 0.7
Oats 1.2 0.7
Urban Ecosyst
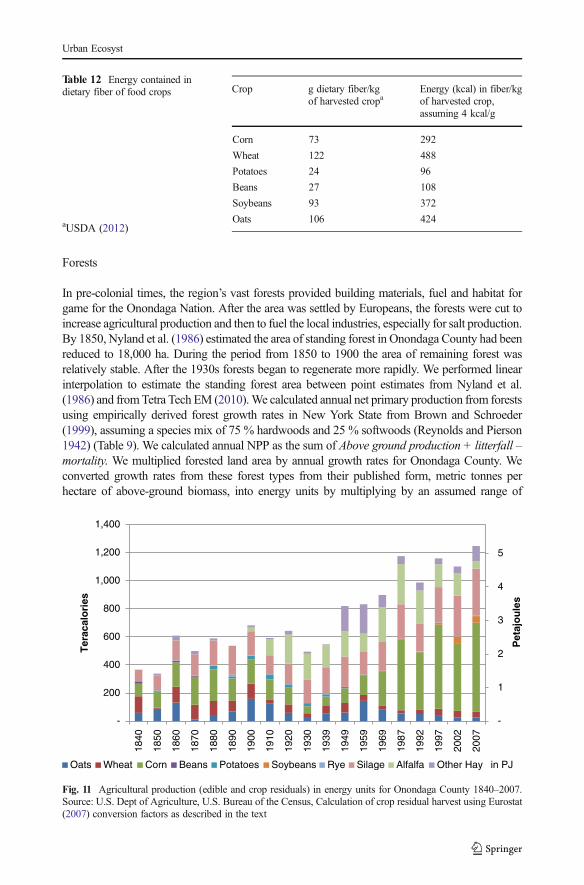
Forests
In pre-colonial times, the region’s vast forests provided building materials, fuel and habitat forgame for the Onondaga Nation. After the area was settled by Europeans, the forests were cut toincrease agricultural production and then to fuel the local industries, especially for salt production.By 1850, Nyland et al. (1986) estimated the area of standing forest in Onondaga County had beenreduced to 18,000 ha. During the period from 1850 to 1900 the area of remaining forest wasrelatively stable. After the 1930s forests began to regenerate more rapidly. We performed linearinterpolation to estimate the standing forest area between point estimates from Nyland et al.(1986) and fromTetra Tech EM (2010).We calculated annual net primary production from forestsusing empirically derived forest growth rates in New York State from Brown and Schroeder(1999), assuming a species mix of 75 % hardwoods and 25 % softwoods (Reynolds and Pierson1942) (Table 9). We calculated annual NPP as the sum of Above ground production + litterfall –mortality. We multiplied forested land area by annual growth rates for Onondaga County. Weconverted growth rates from these forest types from their published form, metric tonnes perhectare of above-ground biomass, into energy units by multiplying by an assumed range of
Table 12 Energy contained indietary fiber of food crops
aUSDA (2012)
Crop g dietary fiber/kgof harvested cropa
Energy (kcal) in fiber/kgof harvested crop,assuming 4 kcal/g
Corn 73 292
Wheat 122 488
Potatoes 24 96
Beans 27 108
Soybeans 93 372
Oats 106 424
-
1
2
3
4
5
-
200
400
600
800
1,000
1,200
1,400
1840
1850
1860
1870
1880
1890
1900
1910
1920
1930
1939
1949
1959
1969
1987
1992
1997
2002
2007
Pet
ajo
ule
s
Ter
acal
ori
es
Oats Wheat Corn Beans Potatoes Soybeans Rye Silage Alfalfa Other Hay in PJ
Fig. 11 Agricultural production (edible and crop residuals) in energy units for Onondaga County 1840–2007.Source: U.S. Dept of Agriculture, U.S. Bureau of the Census, Calculation of crop residual harvest using Eurostat(2007) conversion factors as described in the text
Urban Ecosyst

8,100–9,100 BTU per lb (18.8–21.2 MJ/kg). Thus the average calculated values for hardwoodand softwood NPP are 6.25 to 8.75 t/ha/year (124–174 GJ/ha/year), respectively.
Agricultural lands
For agricultural land, we used the methodology from Balogh et al. (2012) to estimate thecaloric value of food and fodder produced in Onondaga County. We converted the reportedcrop yield in weight or volume into calories by using the caloric values for each crop in rawform (USDA 2012) to calculate total energy output and to correct for water weight (Table 10).For crops where only the land area of production is given, e.g. grasses, clover, and otherpasture lands, we multiplied by known or estimated yield conversion factors (Table 10). To
-
5
10
15
20
25
1840
1850
1860
1870
1880
1890
1900
1910
1920
1930
1939
1949
1959
1969
1980
1987
1992
1997
2002
2007
Pet
ajo
ule
s (1
0^15
J)
Agriculture Forest
Fig. 12 Annual net primary production from agriculture and forests in energy units for Onondaga County,1840–2007
-
2
4
6
8
10
12
1820 1840 1860 1880 1900 1920 1940 1960 1980 2000 2020
R:P
Rat
io
Fig. 13 Results of sensitivity analysis for forest production on the R:P ratio for Syracuse, 1840–2005. The highvalues assume maximum estimates of aboveground production and low estimates of mortality for hardwoods andsoftwoods in Onondaga County, and the low values assume lower aboveground production and higher mortality
Urban Ecosyst

calculate the available residual biomass production that was not harvested, we used thesuggested methodology from Eurostat (2007) which multiplies the primary crop harvest bya harvest factor (Eq. 2, Table 11).
Source: Eurostat (2007)
Available crop residues t as is weightð Þ½ � ¼ primary crop harvest t as is weightð Þ½ � � harvest factor
ð2ÞNot all of these residues can be captured and subject to further use. We calculated usable
crop residues by multiplying the available crop residues by a recovery weight factor (Eurostat2007) (Table 11). We assumed the energy content of crop residues to be 4 kcal/g. Certain cropswere assumed to have no usable crop residues (e.g. potatoes and beans).
We accounted for the combustible energy in the dietary (indigestible) fiber of the majorfood crops, which would not be included in the energy content calculations in the USDANational Nutritional Database (USDA 2012). We estimated the combustible energy per kg ofharvested crop by multiplying the dietary fiber (in grams) per 1 kg of crop (USDA 2012) by4 kcal/g (Table 12). The combustible energy was added to the total energy of crops includingresidues. Including this energy production increased the energy in the total agriculturalproduction for the year by 2.3 % to 4.7 %, and varied depending on the crop mix and yieldsfor the given year.
Results
Agricultural production including usable crop residuals and dietary fiber varied from a low of1.5 PJ/year in 1850 to a high of 5.2 PJ/year in 2007 (Fig. 11). Forest production varied from alow of 2.3 PJ/year in 1930 to a high of 16.3 PJ/year by 2007 (Fig. 12). The results of asensitivity analysis indicate that, depending on the year, the R:P ratio may be 15–24 % higherto 4–11 % lower than our estimates, however the long-term trend for the R:P ratio in Syracusewas preserved (Fig. 13).
References
Aleklett K, Campbell CJ (2003) The peak and decline of world oil and gas production. Miner Energy RawMaterRep 18:5–20
Aleklett K, Höök M, Jakobsson K, Lardelli M, Snowden S, Söderbergh B (2010) The peak of the oil age –analyzing the world oil production reference scenario in world energy outlook 2008. Energy Policy 38:1398–1414
Allied Chemical (n.d.) Syracuse works. Brochure. Available at Solvay Library, Solvay Process HistoricalCollection. Syracuse, NY
Augenstein ML, Johnston LJ, Shurson GC, Hawton JD, and Pettigrew JE (1994) Formulating farm-specificswine diets. University of Minnesota Extension. http://www.extension.umn.edu/distribution/livestocksystems/di6496.html Accessed June 25, 2013
Australian Department of Resources, Energy and Tourism (2012) http://www.ret.gov.au/energy/efficiency/eeo/faq/Pages/default.aspx Accessed December 22, 2012
Balogh SB (2010) Simulating the potential effects of plug-in hybrid electric vehicles on the energy budget andtax revenues for Onondaga County, NY. Master’s Thesis, SUNY College of Environmental Science andForestry
Balogh SB, Hall CAS, Guzman AM, Balcarce DE, Hamilton A (2012) The potential of Onondaga county to feedthe population of Syracuse New York: past, present and future. In: Pimentel D (ed) Global economic andenvironmental aspects of biofuels. Taylor and Francis, Boca Raton
Barles S (2007) Feeding the city: food consumption and flow of nitrogen, Paris, 1801–1914. Sci Total Environ375:48–58
Urban Ecosyst

Barles S (2010) Society, energy and materials: the contribution of urban metabolism studies to sustainable urbandevelopment issues. J Environ Plan Manag 53:439–455
Barr WM (1879) A practical treatise on the combustion of coal: including description of various mechanicaldevices for the economic generation of heat by the combustion of fuel, whether solid, liquid or gaseous.Yohn brothers, Indianapolis
Bell VJ (1998) The Onondaga New York salt works (1654–1926). Science tribune. http://www.tribunes.com/tribune/sel/bell.htm Accessed February 14, 2012
Billen G, Barles S, Garnier J, Rouillard J, Benoit P (2009) The food-print of Paris: long term reconstruction of thenitrogen flows imported into the city from its rural hinterland. Reg Environ Chang 9:13–24
Billen G, Barles S, Chatzimpiros P, Garnier J (2012) Grain, meat and vegetables to feed Paris: where did anddothey come from? Localising Paris food supply areas from the eighteenth to the twenty-first century. RegEnviron Chang 12:325–335
Brown SL, Schroeder PE (1999) Spatial patterns of aboveground production and mortality of woody biomass foreastern U.S. forests. Ecol Appl 9:968–980
Campbell CJ, Laherrère JH (1998) The end of cheap oil. Sci Am 278:60–65Caputo J, Balogh SB, Volk T, Johnson L, PuettmannM, Lippke B, O’Neil E (2013) Incorporating uncertainty into a
Life Cycle Assessment (LCA) model of short-rotation willow biomass (Salix spp.) crops. BioEnergy Res 1–12.doi:10.1007/s12155-013-9347-y
Castellano PJ, Volk TA, Herrington LP (2009) Estimates of technically available woody biomass feedstock from naturalforests and willow biomass crops for two locations in New York State. Biomass Bioenergy 33(3):393–406
Chase FH (1924) Syracuse and its environs: a history. LewisHistorical PublishingCompany, Inc., NewYork andChicagoChiba LI (2009) Animal nutrition handbook, section 16: sheep nutrition and feeding. http://www.ag.auburn.edu/
chibale/an16sheepfeeding.pdf Accessed June 25, 2013Clayton WW (1878) History of Onondaga County, New York with illus. and biographical sketches of some of its
prominent men and pioneers. D. Mason & Co, SyracuseCleveland CJ, Costanza R, Hall CAS, Kaufmann R (1984) Energy and the United States economy: a biophysical
perspective. Science 225:890–897Cook GH (1853) Salt: report to Hervey Rhoades Esq., superintendent of Onondaga salt springs N. Y. (From
Transactions N. Y. State agricultural society, 1853 Vol. 13th.) http://books.google.com/books?id=FbU-AAAAcAAJ&dq Accessed February 10, 2012
Cornell University Cooperative Extension (2013) Measuring corn silage yield. Agronomy Fact Sheet Series #71.http://nmsp.cals.cornell.edu/publications/factsheets/factsheet71.pdf
Cottrell F (1955) Energy and society: the relation between energy, social changes, and economic development.McGraw-Hill, New York
Daly HE (1974) The economics of the steady state. Am Econ Rev 64:15–21Daly HE, Farley J (2003) Ecological economics: principles and applications. Shearwater Books Imprint,WashingtonDaniels PL, Moore S (2001) Approaches for quantifying the metabolism of physical economies, part I:
methodological overview. J Ind Ecol 5:69–93Decker H, Elliott S, Smith FA, Blake DR, Rowland FS (2000) Energy and material flow through the urban
ecosystem. Annu Rev Energy Environ 25:685–740Deffeyes KS (2001) Hubbert’s peak: the impending world oil shortage. Princeton University Press, PrincetonDeffeyes KS (2006) Beyond oil: the view from Hubbert’s peak. Hill and Wang, New YorkDuvigneaud P, Denaeyeyer-De Smet S (1975) L’Ecosysteme Urbs. L’Ecosysteme Urbain Bruxellois. In:
Duvigneaud P, Kestemont P (eds) Productivite biologique en Belgique. Bruxelles, pp. 581–597Economic Research Service (ERS) (2012) U.S. Department of Agriculture (USDA) food availability (Per Capita)
data system. http://www.ers.usda.gov/Data/FoodConsumption Accessed February 12, 2012Eurostat (2001) Economy-wide material flow accounts and derived indicators. A methodological guide.
European Statistical Office, LuxemborgEurostat (2007) Economy-widematerial flow accounting. A compilation guide. European Statistical Office, LuxemborgFischer‐Kowalski M, Hüttler W (1998) Society’s metabolism: the intellectual history of materials flow analysis,
part II, 1970-1998. J Ind Ecol 2:107–136Fisher RS (1858) A new and complete statistical gazetteer of the United States of America: founded on and
compiled from official federal and state returns, and the seventh national census. J.H. Colton, New YorkFolke C, Jansson A, Larsson J, Costanza R (1997) Ecosystem appropriation by cities. Ambio 26:167–172Geddes G (1859) Survey of Onondaga county. Trans NY State Agric Soc 19:218–352Grove JM, Pickett STA, Whitmer A, Cadenasso ML (2013) Building an urban LTSER: the case of the Baltimore
ecosystem study and the D.C./B.C. ULTRA-Ex project. In: Singh et al (eds) Long term socio-ecologicalresearch: studies in society-nature interactions across spatial and temporal scales. Springer, New York
Gupta AK, Hall CAS (2011) A review of the past and current state of EROI data. Sustainability 3:1796–1809
Urban Ecosyst

Haberl H, Erb K (2006) Assessment of sustainable land use in producing biomass. In: Renewables basedtechnology. Wiley, Chichester, pp 173–192
Haberl H, Winiwarter V, Andersson K, Ayres RU, Boone C, Castillo A, Cunfer G, Fischer-Kowalski M,Freudenburg WR, Furman E, Kaufmann R, Krausmann F, Langthaler E, Lotze-Campen H, Mirtl M,Redman CL, Reenberg A, Wardell A, Warr B, Zechmeister H (2006) From LTER to LTSER: conceptual-izing the socioeconomic dimension of long-term socioecological research. Ecol Soc 11:13, http://www.ecologyandsociety.org/vol11/iss2/art13/ Accessed June 25, 2013
Haberl H, Fischer-Kowalski M, Krausmann F, Martinez-Alier J, Winiwarter V (2011) A socio-metabolictransition towards sustainability? Challenges for another great transformation. Sustain Dev 19:1–14
Hall MHP (2011) A preliminary assessment of socio-ecological metabolism for three neighborhoods within a rustbelt urban ecosystem. Ecol Model 223:20–31
Hall CAS, Day JW (2009) Revisiting the limits to growth after peak oil. Am Sci 97:230–237Hall CAS, Klitgaard KA (2012) Energy and the wealth of nations: understanding the biophysical economy.
Springer, New YorkHall CAS, Cleveland CJ, Kaufmann R (1986) Energy and resource quality: the ecology of the economic process.
New York: Wiley-InterscienceHall CAS, Balogh SB, Muprhy DJ (2009) What is the Minimum EROI that a Sustainable Society Must Have?
Energies 2:25–47Hamilton JD (2003) What is an oil shock? J Econ 113:363–398Hamilton JD (2011) Nonlinearities and the macroeconomic effects of oil prices. Macroecon Dyn 15:364–378Hammond A et al (1997) Resource flows: the material basis of industrial economies. WRI, Washington D.C,
http://www.wri.org/publication/resource-flows Accessed February 10, 2012Herbert JH (1992) Clean cheap heat: the development of residential markets for natural gas in the United States.
Praeger, New YorkHevesi AG (2004) Population trends in New York State’s cities. A research series from the Office of the New
York State comptroller, Division of Local Government Services and Economic Development: local govern-ment issues in focus. Albany, NY
Hill DB (1985) Forest fragmentation and its implications in central New York. For Ecol Manag 12:113–128Hillier AE (2003) Redlining and the home owners’ loan corporation. J Urban Hist 29:394–420Huang S, Chen C (2005) Theory of urban energetics and mechanisms of urban development. Ecol Model 189:49–71Huang S, Hsu W (2003) Materials flow analysis and emergy evaluation of Taipei’s urban construction. Landsc
Urban Plan 63:61–74Huang SL, Lai HY, Lee CL (2001) Energy hierarchy and urban landscape system. Landsc Urban Plan 53:145–161Hunt F, Kettell TP, Homans IS, Dana WB (1848) Hunt’s merchants’ magazine and commercial review. Freeman
Hunt, New YorkHydro-Electric Power Commission of Ontario (1919) Coal and electricity compared for the heating of homes.
Heat Ventilating Mag 16:24–28International Energy Agency (IEA) (2008) From 1st to 2nd generation biofuel technologies. Paris, France http://
www.iea.org/papers/2008/2nd_biofuel_gen.pdf Accessed June 12, 2012International Energy Agency (IEA) (2009) IEA technology essentials – biomass for power generation and CHP.
http://www.iea.org/techno/essentials3.pdf Accessed June 12, 2012Jackson KT (1985) Crabgrass frontier: the suburbanization of America. Oxford University Press, New YorkJones EE (2008) Iroquois population history and settlement ecology, AD 1500–1700. Doctoral dissertation. The
Penn State UniversityJournal of the Society of Chemical Industry (1896) The remedies for smoky combustion. Partial combustion of
coal for the production of fuel gas. 18:646–650Kennedy C, Cuddihy J, Engel-Yan J (2007) The changing metabolism of cities. J Ind Ecol 11:43–59Kennedy C, Pincetl S, Bunje P (2011) The study of urban metabolism and its applications to urban planning and
design. Environ Pollut 159:1965–1973Kibby HV, Gallagher JL, Sanville WD (1980) Field guide to evaluate net primary production of wetlands. U.S.
Environmental Protection Agency, CorvallisKim E, Barles S (2012) The energy consumption of Paris and its supply areas from the eighteenth century to the
present. Reg Environ Chang 1–16Kolkin TL (1906) A 60,000 V transmission line in America. The electrical review 59:887–888. http://books.
google.com/books?id=xks1AQAAMAAJ&pg=PA887 Accessed January 11, 2013Krausmann F (2013) A city and its hinterland: Vienna’s energy metabolism 1800–2006. In: Singh SJ, Haberl H,
Chertow M, Mirtl M, Schmid M (eds). Springer Netherlands pp 247–268Krausmann F, Haberl H (2002) The process of industrialization from the perspective of energetic metabolism.
Socioeconomic energy flows in Austria 1830–1995. Ecol Econ 41:177–201
Urban Ecosyst

Lambert, J, Hall CAS, Balogh SB (2013a) EROI of different fuels and the implications for society. Energy Policy(forthcoming)
Lambert J, Hall CAS, Balogh SB, Gupta AJ, Arnold M (2013b) Energy, EROI and quality of life. Energy Policy(forthcoming)
Lieth H (1975) In: Lieth H, Whittaker RH (eds) Primary production of the major vegetation units of the world.Springer, Berlin-Heidelberg-New York
Manno JP (2011) Looking for a silver lining: the possible positives of declining energy return on investment(EROI). Sustainability 3:2071–2079
Max-Neef M (1995) Economic growth and quality of life: a threshold hypothesis. Ecol Econ 15:115–118McShane C, Tarr JA (2007) The horse in the city: living machines in the nineteenth century. Johns Hopkins Univ.
Press, BaltimoreMeadows DH, Club of Rome (1972) The Limits to growth; a report for the Club of Rome’s project on the
predicament of mankind. Universe Books, New YorkMirtl M, Orenstein DE, Wildenberg M, Peterseil J, Frenzel M (2013) Development of LTSER Platforms in
LTER-Europe. In: Singh (ed) Long term socio-ecological research: studies in society-nature interactionsacross spatial and temporal scales. Springer, New York
National Oceanic and Atmospheric Administration (NOAA) (2013) National weather service forecast online –Binghamton. http://www.nws.noaa.gov/climate/index.php?wfo=bgm Accessed June 20, 2013
National Research Council (2001) Nutrient requirements of dairy cattle.7th rev. ed. National Academy Press,Washington, D.C
New York Constitutional Convention (1868) Documents of the convention of the state of New York, 1867–1868.In: Weed P. Available via http://books.google.com/books/about/Documents_of_the_convention_of_the_state.html?id=hUtJAAAAYAAJ Accessed January 9, 2013
New York Public Service Commission (1907–1922). Annual report of the Public Service Commission, SecondDistrict. Albany, N.Y
New York State Department of State Census (1807–1925) Available from http://www.nysl.nysed.gov/scandocs/nyscensus.htm Accessed December 22, 2012
New York State Energy Research and Development Agency (NYSERDA) (2011) Patterns and trends, New YorkState energy profiles: 1993–2007. Albany, NY. http://www.nyserda.ny.gov/Publications/~/media/Files/Publications/Energy-Analysis/1995_2009_patterns_trends_rpt.ashx Accessed February 15, 2011
Ngo N, Pataki D (2008) The energy and mass balance of Los Angeles County. Urban Ecosyst 11:121–139Niccolucci V, Pulselli FM, Tiezzi E (2007) Strengthening the threshold hypothesis: economic and biophysical
limits to growth. Ecol Econ 60:667–672Nowak DJ and O’Connor PR (2001) Syracuse urban forest master plan: guiding the city’s forest resource into the
21st century. United States Forest Service, Newton Square, PA. http://www.fs.fed.us/ne/newtown_square/publications/technical_reports/pdfs/2001/gtrne287.pdf Accessed March 19, 2012
Nyland RD, Zipperer WC, Hill DB (1986) The development of forest Islands in exurban central New York state.Landsc Urban Plan 13:111–123
Odum HT (1956) Primary production in flowing waters. Limnol Oceanogr 1(2):102–117Odum, HT (1962) Ecological tools and their use: man and the ecosystem. In: Waggoner PE, Ovington JD (eds)
Proceedings of the Lockwood conference on the suburban forest and ecology, the Connecticut agriculturalexperiment station, bulletin pp 57–75
Odum HT (1970) Environment, power, and society. Wiley-Interscience, New YorkOdum HT (1973) Energy, ecology and economics. Ambio 2:220–227OdumHT, BrownMT,Whitefield LS, Woithe R, Doherty S (1995) Zonal organization of cities and environment:
a study of energy system basis for urban society. A report to the Chiang Ching-Kuo Foundation forInternational Scholarly Exchange, Center for Environmental Policy. University of Florida, Gainesville
Papachristou H (2011) Wood-burning stoves all the rage in austerity Greece. Reuters 23 November 2011Pendall R (2003) Sprawl without growth: the upstate paradox. Brookings Institution, Washington, DC, http://
www.brookings.edu/reports/2003/10demographics_pendall.aspx Accessd March 23, 2012Peters CJ, Bills NL, Lembo AJ, Wilkins JL, Fick GW (2009) Mapping potential foodsheds in New York State: a
spatial model for evaluating the capacity to localize food production. Renew Agric Food Syst 24:72Porter JC (2009) Haymaking. University of New Hampshire Cooperative Extension. http://extension.unh.edu/
resources/files/resource001171_rep1484.pdfReynolds RV, Pierson AH (1942) Fuel wood used in the United States 1630-1930. Circular No. 641. U.S. Dept.
of Agriculture, Washington, D.CSahely HR, Dudding S, Kennedy CA (2003) Estimating the urban metabolism of Canadian cities: Greater
Toronto Area case study. Can J Civ Eng 30:468–483Schurr SH (1960) Energy in the American economy, 1850–1975: an economic study of its history and prospects.
Johns Hopkins University Press, Baltimore
Urban Ecosyst

Seto KC, Reenberg A, Boone CG, Fragkias M, Haase D, Langanke T, Marcotullio P, Munroe DK,Olah B, Simon D (2012) Urban land teleconnections and sustainability. Proc Natl Acad Sci 109:7687–7692
Singh SJ, Haberl H, Chertow M, Mirtl M, Schmid M (2013) Long term socio-ecological research: studies insociety-nature interactions across spatial and temporal scales. Springer, New York
Smith JR (1916) Commerce and industry. Holt, New YorkSmith BE, Marks P, Gardescu S (1993) Two hundred years of forest cover changes in Tompkins County, New
York. Bull Torrey Bot Club 120:229–247Stamouli N, Bouras S (2013) Greeks raid forests in search of wood to heat homes. Wall Street Journal 12 January
2013Swaney D, Santoro RL, Howarth RW, Hong B, Donaghy KP (2012) Historical changes in the food and water
supply systems of the New York City Metropolitan Area. Reg Environ Change 12(2):363–380Syracuse Journal (newspaper) (various years) Accessed at Onondaga Historical Association Museum and
Research Center. Syracuse, New YorkTappan W (1853) Onondaga County – its salt works – production, etc. The Friend. Philadelphia, PA. 26:292.
http://books.google.com/books?id=j0MrAAAAYAAJ Accessed January 30, 2012Tenney WJ, Leeds SP (1855) The Mining magazine and journal of geology, mineralogy, metallurgy, chemistry
and the arts, Vol. 5. Baillière, New York, pp 94–95, http://books.google.com/books?id=YAgAAAAAMAAJ&dq Accessed January 10, 2012
Tetra Tech EM (2010) Onondaga County multi-jurisdictional all-hazards mitigation plan volume I. For Syracuse-Onondaga County Planning Agency. Syracuse, NY
The American Railway Times (1870) Locomotive statistics. 20:242The National Academies (2007) Nutrient requirements of horses. http://nrc88.nas.edu/nrh/Accessed February 12,
2012Underhill EF (1868) Proceedings and debates of the constitutional convention held in 1867 and 1868 in the city
of Albany, Volume 5. Weed, Parsons, and Co, New York, p 3373, http://books.google.com/books?id=AVEPAQAAMAAJ Accessed December 20, 2012
UN-HABITAT (2011) Global report on human settlements 2011 - United Nations human settlements pro-gramme. Earthscan, London, Washington, DC, http://www.unhabitat.org/content.asp?typeid=19 &catid=555&cid=9272 Accessed June 21, 2013
U.S. Census Bureau (1800) Return of the whole number of persons within the several districts of the UnitedStates. http://www.census.gov/prod/www/abs/decennial/1800.html Accessed December 20, 2012
U.S. Census Bureau (1840) Census of Population and Housing. Volume 3. Compendium of the Enumeration of theinhabitants and statistics of the United States, as obtained at the Department of State, from the returns of theSixth Census. Onondaga County, NY. http://www2.census.gov/prod2/decennial/documents/1840b–01.pdfAccessed January 30, 2012
U.S. Census Bureau (1850) Census of population and housing. The Seventh Census of the United States: 1850.Onondaga County, NY. http://www2.census.gov/prod2/decennial/documents/1850a–01.pdf AccessedJanuary 30, 2012
U.S. Census Bureau (1860) Census of Population and Housing. Agriculture of the United States in 1860.Onondaga County, NY. http://www2.census.gov/prod2/decennial/documents/1860b–01.pdf AccessedJanuary 30, 2012
U.S. Census Bureau (1870) Census of population and housing. Volume 3: the statistics of the wealth and industryof the United States. Onondaga County, NY. http://www2.census.gov/prod2/decennial/documents/1870c–01.pdf Accessed January 30, 2012
U.S. Census Bureau (1880) Census of Population and Housing. Volume 3: report on the Productions ofAgriculture embracing general statistics and monographs. Onondaga County, NY. http://www2.census.gov/prod2/decennial/documents/1880a_v3–01.pdf Accessed January 30, 2012
U.S. Census Bureau (1890) Census of population and housing. Volume 5: reports on the statistics of agriculturein the United States, agriculture by irrigation in the western part of the United States, and statistics offisheries in the United States. Onondaga County, NY. http://www2.census.gov/prod2/decennial/documents/1890a_v5–01.pdf Accessed January 30, 2012
U.S. Census Bureau (1900) Census of Population and Housing. Volume (5 and 6). Onondaga County, NY. http://www.census.gov/prod/www/abs/decennial/1900.html Accessed January 30, 2012
U.S. Census Bureau (1901) Twelfth census of the United States. Census bulletin: Maufactures. Salt. No 116.Washington, D.C
U.S. Census Bureau (1950) Census of population and housing. Onondaga County. http://www.census.gov/prod/www/abs/decennial/1950.html Accessed December 20, 2012
U.S. Census Bureau (2013) American fact finder.http://factfinder2.census.gov/faces/nav/jsf/pages/index.xhtmlAccessed January 11, 2013
Urban Ecosyst

U.S. Department of Agriculture (USDA) (2012) National nutrient database for standard reference. http://ndb.nal.usda.gov/Accessed February 13, 2012
U.S. Energy Information Administration (EIA) (2010) Net generation and fuel consumption at power plantsconsuming coal and biomass http://www.eia.gov/cneaf/solar.renewables/page/_rea_data/table9.htmlAccessed June 10, 2012
U.S. Energy Information Administration (EIA) (2012) Annual energy review. Table 1.5 energy consumption,expenditures, and emissions indicators estimates, selected years, 1949–2011. http://www.eia.gov/totalenergy/data/annual/pdf/sec1_13.pdf Accessed December 20, 2012
U.S. Energy Information Administration (EIA) (2013) State profile and energy estimates. http://www.eia.gov/beta/state/data.cfm?sid=NYAccessed January 7, 2013
U.S. Federal Highway Administration (FHWA) (1995) Highway statistics summary to 1995. http://www.fhwa.dot.gov/ohim/summary95/section2.html Accessed February 10, 2012
United States Forest Service (USFS) (2012) Forest inventory and analysis national program. http://www.fia.fs.fed.us/Accessed March 18, 2012
University of Missouri Extension (2010) Tables for weights and measurement: crops. http://extension.missouri.edu/publications/DisplayPub.aspx?P=G4020 Accessed March 27, 2012
Vey JS (2007) Restoring prosperity the state role in revitalizing America’s older industrial cities. BrookingsInstitution Metropolitan Policy Program, Washington, DC
Vose GL (1873) Manual for railroad engineers and engineering students: containing the rules and tables neededfor the location, construction, and equipment of railroads, as built in the United States. Lee and Shepard,Boston
Weisz H, Steinberger JK (2010) Reducing energy and material flows in cities. Curr Opin Environ Sustainability2:185–192
White JH (1979) A history of the American locomotive. Its development: 1830–1880. Dover, New York, p 84Wolman A (1965) The metabolism of cities. In: Water, health and society. University Press, Indiana, pp 276–296Woodbury PB (2010) Renewable fuels roadmap and sustainable biomass feedstock supply for New York - final
report. Appendix E: analysis of sustainable feedstock production potential in New York State. On behalf ofNew York State Energy Research Development Authority (NYSERDA). Albany, NY
Zezima K (2008) With oil prices rising, wood makes a comeback. NY Times 19 Feb 2008Zipperer WC (2002) Species composition and structure of regenerated and remnant forest patches within an
urban landscape. Urban Ecosyst 6:271–290Zipperer WC, Burgess RL, Nyland RD (1990) Patterns of deforestation and reforestation in different landscape
types in central New York. For Ecol Manag 36:103–117Zucchetto J (1975) Energy, economic theory and mathematical models for combining the systems of man and
nature. Case study, the urban region of Miami. Ecol Model 1:241–268
Urban Ecosyst