EXAMINING THE CSI EFFECT AND THE INFLUENCE OF FORENSIC ...
124
Virginia Commonwealth University Virginia Commonwealth University VCU Scholars Compass VCU Scholars Compass Theses and Dissertations Graduate School 2013 EXAMINING THE CSI EFFECT AND THE INFLUENCE OF FORENSIC EXAMINING THE CSI EFFECT AND THE INFLUENCE OF FORENSIC CRIME TELEVISION ON FUTURE JURORS CRIME TELEVISION ON FUTURE JURORS Christopher Kopacki Virginia Commonwealth University Follow this and additional works at: https://scholarscompass.vcu.edu/etd Part of the Public Affairs, Public Policy and Public Administration Commons © The Author Downloaded from Downloaded from https://scholarscompass.vcu.edu/etd/3178 This Dissertation is brought to you for free and open access by the Graduate School at VCU Scholars Compass. It has been accepted for inclusion in Theses and Dissertations by an authorized administrator of VCU Scholars Compass. For more information, please contact [email protected].
Transcript of EXAMINING THE CSI EFFECT AND THE INFLUENCE OF FORENSIC ...
Virginia Commonwealth University Virginia Commonwealth University
VCU Scholars Compass VCU Scholars Compass
Theses and Dissertations Graduate School
2013
EXAMINING THE CSI EFFECT AND THE INFLUENCE OF FORENSIC EXAMINING THE CSI EFFECT AND THE INFLUENCE OF FORENSIC
CRIME TELEVISION ON FUTURE JURORS CRIME TELEVISION ON FUTURE JURORS
Christopher Kopacki Virginia Commonwealth University
Follow this and additional works at: https://scholarscompass.vcu.edu/etd
Part of the Public Affairs, Public Policy and Public Administration Commons
© The Author
Downloaded from Downloaded from https://scholarscompass.vcu.edu/etd/3178
This Dissertation is brought to you for free and open access by the Graduate School at VCU Scholars Compass. It has been accepted for inclusion in Theses and Dissertations by an authorized administrator of VCU Scholars Compass. For more information, please contact [email protected].

EXAMINING THE CSI EFFECT AND THE INFLUENCE OF FORENSIC CRIME TELEVISION ON FUTURE JURORS
A Dissertation submitted in partial fulfillment of the requirements for the degree of
Doctor of Philosophy at Virginia Commonwealth University
by
CHRISTOPHER G. KOPACKI Master of Science, Virginia Commonwealth University, 2005
Bachelor of Science, Bluefield College, 2003
Director: WILLIAM C. BOSHER, JR., ED.D. DISTINGUISHED PROFESSOR OF PUBLIC POLICY AND EDUCATION
Virginia Commonwealth University Richmond, Virginia
August 2013
ii
© Christopher G. Kopacki, 2013 All Rights Reserved

iii
Dedication
This dissertation is dedicated to my parents, Mr. Edward J. Kopacki, Jr. and Mrs. Debra L. Kopacki. You have provided me with knowledge, wisdom, and guidance, which have served me well throughout my life. I truly appreciate all the sacrifices the both of you have made for me over the years.

iv
Table of Contents
Page
Dedication .......................................................................................................................... iii
Abstract ............................................................................................................................ viii
Chapter
1. Introduction .................................................................................................................... 1
Background of the Problem ...................................................................................... 1
Theoretical Framework ............................................................................................. 3
Statement of the Problem .......................................................................................... 4
Purpose of the Study ................................................................................................. 4
Significance of the Study .......................................................................................... 4
Link to Public Policy ................................................................................................ 5
Research Questions ................................................................................................... 6
Hypotheses ................................................................................................................ 6
Methodology ............................................................................................................. 6
Limitations ................................................................................................................ 7
Summary ................................................................................................................... 7
Definitions of Terms ................................................................................................. 9
2. Review of the Literature .............................................................................................. 10
Brief History of Crime and the Media in the United States .................................... 10
Social Constructionism and the Media ................................................................... 13
Influence of Crime Television ................................................................................ 17
The “CSI Effect” Defined ....................................................................................... 20

v
Current Research on the CSI Effect ........................................................................ 22
Theoretical Works ......................................................................................... 22
Empirical Studies .......................................................................................... 28
Other Relevant Research ............................................................................... 36
Summary and Conclusion ....................................................................................... 37
3. Methodological Plan .................................................................................................... 40
Research Questions ................................................................................................. 41
Hypotheses .............................................................................................................. 41
Instrument and Scenarios ........................................................................................ 42
Measurement ........................................................................................................... 44
Dependent Variables ..................................................................................... 45
Independent Variables .................................................................................. 45
Control Variables .......................................................................................... 47
Research Design ...................................................................................................... 47
Units of Analysis and Population ........................................................................... 48
Data Sources and Data Collection .......................................................................... 49
Procedures ............................................................................................................... 50
Data Analysis .......................................................................................................... 50
Limitations .............................................................................................................. 51
4. Analysis and Results .................................................................................................... 53
Overview ................................................................................................................. 53
Data Cleaning .......................................................................................................... 53
Descriptive Statistics ............................................................................................... 53
vi
Transformation and Selection of Variables ............................................................ 55
Hypothesis 1 ............................................................................................................ 60
Hypothesis 2 ............................................................................................................ 61
Hypothesis 3 ............................................................................................................ 62
Additional Findings ................................................................................................ 64
Summary of Results ................................................................................................ 66
5. Discussion and Conclusions ........................................................................................ 68
Introduction ............................................................................................................. 68
Methods and Data ................................................................................................... 68
Major Findings ........................................................................................................ 70
Discussion ............................................................................................................... 71
Public Policy Implications ...................................................................................... 75
Recommendations for Juror Selection .................................................................... 77
Conclusions ............................................................................................................. 78
Recommendations ................................................................................................... 80
References ......................................................................................................................... 82
Appendices
A. Survey Instrument .............................................................................................. 88
B. Informed Consent ............................................................................................... 92
C. SPSS Frequencies Outputs ................................................................................. 93
D. SPSS Descriptives Output .................................................................................. 99
E. SPSS Logistic Regression Output (Preliminary Model) .................................. 100
F. SPSS Logistic Regression Output (Final Model) ............................................. 103

vii
G. Bivariate Analysis Outputs .............................................................................. 105
H. SUNY IRB Approval ....................................................................................... 111
I. VCU IRB Approval ........................................................................................... 113

viii
Abstract
EXAMINING THE CSI EFFECT AND THE INFLUENCE OF FORENSIC CRIME TELEVISION ON FUTURE JURORS By Christopher G. Kopacki, Ph.D. A Dissertation submitted in partial fulfillment of the requirements for the degree of Doctor of Philosophy at Virginia Commonwealth University
Virginia Commonwealth University, 2013
Major Director: William C. Bosher, Jr., ED.D. Distinguished Professor of Public Policy and Education
L. Douglas Wilder School of Government and Public Affairs
This dissertation examines the relationship exposure to forensic crime television has on a
potential juror’s willingness to find a suspect guilty when presented with a case involving only
circumstantial and eyewitness evidence. This study also looks at a potential juror’s expectation
of forensic evidence being presented at trial based upon this exposure. To better understand
these relationships, the study utilized social constructionism as the theoretical framework. To
collect data, an original survey instrument that included either a violent or non-violent crime
scenario was developed. Reponses from 1572 undergraduate students were analyzed to better
understand what might influence their willingness to find a suspect guilty and their expectation
of forensic evidence being presented at trial. The results indicate that viewership of forensic
crime television does not significantly influence a potential juror’s decision to find a suspect
guilty or not guilty. After controlling for viewership, it appears that the number of justice-based
classes completed by the potential juror does influence their decision to find the suspect guilty.

ix
The analysis also shows that gender and the type of scenario (violent versus non-violent) may
influence a juror’s willingness to find a suspect guilty. It does not appear that there is a
correlation between a juror’s willingness to find a suspect guilty and their expectation of forensic
evidence being presented at trial.
1
Chapter 1: Introduction
Since its invention, scholars and practitioners have studied the power of television
because it has the ability to transmit persuasive messages to millions of people. More
specifically, legal scholars and practitioners have sought to understand the impact law and crime
based television has upon the populous, especially potential jurors. Currently, there is
conflicting research about the impact crime television has upon potential jurors. The impact of
the aptly named “CSI Effect” is still under debate. This study focuses on the relationship
between viewership of forensic crime television and a juror’s willingness to convict a suspect. It
also focuses on the relationship between this viewership and a juror’s expectation of forensic
evidence being presented at trial.
Background of the Problem
The CSI Effect is a socially constructed phenomenon by which exposure to crime media
distorts the viewers’ expectation of justice. It is a media effect. It takes its namesake from the
popular CBS crime drama, CSI: Crime Scene Investigation. It also combines a science and
technology effect. Constant exposure to crime dramas that present a plentiful amount of
scientific evidence, potentially create jury bias (Thomas, 2006). The science to many viewers
appears real and infallible (Tyler, 2006). It is not.
Current research in this area is conflicting. Recent theoretical works by, Cooley (2006),
Mann (2006), Tyler (2006), and Cole and Dioso-Villa (2007) suggest there is theoretical
plausibility for the CSI Effect. However, some of the most recent empirical studies conducted by
Podlas (2006), Schweitzer and Saks (2007), Stevens (2008), Thomas (2008), and Kim, Barak,
and Shelton (2009) offer conflicting evidence of a CSI Effect.

2
Cooley (2006) argues that science does have a different burden of proof than does the
law. He believes the different and higher burden of proof science has may shift into the courts
and therefore increase the burden of guilt in a juror’s mind. Mann (2006) supports this by
arguing the intended sense of realism provided by television shows specializing in forensic
science have been evident in the courtroom. His research shows more jurors are demanding
more evidence in court before they will convict. Jurors may come into court with a different
expectation when they have increased exposure to these forensic television shows. People have
difficulty separating themselves from these types of influences (Tyler, 2006).
Cole and Dioso-Villa (2007) do point out that there is little empirical evidence at this
time. They do discuss the anecdotal accounts from some attorneys. They state that some
prosecutors provide anecdotal accounts of juries acquitting defendants because of a lack of
forensic evidence in cases that they believe had sufficient other evidence to warrant a conviction.
This is a concern as circumstantial and eyewitness evidence has always been used to convict
defendants.
Podlas (2006) looked at three aspects of the CSI Effect to include: (1) the possibility of
creating unreasonable expectations on the part of jurors, (2) creating the belief that science is
infallible, and (3) that forensic crime dramas seen on television increase interest in forensic
science. She surveyed 306 undergraduate students and found no empirical evidence to the
existence of a CSI Effect. However, she did point out that applications to forensic science
programs have been on the rise and that in itself may be evidence of a positive CSI Effect.
Schweitzer and Saks (2007) had different findings. They specifically looked at the
difference in perceptions of viewers and non-viewers of forensic science programing. They
found that viewers of forensic science television rated themselves as having a better
3
understanding of the duties of a forensic scientist and more critical of the forensic evidence
presented at trial. Schweitzer and Saks (2007) claim, “people who watch such television
programs regularly expect better science than what they often are presented in courts” (p. 363).
Their study only consisted of 48 undergraduate students.
Stevens (2008) and Thomas (2008) took a different approach to providing evidence of the
CSI Effect. Both Stevens (2008) and Thomas (2008) in different studies surveyed trial attorneys.
Stevens found that forensic evidence did not shape a prosecutor’s decision to charge a suspect.
Stevens (2008) reported that more than half of the attorneys surveyed reported that juries were
always influenced by forensic analysis. Thomas (2008) reported that 38% of the prosecutors he
surveyed believed that they had at least one trial that resulted in an acquittal or hung jury because
no forensic evidence was available. He found that prosecutors believed that juries focus so much
on scientific evidence that they pay too little attention to the unscientific evidence.
Kim, Barak, and Shelton (2009) conducted a study of the CSI Effect using multivariate
analyses and surveyed 1,027 actual jurors. They looked at a juror’s willingness to convict a
defendant at trial without any scientific evidence. They found that exposure to forensic based
dramas had no significant effect on jurors’ decisions to convict. However, they did find
difference on willingness to convict when it came to juror race, education, age, and gender.
Theoretical Framework
The CSI Effect is examined through the lens of social constructionism. Social
constructionist theory claims that an individual’s reality, or what they believe to be reality, is
constructed from two sources: experienced reality and symbolic reality (Surette, 2011).
Experienced reality is the knowledge one gains from their own experiences. Symbolic reality is
knowledge gained elsewhere, such as television. These two sources combine to create an

4
individual’s “socially constructed reality” (Surette, 2011). The theory of social constructionism
applies well to the media’s influence over individuals’ views, as it can greatly influence the
symbolic knowledge acquired by an individual.
Statement of the Problem
Television is one of the most influential mediums in the United States. It is so influential
because it projects real life images into the homes of viewers (Mann, 2006). Of course, many of
the programs watched on television are fictitious. A problem occurs when people believe that
these realistic images and messages portrayed in fictitious television are reality. Television
falsely portrays criminals, victims, the police, and the courts (Reiner, Livingston, & Allen, 2003;
Surette, 2011; Wu, 2010). There exists a gap in the knowledge of how much forensic crime
television exposure affects a person’s expectation of scientific analysis in criminal investigations.
There is no definitive evidence currently available.
Purpose of the Study
The purpose of this study is to better understand the relationship exposure to forensic
crime television has on a potential juror’s (student’s) willingness to find a suspect guilty without
forensic evidence being presented. This study looks at a potential juror’s expectation of forensic
evidence being presented at trial based upon this exposure. Differences between violent and
non-violent crime are examined. Variables that may explain a potential juror’s willingness to
find guilt and a potential juror’s expectation of forensic evidence at trial are also examined. A
convenience sample of undergraduate students is used as potential jurors.
Significance of the Study
This study aims to better understand the CSI Effect and the impact television viewership
has upon potential jurors, especially young, potential jurors. It is important to understand the

5
impact forensic crime television has upon the new generation of jurors. This study is designed to
improve upon some of the limitations in the previous empirical studies discussed; specifically,
sample size and variable measurement. Judges, trial attorneys, and academics benefit from
having increased knowledge about jurors’ willingness to convict a defendant and their
expectations of evidence. Teachers benefit from understanding the influence these shows have
upon their students. It provides additional evidence to support and refute previous claims made
about the CSI Effect.
Link to Public Policy
As an issue of public policy, criminal justice has traditionally been a function of the
government. The public has primarily relied upon the criminal justice system (police, courts,
and corrections) to keep them safe. The administration of justice is a public policy concern. It is
the responsibility of the justice system to ensure justice for those accused of crime and the
victims of crime alike. Justice policy is an important focus of public policy.
Across the United States, violent crime has steadily decreased and is at its lowest rate in
decades (FBI, 2012). According to the Uniform Crime Report published by the Federal Bureau
of Investigation (2012), the violent crime rate in 2011 is almost half of what is was in 1992,
386.3 versus 757.7 respectively. Despite the decline, many Americans perceive crime as a
growing public policy problem. Much of this may be due to the attention given the crime
problem, especially violent crime, by the media. Although this study does not directly look at
the public’s perception of the crime problem in the United States, it does look at how television
(media) exposure may affect the administration of justice. It looks at how potential jurors
willingness to find a suspect guilty is influenced by crime television viewership.

6
Primary Research Questions
This study addresses the following research questions:
1) Does viewership of forensic crime based television affect a potential juror’s (student’s)
willingness to find a suspect guilty when only circumstantial and eyewitness evidence is
presented?
2) Do expectations for forensic evidence being presented at trial vary for violent versus non-
violent types of crimes?
Hypotheses
For research question one listed above, the following hypotheses were developed:
H1: Higher levels of viewership of forensic crime television shows decreases a potential juror’s
(student’s) willingness to find a suspect guilty when only circumstantial and eyewitness evidence
is presented.
H2: After controlling for exposure, potential jurors (students) who have completed more justice-
based courses have increased willingness to find a suspect guilty when only circumstantial and
eyewitness evidence is presented.
For research question two, the following hypothesis was developed:
H3: There is a higher expectation for forensic evidence after reading the violent crime scenario
than after reading the non-violent crime scenario.
Methodology
This study utilizes a quantitative approach within a cross-sectional research design. A
survey instrument utilizing fictitious crime scenarios was developed to collect data. See
Appendix A. The survey was piloted upon IRB approval. The dependent variables for this study
are willingness to find the suspect guilty and expectation of forensic evidence. The independent

7
variables for this study include viewership of forensic crime television shows, the number of
justice related courses the respondent has completed, the scenario itself (violent versus non-
violent), race, political ideology, academic major, and class rank. Control variables include age,
gender, and criminal history. The population for this study includes only undergraduate students
that are jury eligible. Jury eligible students are those students that are at least eighteen years of
age, speak English, are United States citizens, and have not been convicted of a felonious crime.
Methodology is discussed in greater detail in Chapter Three.
Limitations
As with most studies, there are limitations. The greatest limitation with this study is that
of the overall generalizability. The geographic location of the participants, age range, and other
demographic characteristics limit the generalizability of the findings. Additionally, the types of
participants used, students versus community members, may affect generalizability. Selection
bias is also a factor, as a convenience sample is used. Some students within the population never
have an opportunity to participate. However, the large sample size, 1572 students, helps to
overcome some of these limitations.
This study uses a cross-sectional versus a longitudinal design, which is also a limitation.
This cross-sectional design does not capture changes over time. This study only captured the
information at one point in time. It does not track students throughout an academic career. Cost,
time, and feasibility have been considered.
Summary
CSI and similar types of forensic crime shows offer an absolute or definitive “truth”
about how, why, and who carry out crimes. As Kruse (2010) argues, CSI creates fictitious
“wishful-thinking” science that affects those perceptions in nonfictional society. This has

8
created concern within public administration and the criminal justice system. A bedrock
principle of the American society is to be able to provide justice to those that have been
wronged. Extra-legal factors that may affect justice from being carried out must be examined.
As the Honorable Judge Shelton states, “Our criminal justice system must find ways to adapt to
the increased expectations of those whom we ask to cast votes of guilty or not guilty” (2008, p.
6).
Chapter Two examines the history of the CSI Effect and then defines it for the purposes
of this study. The media’s role in the development of the CSI Effect is discussed. Chapter Two
also includes discussion about social constructionism, the theoretical foundation for this study. It
examines the most recent and relevant studies into this phenomenon.
9
Definitions of Terms
Circumstantial evidence – Evidence in which an inference is required to connect the evidence
to a particular conclusion. It is related to the case but does not directly prove guilt or innocence.
It is indirect evidence.
CSI Effect – A media effect in which a person’s perceptions of the justice system are influenced
by what they watch on television.
Eyewitness evidence – Evidence presented of an event or occurrence by one who was actually
present and can account for the event firsthand. It is direct evidence.
Forensic – Of or relating to the law. Often denoting the application of scientific methods and
techniques to the investigation of crime.
Forensic evidence – Scientific evidence that is applied to criminal investigations and the
analysis of crimes. Examples may include fingerprinting, DNA, firearm identification, and
blood spatter analysis.
Forensic crime television – Television shows that contain elements of both criminal
investigations and forensic evidence. Examples of these shows include: CSI, Law and Order:
SVU, Forensic Files, NCIS, etc.

10
Chapter 2: Review of the Literature
Media, specifically television, significantly influences American culture. It influences
what consumers buy, how people act, and how people view the world. Media can play a major
role in the social construction of an individual’s view of the real world, which can specifically
affect the American justice system. The media can also affect the public’s fear of crime, their
perceptions of the police, and their understanding of the justice system. Many citizens base their
opinions of crime and punishment upon media accounts. Popular media depictions of criminal
investigations may significantly alter people’s perceptions of reality. Through this social
construction, a relatively new phenomenon called the “CSI Effect” has emerged.
Brief History of Crime and the Media in the United States
Media has primarily been structured along two dimensions: types of media and types of
content (Surette, 2011). The four types of media primarily referred to in the United States are
print, sound, visual, and new media (Surette, 2011). Examples of print include novels and
newspapers. Sound media can be any audible media source from radio to compact discs. Visual
media often encompasses television and film. New media is media that combines the qualities of
sound, print, and visual media (Surette, 2011). This includes media from the Internet, social
networking, and even video games. Each of these types of media provides varied types of media
content.
Media content includes the categories of entertainment, advertising, news, and
infotainment (Surette, 2011). Infotainment is the combination of entertainment and news, which
has significantly increased in popularity over the last decade (Surette, 2011). It includes news
magazines, reality television, and court trials. Similarly, the term “edutainment” has been used
(Andreasen, 2002; Raguragavan & Henley, 2009). It is similar in purpose as it is used to

11
promote positive behavioral changes by deliberate inclusion of socially desirable messages in
entertainment television (Andreasen, 2002; Raguragavan & Henley, 2009). Reality television
such as Suppernanny and The Dog Whisperer would be examples.
Newspapers and print media existed prior to the colonization of what is now the United
States. Through this history, crime stories have been covered. Evidence of this can be found
throughout the 17th century. These early accounts attempted to link crime with sin (Surette &
Otto, 2002). Early colonial newspapers contained local crime stories. One major example is that
of the Salem Witch trials of 1692 and 1693. Pages of The Athenian Mercury newspaper in
London, England are still in existence and show coverage of the trials across the Atlantic.
Media, such as newspapers, are said to have finally generated a mass market in the 1830s
(Surette, 2011). In 1833, The Sun in New York started by selling copies on the street for one
penny, hence the term “penny papers” (Weaver & Vilhoit, 1991). The Sun included a daily
police-court column (Surette, 2011). Newspapers are able to provide an eyewitness account of
stories and crime. This eyewitness reporting became very popular during the American Civil
War (Weaver & Vilhoit, 1991). Also in the 19th century, “dime” novels became very popular.
Many of the stories were detective and crime thrillers (Surette, 2011). They are really not that
different than contemporary crime novels. Crime in print remains a constant today.
In the 1920s, radio started to dominate the home entertainment market. Although audio
recordings existed prior, radio allowed live audio to enter the homes of many Americans. Radio
was the first to provide “on-the-scene” coverage of news and crime events (Surette, 2011). An
example of this was the live coverage of the Lindbergh kidnapping trial. In the 1930s and 1940s,
radio crime dramas became popular (Surette, 2011). Radio programs such as The Shadow,
Sherlock Holmes, and Gang Busters entertained radio listeners in the 1930s and 1940s as prime

12
time television dramas do today. These radio programs provided a model for modern day
television dramas (Surette, 2011).
In the late 1940s and in the 1950s, television quickly replaced radio as the primary source
of home entertainment. Television combined the audio from radio with visual content, which
arguably left much less to the imagination. Crime shows became a staple of contemporary
television (Dowler, 2007). Examples of these shows include The Untouchables and Dragnet
(which was adapted from radio). Radio dramas became history. In the early 1950s, it is
estimated that over 100,000 televisions were purchased each week in the United States
(Edgerton, 2007). In 1977, the ratio of television sets to Americans became one-to-one and has
never declined (Surette, 2011).
Over time the criminal justice system has shifted into mainstream media (Mann, 2006).
Weekly police dramas often include technical police and legal procedures. These shows may
lead many viewers to think that they are watching an accurate depiction of the justice system
(Mann, 2006). One of the first forensic based shows to air on television was Quincy M.E. in the
late 1970s and early 1980s. The show focused on a forensic pathologist investigating suspicious
deaths. In 1990, Law and Order first debuted and ran for twenty seasons. It not only focused on
the investigator’s role in a case, but also the attorney’s role in the trial process. A number of spin
offs were created to include: Law and Order: SVU and Law and Order: Criminal Intent. In
2000, arguably the most influential of the forensic crime dramas, CSI: Crime Scene Investigation
aired on CBS. CSI has continually received high rankings and has spun off a number of shows
to include CSI: Miami and CSI: New York (Harnick, 2012). “CSI portrays a sense of forensic
realism, and, in so doing, asserts the veracity of science” (Cavender & Deutsch, 2007, p. 67).

13
There is a wide gap between what popular media portrays on television and reality. The
goal of television is to entertain and create an audience. If a television show does not entertain it
will likely have no viewers. Without viewership, it will not sell advertising and therefore will no
longer be aired.
Today, the newest type of media is referred to as “new media” (Surette, 2011). New
media merges audio, visual, and print media with word of mouth. It is very powerful as it
provides information access and psychological engagement (Manovich & Durlak, 2002). Forms
of new media include the Internet, electronic games, and personal digital assistant devices
(PDAs). It encompasses the digital world. Social networks, such as Facebook and LinkedIn, are
examples of this new media. New media provides fast communication and on-demand access.
People are able to get the content they want, when they want it, and how they want it. As
television supplanted radio as the most influential type of media, an argument can be made that
new media will be, if not already, the most powerful form of media.
The danger of new media, especially as it pertains to crime information, is that
information published (or posted) is less vetted than it is from the traditional outlets. This creates
significant concern for the criminal justice system. On the policing side, it may change the
expectations a citizen has of the police. The citizens expectation may mirror what they see
online versus the reality the police work within. On the courts side, jurors may research a case
and may hear about information that is not legally admitted at trial. In essence, it has the
potential to undermine the fairness of the judicial system.
Social Constructionism and the Media
Social constructionism is a theoretical framework that is applied throughout the
humanities and social sciences (Bickerstaff & Walker, 2003; Davidson, & Frickel, 2004;

14
Freidland & McLeod, 1999; Hannigan, 1995; Heller, 2001). It has also recently received more
attention in the science and technology communities (Bickerstaff & Walker, 2003; Jasanoff,
1996). The latter has been more controversial. Social constructionist theory has been applied to
human emotions, gender studies, race and ethnicity, human sexuality, natural science, media
studies, and many others (Bickerstaff & Walker, 2003; Bing, 2010; Freidland & McLeod, 1999;
Haslanger, 1995; Heller, 2001; Wilson & Tagg, 2010). Specifically, in the area of media studies,
social constructionism attempts to understand the relationship between facts, truth, human
nature, and reality (Alexander & Hanson, 2013; Bing, 2010; Muraskin & Domash, 2007; Surette,
2011).
In its simplest form, social constructionism claims that an idea, based on fact or fiction,
constructs another concept. This concept is the construct because it has been constructed.
Concepts are constructed rather than discovered (Berger & Luckman, 1991). Typically this
classical view of constructionism has allied with empiricism (Mallon, 2008). Human views or
beliefs are often based upon witnessed accounts. However, many human beliefs are not based
upon factual witnessed accounts, but upon information learned from others. Social
constructionists attempt to understand “how people assign meaning to their world” (Hannigan,
1995, p. 33).
Ray Surette (2011) best explains social constructionism as the theoretical foundation for
the media’s influence on crime and justice. He states “social constructionism views knowledge
as something that is socially created by people” (Surette, 2011, p. 30). This constructionism
creates an individual’s reality, or what they believe to be reality. Surette goes on to state that
people primarily have two sources in which to create their reality: experienced reality and
symbolic reality (Surette, 2011). These two sources combine to create an individual’s “socially

15
constructed reality” (Surette, 2011). This aligns with Berger and Luckman’s (1991) view that
knowledge is created by an individual’s interaction with society (Schwandt, 2003).
Experienced reality is one’s own knowledge gained from one’s own experiences. This is
likely one of the most limited sources of one’s own knowledge (Surette, 2011). People often
credit indirect versus direct sources of knowledge when forming their socially constructed reality
(Surette, 2011). These symbolic sources of knowledge include other people, institutions, and the
media (Surette, 2011). These sources can collectively form one’s symbolic reality (Surette,
2011). The symbolic reality is formed from all the events an individual did not witness but
believe occurred, all the facts about the world an individual did not personally collect but believe
to be true, and all the things an individual believes to exist but did not see (Surette, 2011).
Television helps create a symbolic reality because people that watch a great deal of television
have a tendency to hold beliefs consistent with what they witness on the television screen
(Podlas, 2002).
For example, if one were to ask an individual if the sun existed, most would respond in
the affirmative. When asked why, they would likely state because they can see it. This is
experienced reality. If one were to then ask them if they thought the surface of the sun was hot,
they would again likely respond in the affirmative. Again asking them why, they would likely
state that they learned this in school or read about it in a book. None of these individuals would
be able to say they have been to the surface of the sun to experience this first hand. This is
symbolic reality.
Mixing together an individual’s experienced reality with their symbolic reality creates an
individuals socially constructed reality (Hannigan, 1995; Surette, 2011). This is an individual’s
perceived “real world”. However, an individual’s socially constructed reality may not be reality.

16
This may occur when experienced reality is misinterpreted or too much credit has been given to
one experience. This is a problem that can be created by having a small sample size. This false
reality can also be created when an individual receives incorrect or biased information from
others. Sources of symbolic information can be very influential. Information gained from close
family or friends can carry additional weight. Information gained through the media or news
outlets can also significantly impact an individual’s symbolic reality.
An example of this could be of how a person views a police department. If a citizen has
one interaction, with one officer, of one police department, their whole opinion about the
institution may be based upon this one encounter. If the citizen is pulled over for speeding and
the officer gives them a citation, they may believe that this agency never gives breaks and writes
everyone a tickets. With this limited experienced reality, they are likely to discuss this encounter
and their beliefs with friends and others; hence, contributing to others’ symbolic reality about
this one police agency. This is an example of how negative attitudes are socially constructed.
The converse of a positive encounter is also likely if a warning had been given versus a citation.
As discussed above, media influence lies within the symbolic reality of one’s socially
constructed reality. Entertainment media specifically shapes this area. It enforces social
constructions that are then taken for granted (Deutsch & Cavender, 2008). Alternative
viewpoints are likely not presented as not to conflict with the fictitious reality that is created
(Deautsch & Cavender, 2008).
The media provides information and reports of events, such as national disasters or plane
crashes, issues such as crime or literacy rates, or conditions such as homelessness and poverty. It
is important to realize that this information is passed from one person or institution to another.
Bias or deficiencies in the informer’s interpretation of the actual event, issue, or condition may
17
be transferred to the informed. This may or may not be done intentionally. It is likely the result
of “competing social constructions” (Surette, 2011).
Competing social constructions are those offering differing descriptions of what the
world is like. For example, the social construction of homicide may include official statistics
and media stories of homicides near one’s home. Although homicide rates have been continually
declining over the past decade, an individual may have a different socially constructed reality
because the media recently reported on two separate homicides in their area. The media has a
tendency to report on individual events (the homicide) versus on the issue (the homicide rate).
Socially constructed is the idea of the justice system. Socially constructed is the belief
most people have about the police and the courts in real life. The concept of the “CSI Effect” is
one that is likely the socially constructed reality of a citizen viewing the justice system from the
outside. Most of this viewing is accomplished through television. These types of shows provide
people cultural meanings through narratives that reflect popular beliefs about crime (Cavender &
Deutsch, 2007). Of course, this is not exactly a new belief. Legal professionals for decades have
chastised jurors for their inability to distinguish between law-related television dramas and the
realities of the courtroom (Brickell, 2010).
Influence of Crime Television on the Populous: Creating Unrealistic Expectations
Television is one of the most influential mediums in the United States because it projects
real life images into the homes of viewers (Mann, 2006). However, many of these accounts or
“stories” viewed on television are fictitious in nature. They do not accurately represent the
criminal justice system. They create false depictions of criminals, crime victims, crime fighters,
and the courts. Reiner, Livingston and Allen (2003) support this portrayal of crime in the media.
They state that compared to official crime statistics, “the characteristics of crime, criminals, and

18
victims represented in the media are in most respects the polar opposite of the pattern suggested
by official crime statistics or by crime and victim surveys” (Reiner et al., 2003, p. 15). They
refer to this as the “law of opposites” (Reiner et al., 2003).
Criminals are primarily discussed in two places today: in popular television shows and
the news. Of course, there are a number of other places to gain information about criminals, to
include books, magazines, journal articles, and the like. However, the majority of Americans
construct their view of “the criminal” through what they see on television and the news (Surette,
2011). Criminals on television often appear attractive, intelligent, and decisive (Surette, 2011).
In reality the opposite is likely true. In the news, violent criminals are most likely covered
giving the false belief that violent crime is more rampant than it is in reality. According to the
Uniform Crime Report (UCR) data published yearly by the Federal Bureau of Investigation
(FBI), property crimes are committed at significantly higher rates than violent crimes.
Victims are also falsely depicted in the media. Television programs often depict victims
as helpless or innocent. Innocent means they had no role in their own victimization. Commonly
they are also shown as white and male (Surette, 2011). Supporting Reiner, Livingston, and
Allen’s “law of opposites”, the reality is again often the opposite of this portrayal. Very rarely
does the news cover the full background of the victim or discuss why the victim was victimized.
The news neglects to mention how victims are often “active” or “passive” participants in their
own victimization (Meadows & Kuehnel, 2005). Active-participant victimization is that
behavior, in which the victim has some of the responsibility for his or her own victimization by
actively engaging in a risky behavior (Meadows & Kuehnel, 2005). An example of this would
be starting a fight and then the instigator became the beaten party. Passive participant
victimization is when a victim did not take an active role in their own victimization but did

19
something so naïve that is likely caused them to be victimized (Meadows & Kuehnel, 2005). An
example of this would be picking up a hitchhiker that robbed them of their vehicle.
Similar is the depiction of the police and crime fighters. Exposure to popular media can
significantly influence ones’ perception of the police and the job that they do (Wu, 2010).
Through media depictions, police officers usually fall into either the “good cop” or “bad cop”
frames. In the good cop frame, the police are part of a justice machine with dedicated
professionals using the latest technology to repeatedly prove that crime does not pay (Surette,
2011). The bad cop frame is likely to show police in a more negative light. Police are commonly
shown as inefficient, incompetent, or corrupt (Surette, 2011). The public is inundated with
images of police officers, from the heroic crime fighter, to the bumbling ineffective bureaucrat
(Dowler, 2002). On television, officers and detectives are also shown using high levels of force
or being engaged in shootouts regularly. In reality, this is not the case and contributes to the
public’s inaccurate construction of the police.
It has been discussed in the literature that the majority of individuals’ knowledge of the
court system comes from media (Surette, 2011). Few individuals have experiential knowledge
of how the court system works. Often crime shows depict crime-fighting attorneys chasing after
criminals. They appear to be engaged in the “chase” as much as the police. In reality, this again
is not true. The increase in mass media trials has contributed to the social construction of the
courts in America.
Historically, the media has constructed the stereotypes of the white, male dominated
justice system. The majority of early popular media shows males as the hero, crime-fighter.
However, times have been changing. More and more women and minorities have been the focus
of crime related television. Media portrayals show women and minorities in positions of power

20
in the justice system. Female and minority police officers, attorneys, and judges have taken a
more dominant role in television.
Some studies suggest that popular crime shows affect individuals’ gender perceptions of
police and forensic scientists (Jones & Bangert, 2006). In a recent “Draw a Scientist Test”
(DAST) conducted by Jones and Bangert (2006), in which female middle school girls were
studied, they observed a more gender-balanced view of females’ perceptions of scientists over
similar studies conducted in the late 1980s. Today’s crime dramas over represent the number of
female detectives and crime scene investigators (DeTardo-Bora, 2009). Although there may be
other significant contributing factors breaking down traditional gender stereotypes when it comes
to policing, it is clear that the portrayal of professional women in popular media has an influence.
Television also may affect a person’s perception of the reality of science. Forensic crime
dramas like CSI construct “the illusion of science through its strategic web of forensic facticity”
(Deutsch & Cavender, 2008, p. 34). The science in these television shows appears infallible
(Mann, 2006). It also contributes to a belief that this science exists and will keep people safe
(Harrington, 2007). Of course the impact of media on science is not a new phenomenon. Elliot
and Rosenberg (1987) found that exposure to media science was a significant predictor for a
person’s belief in understanding science. Machado and Santos (2011) find evidence that this
social construction perpetuated by media exposure creates belief in a “super-science”. The
representation of forensic science on television is meaningful to the viewer and should not be
overlooked (Mopas, 2007).
The “CSI Effect” Defined
The “CSI Effect” is a media effect. It assumes its namesake from the vastly popular CBS
crime drama, CSI: Crime Scene Investigation. It is a socially constructed phenomenon by which

21
exposure, or overexposure, to crime media distorts the viewers’ expectation of justice. CSI and
similar forensic crime dramas distort citizens’ expectations of the police, the courts, and the
justice system as a whole. By constant exposure to crime dramas that present a plentiful amount
of scientific evidence, jury bias is potentially created (Thomas, 2006). Cole and Dioso-Villa
(2009) also refer to this as the “pretrial publicity effect” (p. 1337). The CSI Effect is the idea
that these forensically based, crime dramas have given jurors heightened expectations about the
evidence, especially physical evidence, presented at trial (Cole & Dioso-Villa, 2007; Cooley,
2006; Ghoshray, 2006; Kim, Barak & Shelton, 2009; Mann, 2006; Podlas, 2006; Schweitzer &
Saks, 2007; Shelton, Kim & Barak, 2006; Stevens, 2006; Thomas, 2008; Tyler, 2006). DNA
evidence in particular has the public’s attention. Citizens place a great amount of confidence in
DNA evidence (Brewer, 2010). The mass media undoubtedly has played a role in this (Brewer,
2010).
This “CSI Effect” has evolved into the notion that in order to convict accused criminals,
jurors are more likely to now expect prosecutors and the police to show scientific evidence rather
than to merely overcome reasonable doubt (Harriss, 2011). CSI: Crime Scene Investigation and
similar shows repeatedly enforce the idea to viewers that evidence is more truthful than people:
“Science equates to truth and objectivity whereas people are linked directly with dishonesty and
bias” (Harriss, 2011, p. 4). It possibly creates a false expectation of science (Tyler, 2006). This
media effect is not likely intentional, the effect is likely involuntary and unconscious (Jenkins,
2006).
The majority of citizens do not have actual knowledge about police work and the courts.
Some will have experience through interactions with the police, and fewer will be involved in a
criminal trial, and even fewer will have experienced knowledge of what goes on behind the

22
scenes. Most of the information citizens gain about policing, the courts, and the justice system is
gained through their symbolic reality (Surette, 2011). This knowledge is most likely obtained
from what they see on television (Reiner et al., 2003; Surette, 2011). Shows like CSI and Law
and Order allow viewers to be in places and situations that they would normally never be
allowed to enter. These places include crime scenes and the prosecutor’s office.
The CSI Effect is also a technology effect. A “tech effect” can be defined as a broader
cultural influence based upon advances in modern technology (Shelton, Kim & Barak, 2006).
Technology is often thought to improve efficiency and decrease the likelihood of human errors.
Modern technology, especially in crime fighting, appears infallible (Tyler, 2006). This can
create a higher expectation of the validity of physical evidence at trial (Tyler, 2006). The CSI
Effect contributes to the belief that the justice system provides swift and certain justice because
crimes are solved in sixty minutes with the aid of modern technology.
Current Research on the CSI Effect
Studying the so-called CSI Effect is a relatively new area of academic interest. A
relatively small number of theoretical-based articles have explored the concept (Cole & Dioso-
Villa, 2007; Cooley, 2006; Ghoshray, 2006; Mann, 2006; Tyler, 2006). Currently there are also
a very limited amount of empirical approaches to studying the CSI Effect (Kim, Barak &
Shelton, 2009; Podlas, 2006; Schweitzer & Saks, 2007; Shelton, Kim & Barak, 2006; Stevens,
2006; Thomas, 2008;). These most current and relevant studies will be discussed in order to
develop a more thorough understanding of the topic and to identify any gaps in the literature.
Theoretical Works
Cole and Dioso-Villa (2007) define the CSI Effect as a phenomenon that jury verdicts are
skewed due to the influence of media. Media is primarily defined as forensic-based police

23
dramas such as CSI: Crime Scene Investigation that debuted on CBS in 2000. It is a police-
based drama that focuses on the use of forensic evidence to solve crimes. In these shows,
forensic evidence rather than circumstantial evidence, is relied upon to solve a case (Cole &
Dioso-Villa, 2007). However, as discussed earlier, this is not reality. The majority of criminal
cases are not solved through direct forensic evidence linking a suspect to a particular crime.
Cole and Dioso-Villa (2007) theorize that jurors that have been exposed to such programs might
expect actual cases to be built in the same manner. This expectation would create a CSI Effect.
To study this new phenomenon Cole and Dioso-Villa (2007) conducted an examination
of both media reports and scholarly professional publications. They determined that the term
CSI Effect has been used to denote many different things. They identified six different claims
that were labeled as the CSI Effect:
1) The strong prosecutor’s effect occurs when prosecutors refer to actual jurors in actual cases
wrongfully acquitting defendants that they believe are in fact guilty (Cole & Dioso-Villa, 2007).
Prosecutors provide anecdotal accounts of juries acquitting defendants because of a lack of
forensic evidence in cases that they believe had sufficient other evidence to warrant a conviction
(Cole & Dioso-Villa, 2007).
2) The weak prosecutors effect is a lesser effect that finds some prosecutors are adopting
remedial measures to combat a potential CSI Effect with juries and therefore giving claims of the
effect credibility (Cole & Dioso-Villa, 2007). Some of these measures include questioning
jurors about television viewing during the voir dire process, explaining why forensic evidence is
absent or not needed during opening and closing statements, and calling experts to testify why
forensic evidence was not found (Cole & Dioso-Villa, 2007). It is an effect on the prosecutor

24
that prosecutors believe that they need to change their tactics during trial due to television
viewership.
3) The defendant’s effect or “reverse CSI-effect” incorporates defense attorney’s views of media
influence (Cole & Dioso-Villa, 2007). Cole and Dioso-Villa (2007) found some defense
attorneys readily admitted to exploiting the supposed CSI Effect. Defense attorneys believed the
positive image forensic scientist portray on television adds credibility to forensic scientists who
testify in court. This in turn gives their testimony added weight (Cole & Dioso-Villa, 2007).
Cole and Dioso-Villa (2007) state that this is the effect that prosecutors originally anticipated.
With added credibility and weight of forensic evidence admitted into court, there is a perception
that convictions are more likely in cases where defendants would normally not be convicted
without exposure to such shows (Cole & Dioso-Villa, 2007).
4) Cole and Dioso-Villa (2007) also discuss a producer’s effect. This version suggests that these
types of shows actually educate and therefore juries may know more about crime science. Some
believe that now jurors are better at assessing testimony and evaluating evidence because of CSI
type shows (Cole & Dioso-Villa, 2007). However, if science is not accurately and realistically
being portrayed, this may be the most dangerous version.
5) The professor’s version of a CSI Effect takes into account the increased interest students are
showing towards forensic science, criminal justice, and criminology programs (Cole & Dioso-
Villa, 2007). Enrollment numbers in these areas have increased (Bergslien, 2006; Catalani,
2006; Smallwood, 2002). Also observed is the number of students that drop out of forensic
science programs because of the false perceptions obtained from viewership prior to entering the
field of study (Cole & Dioso-Villa, 2007). However, educators may positively exploit this effect
to stimulate learning (Cole & Dioso-Villa, 2007).
25
6) The final CSI Effect version discussed by Cole and Dioso-Villa (2007) is referred to as the
police chief’s version. This version believes that this type of media viewership educates
criminals and makes them savvier to avoiding detection (Cole & Dioso-Villa, 2007). Cole and
Dioso-Vila (2007) point out that some criminologists report that criminals clean up blood, use
gloves, or remove evidence from crime scenes. However, other research suggests there is no
increase in detection avoidance (Beauregard & Bouchard, 2010).
Cole and Dioso-Villa (2007) state, at the time of their study, that little evidence of a CSI
Effect actually exists. It is likely nothing more than a media phenomenon created by a typical
“media panic” (Cole & Dioso-Villa, 2007). They define media panics as over exaggerated social
problems where the media creates an increased sense of danger over the issue.
Cole and Dioso-Villa (2007) also discuss the possibility that such a phenomenon alters
the burden of proof required of criminal trials. In the United States, the burden of proof required
for a criminal conviction is that of “beyond a reasonable doubt”. Reasonable doubt differentiates
between “moral certainty” and “mathematical certainty” (Cole & Dioso-Villa, 2007).
Mathematical certainty assumes a level of infallibility and absolute certainty (Cole & Dioso-
Villa, 2007). Moral certainty should assume a lesser degree (Cole & Dioso-Villa, 2007).
Science is often presumed to be a mathematical certainty; however, it is often fallible. At one
time it was a fact that the earth was flat. Science is ever evolving and what was once thought to
be correct may in fact turn out not upon future research. However, forensic scientists, and to a
lesser degree crime scene investigators, are often viewed as having a higher level of certainty in
their conclusions (Cooley, 2006). Science does have a different “burden of proof” than does the
law. Therefore, this increased burden or expectation could influence a jurors mind (Cooley,
2006).
26
Mann (2006) defines the CSI Effect as a phenomenon that gives jurors heightened and
unrealistic expectations on how definitive forensic evidence can be at trial when determining an
individual’s guilt. He writes that the intended sense of realism provided by television shows
specializing in forensic investigations has been evident in the courtroom. Jurors are demanding
more evidence before they will convict (Mann, 2006). Therefore, this increased pressure for
forensic evidence is requiring some prosecutors to build cases that not only meet the legal
standard of guilt but also a higher standard based upon television. Television shows rarely lack
the physical evidence needed to find a defendant guilty. This can lead real jurors to expect the
same definitive evidence. Witnesses may be perceived as having a lesser role in the court
process. Television has taught potential jurors about DNA but not when to use it in a criminal
trial (Mann, 2006). Television does not provide training and experience.
Mann (2006) also makes the argument that this increased expectation for more physical
science has created “junk science”. Experts may be hired to testify at trial to other opinions and
answer numerous hypotheticals. Another concern is that forensic scientists bring an inherent
bias into their work. Most forensic personnel work with or for policing agencies to support
criminal investigations. State run departments of forensic science or laboratories primary does
their work for law enforcement. However, when asked to report or testify in a case, they are
expected to appear neutral and unbiased. Forensic evidence and science are quite often thought
to be infallible unlike eyewitness testimony. Forensic evidence is therefore likely given more
weight at trial by judges and jurors (Cooley, 2006; Mann, 2006).
Forensic crime dramas have significantly increased people’s interest in science and the
criminal justice process. Cooley (2006) states that:
the misleading images of forensic science portrayed by these shows will
27
potentially: (a) hamper the effectiveness of crime labs; (b) increase the
likelihood prosecutors will make unreasonable requests to crime lab
personnel; and (c) increase the chances forensic examiners will fabricate
evidence, offer unjustifiable opinions in order to support a prosecutor’s
unreasonable request, or maintain the unrealistic perception forensic
science can somehow accurately answer all questions relating to a crime
(p. 501).
Research into media reports shows magazine and newspapers have increased reports
speculating that a CSI Effect exists (Tyler, 2006). Many of these reports speculate that millions
of viewers that watch CSI and similar forensic dramas develop unrealistic expectations about
physical evidence and courtroom trials (Tyler, 2006). This may increase the likelihood that
jurors will have “reasonable doubt” in a criminal trial that does not present similar types of
physical evidence and therefore increase acquittals (Tyler, 2006). It can also have a converse
effect when physical or forensic evidence is produced at trial. Juries may be more likely to
convict when forensic evidence is produced at trial (Tyler, 2006).
Tyler (2006) makes the argument that if juror judgments are influenced by exposure to
similar cases in the media and by pretrial publicity about a case, then it is plausible that jurors
may be influenced by CSI styled television shows. People have difficulty separating themselves
from these types of influences (Tyler, 2006). Tyler (2006) also concludes that by the repeated
coverage of the media that the CSI Effect has become an accepted reality. Tyler (2006) also
states that this is consistent with empirical findings in other areas of legal psychology although
there is none directly linking it as of 2006.

28
The previous literature discussed does not offer a definitive answer to the question of
whether or not the CSI Effect exists. They do offer a theoretical discourse into the plausibility of
such an effect. However, the research lacks a true experimental approach. Over the past few
years, a very limited number of studies have been conducted attempting to provide empirical
evidence of such an effect.
Empirical Studies
In 2006, Shelton, Kim, and Barak conducted one of the first empirical studies of the CSI
Effect in response to a number of prosecutors, judges, and journalists that have claimed juries
have wrongfully acquitted defendants when no scientific evidence was produced at trial. They
specifically surveyed 1,027 individuals that were called for jury duty in Michigan. Shelton, Kim
and Barak (2006) specifically looked at demographic information, television viewing habits, and
the respondents’ expectations of whether or not the prosecutor would produce scientific
evidence. They tried to determine if scientific evidence was needed as a condition for a guilty
verdict.
The survey asked respondents how often they watched specific television shows to
include general news, crime news, forensic dramas, forensic documentaries, crime
documentaries, and general crime dramas (Shelton et al., 2006). Respondents were asked how
accurate they thought these programs reflected the criminal justice system. Respondents were
then asked what types of evidence they expected to be presented in a criminal case if they were
to be a juror. The final part of the survey asked respondents how likely they would be to find a
defendant guilty based upon the types of evidence presented by the prosecution and the defense.
Thirteen different scenarios were given.

29
Descriptive analysis of the data was conducted to explore the general patterns of the
respondents. They reported that 46.3% of the respondents expected to see scientific evidence
presented in every criminal case (Shelton, Kim & Barak, 2006). Similarly, there was an
expectation for specific types of evidence to include DNA (21.9%), fingerprint evidence
(36.4%), and firearms evidence (32.3%). Shelton and colleagues (2006) point out that this is
interesting because these types of evidence may be crime specific and may not be pertinent in
many types of cases. They also found that there was a higher expectation for physical evidence
in more serious types of criminal cases to include murder or rape (Shelton et al., 2006). One
variable, CSI viewership, was also specifically analyzed. Frequent CSI watchers had a higher
expectation for all types of evidence to be introduced versus the non-CSI watcher (Shelton et al.,
2006).
Results when looking at demands for particular evidence as a condition for a guilty
verdict were also interesting. Shelton, Kim, and Barak (2006) found that respondents were more
likely to find a defendant guilty if there was specific testimony from a victim or witness. They
also found that when a prosecutor relied exclusively on circumstantial evidence and did not
provide scientific evidence that respondents were more likely to find a defendant not guilty.
This study confirms claims that jurors now expect more scientific evidence to be
produced at trial (Shelton, Kim & Barak, 2006). As the seriousness of the crime increases, so
did the expectation for scientific evidence. This expectation is not just for violent crimes, but
also for property crimes such as burglary and larceny. However, based upon their results, they
conclude that watching CSI and similar programs may only “marginally increase” the
expectations for scientific evidence to be produced at trial. The authors do point out that the

30
significance of these findings is not clear due to other variables. They point out that actual
knowledge of the criminal justice system may need to also be examined.
One of the most important concepts this study examined was whether a juror’s
expectation for scientific evidence ultimately would influence their finding of guilt during a trial.
They found that approximately half of the respondents were willing to make a decision based on
descriptions of cases with or without scientific evidence (Shelton et al., 2006). However, in most
scenarios, “respondents’ increased expectations of scientific evidence did not translate into
demands for such evidence as a prerequisite for a finding of guilt or innocence” (Shelton et al.,
2006, p. 359).
Shelton, Kim, and Barak (2006) confirm the argument made by Tyler (2006) that “the
CSI Effect was “mixed” and that it did not always work in the direction hypothesized by
complaining prosecutors and judges” (p. 333). The study found significant expectations from
jurors for scientific evidence but did not find a clear link between these expectations and
television viewing habits. The survey results did not show that a demand of scientific evidence
for finding guilt is significantly related to watching crime scene dramas. They believe it may be
more likely a “tech effect” rather than a “CSI Effect”. A “tech effect” is defined as a broader
cultural influence based upon advances in modern technology (Shelton, Kim & Barak, 2006).
In 2006, Podlas conducted an empirical study on whether or not the CSI Effect exists and
its impacts on the justice system through juror deliberations. Three different conceptions of what
the CSI Effect may be are detailed. A survey of jury eligible adults was conducted. Podlas
(2006) also investigated trials that had been reported by prosecutors as tainted by a CSI Effect.
Significant discussion into the theory of media influence on jurors’ understandings of the law
was included.

31
The first concept that Podlas (2006) investigated is that “CSI creates unreasonable
expectations on the part of jurors, making it more difficult for prosecutors to obtain convictions”
(p. 433). There is a belief that forensic based dramas condition potential jurors to have
unreasonable expectations and that every crime can be solved with forensic science (Podlas,
2006). With this in mind, she argues that the effect itself may be increasing the practical burden
for prosecutors and law enforcement. Podlas (2006) concludes that there is anecdotal evidence
from prosecutors. Some report that jurors are now taking longer to deliberate and are asking
more questions (Podlas, 2006). However, she finds no empirical evidence to support this
concept.
The second concept that Podlas (2006) investigated is that of the infallibility of science.
The conceptual definition is that CSI and similar crime dramas “elevates scientific evidence to an
unsupported level of certainty thus bolstering the prosecution’s case” (p. 437). This is converse
to the first concept. If forensic science is thought to be infallible, it gives prosecutors and law
enforcement a decided advantage at trial where forensic evidence is introduced. Although not
conclusive, Podlas (2006) finds some support for this concept. Television may be influencing
how people perceive the strength of forensic science.
The third concept variation that Podlas (2006) discusses is that forensic crime dramas
seen on television increase the interest in forensic science. It increases public awareness of the
field and has created significant interest in forensics (Podlas, 2006). More colleges and
universities have created forensic science programs as it is viewed now as a viable career path
(Podlas, 2006). Applications to forensic science programs have been on the rise (Podlas, 2006).
This itself may be evidence of a “positive” CSI Effect.

32
The empirical portion of the Podlas (2006) study surveyed 306 undergraduate and
graduate students of a large state university in the Northeast. Data on student television viewing
habits was collected. Students were then given a criminal law scenario with verdict sheet. The
verdict sheet collected information on reasons impacting respondents’ selected verdicts. The
criminal law scenario only included witness testimony and purposely did not include any
forensic evidence. Analysis of the data was conducted to determine if there was an “anti-
prosecution effect”. Podlas (2006) reports that there was no anti-prosecutorial based CSI Effect,
as CSI viewers were no more likely influenced by CSI factors than were non-viewers. Podlas
(2006) concludes that the data suggests no such “CSI Effect” exists.
Schweitzer and Saks (2007) conducted a study of forensic science television viewers and
report different findings from the two previously mentioned empirical studies (Podlas, 2006;
Shelton, Kim & Barak, 2006). Schweitzer and Saks (2007) prepared a simulated transcript of a
trial in which the key evidence was a hair recovered in a mask used by the perpetrator of a crime
and found at the crime scene. In the fictitious scenario a forensic scientist testified he conducted
forensic analysis of the hair found at the crime scene and hair from the defendant. His opinion
was that they were from the same person. Forty-eight university students were presented the
scenario and surveyed.
Participants were grouped as non-viewers or viewers of forensic science based on their
television viewership. Viewers rated themselves as having a better understanding of the duties
of a forensic scientist (Schweitzer & Saks, 2007). Viewers were also found to be more critical of
the forensic evidence presented in the fictitious trial. Schweitzer and Saks (2007) claim, “people
who watch such television programs regularly expect better science than what they often are
presented in courts” (p. 363). They also report that their data supports the prosecutorial claim
33
that the CSI Effect increases the prosecutions burden. Schweitzer and Saks (2007) state an
inference can be made that specific exposure to forensic-science fiction can influence attitudes
and perceptions of potential jurors. They also state that this CSI Effect may not be limited to the
heaviest consumers of forensic fiction but the casual watcher as well.
Stevens (2008) took a different approach to his study of the CSI Effect. By surveying
444 American prosecutors, he attempted to determine if forensic analysis performed by a crime
lab or documented evidence secured by investigators influences prosecutor discretion. Stevens
(2008) defined the CSI Effect as “fictionalized accounts of forensic analysis practices: criminal
cases can be solved through the employment of hi-tech forensic science as seen on prime-time
American drama crime shows” (p. 37). Questions were asked relating to performance
contributions (agendas, future aspirations, incentives), law school, and about the predictive value
of the elements of a crime.
Stevens (2008) found that forensic evidence did not shape prosecutor decisions on
whether or not to charge a suspect. However, he found that the CSI Effect did shape prosecutors
decisions to use “compelling” (forensic personnel or victims) witnesses at trial (Stevens, 2008).
More than half of the attorneys surveyed reported that juries were always influenced by forensic
analysis. More staggering was that 81% of the lawyers said that judges were always influenced
by forensic analysis. Few prosecutors sought out forensic evidence in order to make a decision
to prosecute (Stevens, 2008). The main reason for this was use of the plea bargaining process if
there were issues with witnesses, victims, or evidence (Stevens, 2008).
In response to Tyler’s (2006) article, which states that it is plausible that the CSI Effect
exists, Thomas (2006) reports finding a significant influence. Arguably less scientific, Thomas
(2006) reports having surveyed 102 trial attorneys in the Maricopa County prosecutor’s office.

34
Thirty-eight percent of prosecutors surveyed believed that they had at least one trial that resulted
in an acquittal or hung jury when forensic evidence was not available (Thomas, 2006). Forty
percent of the attorneys reported that jurors had asked specific questions about forensic evidence
when those specific terms were not used at trial. After speaking with jurors post-trial, 74% of
the prosecutors surveyed stated jurors “expected to be presented with scientific evidence”
(Thomas, 2006, p. 71). When scientific and nonscientific evidence was included, 45% of the
prosecutors believed “the jury focused so much on presented scientific evidence that they paid
too little attention to unscientific evidence like witnesses and police testimony” (Thomas, 2006,
p. 71).
One additional concern was brought to light by this survey. Thomas (2006) reports that
in 72% of cases, prosecutors felt a jury member who watched forensic dramas may have swayed
jurors who do not watch these type of crime fiction shows (Thomas, 2006). Based upon these
reported findings, the Maricopa County prosecutors have begun to use trial tactics to counter the
CSI Effect. These tactics include using the voir dire process, opening and closing statements,
presentation of evidence, and other evidence (Thomas, 2006). Prosecutors have had to take
many more pre-emptive steps to prevent jurors from having heightened expectations from
television.
Some research suggests that viewership of criminal investigative dramas heavy in
forensic testing may alter jury outcomes (Robbers, 2008). Robbers (2008) conducted a study in
which judges, criminal prosecutors, and defense attorneys were surveyed about their experiences
with juries. The study reported that 79% of the 290 respondents cited specific examples in
which they believed a jury had made a decision that was influenced by a forensic television
program. The same study also indicated that a large majority (85.5%) of the respondents felt that

35
their job had changed in some way based upon the influence of these television shows. Some of
the cited influences included spending additional time discussing forensic evidence, including
negative evidence witnesses, added time establishing the credibility of eye witnesses, and
discussing the differences between television programs and actual trials. Negative evidence
witnesses are those witnesses called to explain why forensic evidence is not needed (Robbers,
2008).
Findings from prior empirical studies are relatively inconclusive due to the limitations of
the methodologies used (Kim et al., 2009). Small sample sizes, limitations of scenarios used,
and lack of demographic analysis have been cited as shortcomings (Kim et al, 2009). To expand
upon these previous empirical studies, Kim, Barak, and Shelton (2009) conducted a study of the
CSI Effect using multivariate analyses for the first time. 1,027 actual jurors were surveyed from
Washtenaw County court in Michigan and presented with fictitious scenarios.
Two dependent variables were studied: a) circumstantial evidence and b) eyewitness
evidence. They looked at whether or not these variables affected a juror’s willingness to convict
a defendant at trial without any scientific evidence. Circumstantial evidence or indirect evidence
is that evidence that reasonably leads a person to infer other facts that are not directly observed.
It requires a judge’s or jury’s interpretation and inference about causation (Kim et al, 2009).
Direct evidence is that evidence in which a person has actual knowledge because they see or hear
something. Eyewitness evidence is a type of direct evidence.
The Kim et al. (2009) study also looked at two main independent variables. Exposure to
CSI dramas was collected using a five-point scale ranging from never (1) to regularly (5). Juror
expectations about whether or not that will receive some kind of scientific evidence at trial were
collected using a three-point scale (1 = no, 2 = unsure, 3 = yes). Demographic information was

36
collected on age, gender, race, education level, income level, neighborhood crime problems, and
political views.
Using a multivariate analysis and controlling for the listed variables, they found that
exposure to CSI type dramas had no significant effect on jurors’ decisions to convict (Kim et al,
2009). However, they did find some significance in regards to race, education, age, and gender.
Non-white jurors were more willing to convict on circumstantial evidence alone versus white
jurors (Kim et al, 2009). Jurors with lower levels of education also showed more willingness to
convict on circumstantial cases versus individuals with higher levels of education (Kim et al,
2009). Age and gender were significantly associated with an individuals’ willingness to convict
in direct evidence cases involving only eyewitness evidence. As age increased, so did the
willingness to convict upon eyewitness evidence alone. Also males were more likely to convict
on eyewitness evidence than females.
Other Relevant Research
Some empirical evidence does exist that judges and juries do sometimes disagree on
verdicts (Farrell & Givelber, 2010). Duncan v. Louisiana (1968) recognized judges and juries do
not always agree. Duncan made mention to a jury’s potentially using a more commonsense, and
sympathetic approach versus the more tutored approach of a judge. This commonsense and less
tutored approach is a concern when commonsense is created through a socially constructed
reality that does not accurately represent real life. Ultimately, there is no clear understanding of
this influence when studying the CSI Effect.
Holmgren and Fordham (2011) point out that juries do want to know why forensic
evidence was not presented at trial when it could have been. However, they found that juries
might not shape their verdicts or acquit suspects on this fact alone. They suggest that while
37
jurors may question why forensic evidence is not presented, jurors will still carefully weigh all of
the other evidence. The weight of eyewitness and other evidence would be considered.
Hughes and Magers (2007) conducted a study that mailed surveys to judges asking their
perception of any CSI Effect. The judges surveyed perceived that forensic crime shows had an
impact on their courts. The majority reported that the impact was negative. Specifically, they
reported that the majority of the judges surveyed felt that these shows impacted attorney
behavior and jury selection. This study did not address jury decision-making.
Summary and Conclusion
There is theoretical plausibility that watching forensic crime dramas may affect juror
decision-making (Tyler, 2006). This potentially occurs by altering an individual’s understanding
of the standard of reasonable doubt (Tyler, 2006). Many of the measures of this phenomenon are
based upon anecdotal evidence (Cole & Dioso-Villa, 2007; Ghoshray, 2006). However, if
attorneys are changing their tactics in court, then this anecdotal evidence supports the existence
of the CSI Effect in the court system.
There is no strong empirical evidence to date that a CSI Effect exists. One issue is how
the CSI Effect is defined. If it is defined specifically as affecting jury outcomes, there is little
evidence to support its existence. However, attorneys and judges are dealing with the CSI Effect
in the courtroom (Lawson, 2009). Examples have been seen in minor drug and weapons cases to
murder cases (Lawson, 2009). Much of the time prosecutors spend at trial now is educating
jurors (Mertens, 2006).
Jurors should only base their decisions upon the facts, the case, and the law. However,
extralegal factors have been shown to potentially influence some jurors (Feigenson & Park,
2006; Miller, Maskaly, Green & Peoples, 2011). Jurors are human beings, and human beings

38
inherently possess biases. When they are required to participate in the judicial process as a juror,
they bring this bias into the jury box and potentially infuse it into the justice system. Research in
simulated legal settings (i.e. mock jury trials) suggests that laypersons do not completely
understand the statistical properties of evidence (Leshowitz & Okun, 2011). Conventional
wisdom, emotions, and a lack of scientific reasoning affect the judgments of laypersons that
compose the majority of jurors (Leshowitz & Okun, 2011). People bring their own biases into
the decision-making process. The nature of the crime itself can alter the standards a juror uses to
find guilt (Kovera, 2002).
After a review of the literature, there appears to be a number of areas to conduct further
research into the CSI Effect. First, how much influence does watching copious amounts of
forensic crime based television affect the biases jurors bring into the jury box? Second, does the
nature of the crime significantly play a role in the expectation of evidence presented? Third,
how does this affect the “next generation” of jurors? Much of the research discussed above
consisted of data collected when today’s college students were not jury eligible. The influence
of these types of television may vary for today’s young juror versus an older one. This is
interesting to explore.
In addition, social constructionist theory provides a framework in which to frame future
research. Social constructionism states that experienced reality combined with symbolic reality
creates a person’s socially constructed reality. Using this framework, future research studies
should examine a person’s knowledge through experiences and their symbolic sources of
knowledge through education and television viewership. Understanding this combination of
information may better explain the socially constructed reality that potential jurors bring with
them into the jury box.

39
Chapter Three discusses a methodological plan to answer these questions. It integrates
the scope of the problem discussed in Chapter One with the literature reviewed in Chapter Two.
The methodology incorporates a social constructionist framework. It looks at how experienced
reality combined with symbolic reality may affect a person’s socially constructed reality in a jury
setting. The population studied is also discussed. Methods and techniques to collect data to
answer these questions are addressed.

40
Chapter 3: Methodological Plan
The primary goal of this research study is to examine whether a correlation exists
between a potential juror’s (student’s) willingness to find a suspect guilty when only
circumstantial and eyewitness evidence is presented and their exposure to forensic crime
television. A positive finding may further support arguments for the existence of the CSI Effect
phenomenon within a social constructionist framework. The secondary goal is to better
understand if the nature of the crime, violent versus non-violent, affects expectations of forensic
evidence being presented at trial. Variables that may explain a potential juror’s (student’s)
willingness to find guilt and a potential juror’s (student’s) expectation of forensic evidence at
trial are examined.
This study utilized a quantitative approach within a cross-sectional research design. A
survey instrument was developed to measure the dependent and independent variables.
Responses were collected from students. Students were given either a fictitious violent crime
scenario or a fictitious non-violent crime scenario. The scenarios were consistent in the types of
circumstantial and eyewitness evidence present. Only the crime was different. Students were
then asked about their expectations for forensic evidence to be presented at trial and then their
willingness to find the suspect guilty in the scenario. The scenarios only contain circumstantial
and eyewitness evidence. No forensic or scientific evidence is included. Forensic evidence is
defined as scientific evidence that must be qualified by an expert. Examples include but are not
limited to fingerprints, DNA, chemical analysis, or tool marks. The scenarios and measurement
of variables are discussed further in this chapter. This chapter includes the following research
elements: research questions, hypotheses, research design, units of analysis and population, data
sources and collection, survey instrument, measurement of variables, analytical techniques, and

41
limitations.
Research Questions
This study addresses the following research questions:
1) Does viewership of forensic crime based television affect a potential juror’s
(student’s) willingness to find a suspect guilty when only circumstantial and
eyewitness evidence is presented.
2) Do expectations for forensic evidence being presented at trial vary for violent versus
non-violent types of crimes?
By addressing the aforementioned research questions, this study will help law, justice, and police
practitioners to better understand the willingness and expectations of current and future jurors
coming out of college. It will be most beneficial for the judiciary and trial attorneys. It will also
help policy makers be better informed about the CSI Effect problem.
Hypotheses
For research question one listed above, the following hypotheses have been developed:
H1: Higher levels of viewership of forensic crime television shows decreases a potential
juror’s (student’s) willingness to find a suspect guilty when only circumstantial and
eyewitness evidence is presented.
H2: After controlling for exposure, potential jurors (students) who have completed more
justice-based courses have increased willingness to find a suspect guilty when only
circumstantial and eyewitness evidence is presented.
For research question two, the following hypothesis has been developed:
H3: There is a higher expectation for forensic evidence after reading the violent crime
scenario than after reading the non-violent crime scenario.

42
Instrument and Scenarios
An original survey instrument was created for this study. See Appendix A. There are
two possible scenarios (listed below) associated with the survey: a violent crime scenario and a
non-violent crime scenario. Specifically each scenario contains a realistic but fictitious story of a
criminal occurrence. Both stories contain circumstantial and eyewitness information leading
readers to a specific suspect. No mention of forensic or scientific testing is made in the
scenarios. They were intentionally crafted to leave thoughts of forensic testing and evidence to
the reader.
Violent Crime Scenario
During the afternoon of Friday, January 4th, Ms. Smith was home alone in her house. Her
stand alone, two-story house is in a relatively quiet, suburban neighborhood. Around 1 p.m. she
walked outside to go to her car. As she walked towards her car, an unknown male ran up to her
and struck her in the head with a brick. She yelled for help. The man dropped the brick and ran
away. Ms. Smith immediately called the police and told them somebody had just assaulted her
and that she was hurt. She described the unknown person as a white male, wearing jeans and
grey sweatshirt.
Approximately ten minutes later, Officer Taylor, who was responding to the call for
service, spotted a person walking out of Ms. Smith’s neighborhood matching the same
description. They were approximately a half-mile from her house. Officer Taylor stopped and
detained the man who was identified as Richard Flowers. Mr. Flowers was wearing jeans, boots,
and a grey hooded sweatshirt. He was 32 years old. When Officer Taylor asked Mr. Flowers
what he was doing in the neighborhood Flowers stated, “I’m just walking around. I live in the
next neighborhood over.” Mr. Flowers’ identification showed that he did live in the area.

43
Not being positive that he may have caught the burglar, Officer Taylor, with the
assistance of another officer, brought Ms. Smith to where Mr. Flowers was being detained at the
entrance to her neighborhood. Once she arrived, Officer Taylor asked if she recognized Mr.
Flowers. Ms. Smith immediately said, “Yes, that is the guy that hit me.” With this
identification, Mr. Flowers was arrested for assault and battery.
Non-violent Crime Scenario
During the afternoon of Friday, January 4th, Ms. Smith was home alone in her house. Her
stand alone, two-story house is in a relatively quiet, suburban neighborhood. Around 1 p.m she
heard a knock at her front door. She decided not to answer the door as she was not expecting
company and assumed it was a solicitor. A couple minutes later, she heard a knock at her back
door followed by a large bang, as if somebody had kicked in the back door. She ran downstairs
and saw an unknown male in her kitchen with her purse in his hand. She yelled for him to leave
the house and that she was calling the police. The man dropped the purse and ran away out the
same back door. Ms. Smith immediately called the police and told them somebody had just
broken into her house. She described the unknown person as a white male, wearing jeans, and
grey sweatshirt.
Approximately ten minutes later, Officer Taylor, who was responding to the call for
service, spotted a person walking out of Ms. Smith’s neighborhood matching the same
description. They were approximately a half-mile from her house. Officer Taylor stopped and
detained the man who was identified as Richard Flowers. Mr. Flowers was wearing jeans, boots,
and a grey hooded sweatshirt. He was 32 years old. When Officer Taylor asked Mr. Flowers
what he was doing in the neighborhood Flowers stated, “I’m just walking around. I live in the
next neighborhood over.” Mr. Flowers’ identification showed that he did live in the area.
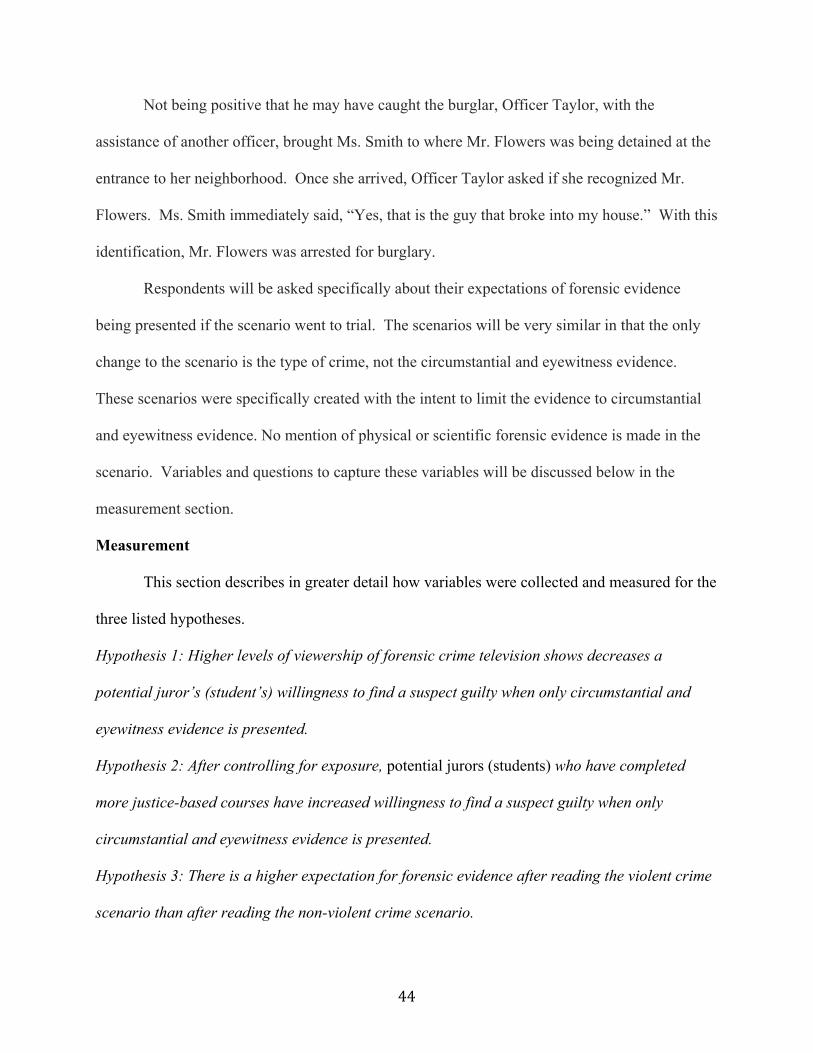
44
Not being positive that he may have caught the burglar, Officer Taylor, with the
assistance of another officer, brought Ms. Smith to where Mr. Flowers was being detained at the
entrance to her neighborhood. Once she arrived, Officer Taylor asked if she recognized Mr.
Flowers. Ms. Smith immediately said, “Yes, that is the guy that broke into my house.” With this
identification, Mr. Flowers was arrested for burglary.
Respondents will be asked specifically about their expectations of forensic evidence
being presented if the scenario went to trial. The scenarios will be very similar in that the only
change to the scenario is the type of crime, not the circumstantial and eyewitness evidence.
These scenarios were specifically created with the intent to limit the evidence to circumstantial
and eyewitness evidence. No mention of physical or scientific forensic evidence is made in the
scenario. Variables and questions to capture these variables will be discussed below in the
measurement section.
Measurement
This section describes in greater detail how variables were collected and measured for the
three listed hypotheses.
Hypothesis 1: Higher levels of viewership of forensic crime television shows decreases a
potential juror’s (student’s) willingness to find a suspect guilty when only circumstantial and
eyewitness evidence is presented.
Hypothesis 2: After controlling for exposure, potential jurors (students) who have completed
more justice-based courses have increased willingness to find a suspect guilty when only
circumstantial and eyewitness evidence is presented.
Hypothesis 3: There is a higher expectation for forensic evidence after reading the violent crime
scenario than after reading the non-violent crime scenario.

45
Dependent Variables (DV)
Willingness to find the suspect guilty variable- This is the primary DV used to test
hypotheses 1 and 2. After reading the scenario, respondents were asked how willing they
are to find the suspect guilty. The willingness variable is measured on a four-point scale.
(Not willing=1, Less willing=2, More willing=3, Very willing=4). The intent of using
this four-point scale is to remove a neutral position. It also allows the researcher to create
a dichotomous willingness variable for analysis. (Not willing=0, Willing=1).
Expectation of forensic evidence variable- This is the primary variable to test hypothesis
3. After reading the scenario, respondents were asked specifically if they would expect
forensic evidence to be presented at trial. The expectation variable is also measured on a
four-point scale. (Definitely would not=1, Probably would not=2, Probably would=3,
Definitely would=4). Again, The intent of using this four-point scale is to remove a
neutral position. It allows the researcher to create a dichotomous expectation variable for
analysis. (Would not=0, Would=1).
The correlation between the willingness and expectation variables is also examined using a chi-
square test. The results are discussed in Chapter Four.
Independent Variables (IV)
Inclusion of these independent variables is based upon theory, literature, and the social
constructionist framework discussed in Chapter Two.
Viewership variable- Exposure to forensic crime television shows, the main independent
variable of this study, is measured with the question “On average, how many hours of
forensic crime related television do you watch in a week?” Examples of these shows such
as: CSI, Forensic Files, NCIS, The First 48, and the like are included in the question. The

46
viewership variable is an open-ended question looking to capture ratio level responses.
Categories of amounts of viewership have been created to better understand the data.
This is the question that measures potential jurors’ (students') exposure to various law,
crime, and forensic related television programs. Forensic crime shows are defined as
crime dramas, documentaries, or reality television shows that discuss physical and
scientific evidence.
Scenario variable- This is the primary IV for hypothesis 3. Which scenario was the
student given? (Violent=1, Non-violent=0).
Race- (White, Black, Hispanic, Asian, American Indian, Bi/Multi-racial, Other)
Political ideology- When considering your political ideology, how would you classify
yourself? This is measured on a 5-point scale. (Conservative=1, Lean Conservative=2,
Moderate=3, Lean Liberal=4, Liberal=5). It should be noted that this variable is not
included in the analysis. The question was included to collect data for a future study.
One area that previous research fails to examine is the potential affect class rank and types of
classes and majors may have on students or potential jurors. These additional independent
variables are collected:
Major- Are you in a public justice or criminal justice major. (Yes=1, No=0)
Justice related courses- How many public justice, criminal justice, or law courses have
you completed? (0, 1, 2, 3, 4, 5 or more)
Class rank- What is your class rank? A student’s class standing is determined by the
number of hours of credit earned: freshman, 0 through 26 hours; sophomore, 27 through
56 hours; junior, 57 through 86 hours; senior, over 86 hours. (Freshman, Sophomore,
Junior, Senior).

47
Control Variables
Listed are the specific control variables that are commonly found within the literature.
Age- How old are you? A ratio level response was collected.
Gender- (Male=1, Female=0).
Criminal history- Has the respondent ever been charged with a criminal offense?
Respondents are asked to exclude minor traffic infractions. (Yes=1, No=0).
Previous juror- Has the respondent previously served as a juror? (Yes=1, No=0).
Jury eligible- Is the respondent eligible to serve on a jury? To be jury eligible, you must
be a U.S. citizen, be 18 years of age or older, never have been convicted of a felony, and
able to understand English. This is a qualification question for the study. Those that are
not jury eligible are excluded from the analysis.
The variables of viewership and number of justice related courses are intended to capture
information about the respondent’s symbolic knowledge, as a component of their socially
constructed reality. The variables of previously being a juror and having been charged with a
criminal offense relate to an individual’s experienced knowledge, as a component of their
socially constructed reality.
Research Design
This research utilizes a cross-sectional design. Therefore, it provides a “snapshot” of
student expectations during a semester. This design is simple, cost efficient, and appropriate for
this type of research seeking only to determine the existence of a correlation among expectations
of forensic evidence and the listed independent variables. One limitation is that this design,
unlike a longitudinal design, cannot capture change of expectations over time since it is only
capturing student expectations at one point in time. A longitudinal study may have more value

48
as it could track student expectations over a multi year academic career. However, due to the
cost, time, and complexity of a longitudinal study, it is not feasible.
Units of Analysis and Population The population for this study was composed of undergraduate students. For students to
be eligible to participate in the study, they had to have been enrolled in classes and physically
attending during the Spring 2013 semester. Online students were not given an opportunity to be
participants. They had to self-report being “jury eligible”. Jury eligible students are those
students that are United States citizens, at least 18 years of age, speak English, and have not been
convicted of a felonious crime.
A convenience sample of students was utilized. Therefore, this study utilizes a non-
probability sampling frame. One of the limitations of such a frame is that some students will
have no chance of being able to participate in the study. This limits the generalizability of the
findings. The researcher for this study had access to college students and professors. Classes of
students to survey were selected by size, convenience of scheduling, and approval of the
professor. Large sections of classes were given the highest priority.
The benefit of using convenience samples containing college students for trial
simulations, as opposed to archival records or post trial interviews, is “the ability to control
extraneous variables while manipulating the variable(s) of interest” (McCabe, Krauss, &
Lieberman, 2010, p. 730). Research in the area of mock juries versus actual juries shows that
mock juries that use college students are reliable. Research has generally found that there are few
consistent differences between representative samples and those consisting of college students
(Bornstein, 1999; Nunez, McCrea & Culhane, 2011). The use of the sampling of college
students is widespread in jury decision-making research and continues to rise (Lieberman,
49
Krauss & Wiener, 2011). The cost and convenience associated with these samples are the most
common cited reasons for their use.
Data Sources and Data Collection
Data collection for the study was conducted by utilizing an original survey instrument.
The surveys contain a crime scenario or “vignette”. As discussed in Chapter Two, these types of
instruments are popular for collecting mock trial and juror data. There were two potential
scenarios: 1) a violent crime scenario, and 2) a non-violent crime scenario. The circumstances
presented in the crime scenarios are the same except for the type of crime being committed.
Respondents only receive one scenario within their survey. Each type of scenario was
distributed equally.
Surveys included one of the following types of trial scenarios:
1) A violent crime scenario containing circumstantial and eye witness information, but no
specific mention of physical, scientific, or forensic evidence being collected (violent
crime case) or
2) A non-violent crime scenario containing circumstantial and eye witness information, but
no specific mention of physical, scientific, or forensic evidence being collected (non-
violent crime case).
Data was collected via a survey instrument from undergraduate students attending a
moderate sized, liberal arts university in the northeast. Jury eligibility questions, to include age,
were asked. The assumption is made that if they are able to complete the survey, they pass the
English requirement.
Requests were made to professors within the university, directly asking for their class’
participation in the study. Convenience of scheduling, class size, and the professor’s willingness
50
to come let the researcher pass out the survey ultimately determined class selection. Focus was
given to large classes containing high numbers of students. Secondary focus was given to pubic
justice classes to compare justice majors against non-justice majors.
Procedures
Prior to collecting data and distributing the survey instrument, the researcher obtained
institutional review board (IRB) approval from the participant university. This study required
expedited review. The survey did not collect any personal identifying information. All
participation has been and will be kept anonymous. Participation was voluntary and a consent
waiver was obtained. All results have been and will be kept in a locked filing cabinet in a locked
office.
After approval was obtained, the instrument was piloted. Feedback from the pilot, peers,
and the researcher’s dissertation committee were incorporated into the final survey. Feedback
was used to fine-tune the instrument. The pilot consisted of 28 undergraduate students. Peer
review came from colleagues, many of who teach justice or law based courses.
Once completed, the final survey instrument was distributed to undergraduate students.
Professors of large class sections throughout the University were asked for their classes’
participation. Data collection took place over four weeks. It was the goal of the researcher to
obtain over 1000 responses. 1652 were collected.
Data Analysis
Several types of analysis were conducted and are expounded upon in Chapter Four. All
responses from the survey were entered into the SPSS statistical package for analysis. Outcomes
from both of scenarios are analyzed. Descriptive analysis for all the responses is reported. A

51
chi-square test is used to analyze the relationship between the two dependent variables. Analysis
of the dependent variables is conducted utilizing regression.
Logistic regression allows the researcher to measure whether or not an independent
variable has any predictive properties over the dependent variable. Since both the willingness
and expectation variables are dichotomous (the willingness DV four-point scale and expectation
DV four-point scale have been collapsed into dichotomous variables), logistic regression is used.
It allows the researcher to understand the effect the independent variables has upon a potential
juror’s (student’s) willingness to find the suspect guilty and a potential juror’s (student’s)
expectation of forensic evidence being presented. Models for analysis of the two DVs are
discussed in Chapter Four.
Limitations
There may be limitations to using students rather than community members to predict
potential juror expectations. Using primarily students to conduct psycho-legal research, rather
than community members, may incorrectly predict the likely behavior of actual jurors (Fox,
Wingrove, & Phiefer, 2011). However, more research shows that the difference between student
samples and community samples is negligible (Hosch, Culhane, Tubb, & Granillo, 2011;
McCabe, Krauss, & Lieberman, 2010). In general, there is little difference in individual verdict
preferences between students and community members.
The greatest limitation will be that of generalizability. The geographic location of the
participants, age range, and other demographic characteristics will limit the generalizability of
the findings. Selection bias is included. Using a convenience sample also limits the
generalizability of the findings. As discussed above, some students, to include online only
students, never had an opportunity to participate. However, a large sample size helps overcome

52
some of these limitations.
Additionally, using a cross-sectional versus a longitudinal design provides limitations.
This cross-sectional design does not capture changes of willingness or expectation over time.
This study only captured the information at one point in time. It did not track students
throughout an academic career. Cost, time, and feasibility have been considered.
This chapter discussed the methodological plan for this study. The next chapter discusses
the data analysis and results of the survey. This includes data cleaning, variable selection,
descriptive analysis, and regression analysis. A discussion about these results is included in
Chapter Five.

53
Chapter 4: Analysis and Results
Overview
This chapter will discuss the preparation of the dataset and then the results. First, data
cleaning and selection of cases will be discussed. Second, descriptive statistics for the dependent
and independent variables will be provided. Third, the process for transformation and then
selection of variables into the logistic regression model will be discussed. Forth, each of the
three hypotheses will be tested and the results will be reported. Finally, other related findings
will be provided.
Data Cleaning
During data collection, 1652 surveys (Appendix A) were completed and entered into
SPSS. Of the 1652, 1583 participants claim to be jury eligible. As this is a study of potential
future jurors, those that did not report being jury eligible were removed. Four respondents did
not answer questions one and/or two (willingness variable and expectation variable), which are
the main dependent variables being tested. They were also removed. In addition, 14 of the
respondents did not complete question three (hours of viewership), which is the primary
independent variable. They too were removed. This results in 1572 cases to be included in the
analysis.
Descriptive Statistics
The overall demographics of the respondents show that most respondents were white
(84%) versus non-white (16%) and had a mean age of 20.3 with a range of 18 to 61. Reponses
show that the large majority had never served on a jury (98%), are not justice majors (86%), and
had not previously been charged with a crime (94%). The survey covered all class ranks by
showing that 28% were freshmen, 25% were sophomores, 26% were juniors, and 21% were

54
seniors. It also shows that most respondents had never completed a justice related class (59%).
Only 8.7% had completed 5 or more justice classes.
Table 4.1 provides the frequencies for the dependent variable for willingness to find the
suspect guilty, which was captured in question one of the survey. Table 4.2 provides the
frequencies for the second dependent variable, expectation of forensic evidence being presented
at trial, which was collected in question two of the survey. Table 4.3 provides the frequencies
for the primary independent variable; average hours of viewership per week of forensic crime
television. The viewership variable was collected at the ratio level and is used as such during
analysis. For illustrative purposes, the variable was broken down into the four categories of
viewership as seen in Table 4.3 below.
These tables show that the majority of respondents are somewhat willing to find the
suspect in the scenarios guilty (58%), probably would expect forensic evidence to be presented at
trial (39%), and report watching a minimal amount (1 to 3 hours) of forensic crime related
television per week (39%). The average viewership reported is 2.8 hours. All frequencies and
descriptive outputs for each variable are reported in Appendices C and D respectively.

55
Transformation and Selection of Variables
As discussed in Chapter Three, logistic regression is used for analysis and to test
hypotheses 1 and 2. Logistic regression allows the researcher to understand the influence single
variables have upon a dependent variable while holding other variables constant. Binary logistic
regression takes into account the categorical and non-metric nature of the dependent variable. It
provides analysis of dichotomous dependent variables.
As previously discussed in Chapter Three, the intent of using the four-point scale to
capture a respondent’s willingness to find the suspect guilty was to remove the possibility of a
neutral position. It was intended to require respondents to take a position and not “sit on the
Table 4.1Willingness Frequency (%) a Count (n)Not at all willing 4 61Not too willing 24 371Somewhat willing 58 906Very Willing 15 234a. May not total 100% due to rounding
Table 4.2Expectation Frequency (%) a Count (n)Definitely would not 2 34Probably would not 21 324Probably would 39 610Definitely would 38 604a. May not total 100% due to rounding
Table 4.3Hours of Viewing Frequency (%) a Count (n)0 (None) 35 5521-3 (Minimal) 39 6114-6 (Moderate) 16 2527 or more (Heavy) 10 157a. May not total 100% due to rounding

56
fence”, which is similar to the requirements of a juror. It is shown in Table 4.1 that the majority
of people fall into the middle categories of “not at all willing” or “somewhat willing” (82%).
Few people stated they were “not at all willing” (4%) or “very willing” (15%). There were not
many respondents that fell at the extreme points of the scale. With this in mind, the four-point
“willingness” scale is collapsed into a dichotomous variable, “not willing” (coded 0) and
“willing” (coded 1). Table 4.4 shows the frequencies of the new, dichotomous variable. The
majority of the respondents fall into the willing category.
For preliminary analysis and to aid in selecting the most parsimonious model to test
hypotheses 1 and 2, a logistic regression model including all of the independent variables was
run. Table 4.5 shows the logistic regression coefficient, Wald test, and odds ratio for each of the
predictors. Discussion and interpretation of the predictor variables follows.
Table 4.4Willingness Frequency (%) a Count (n)Not Willing 28 432Willing 73 1140a. May not total 100% due to rounding
Table 4.5Logistic Regression Predicting Willingness from Viewership, Juror, Age, Gender,Race, Charged, Class Rank, Major, Number of Justice Classes and Scenario
B Wald p Odds RatioViewership -0.016 3.002 0.083 0.985Juror -0.539 1.752 0.186 0.583Age -0.02 1.138 0.286 0.98Gender -0.331 7.855 0.005 0.718RaceBinary 0.225 2.101 0.147 1.252Charged 0.41 2.39 0.122 1.507ClassRank -0.058 0.813 0.367 0.944JusticeMajor 0.018 0.006 0.939 1.018CJ_Classes -0.079 1.853 0.173 0.924Scenario -0.391 11.181 0.001 0.677Constant 1.83 22.339 0 6.236
57
Employing a .05 criterion of statistical significance, gender and scenario are the only
variables show to have significant partial effects. The odds ratio for gender indicates that when
holding all other variables constant, a man is .7 times less likely to be willing to find the suspect
guilty. The odds ratio for scenario indicates that when holding all other variables constant, those
receiving the violent crime scenario are .67 times less likely to be willing to find the suspect
guilty.
Although not statistically significant at the .05 criterion, the variables can be interpreted
as such in the following way. As viewership increases, willingness to find the suspect guilty
decreases. Having been a juror in the past deceases the willingness to find the suspect guilty.
As age increases, willingness to find the suspect guilty decreases. Whites are more willing than
non-whites to find the suspect guilty. Those that have been charged with a crime previously are
more willing to find the suspect guilty. As class rank increases, willingness to find the suspect
guilty decreases. Those that are justice majors are more willing to find the suspect guilty. And
as the number of justice related classes’ completed increases, willingness to find the suspect
guilty decreases.
Prior juror experience, previously being charged with a crime, class rank, age, major,
number of justice-based classes, and race were not found to be statistically significant. Much of
this is likely due to the homogeneity of the sample population. In addition, there is likely an
issue with multicollinearity due to the inter-associations with the variables of class rank, age,
major, and number of justice-based classes. Schooling is progressive. As age increases, so does
class rank. The number of classes could be related to age or rank because major-specific courses
are usually completed in the junior and senior years. Multicollinearity can result from the
58
repetition of similar variables. Number of justice-based classes captures similar information to
age, major, and class rank.
Bivariate analysis, to include cross tabulations and chi-square tests of the independent
variables and willingness variable, was conducted. These results were also considered when
building the final model shown in Table 4.6. The outputs for the bivariate analysis are provided
in Appendix G. The bivariate analysis of willingness and number of justice-based classes reports
a chi-square statistic of 15.48 and a significance of .009. This suggests there is a strong
relationship between the IV of number of justice-based classes and willingness to find the
suspect guilty, even though this is not seen in the preliminary model. In addition, understanding
the effect the number of completed justice-based classes has upon the DV of willingness is the
focus of the second hypothesis. Therefore, in order to create a parsimonious model, variables
that do not appear to significantly influence the dependent variable or create concerns of
multicollinearity are removed.
Based upon the focus of the study and hypotheses presented, the variables of viewership
(hypothesis 1) and number of justice-based classes (hypothesis 2) should be examined further.
Therefore, the new model is created only including viewership, number of justice-based courses,
gender, and scenario variables. Table 4.6 shows the logistic regression coefficient, Wald test,
and odds ratio for each of these four predictors. The full SPSS logistic regression output is
contained in Appendix F.

59
Employing a .05 criterion of statistical significance, the variables of gender, scenario, and
justice classes appear to have significant partial effects. Viewership is still not statistically
significant. The odds ratio for gender indicates that when holding all other variables constant, a
man is .73 times less likely to be willing to find the suspect guilty. The odds ratio for scenario
indicates that when holding all other variables constant, those receiving the violent crime
scenario are .69 times less likely to be willing to find the suspect guilty. The odds ratio for
justice classes indicates that when holding all other variables constant, as the number of classes
increases by 1, the potential juror is .9 times less likely to be willing to find the suspect guilty.
The viewership variable suggests that as the number of hours of viewership increases by 1, the
willingness to find the suspect guilty decreases by .99 times. However, viewership does not
appear to significantly influence the dependent variable of willingness.
As shown in Appendix F, this model has a Cox and Snell r-square statistic of .019 and a
Nagelkerke r-square statistic of .028. These statistics are low and may suggest the model has
limited predictive power. However, these pseudo r-square statistics are not heavily relied upon
in binary logistic regression analysis, as the r-squared statistic was designed for linear regression
analysis. The Omnibus Tests of Model Coefficients shows a chi-square of 30.26 and a
significance of .000. This shows the model is statistically significant. Another test to show
goodness of fit is the Hosmer-Lemeshow Test, which was conducted. It shows a chi-square of
Table 4.6Logistic Regression Predicting Willingness from Viewership,Number of Justice Classes, Gender and Scenario
B Wald p Odds RatioViewership -0.014 2.551 0.11 0.986CJ_Classes -0.101 8.082 0.004 0.904Gender -0.321 7.749 0.005 0.725Scenario -0.369 10.323 0.001 0.692Constant 1.473 170.267 0 4.362
60
10.94 and a significance of .205. This non-significant chi-square indicates that the data fits the
model well and that the overall model fit is good.
Hypothesis 1: Higher levels of viewership of forensic crime television shows decreases a
potential juror’s (student’s) willingness to find a suspect guilty when only circumstantial
and eyewitness evidence is presented.
Using the above model, displayed in Table 4.6, it appears that as viewership increases
that the willingness to find the suspect guilty decreases. The odds ratio for viewership suggests
that for every one hour increase of viewership of forensic crime television shows, a potential
juror is .99 times less likely to be willing to find the suspect guilty. Using the .05 criterion for
statistical significance, viewership is not statistically significant. It does not appear to affect a
person’s willingness to find the suspect guilty. Therefore, in the absence of forensic evidence,
higher levels of viewership of forensic crime television shows do not decrease a potential juror’s
(student’s) willingness to find a suspect guilty when only circumstantial and eyewitness evidence
is presented.
Table 4.7 helps reiterate this finding. It shows how the probability for finding guilt
changes when hours of forensic crime television is increased and other factors are held constant.
For this illustration, the average potential juror is used. The average potential juror from the
study is a female, receiving the non-violent scenario, and has completed no justice-based classes.
Viewership is shown from 0 to 7 hours per week. Again, it must be understood that using the .05
criterion for statistical significance, viewership is not statistically significant. It has little to no
predictive power over the dependent variable. Converting logits to odds and then to probabilities
created the probabilities reported in Table 4.7.

61
Hypothesis 2: After controlling for exposure, potential jurors (students) who have
completed more justice-based courses have increased willingness to find a suspect guilty
when only circumstantial and eyewitness evidence is presented.
Using the above model, displayed in Table 4.6, in absence of forensic evidence, it
appears that as the number of justice related courses completed by a potential juror increases, the
willingness to find the suspect guilty decreases. The odds ratio for justice classes indicates that
when holding all other variables constant, as the number of classes increases by 1, the potential
juror is .9 times less likely to be willing to find the suspect guilty. This is the opposite of what is
stated in hypothesis 2.
Table 4.8 helps to illustrate this effect. Table 4.8 takes the average potential juror
(female, receiving the non-violent scenario, and 2.8 hours of forensic crime television
viewership) and shows how additional justice-based classes change the probability of the
potential juror finding the suspect guilty. It shows that as the number of completed justice-based
courses increases from 0 to 5, there is a 13% decrease in likelihood that the potential juror will
find the suspect guilty. Therefore, after controlling for exposure, potential jurors (students) who
have completed more justice-based courses have decreased willingness to find a suspect guilty
when only circumstantial and eyewitness evidence is presented. This suggests that a juror
having additional justice education may be more critical of eyewitness and circumstantial
evidence. This idea is further expounded upon in Chapter Five.
Table 4.7Hours of Viewership
0 1 2 3 4 5 6 7Willing 62% 61% 61% 61% 60% 60% 60% 59%
Not Willing 38% 39% 39% 39% 40% 40% 40% 41%
(Potential juror that is female, received the non-violent scenario and has completed no justice-based classes)

62
Hypothesis 3: There is a higher expectation for forensic evidence after reading the violent
crime scenario than after reading the non-violent crime scenario.
To test hypothesis 3, a chi-square test and cross tabulation of the expectation variable and
the scenario variable is used. A chi-square test is used when the researcher wants to see if there
is a relationship between two categorical variables. Both expectation and scenario are
categorical variables. The cross tabulation will help illustrate how the scenario affects
expectation of forensic evidence being presented at trial.
Table 4.8Number of Classes
0 1 2 3 4 5Willing 61% 58% 56% 53% 51% 48%
Not Willing 39% 42% 44% 47% 49% 52%
(Potential juror that is female, received the non-violent scenario and watches 2.8 hours of forensic crime television)
Table 4.9Expectation * Scenario Crosstabulation
ScenarioNon-Violent Violent Count
% % nExpectation Definitely would not 2 2 34
Probably would not 25 16 324Probably would 37 41 610Definitely would 35 42 604
Table 4.10Chi-Square Tests
Value df Asymp. Sig. (2-sided)Pearson Chi-Square 23.720a 3 .000Likelihood Ratio 23.893 3 .000Linear-by-Linear Association 17.401 1 .000N of Valid Cases 1572a. 0 cells (0.0%) have expected count less than 5. The minimum expected count is 16.98.

63
Table 4.9 shows that the scenario received by respondents does affect their expectation of
forensic evidence being presented at trial. Respondents are more likely to expect forensic
evidence at trial for a violent crime rather than a non-violent crime. The chi-square tests show
that significance is less than .05, and therefore statistically significant. There is a higher
expectation for forensic evidence after reading the violent crime scenario then after reading the
non-violent crime scenario.
Breaking down expectation into a dichotomous variable (would and would not) may help
to illustrate the findings a bit more. Table 4.11 shows this breakdown. 72% of those that
received the non-violent crime scenario would expect forensic evidence to be presented at trial.
82% of those that received the violent crime scenario would expect forensic evidence to be
presented at trial. Again, the difference is shown to be statistically significant.
Table 4.11Expectation(Binary) * Scenario Crosstabulation
ScenarioNon-Violent Violent Count
% % n (%)Expectation(Binary) Would Not 28 18 358 (23)
Would 72 82 1214 (77)
Table 4.12Chi-Square Tests
Value df Asymp. Sig. (2-sided)Pearson Chi-Square 22.886a 1 .000Continuity Correction b 22.314 1 .000Likelihood Ratio 23.041 1 .000Linear-by-Linear Association 22.872 1 .000N of Valid Cases 1572a 0 cells (0.0%) have expected count less than 5. The minimum expected count is 178.77.b Computed only for a 2x2 table

64
Additional Findings
During the analysis conducted to test hypotheses 1 and 2, it was found that two other
variables, gender and scenario, are statistically significant. Table 4.6 shows the odds ratio for
gender indicates that when holding all other variables constant, a man is .73 times less likely to
be willing to find the suspect guilty. The odds ratio for scenario indicates that when holding all
other variables constant, those receiving the violent crime scenario are .69 times less likely to be
willing to find the suspect guilty. To help understand the influence of these variables on the
willingness to find the suspect guilty, the following tables have been created using the same
logistic regression model from above (Table 4.6).
Table 4.13 takes the profile of the “average” potential juror and shows differences by
gender. The profile above is looking at that of the average viewer (2.8 hours) that has completed
no justice classes, and received the non-violent scenario. It shows that female respondents are
more willing to find the suspect guilty than male respondents. It shows approximately an 8%
difference. The model does show gender as being statistically significant (Table 4.6).
Table 4.13Gender
Female MaleWilling 61% 53%
Not Willing 39% 47%(Potential juror receiving the non-violentscenario, watches an average of 2.8 hoursof forensic crime television, and has completedno justice-based courses)
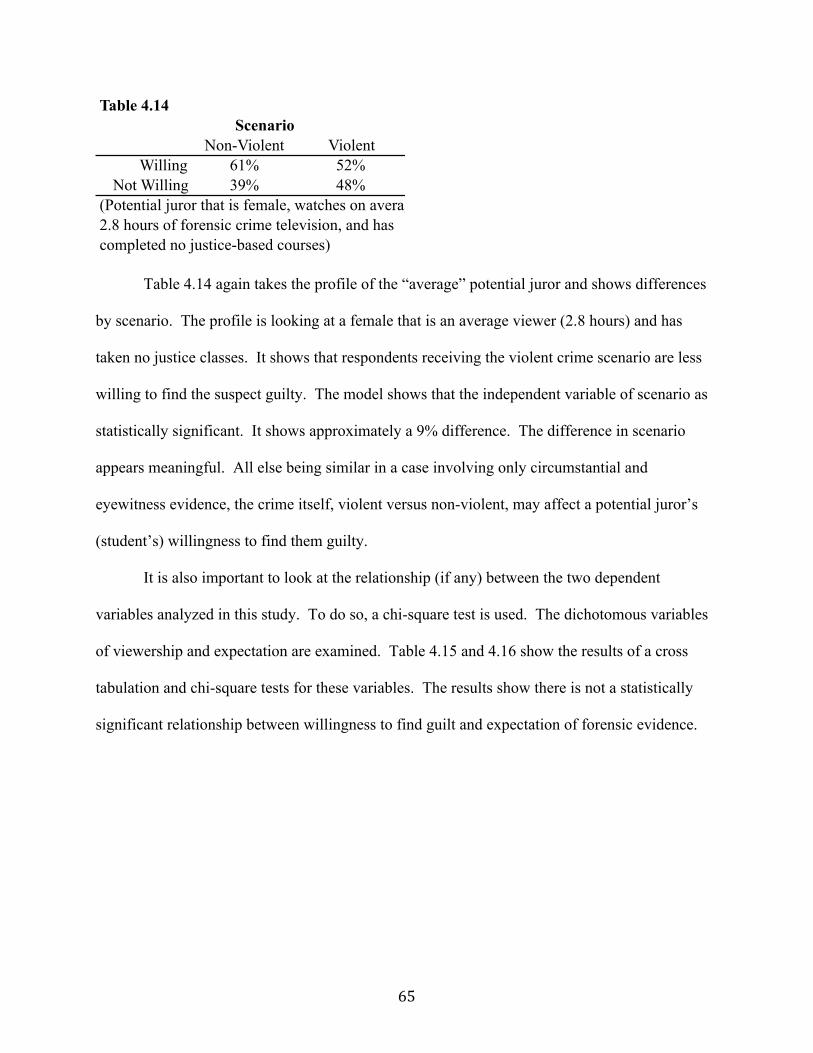
65
Table 4.14 again takes the profile of the “average” potential juror and shows differences
by scenario. The profile is looking at a female that is an average viewer (2.8 hours) and has
taken no justice classes. It shows that respondents receiving the violent crime scenario are less
willing to find the suspect guilty. The model shows that the independent variable of scenario as
statistically significant. It shows approximately a 9% difference. The difference in scenario
appears meaningful. All else being similar in a case involving only circumstantial and
eyewitness evidence, the crime itself, violent versus non-violent, may affect a potential juror’s
(student’s) willingness to find them guilty.
It is also important to look at the relationship (if any) between the two dependent
variables analyzed in this study. To do so, a chi-square test is used. The dichotomous variables
of viewership and expectation are examined. Table 4.15 and 4.16 show the results of a cross
tabulation and chi-square tests for these variables. The results show there is not a statistically
significant relationship between willingness to find guilt and expectation of forensic evidence.
Table 4.14Scenario
Non-Violent ViolentWilling 61% 52%
Not Willing 39% 48%(Potential juror that is female, watches on average2.8 hours of forensic crime television, and hascompleted no justice-based courses)

66
Summary of Results
From the results of the data collected in this study, it does not appear that viewership of
forensic crime television influences a potential juror’s (student’s) decision to find a suspect
guilty or not guilty. After controlling for viewership, it appears that the number of justice-based
classes completed by the potential juror (student) does influence their decision to find the suspect
guilty. As the number of completed courses increases, the willingness of the potential juror to
find the suspect guilty decreases. The analysis shows that gender and the type of scenario
(violent versus non-violent) may influence willingness to find the suspect guilty as well. Females
are more willing to find the suspect guilty and males are less likely. Those exposed to violent
crime scenarios may be less willing to find the suspect guilty with only eyewitness and
circumstantial evidence presented. It also appears that potential jurors (students) are more likely
to expect forensic evidence at trial for a violent crime rather than a non-violent crime.
Table 4.15Willingness(Binary) * Expectation(Binary) Crosstabulation
ExpectationWould Not Would Count a
% % n (%)Willingness Not Willing 28 27 432 (28)
Willing 72 73 1140 (73)a. May not total 100% due to rounding
Table 4.16Chi-Square Tests
Value df Asymp. Sig. (2-sided)Pearson Chi-Square .048a 1 0.827Continuity Correctionb 0.023 1 0.88Likelihood Ratio 0.047 1 0.828Linear-by-Linear Association 0.048 1 0.827N of Valid Cases 1572a 0 cells (0.0%) have expected count less than 5. The minimum expected count is 98.38.b Computed only for a 2x2 table

67
Table 4.17Summary of Findings
Hypothesis 1
Higher levels of viewership of forensic crime television shows do not significantly affect a potential juror’s (student’s) willingness to find a suspect guilty when only circumstantial and eyewitness evidence is presented.
Hypothesis 2
After controlling for exposure, potential jurors (students) who have completed morejustice-based courses have decreased willingness to find a suspect guilty when only circumstantial and eyewitness evidence is presented.
Hypothesis 3
There is a higher expectation for forensic evidence after reading the violent crime scenario than after reading the non-violent crime scenario.

68
Chapter 5: Discussion and Conclusions
Introduction
The focus of this chapter is to discuss the relevance of the analysis and provide
recommendations for further research. The purpose of this study is to better understand the
relationship exposure to forensic crime television has on a potential juror’s (student’s)
willingness to find a suspect guilty without forensic evidence being presented at trial. This study
also looks at a potential juror’s expectation of forensic evidence being presented at trial based
upon this exposure. Additional predictors for willingness to find a suspect guilty and expectation
of forensic evidence being presented at trial were also examined. Some of the predictors the
study focused on included the number of justice-based classes completed, gender, and the type of
crime scenario (violent versus non-violent) the potential juror received.
The theoretical foundation for this study is based upon that of social constructionism. As
discussed in much greater detail in Chapter Two, social constructionism is the idea that people
combine experienced reality with symbolic reality to create a socially constructed reality
(Surette, 2011). Knowledge is created by an individual’s interaction with society (Schwandt,
2003). People gain some knowledge from first hand accounts (experience) and gain some
knowledge through other sources (symbolic). These symbolic sources may include other people,
books, media, and television. These experiences and symbolic sources create a person’s
perceived reality. This perceived reality might influence juror decision-making. This study
looked at specific variables that may contribute to a potential jurors socially constructed reality.
Methods and Data
This study utilized a quantitative approach within a cross-sectional research design. A
survey instrument utilizing fictitious crime scenarios was developed to collect data (Appendix

69
A). The focus of the crime scenarios was to provide the respondent with a crime scenario that
involved only circumstantial and eyewitness evidence. There was purposely no mention of
forensic evidence being collected or analyzed. IRB approval was obtained and the survey was
piloted. After the pilot and committee review, small changes were made and the survey was
distributed. 1652 surveys were completed by undergraduate students during data collection and
entered into SPSS. Once data cleaning and case selection was completed, 1572 cases were used
in the analysis. Descriptive and regression analysis was used to analyze the variables.
The dependent variables for this study are willingness to find the suspect guilty and
expectation of forensic evidence. The independent variables for this study include viewership of
forensic crime television shows, the number of justice related courses the respondent has
completed, the scenario itself (violent versus non-violent), race, academic major, and class rank.
Control variables include age, gender, and criminal history. The final sample for analysis only
included those that reported to be jury eligible. Jury eligible students are those students that are
United States citizens, at least eighteen years of age, speak English, and have not been convicted
of a felonious crime.
The overall demographics of the respondents show that most respondents were white
(84%) versus non-white (16%), and had a mean age of 20.3 with a range of 18 to 61. Reponses
show that the large majority had never served on a jury (98%), are not justice majors (86%), and
had not previously been charged with a crime (94%). The survey covered all class ranks by
showing that 28% were freshmen, 25% were sophomores, 26% were juniors, and 21% were
seniors. It also shows that most respondents had never completed a justice related class (59%).
Only 8.7% had completed 5 or more justice classes.

70
Additional descriptives show that the majority of respondents are somewhat willing to
find the suspect in the scenarios guilty (58%), probably would expect forensic evidence to be
presented at trial (39%), and report watching a minimal amount (1 to 3 hours) of forensic crime
related television per week (39%). The average viewership reported is 2.8 hours per week. All
frequencies and descriptive outputs for each variable are reported in Appendices C and D
respectively. Further analysis revealed that the number of justice related courses, the type of
scenario, and gender were statistically significant.
Major Findings
Utilizing the analysis discussed in Chapter Four, it does not appear that viewership of
forensic crime television influences a potential juror’s (student’s) decision to find a suspect
guilty or not guilty. However, after controlling for viewership, it appears that the number of
justice-based classes completed by the potential juror (student) does influence their willingness
to find the suspect guilty. As the number of completed courses increases, the willingness of the
potential juror to find the suspect guilty decreases. Increased justice-based education appears to
make potential jurors more critical of circumstantial and eyewitness evidence based scenarios
when there is no mention of forensic evidence.
The analysis also shows that gender and the type of scenario (violent versus non-violent)
may influence willingness to find the suspect guilty as well. Females are more willing to find the
suspect in these scenarios guilty. Males are less likely to find the suspect guilty. Those exposed
to the violent crime scenario were less willing to find the suspect guilty with only eyewitness and
circumstantial evidence presented. It was also found that potential jurors (students) are more
likely to expect forensic evidence at trial involving a violent crime scenario rather than a non-
71
violent crime scenario. There appears to be no correlation between the expectation of forensic
evidence being presented and willingness to find the suspect guilty.
Discussion
Hypothesis 1: Higher levels of viewership of forensic crime television shows decreases a
potential juror’s (student’s) willingness to find a suspect guilty when only circumstantial and
eyewitness evidence is presented.
This study shows that viewership of forensic crime based television does not affect a
potential juror’s willingness to find a suspect guilty when only circumstantial and eyewitness
evidence is presented. This supports previous findings from Kim, Barak, and Shelton (2009).
They found that exposure to CSI-type dramas had no significant effect on jurors’ decisions to
convict a suspect.
This study does show that gender, education, and type of scenario (violent crime versus
non-violent crime) does affect a potential juror’s (student’s) willingness to find a suspect guilty
in the absence of forensic evidence. This study shows that females are more willing to find a
suspect guilty than males. Kim et al. (2009) had the opposite finding. They found that males
were more likely to convict on eyewitness evidence than females. This study finds conflicting
evidence to gender differences in juror willingness to find a suspect guilty. At this time, it
appears the effect gender has upon jury willingness to find a suspect guilty is plausible, but
inconclusive.
Social constructionism suggests that individuals develop their own socially constructed
reality through first hand experience and exposure to information not directly experienced.
There is no new evidence to suggest that television is still not the most influential medium in the
United States. This study suggests that for most people, exposure to forensic crime related

72
television does not influence their willingness to find a suspect guilty or not guilty. However,
the amount of anecdotal evidence found in the literature suggests that there are some individuals
that are going to be influenced by what they see on television. Television is a powerful source of
symbolic reality and may play a large role in an individual’s socially constructed reality.
Hypothesis 2: After controlling for exposure, potential jurors (students) who have completed
more justice-based courses have increased willingness to find a suspect guilty when only
circumstantial and eyewitness evidence is presented.
This study shows that an increase in justice-based education (number of completed
justice-based courses) decreases the willingness of potential jurors to find a suspect guilty when
only circumstantial and eyewitness evidence is presented. This is in direct contradiction to the
original hypothesis. The hypothesis was drawn from the simple assumption that those with more
justice-based education would utilize the combination of eyewitness and circumstantial evidence
to find the suspect guilty. The finding of those with more education being less willing to find a
suspect guilty is consistent with the findings of Kim et al. in 2009. They found that jurors with
lower levels of education were more willing to convict a suspect in circumstantial cases versus
jurors with higher levels of education. They did not specifically look at justice-based education
as this study has done.
Hypothesis 2 was also developed to address one the areas needing further exploration
pointed out by Shelton, Kim, and Barak (2006). They stated their findings might not be clear
due to other variables, such as knowledge of the criminal justice system. Knowledge of the
criminal justice system was collect by asking respondents how many justice-based courses they
had completed. The assumption is made that those who have completed more justice-based

73
courses have a better understanding of the justice system than those who have not completed as
many justice-based courses.
It appears higher levels of education, and even more specific, justice-based education,
makes potential jurors’ more critical of circumstantial and eyewitness evidence when forensic
evidence is not presented. As is taught in criminal justice programs and is accepted fact,
eyewitness identification is at times not reliable (Wells & Olson, 2003). The criminal justice
system still heavily relies upon eyewitness identification. Recent cases involving exoneration
from DNA evidence have collaborated these concerns (Wells & Olson, 2003). Therefore, it is
reasonable to believe that those potential jurors with more education are likely to be more critical
of cases involving only eyewitness information without collaborating forensic evidence.
This relates directly to the power of symbolic reality within the social constructionist
framework. Education and media exposure about the pitfalls of eyewitness evidence may
contribute to the socially constructed reality a potential juror brings with them to the jury box. In
this case, the juror becomes more critical with added knowledge, although not experienced
knowledge. Although this study does not specifically isolate exposure to information and
learning about eyewitness evidence, reasonable assumptions can be made that those with higher
levels of justice-based education have more likely been exposed to this information than those
without. This therefore gives credence to the idea that exposure to information, through media
or formal education, may change the behavior of a potential juror.
Hypothesis 3: There is a higher expectation for forensic evidence after reading the violent crime
scenario than after reading the non-violent crime scenario.
Findings from this study support the hypothesis that there is a higher expectation for
forensic evidence to be presented at trial for the violent crime scenario versus the non-violent

74
crime scenario. This finding is also consistent with Shelton, Kim, and Barak’s (2006) findings.
They found that as the seriousness of the crime increased, so did the expectation for scientific
evidence being presented. However, they did conclude that this increase in expectation was only
marginal. In this study, it was found that there was a 10% increase in expectation of evidence for
the violent crime scenario over the non-violent crime scenario. See Table 4.11.
In 2006, Shelton et al. also reported that 46.3% of the respondents to their survey
expected to see scientific evidence presented in every criminal case. This study shows that 77%
of all of the respondents had some level of expectation of forensic evidence being presented at
trial. See Table 4.11. This is fascinating as it has been less than a decade of time between the
studies and there appears to be a significant increase. Of course, methodology and data
collection may account for some of this. In addition, the demographics for each of these studies
are different, especially when it comes to age. The mean age for this study is 20 years of age and
the mean age for Shelton et al. study is 45 years of age. Although not conclusive, the difference
in these two studies suggest that the younger generation of potential jurors may appear to have a
higher expectation of forensic evidence being presented at trial.
This finding also supports Mann’s (2006) belief that witnesses may have a lesser role in
today’s trials. Television has taught potential jurors about DNA but not when to use it in
criminal trials (Mann, 2006). Most, 77%, of the respondents in this study expected forensic
evidence to be presented. In both the violent and non-violent crime scenario, there was arguably
no realistic opportunity for forensic evidence to be used to identify the perpetrator. In real life,
fingerprints or DNA would not be an option. However, it is apparent that many people today
expect this type of evidence. Fortunately, as this study suggests, there is no significant
correlation to willingness and expectation. This also supports Holmgren and Fordham’s (2011)
75
finding that juries do want to know why forensic evidence was not presented at trial, but will still
carefully weigh all of the other evidence, including eyewitness evidence.
Other Findings
This study also shows that the type of crime (crime scenario) affects an individual’s
willingness to find a suspect guilty. This study suggests that potential juror’s are less willing to
find a suspect guilty of a violent crime then of a non-violent crime in the absence of forensic
evidence. There are a couple plausible thought processes that may explain this from the
scenarios used. The first is that there may be the assumption that there would be an increased
penalty associated with the violent crime versus a non-violent crime. Therefore, individuals
may require a higher burden of proof to find guilt. The second is that the violent crime scenario
may offer additional opportunity to provide forensic evidence linking the suspect to the crime.
However, as this scenario was purposely crafted, in reality, there is little to no opportunity for
forensic evidence to be used to link the suspect to the crime in the violent crime scenario. Only
the eyewitness evidence and circumstantial evidence discussed could be reasonably used for this.
This gives more plausibility to the first thought process of that if there is a possibility of
increased punishment, there may be a higher burden of proof necessary. It must be reiterated, this
was not the focus of the study and this was not specifically addressed in the research. It would
be an interesting area to explore in future research.
Public Policy Implications
Criminal justice and the administration of justice is a focus of public policy. It is a
responsibility of government. The justice system has a responsibility to ensure justice for those
accused of a crime and for the victims of crime. Government has a responsibility to protect its
citizens. Justice and public safety is a public policy concern.
76
This study took a practitioner-based approach to the question of how forensic crime
television viewership may affect those making justice-based decisions. It specifically looked at
potential jurors. Jurors are justice decision-makers. Since the criminal justice system places a
high level of responsibility on jurors, it is important to understand what variables may influence
their decision-making.
Intelligent questioning of jurors during the voir dire process can be a critical component
of the jury process. The information gained through this study may assist with more intelligent
questioning of potential jurors during the voir dire process. As Cole and Dioso-Villa (2007)
point out, some of the measures to counteract the existing beliefs about the CSI Effect include
questioning jurors about television viewing during the voir dire process, explaining why forensic
evidence is absent or not needed during opening and closing statements, and calling experts to
testify why forensic evidence was not found. Cole and Dioso-Villa (2007) found some defense
attorneys readily admitted to exploiting the CSI Effect.
Trial attorneys should not focus on the number of hours of forensic crime related
television jurors’ watch. Television or media coverage of the specific case they are about to try
is a different concern not specifically addressed in this study. Trial attorneys will also benefit
from understanding the young generation of jurors that is starting to show up in the jury box.
They have a higher expectation of forensic evidence being used or discussed at trial. However, it
does appear that they are able to put this aside and focus on a totality of the circumstances. It is
beneficial for judges, attorneys, and law enforcement officers to understand that expectation of
forensic evidence is not correlated to their willingness to find a suspect guilty.
As a policy concern, the recommendation is not to change current policy or enact new
policy as it relates to the CSI Effect. As is quite often seen in the public policy arena, policy

77
makers want to take action before completely understanding the scope of a problem or even
understanding if a problem truly exists. Although this study does not definitely disprove the
existence of a CSI Effect, it does support other findings that the amount of forensic crime
television a potential juror watches does not likely influence their willingness to find a suspect
guilty. No new policies to combat the so-called CSI Effect need to be implemented.
One additional area of public policy focus in this study is that of education policy. This
study looked at how increased justice education may influence a juror’s willingness to find a
suspect guilty. This study found that an increase in justice-based education decreased a potential
juror’s willingness to find a suspect guilty when only circumstantial and eyewitness evidence is
available. It appears that those who have been exposed to more justice-based courses are more
critical of circumstantial and eyewitness evidence when forensic evidence is not presented. It is
important for policy makers and practitioners to understand how education affects justice
outcomes. This is finding that educators may want to discuss further in the academic arena.
Recommendations for Juror Selection
The findings from this study may help trial attorneys better prepare for the voir dire
process by understanding the jury pool a little better. This study found that those potential jurors
with higher levels of education, specifically justice-based education, were less likely to find the
suspect in the scenarios guilty. Therefore, defense attorneys may want to select those jurors with
higher levels of education, especially justice-based education, for primarily circumstantial cases.
It appears that potential jurors with higher levels of education are more critical of circumstantial
and eyewitness evidence.
The opposite would be true for prosecutors of circumstantial evidence cases. This study
found that those potential jurors with less education were more likely to find the suspect in these
78
scenarios guilty. It appears they may put more value in circumstantial and eyewitness evidence.
Prosecutors may want to focus on selecting jurors with less formal justice education. However,
this may be a difficult concept to defend.
In regards to jury selection, this study did find a difference in gender. This study found
that potential female jurors were more willing to find the suspect guilty from the scenarios. Male
respondents were less likely to find the suspect guilty. However, this finding is in contrast to
previous findings (Kim et al., 2009). The finding of gender differences in this study may have
been influenced by the gender of the victim in the scenarios. The victim was female. This may
have affected female respondents. This is an area that could be explored further and was not
specifically addressed in this study. With these findings in mind, no recommendations for jury
selection based upon gender can be reasonably made from this study.
This study did not find evidence that selecting jurors based upon forensic crime related
television viewership has a significant effect on decision making. Viewership of forensic crime
television does not appear to significantly affect a potential jurors willingness to find a suspect
guilty. Trial attorneys may want to focus on other areas of concern. Overall, the information
gained in this study may aid trial attorneys in the intelligent questioning of jurors.
Conclusions
Television is one of the most influential mediums in the United States. It is influential
because it projects realistic images into the homes of viewers (Mann, 2006). Many of the images
are fictitious. A problem occurs when people believe that these realistic, but fictitious, images
are reality. This study suggests that this should not be a great concern for the American jury
system. Consistent with previous findings from Kim, Barak, and Shelton (2009), exposure to

79
forensic crime television does not appear to be a significant predictor of a juror’s willingness to
find a suspect guilty.
It does not appear that viewership of forensic crime based television has an effect on a
potential juror’s (student’s) willingness to find a suspect guilty when only circumstantial and
eyewitness evidence is presented. However, it does appear that expectations for forensic
evidence being presented at trial vary for violent versus non-violent types of crimes. Although
viewership of forensic crime television does not affect a juror’s willingness to find a suspect
guilty, this study finds that gender, justice-based education, and type of crime may affect a
juror’s willingness to find a suspect guilty. Females were more willing to find the suspect guilty
than males were. Those who completed a greater number of justice-based courses were less
willing to find the suspect guilty. Also, those given the violent crime scenario were less willing
to find the suspect guilty than those who were given the non-violent crime scenario. Again,
these findings involved crime scenarios that involved no forensic evidence, only eyewitness and
circumstantial evidence.
In the American system, jurors are asked to find a suspect guilty or not guilty. There is
no in-between, or scale for guilt. Jurors are requested to give a binary response, guilty or not
guilty. As found in this study, most respondents expected forensic evidence to be presented at
trial, however; it appears this expectation did not affect their willingness to find the suspect
guilty. Again, there appears to be no significant correlation between willingness and
expectation. With this in mind, the researcher suggests that future CSI Effect studies focus more
on juror outcomes (willingness) versus a juror’s expectation of forensic evidence. This study
finds that expectation does not predict willingness, and therefore is the wrong question to focus
on when exploring the practical impact of crime related television upon juror decision-making.

80
This study reduces the gap in the knowledge of how forensic crime television exposure
affects jury decision-making. It improves upon limitations of sample size and variable
measurement of previous studies. This study included 1572 jury eligible participants. It also
measured viewership of forensic crime television at the ratio level. Previous studies used
ambiguous scales. It specifically looks at the youngest generation of jurors. Knowledge gained
from this study may aid justice practitioners in the administration of justice.
Recommendations
As with most studies, there are limitations. The greatest limitation with this study is that
of generalizability. The geographic location of the participants, age range, and other
demographic characteristics limit the generalizability of the findings. Additionally, the types of
participants used, students versus community members, may affect generalizability. Selection
bias is also a factor, as a convenience sample was used. Some students within the population
never had an opportunity to participate. However, the large sample size helps to overcome some
of these limitations.
This study used a cross-sectional versus a longitudinal design, which is also a limitation.
This cross-sectional design did not allow the researcher to capture changes of willingness or
expectation over time. This study only captured the information at one point in time. It did not
track students throughout an academic career. Cost, time, and feasibility were considered.
A few recommendations can be made to overcome some of these limitations in future
research. This study could reasonably be replicated and include a more diverse community
population. The population for this study was rather homogeneous. There was little variance in
age, race, geographic location, or status (all were college students). It would be recommended to

81
replicate this study with community members in a less isolated urban environment and compare
results.
In regards to future CSI Effect research, the primary recommendation of the researcher is
to change the question. Previous literature focused on the expectation of forensic evidence being
presented at trial. While it may be interesting, this study suggests that expectation is not related
to a juror’s willingness to find a suspect guilty. Therefore, expectation of forensic evidence is
not consequential in the decision-making process. Research should focus on understanding what
affects a juror’s willingness to find a suspect guilty. Although this study finds that viewership of
forensic crime television does not affect their willingness, it does find that the type of crime, the
juror’s gender, and their education affects their willingness. These and other factors should be
further explored.

82
References
Alexander, A. & Hanson, J. (2013). Taking Sides: Clashing Views in Mass Media and Society. New York, NY: McGraw-Hill. Andreasen, A.R. (2002), Marketing social marketing in the social change marketplace. Journal of Public Policy and Marketing, 21(1), 3-13. Beauregard, E. & Bouchard, M. (2010). Cleaning up your act: Forensic awareness as a detection avoidance strategy. Journal of Criminal Justice, 38, 1160-1166. Berger, P. & Luckmann, T. (1991). The social construction of reality. London: Penguin Books. Bergslien, E. (2006). Teaching to avoid the “CSI effect”. Journal of Chemical Education, 83, 690-691. Bickerstaff, K. & Walker, G. (2003). The place(s) of matter: matter out of place – public understandings of air pollution. Progress in Human Geography, 27(1), 45-67. Bing, R. L. (2010). Race, Crime, and the Media. New York, NY: McGraw-Hill. Bornstein, B. H. (1999). The ecological validity of jury simulations: Is the jury still out? Law and Human Behavior, 23, 75–91. Brewer, P. (2010). Media use and public perceptions of DNA evidence. Science Communication, 32(1), 93-117. Brickell, W. (2008). Is it the CSI effect or do we just distrust juries? Criminal Justice, 23(10), 11-17. Catalani, R. (2006). A CSI writer on the CSI effect. Yale Law Journal Pocket Part, 115, 76-78. Cavender, G. & Deutsch, S. K. (2007). CSI and moral authority: The police and science. Crime, Media, Culture, 3(1), 67-81. Cole, S. A., & Dioso-Villa, R. (2007). CSI and its effects: Media, juries, and the burden of proof. New England Law Review, 41, 435-469. Cole, S. A., & Dioso-Villa, R. (2009). Investigating the "CSI effect" effect: Media and litigation crisis in criminal justice. Stanford Law Review, 61, 1335-1374.

83
Cooley, C. M. (2006). The CSI-effects: Its impact and potential concerns. New England Law Review, 41, 471-502. Davidson, D. J. & Frickel, D. S. (2004). Understanding Environmental Governance: A Critical Review. Organization and Environment, 17(4), 471-490. DeTardo-Bora, K. A. (2009). Criminal justice 'hollywood style': How women in criminal justice professions are depicted in prime-time crime dramas. Women Criminal Justice, 19(2), 153-168. Deutsch, S. K., & Cavender, G. (2008). Csi and forensic realism. The Journal of Criminal Justice and Popular Culture, 15(1), 34-53. Dowler, K. (2002). Media influence on citizen attitudes toward police effectiveness. Policing and Society, 12(3), 227-238. Dowler, K. (2007). Introduction to the special issue: Media criminology in the television world. Journal of Criminal Justice and Popular Culture, 14(3), 237-242. Duncan v. Louisiana, 391 U.S. 145 (1968). Edgerton, G. R. (2007). The Columbia History of American Television. New York, NY: Columbia University Press. Elliot, W. R., & Rosenberg, W. L. (1987). Media exposure and beliefs about science and technology. Communication Research, 14(2), 164-188. Farrell, A. & Givelber, D. (2010). Liberation Reconsidered: Understanding why judges and juries disagree about guilt. Journal or Criminal Law and Criminology, 100(4), 1549- 1586. Federal Bureau of Investigation. (2012). Crime in the United States, 2011. Retrieved from http://www.fbi.gov/about-us/cjis/ucr/crime-in-the-u.s/2011/crime-in-the-u.s.-2011. Feigenson, N. & Park, J. (2006). Emotions and Attributions of Legal Responsibility and Blame: A Research Review. Law and Human Behavior, 30, 143-161. Friedland, L. A. & McLeod, J. M. (1999). Community integration and mass media: A reconsideration. In D. Demers & K. Viswanath (Eds.), Mass media, social control, and social change: A macrosocial perspective (pp. 197–226). Ames: Iowa State University Press. Ghoshray, S. (2006). CSI and its effects: Circumstantial evidence, reasonable doubt, and jury manipulation. New England Law Review, 41, 533-562.

84
Hannigan, J. A. (1995). Environmental sociology: A constructionist perspective. New York: Routledge. Harrington, E. (2007). Nation, identity and the fascination with forensic science in Sherlock Holmes and CSI. International Journal of Cultural Studies, 10(3), 365-382. Harnick, C. (2012, June 14). Most-Watched TV Show In The World Is 'CSI: Crime Scene Investigation'. Huffington Post. Retrieved from http://www.huffingtonpost.com/2012/06/14/most-watched-tv-show-in-the-world- csi_n_1597968.html. Harriss, C. (2011). The Evidence Doesn’t Lie: Genre Litercy and the CSI Effect. Journal of Popular Film and Television, 39(1), 2-11. Haslanger, S. (1995). Ontology and Social Construction. Philosophical Topics, 23(2), 95-125. Heller, F. (2001). On the integration of the social sciences. Human Relations, 54(1), 49-56. Holmgren, J. A. & Fordham, J. (2011). CSI effect and the Canadian and the Australian jury. Journal of Forensic Sciences, 56(S1) 63-71. Hughes, T. & Magers, M. (2007). The perceived impact of crime scene investigation shows on the administration of justice. The Journal of Criminal Justice and Popular Culture, 14(3), 259-276. Jasanoff, S. (1996). Is Science Socially Constructed – And Can It Still Inform Public Policy? Science and Engineering Ethics, 2, 263-276. Jenkins, H. (2006). Fans, bloggers, and Gamers. New York, NY: NYU Press. Jones, R., and Bangert, A. (2006). The "CSI" effect: Changing the face of science. Science Scope, 30(3), 38-42. Kim, Y. S., Barak, G., & Shelton, D. E. (2009). Examining the "CSI-effect" in the cases of circumstantial evidence and eyewitness testimony: Multivariate and path analyses. Journal of Criminal Justice, 37(5), 452-460. Kovera, M. B. (2002). The effects of general pretrial publicity on juror decisions: An examination of moderators and mediating mechanisms. Law and Human Behavior, 26(1), 43-72. Kruse, C. (2010). Producing absolute truth: CSI science as wishful thinking. American Anthropologist, 112(1), 79-91. Lawson, T. F. (2009). Before the verdict and beyond the verdict: The CSI infection within modern criminal jury trials. Loyola University Chicago Law Journal, 41, 119-173.

85
Leshowitz, B. & Okun, M. (2011). Effects on an evidence-based text on skepticism, methodological reasoning, values and juror decision-making. Educational Psychology, 31(3), 319-337. Lieberman, J. D., Krauss, D. A., & Wiener, R. L. (2011). Preface to “When Does Sample Matter in Juror Decision-Making Research? Differences Between College Student and Representative Sample Jurors”. Behavioral Sciences and the Law, 29, 325-327. Machado, H. & Santos. F. (2011). Popular press and forensic genetics in Portugal: Expectations and disappointments regarding two cases of missing children. Public Understanding of Science, 20(3), 303-318. Mallon, R. (Winter 2008). Naturalistic Approaches to Social Construction. The Stanford Encyclopedia of Philosophy. Edward N. Zalta (ed.), Retrieved from: http://plato.stanford.edu/archives/win2008/entries/social-construction-naturalistic/. Mann, M. D. (2006). The ‘CSI-effect’: Better jurors through television and science? Buffalo Public Interest Law Journal, 24, 157-183. Manovich, L. & Durlak, J. (2002). The language of new media. Canadian Journal of Communication, 27(1), 101-104. McCabe, J. G., Krauss, D. A., & Lieberman, J. D. (2010). Reality Check: A Comparison of College Students and a Community Sample of Mock Jurors in a Simulated Sexual
Violent Predator Civil Commitment. Behavioral Sciences and the Law, 28, 730-750. Meadows, R. J. & Kuehnel, J. (2005). Evil Minds: Understanding and Responding to Violent Predators. Upper Saddle River, NJ: Pearson Prentice Hall. Mertens, J. (2006). Smoking gun: When real-life CSI and Hollywood collide. Law Enforcement Technology, 33(3), 52-61. Miller, M. K., Maskaly, J., Green, M., & Peoples, C. D. (2011). The effects of deliberations and religious identity on mock jurors’ verdicts. Group Process & Intergroup Relations, 14(4), 517-532. Mopas, M. (2007). Examining the CSI Effect through an ANT lens. Crime, Media, Culture, 3(1), 110-117. Muraskin, R. & Domash, S. F. (2007). Crime and the Media: Headlines versus Reality. Upper Saddle River, NJ: Pearson Prentice Hall. Podlas, K. (2002). Should we blame judge judy? the messages TV courtrooms send viewers. Judicature, 86(1), 38-43.

86
Podlas, K. (2006). CSI effect: Exposing the media myth. Fordham Intellectual Property, Media And Entertainment Law Journal, 16, 429-465. Raguragavan, G. & Hanley, N. (2009). Reality television (Suppernanny): a social marketing “place” strategy. Journal of Consumer Marketing, 26(5), 311-319. Reiner, R., Livingstone, S., Allen, J. (2003) From Law and Order to Lynch Mobs: Crime News Since the Second World War” In P. Mason, (ed) Criminal Visions: Media Representations of Crime and Justice, 13-32. Portland: Willan Publishing. Robbers, M. (2008). Blinded by science: The social construction of reality in forensic television shows and its effect on criminal jury trials. Criminal Justice Policy Review, 19(1), 84- 102. Schweitzer, N. J., & Saks, M. J. (2007). The ‘CSI-effect’: Popular fiction about forensic
science affects the public's expectations about real forensic science. Jurimetrics, 47, 357- 364.
Shelton, D., Kim, Y. S., & Barak, G. (2006). Study of juror expectations and demands concerning scientific evidence: Does the "CSI effect" exist? Vanderbilt Journal of Entertainment and Technical Law, 9(2), 331-368. Shelton, D. (2008). 'CSI effect': Does it really exist? NIJ Journal, 259, 1-7. Smallwood, S. (2002). As Seen on TV: CSI and The X-Files Help Build Forensics Programs.
Chronicle of Higher Education, 48(45), 1-4. Stevens, D. (2008). Forensic science, wrongful convictions, and American prosecutor discretion. Howard Journal of Criminal Justice, 47(1), 31-51. Surette, R. (2011). Media, Crime, and Criminal Justice: Images, Realities, and Policies (4th). Belmont, CA: Wadsworth. Surette, R. & Otto, C. (2002). A test of a crime and justice infotainment measure. Journal of Criminal Justice, 30, 443-453. Schwandt, T. A. (2003). Three epistemological stances for qualitative inquiry: Interpretativism, hermeneutics and social constructionism. In N. K Denzin & Y. S. Lincoln (Eds.), The landscape of qualitative research: Theories and issues (pp. 292-331). Thousand Oaks, CA: Sage. Thomas, A. P. (2006). The CSI-effect: Fact or fiction. Yale Law Journal Pocket Part, 115, 70- 72. Tyler, T. (2006). Viewing CSI and the threshold of guilt: Managing truth and justice in reality and fiction. The Yale Law Journal, 115(5), 1050-1085.

87
Weaver, D. H. & Vilhoit, G. C. (1991). The American Journalist: A Portrait of U.S. News People and the Their Work. United States of America: Indiana University Press. Wells, G. L. & Olson, E. A. (2003). Eyewitness Testimony. Annual Review of Psychology, 54, 277-295. Wilson, F. & Tagg, S. (2010). Social constructionism and personal constructivism, getting the business owner’s view on the role of sex and gender. International Journal of Gender and Entrepreneurship, 2(1), 68-82. Wu, Y. (2010). College students' evaluation of police performance: A comparison of Chinese and Americans. Journal of Criminal Justice, 38(4), 773-780.

88
Appendix A: Survey
Please read the entire scenario, including the statements at the bottom. Then complete the 13 questions on the back.
During the afternoon of Friday, January 4th, Ms. Smith was home alone in her house. Her stand alone, two-story house is in a relatively quiet, suburban neighborhood. Around 1 p.m. she walked outside to go to her car. As she walked towards her car, an unknown male ran up to her and struck her in the head with a brick. She yelled for help. The man dropped the brick and ran away. Ms. Smith immediately called the police and told them somebody had just assaulted her and that she was hurt. She described the unknown person as a white male, wearing jeans and a grey sweatshirt. Approximately ten minutes later, Officer Taylor, who was responding to the call for service, spotted a person walking out of Ms. Smith’s neighborhood matching the same description. They were approximately a half-mile from her house. Officer Taylor stopped and detained the man who was identified as Richard Flowers. Mr. Flowers was wearing jeans, boots, and a grey hooded sweatshirt. He was 32 years old. When Officer Taylor asked Mr. Flowers what he was doing in the neighborhood, Flowers stated, “I’m just walking around. I live in the next neighborhood over.” Mr. Flowers’ identification showed that he did live in the area. Not being positive that he may have caught the attacker, Officer Taylor, with the assistance of another officer, brought Ms. Smith to where Mr. Flowers was being detained at the entrance to her neighborhood. Once she arrived, Officer Taylor asked if she recognized Mr. Flowers. Ms. Smith immediately said, “Yes, that is the guy that hit me.” With this identification, Mr. Flowers was arrested for assault. As you answer the following questions, please keep these things in mind: 1) Assault is the crime of unlawfully touching another, which may result in harm. 2) Guilt in the American criminal justice system is defined as “proof beyond a reasonable doubt” not “proof beyond all doubt”. 3) Pretend you are a juror and have just been presented this case by the prosecutor. Assume the victim and Officer Taylor testified exactly to what was stated above.

89
Version V-1
Please fill in only one answer per question.
1) After reading this scenario, how willing are you to find the suspect guilty?Not at all willing Not too willing Somewhat willing Very willing
2) After reading this scenario, would you expect forensic evidence to be presented? Forensic evidence is any scientific or physical evidence that is presented at trial to helpdetermine the true facts of the case.
Definitely would not Probably would not Probably would Definitely would
3) On average, how many hours of forensic crime related television do you watch in a week? (Examples of forensic crime related television shows include: CSI, NCIS, First 48, Forensic Files, Law and Order, etc.) __________ hours
4) Have you ever served as a juror? Yes No
5) Are you eligible to serve on a jury? (To be jury eligible, you must be a U.S. citizen, be 18 years of age or older, never have been convicted of a felony, and able to understand English.)
Yes No
6) How old are you? ________ years of age
7) What is your gender? Male Female
8) Please indicate which category best identifies your race or ethnicity? White Black Hispanic Asian American Indian Bi/Multi Racial Other
9) Have you ever been charged with a criminal offense? (Only include misdemeanor and felony offenses. Do not include minor traffic infractions.)
Yes No
10) What is your class rank?Freshman Sophomore Junior Senior
11) Are you a public justice or criminal justice major? Yes No
12) How many public justice, criminal justice, or law related courses have you completed? 0 1 2 3 4 5 or more
13) When considering political affiliation, how would you classify yourself? Conservative Lean Conservative Moderate Lean Liberal Liberal

90
Please read the entire scenario, including the statements at the bottom. Then complete the 13 questions on the back.
During the afternoon of Friday, January 4th, Ms. Smith was home alone in her house. Her stand alone, two-story house is in a relatively quiet, suburban neighborhood. Around 1 p.m. she heard a knock at her front door. She decided not to answer the door as she was not expecting company and assumed it was a solicitor. A couple minutes later, she heard a knock at her back door followed by a large bang, as if somebody had kicked in the back door. She ran downstairs and saw an unknown male in her kitchen with her purse in his hand. She yelled for him to leave the house and that she was calling the police. The man dropped the purse and ran away out the same back door. Ms. Smith immediately called the police and told them somebody had just broken into her house. She described the unknown person as a white male, wearing jeans, and a grey sweatshirt. Approximately ten minutes later, Officer Taylor, who was responding to the call for service, spotted a person walking out of Ms. Smith’s neighborhood matching the same description. They were approximately a half-mile from her house. Officer Taylor stopped and detained the man who was identified as Richard Flowers. Mr. Flowers was wearing jeans, boots, and a grey hooded sweatshirt. He was 32 years old. When Officer Taylor asked Mr. Flowers what he was doing in the neighborhood, Flowers stated, “I’m just walking around. I live in the next neighborhood over.” Mr. Flowers’ identification showed that he did live in the area. Not being positive that he may have caught the burglar, Officer Taylor, with the assistance of another officer, brought Ms. Smith to where Mr. Flowers was being detained at the entrance to her neighborhood. Once she arrived, Officer Taylor asked if she recognized Mr. Flowers. Ms. Smith immediately said, “Yes, that is the guy that broke into my house.” With this identification, Mr. Flowers was arrested for burglary. As you answer the following questions, please keep these things in mind: 1) Burglary is the crime of breaking and entering another person’s house with the intent to steal something. 2) Guilt in the American criminal justice system is defined as “proof beyond a reasonable doubt” not “proof beyond all doubt”. 3) Pretend you are a juror and have just been presented this case by the prosecutor. Assume the victim and Officer Taylor testified exactly to what was stated above.

91
Version NV-0
Please fill in only one answer per question.
1) After reading this scenario, how willing are you to find the suspect guilty?Not at all willing Not too willing Somewhat willing Very willing
2) After reading this scenario, would you expect forensic evidence to be presented? Forensic evidence is any scientific or physical evidence that is presented at trial to helpdetermine the true facts of the case.
Definitely would not Probably would not Probably would Definitely would
3) On average, how many hours of forensic crime related television do you watch in a week? (Examples of forensic crime related television shows include: CSI, NCIS, First 48, Forensic Files, Law and Order, etc.) __________ hours
4) Have you ever served as a juror? Yes No
5) Are you eligible to serve on a jury? (To be jury eligible, you must be a U.S. citizen, be 18 years of age or older, never have been convicted of a felony, and able to understand English.)
Yes No
6) How old are you? ________ years of age
7) What is your gender? Male Female
8) Please indicate which category best identifies your race or ethnicity? White Black Hispanic Asian American Indian Bi/Multi Racial Other
9) Have you ever been charged with a criminal offense? (Only include misdemeanor and felony offenses. Do not include minor traffic infractions.)
Yes No
10) What is your class rank?Freshman Sophomore Junior Senior
11) Are you a public justice or criminal justice major? Yes No
12) How many public justice, criminal justice, or law related courses have you completed? 0 1 2 3 4 5 or more
13) When considering political affiliation, how would you classify yourself? Conservative Lean Conservative Moderate Lean Liberal Liberal
92
Appendix B: Informed Consent
Version(1:(2,25,2013( 1(
Informed Consent: Researcher Copy (Please turn this back in.)
The study in which you are about to participate in investigates students’ perceptions of criminal cases. The purpose of the research is to examine student perceptions. The experiment is being conducted by Professor Christopher Kopacki.
The study involves an assembly of results from a questionnaire that you, as the participant, will be asked to fill out and return to the experimenter. There are no risks or hazards involved.
The questionnaire should take no longer than 10 minutes to complete. Each person’s data in this study will be kept entirely confidential. Your name will not be reported, nor asked for in the questionnaire. The only demographic information that will be reported in the study will be your gender and your ethnicity. Any other data reported will result from the answers you submit in the questionnaire. All results will be reported in the aggregate.
You will not directly benefit from this experiment; however, this study will help others understand student perceptions - on campus.
Your participation is voluntary, and you are free to discontinue participation at any point of the research. You may also decline to answer any or all of the questions in the questionnaire for any reason.
If you have any questions, please contact Professor Christopher Kopacki. If you have any questions about your rights as a research participant, please contact Dr. Friedman, Chair of the Human Subjects Committee, at (315)-312-6381.
I have read the above statement about the purpose and nature of the study, and I freely consent to participate.
Participant’s signature Date
This consent form will be kept by the researcher for at least three years beyond the end of the study and was approved by the IRB on 2/25/2013 at SUNY-Oswego.
(

93
Appendix C: SPSS Frequencies Outputs
Question)1:)Willingness
Frequency Percent Valid)Percent Cumulative)PercentNot)at)all)willing 61 3.9 3.9 3.9Not)too)willing 371 23.6 23.6 27.5Somewhat)willing 906 57.6 57.6 85.1Very)Willing 234 14.9 14.9 100
Total 1572 100 100
Question)2:)Expectation
Frequency Percent Valid)Percent Cumulative)PercentDefinitely)would)not 34 2.2 2.2 2.2Probably)would)not 324 20.6 20.6 22.8Probably)would 610 38.8 38.8 61.6Definitely)would 604 38.4 38.4 100
Total 1572 100 100
Question)3:)Viewership)(Categories)
Number)of)Hours Frequency Percent Valid)Percent Cumulative)Percent
0)(None) 552 35.1 35.1 35.1
1H3)(Minimal) 611 38.9 38.9 74
4H6)(Moderate) 252 16 16 90
7)or)more)(Heavy) 157 10 10 100
Total 1572 100 100

94
Question)3:)Viewership
Number)of)Hours Frequency Percent Valid)Percent Cumulative)Percent0 552 35.1 35.1 35.1
0.25 1 0.1 0.1 35.20.26 1 0.1 0.1 35.20.5 38 2.4 2.4 37.71 198 12.6 12.6 50.31.5 39 2.5 2.5 52.72 216 13.7 13.7 66.52.5 14 0.9 0.9 67.43 104 6.6 6.6 743.5 7 0.4 0.4 74.44 116 7.4 7.4 81.84.5 7 0.4 0.4 82.35 79 5 5 87.35.5 1 0.1 0.1 87.36 42 2.7 2.7 906.5 1 0.1 0.1 90.17 17 1.1 1.1 91.27.5 3 0.2 0.2 91.38 23 1.5 1.5 92.89 9 0.6 0.6 93.410 47 3 3 96.411 1 0.1 0.1 96.412 11 0.7 0.7 97.112.5 1 0.1 0.1 97.214 3 0.2 0.2 97.415 12 0.8 0.8 98.216 1 0.1 0.1 98.217 1 0.1 0.1 98.318 3 0.2 0.2 98.520 11 0.7 0.7 99.224 4 0.3 0.3 99.425 2 0.1 0.1 99.628 1 0.1 0.1 99.630 1 0.1 0.1 99.748 2 0.1 0.1 99.8100 2 0.1 0.1 99.9120 1 0.1 0.1 100
Total 1572 100 100

95
Question)4:)Served)as)Juror)Previously
Frequency Percent Valid)Percent Cumulative)PercentNo)<)0 1533 97.5 98.1 98.1Yes)<)1 29 1.8 1.9 100Total 1562 99.4 100
System)Missing 10 0.6Total 1572 100
Question)5:)Juror)Eligible?)))))(Before)Removing)Cases)
Frequency Percent Valid)Percent Cumulative)Percent
No)D)0 65 3.9 3.9 3.9
Yes)D)1 1583 95.8 96.1 100
Total 1648 99.8 100
System)Missing 4 0.2
Total 1652 100

96
Question)6:)Age
Age Frequency Percent Valid)Percent Cumulative)Percent18 279 17.7 17.8 17.819 393 25 25 42.820 365 23.2 23.2 66.121 275 17.5 17.5 83.622 141 9 9 92.523 58 3.7 3.7 96.224 13 0.8 0.8 97.125 6 0.4 0.4 97.526 5 0.3 0.3 97.827 5 0.3 0.3 98.128 4 0.3 0.3 98.329 2 0.1 0.1 98.530 1 0.1 0.1 98.531 2 0.1 0.1 98.732 2 0.1 0.1 98.835 1 0.1 0.1 98.936 3 0.2 0.2 9938 1 0.1 0.1 99.139 3 0.2 0.2 99.340 1 0.1 0.1 99.443 1 0.1 0.1 99.446 1 0.1 0.1 99.548 1 0.1 0.1 99.649 3 0.2 0.2 99.751 1 0.1 0.1 99.852 1 0.1 0.1 99.954 1 0.1 0.1 99.961 1 0.1 0.1 100
Total 1570 99.9 100System)Missing 2 0.1
Total 1572 100

97
Question)7:)Gender
Frequency Percent Valid)Percent Cumulative)PercentFemale 804 51.1 51.2 51.2Male 767 48.8 48.8 100Total 1571 99.9 100
System)Missing 1 0.1Total 1572 100
Question)8:)Race
Frequency Percent Valid)Percent Cumulative)PercentWhite 1320 84 84.1 84.1Black 60 3.8 3.8 88Hispanic 99 6.3 6.3 94.3Asian 22 1.4 1.4 95.7American)Indian 5 0.3 0.3 96Bi/Multi)Racial 52 3.3 3.3 99.3Other 11 0.7 0.7 100Total 1569 99.8 100System)Missing 3 0.2
Total 1572 100
Question)9:)Previously)Charged)with)a)Crime?
Frequency Percent Valid)Percent Cumulative)PercentNo 1471 93.6 94 94Yes 94 6 6 100Total 1565 99.6 100System)Missing 7 0.4
Total 1572 100

98
Question)10:)ClassRank
Frequency Percent Valid)Percent Cumulative)PercentFreshman 442 28.1 28.2 28.2Sophomore 391 24.9 24.9 53.1Junior 406 25.8 25.9 78.9Senior 331 21.1 21.1 100Total 1570 99.9 100System)Missing 2 0.1
Total 1572 100
Question)11:)Justice)Major?
Frequency Percent Valid)Percent Cumulative)PercentNo 1342 85.4 85.8 85.8Yes 223 14.2 14.2 100Total 1565 99.6 100System)Missing 7 0.4
Total 1572 100
Question)12:)Number)of)Justice)Classes)Completed
Number)of)Classes Frequency Percent Valid)Percent Cumulative)Percent0 927 59 59 591 313 19.9 19.9 78.92 111 7.1 7.1 863 54 3.4 3.4 89.44 30 1.9 1.9 91.3
5)or)more 136 8.7 8.7 100Total 1571 99.9 100
System)Missing 1 0.1Total 1572 100
Question)14:)Scenario
Frequency Percent Valid)Percent Cumulative)PercentNon<Violent 787 50.1 50.1 50.1Violent 785 49.9 49.9 100
Total 1572 100 100

99
Appendix D: SPSS Descriptives Output
Descriptive Statistics
Question Variable N Minimum Maximum Mean Std. Deviation1 Willingness 1572 1 4 2.84 0.7162 Expectation 1572 1 4 3.13 0.8123 Viewership 1572 0 120 2.8085 6.109614 Juror 1562 0 1 0.02 0.1355 JurorEligible 1572 1 1 1 06 Age 1570 18 61 20.31 3.2617 Gender 1571 0 1 0.49 0.58 Race 1569 1 7 1.43 1.1699 Charged 1565 0 1 0.06 0.238
10 ClassRank 1570 1 4 2.4 1.10711 JusticeMajor 1565 0 1 0.14 0.3512 CJ_Classes 1571 0 5 0.95 1.534
Scenario 1572 0 1 0.5 0.5Valid N (listwise) 1540

100
Appendix E: SPSS Logistic Regression Output (Preliminary Model)
N PercentIncluded in Analysis
1540 98
Missing Cases 32 2Total 1572 100
0 01572 100
Original Value
Internal Value
Not Willing 0Willing 1
Block 0: Beginning Block
Not Willing WillingNot Willing 0 421 0Willing 0 1119 100
72.7
B S.E. Wald df Sig. Exp(B)Step 0 Constant 0.978 0.057 292.332 1 0 2.658
Case Processing SummaryUnweighted Casesa
Selected Cases
Totala. If weight is in effect, see classification table for the total number of cases.
Dependent Variable Encoding
Classification Tablea,b
ObservedPredicted
WillingBinary Percentage Correct
Step 0WillingBinary
Overall Percentagea. Constant is included in the model.b. The cut value is .500
Variables in the Equation
Unselected Cases

101
Score df Sig.Viewership 2.71 1 0.1Juror 5.233 1 0.022Age 6.823 1 0.009Gender 8.337 1 0.004RaceBinary 1.687 1 0.194Charged 1.399 1 0.237ClassRank 6.177 1 0.013JusticeMajor 4.211 1 0.04CJ_Classes 10.555 1 0.001Scenario 12.604 1 0
43.099 10 0
Block 1: Method = Enter
Chi-square df Sig.Step 42.345 10 0Block 42.345 10 0Model 42.345 10 0
Step -2 Log likelihood
Cox & Snell R Square
Nagelkerke R Square
1 1764.348a 0.027 0.039
Not Willing WillingNot Willing 9 412 2.1Willing 7 1112 99.4
72.8
Variables not in the Equation
Step 0Variables
Overall Statistics
Omnibus Tests of Model Coefficients
Step 1
Model Summary
a. Estimation terminated at iteration number 4 because parameter estimates changed by less than .001.
Classification Tablea
ObservedPredicted
WillingBinary Percentage Correct
Step 1WillingBinary
Overall Percentagea. The cut value is .500

102
B S.E. Wald df Sig. Exp(B)Viewership -0.016 0.009 3.002 1 0.083 0.985Juror -0.539 0.407 1.752 1 0.186 0.583Age -0.02 0.019 1.138 1 0.286 0.98Gender -0.331 0.118 7.855 1 0.005 0.718RaceBinary 0.225 0.155 2.101 1 0.147 1.252Charged 0.41 0.265 2.39 1 0.122 1.507ClassRank -0.058 0.064 0.813 1 0.367 0.944JusticeMajor 0.018 0.238 0.006 1 0.939 1.018CJ_Classes -0.079 0.058 1.853 1 0.173 0.924Scenario -0.391 0.117 11.181 1 0.001 0.677Constant 1.83 0.387 22.339 1 0 6.236
Variables in the Equation
Step 1a
a. Variable(s) entered on step 1: Viewership, Juror, Age, Gender, RaceBinary, Charged, ClassRank, JusticeMajor, CJ_Classes, Scenario.
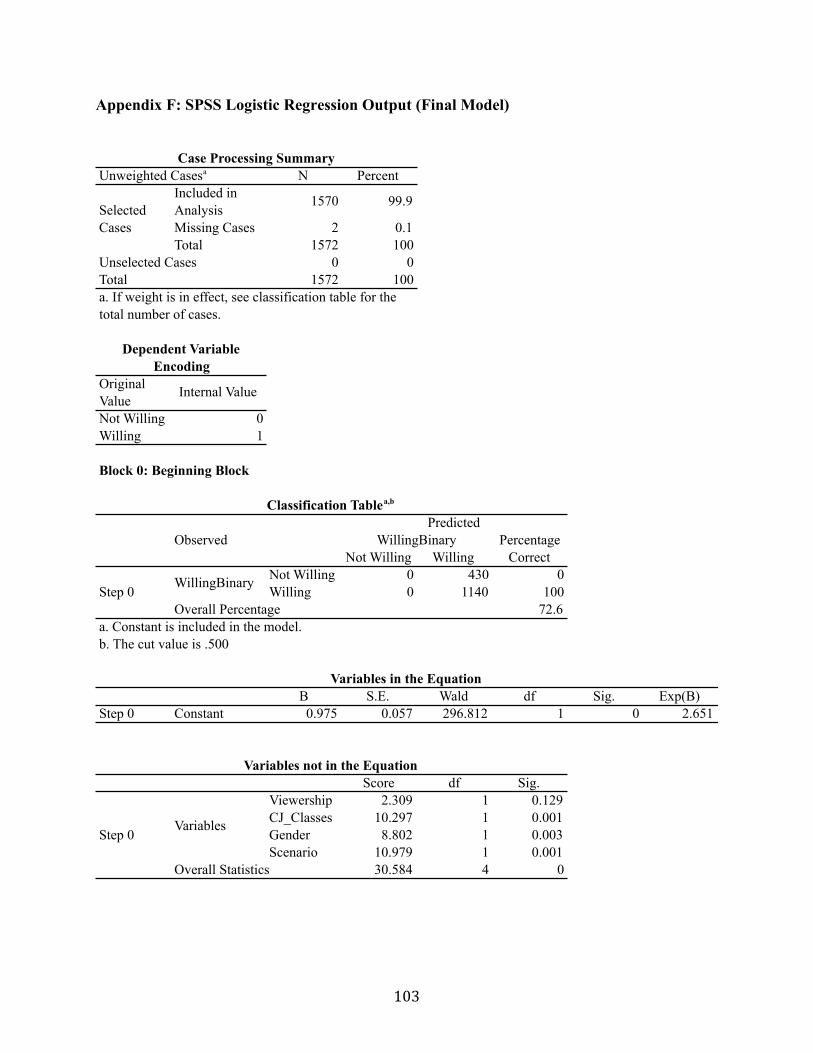
103
Appendix F: SPSS Logistic Regression Output (Final Model)
N PercentIncluded in Analysis
1570 99.9
Missing Cases 2 0.1Total 1572 100
0 01572 100
Original Value
Internal Value
Not Willing 0Willing 1
Block 0: Beginning Block
Not Willing WillingNot Willing 0 430 0Willing 0 1140 100
72.6
B S.E. Wald df Sig. Exp(B)Step 0 Constant 0.975 0.057 296.812 1 0 2.651
Score df Sig.Viewership 2.309 1 0.129CJ_Classes 10.297 1 0.001Gender 8.802 1 0.003Scenario 10.979 1 0.001
30.584 4 0
Variables not in the Equation
Step 0Variables
Overall Statistics
Step 0WillingBinary
Overall Percentagea. Constant is included in the model.b. The cut value is .500
Variables in the Equation
Dependent Variable Encoding
Classification Tablea,b
ObservedPredicted
WillingBinary Percentage Correct
Case Processing SummaryUnweighted Casesa
Selected Cases
Unselected CasesTotala. If weight is in effect, see classification table for the total number of cases.

104
Block 1: Method = Enter
Chi-square df Sig.Step 30.255 4 0Block 30.255 4 0Model 30.255 4 0
Step-2 Log
likelihoodCox & Snell
R SquareNagelkerke R Square
1 1813.192a 0.019 0.028
Hosmer and Lemeshow TestStep Chi-square df Sig.
1 10.941 8 0.205
Not Willing WillingNot Willing 2 428 0.5Willing 1 1139 99.9
72.7
B S.E. Wald df Sig. Exp(B)Viewership -0.014 0.009 2.551 1 0.11 0.986CJ_Classes -0.101 0.036 8.082 1 0.004 0.904Gender -0.321 0.115 7.749 1 0.005 0.725Scenario -0.369 0.115 10.323 1 0.001 0.692Constant 1.473 0.113 170.267 1 0 4.362
Classification Tablea
Omnibus Tests of Model Coefficients
Step 1
Model Summary
a. Estimation terminated at iteration number 4 because parameter estimates changed by less than .001.
ObservedPredicted
WillingBinary Percentage Correct
Step 1WillingBinary
Overall Percentagea. The cut value is .500
Variables in the Equation
Step 1a
a. Variable(s) entered on step 1: Viewership, CJ_Classes, Gender, Scenario.

105
Appendix G: Bivariate Analysis Outputs
Willingness(*(Viewership
CrosstabulationViewership
Hours 0 0.25 0.26 0.5 1 1.5 2 2.5 3 3.5Willingness Not(Willing 142 1 0 9 54 11 60 3 30 2
Willing 410 0 1 29 144 28 156 11 74 5Total 552 1 1 38 198 39 216 14 104 7
Hours 4 4.5 5 5.5 6 6.5 7 7.5 8 9Wilingness Not(Willing 33 3 19 1 19 0 4 2 8 4
Willing 83 4 60 0 23 1 13 1 15 5Total 116 7 79 1 42 1 17 3 23 9
Hours 10 11 12 12.5 14 15 16 17 18 20Willingness Not(Willing 13 0 3 0 0 2 0 0 0 4
Willing 34 1 8 1 3 10 1 1 3 7Total 47 1 11 1 3 12 1 1 3 11
Hours 24 25 28 30 48 100 120 TotalWillingness Not(Willing 2 0 1 0 0 1 1 432
Willing 2 2 0 1 2 1 0 1140Total 4 2 1 1 2 2 1 1572
Chi$Square+TestsValue df Asymp.+Sig.+(2$sided)
Pearson+Chi$Square 33.533a 36 0.586Likelihood+Ratio 36.566 36 0.442Linear$by$Linear+Association 2.229 1 0.135N+of+Valid+Cases 1572a+44+cells+(59.5%)+have+expected+count+less+than+5.+The+minimum+expected+count+is+.27.

106
Willingness(*(Juror
CrosstabulationPreviously(a(Juror
No Yes TotalWillingness Not(Willing 416 14 430
Willing 1117 15 1132Total 1533 29 1562
Chi$Square+TestsValue df Asymp.+Sig.+(2$sided)
Pearson+Chi$Square 6.375a 1 0.012Continuity+Correction+b 5.36 1 0.021Likelihood+Ratio 5.728 1 0.017Linear$by$Linear+Association 6.371 1 0.012N+of+Valid+Cases 1562a+0+cells+(0.0%)+have+expected+count+less+than+5.+The+minimum+expected+count+is+7.98.b+Computed+only+for+a+2x2+table
Willingness(*(Age
Crosstabulation
Age 18 19 20 21 22 23 24 25 26 27Willingness Not(Willing 73 100 98 81 38 17 4 4 2 0
Willing 206 293 267 194 103 41 9 2 3 5Total 279 393 365 275 141 58 13 6 5 5
Age 28 29 30 31 32 35 36 38 39 40Willingness Not(Willing 1 1 0 0 2 1 2 1 2 1
Willing 3 1 1 2 0 0 1 0 1 0Total 4 2 1 2 2 1 3 1 3 1
Age 43 46 48 49 51 52 54 61 TotalWillingness Not(Willing 1 0 1 0 0 1 1 0 432
Willing 0 1 0 3 1 0 0 1 1138Total 1 1 1 3 1 1 1 1 1570
Chi$Square+Tests
Value df Asymp.+Sig.+(2$sided)
Pearson+Chi$Square 41.040a 27 0.041
Likelihood+Ratio 42.901 27 0.027
Linear$by$Linear+Association 7.249 1 0.007
N+of+Valid+Cases 1570
a+43+cells+(76.8%)+have+expected+count+less+than+5.+The+minimum+expected+count+is+.28.

107
Willingness(*(Gender
CrosstabulationGenderFemale Male Total
Willingness Not(Willing 194 237 431Willing 610 530 1140
Total 804 767 1571
Chi$Square+TestsValue df Asymp.+Sig.+(2$sided)
Pearson+Chi$Square 9.038a 1 0.003Continuity+Correction+b 8.701 1 0.003Likelihood+Ratio 9.044 1 0.003Linear$by$Linear+Association 9.032 1 0.003N+of+Valid+Cases 1571a+0+cells+(0.0%)+have+expected+count+less+than+5.+The+minimum+expected+count+is+210.42.b+Computed+only+for+a+2x2+table
Willingness(*(Race((Binary)
CrosstabulationRaceBinaryNon8White White Total
Willingness Not(Willing 75 357 432Willing 174 963 1137
Total 249 1320 1569
Chi$Square+TestsValue df Asymp.+Sig.+(2$sided)
Pearson+Chi$Square .993a 1 0.319Continuity+Correction+b 0.845 1 0.358Likelihood+Ratio 0.978 1 0.323Linear$by$Linear+Association 0.992 1 0.319N+of+Valid+Cases 1569a+0+cells+(0.0%)+have+expected+count+less+than+5.+The+minimum+expected+count+is+68.56.b+Computed+only+for+a+2x2+table

108
Willingness(*(Charged
CrosstabulationCharged
No Yes TotalWillingness Not(Willing 408 20 428
Willing 1063 74 1137Total 1471 94 1565
Chi$Square+TestsValue df Asymp.+Sig.+(2$sided)
Pearson+Chi$Square 1.856a 1 0.173Continuity+Correction+b 1.545 1 0.214Likelihood+Ratio 1.948 1 0.163Linear$by$Linear+Association 1.854 1 0.173N+of+Valid+Cases 1565a+0+cells+(0.0%)+have+expected+count+less+than+5.+The+minimum+expected+count+is+25.71.b+Computed+only+for+a+2x2+table
Willingness(*(ClassRank
CrosstabulationClassRankFreshman Sophomore Junior Senior Total
Willingness Not(Willing 105 115 100 111 431Willing 337 276 306 220 1139
Total 442 391 406 331 1570
Chi$Square+TestsValue df Asymp.+Sig.+(2$sided)
Pearson+Chi$Square 11.558a 3 0.009Likelihood+Ratio 11.429 3 0.01Linear$by$Linear+Association 5.321 1 0.021N+of+Valid+Cases 1570a+0+cells+(0.0%)+have+expected+count+less+than+5.+The+minimum+expected+count+is+90.87.

109
Willingness(*(JusticeMajor
CrosstabulationJusticeMajor
No Yes TotalWillingness Not(Willing 357 73 430
Willing 985 150 1135Total 1342 223 1565
Chi$Square+TestsValue df Asymp.+Sig.+(2$sided)
Pearson+Chi$Square 3.610a 1 0.057Continuity+Correction+b 3.309 1 0.069Likelihood+Ratio 3.504 1 0.061Linear$by$Linear+Association 3.608 1 0.058N+of+Valid+Cases 1565a+0+cells+(0.0%)+have+expected+count+less+than+5.+The+minimum+expected+count+is+61.27.b+Computed+only+for+a+2x2+table
Willingness(*(Number(of(CJ_Classes
Crosstabulation#(of(CJ_Classes
0 1 2 3 4 5(or(more TotalWillingness Not(Willing 241 79 30 16 15 50 431
Willing 686 234 81 38 15 86 1140Total 927 313 111 54 30 136 1571
Chi$Square+TestsValue df Asymp.+Sig.+(2$sided)
Pearson+Chi$Square 15.479a 5 0.009Likelihood+Ratio 14.315 5 0.014Linear$by$Linear+Association 10.114 1 0.001N+of+Valid+Cases 1571a+0+cells+(0.0%)+have+expected+count+less+than+5.+The+minimum+expected+count+is+8.23.

110
Willingness(*(Scenario
CrosstabulationScenarioNon4Violent Violent Total
Willingness Not(Willing 187 245 432Willing 600 540 1140
Total 787 785 1572
Chi$Square+TestsValue df Asymp.+Sig.+(2$sided)
Pearson+Chi$Square 10.942a 1 0.001Continuity+Correction+b 10.572 1 0.001Likelihood+Ratio 10.967 1 0.001Linear$by$Linear+Association 10.935 1 0.001N+of+Valid+Cases 1572a+0+cells+(0.0%)+have+expected+count+less+than+5.+The+minimum+expected+count+is+215.73.b+Computed+only+for+a+2x2+table

111
Appendix H: SUNY IRB Approval

112
ACCEPTANCE OF REVIEW BY PRINCIPAL INVESTIGATOR TO: David Bozak, Co-Chair, Oswego State University Human Subjects Committee, c/o Psychology Department, 414 Mahar Hall FROM: Principal Investigator (PI): ___________________________________________________________________ RE: Research involving human participants entitled ___________________________________________________________________ ___________________________________________________________________ I read the attached review and agree to follow its recommendations. Yes ______________ No __________________ I wish to make the following modifications for the review panel’s further consideration: I agree to notify the chair of the Human Subjects Committee of any additions or changes in the procedure not covered by the initial review or any other unanticipated problems, which potentially involve risks to participants or others. P. I. Signature: ___________________________________ Print Name: _____________________________________ Date: ____________ 08.19.09

113
Appendix I: VCU IRB Approval
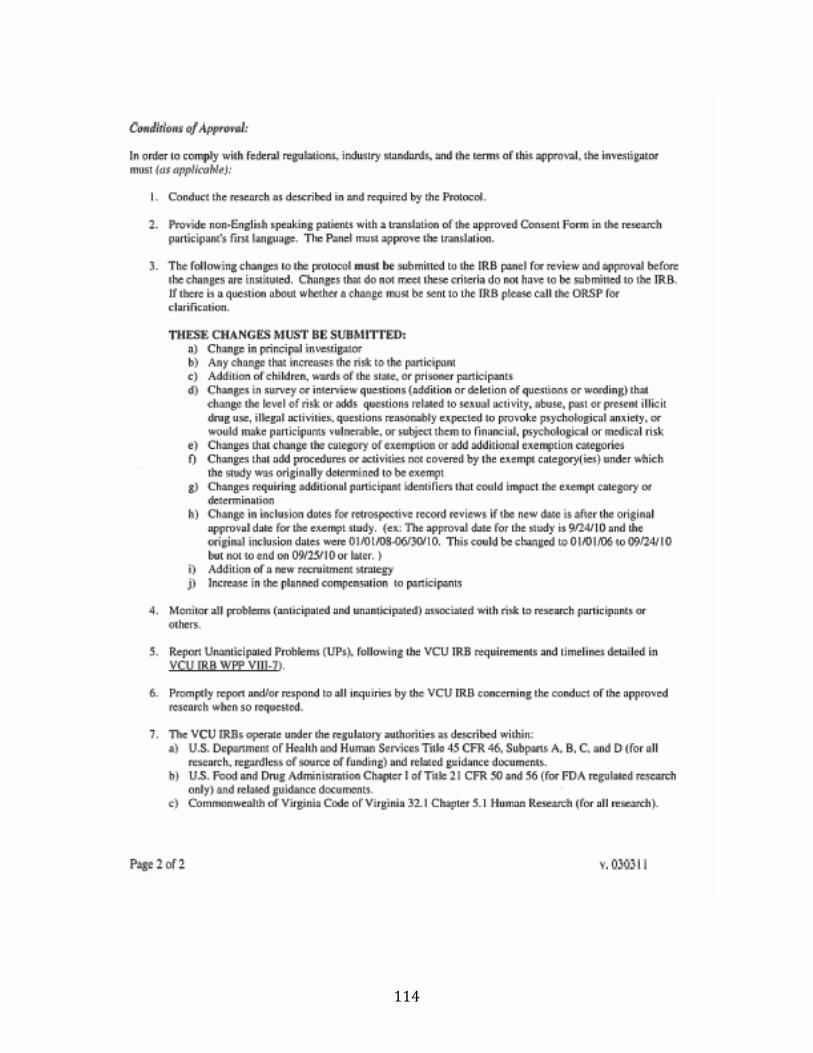
114