Examining Perceptions of Success During the Implementation of an Instructional Policy

University of Massachusetts Amherst University of Massachusetts Amherst
ScholarWorks@UMass Amherst ScholarWorks@UMass Amherst
Open Access Dissertations
9-2012
Examining Perceptions of Practices and the Roles of Special Examining Perceptions of Practices and the Roles of Special
Education Leaders through the Distributed Leadership Lens Education Leaders through the Distributed Leadership Lens
Patrick Ryan Tudryn University of Massachusetts Amherst
Follow this and additional works at: https://scholarworks.umass.edu/open_access_dissertations
Part of the Education Commons
Recommended Citation Recommended Citation Tudryn, Patrick Ryan, "Examining Perceptions of Practices and the Roles of Special Education Leaders through the Distributed Leadership Lens" (2012). Open Access Dissertations. 671. https://scholarworks.umass.edu/open_access_dissertations/671
This Open Access Dissertation is brought to you for free and open access by ScholarWorks@UMass Amherst. It has been accepted for inclusion in Open Access Dissertations by an authorized administrator of ScholarWorks@UMass Amherst. For more information, please contact [email protected].
Examining Perceptions of Practices and the Roles of Special Education Leaders through
the Distributed Leadership Lens
A Dissertation Presented
by
Patrick R. Tudryn
Submitted to the Graduate School of the
University of Massachusetts Amherst in partial fulfillment
Of the requirements for the degree of
Doctor of Education
September 2012
Education Policy, Research Policy and Administration

© Copyright by Patrick R. Tudryn 2012
All Rights Reserved

EXAMINING PERCEPTIONS OF PRACTICES AND THE ROLES OF SPECIAL
EDUCATION LEADERS THROUGH THE DISTRIBUTED LEADERSHIP LENS
A Dissertation Presented
by
PATRICK R. TUDRYN
Approved as to style and content by:
_________________________________________
Mary Lynn Boscardin, Chair
_________________________________________
Robert Marx, Member
_________________________________________
Craig Wells, Member
_________________________________________
Christine B. McCormick, Dean
School of Education

DEDICATION
This dissertation is dedicated to my mother, my last father, and my two sisters. I thank
my sisters, Sarah and Annie, for their unconditional love and support which helped me to
finish this important work through difficult personal times. I thank my mom, Margaret,
for instilling the confidence in me with her constant encouragement of words (aka
“nagging”) that I could achieve anything. I thank my deceased father, Tony, for never
allowing me to take the easy way out, and teaching me through hard work and
perseverance that great things can be accomplished. Most importantly, I appreciate the
upbringing I received from both parents. Without my mother or father, I could have
never overcome the reading and speech and language challenges displayed during my
primary years, and access the level of education needed to complete this dissertation. I
especially thank them for not enabling me during those years, but motivating me to
accomplish more with their support and encouragement.

v
ACKNOWLEDGEMENT
It is with great pleasure I acknowledge and thank my advisor, Dr. Mary Lynn
Boscardin, for the individual time and effort she committed not only in assisting me
through this dissertation process, but with her helping to make me a more prepared,
educated, and balanced administrator. I also like to acknowledge and thank my cohort,
The Crossroads, for their support and collegiality during this process. Further, I would
like to acknowledge and thank Dr. John Carey, Dr. Craig Wells, and Dr. Robert Marx for
their assistance as their feedback was invaluable to my dissertation work. Last, I thank
my principal, Kimberly Hellerich, for her flexibility with my job responsibilities as
assistant principal during my data collection stage.

vi
ABSTRACT
EXAMINING PERCEPTIONS OF PRACTICES AND THE ROLES OF SPECIAL
EDUCATION LEADERS THROUGH THE DISTRIBUTED LEADERSHIP LENS
SEPTEMBER 2012
PATRICK R. TUDRYN, B.S., AMERICAN INTERNATIONAL COLLEGE,
SPRINGFIELD
M.S., AMERICAN INTERNATIONAL COLLEGE, SPRINGFIELD
Ed.D., UNIVERSITY OF MASSACHUSETTS AMHERST
Directed by: Professor Mary Lynn Boscardin
The purpose of this dissertation is to investigate the perceptions of distributed leadership
held by 15 administrators of special education and 15 special education teacher leaders
invited to perform a Q-sort, rank ordering 40 statements representing distributed
leadership attributes. The research questions that guided this investigation included: 1)
Are there any clusters of participants who ranked the leadership statements similarly and
differently; 2) Are the clusters related to demographic or personal characteristics
associated with the participants; 3) Were there similarities as to how the items were
ranked by the participants among the clusters; 4) Are there themes depicting the clusters
based on the statement rankings; and 5) To what extent is there a relationship between the
cluster composition, demographic and district variables? Results revealed two factors of
participants who sorted their cards similarly, the priority given to each statement
representing distributed leadership traits, and the preferred attributes associated with each
factor. Each factor was further examined to determine how the demographics of the
participants contributed to the similar sorts. This study demonstrates the importance of

vii
special education leaders developing an understanding of both the organization’s purpose
as well as the staff members’ needs, personalities, strengths, and skill sets. As special
education leaders move across the continuum of distributed leadership, their leadership
practices transition from distributing leadership tasks from a top-down model to creating
a truly collaborative environment embedded into the organization as it becomes action
oriented through continuous improvements in programming and instruction with students
with special needs. This research will contribute to expanding the understanding of
distributed leadership practices in the field of special education. Future research should
be devoted to better understanding the relationship between special education and
distributed leadership, and the influence special education leadership has on an
organization’s culture, student programming, and student achievement in relationship to
state accountability measures.

viii
TABLE OF CONTENTS Page
ACKNOWLEDGEMENT………………………………………………………………v
ABSTRACT…………………………………………………………………………….vi
LIST OF TABLES………………………………………………………………………xi
LIST OF FIGURES…………………………………………………………………….xiii
CHAPTER
1. EXAMINING LEADERSHIP PRACTICES AND THE ROLES OF SPECIAL
EDUCATION LEADERS……………………………………………………………1
Introduction………………………………………………………………………1
Historical Perspective: Social Reform Movements Influence on
Learning and Leadership………………………………………………………….3
The Impact of Education Reform Movements…………………………....5
Standards Movement……………………………………………………..7
No Child Left Behind…………………………………………………….8
Individuals with Disabilities Education Act………………..………....…11
Summary……………………………………………………………….……...…12
2. OVERVIEW OF DISTRIBUTED LEADERSHIP…………………….....................14
Distributed Leadership………………………………………………………..….14
Distributed Practices of Special Education Leaders……………………..20
Developing a Distributed Leadership Model for Special Education…….25
Summary…………………………………………………………………………32
3. METHODOLOGY…………………………………………………………………..33
Research Design and Rationale………………………………………………….34

ix
Research Questions…………………………….………………………...41
Definitions………………………………………………………………..42
Participants……………………………………………………………….44
Item Selection and Instrumentation…………………………………...…56
Procedure………………………………………………………………...67
Data Analysis…………………………………………………………………….70
Labels, Dimension, Descriptors, and Hypotheses……………………….74
Summary…………………………………………………………………………76
4. FINDINGS…………………………………………………………………………..78
Factor Membership……………………………………………………………....78
Demographic Characteristics of Members……………………………….83
Leadership Attribute Statement Rankings…………………………………...…..98
Factor A Rankings……………………………………………………...101
Factor B Rankings……………………………………………………...114
Similarities Among Special Education
Distributed Leadership Statements……………………………………………..126
Summary………………………………………………………………………..131
5. DISCUSSION……………………………………………………………………...134
Demographic Similarities and Differences among Participant
Distributed Leadership Sorts……………………………………………………134
Demographic Influence on Perceptions of Distributed Leadership…….134
Factor Profiles………………………………………………………………..…139
The Planned Distribution Profile of Factor A
Special Education Leaders……………………………………………...139

x
The Embedded Distribution Profile of Factor B
Special Education Leaders……………………………………………...143
The Distributed Leadership Continuum………………………………………...145
Limitations and Suggestions for Future Studies………………………………..151
Conclusions……………………………………………………………………..152
APPENDIX: INSTRUMENTATION……………………………………………..…..156
REFERENCES……………………………………………………………………..….164

xi
LIST OF TABLES
Table Page
2.1 Practices of Distributed Leadership…………………………………..20
2.2 Characteristics of Distributed Leadership Practices of
Special Education Leaders……………………………………………32
3.1 Characteristics of Special Education Administrator Participants…….51
3.2 Characteristics of Special Education Teacher Leader Participants...…53
3.3 Distributed Leadership Inventory…………………………………….58
3.4 45 Concourse Statements from Militello and Janson…………………59
3.5 Distributed Leadership Statements……………………………………61
3.6 Follow-up Questionnaire: Special Education Leadership Cohort…….64
3.7 Distributed Leadership Statements……………………………………66
3.8 Q-sort Follow-up Questions…………………………………………...70
4.1 Correlation Matrix Between Sorts……………………………………..82
4.2 Factor Significance and Membership…………………………………..83
4.3 Demographic Information from Factor A and Factor B……………….88
4.4 Demographic Information by Position from Factor A and Factor B…..90
4.5 Factor A and Factor B Item Rankings………………………………….99
4.6 Rankings for Factor A Highest and Lowest Rated Statements………..102
4.7 Rationale of Factor A Members for Highest Ranked Items…………...103
4.8 Rationale of Factor A Members for Lowest Ranked Items……………109
4.9 Rationale of Factor B Members for Highest and Lowest Ranked Items……..115
4.10 Rationale of Factor B Members for Highest Ranked Items…………….117

xii
4.11 Rationale of Factor B Members for Lowest Ranked Items…………….121
4.12 Factors A and B Rationale for High Ranked Item……………………...127
4.13 Factors A and B Rationale for Ranking Item #15 Low………………...130

xiii
LIST OF FIGURES
Figure Page
2.1 A Taxonomy of Distribution…………………………………………23
2.2 A Model for Sustaining Distributed Leadership……………………..27
3.1 Q-sort Process: A Schematic Diagram……………………………….41
3.2 Q-sort diagram: Special Education Leadership Cohort………………62
3.3 Q-sorting Diagram…………………………………………………….68
4.1 Component Plot in Rotated Space……………………………………79
4.2 Factor Scree Plot……………………………………………………...80
5.1 Continuum of Distributed Leadership………………………...……..148

1
CHAPTER 1
EXAMINING LEADERSHIP PRACTICES AND THE ROLES OF SPECIAL
EDUCATION LEADERS
James Burns is commonly associated by many in the educational field as the
founder of modern leadership theory (Marzano, Waters, & McNulty, 2005). While
working in politics, Burns (1978) provided the following definition for leadership:
“leaders inducing followers to act for certain goals that represent the values and
the motivation- the wants and the needs, the aspirations and expectations- of both
leaders and followers. And the genius of leadership lies in the manner in which
leaders see and act on their own and their followers’ values and motivations.”
(p.19)
Introduction
The primary purpose of this paper is to explore the relationship between
distributed leadership and the leadership practices of special education administrators and
special education teacher leaders. For the purpose of this paper, special education
administrator will be defined as an individual who works in a school district to lead,
supervise, and manage the provision of special education and related services for
individuals with disabilities. Lashley and Boscardin (2003) state that special education
administrators responsibilities include implementing the provisions of the Individuals
with Disabilities Education Act (IDEA), state and local statutes as well as policies and
procedures that stipulate a free appropriate public education in the least restrictive
environment for all students with disabilities. Special education administrators have had
a significant role in the vast improvements in the field over the last 30 years and will
continue to play a vital role in the future of public education.
When defining teacher leadership, York-Barr and Duke (2004) argue that very
few authors in the literature accurately define teacher leadership with clarity. For the
2
purpose of this paper, special education teacher leaders are teachers that possess both the
skills and opportunities to collaborate often with others in an effort to problem solve in an
effective and timely manner; and advocate for the needs of students with special needs
(Billingsley, 2007). In addition, special educator leaders provide vision and direction for
special education through collaborative efforts (York-Barr, Sommerness, Duke, & Ghere,
2005). Special educator leaders promote the use of evidence-based practices and are
adept at interpreting student data needed to effectively provide an appropriate education
to all students with various ability levels (CEC, 2009a). Ironically however, it is
disappointing when the current research base for special education lacks in the number of
data-based publications (Crockett, Becker, M.S.W., & Quinn, 2009).
While the focus of this paper is on special education leadership, it is imperative to
first demonstrate that leadership does have a significant impact in the educational field.
Leadership affects the extent to which teachers use proven, research-based practices to
improve student performance (Noell & Witt, 1999). Additionally, academic outcomes for
students with disabilities and at-risk students have been found to improve when school
leaders focus on instructional issues, demonstrate strong support for special education,
lead collaborative efforts, and provide ongoing professional development and/or training
(Benz, Lindstrom, & Yovanoff, 2000; Brownell, Smith, McNellis, & Miller, 1997;
Kearns, Kleinert, Clayton, Burdge, & Williams, 1998; Klingner, Arguelles, Hughes, &
Vaughn, 2001). In recent years, specifically in the last decade, there has been a
substantial amount of research produced linking leadership to student achievement and
thus emphasizing the importance of leadership in the field of education. For example,
Marzano et al. (2005) performed a meta-analysis examining 69 studies over 35 years of
3
research involving 2,802 schools, approximately 1.4 million students, and 14,000
teachers and the results indicate that “school leadership has a substantial effect on student
achievement and provides guidance for experienced and aspiring administrators alike”
(p.12). In fact, leadership has been found to be second only to teaching on its direct
impact on student learning (Marzano et al.; Leithwood, Harris, & Hopkins, 2008).
Provost (2007) reported that participants valued a principal that effectively communicates
the school objectives with clear outcomes while maintaining high expectations for staff
performance. Although the majority of the research available focuses on the role of the
principal, the role of the special education administrator is just as important. However,
the size of the impact of the special education administrator is complex and difficult to
measure compared to principals who are placed in a position of sustained direct daily
contact with teachers and students. The problem is there is little known about how
special education leadership tasks and activities are distributed among professionals in
schools (Boscardin, 2005). Furthermore, there is a void in the educational literature on
the extent of involvement that district and school administrators involve special education
teachers in shaping local policies and practices (Billingsley, 2007). In addition, it has
been reported on the topic of teacher leadership that no studies have been found that
addressed the work of special education teachers as leaders (Billingsley).
Historical Perspective: School Reform Movements Influence on Learning &
Leadership
Between the years of 1910 and 1929, the business and industrial group held top
status in American society (Callahan, 1962) largely due to technological advances for
efficiency (Callahan). During this time there was immense pressure for schools to run

4
like businesses for efficiency and economy from popular journals, outside businessmen,
and from educators themselves who bought into the factory system (Callahan).
Furthermore, by 1917 school boards although smaller in size became increasingly more
dominated by businessmen (Callahan) resulting in the increased incorporation of the
factory model into the educational system. An additional factor that resulted in schools
resembling factories and school superintendents as business managers was the similarity
of the school superintendent’s responsibilities with the running of a physical plant
(Callahan). Superintendents, especially those in large cities, were responsible for
supervision of staff and students, working with the school board to improve quality of
education, managing the maintenance of the physical plants, and paying careful attention
to expenditures involving large sums of money, (Callahan). Consequently, the position
of school superintendent held more characteristics similar to a managerial job of a
business or industry than that of an educator and thus the factory model was reflective in
school systems throughout the United States.
The factory model was developed during the nineteenth century with the purpose
of sorting and selecting students (DuFour & Eaker, 1998). This was aligned with the
industry model in which a select few made decisions that affected many within the
organization as the decisions were handed down. Workers were trained on their specific
tasks to perform their jobs, and thus were viewed as “interchangeable parts” (Callahan,
1962; DuFour & Eaker). Education was reflective of this practice as it followed this top-
down structure- teachers would carry out the mission of the principal and students were
provided the “one size fits all” form of instruction (Callahan; DuFour & Eaker). The
factory model during this time was somewhat effective as dropouts had ready access to

5
unskilled jobs in the industry and a select few would move onto college (DuFour &
Eaker). However, this has become less true over time as the number of unskilled jobs
have significantly decreased, resulting in the factory model becoming increasingly more
inappropriate and ineffective for improving education (DuFour & Eaker).
The Impact of Education Reform Movements
The historical events and characteristics of the efforts in the late 20th
century
school reform/improvement in the United States have been educational in terms of
improving educational leadership and school reform initiatives (although the results were
disappointing). Beginning in 1957, the launching of Sputnik cause many critics to cite
the United States public school system as the primary reason for falling behind Russia in
the race for space (DuFour & Eaker, 1998). This event brought attention to the
inappropriateness of the factory model and the need for reform in education which led to
the development of The Elementary and Secondary Act of 1965 (ESEA) (Yell, 2006b).
Although the earliest known school for children with disabilities was established in 1817
in Hartford, Connecticut, it was not until the late 1960s and early 1970s that equity of
educational opportunity for the disabled became a priority for federal legislation
(Alexander & Alexander, 2001). The ESEA provided federal funds to states under Title I
of the law for the purpose of improving the educational opportunities for disadvantaged
children (Yell).
Title I schools were schools determined by a variety of formulas containing large
populations of underachieving disadvantaged children. These formulas were usually
based on data that contained the number of students on free or reduced lunch or the
percentage of students within the school’s attendance zone (Yell, 2006b). The ESEA is

6
responsible in many ways for the continued support throughout the years from the federal
government to ensure equal educational opportunities to the economically disadvantaged
students (Yell). No Child Left Behind (NCLB) has its roots from ESEA and the
Improving America’s Schools Act of 1994 (IASA).
In 1983 the National Commission on Excellence in Education caught the nation’s
attention with its poor assessment of education in the U.S. In its report, A Nation at Risk,
the commission made frequent remarks such as “decline,” “deficiencies,” “threats,”
“risks,” “afflictions,” and “plight” when describing the educational system (DuFour &
Eaker, 1998). A Nation at Risk led to the catalyst of school improvement initiatives that
came to be known as the Excellence Movement, a top-down attempt to improve
education (DuFour & Eaker).
The Excellence Movement’s answer to educational reform was more is better:
more instructional time, more testing, longer school days, more homework, and more
rigorous courses. This was the top-down approach to education adopted during the
Excellence Movement is associated with a leadership practice similar to one Silva,
Gimbert, and Nolan (2003) describe in the first wave of development. Decisions are
made at the highest administrative level driven by major school reform initiatives and are
handed down for implementation, thus lacking the collaborative learning environments
that school districts presently strive to create and that are evident of high achieving
schools. The Excellence Movement lacked innovative initiatives, and therefore the
billions of dollars the U.S. invested in the Excellence Movement produced marginal
results at best. Within the Excellence Movement period in time from 1983 to 1986,
forty-six states created some kind of performance-based compensation system for

7
teachers such as merit pay, career ladders, or mentor teacher plans in an effort to improve
on the quality of teachers (Berry & Ginsberg, 1990) and teacher leadership. Berry and
Ginsberg report that hundreds of millions of dollars were spent as hundreds of thousands
of teachers participated in some form of performance-based pay system. However, these
performance-based compensation systems did reflect in gains in student achievement.
Standards Movement
Unfortunately, also in 1990, the United States Department of Education came to
the same conclusion as 1983 by reporting low levels of student achievement. The
failures of the Excellence Movement led to a new two-part strategy (DuFour & Eaker,
1998). The first part emerged from a summit lead by President George H. W. Bush
where the objective was to identify six national goals of education that were later
amended to eight by Congress and to attain these goals by the year 2000 (Yell, 2006b).
Thus the name Goals 2000, was given to this federal initiative. This “bottom-up” attempt
to improve education represented the second wave of reform, known as the Restructuring
Movement (DuFour & Eaker). The Restructuring Movement looked to address the
national goals by providing job-site autonomy and individual empowerment consistent
with the best practice in the private sector giving local administrators greater authority to
initiate change. The problem with the Restructuring Movement was that school
improvement agendas failed to focus on the number one priority of classroom learning
and instead focused on nonacademic issues such as student discipline (DuFour & Eaker).
Both the Excellence and Restructuring Movements are time periods that can be
associated with the leadership practice of transactional leadership. Transactional
leadership takes its name from the exchange of goods, etc. for services. The expectation

8
from followers is that they will receive perks for good service (e.g., teacher is excused
from faculty meeting for giving up their prep period to provide coverage for another
class). Transactional leaders attempt to motivate teachers through contingency-reward
relationships (Kezar & Eckel, 2008) exemplified in the performance-based compensation
systems created by the majority of state legislations during the Excellence Movement.
Transactional leaders also delegate authority while communicating teacher expectations
(Stewart, 2006) similar to the top-down approach of the Excellence Movement. In
addition, transactional leadership was evident in the management of schools during the
Restructuring Movement. Although opportunities were provided to educators to
collaborate to improve teaching and learning commonly found in the practices of
transformational leadership and professional learning communities, educators
participated in lower levels of collaboration seen in transactional leadership practices.
Vesper, McCarthy, and Lashley (1994) concluded in their research that principals
continued to exert substantial authority over most decisions, failing to include teachers in
the decision making processes despite the Restructuring Movement.
No Child Left Behind
Although opportunities were provided to schools to collectively improve
academic success, most schools failed to use the power of collaboration to focus on high
priority academic issues (Dufour & Eaker, 1998). The failures of the Excellence and
Restructuring Movements led to at least two significant changes in the field of education;
one, the No Child Left Behind Act (NCLB) (2002) introduced greater levels of
accountability for students and increase qualification requirements for teachers, and; two,
the educational leadership has shifted, focusing on leadership roles and practices of the
9
leaders in relationship to the effectiveness of the use of collaborative leadership practices
(Hallinger and Heck, 2010).
It is evident that administrative practices in schools have changed over time as
federal laws have strengthened and efforts have increased to ensure students with
disabilities receive a free appropriate public education (FAPE) (Meyen, 1995). Although
education is not a provision covered in the Constitution, the federal government has been
indirectly involved through the use of categorical grants over the years (Yell, 2006b;
Alexander & Alexander, 2001). Federal government allows Congress to intervene in
public education through three avenues: (1) state acceptance of federal grants by the
general welfare clause; (2) standards or regulations authorized within the commerce
clause; and (3) constrained actions by courts enforcing federal constitutional provisions
protecting individual rights and freedoms (Alexander & Alexander). For years the
federal government would only intervene with states’ regulation of public schools if
denial of a Constitutional right was involved. However, over the last decade the federal
courts have made more decisions regarding issues of the equity and adequacy of state
finance models used to fund schools (Alexander & Alexander).
On January 8th
, 2002, President Bush signed the NCLB into law as a result of
ESEA (20 U.S.C. §16301 et seq.) in order to ensure that all public school students
achieve important learning goals in safe classrooms by highly qualified teachers (Yell,
2006b). NCLB is a revision and reauthorization of both the ESEA and the Improving
America’s Schools Act (IASA) of 1994, and NCLB serves the purpose of continuing the
government’s commitment to ensure equal access to education for poor and
disadvantaged students (Yell). NCLB (2002) was developed in response to the federal

10
government’s overwhelming dissatisfaction from our country’s lack of improvement in
educational achievement despite increased funding over the last twenty years.
Acknowledging the failures of the Excellence and Restructuring Movements as measured
by this reform initiative adopted accountability as its mandate. Student achievement of
standardized tests would be the dominant measure of student performance.
The major requirements of NCLB for schools include accountability for results,
the use of scientifically based instruction, and the training of highly qualified teachers
and paraprofessionals (Yell, 2006b). NCLB holds school districts accountable for all
students’ learning, including those with disabilities through student participation in
statewide assessments. Similarly, the 1997 reauthorization of IDEA ensures that all
students with disabilities are included in state assessment programs by building in
accountability provisions (Parrish & Wolman, 2004). This is to ensure that the
instruction and achievement improves for all students (Yell).
Schools districts have learned from past failures that change is dependent on
effective leadership which emphasizes collaborative approaches to school improvement.
Even though there are many valid arguments with some of the dilemmas NCLB places on
school districts, most educators would agree that accountability for student achievement
is necessary in order to improve our educational systems. With increased accountability,
there has been additional pressure placed on educational leaders and teachers to attain
higher levels of student achievement. As a result, the leadership of the organization of a
district and its schools are viewed either as the catalyst or the anchor for improving
student learning.

11
Individuals with Disabilities Education Act
The purpose of IDEA 2004 is to ensure that all children with disabilities receive a
FAPE. IDEA 2004 is the latest of several reauthorizations of the Education for All
Handicapped Children Act of 1975 (EAHCA). In 1987 the EAHCA was renamed the
Individuals with Disabilities Act, but still serves as the foundation of IDEA. Children
that have disabilities that impact their academic achievement may receive special
education and related services so that their individual needs can be met under their
Individual Education Program (IEP). IDEA 2004 is designed to prepare children with
disabilities for further educational opportunities, employment, and independent living
(Yell, 2006a). In many ways the IDEA 2004, specifically the Least Restrictive
Environment (LRE) provision, supports NCLB. The Individuals with Disabilities
Education Improvement Act of 2004 (IDEA 2004) was developed with an emphasis to
complement the standards and requirements of NCLB and is the most current revision of
the law since 1997.
LRE is one of the provisions of IDEA that is supported in the language of NCLB.
The IDEA Regulations for LRE under section 300.114 require that students with
disabilities receive their education from the general curriculum with their nondisabled
peers to the maximum extent appropriate. The LRE provision of IDEA 2004 and the
regulations extends not only to the setting, but also to the curriculum. Similarly, NCLB
addresses the need to improve instruction for students with learning disabilities. NCLB
holds states accountable for including students with learning disabilities in all state
assessments along with the monitoring of their adequate yearly progress (AYP) in the
general curriculum. In order for students with disabilities to make AYP, they must be

12
exposed to the other requirements of NCLB such as good instruction from very skilled
teachers. As a result, one of the intentions of NCLB is to support the fight for inclusion
of students with disabilities in the general curriculum.
The goal for children with disabilities is for all to receive a complete education in
the general curriculum. According to the federal regulations in section 300.116, school
districts and states must make all placement decisions in compliance with LRE.
Furthermore, the accountability measures of LRE in IDEA 2004 and Title I under NCLB
requiring the inclusion of students with disabilities in state assessments help to avoid
some negative consequences such as a large rate increase of special education referrals.
Research has shown that when students with disabilities are permitted to be excluded
from state assessments measuring accountability, then the number of special education
referrals increases considerably (Lehr & Thurlow, 2003).
Summary
National professional standards provide a solid foundation for identifying the
roles and responsibilities of leaders of special education, however, federal and state
mandates have contributed to the work of leaders of special education becoming more
complex. Additional complexities make the expectation of any one leader of special
education possessing the expert knowledge or specialized skills necessary to address all
situations unrealistic. The ability of leaders to distribute, as opposed to delegate,
leadership responsibilities in a meaningful and shared manner while maintaining
oversight and accountability opens possibilities and opportunities for providing the best
practices for learners with disabilities from diverse backgrounds and engaging multiple
stakeholders. Chapter 2 will examine how distributed leadership might begin to help

13
address the challenge of providing students with disabilities and their families with the
services and programs needed to meet their needs.

14
CHAPTER 2
OVERVIEW OF DISTRIBUTED LEADERSHIP
“Distributed leadership enhances opportunities for the organization to benefit from the
capacities of more of its members, permits members to capitalize on the range of their
individual strengths, and develops among organizational members a fuller appreciation
of interdependence and how one’s behavior effects the organization as a whole”
-Leithwood, 2005, p.18
Distributed Leadership
The empirical evidence supporting distributed leadership in schools is not as
strongly backed as other leadership styles, such as transformational leadership. In fact, it
has been suggested that this form of leadership exists without any or little empirical
support at all (Harris, 2007). Mascall, Leithwood, Straus, and Sacks (2008) have added
that “systematic evidence is modest, at best, about the factors that influence the nature
and extent of distributed leadership in schools, as well as the consequences of distributed
patterns of leadership for schools and students.” This can be attributed to the fact that
this form of leadership has only emerged during the last decade.
Gronn (2008) states, “Distributed leadership arose in reaction to understandings
of leadership that emphasized heroic-like individual behavior. It has achieved a high level
of theoretical and practical uptake (p. 141).” In addition, some have argued that the term
‘distributed leadership’ has caused confusion due to the varying definitions (Harris, 2007;
Gronn, 2003; Spillane, 2006) and similarities to other forms of leadership (i.e. democratic
leadership) in the literature (Bennet, Wise, Woods, & Harvey, 2003; Woods, 2004).
However, Gronn (2008) has recently concluded that it appears distributed leadership has
survived the initial stage of conceptual exploration and is here to stay, and others have
proclaimed that its popularity is increasing (Spillane & Harris, 2008). Gronn (2008)

15
adds, “[Distributed leadership] is now well into a phase of empirical investigation and
may shortly be entering a period when some sense of its impact will become clearer (p.
141).”
Gronn (2002) has provided two broad definitions for distributed leadership.
Gronn refers distributed leadership in one perspective as “straightforward numerical” and
in another perspective as “concertive action” (p. 654). In brief, these two definitions for
distributed leadership are described by as following (Gronn):
Numerical or additive: Leadership is “dispersed rather than concentrated”. As
a result, leadership is shared among colleagues rather than placed on one focal
individual such as the principal in the school setting. Distributed leadership
can include in addition to the principal, assistant principals, teacher leaders,
school board members, and even students. This form of leadership does not
necessarily provide any more leadership or privileges to any individuals with
particular position titles. Numerical leadership allows the possibility of all
members in the organization to carry out leadership responsibilities as the
situations change from time to time. This form of distributed leadership is
most commonly used and is directly contrasted with focused leadership
(Bennet, Wise, Woods, & Harvey, 2003).
Distributed leadership as concertive action: This form of distributed
leadership is holistic where the sum is greater than its parts. Distributed
leadership in this form is structured around concept of division of labor as
formal roles are not defined. Gronn (2002) observes three main patterns in
concertive action:
16
a) Spontaneous collaboration: Leadership is evident in the interaction and
relationships of people from multiple layers or divisions within the
organization. Members of the organization, each of whom is comprised
with different skills and expertise, pool their talents and resources together
to accomplish numerous organizational tasks.
b) Intuitive working relations: Leadership is manifest in the shared role
when instinctive understandings emerge over time as a result of two or
more organizational members developing close working relations built on
trust and shared responsibility.
c) Institutionalized Practices: Structures of working together such as
committees are put into place in an effort to improve upon an
organization’s current practice.
Distributed leadership has developed its roots from the work of Elmore (2000,
2002) and Spillane (Spillane, Halverson, & Diamond, 2001, 2004; Spillane, 2006;
Spillane & Harris, 2008; Spillane, Camburn, Pustejovsky, Pareja, & Lewis, 2008).
Elmore (2000, 2002) has argued that distributed leadership is needed for an organization
(i.e. schools) to make instructional improvement, and; that leaders need to incorporate the
model of distributed leadership in order to work cooperatively around the common task
of instructional improvement (Elmore, 2000) and to create and sustain capacity using
professional development (Elmore, 2002). According to Spillane et al. (2004),
distributed leadership can be defined as an interactive web of leaders and followers who
periodically change roles as the needs of the organization change. The model of
distributed leadership focuses on the interactions that take place during both informal and

17
formal leadership roles (Spillane & Harris, 2008) and how these leadership practices
influence the organizational and instructional outcomes (Spillane, 2006).
Distributed leadership acknowledges that an organization similar to a school
district or school has multiple leaders in which the leadership tasks are widely shared
within the organization and recognize that the work of all individuals who contribute to
leadership practice (whether formally or informally designated) as leaders (Spillane &
Harris, 2008). Spillane’s theory (Spillane et al., 2001, 2004) on distributed leadership (in
Spillane et al., 2004) is based on two assumptions:
School leadership is best understood through considering leadership tasks; and
Leadership practice is distributed over leaders, followers, and the school’s
situation or context.
Similarly to Gronn, Spillane et al. (2004) described three ways that leadership can
be distributed over multiple leaders in regards to distributed leadership. The first way is
through collaborative distribution, which occurs when the actions of a leader follows the
actions of another leader. The second way is through collective distribution, which
occurs when leaders share a common goal, but work interdependently of each other to
achieve the goal. The third and last way is through coordinated distribution, which
occurs when different individuals attempt to accomplish sequential tasks.
Based on an extensive literature review, Spillane et al. (2004) has identified
several functions that provide a framework for analyzing leadership tasks:
Constructing and selling an instructional vision;

18
Developing and managing a school culture conducive to conversations about
the core technology of instruction by building norms of trust, collaboration,
and academic press among staff;
Procuring and distributing resources, including materials, time, support, and
compensation;
Supporting teacher growth and development, both individually and
collectively;
Providing both summative and formative monitoring of instruction and
innovation; and
Establishing a school climate in which disciplinary issues do not dominate
instructional issues.
In order for distributed leadership to be an effective means of managing an
organization, the importance of collaboration among leaders and followers cannot be
understated. If numerous leadership tasks are to be distributed among multiple leaders,
then a clear, well defined vision and mission need to be in place. This is necessary for
the entire organization to work collectively in an effort to demonstrate growth and
improve instructionally and organizationally as a whole. Collaboration is essential for
the development of a strong organizational culture and producing conversation among
staff conducive to the needs of the organization. Leithwood, Mascall, Strauss, Sacks,
Memon, and Yashkina (2007) have provided a description of distributed leadership by
breaking the leadership tasks into four categories or patterns. These patterns reflect the
extent to which the performance of the task is aligned across the sources of leadership

19
and the degree to which the approach is planned or spontaneous. A summary of the
breakdown of the four patterns is as followed (Leithwood et al., 2007):
Planful alignment: the leadership tasks in this pattern have been given
careful, prior reflective thought by members working cooperatively towards
shared whole-organizational goals. Various leadership sources consider
which leadership practices are best carried out by which source. Due to the
careful planning and preparation involved in this pattern, this pattern is
expected to lead to positive long-term effects within the organization.
Spontaneous alignment: the leadership tasks in this pattern are distributed
with little or no planning. Leadership tasks typically are assigned by chance
through by spontaneous collaboration. This pattern is expected to produce
short-term positive outcomes, while expecting to fail to produce long-term
results due to the lack of reflective feedback.
Spontaneous misalignment: the leadership tasks in this pattern are also
distributed with little or no planning by chance. However, in these situations
this pattern of leadership produces negative outcomes for the organization,
thus making it difficult to achieve even short-term success.
Anarchic misalignment: the leadership tasks in this pattern involve substantial
planning and alignment within a unit (i.e. department) with each unit working
very independently and competing with other units for resources and with
determining the focus for organizational goals. Success of the organization is
determined by the level of participation by others in this pattern of leadership.
One of the major challenges with this pattern of leadership is receiving the

20
necessary buy-in and long-term commitment required from members to work
towards the wider goals of the organization.
Table 2.1
Patterns of Distributed Leadership
(Leithwood et al, 2007, pp 40-42)
Types of Planning
Purposeful Nonexistent
Ex
pec
ted
Ou
tco
mes
Po
siti
ve
Planful Alignment: careful, reflective,
collaborative thought process that leads to
long-term positive effects
Spontaneous Alignment: tasks distributed by
chance through spontaneous collaboration that
produce short-term positive effects.
Neg
ati
ve Anarchic Misalignment: involves
substantial amount of planning but fails to
produce positive results due to failures
with buy-in or conflicting agendas
Spontaneous Misalignment: tasks distributed
by chance producing both short and long-term
negative effects
Distributed Practices of Special Education Leaders
Dufour and Eaker (1998) assert that “attempts to persuade educators to participate
in reform by assuring them that change will be easy are patently dishonest (p. 50).”
Change is always difficult no matter what the initiative. School change is particularly
complex and difficult because the notion of changing from the traditional model that
schools have function is radical to many long-time educators. Many educators have
taught in isolation for a number of years and are now required to work in collaborative
teams that require sharing and opening the door to their classrooms with their peers. For
years, teaching resembled individual private practice and now it has transitioned into a
professional learning community where educators share teaching strategies, best
practices, and resources to improve student learning (Drago-Severson & Pinto, 2006).
Leadership practice that effectively promotes collaboration and provides opportunities for
educators to work cooperatively and collaboratively together draws from the experiences

21
and expertise of others in an effort to improve the organization. The emphasis is not
what students can learn or are taught in isolated classes, but what can be learned and
taught in the organization as a whole while addressing a challenging curriculum with
high and attainable standards (Drago-Severson & Pinto). A positive school culture with a
challenging curriculum focused on high, attainable standards is cultivated through the
ongoing collective work of administrators and teachers. Special education administrators
not only have the challenge of building a positive collaborative environment, but also in
the promoting of collaboration between general and special education teachers and
general education administrators to assure that high quality educational programs are
available to all students regardless of ability (Lashley and Boscardin, 2003). In order to
meet the demands of the job, special education administrators must effectively distribute
leadership tasks among multiple leaders and followers while simultaneously working
collaboratively and collectively together. It is imperative to the success of educational
programs that special education administrators and principals have a collaborative and
cooperative relationship. Thus, it is the responsibility of special education administrators
to prepare school-level administrators to understand the roles and responsibilities of
special educators (Wald, 1998).
In a study consisting of 451 interviews from headteachers and teachers in 11
schools (4 secondary, 2 middle, 3 primary, and 2 junior/infant) in England, MacBeath,
Oduro, and Waterhouse (2004) were able to develop six different approaches or
perspectives to distributing leadership tasks. This study, sponsored by the National
College for School Leadership, was conducted during the 2003 and 2004 years and
represented both rural and urban settings. These six processes have been described as

22
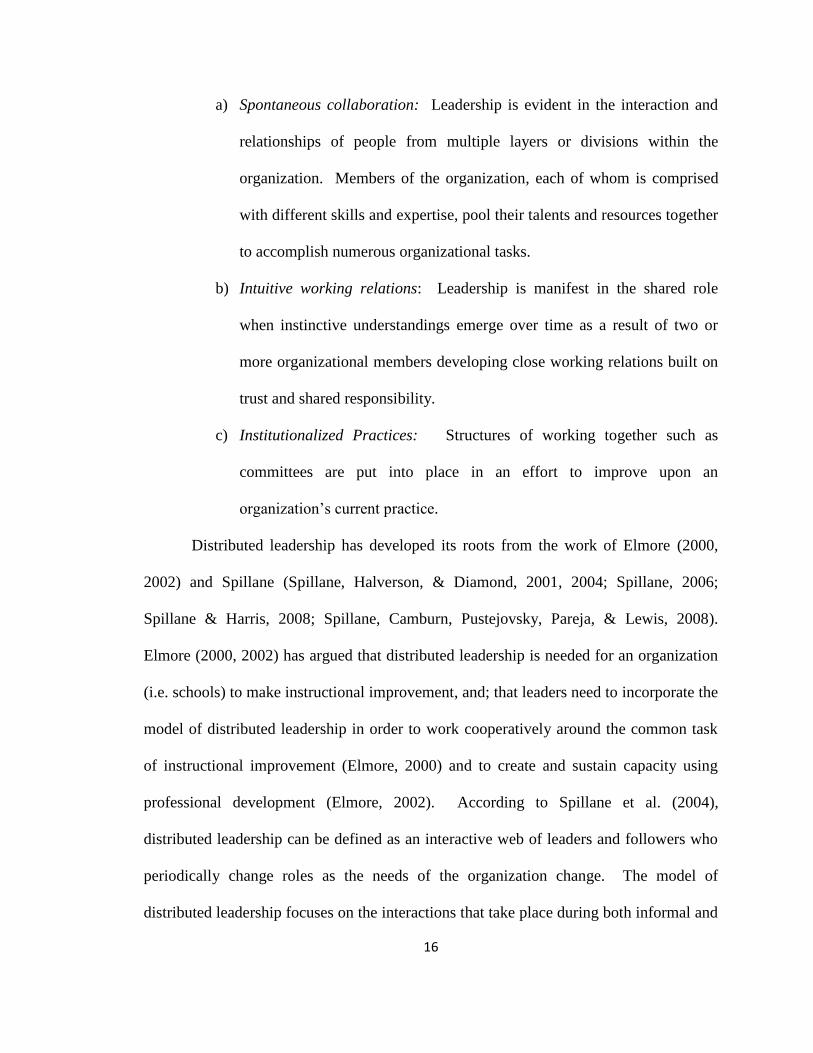
formal distribution, pragmatic distribution, strategic distribution, incremental distribution,
opportunistic distribution, and cultural distribution. These six approaches are not defined
as either being in isolation or as mutually exclusive of each other; however, when
viewing the diagram shown in figure 2.1 below of these six approaches, a natural
progression between the approaches is evident. In addition, MacBeath et al. state the
categories are not “discrete or watertight” and “exemplify different approaches at
different times and in response to external events” (p.35).
Each of the six approaches contains a unique function for distributing leadership
tasks. Formal distribution recognizes the expertise of an individual and as a result,
responsibility is assigned based on their specialized skills accompanied with performance
expectations (MacBeath et al., 2004). Formal distribution provides a sense of ownership
and accountability. On the contrary, pragmatic distribution is typically a reaction to
external events. Additional tasks are given in response to heavy workloads that can often
be associated with the implementation of multiple initiatives (MacBeath et al.). These
added responsibilities are not always welcomed by staff. Strategic distribution is goal
orientated and the appointment of individuals is largely based on their potential to work
collectively with other leaders (MacBeath et al.). Formal, pragmatic, and strategic
distribution is typically perceived as top-down leadership practices similar to the
leadership practices of the Excellence Movement.
Incremental distribution is driven to support professional development and growth
by increasing the responsibility of those demonstrating the capacity to lead. It is based
on the belief that the capacity to lead is inherent in everyone, but requires mutual
confidence of both leaders and followers to manifest (MacBeath et al., 2004). A shift to a
23
bottom-up approach takes place when transitioning into opportunistic distribution. It is
based on the assumption that the relevance and strength of the initiative will result in
capable individuals willingly extending their roles to leadership for the good of the
organization. Similar to the leadership practices during the Restructuring Movement,
opportunistic distribution provides greater job-site autonomy and individual
empowerment. On the contrary though, the practice of opportunistic distribution does not
Figure 2.1
A Taxonomy of Distribution
MacBeath et al. (2004, p.35)
Formal Distribution:
through designated roles/job description
Distributed
Leadership
Cultural distribution:
practicing leadership as a reflection of school’s
culture, ethos and traditions initiative to lead
Opportunistic distribution:
capable teachers willingly extending their roles to school-
wide leadership because they are predisposed to taking initiative to
lead.
Incremental distribution:
evolving greater responsibility as people demonstrate their capacity
to lead
Strategic distribution:
based on planned appointment of individuals to contribute
positively to the development of leadership throughout the school.
Pragmatic distribution:
through necessity/ often ad hoc delegation of workload

24
assign leadership, but disperses leadership among staff willing to lead, organize, and
provide oversight (MacBeath et al.). Finally, cultural distribution represents the most
effective approach to distributed leadership. Cultural distribution emphasizes leadership
through activities rather than roles or individual initiative. MacBeath et al. state,
“Distribution as a conscious process is no longer applicable because people exercise
initiative spontaneously and collaboratively with no necessary identification of leaders or
followers… Teamworking, leading and following, looking after others are a reflection of
the culture, ethos and traditions in which shared leadership is simply an aspect of the way
we do things round here” (p.43). The practice of cultural distribution relies heavily on
trust and competence which can only be accomplished in a truly collaborative
environment that has been embedded into the culture of the organization. Consequently,
collaboration cannot be undervalued and is a necessity to maintaining accountability.
Further, the works of Billingsley (2011) and MacBeath et al. (2004) bring
attention to the importance of the practice of distributed leadership in special education.
Billingsley’s statements of the importance of shared leadership, working with
stakeholders towards developing a shared vision, and facilitating the development of a
culture in the district is characteristic of MacBeath et al.’s description of cultural
distribution. Both works emphasize the value of special and general educators working
together as a community of people towards to common goal, which is imperative to
providing a continuum of special education services to students with disabilities in their
least restricted environment. In addition, Billingsley’s statement in regards to expecting
resistance and listening to concerns is also representative of the trust and reciprocity
needed to achieve cultural distribution. Furthermore, both works outline the importance

25
for providing opportunities for professional development as well developing
accountability systems for progress monitoring.
Developing a Distributed Leadership Model for Special Education
It is logical to associate the effectiveness of special education programs with the
leadership practices of special education administrators. However, because the research
is limited in this area, it is important to establish a relationship between special education
administrators and special education teacher leaders, given there are distinctions between
the two roles. A special education administrator is an educational leader who determines
and articulates the educational standards and goals for special education programs to
special educators through collaborative efforts that lead to enhanced opportunities for
individuals with exceptional learning needs (CEC, 2009b). A teacher leader works
collegially and collaboratively (Silva et al., 2000) engaging in the problem solving
process at the building levels, mentoring new teachers, assisting with redesigning
schools, and providing meaningful professional growth activities for colleagues (Darling-
Hammond, Bullmaster, & Cobb, 1995; Billingsley, 2007). According to the CEC, the
responsibilities and roles of a special education administrator include oversight of special
education programs; assisting with program development and implementation; ensuring
the quality of special education services; and being involved in the education process by
working with teachers and parents (CEC, 2009b). Although few in the educational field
would devalue the importance of collaboration to the role of special education
administrator, there is lack of research available that measures the significance of impact
that collaboration has on the effectiveness of special educator leadership practices. The
majority of research performed on the impact of educational leadership analyzes the

26
effectiveness of various leadership practices and roles of principals, but few examine the
role of the leader of special education. The abundance of research on school leadership
of principals clearly indicates that leadership does have a direct impact on teaching and
learning (Marzano et al., 2005). However, through the analysis of literature on the roles
and responsibilities of special educators along with the defining characteristics of
distributed leadership a connection can evidently be drawn.
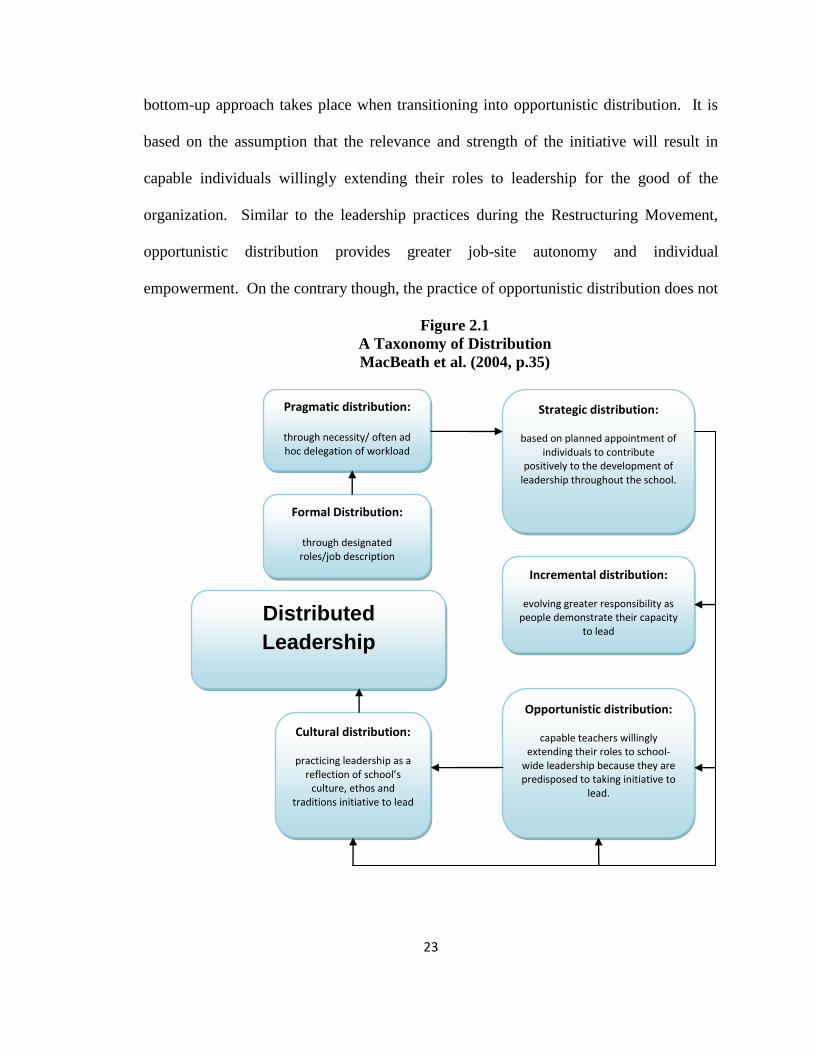
MacBeath et al. (2004) published a report sponsored by the National College for
School Leadership on “Distributed Leadership” in which they describe a model for
sustaining distributed leadership. This model consists of three major phases of
development for distributed leadership (see figure 2.2). And although the model was
developed specially for schools, the three phases of development are applicable to larger
district organizations, specifically special education departments. In summary, the three
phases for sustaining distributed leadership developed by MacBeath et al. are described
below:
Phase 1 begins as the educational leader, such as a special education
administrator, learns the formal structures, history, and culture of the
organization. As the (special education administrator) leader, becomes
familiar with staff (i.e., special education teacher leaders) and their skill
sets, leadership responsibilities are formally and strategically assigned to
individuals that comprise of a leadership team. In addition, the leadership
team builds a system of accountability by controlling and monitoring
progress.

27
Figure 2.2
A Model for Sustaining Distributed Leadership
(MacBeath et al., 2004, p.46)
Phase 2 evolves as the scope of leadership incrementally includes other
staff members (i.e., special education teachers, regular education teachers,
paraprofessionals, etc.) that do not hold formal leadership positions in an
effort to establish a shared leadership as well as a shared vision among
staff indicating the mission of the organization. Conscious efforts are
made to include all staff in decision making. The (special) educational
leader strives to build a strong culture of collaboration that allows both
Creating
awareness
for shared
leadership
Formally and strategically assign
leadership responsibilities to
capable individuals
Control and manage their performance
Create a mutual learning culture
Identify leadership
potential in people
Train people for
leadership
Facilitate individual leadership
performance
Respect views of all
Be prepared to stand back
Motivate people to initiate leadership
Listen
Encourage risk-taking
Provide material
help
Make yourself accessible
Allow sufficient freedom for people to initiate
and implement
Ensure security
Peer/self-evaluation
Provide opportunity for continuous professional
development
trust
feedback
attitudes
knowledge
confidence
Phase 1 Phase 2 Phase 3
28
formal and informal opportunities to staff to learn from one another in
effort to improve individual skill and collective practices. The success of
the organization is based on the effectiveness of these collaborative
efforts.
Phase 3 emphasizes sustainability. The organization has established a
culture characterized by values of mutual trust, self-confidence and shared
goals. The roles of leaders and followers can change according to the
context of the situation. Because there is a collaborative culture in which
there is a high level of trust, differences in values and work practices can
both be tolerated and challenged.
Research indicates that the role of special education administrator continues to
evolve and change (Lashley, 1992; Sullivan and Leary, 1991). Thus, distributed
leadership naturally becomes a logical preference of leaders of special education based on
the definition of distributed leadership as an interactive web of leaders and followers in
which roles and responsibilities adjust accordingly to meet the changes within
organization (Spillane et al., 2004). Typically, special education administrators serve
their position from the district level similar to superintendents. This requires special
education administrators to skillfully work with other district level leaders (i.e.
superintendent, principals and curriculum director) to align the goals and objectives of
the district with the need to meet the needs of students with disabilities. This is quite
challenging for many special education administrators (depending on the state and
district) because they often do not have the benefit of having input into programs,
management, or supervision at the building base level. Thus, it is imperative that special

29
education administrators delegate responsibility effectively and work extremely well with
others collaboratively.
As a result, special education administrators must have effective and well-
informed special education teacher leaders at the building levels in order to maintain
compliance with the regulations of IDEA 2004 along with state and local statutes while
running well-designed programs that meet the students’ needs. The accountability
system that is established between special education administrators and teachers leaders
is a necessary component for controlling and monitoring performance as described in the
first phase of MacBeath et al.’s (2004) model for sustaining distributed leadership. The
relationship between special education administrators and special education teacher
leaders plays a pivotal role with meeting the individual needs of the students with
disabilities.
Additionally, special education plays an essential role in attaining the high
academic expectations that are commonly set in the curricular frameworks and standards
at the state and local levels. MacBeath et al. (2004) state in their work when describing
the second phase for sustaining distributed leadership, “(The) explicit purpose is to
encourage a sense of collaboration… and a culture in which staff willingly use informal
opportunities to discuss…learning and then reflect on their practice as a way of
identifying their professional learning skills (p.47).” As mentioned earlier, special
education administrators have the challenging responsibility of building a positive
collaborative relationship with special education staff, but also in the promotion of
collaboration between general and special education teachers and administrators to assure
that high quality educational programs are accessible to all students regardless of ability

30
(Lashley and Boscardin, 2003). As a result, the roles and practices of leadership of
special educators are equally as important as those of general educators. Crockett (2002)
in an effort to assist decision makers converted five historical themes in special education
into principles of administrative practice grounded in FAPE, LRE, and best practices.
Crockett developed a framework which presents these five core principles as areas to be
developed in the preparation of responsive leaders for inclusive schools. The principles
are:
1. Ethical Practice: Ensuring universal educational access and
accountability. This first principle develops moral leaders who are
capable of analyzing complexities, respecting others, and advocating for
child benefit, justice, and full educational opportunity.
2. Individual Consideration: Addressing individuality and exceptionality in
learning. This principle develops leaders who are attentive to the
relationship between the unique learning and behavioral needs of students
with disabilities and the specialized instruction to address their educational
progress.
3. Equity Under Law: Providing an appropriate education through equitable
public policies. This principle develops leaders who are committed to the
informed implementation of disability law, financial options, and public
policies that support individual educational benefit.
4. Effective Programming: Providing individualized programming designed
to enhance student performance. This principle develops leaders who are
skilled at supervising and evaluating educational programs in general, and

31
individualized programming in particular, and who foster high
expectations, support research-based strategies, and target positive results
for learners with exceptionalities.
5. Establishing Productive Partnerships. The fifth principle develops
leaders who are effective in communicating, negotiating, and collaborating
with others on behalf of students with disabilities and their families.
By taking a closer look at these principles, one realizes that in order to reach the desired
goals, an organization must first accomplish the last principle. This fifth and last
principal emphasizes the importance of collaboration involving multiple stakeholders that
includes both special and general education teachers and administrators along with the
families in order to meet the needs of students with disabilities. Crockett goes on to state
on the fifth principle that “because educating diverse learners is a complex task,
establishing productive partnerships, encourages leaders to question how well the
members of their own learning communities collaborate and how effectively they partner
with parents and service agencies in responding to the needs of vulnerable youth and
families”. Special education leaders can only accomplish the five principles if they
comprehend the size of impact of the disability along with students’ needs, have high but
reasonable expectations, and are well-educated and up-to-date on recent law. Because
special education administrators do not generally supervise from the building base level,
they must distribute leadership tasks by collaboratively working with others in order to
effectively perform the duties and responsibilities of the job. The relationship between
special education administrators and teacher leaders must be a collaborative partnership

32
based on trust in order to be effective as described in the third phase MacBeath et al.’s
(2004) model for sustaining distributed leadership.
Table 2.2
Characteristics of Distributed Leadership Practices
of Special Education Leaders
Roles/Responsibilities DL Framework
SP
ED
AD
MIN
Determines and articulates the educational
standards and goals for SPED programs; Lead
collaborative efforts; lead district wide
initiatives such as student progress monitoring;
being involved in the education process by
working with teachers and parents (Boyer &
Lee, 2001; Lashley & Boscardin, 2003;
Walther-Thomas, Korinek, McLaughlin, &
Williams, 2000)
Constructing and selling a vision; Building
norms of collaboration; Providing both
summative and formative monitoring;
Supporting teacher growth and development;
distributes resources, time, & support (Spillane
et al., 2004)
SP
ED
TL
Works collaboratively; mentoring new
teachers; assists with redesigning schools;
provides meaningful professional growth
activities for colleagues (Darling-Hammond,
Bullmaster, & Cobb, 1995; Billingsley, 2007;
Silva et al., 2000)
Builds norms of collaboration; supports teacher
growth & development; Constructs & sells a
vision; distributes resources, time, & support
(Spillane et al., 2004)
Summary
The characteristics of the distributed leadership practices discussed in this paper
of special education administrators and teacher leaders are displayed in the above in table
2.2. Following the distributed leadership framework of Spillane et al. (2004), utilizing
effective forms of collaboration is essential to successfully fulfilling the many
responsibilities of special education leaders. Special education administrators
demonstrating distributed leadership provide clear vision; however, distributed leaders
also reassign roles among multiple leaders periodically depending on the context of the
situation. Complementary to special education administrators are special education
teacher leaders, who demonstrate distributed leadership by working collectively with
multiple leaders and followers to support the vision (Spillane et al., 2004).

33
CHAPTER 3:
METHODOLOGY
Previously discussed was the importance of associating the effectiveness of
special education with leadership practices of special education administrators; however,
due to the limited scope of research conducted in this area, and the case is made for
further investigation of the relationship between special education administrators and
special education teacher leaders regarding perceptions about leadership and the
narrowing of the focus to one particular type of leadership theory. While the literature
review defined the roles and responsibilities of special education administrators and
special education teacher leaders, it is unknown how each perceives distributed
leadership practices. Consequently, the literature review was organized in a way that
highlighted the purposes of leadership to demonstrate to the reader the importance of
distributed approaches to leadership in order to effectively perform administrative and
teacher leader responsibilities. As schools become increasingly more inclusive, both
general and special education administrators must become increasingly more
collaborative in order to meet the needs of diverse learners (Lashley and Boscardin,
2003).
The work of special education administrators has significantly increased,
particularly over the last decade, as the laws have changed and strengthened with the
reauthorization of Individuals with Disabilities Act 2004 and No Child Left Behind 2001.
However, role ambiguity continues to be a problem for special education administrators
(Edmonson, 2001). As described in Chapter 1, the roles and responsibilities of special

34
education leaders along with exploring and learning how special educator leadership
tasks and activities are organized and structured differently across and within school
districts, with some roles having a school-based focus while others have a district
perspective.
Due to the complexities and nature of the job of a special education leader, it is
essential to examine and question the distribution of leadership tasks. This study
attempts to identify the most prevalent distributed leadership attributes that special
education administrators and teacher leaders value the most and the least. Although
school districts across the country have various organizational structures, educational
services, and student populations; the examination of special education leadership is one
that will continue to grow as school districts continue to be held more accountable for the
education of all learners with laws such IDEA and NCLB. In this paper, the rationale for
the study, participant selection, procedure, and data analysis is presented.
Research Design and Rationale
The primary purpose of this research is to explore the relationship between the
distributed leadership practices of special education administrators and special education
teacher leaders by using a mixed methods approach. As stated earlier, there is an overall
dearth of research conducted in the area of special education leadership and it is the hope
that this paper serves as a stepping stone for further research that will lead to a positive
impact in the field of special education leadership and administration. This relationship
has been explored by investigating the characteristics of Q-sorts performed by special
education administrators and special education teacher leaders. The Q-technique is a
method of rank-ordering variables followed by an assignment of numbers to those ranks
35
for statistical analysis (Kerlinger, 1986). In a Q-methodology study, subjects sort
statements into categories based on their personal understandings of the concepts under
investigation. Additionally, in a Q-methodology, the n for the study is the number of
items (Q-sample) rather than the number of participants participating in the sorting
activity. Through the quantitative analysis of the Q-Sort data it is possible to determine
the priority given to each statement representing collaborative and distributive leadership
traits.
The Q methodology was developed in response to issues with past practice that
focused on the “external standpoint of the investigator” in which studies by the very
nature they were constructed produced limited data for analysis (Brown, 1980, p.1).
Studying leadership behavior in the context of any analytical framework that has been
specified to be a priori has the potential to be problematic. Brown stated, “operational
definitions place constraints on behavior by replacing the subject’s meaning with the
investigators” (p.4-5) because investigator attention is drawn to the constraints rather than
to the behavior forcing the investigators in these types of studies to align their results to
their operational definitions. Q methodology along with the application of factor analysis
provides the investigator “flexible procedures for the examination of subjectivity within
an operant framework” (Brown, p.6) and the ability to thoroughly explain factors in terms
of commonly shared attitudes or perspectives.
In 1935, Sir Godfrey Thomson, a British factorist, published a paper describing
the possibilities of calculating correlations between people instead of tests
(VandenBosch, 2001). It was at this time that Thomson first introduced the technique
“Q” in effort to differentiate from the traditional R technique; however, Thomson was

36
reluctant to carry the Q-techniques further (Brown, 1980). Coincidentally and almost
simultaneously, William Stephenson was writing on the possibilities of performing
person correlations and intrapersonal relationships (Brown; Stephenson, 1935). Thus, it
was Stephenson who popularized the Q-methodology as a systematic research method of
investigating individuals’ judgments, attitudes, and perspectives on a particular topic or
in a given situation (Brown, 1996; VandenBosch).
The Q-technique has been described as a very effective technique for the intensive
investigation of a small number of people (Thompson, 1998; VandenBosch, 2001). A Q-
technique factor analysis is used to identify types or clusters of people with similar
perceptions (Thompson) by factoring people over variables holding circumstances
constant (VandenBosch). According to Thompson, a Q-technique factor analysis serves
to answer the three questions of: 1) How many types (factors) of people are there?, 2) Are
the expected people most associated with the expected person factors?, and 3) Which
variables were and were not useful in differentiating the various person types/factors?
Although factor analysis has been conceptually available since the early 1900s, its
use has only become prevalent with the recent advances of technology and user-friendly
statistical software packages (i.e. SPSS) (Thompson, 1998). Pertinent to the field of
special education, Johnson (1993) used the Q-methodology to explore teacher attitudes
towards the inclusionary model for students with special needs. The participants of this
study consisted of 33 special education and regular education teachers. The Q-sort
activity was comprised of 36 statements representing teacher perceptions regarding
education models, special education students, and methodologies. The Q-sort instrument
was adapted from “A Survey of Teacher’s Opinions Relative to Mainstreaming Special

37
Needs Children” by Larrivee and Cook (1979). The Q-sort packages were delivered to
special education teachers in each building who were then responsible for disseminating
the packages to their peers.
In another study, Bracken and Fischel (2006) applied Q-sort methodology to the
development of the Preschool Classroom Practices (PCP) Q-sort. The PCP Q-sort was
tested on a sample of 66 preschool teachers and assistants and consisted of 49 classroom
practice items. Bracken and Fischel reported that the items reflected a variety of
activities targeted at developing school readiness skills in areas such as oral language,
early literacy, art, early math, responsibility, self-control, and peer relations (p.420).
Bracken and Fischel choose to have the participants complete the Q-sort independently at
home in an effort to avoid possible influence by other program staff at their preschool
center. Bracken and Fischel were available by phone to answer questions that arose
during the completion of the Q-sort. In this study, the researcher was present during the
Q-sort activity; however, the Q-sort activity and follow-up interview took place in an
appropriate setting away from any influential external factors. Similarly to Johnson
(1993), Bracken and Fischel were not present during their Q-sort activity.
An additional study on distributed leadership was conducted Militello and Janson
(2007) exploring the working relationship between school principals and counselors. The
purpose of this study was to investigate the perceived personal relationship between
school counselors and principals through the use of a Q-sort methodology. Specifically,
Militello and Janson explored the social and situational distribution of collaboration
between both groups. 39 principals and school counselors participated in this study by
sorting 45 opinion statements that the authors were able to develop and validate.
38
Participants sorted the statements into nine categories and prioritized the statements from
“most characteristic of my relationship” to “least characteristic of my relationship”. In
addition to quantitative data, qualitative data was also collected as Militello and Janson
followed-up each Q-sort activity with a brief interview to develop a stronger
understanding for the participants’ thought processes involved with the sorting of the 45
opinion statements.
Provost (2007) conducted Q-methodology consisting of 21 statements in a study
investigating the leadership behaviors of principals. Provost utilized the 21 descriptors of
principal leadership behavior previously validated for a questionnaire designed by Heck
and Marcoulides (1993). In this study, the statements served as an activator for the
underlying criteria and perceptions principals consider in regards to the behaviors of an
effective principal. The results of this study were reportedly limited due to the sampling
method and size (30 administrators), both of which prevented the findings of the
perspectives of principals to be generalized (Provost, p.115). Provost focused on the
leadership behaviors of principals which were broadly defined. Participants included
principals, assistant principals, and other administrators in Massachusetts. Provost
aligned comments of the rankings by factor and factor members adding depth to data
interpretation.
As stated earlier, empirical support for distributed leadership is lacking (Harris,
2007) primarily due to only being in existence for the last decade. However, there have
been recent advances by Hulpia, Devos, and Rosseel (2009) with the development of the
Distributed Leadership Inventory (DLI). Hulpia et al. investigated the distribution of
leadership among principals, assistant principals, and teacher leaders in large secondary

39
schools using an inventory that was developed specifically for their research study. In
their work they sought to accomplish three goals: (1) examine the theoretical framework
of distributed leadership with the development of the DLI; (2) describe the validation and
reliability of the scores from the DLI; and, (3) use the results from the DLI to describe
and analyze the perceptions of teachers, teacher leaders, assistant principals, and
principals on distribution of leadership tasks in large secondary schools.
The DLI was developed and evaluated for the purpose of investigating
“leadership team characteristics and distribution of leadership functions between formally
designed leadership positions in large secondary schools.” Hulpia et al. (2009) state that
the DLI questionnaire, which contains 23 statements, “measures the perceived quality of
leadership and the extent to which leadership is distributed” (p. 1014). The DLI breaks
distributed leadership into the leadership functions of the leadership team members and
the characteristics of the leadership team (Hulpia et al.).
Hulpia et al. (2009) state in their research that the development of the DLI was in
response to their perceived need for a quantitative tool to assess distributed leadership,
specifically in large secondary schools. For questions regarding leadership functions,
respondents were required to rate the individual functions of the principal, assistant
principals, and teacher leaders based on a five-point Likert scale ranging from never (a
zero rating) to always (a four rating). Hulpia et al. developed 10 questions on the DLI
pertaining to leadership functions which are based on the research studies of De Maeyer,
Ryamenans, Van Petegem, van den Bergh, and Rijlaarsdam (2007), Hoy and Tarter
(1997), and Leithwood and Jantzi (1999). The scales used in the questionnaire on
leadership functions formed a two-component model that included support and

40
supervision. There are 13 questions on the DLI pertaining to leadership characteristics
which are also based on a five-point Likert scale, ranging from strongly disagree (a zero
point rating) to strongly agree (a four point rating). The questions related to leadership
characteristics [were based on the works of Litwin and Stinger (1968), Rizzo, House, and
Lirtzman (1970); and Staessens (1990)] resulted in a one-component model. According
to the authors this component represented a coherent leadership team (Hulpia et al.).
Although admittedly this study has its limitations, there was enough empirical evidence
for Hulpia et al. to conclude that an “adequate” questionnaire was developed to
investigate distributed leadership in schools or in organizations.
For this particular study, the Q-sorting activity requested that participants
prioritize distributed leadership statements. To accomplish this prioritization task,
participants relied on some subjective set of predilections and aversions using their belief
and value systems. According to Stephenson (1953, p. 285), “Beliefs and values provide
explanations of factors, and may reach into ego dynamics and other schemes for their
theoretical substance.” By sorting the leadership statements, participants revealed their
perspectives about effective leadership attributes of special education leaders and the
ones they value the most as well as least. Furthermore, comparisons have been drawn
between the two groups of participants.
The sorts provided important information on which leadership statements were
ranked positively, neutrally, and negatively among the participants. The qualitative data
served as a ‘safety net’ by allowing the researcher to label perspectives that were revealed
with the sorting and comparing of the participants’ own statements, thus providing an
explanation to why they sorted the statements as they did. As a result, this process

41
ensured that labels were not only connected to the correlations between sorts but also to
the participants’ statements about the sorts. A schematic diagram of the steps of the Q-
sort process (Provost, 2007) is displayed in figure 3.1 below:
Figure 3.1 Q-sort Process: A Schematic Diagram (Provost, 2007 p. 47)
Research Questions
The primary purpose of this research is to develop a stronger understanding of the
distribution of leadership tasks by leaders of special education. This study investigated
leadership practices through the quantitative analysis of the Q-sort data by determining
the priority given to each statement ranking by special education administrators and
special education teacher leaders. In addition, rankings from the Q-sort were used to
further describe the relationship of the Q-factors to demographic and district
characteristics. The qualitative analysis of the personal interview processes with the
participants regarding their sorting rationale and behaviors were used to describe attitudes
or perspectives of the behaviors of effective leaders of special education. This research
contributes to identifying future research needed to expand the understanding of
distributed leadership practices in the field of special education, in addition to drawing
conclusions regarding the current state of these leadership practices. The research
questions that guided this investigation included:
Collection of quantitative and qualitative data
Factor analysis of Q-sorts: Identification and tentative labeling of factors
Comparison of tentative labels to qualitative statements of participants
Finalization of “grounded” description of factors
Application to research questions

42
1. Are there any clusters of participants who ranked the leadership statements
similarly and differently?
2. Are the clusters related to demographic or personal characteristics
associated with the participants?
3. Were there similarities as to how the items were ranked by the participants
among the clusters?
4. Are there themes depicting the clusters based on the statement rankings?
5. To what extent is there a relationship between the cluster composition,
demographic, and district variables?
It is the hope that other educators will find the results described in this study insightful
and relevant in their own practices.
Definitions
The term “teacher leader” is well rooted in the traditional roles in public
education that can include team leaders, department chairs, curriculum developers, and
peer mentors/coaches (Murphy, 2005). Silva et al. (2000) described the development of
teacher leadership in three distinct waves. The third and latest wave of teacher leader
responsibilities include redesigning schools, engaging in the problem solving process at
the building level, mentoring new teachers, and providing meaningful professional
growth activities for colleagues (Darling-Hammond et al., 1995; Billingsley). This
newest wave of development of teacher leadership is based on the values of
professionalism, collegiality, and collaboration (Silva et al., 2000). For the purpose of
this paper, special education teacher leaders are defined as special educators that serve as

43
building liaisons, department chairs, and/or team leaders at the district or building base
level whose responsibilities are aligned with the core principals of the third wave of
teacher leaders described (Silva et al., 2000). The values of professionalism, collegiality,
and collaboration identified in the third wave are critical to improving teacher instruction,
student programming, and student achievement. The title of the teacher leader positions
were secondary to the responsibilities mentioned.
Approximately 30 years after the passage of the Education for All Handicapped
Children Act of 1974 (P.L. 94-132, EAHCA), the special education administrator’s
traditional role of ensuring compliance with federal and state law remains critical,
especially as the laws have strengthened (Crockett, 2002). A special education
administrator is an educational leader who determines and articulates the educational
standards and goals for special education programs to special educators through
collaborative efforts that lead to enhanced opportunities for individuals with exceptional
learning needs (CEC, 2009b). Special education administrators are expected to lead
district wide initiatives such as the introduction of positive behavioral improvement
supports, response to intervention, and student progress monitoring as schools become
more inclusive and increasingly more collaborative (Boyer & Lee, 2001; Walther-
Thomas, Korinek, McLaughlin, & Williams, 2000). Special education administrators’
responsibilities also commonly include mediation and due process hearings, out of
district placements, and issues involving suspension/expulsion, in addition to the daily
responsibilities of managing or supervising special education staff (i.e. teachers,
paraprofessionals, related service providers, etc.) and programs. In addition, it is not
uncommon for special education administrators to be responsible for section 504 in their

44
respective districts; however, this does give the misperception that section 504 is a
special education mandate when indeed it is a civil rights law (Yell, 2006b).
In circumstances in which the responsibilities of some participants resulted in
difficulty differentiating their formal role as a teacher leader or an administrator, the roles
of these participants were identified by their contractual status as a teacher or as an
administrator.
Participants
Similar to Johnson (1993), Militello and Janson (2007), and Provost (2007) the
selection of participants in this Q methodology was nonrandom. This research
investigated the subjectivity of special education leaders with respect to the roles of
special education teacher leaders and special education administrators. In Q
methodology, participants are viewed as variables rather than sample items. Q
methodology does not require a random participant sample because the objective is to
intentionally access a range and diversity of pertinent attitudes and perspectives on the
topic being investigated (Brown, 1980). The participants were selected from
Massachusetts school systems for two reasons. The first and most important reason is
Massachusetts has a high standard for licensing administrators of special education. As a
result, selecting participants from Massachusetts compared to other states increases this
study’s validity. Massachusetts is the only state that incorporates the six CEC
Administrator of Special Education Standards along with requiring a Master’s degree,
prior teaching and special education teaching experience, completion of a practicum; as
well as course work in special education, special education administration, and education
administration (Boscardin, Weir, & Kusek, 2010). It is essential to the quality of this
45
study that the participants had prior relevant experience in the field of special education
along with meeting the requirements of Highly Qualified such as in Massachusetts.
Secondly, Massachusetts requirements for licensure of special education administrators
include having at least an initial license in a specialized educational role and three full
years employment in an educational setting (Massachusetts Department of Education,
2003).
A non-random sample of 15 special education administrators and 15 special
education teacher leaders were selected to sort the statements. The researcher selected 5
special education administrators whose districts are currently making AYP for both Math
and English Language Arts (ELA), along with 4 special education teacher leaders whose
schools are currently making AYP for both Math and ELA, as defined by state
standardized test scores. An additional 10 special education administrators and 11
special education teacher leaders were selected whose districts/schools are labeled as
underachieving in either Math or ELA or both. There were a total of 8 special education
administrators that worked in districts that achieved AYP for the aggregate. However,
three districts failed to make AYP because of the MCAS scores of their subgroups.
Additionally, there were a total of 6 special education teacher leaders that worked in
districts that achieved AYP for the aggregate. Two of these districts also failed to make
AYP due to the scores of their subgroups. There was one additional teacher leader and
special education administrator that worked in districts that made AYP for the aggregate
only in the area of ELA. Overall, there were 9 participants total that work in districts that
achieved AYP for both ELA and math, 7 additional participants that worked in districts

46
that achieved AYP for both ELA and math for the aggregate only, and 12 participants
that worked in districts that did not achieve AYP status in any area.
This sample size afforded the researcher the opportunity to understand the role of
special education leaders from a variety of perspectives in the achievement era. From a
theoretic perspective, the sample size included special education administrators and
special education teacher leaders working in school districts. The Q methodology is
often criticized because of sample size referring to number of participants taking the Q
sort; however, the structure of the sample usually allows for the possibility of explanation
of any data that may be accumulated (Brown, 1980, p.173-174). Brown states only a few
participants are required (e.g., in the range of thirty participants) in Q methodology.
There needs to be enough to establish the existence of a factor for the purposes of
comparing one factor to another (Brown, p. 192). Years of experience working in the
role of special education administrator will likely vary among participants as some
special education administrators have entered administration through various
administrative programs and certification procedures. For this study, the researcher
defined ‘special education administrator’ as the person that oversees the school district’s
special education programs and assists with program administration to ensure the quality
of special education services to students with disabilities and their families, and work
with teachers in the education process (CEC, 2009b).
The researcher defined ‘special education teacher leader’ as a person whose
responsibilities include navigating the structures of schools, nurturing relationships,
modeling professional development, encouraging effective change, and challenging the
status quo for positive results (Silva et al., 2000). Special education teacher leaders serve

47
as building liaisons, department chairs, and/or team leaders at the building base or district
levels. Two of the teacher leader participants in this study served their role at the district
level. As a result, the data in table 3.2 is displayed for 13 special education teacher
leaders in the categories of school enrollment, free and reduced lunch, and school AYP
status. In this study, special education teacher leaders must have held a current
Massachusetts educator license in an area of special education (i.e., Teacher of Students
with Moderate Disabilities, 5-12) indicating the participants have demonstrated
competence in field of special education by meeting the subject matter knowledge
requirements of the Massachusetts Department of Education along with acquiring the
needed pedagogical skills and knowledge through the completion of an approved teacher
preparation program (Massachusetts Department of ESE, 2010). As a result of meeting
these licensure requirements, the participants fulfilled their responsibilities to meet the
Massachusetts Professional Standards for Teachers. In addition, years of experience
working in the role of special education teacher leader varied among participants. Thus,
this information allowed the researcher to access differences based on years of
experiences.
Background information on the participants and their districts was collected in
variety of methods that included a participant demographic questionnaire, the
Massachusetts Department of Education website, and the participants’ school and district
websites. Tables 3.1 and 3.2 indicate the specific location for obtaining each datum. The
characteristics of the participants’ gender, age, ethnicity, years in current position,
teaching experiences, number of years in the position, student enrollment, school district
48
enrollment, certification level, and education for both special education administrators
and special education teacher leaders are also documented in tables 3.1 and 3.2.
For the purpose of this study, gender is defined as either male or female. Age is
indicated by “year of birth”. Classification for ethnicity included the following ethnic
backgrounds: African-American or Black, Asian, Hispanic or Latino, Multi-race (Non-
Hispanic), Native American, Native Hawaiian or Other Pacific Islander, or White. The
vast majority of participants, 29 out of 30, were of the White background. Although the
researcher would have liked to have a sample containing diversity, the reality is that
diversity is nonexistent in the profession of special education. A statistical profile
conducted by Bergert and Burnette (2001), reported that 87% of females and 80% males
enrolled in special education teacher preparation programs were white. In addition,
Bergert and Burnette reported that the ratio of males to females enrolled in special
education teacher preparation programs was 1:6.
The category of years in the position was defined as the number of years that the
special educator leader had been employed as either as special education administrator or
special education teacher leader including years worked in the position of special
education administrator or special education teacher leader in another school district prior
to participation in the study. The majority of special education teacher leader participants
were employed at the secondary level. This is attributed to a lack of leadership
opportunities at the elementary school level. The 15 participants in the special education
teacher leader category represented 10 school districts. Only one of the districts offered
an elementary leadership position at the building base level. Teaching experience is
defined as number of years accumulated at the pre-school, elementary, secondary, and

49
post secondary levels in both general and special education. Educational level is defined
as participants holding the maximum level of education (e.g. a bachelor’s degree, a
master’s degree, a master’s degree plus 30 credits, a doctorate degree). Levels of current
licensures included all licenses held by participants at the time of their participation in the
study.
District data was gathered from the school district profiles on the Massachusetts
Department of Education website. Following the organizational characteristics described
by the Massachusetts Department of Education, the type of district will be classified as:
institutional school, county agricultural, independent public, independent vocational,
local school, regional academic, or regional vocational tech. Student enrollment is
reported as greater than or less than 3,000 as opposed to the district’s actual enrollment.
School district profiles on the Massachusetts Department of Education provides actual
enrollment. In addition, special education enrollment for districts is reported. This
serves as a preventative measure to conceal the identity of the actual school districts and
schools that participated in the study and to protect and to honor the confidentiality of the
participants. In addition, the Massachusetts Department of Education provides certain
demographic information. Tables 3.1 and 3.2 below outline the comparisons between
each district’s AYP status along with per pupil expenditures and per pupil special
education expenditures. According to the Massachusetts Department of Education, the
2009 state average per pupil expenditure was $13,006 with 20.1 percent of total school
district budgets being occupied by special education expenditures. Participants’ per pupil
expenditures and per pupil special education expenditure percents from their districts are
shared (although participant and district identities remain concealed) which allowed for

50
comparisons to be drawn. District pupil expenditures and percents for general and
special education students were collected from the Massachusetts Department of
Education website. In addition, the percentages of students receiving free or reduced
lunch were taken from the 2010-2011 school district directory profile information that is
located on the Massachusetts Department of Education’s website.
The district level student achievement data is reported in terms of the
Massachusetts Comprehensive Assessment System (MCAS) scores, which is a measure
of the distribution of student performance relative to achieving proficiency. The MCAS
scores are artifacts that are used to measure AYP (Adequate Yearly Progress) for each
school and district in Massachusetts. The MCAS was designed to meet the requirements
of the Education Reform Law of 1993 for school law in Massachusetts. In addition, the
MCAS meets the participation requirements for state standardized testing of No Child
Left Behind 2001. MCAS is administered to students in grades three through eight, and
grade 10 to evaluate their knowledge in the content areas of English Language Arts,
Math, and Science. In order for students to earn a high school diploma, they must earn a
passing score in each of the three areas before they graduate 12th
grade.

51
Table 3.1
Characteristics of Special Education Administrator Participants
Background
Information
Group Number of
Participants
% of
Participants
Current Position
N=15
District SPED Administrator 12 80%
Elementary SPED Administrator 1 7%
MS SPED Administrator 1 7%
K-8 SPED Administrator 1 7%
HS SPED Administrator 0 0%
Gender
N=15
Male 5 33%
Female 10 67%
Years in Current Position
N=15
Less than 5 years 6 40%
5 or more years 9 60%
Level of Education
N=15
Master 5 33%
Master +30 9 60%
Doctorate 1 7%
Teaching Experience
N=15
Elementary 9 60%
Secondary 10 67%
Both elementary and secondary 4 27%
General education only 4 27%
Special education only 13 87%
General and special education 3 20%

52
Background
Information
Number of
Participants
% of
Participants
Age
N=15
20-30 0 0%
31-40 3 20%
41-50 5 33%
51-60 7 47%
Ethnicity Hispanic/Latino 1 7%
White 14 93%
District Enrollment
N=15
> 3,000 student enrollment 8 53%
< 3,000 student enrollment 7 47%
> 17% (state average) special education
student enrollment
10 67%
< 17% (state average) special education
student enrollment
5 33%
School Enrollment
N=3
> 400 student enrollment 2 13%
< 400 student enrollment 1 7%
Expenditures
N=15
> $13,055 (state average) Per Pupil
Expenditures
7 47%
< $13,055 (state average) Per Pupil
Expenditures
8 53%
> 20.1% (state average) SPED
expenditures as a percent of Total
School Budget
13 87%
< 20.1% (state average) SPED
expenditures as a percent of Total
School Budget
2 13%

53
Background
Information
Number of
Participants
% of
Participants
Free and Reduced Lunch
N=15
> 34.2% (state average) of district
population
5 33%
< 34.2% (state average) of district
population
10 67%
Student Achievement
N=15
AYP District ELA 5 33%
Non-AYP District ELA 10 67%
AYP District Math 5 33%
Non-AYP District Math 10 67%
AYP District ELA & Math 5 33%
District Aggregate AYP ELA 9 60%
District Aggregate AYP Math 8 53%
Table 3.2
Characteristics of Special Education Teacher Leader Participants Background
Information
Group Number of
Participants
% of
Participants
Current Position
N=15
ES Special Education TL 1 7%
K-8 Special Education TL 1 7%
HS Special Education TL 11 73%
ES & Secondary SPED TL 1 7%
District Special Education TL 1 7%
Gender
N=15
Male 7 47%
Female 8 53%
Years in Current Position
N=15
Less than 5 years 6 40%
5 or more years 9 60%

54
Background
Information
Number of
Participants
% of
Participants
Level of Education Bachelor 1 7%
N=15 Master 4 27%
Master +30 11 73%
Doctorate 0 0%
Teaching Experience
N=15
Elementary 5 33%
Secondary 14 93%
Both elementary and secondary 4 27%
General education only 1 7%
Special education only 8 53%
General and special education 6 40%
Age
N=15
20-30 1 7%
31-40 5 33%
41-50 7 47%
51-60 2 13%
Ethnicity
N=15
Hispanic/Latino 0 0%
White 15 100%
District Enrollment
N=15
> 3,000 student enrollment 8 53%
< 3,000 student enrollment 7 47%
> 17% (state average) special education
student enrollment
11 73%
< 17% (state average) special education
student enrollment
4 27%

55
Background
Information
Number of
Participants
% of
Participants
School Enrollment
N=13
> 1,000 student enrollment 7 54%
< 1,000 student enrollment 6 46%
> 17% (state average) special education
student enrollment
10 77%
< 17% (state average) special education
student enrollment
3 23%
Expenditures
N=15
> 20.1% (state average) SPED
expenditures as a percent of Total
School Budget
12 80%
< 20.1% (state average) SPED
expenditures as a percent of Total
School Budget
3 20%
Free and Reduced Lunch
N=13
> 34.2% (state average) of school
population
5 38%
< 34.2% (state average) of school
population
8 62%
Free and Reduce Lunch
N=15
> 34.2% (state average) of district
population
6 40%
< 34.2% (state average) of district
population
9 60%
Student Achievement
N=13
AYP School ELA 5 38%
Non-AYP School ELA 8 62%
AYP School Math 4 31%
Non-AYP School Math 9 69%
AYP School ELA & Math 4 31%
School Aggregate AYP ELA 7 54%
School Aggregate AYP Math 6 46%
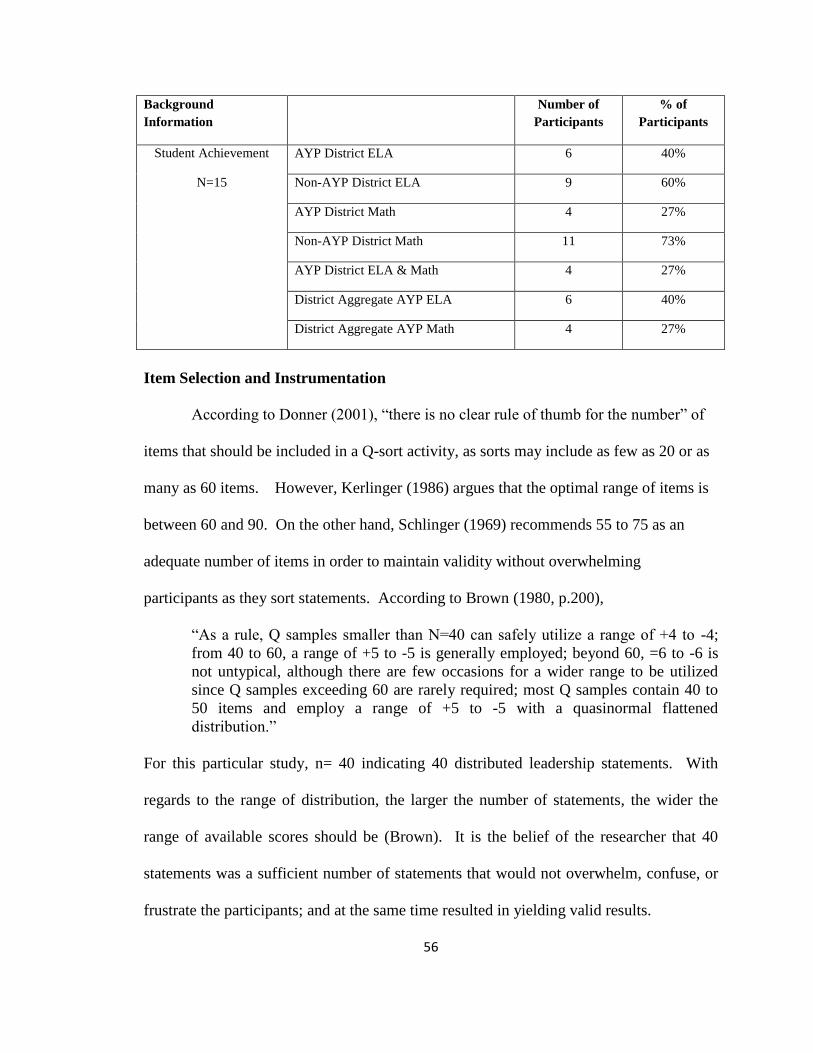
56
Background
Information
Number of
Participants
% of
Participants
Student Achievement AYP District ELA 6 40%
N=15 Non-AYP District ELA 9 60%
AYP District Math 4 27%
Non-AYP District Math 11 73%
AYP District ELA & Math 4 27%
District Aggregate AYP ELA 6 40%
District Aggregate AYP Math 4 27%
Item Selection and Instrumentation
According to Donner (2001), “there is no clear rule of thumb for the number” of
items that should be included in a Q-sort activity, as sorts may include as few as 20 or as
many as 60 items. However, Kerlinger (1986) argues that the optimal range of items is
between 60 and 90. On the other hand, Schlinger (1969) recommends 55 to 75 as an
adequate number of items in order to maintain validity without overwhelming
participants as they sort statements. According to Brown (1980, p.200),
“As a rule, Q samples smaller than N=40 can safely utilize a range of +4 to -4;
from 40 to 60, a range of +5 to -5 is generally employed; beyond 60, =6 to -6 is
not untypical, although there are few occasions for a wider range to be utilized
since Q samples exceeding 60 are rarely required; most Q samples contain 40 to
50 items and employ a range of +5 to -5 with a quasinormal flattened
distribution.”
For this particular study, n= 40 indicating 40 distributed leadership statements. With
regards to the range of distribution, the larger the number of statements, the wider the
range of available scores should be (Brown). It is the belief of the researcher that 40
statements was a sufficient number of statements that would not overwhelm, confuse, or
frustrate the participants; and at the same time resulted in yielding valid results.

57
In this study, the researcher incorporated items used in surveys and previous Q-
sorts (Johnson, 1993; Militello and Janson, 2007; Provost, 2007; Hulpia et al., 2009;
Mosley, 2011) to investigate the relationship between special education administrators
and special education teacher leaders. The researcher analyzed how leadership is
perceived among special educator leaders within school districts by having the
participants complete a Q-sort ranking the items representing distributed and
collaborative forms of leadership from “most necessary to the job as an effective leader
of special education” to “least necessary to the job as an effective leader of special
education”. The statements were generated from the DLI (Hulpia et al.) and from
statements in the work of Militello and Janson. Twenty-three of the statements were
generated from the DLI which represent the DLI in its entirety. Hulpia et al. report in
their research on the development of the DLI that the scores revealed internal-consistency
reliability estimates greater than .79.
The work of Militello and Janson (2007) produced 45 concourse statements
investigating how school counselors and principals perceive their professional
relationship through the lens of distributed leadership. In this study, the 45 statements
from work of Militello and Janson were reduced to 26 statements. Some statements were
eliminated because they specifically address the roles of school counselors and/or
principals and thus, irrelevant for the purpose of this study (e.g., Statement #5: The
principal’s understanding of the national model for school counseling programs
facilitates the relationship between the school counselor(s) and the principal.). The
additional statements were eliminated due to presenting a negative connation (e.g.,
Statement #4: It is almost as if the school counselor role and the principal role are

58
Table 3.3 Distributed Leadership Inventory (DLI) by Hester Hulpia, Geert Devos, and Yves Rosseel (2009)
Statements #1-23 generated from the Distributed Leadership Inventory (DLI) by Hester Hulpia, Geert
Devos, and Yves Rosseel (2009)
DLI: Coherent Leadership Team #1-10
1. ensure there is a well-functioning leadership team
2. ensure the special education leadership team behaves professionally
3. ensure the leadership team supports the goals we like to attain
4. ensure all members of the leadership team work in the same strain on the core objectives
5. ensure the right person sits on the right place, taken the competencies into account
6. ensure members of the management team divide their time properly
7. ensure members of the leadership team have clear goals
8. ensure members of the leadership team know which tasks they have to perform
9. ensure the leadership team is willing to execute a good idea
10. ensure members of the leadership team have clear roles and responsibilities
DLI: Support #11-20
11. premise a long term vision
12. debate the school vision
13. compliment teachers
14. help teachers
15. explain reasons for constructive criticism to teachers
16. be available after school to help teachers when assistance is needed
17. look out for the personal welfare of teachers
18. encourage teachers to pursue their own goals for professional learning
19. encourage teachers to try new practices consistent with their own interests
20. provide organizational support for teacher interaction
DLI: Supervision #21-23
21. evaluate the performance of the staff
22. be involved in the summative evaluation of teachers
23. be involved in the formative evaluation of teachers
almost set up to be antagonistic.). It was anticipated that the sorting these statements
would fall in the negative continuum based solely on the semantics of the statements.
Twenty-three statements were eliminated in total for these reasons. Some of the terms
were changed in the remaining 22 statements to reflect the positions and professional
working relationships of special education teacher leaders and special education
administrators. For example, the terms school counselor(s) and principal were changed

59
to special education teacher leader and special education administrator. In addition, four
of the statements expressed two concepts and therefore were broken into two separate
statements. For example, the statement of “The principal trusts the counselor(s) enough
to make decisions and provide insight when needed.” was broken down into the
statements of “trust teachers enough to make decisions” and “provide insight to
teachers”.
Table 3.4
45 Concourse Statements from Militello and Janson (2007)
1. The counselor(s) educate(s) the principal as to what the appropriate role of what a school counselor is
based on the school counselor national model.
2. The principal makes sure that the counselor(s) has/have time to address the most important needs of
students.
3. The school counselor(s) and the principal are in agreement as to what are appropriate school
counseling responsibilities and tasks.
4. It is almost as if the school counselor role and the principal role are almost set up to be antagonistic.
5. The principal's understanding of the national model for school counseling programs facilitates the
relationship between the school counselor(s) and the principal.
6. School counselor(s) do not have the skill set or training to make decisions in and around curriculum
and instruction.
7. The principal allows the counseling department to function autonomously.
8. Administrative decisions made by the principal are often undermined by the school counselor(s).
9. The counselor(s) and the principal both understand that administrative tasks hinder the counselors’
ability to work with students.
10. The principal and the school counselor(s) work together to develop programs that can benefit
struggling students.
11. If forced to it, the principal would rather cut a teacher and increase class sizes in order to maintain an
appropriately sized school counseling department.
12. The principal acknowledges the expertise of the school counselor(s).
13. The principal trusts the counselor(s) enough to make decisions and provide insight when needed.
14. The principal and counseling roles are pretty defined, but the principal and counselor(s) are not afraid
to pitch in with each other’s jobs.
15. The principal supports the counselor(s) in developing a leadership role in the school.
16. Communication between the principal and the counselor(s) is usually informal unless it is an
important issue that requires documentation.
17. The school counselor(s) and the principal regularly discuss issues relative to the school improvement
plan.
18. The school principal and the counselor(s) communicate openly with each other.
19. School counselor(s) and the principal collaborate on both issues of professional development and
assessing instructional needs, but school counselor(s) have not been involved in any types of
discussions regarding instructional evaluation.
20. Consultation between the counselor(s) and the principal does not occur on a whole lot of issues.
21. Counselors speak with teachers about administrative matters, but as colleagues, not as an
administrator.
22. The school counselor(s) collect data on the ground and then lets the principal know about the smaller
operational things the principal isn't able to track on a daily basis.

60
23. The principal and the school counselor(s) focus on analyzing appropriate interventions to better align
action to the desired outcome and evaluating the degree to which this has been accomplished.
24. The school counselor(s) are not involved with the principal in instructional decisions or
organizational practices to support effective instruction such as tracking or not tracking students,
sequencing the curriculum, etc.
25. The school counselor(s) consult(s) with the principal in order to better understand how schools
systems operate.
26. The counselor(s) and principal both understand the importance of confidentiality.
27. The counselor(s) and the principal consult regarding the teaching that they observed in the
classrooms.
28. The principal is wary about consulting with school counselors on issues involving teachers.
29. The relationship between the principal and the school counselor(s) hinges on the belief that leadership
should be distributed.
30. The counselor(s) and principal each value the other’s tasks and responsibilities.
31. The principal is sometimes frustrated with how little the school counselor(s) share regarding student
issues.
32. The counselor(s) do(es) not consult with the principal in regard to decisions involving students unless
it is an obvious administrative decision that must occur.
33. The school counselor operates at the nexus of where administrative and instructional duties converge.
34. The principal views the school counselor(s) as providing ancillary services that only indirectly
support student learning.
35. The principal and the counselor(s) agree that counseling services should include classroom guidance
lessons.
36. The principal and the counselor(s) have different goals - the counselor(s) seek to remove barriers to
the personal and academic success of kids; the principal seeks to protect the public perception of the
school.
37. The relationship between the principal and the counselor(s) is one of interdependency.
38. If the parameters of the relationship between the principal and counselor(s) were clearer in the first
place, the relationship wouldn’t be so difficult.
39. Principal collaboration with the counselor(s) is integral to developing home-school relations -
especially with challenging students and parents.
40. The principal understands that he/she is not a school counselor and the counselor(s) understand that
they are not principals.
41. There are many facets of the school counseling and principal jobs that cannot be easily accomplished
without mutual support, advice, and understanding.
42. The principal and counselor(s) are in agreement not to involve the counselor(s) in discipline.
43. The relationship between the school counselor(s) and the principal is more friendly than collegial.
44. Given the administrative function of the principal, the relationship between the counselor(s) and the
principal is characterized by an element of fear.
45. The counselor(s) and the principal engage in specific discussions relative to closing the achievement
gaps for traditionally underserved groups of students.
All 23 statements from the DLI and the additional 26 statements from the work of
Militello and Janson (2007) produced 49 statements that were piloted before being
finalized for this study. The 49 statements generated from works of Hulpia et al. (2009)
and Militello and Janson were shared with a cohort of 8 special education leaders that are
currently enrolled in doctoral special education leadership program at the University of

61
Massachusetts, Amherst. The cohort participated in a Q-sort activity involved in the
sorting of the 49 statements listed in table 3.5 below:
Table 3.5 Distributed Leadership Statements
Sort statements from most necessary to the job as an effective leader of special education to least
necessary to the job as an effective leader of special education…
1. ensure there is a well-functioning leadership team
2. ensure the special education leadership team behaves professionally
3. ensure the leadership team supports the goals we like to attain
4. ensure all members of the leadership team work in the same strain on the core objectives
5. ensure the right person sits on the right place, taken the competencies into account
6. ensure members of the management team divide their time properly
7. ensure members of the leadership team have clear goals
8. ensure members of the leadership team know which tasks they have to perform
9. ensure the leadership team is willing to execute a good idea
10. ensure members of the leadership team have clear roles and responsibilities
11. premise a long term vision
12. debate the school vision
13. compliment teachers
14. help teachers
15. explain reasons for constructive criticism to teachers
16. be available after school to help teachers when assistance is needed
17. look out for the personal welfare of teachers
18. encourage teachers to pursue their own goals for professional learning
19. encourage teachers to try new practices consistent with their own interests
20. provide organizational support for teacher interaction
21. evaluate the performance of the staff
22. be involved in the summative evaluation of teachers
23. be involved in the formative evaluation of teachers
24. ensure that teachers have time to address the most important needs of students
25. agree with fellow leaders of special education as to what are appropriate special education teacher
responsibilities and tasks
26. allow the special education department to function autonomously
27. work together with teachers to develop programs
28. acknowledge the expertise of teachers
29. trust teachers enough to make decisions
30. provide insight to teachers
31. ensure roles within the special education department are clearly defined
32. allow some flexibility with responsibilities
33. support teacher(s) in developing a leadership role
34. routinely communicate informally to teachers
35. promote a professional collegial atmosphere
36. support open communication
37. collaborate with teachers on professional development
38. collaborate with teachers on assessing instructional needs
39. collect data on the ground to be shared collaboratively
40. assist special education teachers on analyzing appropriate interventions
41. consult with teachers
42. ensure that all staff understands the importance of confidentiality
43. consult with other district and/or school leaders on the teaching they observe

62
44. understand that the relationship with teachers hinges on the belief that leadership should be
distributed
45. appreciate the work performed and the responsibilities involved with each staff member
46. understand that the relationship with teachers is one of interdependency
47. collaborate with teachers to develop home-school relations
48. understand that there are many facets involved with special education services that cannot be easily
accomplished without the mutual support, advice, and understanding of other staff members
49. engage in specific discussions relative to closing the achievement gaps
This cohort was asked to perform two activities. First, the cohort was asked to
participate in a Q-sort of the 49 items. The participants were requested to rank the 49
distributed leadership statements from +5 (most necessary of the job as an effective
leader of special education) to -5 (least necessary to the job as an effective leader of
special education) by using the following continuum shown in figure 3.2 below:
Figure 3.2
Q-sort diagram: Special Education Leadership Cohort
-5 -4 -3 -2 -1 0 +1 +2 +3 +4 +5
Least Necessary to the job Most Necessary to the job

63
Participants were made aware that only 2 leadership statements can be assigned to
the +5 column; 3 leadership statements to the + 4 column; 4 leadership statements for the
+3 column; 5 leadership statements for the +2 column; and 7 leadership statements for
the + 1 column. In addition, participants were instructed to follow the same procedures
for the negative side of the continuum. Furthermore, 7 statements were assigned to the 0
column. This particular continuum is designed to allow for neutral sorted statements to
be categorized in the middle rather than at the extreme ends. The participants completed
the Q-sort individually but simultaneously spread out in two classrooms located on the
university campus. The researcher was present while participants completed the sorts
and provided support and clarification of directions upon request only.
Next, upon completion of the Q-sort, the participants were asked to respond to a
specific set of questions regarding the statements. The researcher presented the
participants with the follow-up questionnaire in which the participants were instructed to
complete individually. In addition, the researcher notified participants that a whole group
discussion facilitated by the researcher would take place upon completion of the
questionnaire. The participants were instructed to hold onto their questionnaires for the
follow-up discussion.
The follow-up sort questions were designed to document the participants’
thoughts behind their sorts allowing the researcher to gain the necessary insight to
improve the quality of statements to be used in this study. The purpose was to obtain
feedback from the participants about the materials and process. It was anticipated that
because the statements were generated from two separate studies on distributed
leadership that there would be some redundancy among the items. Therefore, the cohort

64
Table 3.6 Follow-up Questionnaire: Special Education Leadership Cohort
Distribution of Leadership Tasks of Administrators and Teacher Leaders of Special Education
Participant Follow-up Questionnaire
1) Please list any statements that are duplicate of each other.
2) Please list what statements should be eliminated. Briefly explain.
3) Please list what statements should be kept. Briefly explain.
4) What statements need changing (i.e. wording/language)? Please list any suggestions for changes.
was asked to identify any item redundancy to avoid unnecessary overlaps with the
statements to be used in the Q-deck for this study. Feedback was also gathered about
item clarity, accuracy, and appropriateness. Some statements were eliminated as a result
of this process, or rewritten to conform to the Q-prompt guiding the sort.
At the completion of the Q-sort activities and follow-up questionnaires, the
researcher engaged the participants in a whole group discussion regarding their sorts and
follow-up questionnaires. Feedback was taken in effort to ensure the statements were
written with clarity. Nineteen statements were eliminated during this process and 13
statements were rewritten to ensure clarity, accuracy, and appropriateness for the purpose
of this research. The term “teacher” was changed to “educator” to allow participants to
reflect on the numerous interactions that take place among multiple constituents.
Feedback from two of the participants indicated that the word “ensure” carried a negative
connation. It was suggested that for many of these statements the verb could be changed
to encourage, assist, consult, etc. However, it was determined that by changing verb

65
would result in the loss of accountability associated with the word “ensure”. As a result,
it was determined by the researcher that the verb “ensure” would remain unchanged. In
addition, some of the statements made reference to leadership team while other
statements made reference to special education leadership team. Based on feedback, any
reference to leadership team was changed to special education leadership team to
provide clarity. As a result of this process the statements were reduced from 49 to 40 to
eliminate some repetitiveness that was expressed through the follow-up questionnaires
and discussion. For example, the statements of ensure members of the leadership team
have clear roles and responsibilities and ensure roles within the special education
department are clearly defined are repetitive. Consequently, these two statements were
modified producing the one statement of provide clear roles and responsibilities to
members of the special education leadership team. Furthermore, some statements were
eliminated during the process as the researcher determined the concepts involved were
not relevant for this study (i.e., debate a long term vision). Twenty-seven of the original
49 statements shared with the cohort remained completely intact.
The final set of statements generated were modified in response to the infinitive
intentionally to obtain the participants’ perceptions of effective leadership practices of
special educators by attempting to limit personal basis that can be associated with the
participants’ current leadership position. Below in table 3.7 are the 40 distributed
leadership questions that made up the Q-sort in this study.

66
Table 3.7
Distributed Leadership Statements Sort statements from most necessary to the job as an effective leader of special education to least
necessary to the job as an effective leader of special education is to…
1. ensure there is a well-functioning special education leadership team
2. be accountable for the professional behavior of the special education leadership team
3. ensure the special education leadership team supports the district goals
4. ensure all members of the special education leadership team work in the same strand on the core
objectives
5. ensure people are assigned responsibilities based on competencies
6. ensure members of the special education leadership team divide their time properly
7. ensure members of the special education leadership team have clear goals
8. ensure members of the special education leadership team prioritize tasks they have to perform
9. ensure the special education leadership team is willing to execute a good idea
10. ensure members of the special education leadership team have clear roles and responsibilities.
11. provide feedback to educators
12. explain reasons for constructive criticism to educators
13. be available after school to help educators when assistance is needed
14. encourage educators to pursue their own goals for professional learning
15. encourage educators to try new practices consistent with their own interests
16. provide organizational support for educator interactions
17. be involved in the summative evaluation of educators
18. be involved in the formative evaluation of educators
19. provide educators with time to address the most important needs of students
20. allow the special education leadership team to function autonomously
21. work together with educators to develop programs
22. acknowledge the expertise of educators
23. trust educators enough to make decisions
24. allow some flexibility with responsibilities
25. support educator(s) in developing a leadership role
26. routinely communicate informally to educators
27. promote a professional collegial atmosphere
28. support open communication
29. collaborate with educators on professional development
30. collaborate with educators on assessing instructional needs
31. collect data on the ground to be shared collaboratively
32. assist special education educators on analyzing appropriate interventions
33. consult with educators
34. ensure that all staff understands the importance of confidentiality
35. understand that the relationship with educators hinges on the belief that leadership should be
distributed
36. appreciate the work performed and the responsibilities involved with each staff member
37. understand that the relationship with educators is one of interdependency
38. collaborate with educators to develop home-school relations
39. understand that special education services cannot be accomplished without the mutual support,
advice, and understanding of other staff members
40. engage in specific discussions relative to closing the achievement gaps

67
Procedure
In this study, special education leaders’ sorting behaviors were first observed and
then their perspectives were labeled and/or identified based on their sorts. In addition,
there were no predetermined scales for participants to rank their items high or low, nor
were participants asked to agree or disagree with any rank items in the sort. Participants
did not receive positive reinforcements for statements they agree with, nor did they
receive negative reinforcements for statements that they disagree with.
At the beginning of each special education leader session, participants were
required to read and sign the consent form (See Appendix A). Next, participants
completed 12-14 questions (depending on the information obtained from district and state
websites) providing information on their personal backgrounds (i.e. gender, age,
ethnicities, years of working as administrator, education background, etc.). The
researcher gathered the demographic information about the participants, schools and
districts prior to the sort. In the event that clarification of information was needed,
inquires were made at the time of the sort. Participants began the Q-sorting activity
following the completion of the personal background information form. Similar to the
procedure of the work of Johnson (1993), the Q statements were adapted from previous
works. The Q-sorting procedures require subjects to assign a specific number of
statements to each column as indicated by the number of the blank cells (Donner, 2001).
In Q-sort activity, the distribution of statements takes the form of a bell-shaped curve. In
addition, the researcher explained to participants how to rank the 40 distributed
leadership statements from +5 (most necessary to the job as an effective leader of special

68
education) to -5 (least necessary of the job as an effective leader of special education) by
using the following continuum shown below:
Figure 3.3
Q-sorting Diagram
-5 -4 -3 -2 -1 0 +1 +2 +3 +4 +5
Least Necessary to the job Most Necessary to the job
For instance, participants were made aware that only 1 leadership statement could
be assigned to the +5 column; 2 leadership statements for the +4 column; 3 leadership
statements for the +3 column; 4 leadership statements for the +2 column; and 6
leadership statements for the +1 column. Participants followed the same procedures for
the negative side of the continuum. In addition, 8 leadership statements were assigned to
69
the 0 column. This particular continuum was designed to allow for neutral sorted
statements to be categorized in the middle rather than at the extreme ends. Next, the
participants responded orally to follow-up sort questions that were designed to document
the participants’ thoughts behind their sorts.
The researcher was present while participants completed the sort and provided
support and clarification of directions. The researcher took precaution not to influence
participants’ answers and only answered clarifying questions when needed or upon
request. On average, participants needed 45 minutes to complete all of the required tasks
in the study. Copies of all printed materials that were given to the participants are located
in Appendix A of this study.
Following the completion of the Q-sort activity, each participant participated in a
structured interview. The follow-up questions allowed the researcher to gather
qualitative data on 1) the participants thought process in regards to completing the sorts,
2) the strategies participants utilized to rank the distributed leadership statements, 3) any
particular difficulties with ranking of the statements, and 4) issues or thoughts that arose
while completing the Q-sort activity. The interview contained questions that captured the
participants’ thought process involved with the Q-statements rankings and the process of
prioritizing the distributed leadership tasks during the sorts. An essential component of
the follow-up interview was to gather qualitative data on the participants’ explanation
(Brown, 1980) as to why they ranked specific statements most and least necessary as en
effective leader of special education (see appendix). The interviews combined with the
rankings provided insight into the participants’ attitudes and perspectives (Brown, 1980)
and helped to establish areas of need for professional development (i.e. mentoring). The

70
participants answered the questions with the researcher present. However, the researcher
was only present to provide clarification and support, but not to influence the
participants’ responses. The follow-up questions are listed below:
Table 3.8 Q-sort Follow-up Questions
1) Briefly describe what went into your choices of statements that are “most necessary to the job as
an effective leader of special education?(+4’s and +5).
Please list the one statement in the +5 column and your reasons for placing it there.
2) Briefly describe what went into your choices of statements that are “least necessary to the job as
an effective leader of special education? (-4’s and -5).
Please list statement in the -5 column and your reasons for placing it there.
3) If there were other specific statements that you had difficulty placing, please list the number of the
statements and describe your dilemma.
4) What other issues/thoughts emerged for you while sorting the cards?
5) Describe how you arrived at your overall most important statements of the job as an effective
leader of special education regarding the distribution of leadership tasks/responsibilities?
6) Describe how you arrived at your overall least important statements of the job as an effective
leader of special education regarding the distribution of leadership tasks/responsibilities?
7) What factor(s), e.g., time, resources, your own knowledge, your skills, and/or your dispositions,
contributed most to the sorting through the distributed leadership statements? Please give specific
examples for each if applicable.
Data Analysis
Participants were asked to rank 40 distributed leadership statements. In addition,
the researcher compared participants’ sorts to determine whether there were themes,
patterns, and/or differences among them. As a result, the researcher was able to make
inductions based on the participants’ sorts. For example, the researcher was able to
determine whether participants sorted statements in a random manner or whether there
were clusters of participants who produced identical sorts, which would indicate shared

71
perspectives about leadership attributes. This process allowed the researcher to make
generalizations on the participants’ sorts.
The qualitative data collected through the use of follow-up interviews with the
participants allowed for the description of each group’s attitudes or perspectives of the
behaviors they envisioned of effective special education leaders. The pre-sort
questionnaires collected important demographic and district data. Rankings from the Q-
Sort data were used to assist with the description of the relationship of the demographic
and district characteristics, and comparisons were also drawn here.
Analyzing both the qualitative and quantitative data revealed the presence of
valued distributed leadership attributes; ranked categories for special education
leadership qualities; and essential leadership qualities special education administrators
possess when distributing leadership tasks through their school districts. Participant’s
responses from the above questions provided further details into the manner in which
they value leadership attributes. When discrepancies were present in the data, the
researcher analyzed and explained the anomalies by using multiple methodologies.
Throughout the study, qualitative and quantitative data was collected simultaneously, but
analyzed at different stages throughout this process. The quantitative methods were
essential with establishing meaning with regards to the sorting. Through the analysis of
correlations, the researcher was able to identify the sorting patterns or themes of
participants.
The computer software, (Statistical for the Social Sciences) SPSS was used to
analyze the results of the participants’ sorts. First introduced in 1968, SPSS is widely
used in the field of social science, statistics, and mathematics. Its statistic software
72
includes descriptive statistics, bivariate statistics, prediction of numerical outcomes, and
prediction of identifying groups. For this particular study, the SPSS method was useful
in creating several descriptive statistics to evaluate the study’s data. For example, this
software is capable to produce the following: 1) the mean rank 2) factors 3) correlations,
and 4) z-scores. As a result, the mean rank of each distributive leadership statement was
calculated to determine the extent to which the participants, as a cluster, perceived each
statement as being characteristic of an effective attribute of special education leaders.
Finally, the correlations among the sorts were calculated and factors were monitored and
extracted from the data. Z-scores were calculated for leadership statements through the
use of factor analysis.
A correlation matrix was constructed to determine the extent of similarities
between the different sorts. In summary, the correlation matrix searched for consistency
within the clusters of participants. In addition, correlations that exceed two times the
standard error in either direction are significant (Brown, 1992). The estimate for the
standard error is 1N, where N is the number of statements (N=40 in this case). As a
result, the value is 140= 1/(6.71)= .15. Statistically, alike correlations suggest that
similarity in the sorts among the participants cannot be explained by random variations
and thus, the participants hold similar perspectives about the most and least important
attributes necessary to the job of effective leader leaders of special education.
Conversely, statistically different correlations are interpreted as dissimilarities among
sorts of the two participants and therefore cannot be explained by random variations
resulting in the participants having differing perspectives on attributes of effective special
education leaders.

73
Factor analysis is a well accepted method for reducing the multiplicity of tests,
variables or other entities and is used by researchers to explore the underlying latent
variables that make up a certain construct and with analyzing two-dimensions or modes
(Kerlinger 1986; Gorsuch, 1983; VandenBosch, 2001). Using the principal components
method, factors were extracted and the eighenvalues for each of the components were
compared to determine the number of components to carry out the analysis. The
principal components method is commonly used in empirical applications as an
‘aggregating technique’ and can be described as “a pure data reduction technique that
seeks linear combinations of the observed indicators” designed to replicate as closely as
possible the original variance (Krishnakumar and Nagar, 2008). The factor analysis
identified clusters of participants who sorted the distributed leadership statements
similarly in a way that separated themselves from the rest of the participants’ sorts as to
represent common perspectives about the leadership attributes of special education
leaders. Additionally, the factor analysis identified patterns of magnitude in the
correlation matrix among sorts. A scree plot was constructed to determine the number of
factors and the strength of each factor that contributed to the variance observed in sorts.
Once constructed, the scree plot illustrated the factors that were present prior to the break
or elbow that is formed in the line. In summary, the scree provided a visual of the
significant eigenvalues that resulted in indentifying factors compared to the remaining
eigenvalues that are insignificant and fail to identify factors.
The calculated principle component scores will be used to determine leadership
statement rankings of items within each factor. Statements ranked least necessary to the
job of an effective leader of special education (-5), neutral (0), and most necessary to the
74
job of an effective leader of special education (+5), will be closely examined to determine
whether there are any commonalities among the statements at the top, in the middle, and
at the bottom that reveal possible criteria used by the participants to sort the statements.
The constant comparative method of data analysis is a popular technique used in
most qualitative methods that includes grounded theory (Merriam, 1998). This method
consists of examining ‘chunks’ of data to identify meanings or patterns that may exist
among the data. In this study, participants’ quotes from the follow-up questionnaire were
compared to the tentative labels assigned to the sorts, which allowed the researcher to
utilize grounded theory to create labels within the qualitative data. Grounded theory is a
unique approach to interpreting qualitative data (Glaser & Strauss, 1967; Merriam).
Grounded theory as prescribed by Merriam (1998), assists with the: 1)
identification of appropriate labels and/or categories for the perspective, 2) description of
the components of the labels, and 3) explanation of theory regarding the combination of
components used to create the perspective described by the labels.
Labels, Dimension, Descriptors, and Hypotheses
The purpose of creating labels is to correctly reflect specific leadership
perceptions, to include all data that is pertaining to specific distributive leadership
practices, and to take into account data that is not pertaining to specific distributive
leadership practices. In this study, the term ‘label’ maintained the same meaning as it
would in a qualitative study. For this study, the qualitative data was effectively used in
the development of dimensions because the qualitative questions are designed to force the
participants to think about their choice selections and supply the researcher with
additional information about their sorts. Appropriate labels were constructed to describe

75
the sorts, using both item rankings and the qualitative statements of participants.
Essentially, the qualitative questions asked participants to reflect about their choices in
their selections during the sorting activity. Participants’ responses provided the
researcher with details about the dimensions and their personal beliefs regarding the
important leadership qualities of distributive leadership.
Similar to labels, descriptors identify and describe concepts in data. However,
descriptors are primarily used to illustrate and/or provide descriptive details for labels.
As a result, descriptors recognize subcategories that break the labels into various parts.
The relation between descriptors and labels is comparable to the relation between
“properties” and “categories” described by Merriam (1998).
The development of hypotheses connected the dimensions to the labels and
provides a more comprehensive explanation of the subjectivity of the participants
(Merriam, 1998). The questions are designed to phase out each participant’s subjectivity
as several of the questions require the participants to elaborate on their thinking processes
that will be used during the sorting of statements. Participants’ answers were useful
when developing hypotheses about the criteria that leads to the motivation pertaining to
the placement and arrangement of the sorting of statements.
An overall framework emerged through the process of constantly comparing
incident with incident, comparing incidents with emerging conceptual categories, and
reducing similar categories into a smaller number of highly conceptual categories
(Merriam, 2003). In summary, categories can be defined as a classification of similar
concepts and serve are the foundation for generating theory through the process of coding
(Strauss and Corbin, 1990).

76
Summary
This study’s research questions are factual in addition to being viewed as
interpretive. As a result, the quantitative section of this study is used to respond to the
factual questions in relation to effective attributes of special education leaders.
Furthermore, the Q-methodology found clusters of people that demonstrate similar as
well as different responses to the distributed leadership statements. The researcher
interprets the participants’ responses in effort to establish an understanding of the
reasoning involved with their sorts and on their perspectives on special education
leadership. At the conclusion of the study, the researcher was able to develop labels for
various perspectives, explain the dimension of participants’ perspectives, determine if
participants’ sorts are similar or different based on demographic factors, and was able to
discuss the specific leadership attributes of special educators that participants’ value the
most as well as the least.
Through the use of quantitative and qualitative research methods, the researcher
investigated the preferred leadership practices of today’s special education leaders. This
study helps to understand under what circumstances special education administrators and
teacher leaders in Massachusetts may develop their leadership style and have
opportunities of growth in this area. In addition, this study outlines some of the benefits
and hindrances associated with the engagement of distributing leadership tasks. The
results provide special education leaders with some understanding of what leadership
characteristics to look for when considering professional growth and employment
opportunities. This is particularly important in the development of well-rounded
administrators in any field. In closing, chapter 3 clearly outlines the process and

77
methodology the researcher implemented to develop a better understanding of the
decision making processes of special education leaders in regards to prioritizing the daily
demands of the job within the practical world by using a variety of measurements.

78
CHAPTER 4:
FINDINGS
The results of participants’ perceptions of distributed attributes in this study are
delineated in this chapter. The research questions provide the organizational structure for
discussion about the findings in this study of special education leadership. Quantitative
and qualitative data are used to answer five research questions as well as capture the
factor member’s perspectives and comments with respect to distributed leadership
attributes. The identification of leadership attributes invoked both positive and negative
reactions from Massachusetts special education administrators and teacher leaders who
participated in the study. Using the data, it was possible to uncover salient labels and
descriptors that explain the participants’ perceptions of distributed leadership attributes
and the reasons for their decisions involved in the sorting.
Factor Membership
The data was initially subjected to factor analysis to determine if any of the
participants sorted distributed leadership attributes similarly to form distinct groups.
Using the principal component method, factors were extracted and the eigenvalues for
each of the components were compared to determine how many components to carry
forward in the analysis. Initially, participants’ sorts were plotted to illustrate similarities
and differences among the sorts (see figure 4.1). The graph shows three participants
(P12, P13, and P19) who marginally fit clusters and one participant (P27) who did not fit
into a cluster on the component plot. Participants that marginally fit clusters were
determined through visual inspection and calculation when verifying those participants
whose sum of the squared factor loadings (a²) score fell within .03, half the common

79
variance (h²/2). P12 was the only participant that had the same number of years teaching
at both the elementary and secondary levels, and was the only participant to have
administrative experience at all three levels (Pre-k, elementary, and secondary). P13 was
the youngest administrator that participated in this study. P19 was one of only two
participants that had experience teaching at the postsecondary level. P27 was the only k-
8 building based administrator in this study.
Figure 4.1
Component Plot in Rotated Space

80
The scree plot (see figure 4.2) was then used to validate that two factors or groups
of participants from the entire sample could be distinguished from the sorts of the group
as a whole and contributed to most to the variance observed in the sorts prior to the break
or elbow on the plot line. Factor A had an eigenvalue of 7.573 and Factor B had an
eigenvalue of 2.999. Factor A members recorded higher factor scores on the scatter plot
than Factor B members. This was not surprising given it was the stronger factor of the
two factors in terms of the eigenvalues. The remaining eigenvalues were insignificant, as
they did not result in identifying factors as shown by the leveling of the plot slope.
Figure 4.2
Factor Scree Plot

81
While a high number of statistically significant positive correlations were found
among the special education leaders who participated in the Q-sort, there were no
statistically significant negative correlations that exceeded the .05 levels. Correlations
that exceed two times the standard error in either direction are significant (Brown, 1996),
in this case the value is 1 # of Cards = 1/6.325 = .158. Participants associated with
Factor A generally sorted leadership statements similarly, as did the participants
connected to Factor B, resulting in each factor demonstrating significant correlations (p ≤
.05) among its group members. For example, Participants 1 and 2 had a significant
correlation, and later both were found to be members of Factor A (see table 4.1).
A “pre-flagging algorithm” developed by Schmolck (2002) was used to
determine factor membership. Two conditions had to be met for participants to be
assigned membership to a particular rotated factor: (1) a2 > h
2/2 (factor 'explains' more
than half of the common variance) where a is the factor loading and “h2”
is computed as
the sum of the squared factor loadings (a2) for the number of factors extracted (Schmolck,
2002, p.15)”and (2) a significant factor loading by participants at either the p<.01 or
p<.05. The “h²” value was computed through the extraction method of principal
component analysis utilizing SPSS software. The standard error is calculated by dividing
1 by the square root of N, where N is the number of statements/items, 1/ 40 = .158. The
value for p is then calculated by multiplying the standard error (ϭ = .158) by the selected
level of significance, +/- 2.58 for p<.01 (2.58 x .158) and +/-1.96 for p<.05 (1.96 x .158)
which equal .408 and .31, respectively. Rotation of a given number of extracted (rotated)
factors, does not change communality coefficients. For example, to be a member of
Factor A, P1 needed an a score that exceeded .31 (p<.05) and an a² that

82
Table 4.1
Correlation Matrix Between Sorts
1 100
2 36 100
3 18 19 100 4 27 31 23 100
5 12 09 30 24 100
6 34 12 20 47 27 100 7 36 03 43 23 27 45 100
8 -03 -21 10 -13 40 -02 16 100
9 31 10 23 15 29 09 -01 -01 100 10 49 31 38 42 51 52 48 05 33 100
11 09 07 35 28 39 07 15 23 -04 27 100
12 33 16 15 09 31 17 39 -01 26 39 00 100 13 31 06 25 25 37 -03 25 27 30 25 30 43 100
14 28 03 17 26 44 23 45 17 16 54 35 43 33 100
15 03 05 -13 02 29 18 11 17 -09 25 21 24 42 34 100 16 33 11 03 17 28 41 21 26 -05 14 23 26 13 52 25 100
17 54 20 02 43 05 09 34 14 25 15 -21 26 42 12 -07 09 100
18 37 27 19 55 30 48 34 -10 15 39 08 20 22 13 21 11 27 100
19 15 09 27 20 39 06 25 01 15 38 33 26 51 37 32 08 10 08 100
20 08 02 12 23 11 20 13 05 34 32 03 05 25 03 36 -10 17 47 23 100
21 47 -07 23 34 02 22 33 13 18 28 18 19 45 43 26 22 33 41 23 35 100 22 30 39 25 41 27 13 -04 05 23 32 15 34 27 02 12 09 29 26 13 25 15 100
23 -20 09 11 -05 32 18 15 20 -15 09 37 08 02 17 30 28 -45 24 -07 -02 -09 -09 100
24 15 27 21 06 25 35 33 36 07 26 18 31 11 27 35 47 -01 10 05 16 13 34 53 100 25 20 30 -11 49 30 17 -05 34 14 18 25 12 29 19 14 29 36 28 09 04 23 34 02 16 100
26 53 04 -21 39 09 48 16 -12 22 28 -08 12 15 31 26 49 43 23 20 23 29 13 -34 -01 26 100 27 25 16 -12 33 -02 39 24 02 -25 16 08 30 04 23 15 44 17 16 16 -15 10 11 29 41 19 29 100
28 39 18 -01 29 38 32 10 28 45 43 10 43 31 49 26 48 27 37 20 26 34 26 09 33 48 48 30 100
29 05 18 38 04 42 15 31 13 -01 29 22 35 23 20 17 26 -01 25 16 28 -04 17 28 19 02 01 -03 13 100 30 30 17 22 32 39 12 52 33 06 29 31 28 53 65 26 43 42 29 34 12 50 01 14 26 28 22 15 42 30 100
1 2 3 4 5 6 7 8 9 10 11 12 13 14 15 16 17 18 19 20 21 22 23 24 25 26 27 28 29 30
*Expressed in 1/100ths with values in bold indicating statistically significance at the .05 level

83
exceeded .274 or h²/2. As another example, for Factor B membership, P3 needed an a
score that exceeded .31 (p<.05) and an a² that exceeded .089 (h²/2).
In addition, there were a high number of statistically significant positive
correlations among the special education leaders that participated in this study. The
correlation matrix between sorts is illustrated in table 4.1. Statistically significant
correlations (p<.05) have been displayed in boldface type, and sorts with a negative
correlation have been italicized. The correlations validate factor or group membership.
Participants associated with Factor A generally sorted leadership statements similarly as
did participants connected to Factor B demonstrated by the significant correlations
among the group members.
Demographic Characteristics of Members
Of the thirty participants who participated in the study, sixteen participants were
members of Factor A, thirteen participants were members of Factor B and one participant
did not meet the membership conditions for either Factor A’s or Factor B’s level of
significance. Table 4.2 illustrates participant factor membership. The next step
investigates the individual special education leaders who comprised the membership for
each factor by considering the demographic composition.
Table 4.2
Factor Significance and Membership
Factor A Factor B Factor A* Factor B*
Participant # a
score
a²
score
a
score
a²
score h²/2 Membership Membership
P1: ADM, NAYP,
NFRL (.739) .546 .052 .003 .274 Member
P2: ADM, NAYP,
NFRL .331* .11 .111 .012 .061 Member

84
Factor A Factor B Factor A* Factor B*
Participant # a
score
a²
score
a
score
a²
score h²/2 Participant # a score
P3: ES TL, NAYP,
NFRL .132 .017 .399* .159 .089 Member
P4: ADM, AYP,
FRL (.661) .437 .117 .014 .226 Member
P5: ADM, NAYP,
FRL .215 .046 (.657) .432 .239 Member
P6: ADM, NAYP,
FRL (.441) .194 .313* .098 .146 Member
P7: ADM, NAYP,
FRL .335* .112 (.475) .226 .169 Member
P 8: ADM, NAYP,
FRL .064 .004 (.470) .221 .113 Member
P9: ADM, NAYP,
NFRL (.473) .224 .039 .002 .113 Member
P10: ADM, NAYP,
NFRL (.544) .296 (.454) .206 .251 Member
P11: ADM, NAYP,
NFRL .016 .000 (.597) .356 .178 Member
P12: ADM, AYP,
NFRL .393* .154 .384* .147 .151 Member
P13: ADM, AYP,
NFRL (.454) .206 .382* .146 .176 Member
P14: ADM, AYP,
NFRL .364* .132 (.601) .361 .247 Member
P15: HS TL,
NAYP, NFRL .136 .018 (.496) .246 .132 Member
P16: ADM, AYP,
NFRL .258 .067 (.525) .276 .172 Member
P17: DL TL,
NAYP, FRL (.745) .555 .182 .033 .294 Member
P18: HS TL,
NAYP, FRL (.551) .304 .232 .054 .179 Member
P19: HS TL, AYPE,
NFRL .305 .093 .357* .127 .110 Member
P20: HS TL, AYPE,
NFRL .384* .147 .113 .013 .080 Member
P21: HS TL,
NAYP, FRL (.568) .323 .196 .038 .181 Member
P22: DL TL, AYP,
NFRL (.462) .213 .129 .017 .115 Member
P23: HS TL, AYP,
NFRL .364* .132 (.706) .498 .315 Member
P24: HS TL, AYP,
NFRL .077 .006 (.643) .413 .210 Member
P25: HS TL,
NAYP, FRL (.458) .210 .186 .035 .123 Member
P26: HS TL,
NAYP, FRL (.703) .494 .073 .005 .250 Member
P27: ADM, NAYP,
NFRL .238 .057 .292 .085 .071 Non-member Non-member

85
Factor A Factor B Factor A* Factor B*
Participant # a
score
a²
score
a
score
a²
score h²/2 Participant # a score
P28: K8 TL, NAYP,
FRL (.594) .353 .358* .128 .212 Member
P29: HS TL,
NAYP, NFRL .051 .003 (.535) .286 .145 Member
P30: HS TL, AYP,
NFRL (.421) .178 (.548) .300 .239 Member
Note: The two following conditions must be met for factor membership: (1) a2 > h2/2 (factor 'explains' more than half of the common
variance located in the 6th column in the table) and (2) that a exceed .31 for the p<.05, as calculated by the +/- 1.96 times the standard
error, as denoted by (). ADM: Special Education Administrator, ES TL: Elementary special education teacher leader, K8 TL: K-8
special education teacher leader, HS TL: High school special education teacher leader, DL TL: District level special education teacher
leader, FRL: Free and reduced lunch district, NFRL: Non-free and reduced lunch district. AYP: District achieved AYP, NAYP:
District did not achieve AYP, AYPE: District achieved AYP for English Language Arts only.
Factor A demographic composition. The demographic and professional
characteristics of this group of 16 participants are shown in tables 4.3 and 4.4. Fifty
percent of the Factor A members were employed as special education administrators
while the remaining half of the 16 members were employed as special education teacher
leaders. Factor A members were equally split between males and females. The majority
of Factor A members at 56 percent had less than 5 years of experience at their current
position, which included 4 special education teacher leaders and 5 special education
administrators. Seventy-five percent held an education level beyond a master’s degree.
The remaining 25 percent included one special education teacher leader and 3 special
education administrators, all of whom held a master’s degree. In addition, 88 percent of
Factor A members had teaching experience at the secondary level, and 43.5 percent had
experience at the elementary level. Thirty-one percent of the members had teaching
experience in both special and general education; however, 25 percent were teachers
leaders as only one special education administrator held dual teaching experience in both
general and special education.

86
The majority of Factor A members, 82 percent, fell into the 31-50 age groups.
There was no significant differences in regards to age between the two subgroups,
although the youngest participant in the study was a teacher leader belonging to Factor A.
Eight-one percent of Factor A members (consisting of 7 teacher leaders and 6
administrators) worked in districts whose special education enrollment was above the
state average. Fifty percent of Factor A members were working in districts whose free
and reduced lunch populations were above the state average, which consisted of primarily
special education teacher leaders as the majority of special education administrators were
working in districts whose free and reduced lunch populations were below the state
average. Further, twenty-five percent of Factor A members were working in districts that
made AYP for both English language arts and mathematics, which included only one
special education teacher leader. Special education teacher leaders (seven of eight TLs)
also represented the majority of the sixty-three percent of Factor A members working in
districts with student enrollments greater than 3,000 students. Five out of the eight
special education administrators were working in district with student enrollments less
than 3,000 students. Factor A contained both the youngest participant (P28) as well as
the oldest participant (P25) in this study.
Factor B demographic composition. The demographic and professional
characteristics of this group of 13 participants are shown in tables 4.3 and 4.4. Factor B
members comprised of 46 percent of special education administrators and 54 percent of
special education teacher leaders. Seventy-seven percent were females with an
equivalent percent having more than 5 years experience in their current position. Fifty-
four percent of Factor B members held an education level beyond a master’s degree. In

87
addition, there was very little variability between teacher leaders and administrators in
the areas of gender, years in current position, and level of education.
Fifty-four percent of Factor B members had experience teaching at the elementary
level and 69 percent had experience at the secondary level. However, there were vast
differences between teacher leaders and administrators as 83 percent of administrators
had teaching experiences at the elementary level and 50 percent at the secondary level,
whereas, eighty-six percent of teacher leaders had teaching experiences at the secondary
level and 29 percent at the elementary level. Furthermore, 54 percent of Factor B
members had teaching experience only in special education with another 46 percent
having experience in both general and special education. There were twice as many
teacher leaders than administrators with experiences in both general and special
education. The majority of Factor B members fell into the 41-60 age groups at 84
percent with the majority teacher leaders falling into the 41-50 age group, and the
majority of administrators falling into the 51-60 age group.
Thirty-one percent of Factor B members represented school districts whose free
and reduced lunch populations are above the state average. The administrators were split
equally between school districts that were above and below the state average. In
comparison, the majority of teacher leaders worked in school districts whose free and
reduced lunch populations were below the state average. Sixty-two percent of Factor B
members worked in school districts whose special education populations were above the
state average with insignificant differences between teacher leaders and administrators.
Thirty-eight percent of Factor B members worked in districts with student populations
greater than 3,000 students which is represented by the majority of administrators (four

88
out of six) as the majority of teacher leaders (six out of seven) worked in school districts
with populations less than 3,000 students. Thirty-eight percent of Factor B members,
representing 2 administrators and 3 teacher leader teachers, worked in districts that
achieved AYP for both English language arts and mathematics. All five members
worked in districts whose free and reduced lunch populations were below the state
average. In comparison, the remaining eight Factor B members consisted of three special
education leaders working in districts whose free and reduced lunch populations were
above the state average.
Factor B included the one participant (P16) holding a doctorate degree and the
one minority participant (P8) in this study. P16 also was the only participant to have
more general education administrative experience (15 years) than special education
administrative experience (6 years). In addition, P8 was the only participant to hold an
administrative position in a related service area (speech and language) in special
education.
Table 4.3 Demographic Information from Factor A and Factor B
Factor A Factor B
N= 16 % N= 13 %
Current Position Special Education Teacher
Leader
8 50% 7 54%
Special Education Administrator 8 50% 6 46%
Gender Male 8 50% 3 23%
Female 8 50% 10 77%

89
Factor A Factor B
N= 16 % N= 13 %
Years in Current
Position Less than 5 years 9 56% 3 23%
5 or more years 7 44% 10 77%
Level of
Education
Bachelor 0 0% 1 8%
Master 4 25% 5 38%
Master +30 12 75% 6 46%
Doctorate 0 0% 1 8%
Teaching
Experience
Elementary only 2 12.5% 4 31%
Secondary only 9 56% 6 46%
Both elementary and secondary 5 31% 3 23%
General education only 1 6% 0 0%
Special education only 10 62.5 7 54%
General and special education 5 31% 6 46%
Free and
Reduced Lunch
> 34.2% (state average) of
district population
8 50% 4 31%
< 34.2% (state average) of
district population
8 50% 9 69%
Age 21-30 1 6% 0 0%
31-40 6 38% 2 15%
41-50 7 44% 5 38%
51-60 2 12% 6 46%

90
Factor A Factor B
N= 16 % N= 13 %
Ethnicity White 16 100% 12 92%
Minority 0 0% 1* 8%
District
Enrollment
> 3,000 student enrollment 10 63% 5 38%
< 3,000 student enrollment 6 38% 8 62%
> 17% (state average) special
education student enrollment
13 81% 8 62%
< 17% (state average) special
education student enrollment
3 19% 5 38%
Student
Achievement
AYP District ELA 5 31% 6 46%
Non-AYP District ELA 11 69% 7 54%
AYP District Math 4 25% 5 38%
Non-AYP District Math 12 75% 8 62%
AYP District ELA & Math 4 25% 5 38%
District Aggregate AYP ELA 9 56% 8 62%
District Aggregate AYP Math 8 50% 8 62%
*Indicates that P7, a special education administrator, was the one minority participant in this study and was
a member of Factor B.
Table 4.4 Demographic Information by Position from Factor A and Factor B
Factor A Factor B
N= 16 % N= 13 %
Current Position Special Education Teacher
Leader
8 50% 7 54%
Special Education Administrator 8 50% 6 46%
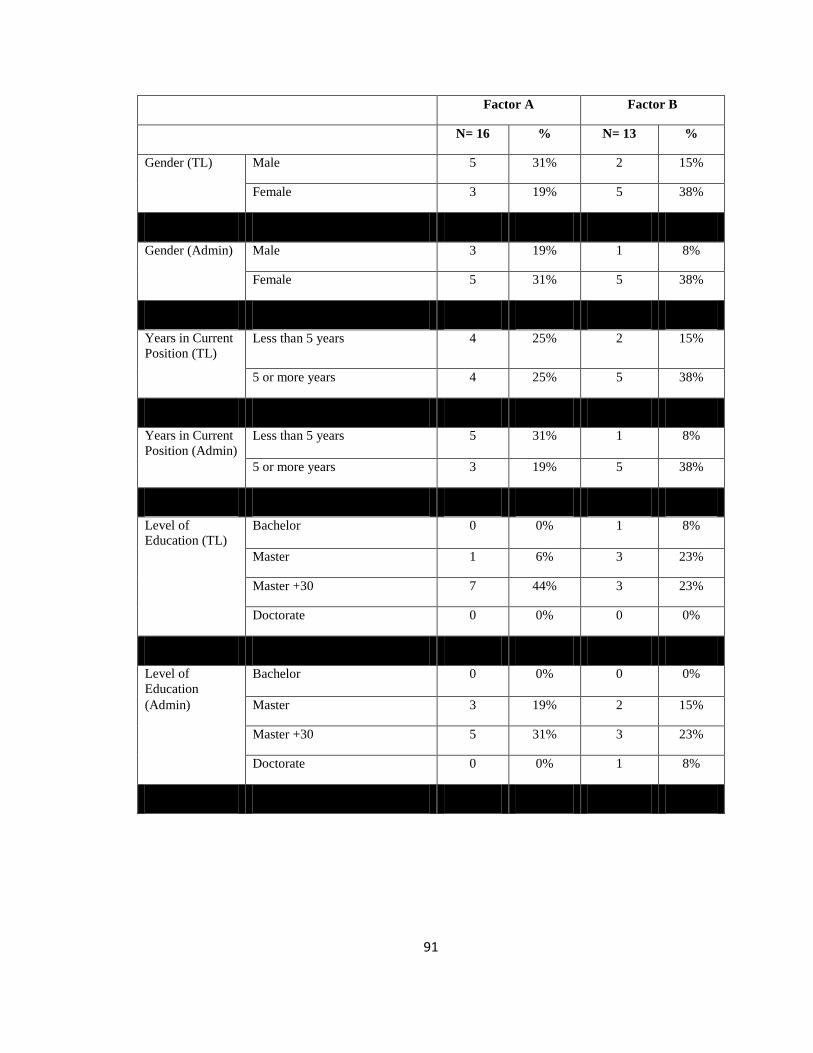
91
Factor A Factor B
N= 16 % N= 13 %
Gender (TL) Male 5 31% 2 15%
Female 3 19% 5 38%
Gender (Admin) Male 3 19% 1 8%
Female 5 31% 5 38%
Years in Current
Position (TL)
Less than 5 years 4 25% 2 15%
5 or more years 4 25% 5 38%
Years in Current
Position (Admin)
Less than 5 years 5 31% 1 8%
5 or more years 3 19% 5 38%
Level of
Education (TL) Bachelor 0 0% 1 8%
Master 1 6% 3 23%
Master +30 7 44% 3 23%
Doctorate 0 0% 0 0%
Level of
Education
Bachelor 0 0% 0 0%
(Admin) Master 3 19% 2 15%
Master +30 5 31% 3 23%
Doctorate 0 0% 1 8%
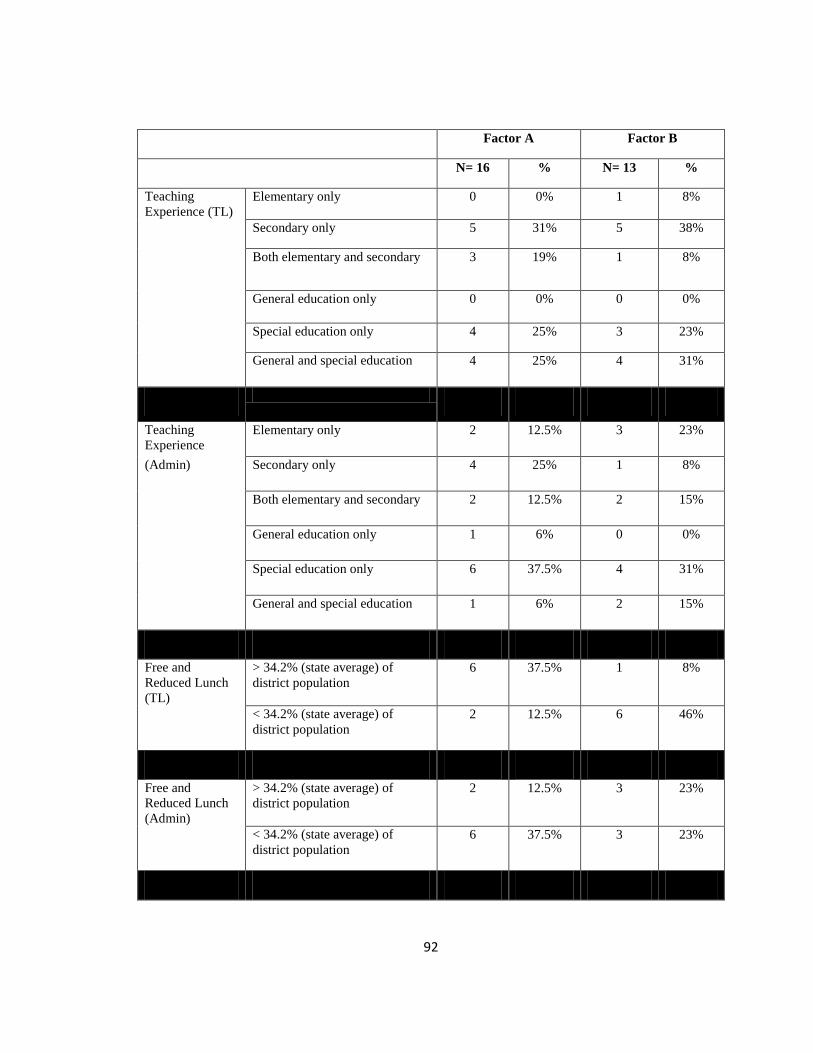
92
Factor A Factor B
N= 16 % N= 13 %
Teaching
Experience (TL)
Elementary only 0 0% 1 8%
Secondary only 5 31% 5 38%
Both elementary and secondary 3 19% 1 8%
General education only 0 0% 0 0%
Special education only 4 25% 3 23%
General and special education 4 25% 4 31%
Teaching
Experience
Elementary only 2 12.5% 3 23%
(Admin) Secondary only 4 25% 1 8%
Both elementary and secondary 2 12.5% 2 15%
General education only 1 6% 0 0%
Special education only 6 37.5% 4 31%
General and special education 1 6% 2 15%
Free and
Reduced Lunch
(TL)
> 34.2% (state average) of
district population
6 37.5% 1 8%
< 34.2% (state average) of
district population
2 12.5% 6 46%
Free and
Reduced Lunch
(Admin)
> 34.2% (state average) of
district population
2 12.5% 3 23%
< 34.2% (state average) of
district population
6 37.5% 3 23%

93
Factor A Factor B
N= 16 % N= 13 %
Age (TL) 21-30 1 6% 0 0%
31-40 3 19% 2 15%
41-50 3 19% 4 31%
51-60 1 6% 1 8%
Age (Admin) 21-30 0 0% 0 0%
31-40 3 19% 0 0%
41-50 4 25% 1 8%
51-60 1 6% 5 38%
District
Enrollment (TL)
> 3,000 student enrollment 7 44% 1 8%
< 3,000 student enrollment 1 6% 6 46%
> 17% (state average) special
education student enrollment
7 44% 4 31%
< 17% (state average) special
education student enrollment
1 6% 3 23%
District
Enrollment
> 3,000 student enrollment 3 19% 4 31%
(Admin) < 3,000 student enrollment 5 31% 2 15%
> 17% (state average) special
education student enrollment
6 37.5% 4 31%
< 17% (state average) special
education student enrollment
2 12.5% 2 15%

94
Factor A Factor B
N= 16 % N= 13 %
Student
Achievement
AYP District ELA 2 12.5% 4 31%
(TL) Non-AYP District ELA 6 37.5% 3 23%
AYP District Math 1 6% 3 23%
Non-AYP District Math 7 44% 4 31%
AYP District ELA & Math 1 6% 3 23%
District Aggregate AYP ELA 3 19% 5 38%
District Aggregate AYP Math 2 12.5% 5 38%
Student
Achievement
AYP District ELA 3 19% 2 15%
(Admin) Non-AYP District ELA 5 31% 4 31%
AYP District Math 3 19% 2 15%
Non-AYP District Math 5 31% 4 31%
AYP District ELA & Math 3 19% 2 15%
District Aggregate AYP ELA 6 37.5% 3 23%
District Aggregate AYP Math 6 37.5% 3 23%
Demographic similarities between Factors A and B members. Overall, Factor
A and Factor B shared few similarities in relation to demographic group composition.
Both factors had an even distribution within their membership of special education
administrators and special education teacher leaders, with Factor A being evenly split and
Factor B members having slightly more special education teacher leaders. Data indicates
that members from both factors had limited variety in their educational work experiences.
For example, 62.5 percent of Factor A members and 54 percent of Factor B members had
95
teaching experiences in only special education. Within both factors, there was a
significantly higher percent of special education teacher leaders with teaching experience
in both general and special education compared to special education administrators. In
addition, a small percentage of participants belonging to each factor had teaching
experience at both the elementary and secondary levels with 31 percent of Factor A and
23 percent of Factor B members. The majority of special education teacher leaders
belonging to each factor had the bulk of their teaching experience at the secondary level.
Further, the one minority special education leader in this study was a special education
administrator belonging to Factor A. This participant was also the only administrator in a
related service field.
There were also some similarities among the subgroups within each factor. For
example, each factor contained one member in the oldest age group (51-60) for the
subgroup of special education teacher leaders. Additionally, each factor had two special
education administrators that work in school districts in which their special education
populations were below the state average of 17 percent, representing 12.5 percent of
Factor A members and 15 percent of Factor B members. Moreover, there were
insignificant AYP differences among special education administrators belonging to each
factor. For instance, 19 percent (3 ADM) of Factor A and 15 percent (2 ADM) of Factor
B members were special education administrators working in districts that achieved AYP
for both Math and English Language Arts (ELA).
Demographic differences between Factors A and B members. There were
several demographic differences that existed between Factor A and Factor B. Based on
the data from this study, Factor A members were generally younger, more educated

96
males with less experience in their current position and worked in larger school districts
with higher rates of poverty. Factor B members were generally more experienced, older,
females working in smaller, more affluent school districts with higher achievement
levels. For instance, female participants comprised of 50 percent of the Factor A
membership, while 77 percent of the Factor B members consisted of female participants.
There also existed differences within each participant subgroup for each factor. For
example, Factor B consisted of only one male special education administrator compared
to three in Factor A, representing 8 percent of Factor B members and 19 percent of Factor
A members.
There were significant differences between the two factors in regards to years in
current position, levels of education, and level of teaching experiences. Factor A
members tended to be less experienced and more educated. Forty-four percent of Factor
A members had been in their current position for 5 or more years compared to 77 percent
of Factor B members. The largest discrepancy between subgroups in this area was
between special education administrators, as 38 percent of Factor B were administrators
who were working in their current position for 5 or more years compared to 19 percent of
Factor A. Factor B consisted on only one administrator with less than 5 years experience
in his/her current position. Seventy-five percent of members of Factor A held education
levels beyond a master’s degree compared to 54 percent of members of Factor B. The
majority of teacher leaders (seven of eight of the TL participants) within Factor A held
education levels beyond a master’s degree representing 44 percent of Factor A members,
whereas 23 percent (representing three of seven of the TL participants) of Factor B
members were teacher leaders holding education levels beyond a master’s degree. Forty-

97
six percent of Factor B members had teaching experiences in both general and special
education compared to 31 percent of Factor A members. In addition, 69 percent of
Factor B and 88 percent of Factor A held teaching experience at the secondary level,
while 54 percent of Factor B and 43.5 percent of Factor A held teaching experiences at
the elementary level. There was three times the amount of special education teacher
leaders belonging to Factor A with experience at both levels compared to Factor B.
Factor A members were generally younger educators, working in larger school
districts with higher poverty levels in comparison to Factor B members. For example, 44
percent of Factor A members was under the age of 40 compared to 15 percent of Factor B
members. The largest discrepancy for age between factors was special education
administrators. For example, the majority of administrators in Factor A (seven of eight
ADM participants) were 50 years or younger representing 44 percent of the members of
Factor A, whereas the majority of administrators in Factor B (five out of six ADM
participants) were older than 50 years representing 38 percent of the members of Factor
B.
Thirty-one percent of Factor B members worked in school districts whose free
and reduced lunch populations were greater than the state average of 34.2 percent in
comparison to 50 percent of the members of Factor A. Further, there were more Factor A
members than Factor B members that worked in larger school districts, as 63 percent of
Factor A members worked in districts greater than 3,000 students compared to 38 percent
of the members of Factor B. The most significant difference in this area between
subgroups was special education teacher leaders. The majority of special education
teacher leaders (seven of eight TL participants) belonging to Factor A worked in districts

98
greater than 3,000 students representing 44 percent of Factor A members, whereas 46
percent of teacher leaders belonging to Factor B (six of seven TL participants) were
working in school districts less than 3,000 students.
Factor A also consisted of more members working in districts with lower
achievement scores on state standardized tests and higher special education populations.
Factor A had significantly more members working in districts whose special education
population was above the state average of 17 percent with Factor A represented at 81
percent and Factor B at 62 percent. The majority of teacher leaders belonging to Factor
A (seven of eight TL participants) were working in districts whose special education
population was above the state average, whereas the majority of teacher leaders
belonging to Factor B (four of seven TL participants) were working in districts whose
special education population was below the state average. Moreover, 25 percent of
Factor A and 38 percent of Factor B members were employed in districts that achieved
AYP benchmarks for both ELA and Math. Only one teacher leader belonging to Factor
A was working in a district that achieved AYP for both ELA and Math representing 8
percent of Factor A members, in comparison to 23 percent of Factor B special education
teacher leader members (three of seven TL participants).
Leadership Attribute Statement Rankings
The distributed leadership statements were ranked using the principle component
scores (see table 4.5). The extent to which the highest and lowest ranked distributed
leadership statements differ from each other was assessed, analyzed, and compared.
Further, the rationale participants employed for ranking their statements were analyzed to
aid with the understanding of the item rankings.

99
Table 4.5
Factor A and Factor B Item Rankings
Item
# Leadership Statements
Factor A
factor scores
n=40
Factor B
factor scores
n=40
1 Ensure there is a well-functioning special education leadership
team 2.82013(1) 1.48701 (4)
2 Be accountable for the professional behavior of the special
education leadership team 0.26850 (12) 0.35939 (15)
3 Ensure the special education leadership team supports the district
goals 1.26607 (5)
-1.42646
(35)
4 Ensure all members of the special education leadership team work
in the same strand on the core objectives -0.15165 (21)
-1.84327
(40)
5 Ensure people are assigned responsibilities based on competencies 0.92982 (7) 0.02726 (20)
6 Ensure members of the special education leadership team divide
their time properly 0.45157 (10)
-1.81584
(39)
7 Ensure members of the special education leadership team have
clear goals 2.38797 (2)
-0.48833
(28)
8 Ensure members of the special education leadership team prioritize
tasks they have to perform 1.50974 (4)
-1.56554
(37)
9 Ensure members of the special education leadership team is
willing to execute a good idea 0.50045 (9)
-0.69279
(33)
10 Ensure members of the special education leadership team have
clear roles and responsibilities 1.95758 (3) 0.66281 (12)
11 Provide feedback to educators 0.40403 (11) 0.69273 (11)
12 Explain reasons for constructive criticism to educators -1.02101 (35) -0.52242 (29)
13 Be accountable after school to help educators when assistance is
needed -1.63027 (40)
-0.52985
(30)
14 Encourage educators to pursue their own goals for professional
learning -1.05848 (36)
-0.37154
(26)
15 Encourage educators to try new practices consistent with their own
interests -1.12218 (37)
-0.64585
(31)
16 Provide organizational support for educator interactions
-0.74246 (32) -0.48292
(27)
17 Be involved in the summative evaluation of educators
-0.73541 (31) -0.13207
(21)

100
Item
# Leadership Statements
Factor A
factor scores
n=40
Factor B
factor scores
n=40
18 Be involved in the formative evaluation of educators
-0.50926 (29) -0.23962
(24)
19 Provide educators with time to address the most important needs
of students -0.41456 (27) 1.82812 (2)
20 Allow the special education leadership team to function
autonomously -0.28170 (25)
-1.45248
(36)
21 Work together with educators to develop programs 0.10826 (14) 0.64977 (13)
22 Acknowledge the expertise of educators -0.10327 (18) 0.73621 (10)
23 Trust educators enough to make decisions -0.00654 (17) 0.46274 (14)
24 Allow flexibility with responsibilities
-0.68635 (30) -0.35550
(25)
25 Support educator(s) in developing a leadership role
-0.17953 (23) -0.22485
(23)
26 Routinely communicate informally to educators -0.85764 (33) 0.86673 (9)
27 Promote a professional collegial atmosphere -0.23771 (24) 1.13516 (5)
28 Support open communication 0.13789 (13) 1.61476 (3)
29 Collaborate with educators on professional development -0.98502 (34) 0.34614 (16)
30 Collaborate with educators on assessing instructional needs -0.14229 (20) 0.91361 (8)
31 Collect data on the ground to be shared collaboratively
0.07122 (16) -0.19523
(22)
32 Assist special educators on analyzing appropriate interventions -0.16945 (22) 1.12858 (6)
33 Consult with educators -0.31195 (26) 0.22407 (18)
34 Ensure that all staff understands the importance of confidentiality
-0.44605 (28) -0.65169
(32)
35 Understand that the relationship with educators hinges on the
belief that leadership should be distributed 0.96595 (6)
-1.68271
(38)
36 Appreciate the work performed and the responsibilities involved
with each staff member -0.13038 (19) 0.32232 (17)
37 Understand that the relationship with educators is one of
interdependency 0.07950 (15)
-1.01418
(34)

101
Item
# Leadership Statements
Factor A
factor scores
n=40
Factor B
factor scores
n=40
38 Collaborate with educators to develop home-school relations -1.58294 (39) 0.10887 (19)
39
Understand that special education services cannot be accomplished
without the mutual support, advice, and understanding of other
staff members
0.86980 (8)
1.84428 (1)
40 Engage in specific discussions relative to closing the achievement
gaps -1.22241 (38) 0.92256 (7)
Factor A Rankings
Factor A members’ rankings of distributed leadership items ranged from 2.82 to
-1.63. This group of special education leaders favored eight items (1, 3, 10, 8, 3, 35, 5,
39) that emphasized (a) a well-functioning leadership team, (b) clear goals, (c) clear roles
and responsibilities, (d) task prioritization, (e) support for district goals, (f) the belief in
distributing leadership, (g) assignment of responsibilities linked to competencies of staff,
and (h) an understanding that service delivery requires mutual support, advice, and
understanding (see table 4.6). The seven lowest ranked Factor A items (13, 38, 40, 15,
14, 12, 29) ranged from -.98 to -1.63 (refer back to table 4.6). The distributed leadership
items represented in Factor A’s low rankings, pertained to (a) developing home-school
relations, (b) closing the achievement gaps, (c) collaborating with educators on
professional development, and (d) encouraging educators to try new practices.
According to the follow-up interviews, Factor A members ranked items high
because they (a) established a well-functioning team, (b) conveyed clear goals, roles and
responsibilities, (c) promoted open communication, and (d) ensured members work
towards a common purpose by prioritizing tasks they need to perform (see table 4.7).
Two Factor A members provided the comments referencing a top-down approach when

102
commenting to item #1, Ensure there is a well-functioning special education leadership
team. One special education administrator stated, “I see there’s a place for top-down at
times, and then there’s a place where you have to share it and own it to move something
forward.” A second special education administrator explained, “It’s more of a top-down
model…But the idea of collaborating with educators on professional development, but
again, the notion of collaborating with teachers is to really sit down and develop things,
and that’s a portion of just the Massachusetts curriculum with having a professional
development plan…And so that’s not something you collaborate on.”
Table 4.6
Rankings for Factor A Highest and Lowest Rated Statements
High
Item #
High Distributed Leadership
Statements (Attributes)
Factor A
High
Scores
Low
Item #
Low Distributed
Leadership
Statements
(Attributes)
Factor A
Low
Scores
1
Ensure there is a well-
functioning special education
leadership team
2.82013(1) 13
Be accountable after
school to help
educators when
assistance is needed
-1.63027
(40)
7
Ensure members of the special
education leadership team have
clear goals
2.38797 (2) 38
Collaborate with
educators to develop
home-school
relations
-1.58294
(39)
10
Ensure members of the special
education leadership team have
clear roles and responsibilities
1.95758 (3) 40
Engage in specific
discussions relative
to closing the
achievement gaps
-1.22241
(38)
8
Ensure members of the special
education leadership team
prioritize tasks they have to
perform
1.50974 (4) 15
Encourage educators
to try new practices
consistent with their
own interests
-1.12218
(37)
3
Ensure the special education
leadership team supports the
district goals
1.26607 (5) 14
Encourage educators
to pursue their own
goals for professional
learning
-1.05848
(36)

103
35
Understand that the relationship
with educators hinges on the
belief that leadership should be
distributed
0.96595 (6) 12
Explain reasons for
constructive criticism
to educators
-1.02101
(35)
5
Ensure people are assigned
responsibilities based on
competencies
0.92982 (7) 29
Collaborate with
educators on
professional
development
-0.98502
(34)
39
Understand that special
education services cannot be
accomplished without the mutual
support, advice, and
understanding of other staff
members
0.86980 (8)
Table 4.7
Rationale of Factor A Members for Highest Ranked Items
Factor
A High
Item#
Statement
Reason
1 Ensure there is a well-
functioning special education
leadership team
I chose this because it said, "well-functioning," and so in
my mind a lot of other things have to happen for it to be
well-functioning, and that means that, looking at the data,
supporting your people with feedback, making sure the
roles, goals, making sure that people are effectively using
time, and also effectively supporting them follows a well-
functioning team, and also open communication. (ADM)
Now, that's kind of a loaded statement; everybody wants
to have a well-functioning leadership team, but what does
that mean, and how do you develop it? You don't always
want yes people; you want a positive, collaborative effort
when you're looking at vision of the district, resources of
the district, and service delivery models in the district.
And so you have to develop a team that responds to that,
or else you find yourself again in trouble. You can have
dissension, but it has to be dissension with respect.
(ADM)
I think without that you can't really do anything to ensure
that students are going to get services and teachers are
going to get the supports that they need so we as a team
need to be organized and functioning well. (ADM)
I'm looking at my chart here, move across and start with a
good foundation, a base. So I felt like those three things

104
(statements #1, #5, and #10) gave me that base, to start a
good leadership team. (ADM)
I think to have a well balanced and effective Special Ed
department you have to have a strong team so I think that
that kind of drives the whole rest of the cards here so
making sure that people understand what their job is, that
they understand how to do it and just having good
leadership skills is essential. I've seen it where you don't
have it and it doesn't work. (ADM)
I don't see how it gets more important than that because if
that's not functioning well, it's going to be chaos. (TL)
Ensure there is a well functioning Special Education
leadership team because as far as Special Ed department
can’t function without competent leaders that are well
respected. That's what I was looking for. (TL)
For me that is critical, that's everything. (TL)
I picked number 1 because I thought that that
encapsulated a lot of the good points in these entire 40
cards but especially the number 7 and the number 10...If
you don't have a well functioning team, the people in the
team have to have the same thought process and we all
have to work together in the best interest of the students.
If we're not all on the same page then it's not going to
work for the student. (TL)
7 Ensure members of the special
education leadership team
have clear goals
That goes back to being able to define what you're doing
and why you're doing it. And if a leader can't articulate
what those pieces are and develop a vision, then nobody's
going to follow. (ADM)
Right off of that number 7 and number 10 having clear
goals and their roles and responsibilities... if everybody
on the team, the teachers, the guidance counselors, the
parents, ETLs, everybody needs to know what they're
supposed to be doing and what role they play in the whole
IEP Process, Special Ed process. (TL)
Members of the Special Ed leadership team have clear
goals because in order to run a department or even within
a district you have to have some type of idea where you're
going. (TL)
There is no I in team or leadership (realistically) in terms
of goals. Statement #7 states "ensures members of the

105
special education leadership team have clear goals."
Members cannot know where their students stand
academically without setting a goal, both team and
personal...tracking team data and academic goals, and
monitoring progress. (TL)
10 Ensure members of the special
education leadership team
have clear roles and
responsibilities
That's what I was looking for. Any type of leadership
roles and making sure that everyone has their
responsibilities, everything is clear. That's set number 10
and number 7. Ensure members of the Special Education
leadership team have clear goals, responsibilities. That
goes along with communication. I was looking for
communication as well. (TL)
You have to make sure that with number 10 everyone's on
the same page and they know their roles and
responsibilities to get the department moving forward.
(TL)
8 Ensure members of the special
education leadership team
prioritize tasks they have to
perform
I think that's a big piece of it. We have to really decide
what's important and just trick down the list. It's like this
sort. They're all important. If you left one of them out
you'd have a problem. It was hard to sort it. I really think
that that's why I tried to get all the leadership stuff at one
end and then more of the actual work. I think it comes if
you have the right leadership style and the functioning
team. (ADM)
Ensure members of the Special Ed leadership team
prioritize their tasks so we are able to improve Special Ed
within a district. What areas do we want to focus on first
and then you have to make sure that with number 10
everyone's on the same page and they know their roles
and responsibilities to get the department moving
forward. (TL)
3 Ensure the special education
leadership team supports the
district goals
I guess to me, this is an overarching principle so that, to
start this is really important. (ADM)
I think that's got to be the clear message as strategic plan
goals you have those and then you have to look at how
your work is in service to those goals all the time. That
starts with the leadership team and then that sifts down to
all of the staff, teachers, principals in schools in the
different buildings, paras, secretaries, everybody. (ADM)
35 Understand that the
relationship with educators
hinges on the belief that
leadership should be
For me, picking the first one was really the essence of the
belief system which I picked. "Understand the
relationship with educators hinges on the belief that
leadership should be distributed." Because, I think, in the

106
distributed field of special ed, there are so many nuances and aspects
to it, no one entity can hold it, and no one administrative
team. I think everybody has a role and a part to play in
the process. So, but for me, that really captures that if you
don't, if you don't believe, fundamentally, and you sit in
the lens that, as a special ed leader, that it's all you, and
all the successes are yours, all the failures are yours, or all
the responsibility is yours, there's no way that it's
manageable and anything would ever move forward,
obviously. But I think, in order to figure out, then, how do
you move it forward, for me, I think the big piece is often
directors who sit on their own and don't see the role
everybody has to play in the process, I don't think they're
effective to moving forward with change. I think the
complexity is the, I think, when I was sorting to this, I
said something to you about, you know, all of these
things, there's a value to them, and then there's, what's the
practicality of implementation, and how do you create
systems. And I think the piece that adds to this is when
you're functioning in a larger system. So we can operate
under what our belief system is around leadership,
distributed leadership in special ed, but if you're not
sitting within the larger context or the frame of the district
and the superintendent and their belief system about
leadership, you kind of can get bogged down in really
weird ways. So it's definitely way more complex, the
bigger the system is. And if the styles are very different.
Obviously, this notion of top-down leadership, what do
we know, I think, about education, because it's hard for
me to separate special ed administration from education
and teaching and learning, and where we want to affect
change, I see there's a place for top-down at times, and
then there's a place where you have to share it and own it
to move something forward. (ADM)
The team has to be well functioning. In order to do that
you need to have some common philosophy. That means
making sure that everyone understands that the educators,
the people on the ground doing the work have to be part
of this. If they're not a real part of it and a valued part of it
then we're in trouble. Understand that the relationship
with educators is one of interdependency is right along
with that. It's sort of connecting the top and the bottom
and making sure we're working together. That was really
it. (TL)
5 Ensure people are assigned
responsibilities based on Well, my thought is, on those three (statements #1, #5,
and #10), if you can build the team on the competencies

107
competencies that they are capable of doing and that they have clear
roles of what their responsibilities are, you're then able to
move across the (sort), you know. (ADM)
39 Understand that special
education services cannot be
accomplished without the
mutual support, advice, and
understanding of other staff
members
I think that's not just special education; it's general
education, related staff, when you're dealing with
districts, you know, vocational, and the like. We've heard
it all before. You have to have everybody buying in to
provide special education services. If you don't come with
that ethic to help mediate those relationships, the only
person that suffers is the kids, so you have to understand
that special education services cannot be accomplished
without mutual support. (ADM)
I chose those (statements #39, #1, and #27) because those
are the things that I have seen lacking in some schools
that I've worked and things that I feel that a special ed
leader can actively change, themselves. A lot of the things
on here are all collaborative things, you know, working
with teachers, working with other people. But I feel like
these things come directly from the top. Places that have
had a professional atmosphere, places that have had
mutual support and advice, have started with someone
who's a leader who makes that atmosphere happen,
regardless of who else is in the building. So I thought that
those were things that a special ed leader can do
themselves and that nobody else can do for them if the
leader is lacking those. (ADM)
I thought this one was the most important one
understanding that Special Ed services can't be
accomplished without the mutual support, advice and
understanding of all of the staff members. I see it as a
collaborative effort to develop good services and
programs in Special Education. So the top down
management style of administration is not helpful to those
who are working directly with the students. That doesn't
mean that there shouldn't be a leadership team that needs
to function well and be in a position where they take an
overview of what's going on and see the bigger picture
and see what needs to be fine tuned or changed. (TL)
In addition, comments from the follow-up interviews by Factor A members
indicate that the highly ranked items of #7, #10, and #3 were segregated by role. These
three items pertained to ensuring the special education leadership team has clear goals

108
(item #7), roles and responsibilities (item #10), as well as ensuring the special education
leadership team supports the district goals (item #3). The comments by special education
teacher leaders signify this group clearly feels that a necessity of being an effective leader
of special education includes ensuring the leadership team has clear goals (item #7), in
addition to ensuring the leadership team has clear roles and responsibilities (item #10).
Special education teacher leaders were the only Factor A members to comment on item
#10 and were the majority (three of four) to comment on item #7. The comments on
these two items reveal that the Factor A teacher leader members value the importance of
ensuring the special education leadership team has clear roles, responsibilities, and goals.
Moreover, special education administrators were the only Factor A members to comment
on item #3 by stating they strongly valued the necessity of ensuring the special education
leadership team supports the district goals. Overall, Factor A members commented on
the importance of creating a well-functioning special education leadership team by
establishing open channels of communication, prioritizing tasks, and providing clear roles
and goals, as well as supporting staff.
One reason Factor A members stated that they assigned low rankings to these
items was for the simple reason that the statements were not perceived to be as important
as the higher ranking items (see table 4.8). Similar to some of the highest ranked items,
the lowest ranked items of #13, #38, and #14 were segregated by role. Special education
administrators were the only Factor A members to comment on items #13 and #38, as
well as representing the majority (four ADM to one TL) that commented on item #14.
The focus of these three items was related to the following responsibilities of special
education leaders when working with educators: (a) being accountable to help after

109
school (item #13), (b) collaborating to develop home-school relations (item #38), and (c)
encouraging the pursuit of goals linked to professional learning (item #14). Their
comments reveal that Factor A special education administrator members ranked these
items low because: being accountable after school to help educators is viewed as
mechanic and not essential to special education leadership; collaborating with educators
to develop home-school relations is systematically set-up, not the teachers responsibility
and it was not considered to be as essential as the majority of statements in the Q deck;
and, encouraging educators to pursue their own goals for professional learning must be
connected to the district’s goals and curriculum.
Table 4.8
Rationale of Factor A Members for Lowest Ranked Items 13 Be accountable after school to
help educators when assistance
is needed
I think the piece for me was trying to shift those things
that I felt were, had the least impact on leadership, or
distributed leadership. And so the one I picked at the far
end was, "Be available after school to help educators."
Because I see that as a mechanic, but not as a theoretical
belief system. So the mechanics of after school, that's
just a detail. It's really, are you accessible to staff and
engage in an active process up front, so that it isn't just
when they get out of work? It's, how do you infuse your
belief about leadership so it's not an addition to their
day; it's part of everybody's work day. (ADM)
And as far as being available after school, that's, that's
fine, but I don't think that's an essential element. I feel
like you can collaborate during school, before school. I
don't think that it is that, that one thing, is critical.
(ADM)
8 Collaborate with educators to
develop home-school relations Although an important component, the way that I am
thinking about educators here currently is primarily
teachers, and a home-school component is something
that gets set up systematically. You have teacher night.
You have situations that the administrator and/or the
district leadership team identify as points where your
teachers have to put themselves in that position. You're
not collaborating with the educators; it's more of a top-
down model, in my experience. Any training or

110
collaboration that you do might occur with your student
adjustment counselors or an outreach social worker, but
not your on the teachers, for the most part. (ADM)
And those are things that I feel that teachers should
handle. Those aren't things that necessarily that an
administrator or director or leader of special education
has to have. Teachers have to develop their own home-
school relations with their students. (ADM)
40 Engage in specific discussions
relative to closing the
achievement gaps
As a special education person, we're already there. I've
asked before, what is the achievement gap? Is it the
black/white achievement gap? From my standpoint, that
falls under the realm of "at-risk," or looking at students
who have economic or environmental disadvantages,
which is actually something that precludes you from
receiving special education services. And so, as a
special education director, it's, what's the wording? It's
nicer than what I was just going to say. "Less
necessary." It's still part of the discussion, especially in a
continuum of services, but as a headset for a special
education administrator, it's not something that is
primary. (ADM)
Personally data bores the hell out of me and I think too
often we get caught in that minutia. It's like the kid you
have in your class a lot of times the IEP is the individual
and they don't need the data. You got to kind of focus on
that kid separate from everything else. That happens
often so it's a lot of kids. That to me it was like okay,
you need it. Again, achievement gaps. I don't care about
testing. I'm focusing on the kids in my class right now
and how I can make them successful. I don't care about
the overall thing. That's where I come from those. (TL)
15 Encourage educators to try new
practices consistent with their
own interests
"Encouraging new practices in their own interests." I
kind of feel like you need to stay focused on what the
goal is of the district, the core, you know, curriculum.
So, yeah, you have interests, but, really, you need to
stay up with what's the focus of the district. (ADM)
I don't know that their own interests necessarily
coordinate with curriculum and framework so I put that
as last. I don't want them going off on a tangent,
especially in Special Ed if you're trying to do
specialized instruction you don't have the kids for a lot
of time so it has to be highly effective and
efficient...especially when there's an IEP involved.

111
(ADM)
Trying new practices that are of an educators interest are
not always in the best interest of the student population.
I would encourage teachers to explore new practices that
are in the students best interest. Then it would have
been a statement placed in a different column. (TL)
14 Encourage educators to pursue
their own goals for professional
learning
I value that professional growth, but the hard part is, is
their own goals, too often, we see professional learning
that's independent, that's not connected to the broader
system and where we want to move forward and affect
change. So what ends up happening is we have people
doing their own growth for their own interests, but it's
not connected to the district work, the vision, and the
mission. So I encourage people to do that, but that was a
struggle for me, because I didn't want to suggest that I
didn't. I think the one that weighed higher, that weighed
more to the right for me on the scale was collaborating
with them on professional development, because that
allows us the opportunity to really talk about, how is it
connected to the work of the district and the needs.
(ADM)
Well, I mean, if I'm encouraging educators to try new
practices, consistent with their own interests, to me, that
kind of falls under that sub-heading, in a lot of ways. So
what I did was, I took the idea that I thought was the
bigger picture, and I put that as more important. And the
components of that bigger picture, I said, okay, that's
only one aspect of that, so I kind of pushed that to the
side. And that's how I answered. (ADM)
Encouraging new practices in their own interests. I kind
of feel like you need to stay focused on what the goal is
of the district, the core, you know, curriculum. So, yeah,
you have interests, but, really, you need to stay up with
what's the focus of the district. (ADM)
I don't know that their own interests necessarily
coordinate with curriculum and framework so I put that
as last. I don't want them going off on a tangent,
especially in Special Ed if you're trying to do
specialized instruction you don't have the kids for a lot
of time so it has to be highly effective and
efficient...especially when there's an IEP involved.
(ADM)

112
Trying new practices that are of an educators interest are
not always in the best interest of the student population.
I would encourage teachers to explore new practices that
are in the students best interest. Then it would have
been a statement placed in a different column. (TL)
12 Explain reasons for constructive
criticism to educators To educators. I guess, I would think that that is not as
necessary, that it's likely that people have been exposed
to that in the past, and that you would hope that you
would not have to spend a lot of time explaining
constructive criticism to people that you're working
with. (ADM)
I'm not sure why you'd have to explain constructive
criticism. I think in this job, you need to be open to that
and willing to have that in your life. (ADM)
Statement #12 because educators should not need you to
explain constructive criticism. They should know all
criticism is constructive. (TL)
29 Collaborate with educators on
professional development But the idea of collaborating with educators on
professional development, again, the notion of
collaborating with teachers is to really sit down and
develop things, and that's a portion of just
Massachusetts curriculum with having a professional
development plan, an IPDP (Individual Professional
Development Plan). And so that's not something you
collaborate on. And so they have to have one. They
don't get a choice. And if they're in special education,
they need to be targeted on that. We're not talking about
somebody who wants to be a pottery teacher and to talk
about how that might work for them. You've got an
expectation; it's professional. You can talk with them
about it, but "collaboration" seems to be kind of a
grandiose term. (ADM)
Overall, Factor A members stated the reasons they assigned low rankings to the
items (14, 15, and 29) on professional development and professional growth was because
professional development is typically driven by the Massachusetts curriculum
frameworks and the goals and needs of the district. Factor A members stressed the need
for the professional development interests and goals of educators to be consistent with

113
(and not independent of) the goals and interests of their districts in order to be supported
and viewed as important by special education leaders.
Factor A Summary. Factor A members were generally comprised of younger,
more educated males with less experience at their current position, who were working in
larger school districts with higher rates of poverty. Overall, there was a higher ratio of
special education teacher leaders working in larger districts with higher rates of students
on free or reduced lunch, and that had experiences teaching in both general and special
education. In addition, there were significantly more special education administrators
that were working in districts that achieved AYP for both Math and ELA. Factor A
participants valued distributed attributes that establish a (a) well-functioning leadership
team, (b) clear goals, (c) clear roles and responsibilities, (d) task prioritization, (e)
support for district goals, (f) the belief in distributing leadership, (g) assignment of
responsibilities linked to competencies of staff, and (h) an understanding that service
delivery requires mutual support, advice, and understanding. Factor A members assigned
low rankings to items pertaining to the development of home school relations, closing the
achievement gaps, collaborating with educators on professional development, and
encouraging educators to explore new practices.
In follow-up interviews, Factor A members expressed that effective leaders of
special education develop well-functioning leadership teams by establishing open
channels of communication, prioritizing tasks, supporting staff, and by providing clear
roles, responsibilities, and goals. Special education administrators in particular,
expressed the general feeling during the follow-up interviews of the necessity for special
education leaders to support the district goals. Special education teacher leaders

114
specifically valued the importance of ensuring the special education leadership team has
clear roles and responsibilities, as well as clear goals. Rationale provided for the low
rankings included: the low ranked items were perceived not as important as the higher
ranked items; professional development is viewed as something driven by external
factors and therefore does not require collaboration; and the professional development
interests and goals of educators must be in alignment with the goals and interests of their
districts in order to be supported by special education leaders. Special education
administrators specifically ranked items pertaining to being accountable after school to
help educators, collaborating with educators to develop home-school relations, and
encouraging educators to try new practices consistent with their own interests low
because: being accountable after school to help educators is viewed as mechanic;
collaborating with educators to develop home-school relations is systematically set-up;
and, encouraging educators to pursue their own goals for professional learning must be
connected to the district’s goals and curriculum.
Factor B Rankings
Factor B’s 10 highest ranked distributed leadership items (39, 19, 28, 1, 27, 32,
40, 30, 26, 22) ranged from 1.84 to .73 (see table 4.9). Factor B members ranked these
statements highly because they (a) acknowledged that special education services require
mutual support, advice, and understanding of other staff, (b) provided time to address the
most important needs of students, (c) supported open communication, (d) ensured a well-
functioning special education team, (e) promoted a professional collegial atmosphere, (f)
helped analyze appropriate interventions, (g) addressed closing the achievement gaps, (h)
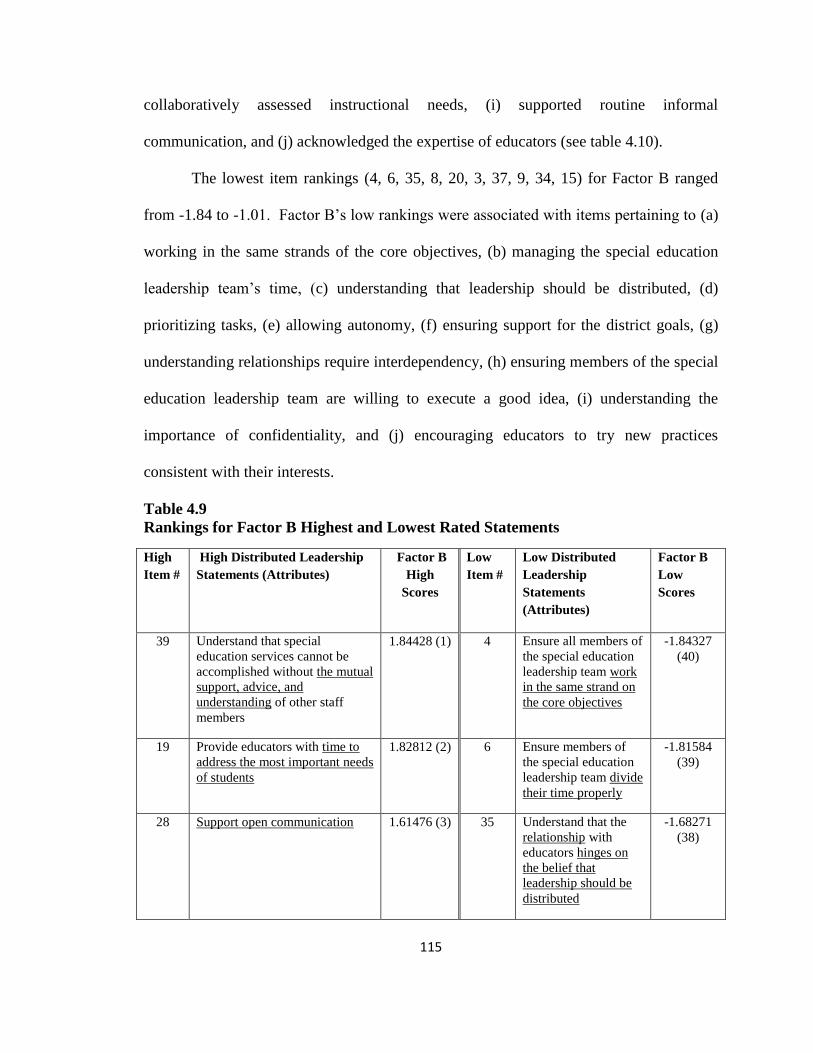
115
collaboratively assessed instructional needs, (i) supported routine informal
communication, and (j) acknowledged the expertise of educators (see table 4.10).
The lowest item rankings (4, 6, 35, 8, 20, 3, 37, 9, 34, 15) for Factor B ranged
from -1.84 to -1.01. Factor B’s low rankings were associated with items pertaining to (a)
working in the same strands of the core objectives, (b) managing the special education
leadership team’s time, (c) understanding that leadership should be distributed, (d)
prioritizing tasks, (e) allowing autonomy, (f) ensuring support for the district goals, (g)
understanding relationships require interdependency, (h) ensuring members of the special
education leadership team are willing to execute a good idea, (i) understanding the
importance of confidentiality, and (j) encouraging educators to try new practices
consistent with their interests.
Table 4.9
Rankings for Factor B Highest and Lowest Rated Statements
High
Item #
High Distributed Leadership
Statements (Attributes)
Factor B
High
Scores
Low
Item #
Low Distributed
Leadership
Statements
(Attributes)
Factor B
Low
Scores
39 Understand that special
education services cannot be
accomplished without the mutual
support, advice, and
understanding of other staff
members
1.84428 (1) 4 Ensure all members of
the special education
leadership team work
in the same strand on
the core objectives
-1.84327
(40)
19 Provide educators with time to
address the most important needs
of students
1.82812 (2) 6 Ensure members of
the special education
leadership team divide
their time properly
-1.81584
(39)
28 Support open communication 1.61476 (3) 35 Understand that the
relationship with
educators hinges on
the belief that
leadership should be
distributed
-1.68271
(38)
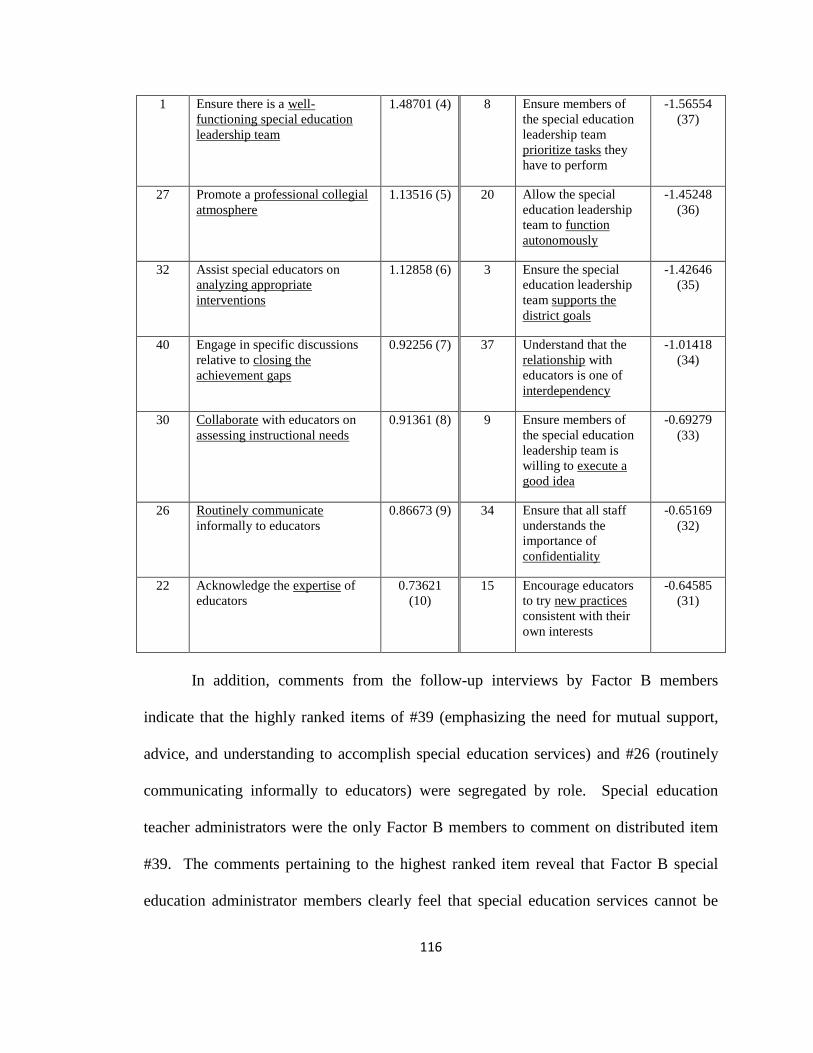
116
1 Ensure there is a well-
functioning special education
leadership team
1.48701 (4) 8 Ensure members of
the special education
leadership team
prioritize tasks they
have to perform
-1.56554
(37)
27 Promote a professional collegial
atmosphere
1.13516 (5) 20 Allow the special
education leadership
team to function
autonomously
-1.45248
(36)
32 Assist special educators on
analyzing appropriate
interventions
1.12858 (6) 3 Ensure the special
education leadership
team supports the
district goals
-1.42646
(35)
40 Engage in specific discussions
relative to closing the
achievement gaps
0.92256 (7) 37 Understand that the
relationship with
educators is one of
interdependency
-1.01418
(34)
30 Collaborate with educators on
assessing instructional needs
0.91361 (8) 9 Ensure members of
the special education
leadership team is
willing to execute a
good idea
-0.69279
(33)
26 Routinely communicate
informally to educators
0.86673 (9) 34 Ensure that all staff
understands the
importance of
confidentiality
-0.65169
(32)
22 Acknowledge the expertise of
educators
0.73621
(10)
15 Encourage educators
to try new practices
consistent with their
own interests
-0.64585
(31)
In addition, comments from the follow-up interviews by Factor B members
indicate that the highly ranked items of #39 (emphasizing the need for mutual support,
advice, and understanding to accomplish special education services) and #26 (routinely
communicating informally to educators) were segregated by role. Special education
teacher administrators were the only Factor B members to comment on distributed item
#39. The comments pertaining to the highest ranked item reveal that Factor B special
education administrator members clearly feel that special education services cannot be

117
accomplished without the mutual support, advice and understanding of other staff
members. Further, special education teacher leaders were the only Factor B members to
comment on item #26 that stressed the importance of routine informal communication
with educators.
The reasons Factor B members assigned low ranking to these statements were as
follows: (a) the goals and objectives of the district are secondary to the programming and
individualized instruction needed to effectively support students with special needs; (b)
constructive feedback should not be a practice but embedded in the culture of the
organization; (c) the distribution and prioritization of leadership tasks should not be
assigned, but take place naturally (“tasks prioritize themselves”) within the special
education leadership team; and (d) similar to Factor A, the statements were viewed as
important, but not as important as the higher ranking items (see table 4.11).
Table 4.10
Rationale of Factor B Members for Highest Ranked Items
Factor B
High
Item#
Statement
Reason
39 Understand that special
education services cannot be
accomplished without the
mutual support, advice, and
understanding of other staff
members
The reason I put that there is because I'm not in all my
buildings all the time; I am basically someone that walks
through programs to make sure they're running okay. I
attend tough team meetings, where something is either
adversarial or there's something in question. And so my
vision of how special ed works is that everyone has to
buy in to their role in educating the student, from the top,
the building head, all the way down, and most
importantly, in the trenches. I taught for 30 years in a
special ed classroom, and I have to tell you that it wasn't
all about me; it was all about us, and getting different
perspectives on how to work with a student, getting fresh
insight into methods, a whole bunch of different strategies
you could use with students. So I think, really, if what
you want is the best education, and it should be about the
kids, first and foremost, this is what has to be the focus.

118
(ADM)
And that, for me, is kind of going in that same theme of
being able to communicate, being collegial. I want to get
away from the "us and them" kind of mentality between
some general ed and some special ed, like, "Those are
your kids. Those are not my . . . " It follows that, like,
inclusive model. (ADM)
For me, I think that it's really important, when you're
working with a team of teachers, to work as a team, both
special educators and general educators, working
collaboratively. I think it's important to share decision
making, to validate other people's perspectives, and just
to work together. (ADM)
19 Provide educators with time
to address the most important
needs of students
The reason I chose this one as the most important is
because I think that that's why we're in education.
Students' needs should be the priority, and if we work
around that, we'll be able to determine how to make that
happen. (ADM)
It also means that you don't have to focus on the things
that are constantly coming back to bite you that have
nothing to do with a high quality of education. You've got
to get the system running smoothly so that you can focus
actually on curriculum instruction and assessment and fun
stuff, yes. The fun stuff of education I feel like in Special
Ed we never have time for, so it's that kind of the
management thing I think are really important. (TL)
Focus on children is what I would say is that. It's a focus
on how we're going to make sure that all kids learn at
high standards. (ADM)
The reason that I chose that statement is because unless
you actually give people the time to address the needs,
none of the other things matter. Particularly in Special Ed,
teachers are often required to do whole bunches of things
for kids and they're not actually given the resources to
actually make sure that those things happen. We can have
all the great IEP people of the world but unless you
actually give them the time and the resources to do it, it
doesn't really matter. (TL)
28 Support open communication So in general, the most necessary choices that I put out
there have to do with keeping open communication and
supporting those people who are working under you, to
make sure that they're always going to be there to support

119
you. And when they feel supported, I think you're going
to get a lot more out of them. (TL)
I'm really feeling, with the way things are in the district
right now, because we've had such a turnover of people . .
. And I think there's just been, people we’re feeling that
there wasn't open communication. And I'm feeling like
I'm just trying to build that up, that people can feel they
can speak to each other and support each other in that
way. So right now, we've been kind of trying to build that
up with people. So that's why, even as a supervisor, when
I was supervising the schools here in district, I think my
staff always knew that they could come to me and talk to
me about anything. So I want to keep that going, because
that was a way for us to get our work done. (ADM)
1 Ensure there is a well-
functioning special education
leadership team
Well, I definitely chose, for number, for the plus five
statement, that there has to be a well-functioning special
education leadership team. If the special education
leadership team isn't well functioning, then it's not going
to be possible to complete the chores of, of special
education, to deliver services, to be out there creating
programs. Everything will fall away from that and be just
as dysfunctional, so I really think that a special education
department is as functional as the leadership team is. And
so the more functional the leadership team is, the more
functional the SPED department will be, and so forth.
(ADM)
I looked at it like a pyramid and starting with leadership
working its way down without that leadership, nothing
else is going to work. (TL)
I had to really think about the word necessary and what
that meant and what I think is the most important element
I guess of a high functioning department and that sort of
lead me to what I chose which actually was number 1
which said ensure there is a well functioning Special
Education leadership team. I think that closely underneath
that are things to do with open communication and
collaboration and I think that those are really key
elements in terms of something that's necessary to be an
effective leader in Special Ed because you really interface
with so many different groups and needs and philosophies
but ultimately if you don't have sort of like a well
functioning team at the top I think things can fall apart
really fast so that's why I chose that card. (TL)
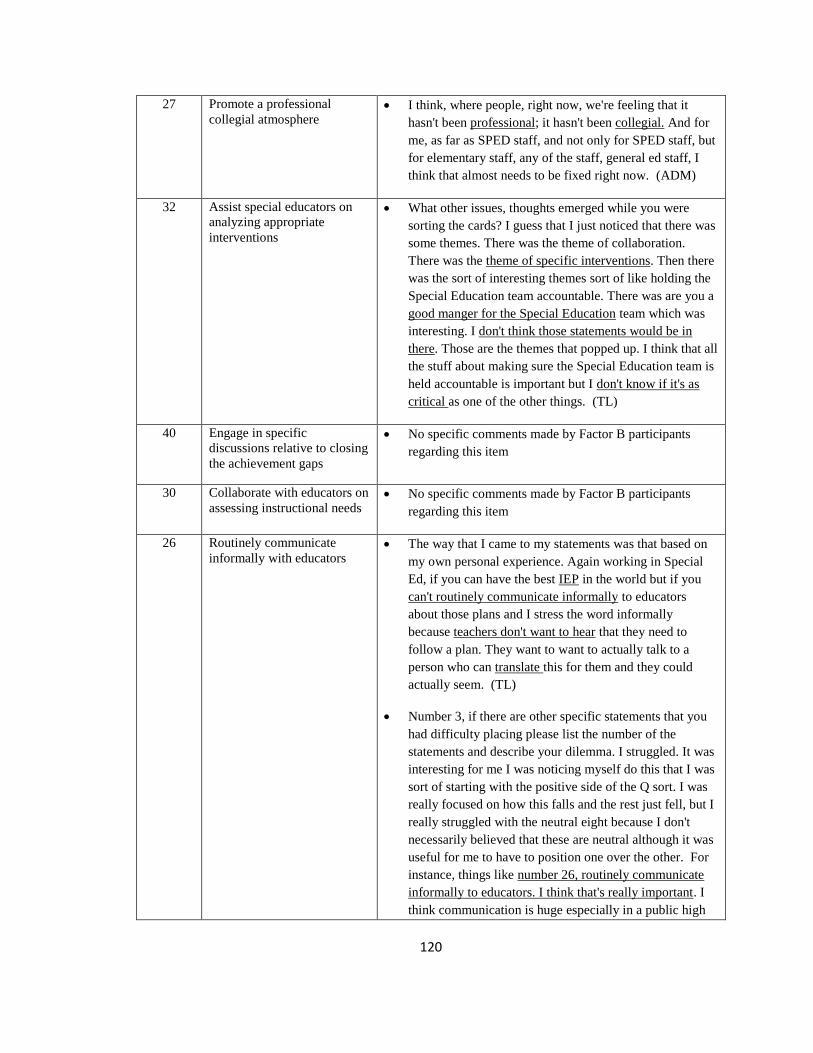
120
27 Promote a professional
collegial atmosphere I think, where people, right now, we're feeling that it
hasn't been professional; it hasn't been collegial. And for
me, as far as SPED staff, and not only for SPED staff, but
for elementary staff, any of the staff, general ed staff, I
think that almost needs to be fixed right now. (ADM)
32 Assist special educators on
analyzing appropriate
interventions
What other issues, thoughts emerged while you were
sorting the cards? I guess that I just noticed that there was
some themes. There was the theme of collaboration.
There was the theme of specific interventions. Then there
was the sort of interesting themes sort of like holding the
Special Education team accountable. There was are you a
good manger for the Special Education team which was
interesting. I don't think those statements would be in
there. Those are the themes that popped up. I think that all
the stuff about making sure the Special Education team is
held accountable is important but I don't know if it's as
critical as one of the other things. (TL)
40 Engage in specific
discussions relative to closing
the achievement gaps
No specific comments made by Factor B participants
regarding this item
30 Collaborate with educators on
assessing instructional needs No specific comments made by Factor B participants
regarding this item
26 Routinely communicate
informally with educators The way that I came to my statements was that based on
my own personal experience. Again working in Special
Ed, if you can have the best IEP in the world but if you
can't routinely communicate informally to educators
about those plans and I stress the word informally
because teachers don't want to hear that they need to
follow a plan. They want to want to actually talk to a
person who can translate this for them and they could
actually seem. (TL)
Number 3, if there are other specific statements that you
had difficulty placing please list the number of the
statements and describe your dilemma. I struggled. It was
interesting for me I was noticing myself do this that I was
sort of starting with the positive side of the Q sort. I was
really focused on how this falls and the rest just fell, but I
really struggled with the neutral eight because I don't
necessarily believed that these are neutral although it was
useful for me to have to position one over the other. For
instance, things like number 26, routinely communicate
informally to educators. I think that's really important. I
think communication is huge especially in a public high
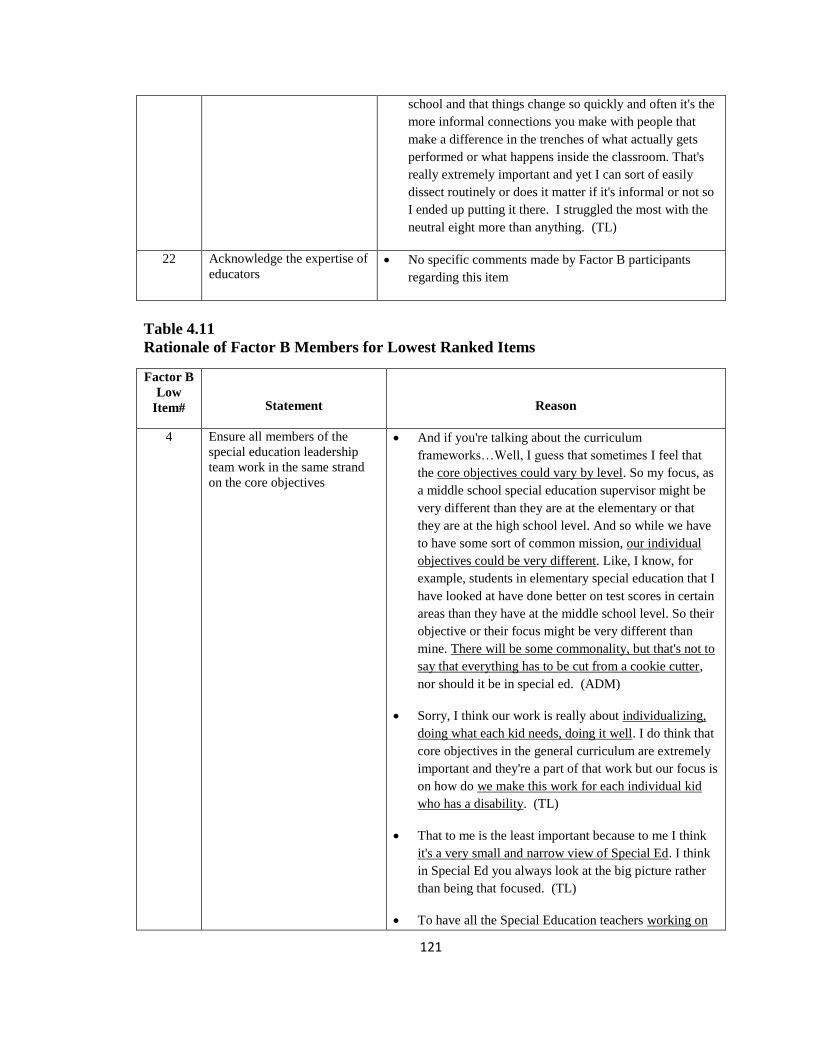
121
school and that things change so quickly and often it's the
more informal connections you make with people that
make a difference in the trenches of what actually gets
performed or what happens inside the classroom. That's
really extremely important and yet I can sort of easily
dissect routinely or does it matter if it's informal or not so
I ended up putting it there. I struggled the most with the
neutral eight more than anything. (TL)
22 Acknowledge the expertise of
educators No specific comments made by Factor B participants
regarding this item
Table 4.11
Rationale of Factor B Members for Lowest Ranked Items
Factor B
Low
Item#
Statement
Reason
4 Ensure all members of the
special education leadership
team work in the same strand
on the core objectives
And if you're talking about the curriculum
frameworks…Well, I guess that sometimes I feel that
the core objectives could vary by level. So my focus, as
a middle school special education supervisor might be
very different than they are at the elementary or that
they are at the high school level. And so while we have
to have some sort of common mission, our individual
objectives could be very different. Like, I know, for
example, students in elementary special education that I
have looked at have done better on test scores in certain
areas than they have at the middle school level. So their
objective or their focus might be very different than
mine. There will be some commonality, but that's not to
say that everything has to be cut from a cookie cutter,
nor should it be in special ed. (ADM)
Sorry, I think our work is really about individualizing,
doing what each kid needs, doing it well. I do think that
core objectives in the general curriculum are extremely
important and they're a part of that work but our focus is
on how do we make this work for each individual kid
who has a disability. (TL)
That to me is the least important because to me I think
it's a very small and narrow view of Special Ed. I think
in Special Ed you always look at the big picture rather
than being that focused. (TL)
To have all the Special Education teachers working on

122
the same core objectives isn't realistic at the high school
level because students have so many different needs and
for everyone to be kind of focused on the same strands
it doesn't seem realistic to me. (TL)
6 Ensure members of the special
education leadership team
divide their time properly
That kind of takes care of itself in scheduling. I don't
have to focus on that too much. (TL)
35 Understand that the relationship
with educators hinges on the
belief that leadership should be
distributed
The reason that I chose that is because one, is that the
other things seemed more practical like giving people
collaboration time or helping people work on
professional development goals or helping people come
up with the specific interventions to work with kids
where that one seems more theoretical. I don't think that
the person needs to have awareness that they understand
that leadership is distributed. I think that they probably
just naturally distribute it and even if they've never
heard the phrase distributed leadership they could still
be doing it very effectively. (TL)
8 Ensure members of the special
education leadership team
prioritize tasks they have to
perform
I would hope that you would have that group of people
that are professionals and can manage their job that you
kind of assume that. (TL)
20 Allow the special education
leadership team to function
autonomously
There is nothing worse that you can do to your people
than just leave them alone. Special Education is so
complex. There are so many opinions, ideas, methods,
strategies that if you do not support your people you are
not going to have a team because there's a million and
one different ways to do it. I think that kind of idea of
autonomous functioning is what kills us as school
districts and we're trying to kind of create of a cohesive
piece and lead people to do things with our students
who need the most individualization we shall always be
a team and we should always feel like we're supported
as a team. (TL)
I don't want them to be completely autonomous because
I don't think they are. I think they have to have a little
bit of autonomy but if they're too autonomous there's a
problem. (ADM)
I feel like that could actually be really detrimental,
especially inside of a school like this where we have
this inclusion model and you're just always working
together. We're moving towards trying to create a
culture where Special Education students are owned and

123
worked with and supported by all educators. Shared
responsibility to educate the kid. Exactly so... that
would be that. (TL)
3 Ensure the special education
leadership team supports the
district goals
I think it’ll be ideal if the district goals always aligned
with the goals of special ed. I think for a lot of different
reasons they don’t always and regardless either I guess I
just don’t think that being an effective leader hinges on
that necessarily. They don’t always line up frequently.
(TL)
37 Understand that the relationship
with educators is one of
interdependency
"Understand that the relationship with educators is one
of interdependency," and then, "Allow the special ed
leadership team to function autonomously." Again, for
me, I guess, I think, in my head, that they already
know this, so I'm feeling like that's not an area that I
have to really worry about right now. I don't know; I
could be wrong. It's already part of the culture.
(ADM)
I think that anybody in education that's a given. You
should already know that. (TL)
9 Ensure members of the special
education leadership team is
willing to execute a good idea
No specific comments made by Factor B participants
regarding this item
34 Ensure that all staff
understands the importance of
confidentiality
Well, as I mentioned before, it's kind of funny. As a
compliance officer, I put in the importance of
confidentiality being least-important. I figure, at this
stage of the game, if the leadership team doesn't
understand that confidentiality is important, then it,
you're in trouble. You know, basically, if you have
people on the team that don't understand that, the same
thing. (ADM)
Least important? Again, I just, I actually just sort of
worked from what I felt was the strongest, things that
were the strongest, all the way to the least. Some
people work from the opposite direction; I just worked
from that way, so it sort of ended up being
confidentiality. (ADM)
15 Encourage educators to try new
practices consistent with their
own interests
Well, one of the things that I noticed in trying to place
the cards was that, for me, there was a lot of
interrelationship or a lot of cross-over between some
of the statements. So when I looked at laying out the
statements, what I tried to do was look at "big picture"
as being the most important, and least important

124
maybe being the individual components of that big
statement. So for example, let me just try to find one
here. Well, I mean, if I'm encouraging educators to try
new practices, consistent with their own interests, to
me, that kind of falls under that sub-heading, in a lot of
ways. So what I did was, I took the idea that I thought
was the bigger picture, and I put that as more
important. And the components of that bigger picture,
I said, okay, that's only one aspect of that, so I kind of
pushed that to the side. (ADM)
I think everyone should be encouraged to pursue their
own goals for professional learning. However, and I
think that they should be thinking about what kinds of
things are out there, and what they could do better, as a
self-reflection. But I also see it being the role of the
special education supervisor or administrator to
provide information to them about what some of the
strategies are that are out there, what some of the
newer research is telling us, and to give them
information, too. (ADM)
Similarly to some of the highest ranked items, the lowest ranked distributed
leadership items of #4, #34, and #15 were segregated by role. Special education teacher
leaders were the majority (three out of four) of Factor B members to comment on item
#4. During the follow-up interviews, special education teacher leaders expressed that
they ranked item #4, Ensure all members of the special education leadership team work
in the same strand on the core objectives, low because this is not always realistic when
addressing and meeting the individual needs of students with special needs. Special
education administrators were the only Factor B members to comment on item #34,
Ensure that all staff understands the importance of confidentiality, and item #15,
Encourage educators to try new practices consistent with their own interests. In
addition, special education administrators shared that they ranked items #34 and #15 low
because confidentiality and encouraging educators to try new practices are not as
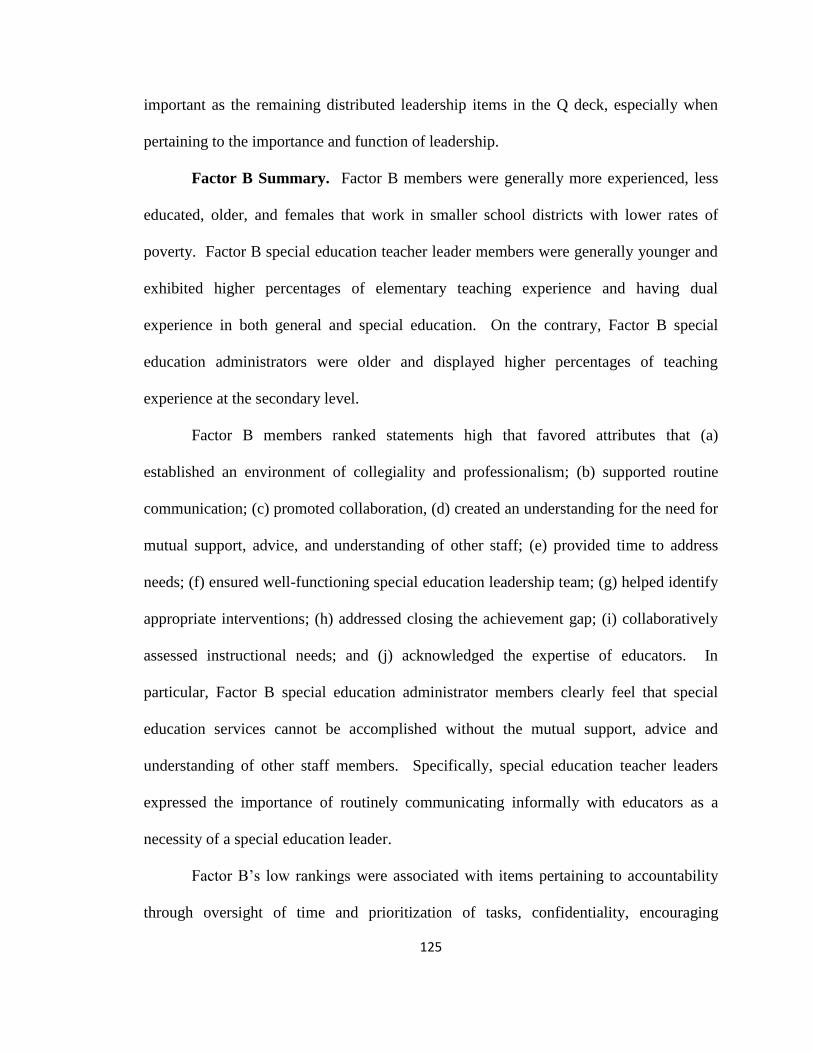
125
important as the remaining distributed leadership items in the Q deck, especially when
pertaining to the importance and function of leadership.
Factor B Summary. Factor B members were generally more experienced, less
educated, older, and females that work in smaller school districts with lower rates of
poverty. Factor B special education teacher leader members were generally younger and
exhibited higher percentages of elementary teaching experience and having dual
experience in both general and special education. On the contrary, Factor B special
education administrators were older and displayed higher percentages of teaching
experience at the secondary level.
Factor B members ranked statements high that favored attributes that (a)
established an environment of collegiality and professionalism; (b) supported routine
communication; (c) promoted collaboration, (d) created an understanding for the need for
mutual support, advice, and understanding of other staff; (e) provided time to address
needs; (f) ensured well-functioning special education leadership team; (g) helped identify
appropriate interventions; (h) addressed closing the achievement gap; (i) collaboratively
assessed instructional needs; and (j) acknowledged the expertise of educators. In
particular, Factor B special education administrator members clearly feel that special
education services cannot be accomplished without the mutual support, advice and
understanding of other staff members. Specifically, special education teacher leaders
expressed the importance of routinely communicating informally with educators as a
necessity of a special education leader.
Factor B’s low rankings were associated with items pertaining to accountability
through oversight of time and prioritization of tasks, confidentiality, encouraging

126
educators to try new practices, autonomy, interdependency, and alignment of the work in
special education to the district goals and core objectives. Specifically, special education
administrators expressed that confidentiality and encouraging educators to try new
practices are not as important as the other distributed leadership attributes. In addition,
special education teacher leaders particularly felt that having the leadership team work in
the same strand on the core objectives is not realistic when taking into consideration the
individual needs of the students.
Similarities Among Special Education Distributed Leadership Statements
Within both factors, item #1, Ensure there is a well-functioning special education
leadership team, was ranked highly. Several Factor A special education teacher leader
and special education administrator members commented on item #1 during their follow-
up interviews. Factor A members stated, in order for a special education leadership team
to be well-functioning, then certain processes must be in place that include (a) supporting
staff, (b) ensuring roles and goals are clearly defined, (c) providing open and effective
channels of communication, and (d) prioritizing tasks accordingly to the needs of the
organization. Three Factor B members also provided commentary about item #1. For
example, one Factor B special education administrator stated that he chose to rank card 1
high because “If the special education leadership team isn’t well-functioning, then it’s not
going to be possible to complete the chores of special education, to deliver services, and
to be out there creating programs.” The remaining two Factor B members, both special
education teacher leaders, provided similar responses that “ultimately if you don’t have a
well-functioning team at the top, things can fall apart really fast”, and “without
leadership, nothing else is going to work.”
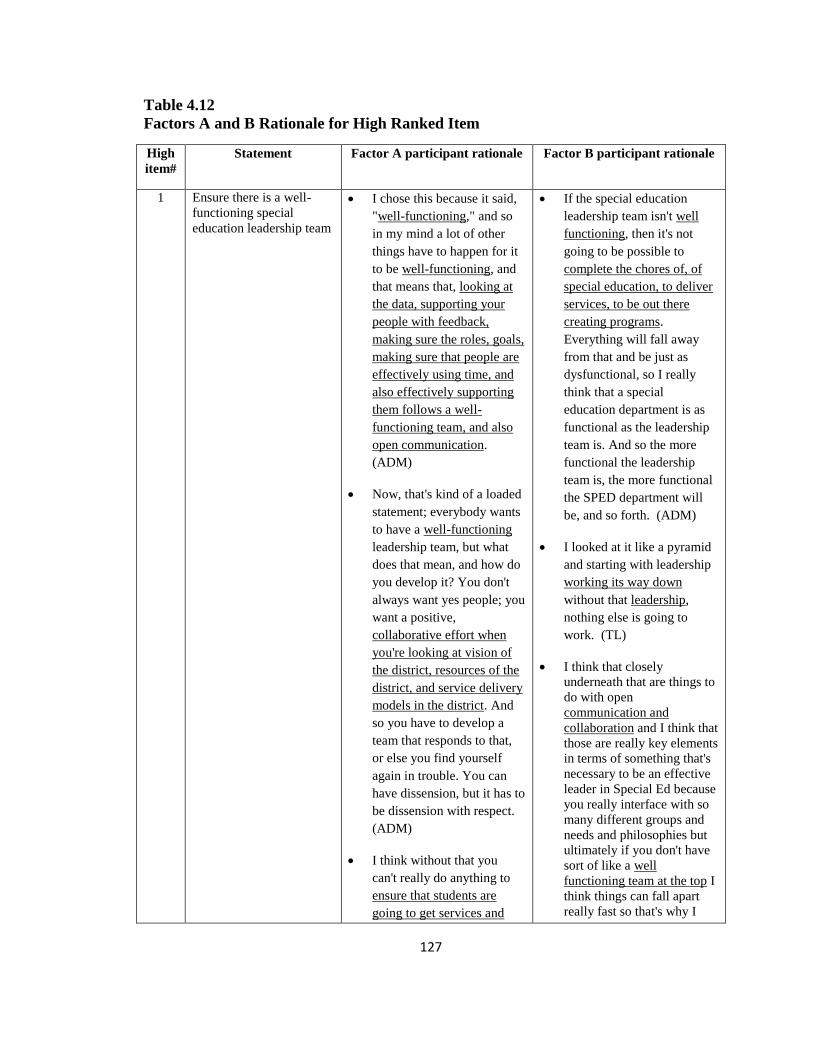
127
Table 4.12
Factors A and B Rationale for High Ranked Item
High
item#
Statement Factor A participant rationale Factor B participant rationale
1 Ensure there is a well-
functioning special
education leadership team
I chose this because it said,
"well-functioning," and so
in my mind a lot of other
things have to happen for it
to be well-functioning, and
that means that, looking at
the data, supporting your
people with feedback,
making sure the roles, goals,
making sure that people are
effectively using time, and
also effectively supporting
them follows a well-
functioning team, and also
open communication.
(ADM)
Now, that's kind of a loaded
statement; everybody wants
to have a well-functioning
leadership team, but what
does that mean, and how do
you develop it? You don't
always want yes people; you
want a positive,
collaborative effort when
you're looking at vision of
the district, resources of the
district, and service delivery
models in the district. And
so you have to develop a
team that responds to that,
or else you find yourself
again in trouble. You can
have dissension, but it has to
be dissension with respect.
(ADM)
I think without that you
can't really do anything to
ensure that students are
going to get services and
If the special education
leadership team isn't well
functioning, then it's not
going to be possible to
complete the chores of, of
special education, to deliver
services, to be out there
creating programs.
Everything will fall away
from that and be just as
dysfunctional, so I really
think that a special
education department is as
functional as the leadership
team is. And so the more
functional the leadership
team is, the more functional
the SPED department will
be, and so forth. (ADM)
I looked at it like a pyramid
and starting with leadership
working its way down
without that leadership,
nothing else is going to
work. (TL)
I think that closely
underneath that are things to
do with open
communication and
collaboration and I think that
those are really key elements
in terms of something that's
necessary to be an effective
leader in Special Ed because
you really interface with so
many different groups and
needs and philosophies but
ultimately if you don't have
sort of like a well
functioning team at the top I
think things can fall apart
really fast so that's why I

128
teachers are going to get the
supports that they need so
we as a team need to be
organize and functioning
well. (ADM)
I'm looking at my chart
here, move across and start
with a good foundation, a
base. So I felt like those
three things (statements #1,
#5, and #10) gave me that
base, to start a good
leadership team. (ADM)
I think to have a well
balanced and effective
Special Ed department you
have to have a strong team
so I think that that kind of
drives the whole rest of the
cards here so making sure
that people understand what
their job is, that they
understand how to do it and
just having good leadership
skills is essential. I've seen it
where you don't have it and
it doesn't work. (ADM)
I don't see how it gets more
important than that because
if that's not functioning
well, it's going to be chaos.
(TL)
Ensure there is a well
functioning Special
Education leadership team
because as far as Special Ed
department can’t function
without competent leaders
that are well respected.
That's what I was looking
for. (TL)
For me that is critical, that's
chose that card. (TL)

129
everything. (TL)
I picked number 1 because I
thought that that
encapsulated a lot of the
good points in these entire
40 cards but especially the
number 7 and the number
10...If you don't have a well
functioning team, the people
in the team have to have the
same thought process and
we all have to work together
in the best interest of the
students. If we're not all on
the same page then it's not
going to work for the
student. (TL)
Factor A members and Factor B members shared only one low ranked distributed
leadership item, #15, Encourage educators to try new practices consistent with their own
interests. Members of Factor A and Factor B ranked distributed leadership item #15 low
because managing individual interests was not viewed as a priority (see table 4.13). This
feeling appeared particularly true for administrators as four special education
administrators (2 Factor A ADM and 2 Factor B ADM) provided comments pertaining to
this item compared to only one special education teacher leader that belong to Factor A.
As one Factor A special education administrator stated, when referring to item #15,
"Encouraging new practices in their own interests. I kind of feel like you need to stay
focused on what the goal is of the district, the core, you know, curriculum. So, yeah, you
have interests, but, really, you need to stay up with what's the focus of the district.” A
Factor A special education teacher leader added, “Trying new practices that are of an
educator’s interest are not always in the best interest of the student population. I would
encourage teachers to explore new practices that are in the students’ best interest.”

130
Further, the one Factor B administrator expressed that the role of special education
administrator includes providing information and strategies to teacher leaders.
Table 4.13
Factors A and B Rationale for Ranking Item #15 Low
Low
item #
Statement Factor A participant rationale Factor B participant rationale
15 Encourage educators to
try new practices
consistent with their
own interests
Encouraging new practices
in their own interests. I kind
of feel like you need to stay
focused on what the goal is
of the district, the core, you
know, curriculum. So, yeah,
you have interests, but,
really, you need to stay up
with what's the focus of the
district. (ADM)
I don't know that their own
interests necessarily
coordinate with curriculum
and framework so I put that
as last. I don't want them
going off on a tangent,
especially in Special Ed if
you're trying to do
specialized instruction you
don't have the kids for a lot
of time so it has to be highly
effective and
efficient...especially when
there's an IEP involved.
(ADM)
Trying new practices that
are of an educators interest
are not always in the best
interest of the student
population. I would
encourage teachers to
explore new practices that
are in the students best
interest. Then it would have
been a statement placed in a
different column. (TL)
Well, one of the things that I
noticed in trying to place the
cards was that, for me, there
was a lot of interrelationship
or a lot of cross-over
between some of the
statements. So when I
looked at laying out the
statements, what I tried to do
was look at "big picture" as
being the most important,
and least important maybe
being the individual
components of that big
statement. So for example,
let me just try to find one
here. Well, I mean, if I'm
encouraging educators to try
new practices, consistent
with their own interests, to
me, that kind of falls under
that sub-heading, in a lot of
ways. So what I did was, I
took the idea that I thought
was the bigger picture, and I
put that as more important.
And the components of that
bigger picture, I said, okay,
that's only one aspect of
that, so I kind of pushed that
to the side. (ADM)
I think everyone should be
encouraged to pursue their
own goals for professional
learning. However, and I
think that they should be
thinking about what kinds of
131
things are out there, and what
they could do better, as a self-
reflection. But I also see it
being the role of the special
education supervisor or
administrator to provide
information to them about
what some of the strategies
are that are out there, what
some of the newer research is
telling us, and to give them
information, too. (ADM)
Summary
The data collected from this study was subjected to factor analysis using
Schmolck’s pre-flagging algorithm. Factor A and Factor B consisted of 16 and 13
special education leaders respectively. Factor A was composed of 8 teacher leaders and 8
administrators, while Factor B included 7 teacher leaders and 6 administrators. There
was one minority special education leader between the two factors.
Factor A accounted for the majority of the variance and were generally younger,
more educated with less experience at their current position, and that were working in
larger school districts with higher rates of poverty. Members of Factor A assigned high
scores to distributed leadership attributes linked to (a) a well-functioning leadership team,
(b) clear goals, (c) clear roles and responsibilities, (d) task prioritization, (e) support for
district goals, (f) the belief in distributing leadership, (g) assignment of responsibilities
linked to competencies of staff, and (h) an understanding that service delivery requires
mutual support, advice, and understanding. Special education administrators specifically
expressed the necessity for special education leaders to support the district goals, as
special education teacher leaders distinctively conveyed the importance of ensuring the
132
special education leadership team has clear roles and responsibilities, as well as clear
goals. Factor B was responsible for a smaller portion of the variance in the data;
predominantly comprised of more experienced, less educated, older, females working in
smaller and more affluent school districts. Also, Factor B members ranked high
leadership items connected to the qualities of (a) mutual support and understanding, (b)
time to address student needs, (c) open communication, (d) well-functioning teams, (e)
collegiality, and (f) professionalism, which are closely linked to cultural distribution.
The qualitative data established an understanding of the participants’ thought
processes from Factor A and Factor B in the sorting of distributed leadership items in
distinct ways. Factor A members comments supported these findings with statements
such as “well-functioning means looking at data, supporting your people with feedback,
making sure the roles and goals (are clear), making sure that people are effectively using
time, and also effectively supporting them”, “you want a positive, collaborative effort
when you’re looking at vision, resources, and service delivery of the district”, and “we all
have to work in the best interest of the students.” Factor A members favored attributes
that are closely connected to strategic distribution.
Factor B special education administrator members clearly felt that special
education services cannot be accomplished without the mutual support, advice and
understanding of other staff members, while special education teacher leaders expressed
the importance of routinely communicating informally with educators as necessity of a
special education leader. Factor B members stressed these qualities with their comments
of “everyone has to buy into educating the student from the top all the way down, and
most importantly in the trenches”, “being able to communicate, being collegial”, and “it’s

133
really important to work as a team, both special educators and general educators, working
collaboratively.”

134
CHAPTER 5
DISCUSSION
This section will explore possible interpretations of the results obtained from
Massachusetts special education leaders’ perceptions of distributed leadership. The focal
point of this discussion will be an exploration of the findings in relationship to participant
roles and the interaction of roles with distributed leadership statement rankings. A
suggested continuum of distributed leadership based on the findings of this study is
explored in the context of emerging leadership approaches. The discussion culminates
with suggestions for future studies in the areas of special education and distributed
leadership.
Demographic Similarities and Differences among Participant Distributed
Leadership Sorts
The demographic similarities and differences of Factor A and Factor B
participants offer some insight on the distributed leadership attributes that members
favored from each factor. The sorting patterns of members belonging to each factor are
consistent with many of the trends and patterns reported in the literature. In addition,
participant role (as special education teacher leader or special education administrator)
helped to provide further explanation of the participants’ perceptions of the necessary
distributed leadership attributes required in special education.
Demographic Influence on Perceptions of Distributed Leadership
Factor demographics provided some understanding of Factor A members’
perceptions of special education through the lens of distributed leadership. Factor A
members were generally younger, more educated, and less experienced at their current

135
position, and were working in larger school districts with higher poverty levels. Factor A
included the youngest (P28) participant in the study. Research indicates that novice
administrators have a greater tendency to be described as more bureaucratic, driven,
direct, and less democratic, indicating a preference to practicing a top-down approach
(Schmidt, Kosmoski, & Pollack, 1998). In addition to Factor A members’ age, the lack
of dual experience in the areas of general and special education could also explain why
there was a preference to top-down compared to more collaborative forms of distributed
leadership. Additional research shows that differences in experiences and with
perceptions of the need for change of school leaders lead to the employment of different
effective improvement strategies (Day, Leithwood, & Sammons, 2008).
Further, the majority of Factor A members (including 4 special education teacher
leaders and 5 special education administrators) had less than 5 years of experience at their
current position indicating an increased probability that these special education leaders
work in districts with higher levels of turnover. Numerous special educators have been
found to leave teaching every year or transfer into general education (McLeskey, Tyler,
& Flippen, 2004). Often these vacancies are filled by unqualified special education
teachers. Districts with high turnover will likely have fewer teachers available to assume
leadership positions, and the teacher leaders in the district will be spending an increased
amount of time dedicated to mentoring new colleagues and less time on leadership tasks
(Billingsley, 2007, 2007; Billingsley et al., 2004). As a result, it’s not surprising that
Factor A members favored items pertaining to roles, responsibilities, and goals,
especially when considering very few have been able to define teacher leadership in the
literature (York-Barr & Duke, 2004). Overall, Factor A members’ age and lack of

136
experiences helps to explain why Factor A members may have favored a planned form of
distributed leadership.
In addition, there were some demographic differences in members of Factor B
compared to members of Factor A. A larger percentage of Factor B members,
particularly the special education teacher leaders, had teaching experience in both general
and special education. Specifically, P16 also was the participant to have more general
education administrative experience (15 years) than special education administrative
experience (6 years), as well as being the only participant to hold a doctorate degree.
There was evidence by a number of Factor B participants who discussed the importance
of the relationship between general and special educators. Research has found that the
support from general education teachers was an important aspect of the support needed
for a long-term career in the field of special education (Prather-Jones, 2011). Special
education administrators have the challenging responsibility of building positive
relationships not only with special education staff, but also between general and special
education teachers and administrators to assure that high quality educational programs
are accessible to all students regardless of ability (Lashley & Boscardin, 2003). The
difference in the type of teaching experience could explain why members of Factor B
favor distributed leadership that prefers professional collegiality.
Factor B members predominantly comprised of more experienced, older, females
working in smaller, more affluent school districts. Loder and Spillane (2005) report that
women school administrators experience some role conflict in their first five years of
transitioning from teacher to administrator. However, the female participants belonging
to Factor B were generally older and more experienced as seventy-five percent of Factor

137
B members had more than 5 years experience in their current position. The majority of
Factor B members fell into the 41-60 age groups at 84 percent with the majority teacher
leaders falling into the 41-50 age group, and the majority of administrators falling into
the 51-60 age group. Research suggests that age is a factor in the consideration in
appointing educators for leadership positions (Ibukun & Oyewole, 1997). In addition,
literature has found that older, more experienced administrators have been perceived as
more effective (Ibukun, Oyewole, & Abe, 2011). The age of the members of Factor B
could have contributed to the high ranking of statements pertaining to professionalism
and collegiality in their approach to distributed leadership. Research conducted on
business executives found that the oldest group was more open to learning compared to
younger professionals, thus demonstrating a greater desire to work with others (Klein,
Astrachan, & Kossek, 1996). This offers another possible explanation of why Factor B
members ranked items high that pertained to collegiality. Although 77 percent of Factor
B members were female and consisted of one male administrator (compared to 50 percent
of Factor A members being female), research indicates that gender differences have
minimal influence when men and women have relatively similar power (Barry, 2002).
Further, Factor B included the one minority participant (P8) in this study who was
also the only participant to hold an administrative position in a related service area
(speech and language) in special education. Unfortunately, the lack of diversity in these
two areas in this study also represents the trend in the educational school system. For
example, only one out of the 17 school districts from Massachusetts that were represented
in this study offered an administrative position in the related service field. Additionally,
although there is an overall dearth of research on minority special education

138
administrators, 17.6 percent of all U.S. school principals were of minority backgrounds in
2007-2008 school year (Sanchez, Thornton, & Usinger, 2009).
Factor B contained significantly more teacher leaders whose districts made AYP
for both English Language Arts (ELA) and Math than Factor A. Research suggests that
positive working conditions such as “fostering a collegial, trusting, team-based, and
supportive culture; promoting ethical behavior; encouraging data use; and creating strong
lines of communication” directly influences the quality of instruction (Clifford,
Behrstock-Sherratt, & Fetters, 2012). Moreover, research indicates an association
between positive working conditions and student achievement (Ladd, 2009). In addition,
Factor B special education teacher leaders represented the largest subgroup from either
factor that (a) worked in districts with student populations less than 3,000 students, (b)
attained AYP for both ELA and math, and (c) worked in districts whose free and reduced
populations were below the state average. Research suggests that smaller school districts
with smaller populations of disadvantaged students perform better on standardized
assessments (NCTAF, 1996; Roza, 2001).
Furthermore, the student demographics in which members of Factor B were
serving may have contributed to the high ranking of collegiality. Sixty-nine percent of
the members of Factor B worked in school districts in which their free and reduced lunch
populations were less than the state averages compared to 50 percent of members of
Factor A. The majority of these members of Factor B were teacher leaders. The smaller
the proportion of disadvantaged students in a school, the more capable a school is to
engage in effective problem-solving processes (Pallas, Natriello, and McDill, 1989).
Overall, factor demographics played a significant role with understanding Factor B

139
members’ perceptions of special education through the lens of distributed leadership.
Factor B members are drawn to distributed leadership that empowers leaders and
followers through mutual work and trust. Factor B members’ sorting patterns, comments,
and demographics suggest that they value distributed leadership in which leadership is
embedded in the culture of the organization, decisions are data-driven, and accountability
maintain through professional collegiality. As a result, these attributes are connected to
the embedded form of distributed leadership on the continuum.
Factor Profiles
Distinct profiles of each factor emerged as a result of the sorting patterns and
responses of Factor A and Factor B members. The sorting patterns and comments of
Factor A members indicated that this group required time for careful planning to
accomplish the highly ranked distributed leadership tasks, whereas the sorting patterns
and comments of Factor B members revealed the need for high levels of support,
collegiality, and communication in order for special education services to be
accomplished.
The Planned Distribution Profile of Factor A Special Education Leaders
The distributed leadership perspectives of Factor A members are consistent with
strategic distribution. Macbeath et al. (2004) define strategic distribution as a “planned
appointment of individuals to contribute positively to the development of leadership
throughout the school.” Macbeath et al. state the distinct characteristic of strategic
distribution is its goal orientation with an emphasis on a long-term goal of school
improvement. Leaders practicing strategic distribution are very calculated in their
appointments of individuals as they attempt to match the compatibility of skill sets within

140
teams of educators and less in terms of individual competencies. Once roles and
responsibilities have been assigned, a leader provides “professional trust” by presuming
competence in performance unless proven otherwise (Macbeath et al.).
Factor A members favored distributed leadership items pertaining to
accountability through the implementation of clear roles, responsibilities, and goals. The
responses from members of Factor A indicate a theme of strategic distribution, especially
with the high ranking of item #5, Ensure people are assigned responsibilities based on
competencies. Factor A members’ highest ranked statement was item #1, Ensure there is
a well-functioning special education leadership team.
Eight out of the 10 top items for Factor A participants began with the verb
“ensure”, results which implies a desired higher level of accountability than the
remaining statements that began with verbs such as provide, encourage, and allow. As
mentioned in chapter 2, Spillane et al. (2004) identified several leadership functions that
included constructing and selling a vision and providing both summative and formative
monitoring. Both of these functions are a framework for providing accountability and
establishing clear goals. In addition to favoring the approach of strategic distribution, the
high ranking of item #5 suggests a preference for distributing leadership through
collective distribution. Spillane et al. describes collective distribution as leaders working
separately but interdependently to achieve a shared common goal.
In addition, comments from the follow-up interviews with Factor A members
provide evidence that the highly ranked items of #7, #10, and #3 were segregated by role.
The comments by special education teacher leaders indicate this group feels strongly that
a necessity of being an effective leader of special education includes ensuring the
141
leadership team has clear goals (item #7), as well as ensuring the leadership team has
clear roles and responsibilities (item #10). These highly valued attributes of Factor A
special education teacher leaders are sensible when taking into consideration that special
educators may be “overwhelmed with the idea of leadership” because of various role
problems that exist in special education (Billingsley, 2007). In order for special
education teacher leaders to address some of these role problems, they need the support
from district administrators to meet their responsibilities in order to effectively meet the
needs of students with disabilities (Billingsley). Factor A special education
administrators identified the necessity for providing support for district goals by being the
only Factor A members stating they strongly valued item #3 –ensuring the special
education leadership team supports the district goals.
Additionally, special education administrators were the only Factor A members to
comment on the lowest ranked items of #13 and #38, as well as representing the majority
(four ADM to one TL) that commented on item #14. Their comments implied that Factor
A special education administrator members ranked these items low because these three
items were related to lower level, managerial tasks that were not directly related to the
instruction and programming of students with disabilities. More specifically, the
comments of Factor A special education administrators revealed: being accountable after
school to help educators (item #13) is viewed as mechanic and not essential to special
education leadership; collaborating with educators to develop home-school relations
(item #38) is systematically set-up, not the teachers responsibility and it was not
considered to be as essential as the majority of statements in the Q deck; and,
encouraging educators to pursue their own goals for professional learning (item #14)

142
must be connected to the district’s goals and curriculum. Although the general
conception of educational leadership traditionally views administrators as handling non-
teaching responsibilities (Silva et al., 2000), there is an increased awareness of the
necessity of teacher leadership for educational reform efforts (Fullan, 1994). Based on
the responses of Factor A members, they evidently recognize the importance of teacher
leadership as the special education teacher leaders favored items pertaining to roles,
responsibilities, and goals; and special education administrators ranked items low that
were considered not as essential as the higher ranked items. Assigning reasonable roles
and responsibilities is one effective strategy that administrators can implement to retain
special education teachers (Leko & Smith, 2010). Understanding the necessity of teacher
leadership for educational reform efforts could be attributed to high educational levels of
the members of Factor A, particularly the special education teacher leaders.
Factor A members’ reactions and comments about the necessities of effective
leaders of special education reflect attributes described in the distributed leadership
approaches of both strategic and collective distribution. Strategic distribution tends to
suggest a top-down approach to leadership (Macbeath et al., 2004). Factor A members’
responses indicate a preference to a top-down approach of leadership with the high
rankings and responses pertaining to those items. For example, one Factor A
administrator summarized her belief statement by stating,
“For me, picking the first was really the essence of the belief system which I
picked. ‘Understand the relationship with educators hinges on the belief that
leadership should be distributed.’ Because, I think, in the field of special ed.,
there are so many nuances and aspects to it, no one entity can hold it, and no one
administrative team. I think everyone has a role and a part to play in the
process…Obviously, this notion of top-down leadership, what do we know, I
think, about education, because it’s hard for me to separate special ed.

143
administration from education and teaching and learning, and where we want to
affect change, I see there’s a place for top-down at times, and then there’s a place
where you have to share it and own it to move something forward.”
This statement shares the view of distributed leadership as also being concertive action.
This form of distributed leadership is holistic where the sum is greater than the equal
parts (Gronn, 2002). Factor A members’ comments shared the understanding that in
order to effectively complete the tasks most necessary to being an effective leader of
special education, the leaderships tasks must be distributed.
In summary, the sorting patterns and comments of Factor A members indicate
attributes of distributed leadership described in the literature that include: (a) the planned
appointments of individuals based on competencies and skill levels (Leithwood, 2005);
(b) the understanding that leadership tasks should be distributed (Bennet et al. 2003); and
(c) accountability through the implementation of clear roles, responsibilities and goals
(Macbeath et al., 2004). Clearly indicated in the sorting patterns and comments was the
need for careful planning to accomplish the distributed leadership tasks that were ranked
highly by Factor A members.
The Embedded Distribution Profile of Factor B Special Education Leaders
Members of Factor B favored items that pertained to attributes that are closely
connected to cultural distribution. Macbeath et al. (2004) define cultural distribution as
“practicing leadership as a reflection of the school’s cultural, ethos and traditions.”
Further, cultural distribution is described as a community of people working together
towards a common goal in which leadership is assumed, shared, and embedded in the
culture of the organization (Macbeath et al.). As a result, the emphasis from leaders and
leadership shifts to a professional learning community where leadership tasks are

144
accomplished by working collaboratively together. Members of Factor B highly ranked
items that established a distributed leadership environment of collegiality and
professionalism; one that supported communication, emphasized the needs of the
students, and established strong organizational structures.
Members of Factor A referenced the words “top-down” when describing their
perspectives of a well-functioning special education leadership team, while members of
Factor B referenced the words collegiality and communication. Three of highest ranked
items numbered 28, 27, and 26 for Factor B included the terms collegial and
communication. Additionally, item #32, Assist special educators on analyzing
appropriate interventions, and item #40, Engage in specific discussions relative to
closing the achievement gaps, are two more items related to “encouraging data use” that
were ranked high by Factor B members. These attributes are connected closely to cultural
distribution. The practice of cultural distribution relies heavily on trust and competence
which can only be accomplished in a truly collegial environment with high levels of
communication that values everybody’s opinion (MacBeath, 2005). Further, high levels
of collegiality are visibly present in successful professional development efforts (Evans,
1991).
In addition, the comments of Factor B members indicate that the highly ranked
items of #39 (emphasizing the need for mutual support, advice, and understanding to
accomplish special education services) and #26 (routinely communicating informally to
educators) were segregated by role, as special education administrators were the only
Factor B members to comment on distributed item #39 and special education teacher
leaders were the only Factor B members to comment on item #26. The comments

145
pertaining to the highest ranked item reveal that Factor B special education administrator
members clearly feel that special education services cannot be accomplished without the
mutual support, advice and understanding of other staff members. Research has indicated
that issues of support had a determining influence on special education teachers to remain
in the field of teaching as well as finding that support from administrators was influential
on their career decisions (Prather-Jones, 2011). Further, special education teacher leaders
were the only Factor B members to comment on item #26 that stressed the importance of
routine informal communication with educators. Research indicates that teachers talk to
each other on a daily basis (Zahorkik, 1987). Further, research supports that effective
schools are characterized by teacher to teacher and teacher to principal collegiality
(Evans, 1991). Special education teachers have reportedly referenced the necessity of
having administrative and collegial support in their workplace (Prather-Jones).
Overall, the sorting patterns and comments of Factor B members indicate
attributes of distributed leadership described in the literature that include: (a) collegiality
(Zahorkik, 1987), (b) administrative support (Prather-Jones, 2011), and (c) high levels of
open communication (MacBeath, 2005). In order for special education services to be
accomplished, Factor B members’ sorting patterns and comments indicated the necessity
for high levels of support, collegiality, and communication.
The Distributed Leadership Continuum
Distributed leadership is a multi-actor practice in which people contribute to a
group or organization through their individual actions (Bennett, Harvey, Wise, & Woods,
2003). Viewed as a product of interactions between school leaders, followers, contexts,
and artifacts (Spillane, 2005), distributed leadership enables opportunity for individuals

146
to exercise leadership aligned with school goals through agential and structural
dimensions of the organization (MacBeath et al., 2004; Garand, n.d.). This does not
mean, however, that the practice of distributed leadership does not fall along a continuum
of participation and engagement. Distributed leadership has the potential to range from
collegial professional practices that involve others in a much broader and collective sense
to practices that are much more hierarchical and authoritarian. Within collegial
professional leadership practices school, district, and community representation
contribute to decision-making, development of educational goals, and improvement of
educational practice and outcomes (Sergiovanni, 1991). In this section, the possibility of
a distributed leadership continuum will be explored along which the traits for each
extreme will be identified.
The distributed leadership continuum originated from the qualitative and
quantitative data from this study, as well as from the works of: Gronn (2002; 2008);
Bennet et al. (2003); Spillane et al. (2001; 2004); Leithwood et al. (2007); Mascall et al.
(2008); and MacBeath et al. (2004). The majority of the research and models presented
on distributed leadership is from the perspective of the instructional or school leader.
The distributed leadership continuum considers leadership from an organizational
perspective, such as a school district. The vast majority of special education
administrators (14 of 15) that participated in this study were serving their position at the
district level. As stated throughout this paper, special education leaders are responsible
for high quality programming which does include the compliance of meeting the
instructional needs of students with disabilities. Although the distributed leadership
continuum encapsulates school leadership, it can also be applied to other areas of

147
educational leadership such as special education. The proposed distributed leadership
continuum has three stages with two transitional periods, one in between each stage. The
continuum (see figure 5.1) models the progression of distributed leadership as an
organization increases its capacity to build leadership.
At one end of the distributed leadership continuum is natural distribution. As
stated in the previous chapter, Factor B members assigned a low ranking to item #35
because their general feeling was the distribution and prioritization of leadership tasks
should not be assigned, but take place naturally (“tasks prioritize themselves”) within the
special education leadership team. The distribution of leadership tasks in this stage takes
place naturally. Similarly to the description of spontaneous alignment by Leithwood et
al. (2007), natural distribution is a pattern of distributed leadership in which leadership
tasks are assigned spontaneously with little to no planning while educators work
collectively together. As a result of insignificant time dedicated to planning, natural
distribution is often in response to an immediate need. Roles are assigned according to
compatibility of skills and competencies needed to perform the leadership tasks. Similar
to transactional leadership, this form of distributed leadership tends to be reactive at times
as issues begin to arise, and produces minimal results.
In the middle of the distributed leadership continuum is planned distribution.
Planned distribution follows the preferred distributed leadership pattern of Factor A
members shared in the previous section. This form of distributed leadership is holistic in
nature as leaders following planned distribution fundamentally believe that leadership
tasks must be distributed in order for the organization to accomplish the many tasks
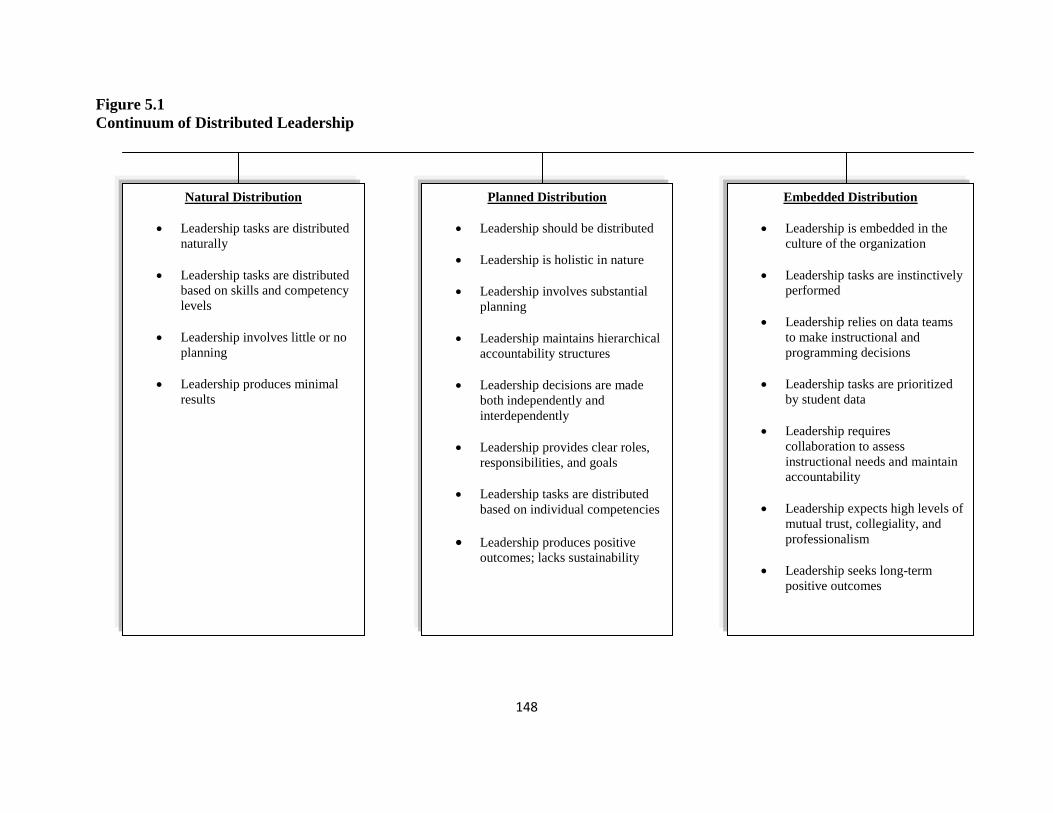
148
Figure 5.1
Continuum of Distributed Leadership
Natural Distribution
Leadership tasks are distributed
naturally
Leadership tasks are distributed
based on skills and competency
levels
Leadership involves little or no
planning
Leadership produces minimal
results
Planned Distribution
Leadership should be distributed
Leadership is holistic in nature
Leadership involves substantial
planning
Leadership maintains hierarchical
accountability structures
Leadership decisions are made
both independently and
interdependently
Leadership provides clear roles,
responsibilities, and goals
Leadership tasks are distributed
based on individual competencies
Leadership produces positive
outcomes; lacks sustainability
Embedded Distribution
Leadership is embedded in the
culture of the organization
Leadership tasks are instinctively
performed
Leadership relies on data teams
to make instructional and
programming decisions
Leadership tasks are prioritized
by student data
Leadership requires
collaboration to assess
instructional needs and maintain
accountability
Leadership expects high levels of
mutual trust, collegiality, and
professionalism
Leadership seeks long-term
positive outcomes

149
necessary to be effective. Accountability follows a hierarchical format in which progress
monitoring typically takes place through formative and summative evaluations. Roles,
responsibilities, and goals are clearly defined within the organization. Leaders and
followers work collectively together; however, the emphasis of the collaborative work is
on receiving feedback and participating in reflective conversations as it relates to
improving instruction. Similar to natural distribution, leadership tasks are assigned based
on individual competencies in this stage of the continuum. Decisions are made both
independently and interdependently. Planned distribution generally produces positive
outcomes, but has difficulties with sustainability because decisions are not consistently
data driven. Leaders practicing planned distribution focus the collective work on the
needs of the organization. Factor A members generally ranked items low that related to
the use data. For instance, one Factor A teacher leader stated, “Personally data bores the
hell out of me and I think too often we get caught in that minutia. It's like the kid you
have in your class a lot of times the IEP is the individual and they don't need the data.”
As distributed leadership transitions from natural distribution to planned
distribution on the continuum, leaders begin to shift the focus of their collective work
from spontaneous collaboration to the development of long-term goals through increased
time dedicated towards planning and implementation. The distribution of leadership
tasks starts to change from instant decisions to careful planning and sometimes
meticulous thought based on individual competencies. Further, hierarchical structures
begin to develop as roles, responsibilities, and goals are defined.
At the other end of the proposed continuum is embedded distribution. This form
of distributed leadership is patterned after the distributed items ranked high by Factor B

150
members. Leadership in this stage is no longer assigned as it is embedded in the culture
as members of the organization instinctively perform leadership tasks. Members work
collectively and collegially using data teams to determine the instructional and
programming needs of the students, as well as monitoring student progress. Members do
not need to prioritize the tasks, as the tasks prioritize themselves with student data which
is essential for maintaining accountability. Within this culture of the work are high levels
of mutual trust, collegiality, and professionalism. Embedded distribution produces long-
term positive outcomes as the research supports collective collegiality as an effective
approach for achieving sustained organizational improvement (Woods & Weasmer,
2004).
As distributed leadership transitions along the continuum from planned
distribution to embedded distribution, leadership becomes less bureaucratic and more
collegial. The focus shifts from reflective conversations to data driven decisions.
Leadership becomes embedded in the culture and is instinctive rather than leadership
tasks being assigned based on competencies. Accountability shifts away from a
hierarchical structure as mutual trust, collegiality, and professionalism increase
throughout the organization. The careful planning continues, but the positive outcomes
become sustainable for the long-term.
This study brings increased awareness the need for educational leadership
preparation programs to devote more attention to special education leadership. In order
for special education leaders to meet the demands of the position, it is necessary that they
practice leadership that effectively and collaboratively distributes leadership tasks.

151
Limitations and Suggestions for Future Studies
Barata (2007) noted the Q-sort methodology has several limitations because of
the force choice nature of sorting. The force choice limits participants from expressing
other opinions that are not part of the choice (Bracken & Fischel, 2006; Cosman-Ross &
Hiatt-Michael, 2005). For this investigation, the Q-sort’s choice process forced special
education teacher leaders and special education administrators to prioritize their rankings
of distributed leadership attributes into cells in columns that ranged from most to least
important to the job of a special education leader. In several instances, participants
expressed a desire to include more leadership statements in the highest positive column.
Results from Q-methodology are not reflective of the general population, as is the
case with this study (Barata, 2007). The 40 leadership statements used in this study only
represented distributed leadership attributes. The findings from this study illustrated that
30 special education teacher leaders and special education administrators who voluntarily
participated in the Q-sort activities showed a preference for particular leadership
attributes associated with the 40 distributed leadership statements.
Only special education teacher leaders and special education administrators who
responded to the researchers’ emails and phone calls participated in the study. The
results might have been different if participants were randomly selected. While the non-
random selection of the participants in this study introduced diversity of thought, it
cannot be used to estimate the number of people in the general population who hold each
of the perspectives. If recruitment had been done randomly, it is likely that some or all of
the perspectives expressed during the Q-sorting procedure would have been missed
(Barata, 2007; Brown, 1980; Provost, Boscardin, & Wells, 2010). It is possible that more

152
factors might have emerged from the factor analysis if more participants holding a
doctoral degree participated in the study and more minority participants had participated
in the study. In addition, the participants in this study were limited to special educators.
However, the perspectives of principals could have provided more depth to this research.
Consequently, additional research is needed to explore perspectives of principals on
effective leadership practices in special education.
The strength of this study rests in the fact that this study can be replicated in
different environments and can accommodate the examination of the leadership attributes
and thought processes supporting choices with regard to the distributed leadership style.
Future research should be devoted to better understanding the relationship influence
distributed leadership approaches has on an organization’s culture, student programming,
and student achievement in relationship to state accountability measures. It is essential to
restate that participants were asked to sort the items from most important to least
important. Participants could have perceived all statements as being necessary to the job
of an effective leader of special education. As a result, more research is needed to draw
any conclusions on based on the relationship between experience and leadership practices
of special education leaders.
Conclusions
As stated earlier, members of Factor A were generally younger, more educated,
and less experienced while Factor B members were generally older and more
experienced. Factor A’s rankings were consistent with research that beginning
administrators are more bureaucratic and direct (Schmidt et al., 1998). Research indicates
that older, more experience business executives demonstrated a greater desire to work

153
with others (Klein et al., 1996), and older, more experienced administrators have been
perceived as being more effective (Ibukun, Oyewole, & Abe, 2011). As a result, it is not
surprising that members of Factor B valued more the items related to improving
instruction and programming as they were farther along in their careers and their
leadership style is further developed.
Members of Factor A fell into the planned distribution stage on the continuum.
Members of Factor A clearly favored statements that emphasized the importance of
leadership tasks necessary with creating a well-functioning special education leadership
team. Members of Factor A were generally more comfortable providing feedback to
educators without first establishing a collegial environment that supports open
communication focusing on the most important needs of the students. The responses
from members of Factor A suggest that they value a top-down leadership practice that is
goal oriented and assign leadership tasks based on individuals’ competencies and
potential to work collectively with other leaders. During the follow-up interviews with
members of Factor A, four participants specifically referenced the word “collaboration”,
but defined it as having clear communication, providing support and meaningful
feedback in a supervisory role.
Based on their responses, members of Factor B fall into the embedded distribution
stage on the continuum. Members of Factor B clearly favored statements that
emphasized the importance of establishing professional collegial partnerships in an effort
to improve instruction and programming for students with special needs. Members of
Factor B ranked statements high that pertained to open communication, closing the

154
achievement gaps, along with statements related to improving or analyzing programming,
interventions, and instruction.
A continuum of distributed leadership was proposed based on the findings of this
study. The majority of research and models presented in the literature on distributed
leadership pertains to the instructional school leader. In addition, special education
administrators, particularly in this study, serve their position at the district level. As a
result, the proposed distributed leadership continuum in this study considers leadership
from an organizational perspective.
As earlier described, there were both strengths and limitations associated with this
study on special education leadership through the distributed lens. Overall strengths
include: (a) size of the study; (b) the fact that this study can be replicated in different
environments; (c) participant selection; and (d) data collection that allowed for both
qualitative and quantitative analysis. Although the participants in this study were
selected nonrandomly, all participants in this study met the Massachusetts state
department of education qualifications of “highly qualified” in their field of work (self-
reported). In addition, because the use of Q-methodology forces participants to prioritize
their rankings of distributed leadership, participants were limited from expressing other
opinions that were not part of the choice. In several instances, participants expressed a
desire to include more leadership statements in the highest positive column. Further, this
study is limited to the perspectives of special education leaders, although multiple
stakeholders (i.e., principals, parents) have an impact on the programming of students
with disabilities. Results are not reflective of the general population, as the findings
illustrate that 30 special education leaders who voluntarily participated in the Q-sort

155
activities showed a preference for particular leadership attributes associated with the 40
distributed leadership statements.
In summary, this study demonstrates the importance of special education leaders
developing an understanding of both the organization’s purpose as well as the staff
members’ needs, personalities, strengths, and skill sets. The leadership practices
transition from distributing leadership tasks from a top-down model to creating a truly
collaborative environment embedded into the organization as special education leaders
move along the continuum of distributed leadership. As expectations for student
achievement continue to rise, special education leaders will need to employ a multitude
of leadership styles/behaviors to meet the needs of students with disabilities, staff,
families, and community stakeholders in the era of school accountability.

156
APPENDIX:
INSTRUMENTATION

157
Q-Sort Consent Form
The Distribution of Leadership Tasks of Leaders of Special Education
Thank you for agreeing to participate in this study. By participating in this study, you will be helping the
researcher complete his dissertation. Your commentary and responses that you provide will assist with the
documentation of the leadership qualities special education leaders value as most as well as least necessary
to the job. Your participation will assist the researcher with developing a stronger understanding of the
theories and practices associated with the profession of a special education leader.
What will happen during the study: During the study, the researcher will ask you to sort a set of
distributed leadership statements developed from the works of Hulpia, Devos, and Rosseel (2009); and
Militello & Janson (2007). This entire task should take between 50-60 minutes.
Who to go to with questions: If you have any questions or concerns about your participation in this study
you should contact the Principal Investigator listed below. You may also ask questions during the sorting
activity.
How participants’ privacy is protected: At the end of this consent form, you will have the opportunity to
choose whether or not you agree to participate in this study. By agreeing to participate in this study, you
allow the researcher to quote you by complete anonymity (without using your name or title). In addition,
we will make every effort to protect your privacy. We will not use your name in any publications.
Furthermore, any information that lets us know who you are will be recorded with a code number. During
the study the coding key that tells us which code number corresponds to your information will be secured.
When the study is finished we will destroy the coding key that links information to you personally.
Risks and discomforts: Your participation in this study is voluntary and confidential to the maximum
extent allowable under federal, state and local law. All the information gathered in this study will be kept
confidential and secured.
Your rights: You should decide on your own whether or not you want to be in this study. You will not be
treated any differently if you decide not to be in the study. If you do decide to be in the study, you have the
right to withdraw from the study at any time without repercussions.
Your participation in this study will be contributing to the advancement of special education leadership and
administration. Once again, thank you for your participation and time to make this study possible.
Sincerely,
Patrick R. Tudryn, CAGS
413-335-5227
ptudryn@ educ.umass.edu
Mary Lynn Boscardin, Ph.D.
Chair & Professor
School of Education
175 Hills-South
University of Massachusetts at Amherst
Amherst, MA 01003
Voice: 413-545-1193
Email: [email protected]

158
PLEASE READ THE FOLLOWING STATEMENT AND SIGN BELOW
When signing this form I am agreeing to voluntarily enter this study. I understand that, by signing this
document, I do not waive any of my legal rights. I have had a chance to read this consent form, and it was
explained to me in a language which I use and understand. I understand that I may be quoted anonymously
(for example, “a district-level administrator”). I have had the opportunity to ask questions and have
received satisfactory answers. A copy of this signed Informed Consent Form has been given to me.
I have read and understand this Consent Form and do hereby:
____AGREE ___DO NOT AGREE to participate in this study.
_____________________________________________ _______________
Signature Date
_____________________________________________
Please print your name here

159
Distribution of Leadership Tasks between Administrators and Teacher Leaders of Special Education
Participant Background Information
Name:____________________________ Current Position:___________________
1) Gender: ____M ____F
2) Year of Birth _______
3) Ethnicity:
_____African American or Black
_____Asian
_____Hispanic/Latino
_____Multi-race, Non-Hispanic
_____Native American
_____Native Hawaiian or Other Pacific Islander
_____ White
_____Other
4) Years you have been in your current position:____ Total years of experience in your position:____
If none, what was your previous position:____________________________
5) What is the student enrollment in your current district?_____
What is the per pupil expenditure cost?___________________
6) What is the special education enrollment in your current district?_____
What is the per pupil special education cost?__________________
7) The type of district you currently work can be characterized as:
_____Institutional School
_____County Agricultural
_____Independent Public
_____Independent Vocational
_____Local School
_____Regional Academic
_____Regional Vocational Tech
8) The type of school in which you currently work can be characterized as:
_____Elementary School
_____Middle School
_____High School
_____District-wide/Central Office
_____Other, Please Describe____________________________

160
9) Current Educational Level:
_____Bachelor
_____Master
_____Master +30
_____Doctorate
10) How many years of teaching experience did you have in general education at the following levels:
_____Pre-School
_____Elementary
_____Secondary
_____Postsecondary
11) How many years of teaching experience did you have in special education at the following levels:
_____Pre-School
_____Elementary
_____Secondary
_____Postsecondary
12) How many years of general education administrative experience did you have at the following levels:
_____Pre-School
_____Elementary
_____Secondary
_____Central Office/District
_____Postsecondary
13) How many years of special education administrative experience did you have at the following levels:
_____Pre-School
_____Elementary
_____Secondary
_____Central Office/District
_____Postsecondary
14) Which general education certificates/licenses and levels do you hold?
____Teacher (Level(s):___________________________)
____Principal (Level(s):___________________________)
____Superintendent
____Other______________________________________
15) Which special education certificates/licenses and levels do you hold?
____Teacher (Level(s):___________________________)
____Principal (Level(s):___________________________)
____Special Education Director/Administrator
____Superintendent
____Other______________________________________
16) Contractual Status:
____ Teacher Contract
____ Administrator Contract

161
NAME:____________________________
Distribution of Leadership Tasks of Administrators and Teacher Leaders of Special
Education
Participant Follow-up Questionnaire
1) Briefly describe what went into your choices of statements that are “most necessary to the
job as an effective leader of special education?(+4’s and +5).
Please list the one statement in the +5 column and your reasons for placing it there.
2) Briefly describe what went into your choices of statements that are “least necessary to the
job as an effective leader of special education? (-4’s and -5).
Please list statement in the -5 column and your reasons for placing it there.
3) If there were other specific statements that you had difficulty placing, please list the
number of the statements and describe your dilemma.
4) What other issues/thoughts emerged for you while sorting the cards?
5) Describe how you arrived at your overall most important statements of the job as an
effective leader of special education regarding the distribution of leadership
tasks/responsibilities?
6) Describe how you arrived at your overall least important statements of the job as an
effective leader of special education regarding the distribution of leadership
tasks/responsibilities?
7) What factor(s), e.g., time, resources, your own knowledge, your skills, and/or your
dispositions, contributed most to the sorting through the distributed leadership
statements? Please give specific examples for each if applicable.

162
Distributed Leadership Statements
Sort statements from most necessary to the job as an effective leader of special education to least
necessary to the job as an effective leader of special education…
Statements #1-23 generated from the Distributed Leadership Inventory (DLI) by Hester Hulpia, Geert
Devos, and Yves Rosseel (2009)
DLI: Coherent Leadership Team #1-10
1) ensure there is a well-functioning leadership team
2) ensure the special education leadership team behaves professionally
3) ensure the leadership team supports the goals we like to attain
4) ensure all members of the leadership team work in the same strain on the core objectives
5) ensure the right person sits on the right place, taken the competencies into account
6) ensure members of the management team divide their time properly
7) ensure members of the leadership team have clear goals
8) ensure members of the leadership team know which tasks they have to perform
9) ensure the leadership team is willing to execute a good idea
10) ensure members of the leadership team have clear roles and responsibilities
DLI: Support #11-20
11) premise a long term vision
12) debate the school vision
13) compliment teachers
14) help teachers
15) explain reasons for constructive criticism to teachers
16) be available after school to help teachers when assistance is needed
17) look out for the personal welfare of teachers
18) encourage teachers to pursue their own goals for professional learning
19) encourage teachers to try new practices consistent with their own interests
20) provide organizational support for teacher interaction
DLI: Supervision #21-23
21) evaluate the performance of the staff
22) be involved in the summative evaluation of teachers
23) be involved in the formative evaluation of teachers

163
Statements #24-49 generated from Socially-focused, situationally-driven practice: A study of distributed
leadership among school principals and counselors by Matthew Militello & Chris Janson (2007)
24) ensure that teachers have time to address the most important needs of students (statement #2).
25) agree with fellow leaders of special education as to what are appropriate special education teacher
responsibilities and tasks (statement #3).
26) allow the special education department to function autonomously (statement #7).
27) work together with teachers to develop programs (statement #10).
28) acknowledge the expertise of teachers (statement #12).
29) trust teachers enough to make decisions (statement #13).
30) provide insight to teachers (statement #13).
31) ensure roles within the special education department are clearly defined (statement #14).
32) allow some flexibility with responsibilities (statement #14).
33) support teacher(s) in developing a leadership role (statement #15).
34) routinely communicate informally to teachers (statement #16).
35) promote a professional collegial atmosphere (statement #18).
36) support open communication (statement #18).
37) collaborate with teachers on professional development (statement #19).
38) collaborate with teachers on assessing instructional needs (statement #19).
39) collect data on the ground to be shared collaboratively (statement #22).
40) assist special education teachers on analyzing appropriate interventions (statement #23).
41) consult with teachers (statement #25).
42) ensure that all staff understands the importance of confidentiality (statement #26).
43) consult with other district and/or school leaders on the teaching they observe (statement #27).
44) understand that the relationship with teachers hinges on the belief that leadership should be distributed
(statement #29).
45) appreciate the work performed and the responsibilities involved with each staff member (statement
#30).
46) understand that the relationship with teachers is one of interdependency (statement #37).
47) collaborate with teachers to develop home-school relations (statement #39).
48) understand that there are many facets involved with special education services that cannot be easily
accomplished without the mutual support, advice, and understanding of other staff members (statement
#41).
49) engage in specific discussions relative to closing the achievement gaps (statement #45).
164
REFERENCES
Alexander, K., & Alexander, M.D. (2001). American public school law (5th
Ed).
Belmont, CA: Wadsworth/Thomson Learning.
Barata, P.C., (2007). Abused women’s perspectives on the criminal justice system’s
response to domestic violence. Psychology of Women Quarterly, 31, 202-215.
Barry, L.L. (2002). The impact of gender on decision making among customized training
administrators within the minnesota state colleges and universities system.
Report and research document.
Bennett, N., Harvey, J. A., Wise, C. and Woods, P. A. (2003). Distributed Leadership: a
Desk Study (Nottingham: NCSL). Available online at: www.ncsl.org.uk/literature
reviews (accessed July 2009).
Benz, M. R., Lindstrom, L., & Yovanoff, P. (2000). Improving graduation and
employment outcomes of students with disabilities: Predictive factors and student
perspectives. Exceptional Students, 66, 509-529.
Bergert, S., & Burnette, J. (2001). Educating exceptional children: A statistical profile.
Retrieved from ERIC database.
Berry, B., & Ginsberg, R. (1990). Creating lead teachers: From policy to implementation.
Phi Delta Kappan, 71, 616-621.
Billingsley, B. (2011). Inclusive school reform: Distributed leadership across the change
process. Unpublished work, pp. 1-42.
Billingsley, B. (2007). Recognizing and supporting the critical roles of teachers in
special education leadership. Exceptionality, 15, 3, 163-176.
Billingsley, B. S., Carlson, E., & Klein, S. (2004). The working conditions and induction
support of early career special educators. Council for Exceptional Children,
70(3), 333-347.
Boscardin, M. L. (2005). The administrative role in transforming secondary schools to
support inclusive evidence-based practices. American Secondary Education, 33,
21-32.
Boscardin M.L., Weir, M.S., & Kusek, C. (2010). A national study of state credentialing
requirements for administrators of special education. Journal of Special
Education Leadership, 23(2), 61-75.

165
Boyer, L., & Lee, C. (2001). Converting challenge to success: Supporting a new teacher
of students with autism. The Journal of Special Education, 35, 75-83.
Bracken, S.S., & Fischel, J.E. (2006). Assessment of preschool classroom practices:
Application of q-sort methodology. Early Childhood Research Quarterly, 21,
417-430.
Brown, S. R. (1980). Political subjectivity. New Haven, CT: Yale University Press.
Brown, S. R. (1996). Q methodology and qualitative research. Qualitative Health
Research, 6(4), 561-567.
Brownell, M. T., Smith, S. W., NcNellis, J. R., & Miller, D. M. (1997). Attrition in
special education: Why teachers leave the classroom and where they go.
Exceptionality, 7(3), 143-155.
Burns, J. M. (1978). Leadership. New York: Harper & Row.
Callahan, R. E. (1962). Education and the cult of efficiency. Chicago: The University of
Chicago Press.
Council for Exceptional Children (2009a, 6th
Ed.). What every special educator must
know: Ethics, standards, and guidelines for special educators.
CEC (2009b) retrieved November 26, 2009.
http://www.cec.sped.org/AM/Template.cfm?Section=Job_Profiles&Template=/C
M/ContentDisplay.cfm&ContentID=2367
Clifford, M., Behrstock-Sherratt, E., Fetters, J., & American Institutes for, R. (2012). The
ripple effect: A synthesis of research on principal influence to inform
performance evaluation design. A Quality School Leadership Issue Brief.
American Institutes For Research.
Cosman-Ross, J. M., & Hiatt-Michael, D. (2005). Adult student motivators at a university
satellite campus. Paper presented at the Annual Meeting of the American
Educational Research Association. Retrieved 4/14/2008, from
http://www.eric.ed.gov.
Crockett, J. B. (2002). Special education’s role in preparing responsive leaders for
inclusive schools. Remedial and Special Education, 23(3), 157-168.
Crockett, J.B., Becker, M. K., M.S.W., & Quinn, D. (2009). Reviewing the knowledge
base of special education leadership and administration from 1970-2009. Journal
of Special Education Leadership 22(2), 55-67.

166
Darling-Hammond, L., Bullmaster, M. L., & Cobb, V. L. (1995). Rethinking teacher
leadership through professional development schools. Elementary School
Journal, 96(1), 87-106.
Day, C., Leithwood, K., Sammons, P. (2008). What we have learned, what we need to
know more about. School Leadership and Management, 28(1), 83-96.
Donner, S. (2001). Using Q-sorts in participatory process: An introduction to the
methodology. In R. A. Krueger, M. A. Casey, J. Donner, S. Kirsch, & J. N. Maak
(Eds.) Social analysis: Selected tools and techniques p. 24-49. Washington, D.C.:
The World Bank.
DuFour, R. & Eaker, R. (1998). Professional learning communities at work: Best
practices for enhancing student achievement. Alexandria, VA: Association for
Supervision and Curriculum Development.
Drago-Severson, E., & Pinto, K. C. (2006). School leadership for reducing teacher
isolation: Drawing from the well of human resources. International Journal of
Leadership in Education, 9(2), 129-155.
Edmonson, S. (2001). Burnout among special education administrators. (ERIC Document
Reproduction Service No. ED470520) Retrieved September 20, 2009, from ERIC
database.
Education for All Handicapped Children Act of 1975, 20 U.S.C. § 1401 et seq.
Elementary and Secondary Education Act (EASA) of 1965, 20 U.S.C. § 16301 et seq.
Executive Summary of the No Child Left Behind Act of 2001 (2004). Retrieved
September 12, 2006, from
http://www.ed.gov/print/nclb/overview/execsumm.html
Elmore, R. F. (2000). Building a new structure for school leadership. Washington, DC:
Albert Shanker Institute.
Elmore, R. F. (2002). Bridging the gap between standards and achievement: The
imperative for professional development in education. (Washington, DC: Albert
Shanker Institute). http://www.shankerinstitute.org/education.html (visited July
2009).
Fullan, M. G. (1994) Teacher leadership: A failure to conceptualize. In D. R. Walling
(Ed.), Teachers as Leaders: Perspectives on the professional development of
teachers. Bloomington, IN: Phi Delta Kappan.
167
Evans, S. B. (1991). A realistic look at the research base for collaboration in special
education. Preventing School Failure, 35(4), 10-13.
Garand, A. (n.d.). The influence of contemporary education reforms on special
education leadership. Unpublished doctoral prospectus, University of
Massachusetts, Amherst.
Glaser, B. G., & Strauss, A. L. (1967). The discovery of grounded theory: Strategies for
qualitative research. Chicago: Aldine Publishing Company.
Gorsuch, R. L. (1983). Factor analysis (2nd
ed.). Hillsdale, NJ: Erlbaum.
Gronn, P. (2002) Distributed Leadership. In K. Leithwood, P. Hallinger, K. Seashore-
Louis, G. Furman-Brown, P. Gronn, W. Mulford and K. Riley (eds) Second
International Handbook of Educational Leadership and Administration,
Dordrecht: Kluwer
Gronn, P. (2003). The New Work of Educational Leaders: Changing Leadership
Practice in an Era of School Reform. London: Paul Chapman.
Gronn, P. (2008). The future of distributed leadership. Journal of Educational
Administration, 26, 2, 141-158.
Hallinger, P., & Heck, R. H. (2010). Leadership for learning: Does collaborative
leadership make a difference in school improvement? Educational Management
Administration & Leadership, 38(6), 654-678.
Harris, A. (2007). Distributed leadership: Conceptual confusion and empirical reticence.
International Journal of Leadership in Education, 10, 3, 315-325.
Hehir, T. F. (1999). The changing roles of special education leadership in the next
millennium: Thoughts and reflections. Journal of Special Education Leadership,
12(1), 3-8.
Hulpia, H., & Devos, G. (2009). Exploring the link between distributed leadership and
job satisfaction of school leaders, Educational Studies, 1-19.
Hulpia, H., Devos, G., & Rosseel, Y. (2009). Development and validation of scores on
the distributed leadership inventory, Educational and Psychological
Measurement, 69(6), 1013-1034.
Ibukun, W. O., & Oyewole, B. K. (1997). Personality factors and administrative
effectiveness of principals in Akure local government area of Ondo state. Studies
in Educational Planning and Administration, 1(1), 34-40.

168
Ibukun, W. O., Oyewole, B. K., & Abe, T. O. (2011). Personality characteristics and
principal leadership effectiveness in ekitistate, Nigeria. International Journal of
Leadership Studies, 6(2), 2011.
Improving America’s School Act (IASA) of 1994, 20 U.S.C. § 16301 et seq.
Individuals with Disabilities Education Act Amendments of 1997, Pub. L. No. 105-17,
105th
Cong., 1st sess.
Individuals with Disabilities Education Act, 20 U.S.C. § 1401 et seq.
Individuals with Disabilities Education Regulations, 34 C.F.R. § 300.1 et seq.
Johnson, B. A. (1993). Classroom integration of special education students: Using q
methodology to determine teacher attitudes. Retrieved from EBSCOhost.
Kearns, J., Kleinert, H., Clayton, J., Burdge, M., & Williams, R. (1998). Principal
supports for inclusive assessment: A kentucky story. Teaching Exceptional
Children, 31, 16-23. Retrieved from ERIC database.
Kerlinger, F. N. (1986). Foundations of behavioral research (3rd
ed.). New York: Holt,
Reinhart and Winston.
Kezar, A., & Eckel, P. (2008). Advancing diversity agendas on campus: examining
transactional and transformational presidential leadership styles, International
Journal of Leadership in Education, 11(4), 379-405.
Klein, E.B., Astrachan, J.H., & Kossek, E.E. (1996). Leadership education: The impact of
managerial level and gender on learning. Journal of Managerial Psychology, 11
(2), 31-40.
Klingner, J. K., Arguelles, M. E., Hughes, M. T, & Vaughn, S. (2001). Examining the
school-wide "spread" of research-based practices. Learning Disability Quarterly,
24, 221-234.
Krishnakumar, J., & Nagar, A. L. (2008). On exact properties of multidimensional
indices based on principal components, factor analysis, mimic and structural
equation models. Social Indicators Research, 86(3), 481-496.
Ladd, H. (2009). Teachers’ perceptions of working conditions: How predictive of policy-
relevant outcomes? Washington, D.C.: Author. Retrieved February 22, 2012,
from http://www.urban.org/uploadedPDF/1001440-Teachers-Perceptions.pdf
Larrivee, B., & Cook, L. (1979). Mainstreaming: A study of the variables affecting
teacher attitude. Journal of Special Education, 13(3), 315-324.

169
Lashley, C., & Boscardin, M.L., (2003). Special education administration at a crossroads:
Availability, licensure, and preparation of special Education administrators.
(ERIC Document Reproduction Service No. ED477116) Retrieved September 20,
2009, from ERIC database.
Lehr, C. & Thurlow, M. (2003). Putting it all together: Including students with
Disabilities in assessment and accountability systems (Policy Directions No. 16).
Minneapolis, MN: University of Minnesota, National Center on Educational
Outcomes. Retrieved November 17, 2006, from
http://education.umn.edu/NCEO/OnlinePubs/Policy16.htm
Leko, M. M., & Smith, S. W. (2010). What should administrators know and do?
Intervention in School and Clinic, 45(5), 321-325.
Leithwood, K. (2005). Educational leadership. The Laboratory for Student Success at
Temple University Center for Research in Human Development and Education.
Leithwood, K. (1993). Contributions of transformational leadership to school
restructuring. Paper presented at the Annual Meeting of the University Council
for Educational Administration. Houston, TX, October 29-31, 1993.
Leithwood, K. (1994). Leadership for School Restructuring. Educational Administration
Quarterly, 30(4), 498-518.
Leithwood, K., & Duke, D.L. (1999). A century’s quest to understand school leadership.
In K. S. Louis & J. Murphy (Eds.), Handbook of research on educational
administration (2nd
Ed., pp. 45-72). San Francisco: Jossey-Bass.
Leithwood, K., & Steinbach, R. (1993). Total quality leadership: Expert thinking plus
transformational practice. Paper presented at the Annual Meeting of the
American Educational Research Association, Atlanta, GA, April 12-16.
Leithwood, K., & Jantzi, D. (2006). Transformational school leadership for large-scale
reform: Effects on students, teachers, and their classroom practices. School
Effectiveness and School Improvement. 17, 2, 201-227.
Leithwood, K., & Jantzi, D. (1999). The effects of transformational leadership on
organizational conditions and student engagement with school. Paper presented
at the Annual Meeting of the American Educational Research Association,
Montreal, Quebec, Canada, April 19-23.
Leithwood, K., Mascall, B., Strauss, T., Sacks, R., Memon, N. and Yashkina, A. (2007).
Distributing leadership to make schools smarter: taking the ego out of the system.
Leadership and Policy in Schools, 6(1), 37-67.

170
Leithwood, K., Harris, A., & Hopkins, D. (2008). Seven strong claims about successful
school leadership. School Leadership and Management, 28(1), 27-42.
Loder, T.L., & Spillane, J.P. (2005). Is a principal still a teacher?: US women
administrators’ accounts of role conflict and role discontinuity. School
Leadership and Management, 25(3), 263-279.
MacBeath, J. (2005). Leadership as distributed: a matter of practice. School Leadership
and Management, 25 (4), 349-366.
MacBeath, G., Oduro, K., & Waterhouse, J. (July 2004). Distributed Leadership in
Action: A study of current practice in schools. Sponsored by NCSL, University of
Cambridge in collaboration with the Eastern Leadership Centre.
Marzano, R. J., Waters, T., & McNulty, B. A. (2005). School leadership that works:
From research to results. Alexandria, VA: Association for Supervision and
Curriculum Development.
Mascall, B., Leithwood, K., Straus, T., & Sacks, R. (2008). The relationship between
distributed leadership and teachers’ academic optimism. Journal of Educational
Administration, 46, 2, 214-228.
Massachusetts Department of Education (2003). Guideline for administrator routes to
initial licensure 603 cmr 7.00,
http://www.doe.mass.edu/Educators/03adminguide.pdf. Accessed February 12,
2011.
Massachusetts Department of Elementary & Secondary Education (Sept. 23, 2010). The
gateway for educators of massachusetts. Retrieved from
http://www.doe.mass.edu/gem/edtypes.aspx?mode=teach.
McLeskey, J., Tyler, N., & Flippen, S.S. (2004). The supply of and demand for special
education teachers: A review of research regarding the nature of the chronic
shortage of special education teachers. The Journal of Special Education, 38, 5-
21.
Merriam, S.B. (1998). Qualitative research and case study applications in education.
Revised and expanded from “Case Study Research in Education.” San Francisco:
Jossey-Bass.
Meyen, E. L. (1995). Legislative and programmatic foundations of special education. In
E. L. Meyen & T. M. Skrtic (Eds.), Special education and student disability:
Traditional, emerging, and alternative perspectives (pp.35-95). Denver, CO:
Love.

171
Militello, M., & Janson, C. (2007). Socially focused, situationally driven practice: a
study of distributed leadership among school principals and counselors. Journal
of School Leadership, 17(4), 409-442.
Mosley, J. (2011). Perceptions of principals attributes in the era of accountability.
Unpublished doctoral dissertation, University of Massachusetts, Amherst.
Murphy, J. (2005). Connecting teacher leadership and school improvement. Thousand
Oaks, CA: Corwin Press.
National Commission on Teaching and America’s Future. (1996). What matters most:
Teaching for America’s future. New York: Author.
Noell, G. H., & Witt, J. C. (1999). When does consultation lead to intervention
implementation? Journal of Special Education, 33 (1), 29—35.
Pallas, A.M., Natriello, G., & McDill, E. (1989). The changing nature of the
disadvantaged population: Current dimensions and future trends. Educational
Researcher, 18(5), 16- 22.
Parrish, T.B., & Wolman, J. (2004). How is special education funded?: Issues and
implications for school administrators. NASSP Bulletin, 88, 57-68.
Prather-Jones, B. (2011). How school administrators influence the retention of teachers
of students with emotional and behavioral disorders. The Clearing House, 84, 1-
8.
Provost, J.A. (2007). Principal leadership behaviors in massachusetts in the era of
education reform. Unpublished doctoral dissertation, University of
Massachusetts, Amherst.
Provost, J., Boscardin, M. L., & Wells, C. S. (2010). Perceptions of principal leadership
behaviors in Massachusetts in the era of education reform. Journal of School
Leadership, 20, 532-560.
Roza, M. (2001). The challenge for title I. Education Week, 20(29), 6-10.
Sanchez, J. E., Thornton, B., & Usinger, J. (2009). Increasing the ranks of minority
principals. Developing School Leaders, 67(2).
Sergiovanni, T. J., (1991). The principalship: A reflective practice perspective. Boston:
Allyn & Bacon.
Silva, D. Y., Gimbert, B., & Nolan, J. (2000). Sliding the doors: Locking and unlocking
possibilities for teacher leadership. Teachers College Record, 102, 779-804.

172
Schlinger, M. J. (1969). Cues on q-technique. Journal of Advertising Research, 9(3), 53-
60.
Schmidt, L. J., Kosmoski, G. J., & Pollock, D. R. (1998). Novice administrators:
Personality and administrative style changes. Report and research document.
Spillane, J. P. (2006). Distributed leadership. San Francisco: Jossey-Bass.
Spillane, J.P., Camburn, E.M., Pustejovsky, J., Pareja, A.S., & Lewis, G. (2008). Taking
a distributed perspective. Epsitemological and methodological tradeoffs in
operationalizing the leader-plus aspect. Journal of Educational Administration,
46(2), 189-213.
Spillane, J. P., Halverson, R., & Diamond, J. B. (2004). Towards a theory of leadership
practice: A distributed perspective. Journal of Curriculum Studies, 26, 1, 3-34.
Spillane, J. P., Halverson, R., & Diamond, J. B. (2001). Investigating school leadership
practice: A distributed perspective. Educational Researcher, 30(3), 23-28.
Spillane, J. P., & Harris, A. (2008). Distributed leadership through the looking glass.
British Educational Leadership, Management & Administration Society
(BELMAS), 22, 1, 31-34.
Stephenson, W. (1935). Technique of factor analysis. Nature, 136, 297-310.
Stephenson, W. (1953). The study of behavior: Q-technique and its methodology.
Chicago: The University of Chicago Press.
Stewart, J. (2006). Transformational leadership: An evolving concept examined through
the works of burns, bass, avolio, and leithwood, Canadian Journal of Educational
Administration and Policy, 54.
Strauss, A., & Corbin, J. (1990). Basics of qualitative research: Grounded theory
procedures and techniques. Newbury Park, CA: Sage Publications, Inc.
Sullivan, M. E., & Leary, P.A. (1991). Perception of rural school administrators of the
role and function of special education administrators. National Forum of Applied
Educational Research Journal, 2, 33-41.
Thompson, B. (1998). Using q-technique factor analysis in education program
evaluations or research: An introductory primer. Retrieved from EBSCOhost.

173
VandenBosch, D. (2001). Why do we factor variables when we care about types of
people? Q and other two-mode factor analytic models. Retrieved from
EBSCOhost.
Vesper, N., McCarthy, M., & Lashley (1994). School Decision Making: The Effect of
Two Restructuring Initiatives. Policy Bulletin. Retrieved from ERIC database.
Wald, J. (1998). Retention of special education professionals: A practical guide of
strategies and activities for educators and administrators. Reston, VA: National
Clearinghouse on the Professions in Special Education, The Council for
Exceptional Children.
Walther-Thomas, C. S., Korinek, L., McLaughlin, V. L., & Williams, B. V. (2000).
Collaboration for effective inclusive education: Developing successful programs.
Boston: Allyn & Bacon.
Woods, A., & Weasmer, J. (2004). Maintaining job satisfaction: Engaging professionals
as active participants. Clearing House, 77(3), 118.
Woods, P. A. (2004). Democratic leadership: drawing distinctions with distributed
leadership. International Journal of Leadership in Education, 7(1), 3–26.
Yell, M. L. (2006a). Least Restrictive Environment. In L. Bayma & A. Sharp (Eds.),
The Law and Special Education (pp. 309-333). Upper Saddle River, NJ: Pearson
Prentice Hall.
Yell, M. L. (2006b). The law and special education (2nd
Ed.). Upper Saddle River, NJ:
Pearson Prentice Hall.
York-Barr, J. & Duke, K. (2004). What do we know about teacher leadership? Findings
from two decades of scholarship, Review of Educational Research, 74(3), 255–
316.
York-Barr, J., Sommerness, J., Duke, K., and Ghere, G. (2005). Special educators in
inclusive education programmes: reframing their work as teacher leadership.
International Journal of Inclusive Education, 9, 2, 193-215.
Zahorik, J. A. (1987). Teachers’ collegial interaction: An exploratory study. The
Elementary School Journal, 87(4), 385-396.