Examination of performance of the Center for Epidemiologic ...
13
RESEARCH ARTICLE Open Access Examination of performance of the Center for Epidemiologic Studies Depression Scale Short Form 10 among African youth in poor, rural households Kelly Kilburn 1* , Leah Prencipe 2 , Lisa Hjelm 3 , Amber Peterman 2 , Sudhanshu Handa 4 and Tia Palermo 2 Abstract Background: Youth mental health has emerged as a pressing global issue. However, to advance research gaps in low-income settings, we need valid measures of common mental health disorders. Using primary data collected in five countries (Kenya, Malawi, Tanzania, Zambia, and Zimbabwe), this study aims to assess the psychometric properties of the commonly used 10-item Center for Epidemiological Studies Depression (CES-D 10) scale among poor, disadvantaged youth populations in sub-Saharan African (SSA). Methods: Youth samples from each country (sample sizes ranging from 651 to 2098) come from large household surveys with youth modules, collected for impact evaluations of cash transfer programs targeted to poor families. For each sample, we assessed internal consistency (alpha), conducted factor analysis, and then examined construct validity and measurement invariance. We performed both exploratory (EFA) and confirmatory factor analysis (CFA) to examine and confirm the structure of the CES-D 10 for each country and then used multigroup CFA to assess measurement invariance across gender and age. Multivariate analyses were conducted to assess construct validity via test of the relationship between CES-D 10 and background characteristics. Results: Results show the CES-D 10 had strong psychometric properties and was a reliable measure of depressive symptoms among disadvantaged youth in SSA. Across countries, there was high internal consistency (Cronbach alphas = 0.70–0.76) and the traditional two-factor solution showed good model fit. Full measurement invariance of the CES-D 10 was supported across gender. Consistent with previous literature on risk factors for depressive symptoms, the CES-D 10 was associated with increasing age, and female gender and being out of school in some locations. Conclusions: Results from this study support broad use of the CES-D 10 among poor youth populations in SSA. Between one-third and two-thirds of our samples demonstrated depressive symptoms as classified by recommended cut-offs for the CES-D 10, indicating a high burden of mental illness in disadvantaged youth populations. This tool can be used in future efforts to study prevalence and dynamics of depressive symptoms in this population, as well as effectiveness of policies and interventions to improve the mental health of youth in SSA. Keywords: Mental health, Depression, Youth, Measurement, Africa, Cash transfers * Correspondence: [email protected] 1 Institute for Global Health and Infectious Diseases, University of North Carolina, Bioinformatics CB# 7030, Chapel Hill, NC 27599-7030, USA Full list of author information is available at the end of the article © The Author(s). 2018 Open Access This article is distributed under the terms of the Creative Commons Attribution 4.0 International License (http://creativecommons.org/licenses/by/4.0/), which permits unrestricted use, distribution, and reproduction in any medium, provided you give appropriate credit to the original author(s) and the source, provide a link to the Creative Commons license, and indicate if changes were made. The Creative Commons Public Domain Dedication waiver (http://creativecommons.org/publicdomain/zero/1.0/) applies to the data made available in this article, unless otherwise stated. Kilburn et al. BMC Psychiatry (2018) 18:201 https://doi.org/10.1186/s12888-018-1774-z
Transcript of Examination of performance of the Center for Epidemiologic ...

RESEARCH ARTICLE Open Access
Examination of performance of the Centerfor Epidemiologic Studies Depression ScaleShort Form 10 among African youth inpoor, rural householdsKelly Kilburn1* , Leah Prencipe2, Lisa Hjelm3, Amber Peterman2, Sudhanshu Handa4 and Tia Palermo2
Abstract
Background: Youth mental health has emerged as a pressing global issue. However, to advance research gaps inlow-income settings, we need valid measures of common mental health disorders. Using primary data collected infive countries (Kenya, Malawi, Tanzania, Zambia, and Zimbabwe), this study aims to assess the psychometricproperties of the commonly used 10-item Center for Epidemiological Studies Depression (CES-D 10) scale amongpoor, disadvantaged youth populations in sub-Saharan African (SSA).
Methods: Youth samples from each country (sample sizes ranging from 651 to 2098) come from large householdsurveys with youth modules, collected for impact evaluations of cash transfer programs targeted to poor families.For each sample, we assessed internal consistency (alpha), conducted factor analysis, and then examined constructvalidity and measurement invariance. We performed both exploratory (EFA) and confirmatory factor analysis (CFA)to examine and confirm the structure of the CES-D 10 for each country and then used multigroup CFA to assessmeasurement invariance across gender and age. Multivariate analyses were conducted to assess construct validityvia test of the relationship between CES-D 10 and background characteristics.
Results: Results show the CES-D 10 had strong psychometric properties and was a reliable measure of depressivesymptoms among disadvantaged youth in SSA. Across countries, there was high internal consistency (Cronbachalphas = 0.70–0.76) and the traditional two-factor solution showed good model fit. Full measurement invariance ofthe CES-D 10 was supported across gender. Consistent with previous literature on risk factors for depressivesymptoms, the CES-D 10 was associated with increasing age, and female gender and being out of school in somelocations.
Conclusions: Results from this study support broad use of the CES-D 10 among poor youth populations in SSA.Between one-third and two-thirds of our samples demonstrated depressive symptoms as classified byrecommended cut-offs for the CES-D 10, indicating a high burden of mental illness in disadvantaged youthpopulations. This tool can be used in future efforts to study prevalence and dynamics of depressive symptoms inthis population, as well as effectiveness of policies and interventions to improve the mental health of youth in SSA.
Keywords: Mental health, Depression, Youth, Measurement, Africa, Cash transfers
* Correspondence: [email protected] for Global Health and Infectious Diseases, University of NorthCarolina, Bioinformatics CB# 7030, Chapel Hill, NC 27599-7030, USAFull list of author information is available at the end of the article
© The Author(s). 2018 Open Access This article is distributed under the terms of the Creative Commons Attribution 4.0International License (http://creativecommons.org/licenses/by/4.0/), which permits unrestricted use, distribution, andreproduction in any medium, provided you give appropriate credit to the original author(s) and the source, provide a link tothe Creative Commons license, and indicate if changes were made. The Creative Commons Public Domain Dedication waiver(http://creativecommons.org/publicdomain/zero/1.0/) applies to the data made available in this article, unless otherwise stated.
Kilburn et al. BMC Psychiatry (2018) 18:201 https://doi.org/10.1186/s12888-018-1774-z

BackgroundYouth mental health has emerged as a pressing issueglobally, but has been largely underacknowledged andunder investigated in policy and research to date [1].Mental illness is a leading cause of death among adoles-cents and its contribution to the global burden of dis-ease is highest in low- and middle-income countries(LMICs), where the majority of young people live [2].The importance of attending to youth mental health iscompounded by the fact that the onset of mental healthissues often occurs during adolescence [3]. This earlyonset can result in negative and lasting impacts as ado-lescence is a crucial time period in the developmentalprocess and lays the foundation for health trajectoriesinto adulthood [1]. Mental disorders in adolescence areassociated with poor physical, reproductive, and sexualhealth, in addition to lower educational attainments andrisky behaviors such as substance abuse [4]. Given theselong-term impacts, action is needed to address know-ledge gaps around the mental health needs of vulnerableyoung people, as well as how policies and programs canbenefit this population.To do this work, however, we need valid measures of
common mental health disorders, such as depressivesymptoms, to accurately assess rates of mental illnessand respond to needs of vulnerable youth populations.Evidence generation on this topic is limited insub-Saharan African (SSA), a region characterized byhigh poverty, due to the capability of existing measure-ment tools [5, 6]. Most instruments for the assessmentof mental illness were developed for western popula-tions, and the reliability of these tools in SSA contexts isuncertain because symptoms of mental illness can ex-press differently across cultures [5, 7]. There have beensome efforts to validate these tools in SSA among adultpopulations, however evidence on the reliability and val-idity of these tools among African youth is scarce [6]. Inorder to better understand the prevalence and risk fac-tors associated with depressive symptoms in this popula-tion, measurement tools must be validated.Increasingly, the Center for Epidemiological Studies
Depression (CES-D) scale is being used in SSA to meas-ure depressive symptoms among youth (see Additionalfile 1: Table S1), however the evidence on its validity andreliability in these populations has not been assessedamong rural, poor populations. The majority of studiesexamining the psychometric properties and performanceof the CES-D in SSA have been conducted among adultpopulations or higher education students (including uni-versity and secondary school students), who representthe most educated and highest socio-economic strata[8–12]. Despite the lack of rigorous validation or exam-ination of the performance of the CES-D in these popu-lations, the scale has been increasingly used, primarily
with the objective of correlating depressive symptomswith background and other risk factors. These studies,for example, have sought to analyze the prevalence ofdepressive symptoms in youth in Rwanda participatingin a mentorship program [13, 14], the impact of a cashtransfer on depressive symptoms among youth in eligiblepoor households in Kenya [15], and to assess correlatesof depression among youth in Eastern Cape, South Af-rica participating in an Human Immunodeficicy Virus(HIV) intervention [16]. As such, this study fills a gap byadvancing understanding of the performance and psy-chometric properties of the CES-D among youth in thepoorest socio-economic strata residing in rural areas inSSA.Using primary data from household samples collected
in five countries (Kenya, Malawi, Tanzania, Zambia, andZimbabwe), this study aims to examine the psychometricproperties of the 10-item, short-form of the CES-D(CES-D 10) in rural, SSA youth populations. Because weuse data from youth in households targeted for cashtransfer programs and these programs are for the mostpoor and vulnerable households, youth in our samplesrepresent those living in most extreme poverty and vul-nerability in the region. We also contribute to under-standing of the broader literature of measurement ofdepressive symptoms among youth in SSA and providetranslated tools for researchers wishing to utilize thesemeasures in the future.
CES-D validity and reliabilityThe CES-D was originally developed in 1976 to measuredepressive symptoms in the general adult population (18and over) in the United States (US) [17], and has alsobeen validated among US adolescents and young adults[18]. Since then, the scale has been widely used and vali-dated as a tool to measure depression among many gen-eral and clinical populations across the world. The initialvalidation of the CES-D scale in the general populationshowed high internal consistency (Cronbach α = 0.85)[17]. Additional studies have also found that the CES-Dhas high internal consistency (Cronbach’s alpha scoresconsistently higher than 0.8) across youth populations inthe west [19–21] and among non-western populations[22, 23], including in SSA [8, 24, 25].In this study, we use the CES-D 10, modified from the
original 20-item CES-D questionnaire [26]. The itemschosen for the CES-D 10 were those that displayed highcorrelation with the full 20-item CES-D, but not witheach other, to limit redundancy. The CES-D 10 was firstvalidated in a sample of healthy older adults in the US[26], but has since been validated more widely includingamong elderly Chinese [27], adolescents in France [28]and Canada [29], and among HIV-positive people inCanada [30]. In SSA, the 10-item version of the CES-D
Kilburn et al. BMC Psychiatry (2018) 18:201 Page 2 of 13

has been found to be a valid, reliable tool to measure de-pression among the general Zulu, Xhosa, and colouredAfrikaans speaking populations in South Africa [31]. Toour knowledge, however, the CES-D 10 specifically hasnot been validated across youth populations in any otherSSA country.The first validation of the full 20-item CES-D suggested a
four-factor structure [1]. The four factors grouped togetheritems into categories of 1) depressed affect, 2) positiveaffect, 3) somatic activity, and 4) interpersonal relations[17]. While this four-factor structure has been replicated instudies conducted among diverse populations in the US[21, 32, 33] and populations outside the US [20, 34], boththree-factor [35–37] and two-factor solutions [23, 38, 39]have also been identified. In SSA, studies have found theoriginal four-factor solution among HIV-infected adults inUganda [24] and students in South Africa [8] but atwo-factor solution among genocide survivors in Rwanda[25]. Validations of the CES-D 10, however, have typicallyfound a two-factor structure representing positive andnegative affect [26, 27, 29–31], while other studies havefound a single-factor solution including one among adoles-cents in France [28] and among an Afrikaans speakingpopulation in South Africa [31].
CES-D correlates among youthA variety of factors have been found to be associatedwith depressive symptomatology among youth, includingindividual and household-level characteristics as well asexposure to negative life events and the social environ-ment. Female gender is one of the most consistent char-acteristics associated with depressive symptoms [20, 40,41]. Other individual factors associated with depressivesymptoms include increasing age, belonging to an ethnicminority group [41], and having lower self-esteem [40].At the household level, lower socio-economic status (e.g.low adult education levels or low income) [41], poorphysical or mental health of a parent [42], and familyconflict or poor parent-child relationships [43–45] arelinked to increased levels of youth depressive symptoms.Social environmental factors including the school envir-onment (e.g. competition among pupils, control byteachers, and pressure to achieve) [40] and discrimin-ation related to ethnicity [43] can also serve as a risk fac-tor for depressive symptoms among young people.Lastly, young people are at greater risk of depressionwhen exposed to negative life events such as problemsin intimate relationships [46] including exposure to in-timate partner violence [47].The factors associated with depressive symptoms among
youth in SSA generally follow the same pattern as else-where. For example, studies in SSA have frequently showna gender disparity whereby females show more symptomsof depression [13, 14, 16]. Other individual risk factors
include poor general health [13, 15] and behaviors such assubstance misuse [16], heavy episodic drinking [9], andHIV risk behavior [10, 11]. At the household level, povertyand related conditions such as food insecurity are an im-portant risk factor for depression [13]. Additionally, poorfamily environments and lack of social support are also re-lated to higher levels of depressive symptoms for youth inSSA [9]. Lastly, traumatic experiences including forcedsex, sexual partner violence, and having been abused as achild put youth at greater risk of depression [9, 10].
MethodsData collectionThis analysis uses data collected for impact evaluations ofgovernment cash transfer programs in rural areas of fivecountries: Kenya, Malawi, Tanzania, Zambia, and Zimbabwe.All analyses are conducted using pre-treatment (baseline)data, except for Kenya as explained below. These cash trans-fer programs were targeted at the household-level with thehousehold head or caregiver receiving the transfer. A sum-mary table of program characteristics for each country isprovided in Additional file 1: Table S2.All evaluations with the exception of Zimbabwe were
designed as cluster-randomized controlled trials (cRCT)at the community or village level, with a random sampleof program-eligible households interviewed in each com-munity. Zimbabwe was designed as a district-matchedcase control evaluation. Household surveys were admin-istered to either the transfer recipient or household headand covered a range of topics including consumption,food security, productive activities, and schooling andhealth of household members.In addition, separate youth modules were administered
to up to two or three youth per household according toa specified age range (varied by country), except forTanzania where all youth in the specified age range weretargeted to be interviewed. Topics included mentalhealth, schooling, aspirations and expectations, sexualbehaviors, risk preferences, and substance use. Youthwere interviewed face-to-face in private settings bysame-sex enumerators using the local language, and ifprivacy could not be assured, then enumerators wereinstructed to forgo the interviews. Informed consent wasobtained from youth age 18 or above, and informedassent plus parental informed consent was obtained foryouth aged younger than 18 years. Written consent wasobtained in Kenya and Tanzania and verbal consent inMalawi, Zambia, and Zimbabwe where enumeratorssigned forms documenting that consent was asked andreceived. Verbal consent was given ethical approval inthese settings as available data indicated that a large pro-portion of our main respondent sample would beilliterate and thus unable to read and sign a consentform. All studies were submitted to a national
Kilburn et al. BMC Psychiatry (2018) 18:201 Page 3 of 13

institutional review board (IRB) for ethical clearance,and in all cases except Tanzania, were submitted in par-allel to international IRB for additional ethical review(see Additional file 1: Table S2).
Individual country samplesThe Kenyan youth sample come from the evaluation ofKenya’s Cash Transfer for Orphans and Vulnerable Chil-dren (CT-OVC). The youth module with the CES-Dquestionnaire was an addition to the 2011 endline sur-vey. In order to ensure no program effects are capturedin this analysis, we only use data from control house-holds (those not receiving the cash transfer). Up to threeKenyan youth living in the household and aged 15–25were administered the youth module (N = 651). The Ma-lawian youth sample comes from the Malawi Social CashTransfer Program (SCTP) impact evaluation. Up to threeyouth aged 13–19 were interviewed in each householdat baseline in 2014 and included in this analysis (N =2098). The Tanzanian youth sample comes from the im-pact evaluation of Tanzania’s Productive Social SafetyNet (PSSN). Potentially all youth aged 14–28 from thehouseholds were interviewed at baseline in 2015 (N =1357) and are included in this analysis. In Zambia, theyouth sample comes from the impact evaluation of theMultiple Category Targeted Grant (MCTG). Up to twoyouth aged 13–17 per household were administered theyouth module at baseline in 2011 and included in thisanalysis (N = 1982). The Zimbabwean youth sample istaken from baseline survey data of the evaluation of Har-monized Social Cash Transfer (HSCT) conducted in2013. Up to three youth per household completed theyouth module (N = 916).All questionnaires and full country reports with
additional sampling and evaluation details are available onthe Transfer Project website (https://transfer.cpc.unc.edu).In each country, the CES-D was translated into locallanguages and field teams subsequently revised eachtranslation for accuracy, interpretation and specificityin group settings during the training period. Locallanguage translations for the CES-D 10 scales utilizedhere are provide in Additional file 1: Table S3.
MeasuresOur primary outcome measure is the CES-D 10 (here-after referred to as CES-D in methodology and results)[26]. Each item of the CES-D is answered in reference tothe past 7 days and on a one to four Likert scale[1 = rarely (< 1 day), 2 = some or a little of the time(1–2 days); 3 = occasionally or a moderate amount oftime (3–4 days); 4 =most or all of the time (5–7 days)].All ten items were summed and then rebased to zerofor a CES-D scale score ranging from 0 to 30, wherehigher scores reflect greater depressive symptomology.
A binary indicator was then created using a cutoff of10 or more to be indicative of a youth exhibitingdepressive symptoms. This cutoff is the most commonlyused threshold and has been previously used in SSA[9, 11, 12, 15].
Statistical analysisDescriptive statistics and internal consistencyDescriptive summary statistics are provided for eachcountry separately for the full youth sample and for thesubsample of youth aged 18 years and under. We usethese two samples because of additional data indicatoravailability (orphanhood) in the younger age group andto observe any heterogeneity in results, given the expect-ation that rates of depressive symptoms differ by age.We then examined average CES-D scores, individualitem scores, and levels of depression for both groups. In-ternal consistency was assessed using Cronbach’s alphas.
Factor analysisExploratory and confirmatory factor analyses (EFA andCFA, respectively) were used to examine the factor struc-ture and model fit of the CES-D in each of the study sam-ples. An EFA with an orthogonal varimax rotation wasfirst conducted to assess whether the factor structure andunderlying relationships between the CES-D items werethe same across samples [26]. We examined the perform-ance of the CES-D scale with factor analysis, using fivecriteria (summarized in Additional file 1: Table S4) follow-ing previous studies validating the CES-D [38, 48, 49]: 1)Each factor must have an eigenvalue of equal to or greaterthan one, 2) Each item should load equal to or greaterthan 0.40 on the primary factor, 3) The difference betweenthe item loading (see point 2) on the primary factor andother factors should be at least 0.2, 4) Each factor musthave at least three items loading at 0.3 or higher, and 5)Factors must have a coefficient alpha greater than 0.7.Second, we conduced CFA to confirm whether the
two factor structure with latent factors for negative andpositive affect showed good model fit for each countrysample. We performed CFA using maximum likelihoodmethods with a diagonal covariance structure. Model fitwas assessed using recommended indices including χ2,the root mean square error of approximation (RMSEA),comparative fit index (CFI), the Tucker-Lewis index(TLI), and the standardized root mean squared residual(SRMR) [50]. Thresholds that indicate good to excellentfit are values where RMSEA ≤0.07, CFI ≥ 0.90, TLI ≥ 0.95and SRMR ≤0.08.
Measurement invarianceWe then assessed configural, metric, and scalar meas-urement invariance across gender and age usingmulti-group CFA by sequentially estimating more
Kilburn et al. BMC Psychiatry (2018) 18:201 Page 4 of 13

constrained models. The first model tested configuralvariance by allowing all parameters to vary acrossgroups. The second model constrained the factor load-ings to be equal across groups to test metric invariance,and then the third model constrains both factor loadingsand intercepts to test scalar invariance. We examinedmodel fit using the CFA fit indices and invariance bycomparing successively constrained models to the previ-ous model using differences in chi-square and CFI.
Construct validityFinally, to assess construct validity, we examined associa-tions between household- and individual-level characteris-tics and the CES-D. We used multivariate linear regressionmodels to examine associations both for the full sampleand for youth aged 18 years or younger. Characteristics ex-amined were motivated by the existing literature. For ex-ample, we hypothesized that increasing age, orphan status,and female gender are associated with increasing CES-Dscores, while school enrolment and wealth would beprotective.We ran individual analyses by country and age
group due to data availability differences by thesecomponents. Individual-level variables include gen-der, age (years), current enrollment or educational
attainment (typically measured as completing sec-ondary level), chronic illness (reported morbidityfor three or more months in the past years), andorphan status (having lost both parents, measuredonly among the sample aged 18 and under). How-ever, for the Tanzanian sample, chronic illness andorphan status were not collected. Household-levelvariables include monthly per-capita expenditure inlocal currency units (logged in multivariate ana-lysis), for all samples except Tanzania for which weuse a wealth index created through principal com-ponent analysis using household assets and dwellingcharacteristics to capture household economic status. Fororphan status, a small number of observations weremissing. We replaced missing indicators with the modeof the sample average and added a binary indicator torepresent missingness to regressions as a covariate.This strategy resulted in 1–2% of the sample withreplaced indicators for orphan status by country (seeTable 1 for details). Geographic fixed effects for regionor district of randomization stratification are includedas appropriate by country, but not reported in Tables.Standard errors were adjusted for clustering at thecommunity-level (the level of program randomization).Data were analyzed using Stata version 14.
Table 1 Summary statistics of background characteristics, by country
(1) (2) (3) (4) (5)
Zimbabwe Zambia Tanzania Malawi Kenya
Mean Mean Mean Mean Mean
Panel A: All youth
Male (%) 0.51 0.53 0.49 0.51 0.59
Age (years) 15.29 14.89 19.29 15.34 18.80
Chronically ill (3+ months in past year) (%) 0.04 0.01 – 0.07 0.06
Enrolled in school or completed secondary (%) 0.68 0.76 0.28 0.67 0.63
Monthly per capita expenditure (local currency) 24.92 42.34 0.081 36,855 2503
N 918 1982 1189 2098 651
Age range (years) 13–19 13–17 14–28 13–19 15–25
Panel B: Youth aged 18 and younger
Male (%) 0.50 0.53 0.54 0.51 0.57
Age (years) 15.06 14.89 15.75 15.12 16.54
Chronically ill (3+ months in past year) (%) 0.04 0.01 – 0.07 0.04
Orphan (both parents) (%) 0.43 0.64 – 0.45 0.75
Missing orphan status (%) 0.01 0.02 – 0.02 0.02
Enrolled in school (%) 0.68 0.77 0.45 0.68 0.77
Monthly per capita expenditure (local currency) 24.68 42.34 0.131 36,789 2402
N 869 1982 611 1979 341
Age range (years) 13–18 13–17 14–18 13–18 15–18
Samples are taken from baseline surveys of cash transfer evaluations and include youth from poor and vulnerable rural households, with the exception of Kenyafor which measures were collected at endline and include only the control group. 1 In Tanzania, a wealth index was used in place of monthly per capitaexpenditure, constructed via principle component analysis including household assets, dwelling characteristics. In Tanzania, chronic illness and orphan status werenot collected
Kilburn et al. BMC Psychiatry (2018) 18:201 Page 5 of 13

ResultsTable 1 describes the background characteristics of thefive samples for the full sample (Panel A) and separatelyfor youth aged 18 and younger (Panel B). For Zambia,the full sample is under 18, however Panels A and B dif-fer because of some age-specific indicators included inthe Panel B (e.g. orphan status). Across samples in PanelA, the proportion of males to females is comparable, ex-pect for Kenya where males make up 59% of the fullsample. The average age of participants is approximately15 years in Malawi, Zambia, and Zimbabwe and ap-proximately 19 years in Kenya and Tanzania where theage range of participants extends into the upper 20s.The large majority of youth are either enrolled in schoolor have completed secondary school across samples, ex-cept for in Tanzania, where only 28% of the full sampleis enrolled in or has completed schooling. The youngersubsamples in Panel B appear similar to the full samplesacross characteristics, although, schooling (enrollmentonly) increases to 45% for the Tanzanian sample. Or-phanhood, an additional indicator for those 18 years andunder, is high (over 40%) across each country with avail-able data. A full three-fourths of Kenyan youth aged 18and under are orphans, a result of Kenya targetinghouseholds with orphans and vulnerable children fortheir program.Across both age group samples, the mean CES-D
score ranged from 7.9 in Zambia to 11.8 in Tanzania(Table 2). Scores correspond to a low of 33% of youth inZambia exhibiting depressive symptoms to a high of64% in Tanzania. In all countries and samples, Cron-bach’s alpha was greater than 0.70 for the CES-D scalewith the exception of Tanzanian youth 18 years or youn-ger (alpha = 0.67), indicating overall satisfactory internalreliability.As part of the EFA, we found either two or three fac-
tors emerged across countries. Using Criteria 1 (eigen-values of one or greater), Malawi and Zimbabwe hadtwo factors while Zambia, Tanzania and Kenya each hadthree factors. However, a visual test of the slopes (“Screetest”), indicates that third factors are only marginallyabove or at one, and slopes flatten out between two tothree factors (Additional file 1: Figure S1). Rotated factorloadings are displayed in Table 3. Countries consistentlydisplayed strong validity for criteria (2), (3) and (4),greater than or equal to 0.40 loading on the primary fac-tor, no cross-loading (differences are at least 0.20 be-tween factors for each item) and no trivial factors (atleast three items loading ≥0.30 for each factor). The ex-ceptions are cross-loadings for ‘hopeful’ and ‘concen-trate’ in Kenya and ‘lonely’ and ‘depressed’ in Tanzania.Loadings of ‘hopeful’ were also generally lower on theprimary factor (including < 0.40 on in Tanzania), a resultalso found in South Africa [31]. The item ‘effort’ was
the only item that loaded on the third factors, indi-cating these third factors performed particularly poor(alphas range from 0.00–0.18). The individual alphasfor other two factors, however, were also lower thanexpected (below 0.49). Nevertheless, in the originalvalidation of the CES-D, Radloff (1977) argues againstoveremphasis of the individual factors due to high in-ternal consistency of the overall scale, which we alsofind in our samples [17].Given the results of the EFA, the two-factor solution
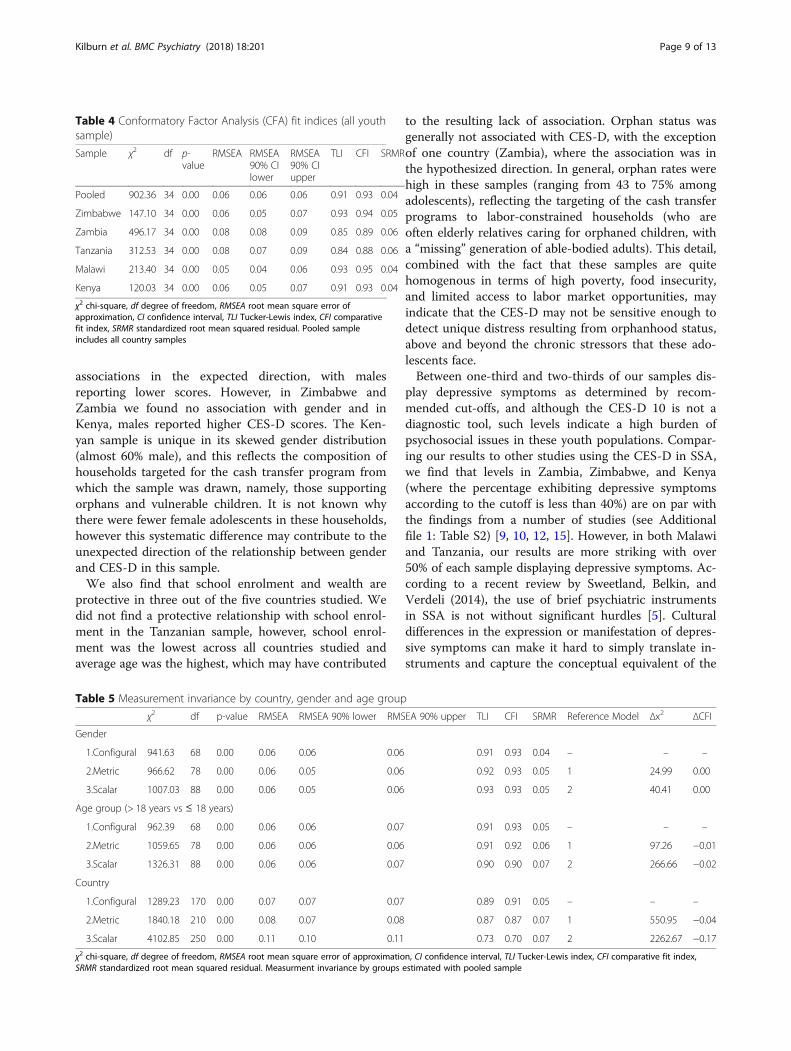
appears to fit the data better. Therefore, we ran CFA onthe two factor model where Factor 1 consisted of ‘sleepwell’, ‘happy’, and ‘hopeful’ while Factor 2 consisted of‘concentrate’, ‘effort’, ‘lonely’, ‘depressed’, ‘get going’, ‘both-ered’, and ‘fearful’. Overall, this two-factor solutionshowed great fit for Malawi, Zimbabwe, and Kenya(Table 4). For each of these countries, the RMSEA ≤0.06, CFI ≥ 0.93, TLI ≥ 0.91, and SRMR ≤ 0.05. The twofactor solution was not as strong, but still showed goodfit for Zambia (RMSEA = 0.08, TLI = 0.85, CFI = 0.89,SRMR = 0.06) and Tanzania (RMSEA = 0.08, TLI = 0.84,CFI = 0.88, SRMR = 0.06). For the pooled sample, we alsofind highly acceptable model fit (RMSEA = 0.06, TLI =0.91, CFI = 0.93, SRMR = 0.04). All χ2 values were signifi-cant at p < 0.001, however these tests are very sensitiveto large sample sizes, and as such, not useful for com-paring fit in this analysis.Next, we examined measurement invariances using
the pooled sample across gender, age groups (> 18 yearsand ≤ 18), and by country (Table 5). For model identifi-cation purposes, means were set to 0 in both groups andvariances were set to 1. Across multi-group CFA modelsfor gender and age, fit indices indicate good to accept-able model fit and invariance appears to be upheld. Forgender, we find that full invariance is supported (changein CFIs was < 0.01) suggesting that males and femalesanswer scale items in the same way. For age, configuraland metric invariance was supported (0.01 difference inCFIs) while scalar invariance is not supported indicatingaverages for older youth (> 18 years) may be systematic-ally different than younger youth (≤ 18 years). Acrosscountry samples, fit indices are good for the first modelindicating configural variance but neither metric norscalar measurement invariance is supported. Therefore,there are likely systematic differences in the way CES-Dwas answered across countries, possibly due to culturaldifferences, upper bounds of age ranges per country orthe ability of local language translation to capture con-sistent and specific item concepts.Table 6 displays the results from OLS regression
models for the relationship between the CES-D scaleand individual and household determinants. Relation-ships are similar for the full sample (Panel A) and the18 years and younger sample (Panel B). Of the individual
Kilburn et al. BMC Psychiatry (2018) 18:201 Page 6 of 13

determinants, CES-D scores increase with age, signifi-cant in all samples but Malawi. Either being enrolled inschool and/or having completed secondary has a pro-tective relationship for youth, although not all relation-ships across countries and samples are statisticallysignificant. The relationship between CES-D and genderis less conclusive in our samples, with males exhibitingsignificantly lower CES-D scores in Tanzania but higher
scores in Kenya as compared to females. This can alsobe seen visually in Additional file 1: Figure S2 withcountry level kernel density graphs of CES-D scores bygender for the 18 and younger samples. In only one case(Zambia), is orphanhood negatively associated withCES-D scores as originally hypothesized. Chronic illnesswas not associated with CES-D scores, however asshown in Table 1, the percentage of youth reporting
Table 2 Summary statistics of CES-D 10 outcome indicators including individual items, by country
(1) (2) (3) (4) (5)
Zimbabwe Zambia Tanzania Malawi Kenya
mean mean mean mean mean
Panel A: All youth (individual items (1)-(10) range: 1–4)
CES-D scale 8.73 7.89 11.76 9.95 8.61
Depressed (CESD≥10) 0.38 0.33 0.64 0.48 0.37
(1) Did you sleep well? (reverse coded) 1.42 1.80 2.18 1.72 1.47
(2) Were you happy? (reverse coded) 1.55 1.92 2.34 1.96 1.67
(3) Did you have trouble concentrating? 2.07 1.85 2.13 1.94 2.08
(4) Did you feel hopeful about the future? (reverse coded) 2.05 1.96 2.56 2.35 1.58
(5) Did you feel that everything you did was an effort? 2.67 2.33 2.53 2.33 2.81
(6) Did you feel lonely? 1.92 1.62 2.03 1.78 1.90
(7) Did you feel depressed? 1.89 1.51 2.29 1.93 1.74
(8) Did you feel that you could not get going? 1.77 1.63 2.08 2.41 1.83
(9) Were you bothered by things that don’t usually bother you? 1.68 1.61 1.73 1.77 1.82
(10) Did you feel fearful? 1.72 1.65 1.90 1.76 1.71
N 918 1982 1189 2098 651
Alpha 0.74 0.70 0.70 0.71 0.76
Age range (years) 13–19 13–17 14–28 13–19 15–25
Panel B: Youth aged 18 and younger (individual items (1)-(10) range: 1–4)
CES-D scale 8.73 7.89 10.27 9.94 8.12
Depressed (CESD≥10) 0.38 0.33 0.53 0.47 0.35
(1) Did you sleep well? (reverse coded) 1.43 1.80 2.05 1.72 1.39
(2) Were you happy? (reverse coded) 1.55 1.92 2.15 1.96 1.63
(3) Did you have trouble concentrating? 2.08 1.85 1.90 1.94 2.02
(4) Did you feel hopeful about the future? (reverse coded) 2.05 1.96 2.52 2.35 1.48
(5) Did you feel that everything you did was an effort? 2.66 2.33 2.44 2.32 2.75
(6) Did you feel lonely? 1.90 1.62 1.90 1.78 1.84
(7) Did you feel depressed? 1.89 1.51 1.96 1.94 1.72
(8) Did you feel that you could not get going? 1.77 1.63 1.97 2.40 1.83
(9) Were you bothered by things that don’t usually bother you? 1.68 1.61 1.58 1.77 1.77
(10) Did you feel fearful? 1.73 1.65 1.80 1.77 1.69
N 869 1982 611 1979 341
Alpha 0.75 0.70 0.67 0.72 0.78
Age range (years) 13–18 13–17 14–18 13–18 15–18
CES-D scale ranges from 0 to 30; while Depressed is a binary outcome indicating a scale value higher or equal to 10. Samples are taken from baseline surveys ofcash transfer evaluations and include youth from poor and vulnerable rural households, with the exception of Kenya for which measures were collected atendline and include only the control group
Kilburn et al. BMC Psychiatry (2018) 18:201 Page 7 of 13

chronic illness is very low across all samples (from 1 %in Zambia to 7% in Malawi). Increasing per capitahousehold expenditures were protective, particularly inZimbabwe and Zambia were measures are highly statisti-cally significant.
DiscussionAs poor mental health is a leading cause of death anddisability-adjusted life years (DALYs) among young peopleglobally, more evidence is needed to understand effectiveinitiatives to improve youth mental health and well-being.Before such evidence can be generated, standard tools formeasurement of mental health, including depressivesymptoms, need to be validated among diverse youthpopulations. Using data from five countries, this study isthe first to examine the psychometric properties of theCES-D 10 among young people in rural, poor householdsin SSA. We find positive evidence to support the use ofthis measure in such populations.Our analyses reveal that the CES-D 10 performs well
across samples and that relationships between the scaleand characteristics largely aligned with hypothesesdriven by the literature on the determinants of youth de-pression. EFA results and factor loadings pointed to atwo-factor solution for the CES-D 10 as the most likelyfactor structure. In Tanzania, Zambia, and Kenya, the
item ‘everything was an effort’ loaded differently, sug-gesting the expression of depressive symptoms may in-clude an additional somatic element in these settings.Similar to other studies on the CES-D 10, the main fac-tors fit into positive and negative affect [26, 27, 29–31]with positive affect including ‘happy’, ‘hopeful’, and ‘sleepwell’, the three reverse coded questions. Similar to an-other validation study in South Africa, ‘hopeful’ loadedlower compared to other positive affect items indicatingthat ‘hopeful’ may not perfectly align with theconceptualization of positive affect [31] .CFA results in-dicate good model fit for the two-factor model for mostcountries and the pooled sample, although fit forTanzania and Zambia are not as strong. Multi-groupCFA results in the pooled sample also indicated stronginvariance of CES-D across gender, but weaker invari-ance across age and country samples.Patterns of background characteristics associated with
the CES-D were similar in the entire age range and ado-lescent samples, and were generally consistent with theexisting literature. For example, gender and age tend tobe two of the most salient characteristics associated withCES-D. In our samples, we also find that increasing ageis associated with increased depressive symptoms, how-ever the findings related to gender are mixed. In two ofthe countries (Tanzania and Malawi), we found
Table 3 Rotated factor analysis of CES-D 10 items (all youth sample)
Zimbabwe Zambia Tanzania Malawi Kenya
(1) (2) (3) (4) (5) (6) (7) (8) (9) (10) (11) (12) (13)
All items range from 1 to 4 Factor1
Factor2
Factor1
Factor2
Factor3
Factor1
Factor2
Factor3
Factor1
Factor2
Factor1
Factor2
Factor3
(1) Did you sleep well? (reversecoded)
0.12 0.71 0.12 0.85 −0.05 0.07 0.76 −0.11 0.10 0.74 0.16 0.81 0.00
(2) Were you happy? (reversecoded)
0.27 0.72 0.09 0.86 0.05 0.03 0.77 −0.29 0.14 0.78 0.06 0.82 0.08
(3) Did you have troubleconcentrating?
0.56 −0.11 0.32 0.17 0.56 0.37 0.51 0.25 0.63 0.08 0.40 0.41 0.29
(4) Did you feel hopeful about thefuture? (reverse coded)
0.09 0.65 0.11 0.41 −0.62 0.06 0.24 − 0.74 − 0.16 0.57 0.27 0.42 −0.49
(5) Did you feel that everything youdid was an effort?
0.37 −0.46 0.11 0.06 0.81 0.01 −0.02 0.80 0.64 0.02 0.13 0.12 0.77
(6) Did you feel lonely? 0.72 0.14 0.64 0.03 0.14 0.57 0.39 0.12 0.63 0.07 0.65 0.14 0.32
(7) Did you feel depressed? 0.76 0.14 0.77 0.10 0.04 0.58 0.52 0.14 0.59 0.25 0.67 0.18 0.28
(8) Did you feel that you could notget going?
0.74 0.12 0.75 0.12 0.03 0.79 −0.04 −0.05 0.60 0.10 0.72 0.11 −0.06
(9) Were you bothered by thingsthat don’t usually bother you?
0.70 0.16 0.73 0.14 0.07 0.75 0.06 −0.10 0.70 0.03 0.74 0.06 −0.05
(10) Did you feel fearful? 0.66 0.09 0.59 0.22 0.18 0.57 0.29 0.00 0.68 0.07 0.67 0.23 −0.04
N 918 918 1982 1982 1982 1189 1189 1189 2098 2098 651 651 651
Alpha 0.49 0.21 0.46 0.38 0.18 0.39 0.38 0.00 0.46 0.30 0.43 0.32 0.15
Samples are taken from baseline surveys of cash transfer evaluations and include youth from poor and vulnerable rural households, with the exception of Kenyafor which measures were collected at endline and include only the control groupThe highest factor loadings for each item are in bold
Kilburn et al. BMC Psychiatry (2018) 18:201 Page 8 of 13
associations in the expected direction, with malesreporting lower scores. However, in Zimbabwe andZambia we found no association with gender and inKenya, males reported higher CES-D scores. The Ken-yan sample is unique in its skewed gender distribution(almost 60% male), and this reflects the composition ofhouseholds targeted for the cash transfer program fromwhich the sample was drawn, namely, those supportingorphans and vulnerable children. It is not known whythere were fewer female adolescents in these households,however this systematic difference may contribute to theunexpected direction of the relationship between genderand CES-D in this sample.We also find that school enrolment and wealth are
protective in three out of the five countries studied. Wedid not find a protective relationship with school enrol-ment in the Tanzanian sample, however, school enrol-ment was the lowest across all countries studied andaverage age was the highest, which may have contributed
to the resulting lack of association. Orphan status wasgenerally not associated with CES-D, with the exceptionof one country (Zambia), where the association was inthe hypothesized direction. In general, orphan rates werehigh in these samples (ranging from 43 to 75% amongadolescents), reflecting the targeting of the cash transferprograms to labor-constrained households (who areoften elderly relatives caring for orphaned children, witha “missing” generation of able-bodied adults). This detail,combined with the fact that these samples are quitehomogenous in terms of high poverty, food insecurity,and limited access to labor market opportunities, mayindicate that the CES-D may not be sensitive enough todetect unique distress resulting from orphanhood status,above and beyond the chronic stressors that these ado-lescents face.Between one-third and two-thirds of our samples dis-
play depressive symptoms as determined by recom-mended cut-offs, and although the CES-D 10 is not adiagnostic tool, such levels indicate a high burden ofpsychosocial issues in these youth populations. Compar-ing our results to other studies using the CES-D in SSA,we find that levels in Zambia, Zimbabwe, and Kenya(where the percentage exhibiting depressive symptomsaccording to the cutoff is less than 40%) are on par withthe findings from a number of studies (see Additionalfile 1: Table S2) [9, 10, 12, 15]. However, in both Malawiand Tanzania, our results are more striking with over50% of each sample displaying depressive symptoms. Ac-cording to a recent review by Sweetland, Belkin, andVerdeli (2014), the use of brief psychiatric instrumentsin SSA is not without significant hurdles [5]. Culturaldifferences in the expression or manifestation of depres-sive symptoms can make it hard to simply translate in-struments and capture the conceptual equivalent of the
Table 5 Measurement invariance by country, gender and age group
χ2 df p-value RMSEA RMSEA 90% lower RMSEA 90% upper TLI CFI SRMR Reference Model Δx2 ΔCFI
Gender
1.Configural 941.63 68 0.00 0.06 0.06 0.06 0.91 0.93 0.04 – – –
2.Metric 966.62 78 0.00 0.06 0.05 0.06 0.92 0.93 0.05 1 24.99 0.00
3.Scalar 1007.03 88 0.00 0.06 0.05 0.06 0.93 0.93 0.05 2 40.41 0.00
Age group (> 18 years vs ≤ 18 years)
1.Configural 962.39 68 0.00 0.06 0.06 0.07 0.91 0.93 0.05 – – –
2.Metric 1059.65 78 0.00 0.06 0.06 0.06 0.91 0.92 0.06 1 97.26 −0.01
3.Scalar 1326.31 88 0.00 0.06 0.06 0.07 0.90 0.90 0.07 2 266.66 −0.02
Country
1.Configural 1289.23 170 0.00 0.07 0.07 0.07 0.89 0.91 0.05 – – –
2.Metric 1840.18 210 0.00 0.08 0.07 0.08 0.87 0.87 0.07 1 550.95 −0.04
3.Scalar 4102.85 250 0.00 0.11 0.10 0.11 0.73 0.70 0.07 2 2262.67 −0.17
χ2 chi-square, df degree of freedom, RMSEA root mean square error of approximation, CI confidence interval, TLI Tucker-Lewis index, CFI comparative fit index,SRMR standardized root mean squared residual. Measurment invariance by groups estimated with pooled sample
Table 4 Conformatory Factor Analysis (CFA) fit indices (all youthsample)
Sample χ2 df p-value
RMSEA RMSEA90% CIlower
RMSEA90% CIupper
TLI CFI SRMR
Pooled 902.36 34 0.00 0.06 0.06 0.06 0.91 0.93 0.04
Zimbabwe 147.10 34 0.00 0.06 0.05 0.07 0.93 0.94 0.05
Zambia 496.17 34 0.00 0.08 0.08 0.09 0.85 0.89 0.06
Tanzania 312.53 34 0.00 0.08 0.07 0.09 0.84 0.88 0.06
Malawi 213.40 34 0.00 0.05 0.04 0.06 0.93 0.95 0.04
Kenya 120.03 34 0.00 0.06 0.05 0.07 0.91 0.93 0.04
χ2 chi-square, df degree of freedom, RMSEA root mean square error ofapproximation, CI confidence interval, TLI Tucker-Lewis index, CFI comparativefit index, SRMR standardized root mean squared residual. Pooled sampleincludes all country samples
Kilburn et al. BMC Psychiatry (2018) 18:201 Page 9 of 13

disorder (measurement variance across countries westudied is a likely indication of this). Previous work inTanzania, for instance, has shown that the experienceand expression of depression differs from western cul-tures, particularly due to the absence of depressed mood[5]. In this way, the high rate of depressive symptomsdisplayed in the Tanzanian sample may partly reflect alack of conceptual equivalence and adjusting the CES-Dscale items or cut-offs may be warranted.Nevertheless, it is important to recognize that the youth
populations used in this study are among the poorest andmost vulnerable in the region. The intensity and persist-ence of adverse conditions (including high rates of or-phanhood, exposure to violence and generalized HIVprevalence affecting caregivers and youth themselves) dur-ing childhood likely puts them at even greater risk of psy-chosocial problems than their peers in the same settings.Moreover, adolescence and young adulthood is a particu-larly vulnerable time for the development of depressive
disorders and even in high-income countries, the preva-lence of disorders among youth hovers around 20% [4]. Ingeneral, there is a lack of evidence on the burden of men-tal health problems among young people in SSA, thus ourfindings add to this limited evidence base.Strengths of this study include large sample sizes, di-
verse geographic locations, and inclusion of data onhousehold-level socioeconomic indicators. However,there are some limitations to this study. First, the sam-ples come from impact evaluations of poverty-targetedcash transfer programms, which means youth came fromextreme poor and rural households. This may limitgeneralizability of findings in the region. Nonetheless, bydemonstrating good performance of the CES-D in apopulation where we may expect challenges to imple-menting standard scales, bolsters expected validityamong other youth populations in these countries.Another limitation is that implementation of the tool
necessitated translation into local languages, which often
Table 6 Ordinary Least Squares multivariate regression examining assocations with CES-D scale (range: 0–30)
(1) (2) (3) (4) (5)
Zimbabwe Zambia Tanzania Malawi Kenya
Panel A: All youth
Male − 0.35 (0.37) 0.14 (0.23) −1.15*** (0.38) − 0.12 (0.44) 1.09** (0.41)
Age (years) 0.18** (0.08) 0.22*** (0.07) 0.33*** (0.04) 0.07 (0.08) 0.19* (0.10)
Chronically ill (3+ months in past year) 1.13 (0.96) 0.48 (1.40) –– 0.15 (0.50) 0.71 (1.02)
Enrolled in school or completed secondary −0.85** (0.37) −0.58** (0.29) −0.37 (0.44) −1.02** (0.41) −0.20 (0.60)
Log per capita monthly expenditure −1.28*** (0.41) −0.82*** (0.20) −0.18 (0.18) − 0.59** (0.24) 0.50 (0.59)
Constant 12.19*** (1.85) 8.57*** (1.47) 5.89*** (1.11) 15.67*** (2.54) 1.01 (5.40)
N 916 1982 1189 2098 651
R-squared 0.06 0.04 0.09 0.01 0.03
Age range (years) 13–19 13–17 14–28 13–19 15–25
Panel B:18 years and younger
Male −0.28 (0.37) 0.13 (0.23) −1.08** (0.48) −0.06 (0.45) 1.51*** (0.51)
Age 0.24** (0.11) 0.22*** (0.07) 0.44** (0.17) 0.10 (0.11) 0.52 (0.38)
Chronically ill (3+ months in past year) 1.09 (0.99) 0.56 (1.39) – – 0.16 (0.54) 2.35 (1.95)
Orphan (both parents) 0.15 (0.35) 0.49* (0.28) – – 0.30 (0.31) 0.72 (0.77)
Missing orphan status 0.15 (1.66) 1.05 (0.96) – – −0.50 (0.73) 2.95 (4.22)
Enrolled in school −0.84** (0.39) −0.65** (0.28) − 0.41 (0.43) −0.99** (0.44) −1.21 (0.93)
Log per capita monthly expenditure −1.37*** (0.42) −0.82*** (0.20) −0.24 (0.22) − 0.56** (0.23) 1.03 (0.67)
Constant 11.42***(2.20)
8.29*** (1.48) 3.56 (2.76) 14.78*** (2.82) −8.40 (9.98)
N 866 1982 611 1979 341
R-squared 0.06 0.04 0.04 0.01 0.08
Age range (years) 13–18 13–17 14–18 13–18 15–18
Robust standard errors in parentheses; *** p < 0.01, ** p < 0.05, * p < 0.1. Geographic fixed effects for region or district of randomization stratification are includedas appropriate by country but not reportedSamples are taken from baseline surveys of cash transfer evaluations and include youth from poor and vulnerable rural households, with the exception of Kenyafor which measures were collected at endline and include only the control group. In Tanzania, a wealth index was used in place of monthly per capitaexpenditure, constructed via principle component analysis including household assets, dwelling characteristics. In Tanzania, chronic illness and orphan status werenot collected
Kilburn et al. BMC Psychiatry (2018) 18:201 Page 10 of 13

lack diversity in vocabulary to adequately allow nuanceand differentiate concepts of individual scale items. Add-itionally, because these data were collected in the con-text of larger impact evaluations, the questionnaireswere not designed with validation of the CES-D scale asan objective. Therefore, related measures of mentalhealth were not collected, which would have been help-ful for testing construct validity of the CES-D. Finally,the fact that some reverse-scored items hung together inthe factor analysis (in Zimbabwe, Zambia, Kenya) sug-gests that our data may suffer from some degree ofreporting bias. Other studies have also reported thissame phenomenon [31] and so these reverse codeditems may tend to be somewhat confusing to partici-pants. Nevertheless, other evidence described above sug-gests that the CES-D generally performed well in thesepopulations, supporting its expanded use.
ConclusionsIn summary, this study provides novel evidence support-ing the use of the CESD 10 among youth in SSA. Thistool can be used in future efforts to study dynamics ofdepressive symptoms in this population, as well as ef-fectiveness of policies and interventions to improve themental health of adolescents in SSA. Our results aresuggestive that the burden of mental illness is very highamong the most poor and vulnerable youth populationsin SSA. However, structural interventions, including pol-icies and initiatives which promote school enrollmentand economic strengthening may have the potential toimprove adolescent mental health. We recommend fur-ther investigations in this area to understand the pro-tective and promotive effects of such interventions onyouth mental health and psychosocial development.
Additional file
Additional file 1: The additional figures and tables contained in thisdocument explains the background literature we cite and our data andresults in more detail. The file contains the following tables and figures,which are cited in the text with the corresponding figure or tablenumber. Figure S1. Plotted test of eigenvalues across countries from fullyouth samples. Figure S2. Kernel density graphs of CES-D 10 scores for18 years and under samples by individual country. Table S1. Studies insub-Saharan Africa using the CES-D among or including youth populations(alphabetical by author). Table S2. Summary of cash transfer program andevaluation characteristics. Table S3. Questionnaire translations for CES-D 10in local languages. Table S4. Summary of criteria for reliability and validityassessment of CES-D scale among the full sample. (DOCX 201 kb)
AbbreviationsCES-D 10: Center for epidemiological studies depression 10-item scale; CES-D: Center for epidemiological studies depression scale; CFA: Confirmatoryfactor analysis; CFI: Comparative fit index; CI: Confidence interval;cRCT: Cluster-randomized controlled trial; CT-OVC: Cash transfer for orphansand vulnerable children; DALYs: Death and disability-adjusted life years;df: Degrees of freedom; EFA: Exploratory factor analysis; HIV: Humanimmunodeficicy virus; HSCT: Harmonized social cash transfer; IRB: Institutional
review board; LMIC: Low- and middle-income countries; MCTG: Multiplecategory targeted grant; OLS: Ordinary least squares; PSSN: Productive socialsafety net; RMSEA: Root mean square error of approximation; SCTP: Socialcash transfer program; SRMR: Standardized root mean squared residual;SSA: Sub-Saharan Africa; TLI: Tucker-lewis index; US: United States
AcknowledgmentsThe Transfer Project is a multi-organizational initiative of the United NationsChildren’s Fund (UNICEF) the Food and Agriculture Organization (FAO) of theUnited Nations, Save the Children UK and the University of North Carolina atChapel Hill (UNC-CH), in collaboration with national governments, and othernational and international researchers. We thank the UNICEF offices responsiblefor commissioning and facilitating this research, including: the East andSouthern Africa Regional Office (ESARO), and country offices of Kenya, Malawi,Tanzania, Zambia and Zimbabwe. We thank our in country research partnersresponsible for collecting baseline data utilized in this analysis, including: Centerfor Social Research (Malawi), Palm Associates (Zambia), Policy Research forDevelopment (REPOA) (Tanzania), Research Solutions Africa (Kenya) and RuzivoTrust (Zimbabwe). This body of research has benefited from the intellectualinput of a large number of individuals. For full research teams by country, see:https://transfer.cpc.unc.edu/.
FundingCurrent core funding for the Transfer Project comes from the SwedishInternational Development Cooperation Agency (Sida), and in the form of timedevoted by staff at UNICEF, FAO and University of North Carolina. Evaluationsare all funded in country by government and development partners, typicallyvia UNICEF Country Officies. Top-up funds for extra survey rounds have beenprovided by: 3 IE - International Initiative for Impact Evaluation (Malawi,Zimbabwe); American World Jewish Services (Tanzania); DFID - UK Departmentfor International Development (Malawi, Kenya, Zambia, Zimbabwe); EU -European Union (Malawi, Zimbabwe); Irish Aid (Malawi, Zambia); KfW - GermanDevelopment Bank (Malawi); NIH - The United States National Institute of Health(Kenya); Sida (Zimbabwe); and Swiss Development Cooperation (Zimbabwe);USAID – United States Agency for International Development (Malawi); USDepartment of Labor (Malawi, Zambia). The funders had no role in thestudy design, data collection or analysis, interpretation, or preparation ofthe manuscript.
Availability of data and materialsThe data that support the findings of this study are owned by countryGovernments and accessible with permission from the Government andUNICEF country offices approximately 1 year after the endline of respectiveimpact evaluations is disseminated. The Kenya data that support the findingsof this study are available through the Transfer Project hosted at theUniversity of North Carolina, and it is expected that Malawi will becomeavailable through the same platform in 2018.
DisclaimerThe views expressed in this article are those of the authors and not thepolicies or views of affiliated institutions.
Authors’ contributionsSH contributed to the design of the studies and oversaw data collection inall countries except Tanzania, where TP and AP designed the study andoversaw data collection. KK, AP, TP, and LH conducted the statistical analysesand LH conducted the literature review. KK and LP prepared the manuscriptwith the support of AP and TP. KK, LP, AP and TP revised the manuscript. Allauthors read and approved the final manuscript.
Ethics approval and consent to participateAll studies were submitted to local institutional review board (IRB) for ethicalclearance.Kenya: The University of North Carolina at Chapel Hill IRB and the KenyaMedical Research Institute Ethics Review Committee.Malawi: The University of North Carolina at Chapel Hill IRB, Malawi’s NationalCommission for Science and Technology (NCST), and National Committeefor Research in Social Sciences and Humanities.Tanzania: Tanzania’s Commission for Science and Technology (COSTECH).Zambia: American Institute for Research IRB and the University of Zambia’sResearch Ethics Committee.
Kilburn et al. BMC Psychiatry (2018) 18:201 Page 11 of 13

Zimbabwe: American Institute for Research IRB and the Medical ResearchCouncil of Zimbabwe.Written consent to participate was obtained in Kenya and Tanzania andverbal consent in Malawi, Zambia, and Zimbabwe where enumeratorssigned forms documenting that consent was asked and received. Verbalconsent was given ethical approval in these settings as available dataindicated that a large proportion of our main respondent sample would beilliterate and thus unable to read and sign a consent form.
Competing interestsThe authors declare that they have no competing interests.
Publisher’s NoteSpringer Nature remains neutral with regard to jurisdictional claims inpublished maps and institutional affiliations.
Author details1Institute for Global Health and Infectious Diseases, University of NorthCarolina, Bioinformatics CB# 7030, Chapel Hill, NC 27599-7030, USA. 2UNICEFOffice of Research – Innocenti, Piazza SS. Annunziata, 12, 50122 Florence,Italy. 3UNICEF East and Southern Africa Regional Office, P.O. Box 44145,Nairobi 00100, Kenya. 4Department of Public Policy, University of NorthCarolina, Abernethy Hall CB #3435, Chapel Hill, NC 27599-3435, USA.
Received: 2 October 2017 Accepted: 5 June 2018
References1. Patel V, Chisholm D, Parikh R, et al. Addressing the burden of mental,
neurological, and substance use disorders: key messages from diseasecontrol priorities. Lancet. 2016;387:1672–85.
2. Kassebaum N, Kyu HH, Zoeckler L, et al. Child and adolescent health from1990 to 2015: findings from the Global Burden of Diseases, Injuries, and RiskFactors 2015 Study. JAMA Pediatr. 2017;171:573–92.
3. Costello EJ, Foley DL, Angold A. 10-year research update review: theepidemiology of child and adolescent psychiatric disorders: II.Developmental epidemiology. J Am Acad Child Adolesc Psychiatry.2006;45:8–25.
4. Patel V, Flisher AJ, Hetrick S, et al. Mental health of young people: a globalpublic-health challenge. Lancet (London, England). 2007;369:1302–13.
5. Sweetland AC, Belkin GS, Verdeli H. Measuring depression and anxiety insub-Saharan Africa. Depress Anxiety. 2014;31:223–32.
6. Mutumba M, Tomlinson M, Tsai AC. Psychometric properties of instrumentsfor assessing depression among African youth: a systematic review. J ChildAdolesc Mental Health. 2014;26:139–56.
7. Ventevogel P, Jordans M, Reis R, de Jong J. Madness or sadness? Localconcepts of mental illness in four conflict-affected African communities.Confl Heal. 2013;7. https://doi.org/10.1186/1752-1505-7-3.
8. Pretorius B. Cross-cultural application of the Center for EpidemiologicalStudies Depression Scale: a study of black south African students. PsycholRep. 1991;69:1179–85.
9. Asante KO, Andoh-Arthur J. Prevalence and determinants of depressivesymptoms among university students in Ghana. J Affect Disord.2015;171:161–6.
10. Othieno CJ, Okoth R, Peltzer K, et al. Risky HIV sexual behaviour anddepression among University of Nairobi students. Ann General Psychiatry.2015;14:16.
11. Peltzer K, Pengpid S, Tiembre I. Mental health, childhood abuse and HIVsexual risk behaviour among university students in Ivory Coast. Ann GeneralPsychiatry. 2013;12:18.
12. Pengpid S, Peltzer K, Skaal L. Mental health and HIV sexual risk behaviouramong University of Limpopo students. S Afr J Psychiatry. 2013;19:25–30.
13. Brown L, Thurman TR, Rice J, et al. Impact of a mentoring program onpsychosocial wellbeing of youth in Rwanda: results of a quasi-experimentalstudy. Vulnerable Children Youth Stud. 2009;4:288–99.
14. Mukabutera A, Bizimana JDD, Owoeye O, et al. Correlates of psychosocialoutcomes among youth heads of households participating in mentoringprograms: a study among Rwandan youths from Bugesera District.Vulnerable Children Youth Stud. 2013;8:49–59.
15. Kilburn K, Thirumurthy H, Halpern CT, et al. Effects of a large-scaleunconditional cash transfer program on mental health outcomes of youngpeople in Kenya. J Adolesc Health. 2015;58:223–9.
16. Nduna M, Jewkes RK, Dunkle KL, et al. Prevalence and factors associatedwith depressive symptoms among young women and men in the easternCape Province, South Africa. J Child Adolesc Mental Health. 2013;25:43–54.
17. Radloff LS. The CES-D scale a self-report depression scale for research in thegeneral population. Appl Psychol Meas. 1977;1:385–401.
18. Radloff LS. The use of the Center for Epidemiologic Studies DepressionScale in adolescents and young adults. J Youth Adolesc. 1991;20:149–66.
19. Perreira KM, Deeb-Sossa N, Harris KM, et al. What are we measuring? Anevaluation of the CES-D across race/ethnicity and immigrant generation.Soc Forces. 2005;83:1567–601.
20. Chabrol H, Montovany A, Chouicha K, et al. Study of the CES-D on a sampleof 1,953 adolescent students. L'Encephale. 2002;28:429–32.
21. Crockett LJ, Randall BA, Shen Y-L, et al. Measurement equivalence of thecenter for epidemiological studies depression scale for Latino and Angloadolescents: a national study. J Consult Clin Psychol. 2005;73:47–58.
22. Cheung C-K, Bagley C. Validating an American scale in Hong Kong: thecenter for epidemiological studies depression scale (CES-D). J Psychol.1998;132:169–86.
23. Kazarian SS, Taher D. Validation of the Arabic Center for EpidemiologicalStudies Depression (CES-D) scale in a Lebanese community sample.Eur J Psychol Assess. 2010;26:68–73.
24. Kaharuza FM, Bunnell R, Moss S, et al. Depression and CD4 cell countamong persons with HIV infection in Uganda. AIDS Behav. 2006;10:105–11.
25. Lacasse JJ, Forgeard MJ, Jayawickreme N, et al. The factor structure of theCES-D in a sample of Rwandan genocide survivors. Soc Psychiatry PsychiatrEpidemiol. 2014;49:459–65.
26. Andresen EM, Malmgren JA, Carter WB, et al. Screening fordepression in well older adults: evaluation of a short form of theCES-D. Am J Prev Med. 1994;10:77–84.
27. Boey KW. Cross-validation of a short form of the CES-D in Chinese elderly.Int J Geriatr Psychiatry. 1999;14:608–17.
28. Cartierre N, Coulon N, Demerval R. Analyse confirmatoire de la version courtede la Center for epidemiological studies of depression scale (CES-D10) chez lesadolescents. L'Encephale. 2011;37:273–7.
29. Bradley KL, Bagnell AL, Brannen CL. Factorial validity of the Center forEpidemiological Studies Depression 10 in adolescents. Issues Mental HealthNurs. 2010;31:408–12.
30. Zhang W, O’Brien N, Forrest JI, et al. Validating a shortened depression scale(10 item CES-D) among HIV-positive people in British Columbia, Canada.PLoS One. 2012;7:e40793.
31. Baron EC, Davies T, Lund C. Validation of the 10-item Centre forEpidemiological Studies Depression Scale (CES-D-10) in Zulu, Xhosa andAfrikaans populations in South Africa. BMC Psychiatry. 2017;17. https://bmcpsychiatry.biomedcentral.com/articles/10.1186/s12888-016-1178-x.
32. Posner SF, Stewart AL, Marín G, et al. Factor variability of the center forepidemiological studies depression scale (CES-D) among urban latinos.Ethn Health. 2001;6:137–44.
33. Makambi KH, Williams CD, Taylor TR, et al. An assessment of the CES-D scalefactor structure in black women: the black Women's health study. PsychiatryRes. 2009;168:163–70.
34. Campo-Arias A, Díaz-Martínez LA, Rueda-Jaimes GE, et al. Psychometricproperties of the CES-D scale among Colombian adults from the generalpopulation. Rev Colombiana de Psiquiatría. 2007;36:664–74.
35. Yang L, Jia C-X, Qin P. Reliability and validity of the Center forEpidemiologic Studies Depression Scale (CES-D) among suicide attemptersand comparison residents in rural China. BMC Psychiatry. 2015;15:8–12.
36. Zhang J, Sun W, Kong Y, et al. Reliability and validity of the Center forEpidemiological Studies Depression Scale in 2 special adult samples fromrural China. Compr Psychiatry. 2012;53:1243–51.
37. Fountoulakis K, Iacovides A, Kleanthous S, et al. Reliability, validity andpsychometric properties of the Greek translation of the Center forEpidemiological Studies-Depression (CES-D) scale. BMC Psychiatry. 2001;1.https://bmcpsychiatry.biomedcentral.com/articles/10.1186/1471-244X-1-3.
38. Atkins R. Validation of the Center for Epidemiologic Studies DepressionScale in black single mothers. J Nurs Meas. 2014;22:511.
39. Edman JL, Danko GP, Andrade N, et al. Factor structure of the CES-D (Centerfor Epidemiologic Studies Depression scale) among Filipino-Americanadolescents. Soc Psychiatry Psychiatr Epidemiol. 1999;34:211–5.
Kilburn et al. BMC Psychiatry (2018) 18:201 Page 12 of 13

40. Steinhausen H-C, Metzke CW. Adolescent self-rated depressive symptoms ina Swiss epidemiological study. J Youth Adolesc. 2000;29:427–40.
41. Harker K. Immigrant generation, assimilation, and adolescent psychologicalwell-being. Soc Forces. 2001;79:969–1004.
42. Gore S, Aseltine RH Jr, Colten ME. Social structure, life stress, and depressivesymptoms in a high school-age population. J Health Soc Behav.1992;33:97–113.
43. Lorenzo-Blanco EI, Unger JB. Ethnic discrimination, acculturative stress, andfamily conflict as predictors of depressive symptoms and cigarette smokingamong Latina/o youth: the mediating role of perceived stress. J Youth Adolesc.2015;44:1984–97.
44. Lorenzo-Blanco EI, Unger JB, Baezconde-Garbanati L, et al. Acculturation,enculturation, and symptoms of depression in Hispanic youth: the roles ofgender, Hispanic cultural values, and family functioning. J Youth Adolesc.2012;41:1350–65.
45. Videon TM. The effects of parent-adolescent relationships and parentalseparation on adolescent well-being. J Marriage Fam. 2002;64:489–503.
46. Jackson PB, Finney M. Negative life events and psychological distressamong young adults. Soc Psychol Q. 2002;65:186–201.
47. Hagan J, Foster H. Youth violence and the end of adolescence. Am SociolRev. 2001;66:874–99.
48. Gorsuch RL. Factor analysis. 2nd ed. Hillsdale, NJ: LEA; 1983.49. Catell R. The scree test for the number of factors. Multivar Behav Res.
1966;1:245–76.50. Hooper D, Coughlan J, Mullen M. Structural equation modelling: guidelines
for determining model fit. Electron J Bus Res Methods. 2008;6:53–60.
Kilburn et al. BMC Psychiatry (2018) 18:201 Page 13 of 13