EXAMINATION OF ELECTROGLOTTOGRAPHY (EGG) AND …
48
EXAMINATION OF ELECTROGLOTTOGRAPHY (EGG) AND SURFACE ELECTROMYOGRAPHY (sEMG) AS TECHNIQUES TO ASSESS ORAL MOTOR ACTIVITY DURING CONSUMPTION OF FOUR FORMS OF CHOCOLATE By Taylor E. Patterson A thesis submitted to the faculty of The University of Mississippi in partial fulfillment of the requirements of the Sally McDonnell Barksdale Honors College Oxford May 2017 Approved by Advisor: Dr. Carol A. Britson Reader: Dr. Wayne L. Gray Reader: Dr. Colin R. Jackson
Transcript of EXAMINATION OF ELECTROGLOTTOGRAPHY (EGG) AND …

EXAMINATION OF ELECTROGLOTTOGRAPHY (EGG) AND SURFACE
ELECTROMYOGRAPHY (sEMG) AS TECHNIQUES TO ASSESS ORAL MOTOR
ACTIVITY DURING CONSUMPTION OF FOUR FORMS OF CHOCOLATE
By
Taylor E. Patterson
A thesis submitted to the faculty of The University of Mississippi in partial fulfillment of
the requirements of the Sally McDonnell Barksdale Honors College
Oxford
May 2017
Approved by
Advisor: Dr. Carol A. Britson
Reader: Dr. Wayne L. Gray
Reader: Dr. Colin R. Jackson

ii
2017
Taylor Patterson
ALL RIGHTS RESERVED

iii
ABSTRACT
Taylor Patterson: Examination of Electroglottography (EGG) and Surface
Electromyography (sEMG) as Techniques to Assess Oral Motor Activity during
Consumption of Four Forms of Chocolate
(Under the direction of Carol Britson)
The study assessed individual oral motor activity while eating different types of
chocolates through the use of electroglottography (EGG) and surface electromyography
(sEMG). I hypothesized that chocolate samples with higher milk solids and cocoa
composition would be preferred by subjects as assessed by subject evaluation of textural
attributes for the four chocolate samples. I predicted that preference will be significantly
and positively correlated with oral motor events [e.g. sEMG activity of master and
suprahyoid muscles, total number of chewing actions, and time to last swallow (EGG)].
The experiment used a subject group of 40 students enrolled at the University of
Mississippi between the ages of 18 and 24 with informed consent. Subjects were asked to
consume four chocolate samples as they normally would, but to consider and rank the
degree of bitterness, hardness, mouth coating, and satisfaction for each sample. Water
was consumed after each sample. The subject had sEMG electrodes positioned on each
side of the face at the masseter muscle and hyoid muscle, and one sEMG ground
electrode on the shoulder. EGG electrodes were positioned at each side of the thyroid
cartilage (‘Adam’s Apple), and one EGG ground electrode on the shoulder. The subject
consumed one randomly selected sample of chocolate to measure chewing and
swallowing events. Data collection began from the time the chocolate is placed in the
mouth, and conclude after the last swallowing event.

iv
The overall preference was significantly different between chocolate types with
gourmet milk chocolate being the most preferred, and gourmet dark chocolate the least.
Significant differences were observed within each intake survey ranking. Significant
relationships were observed between bitterness and mastication muscle forces and
between hardness and chew time parameters. Mouth coating ranking showed a significant
relationship to average masseter force and average chew time of chews 1-5. Finally,
satisfaction showed a significant relationship with average chew time of chews 1-5 and
chew rate. Each textural attribute significantly correlated with a mastication parameter
from the first five chews indicating that textural attributes are decided in the beginning of
mastication and flavor release. The experiment shows that a significant relationship exists
among eating behavior, textural attributes, and preference.

v
TABLE OF CONTENTS
LIST OF TABLES ...........................................................................................................vi
LIST OF FIGURES .........................................................................................................vii
ACKNOWLEDGEMENTS .............................................................................................viii
INTRODUCTION ...........................................................................................................1
MATERIALS AND METHODS .....................................................................................6
RESULTS ........................................................................................................................10
DISCUSSION ..................................................................................................................14
LIST OF REFERENCES .................................................................................................20
TABLES ..........................................................................................................................23
FIGURES .........................................................................................................................28
APPENDIX ......................................................................................................................36

vi
LIST OF TABLES
TABLE 1: Chocolate ingredient composition for each chocolate sample in descending
order of quantity ...............................................................................................................23
TABLE 2: Regression analyses of ranked bitterness vs. mastication parameters by
chocolate type. Significant r2 values (p0.05) are shown in bold. Asterisks indicate less
variance about the best fit line (r2>0.3). ...........................................................................24
TABLE 3: Regression analyses of ranked hardness vs. mastication parameters by
chocolate type. Significant r2 values (p0.05) are shown in bold. Asterisks indicate less
variance about the best fit line (r2>0.3). ...........................................................................25
TABLE 4: Regression analyses of ranked mouth coating vs. mastication parameters by
chocolate type. Significant r2 values (p0.05) are shown in bold. Asterisks indicate less
variance about the best fit line (r2>0.3). ...........................................................................26
TABLE 5: Regression analyses of ranked satisfaction vs. mastication parameters by
chocolate type. Significant r2 values (p0.05) are shown in bold. Asterisks indicate less
variance about the best fit line (r2>0.3). ...........................................................................27

vii
LIST OF FIGURES
FIGURE 1: Electroglottography and surface electromyography electrode placement on
the subject for chewing and swallowing parameter recordings .......................................28
FIGURE 2: Average of student rankings of chocolate characteristics rated on a scale of 1-
5 (1=low characteristic perception, 5=high characteristic perception) for each chocolate
sample tested. Error bars represent one standard deviation from the mean.....................29
FIGURE 3: Average sEMG recordings for mastication force parameters for all chocolate
samples. The gourmet white chocolate error bar (SD=4.12) was removed because it was
obscuring visual relationships among groups ..................................................................30
FIGURE 4: Average sEMG recordings for chewing time, count, and rate for all chocolate
samples. ............................................................................................................................31
FIGURE 5: The regression analysis of % max masseter force chews 1-5 vs. bitterness
ranking of novelty milk chocolate with a high, significant r2 value ................................32
FIGURE 6: The regression analysis of average masseter force chews 1-5 vs. hardness
ranking of gourmet dark chocolate with the highest, significant r2 value .......................33
FIGURE 7: The regression analysis of average masseter force chews 1-5 vs. mouth
coating ranking of gourmet white chocolate with the highest, significant r2 value .........34
FIGURE 8: The regression analysis of time at last swallow vs. satisfaction ranking of
novelty milk chocolate with the highest, significant r2 value ..........................................35

viii
ACKNOWLEDGEMENTS
I would like to thank Dr. Carol Britson for her unwavering guidance, knowledge, and
support over the last two years of this process. I am extremely grateful for all of the time
and hard work she has invested in both me personally and my thesis. I would also like to
thank my second reader, Dr. Wayne Gray, and my third reader, Dr. Colin Jackson, for
their suggestions and comments. The University of Mississippi’s Department of Biology
has been an incredible learning experience for me, and I am grateful for receiving my
undergraduate there. The Sally McDonnell Barksdale Honors College further enhanced
my education and college experience. Furthermore, I would like to thank the professors
that I have had the privilege of learning from during my time at the University of
Mississippi. Lastly, I am grateful for the encouragement and continuous support my
friends and family gave me during this process, and continue to provide even after
completion.

1
INTRODUCTION
Overview
In modern society, food texture has played an increasing role in consumer’s food
selection and preferences due to the wide variety of food available and a greater
understanding of nutritional benefits (Brown, 1994). Chewing behavior is described as a
combination of various physiological, anatomical, and psychological factors, such as
coordination of jaw movement, size and strength of masticatory muscles, and learned
patterns of chewing ranging from those who chew and swallow quickly to those who
suck and allow the chocolate to melt in the mouth (Carvalho-da-Silva et al., 2011).
However, the effectiveness with which the sample is manipulated in the mouth during
mastication will contribute to the efficiency of food breakdown, which increases the
surface area of the food, stimulates saliva secretion, and accelerates the rate of flavor
release in the mouth (Brown et al., 1996).
Differences of sensory attributions of chocolate are attributed to different cocoa
types, varying ingredient proportions, and processing methods (Afoakwa et al., 2007).
The primary chocolate categories include dark, milk, and white chocolate that vary in
ingredient composition of cocoa solids, milk fat, and cocoa butter, which lead to different
proportions of carbohydrates, fat, and protein. Multiple versions of cocoa are used by
different manufactures for different chocolates including cocoa butter, cocoa powder,
cocoa liquor, cocoa butter equivalents, and cocoa butter replacements, such as lauric fats,
palm kernel, and coconut oil (Afoakwa et al., 2007). Cocoa butter replacements are used
completely in place of cocoa butter in novelty chocolates, but are poorly absorbed by the
gut. The United States requires cocoa butter as the exclusive fat source for a product to be
2
called a chocolate (U.S. Food and Drug Administration, 1988). However, cocoa butter
and lecithin, a surfactant, reduce the chocolate viscosity, while milk fat softens the
texture and adds to the creaminess attribute (Afoakwa et al., 2007). A high-quality
chocolate contains a high fat content, small mean particle size, and a low viscosity. This
is due to the fact that particle size distribution determines the perception of flavor,
viscosity, and texture, and is a distinguishing factor of chocolate types (Afoakwa et al.,
2007). Large particle sizes determine mouth feel, but diminish sweetness, while smaller
particle sizes provide a creamier taste. The maximum particle size of a chocolate is 30
m or the chocolate contains a gritty taste with a high viscosity that causes a pasty mouth
feel to prolong in the mouth (Afoakwa et al., 2007). Dark chocolate has an optimum
particle size of less than 35 m, and milk chocolate has a bimodal distribution of particle
size. Ziegler et al. (2001) demonstrated an inverse relationship between particle size and
the effort to melt, manipulate, and swallow the chocolate sample. Fine chocolate with
small particle sizes had a significantly high mastication effort.
Techniques to measure physiological parameters of chewing include surface
electromyography (sEMG) to evaluate the activity of masticatory muscles, and
electroglottography (EGG) to identify swallowing events (Carvalho-da-Silva et al.,
2011). Both of these techniques are non-invasive, inexpensive, and do not interfere with
the eating process. Carvalho-da-Silva et al. (2011) investigated variation in the individual
eating behavior chocolate with the use of sEMG and EGG procedures, and determined
that changes in eating behavior relate to textural differences between two chocolate
samples. Forty chocolate consumers evaluated two different chocolate samples for five
textural attributes (hardness, melting speed, smoothness, thickness, and mouth coating)

3
and sEMG data including total number of chews, time of last chew, total chewing time,
total chew rate, total muscle work, total muscle work rate, total number of swallows, the
first and last time of swallow, and swallow rate (Carvalho-da-Silva et al., 2011). The
findings allowed separation of the subjects into three eating behavior groups including
“fast chewers”, “thorough chewers”, and “suckers.” A two-fold increase existed for the
time the chocolate was kept in the mouth between the fast chewers (17s) and suckers
(46s) while the thorough chewers (30s) had the median value. The suckers displayed the
lowest number of chews (15), chew rate (0.36 s-1), and muscle work (10.17 mV). The
thorough chewers had the highest number of chews (26) and muscle work (28.02 mV),
while the fast chewers had the highest chew rate (1.08 s-1) (Carvalho-da-Silva et al.,
2011). Similarly, Brown et al. (1994a) used sEMG to investigate the chewing patterns for
a range of foods, and divided the population of fifty-two subjects into eating behavior
groups of fast eaters (11.5%), slow eaters (21.2%), and energetic/inefficient eaters (9.6%)
due to the discriminating factors of chew time, chew rate, and muscle work that showed
significance across all foods tested. Another aspect of eating behavior investigated by de
Lavergne et al. (2015) includes the analysis of different eating durations due to chewing
behavior on texture perception and bolus properties. He divided subjects into two groups
(fast and slow eaters), in which both groups had similar textural perceptions of the
product in the beginning of mastication, but different towards the end. Short eaters had a
higher first chew force, and did not break down the bolus as much resulting in larger,
fewer bolus fragments, less adhesive bolus properties, and less saliva incorporation.
Together these three studies suggest that eating behavior variation among consumers is

4
due to mastication parameters of chew time and muscle work and cause a significant
effect in texture perception, but lack investigation of the influence of preference.
Differences in eating behaviors may contribute to preference because
acceptability and liking of a food is based on the ease in which a product can be
manipulated and managed in the mouth. Specifically, chew rate is positively correlated to
preference; the faster a subject chews, the easier the product is manipulated in the mouth,
and the higher the preference (Brown and Braxton, 2000). Nasser et al. (2011) found that
with chocolate specifically, the sugar and cocoa content of chocolate is positively
correlated with the preference and desire for chocolate. Chocolates are semi-solid
suspensions of fine solid particles from sugar and cocoa in a continuous fat phase. The
continuous lipid phase composition of chocolate influences mouth coating because
chocolate melts during consumption to give a smooth suspension of solids in cocoa butter
and milk fat (Afoakwa et al., 2007). As chocolate melts in the mouth, the continuous fat
phase inverts into a continuous aqueous phase that mixes with saliva to dissolve sugar
particles, while lipids and cocoa solids coat the mouth’s epithelial surfaces. This final
phase inversion of oral dissolution provides the final assessment of texture.
Not only do eating behaviors contribute to preference, but also perceived textural
attributes. Chang and Chen (2013) found that chew force was at a maximum, meaning
masseter muscles were most active, during the early chewing phases, and progressively
decreased as mastication continued due to the progressively fragmented bolus. Food
texture properties had the strongest relationship with muscle activity in the first bite;
chew force positively correlated with hardness, while chew work positively correlated
with breaking energy. Iguchi et al. (2015) concluded that chewing performance and the

5
resultant muscle activity depends on food hardness; the harder the food, the more
chewing cycles, the longer the chew duration, and the greater the masseter and hyoid
force. Previous studies have also concluded that the number of chews, swallowing events,
and residence time in mouth for chocolate are positively correlated to mouth coating
(Carvalho-da-Silva et al., 2011). Overall, previous studies tested eating behavior in
relation to preference or textural attributes proving that significant relationships exist
among all three variables, but the relationship has not been tested to understand how the
oral breakdown of food gives rise to preference and perceived textural attributions.
Purpose
This research project assessed individual oral motor activity while eating different
types of chocolate samples using EGG for swallowing events and sEMG for chewing
events. With this information, I aimed to determine which aspects of the masticatory
process underlie differences in individual chewing behavior. I hypothesized that
chocolate samples with a higher milk solid and cocoa composition would be preferred by
subjects as assessed by subject evaluation of four chocolate samples for bitterness,
hardness, mouth coating, and satiation. I also hypothesized that preference will be
significantly correlated with oral motor events, such as total chews, muscle force, and
time to last swallow.

6
MATERIALS AND METHODS
This study began by recruiting by email forty, male or female, college students
ages 18-24 enrolled at the University of Mississippi with no history of adverse reactions
to chocolate, and no dental work that would interfere with mastication. The experiment
was reviewed and approved by the Institutional Review Board (#16-066) at the
University of Mississippi. If participants were interested in volunteering, informed
consent was obtained and an intake survey was given to the participants (Appendix A).
Four different types of chocolate samples of the same size and shape with varying
ingredients were used in my experiment (Table 1): gourmet milk chocolate (Lindt and
Sprüngli, 30% cocoa), gourmet dark chocolate (Lindt and Sprüngli, 90% cocoa), gourmet
white chocolate (Lindt and Sprüngli), and novelty milk chocolate (R.M. Palmer
Company). All chocolates were purchased locally. All of the Lindt chocolate types had
expiration dates within one month of each other, but the novelty milk chocolate had no
expiration date. This novelty milk chocolate does not contain cocoa butter but instead
contains vegetable oils. The intake survey evaluated the subject’s perception of each
chocolate sample’s textural attributes, along with their overall preference. Participants
were given an intake survey form in an envelope, and 10 mg of each of the four chocolate
samples were randomly presented to the subject as A, B, C, and D. For each chocolate
sample, the subjects were instructed to consume the chocolate as they normally would,
but to consider the degree of bitterness, hardness at first bite (force to bite into the
chocolate), mouth coating (extent to which residue coats the mouth after swallowing),
and satisfaction. Water was consumed by the subjects after each chocolate sample to

7
cleanse the mouth. After all chocolate samples were tested, the subjects ranked the
chocolate samples in order of overall preference, and placed the intake survey back into
the envelope. My advisor assigned a four-digit code to the envelope to ensure that I did
not know which codes were matched with which subject until completion of the
experimental data collection.
Surface electromyography was used to evaluate masticator muscle activity while
chewing, and electroglottography was used to record swallowing events from the closing
and opening of the vocal folds (Hort et al., 2011). Both methods are non-intrusive, and do
not interfere with the eating process. A PowerLab 26T (LTS) electronic data acquisition
system from ADInstruments Inc. recorded the EGG and sEMG data using LabChart
software package version 8.0.2.
I used a ML317 electrooculography (EOG) recorder connected to the PowerLab
system to record the EGG data. The EOG pod is designed to detect fine scale muscle
activity and in addition to oculomotor activity can be used to produce electrogastrographs
and electroglottographs. Three MLA2504 Shielded Lead Wires were connected to the
EOG pod according to the color-coded, positive, negative and ground leads. The EOG
pod was plugged into the Input 1 Pod Port on the front panel of the PowerLab system.
Disposable adhesive electrodes were attached to each lead before being placed on the
subject. The EOG pod was calibrated to 0 mV before the experiment began, and the
sensitivity range for the pod is 4mV. A push button switch was also connected to the
front panel of the PowerLab system via the Input 2 Pod Port in order to ensure the
recording of the last swallow.

8
For the sEMG equipment, a MLA2540 Five-lead Shielded Bio Amp Cable and
MLA2505 snap-connected Lead Wires were used. The Bio Amp cable was connected to
the PowerLab system via the Bio Amp socket. Five MLA1010 disposable adhesive
electrodes were attached to the five snap-connected Lead Wires before placed on the
subject. The sensitivity range for the MLA2540 Five-lead Shielded Bio Amp Cable is
5V to 100 mV.
Before beginning the experimental portion of the project, subjects were shown
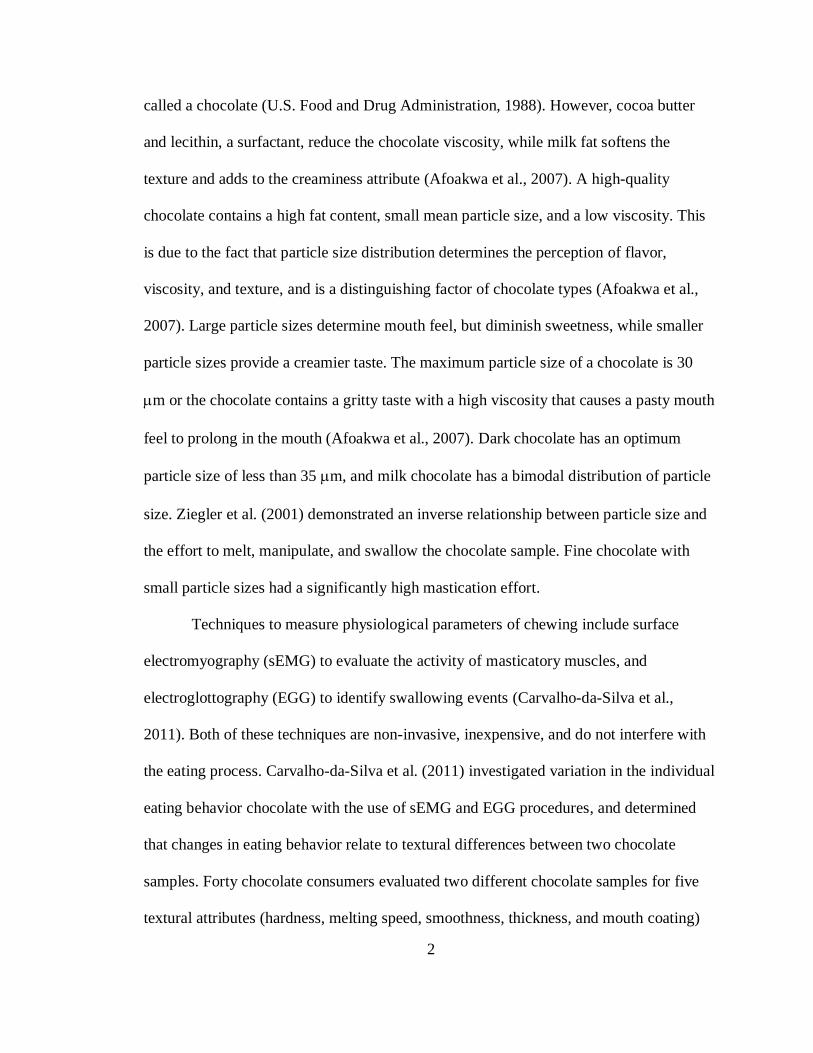
where the sEMG and EGG electrodes would be placed on their skin. They were
instructed to cleanse those areas of their own skin with an alcohol wipe in order to
guarantee secure attachment of the electrodes to the skin. Four sEMG electrodes were
attached to each side of the subject’s face at the masseter muscle and hyoid muscle. The
other sEMG electrode was placed on the subject’s shoulder to act as a ground. Two EGG
electrodes were placed on each side of the thyroid cartilage (“Adam’s Apple), and one
EGG electrode was placed on the shoulder to act as a ground (Figure 1).
Following electrode attachment, subjects were asked to perform three voluntary
actions for the purpose of calibrating the equipment. First, subjects clenched their teeth to
measure the maximum voluntary contraction (MVC) of the masseter muscle. Second,
subjects lowered their mandible (opened mouth) to measure the voluntary action of the
hyoid muscle. Third, subjects took a sip of water and swallowed in order to calibrate a
swallowing event. The subjects were then presented with one randomly selected
chocolate sample (10 mg), asked to consume as they normally would, and depress the
push button when taking their last swallow. Data collection began from the time the
chocolate was placed in the mouth, and concluded after the last swallowing event. After

9
consumption, data files were stored on a computer using a randomly assigned four-
character code. Upon completion of consumption and recordings, the electrodes were
removed from the subject’s skin, and lotion was provided as needed for skin irritation. At
the end of the experimental data collection, the randomly assigned four-digit codes were
matched with the four character codes for each subject to allow for analysis testing of the
correlation between preference and oral motor activity from the single-blind experiment.
Analytical Methods
Chi-square analysis (Siegel and Castellan, 1988) was used to detect significant
difference in preferred chocolate. Descriptive statistics, such as mean, standard deviation,
and standard error, were calculated for the intake survey rankings of each chocolate for
mouth coating, hardness, bitterness, satisfaction, and overall preference. One-Way
Analyses of Variance (ANOVA) were performed to evaluate the rankings of each textural
attribute from the intake survey data for each of the four chocolate samples. Descriptive
statistics were also calculated for the sEMG and EGG variables including average chew
force, average time per chew, % of max masseter force, % of max hyoid force, total
number of chews, total chewing time, chew rate, and time of last swallow. Regression
analyses were used to identify significant relationships between intake ranking and the
sEMG variables for the specific chocolate sample that the subject consumed during the
sEMG and EGG data recording. Analyses were conducted using Microsoft Excel and the
level of significance was set at =0.05 for all tests.

10
RESULTS
Intake Survey
When asked to rank their overall preference of the four chocolate samples, 24
students preferred gourmet milk chocolate over the 0 students who preferred gourmet
dark chocolate, 13 who preferred gourmet white chocolate, or 3 who preferred novelty
milk chocolate. The overall preference ranking of the four chocolate samples was
statistically significant (2= 35.4, df=3, p0.05).
Gourmet dark chocolate was ranked as having the highest bitterness, highest
hardness, and lowest satisfaction among all chocolate samples, while gourmet milk
chocolate was overall perceived as having the highest mouth coating and highest
satisfaction. Gourmet white chocolate was ranked as the lowest perception of bitterness
while the novelty milk chocolate had the lowest hardness and the lowest mouth coating
properties. Statistical differences were observed within the ranked bitterness rankings of
the four chocolates (F (3,156) =126.97, p0.001; Fig. 2), as well as within hardness
perception rankings (F (3,156) =38.53, p0.001; Fig. 2), mouth coating rankings (F (3,156)
=8.07, p0.001; Fig. 2), and satisfaction rankings (F (3,156) =44.84, p0.001; Fig. 2).
sEMG Data
Each chocolate type was consumed by 10 volunteers randomly selected from the
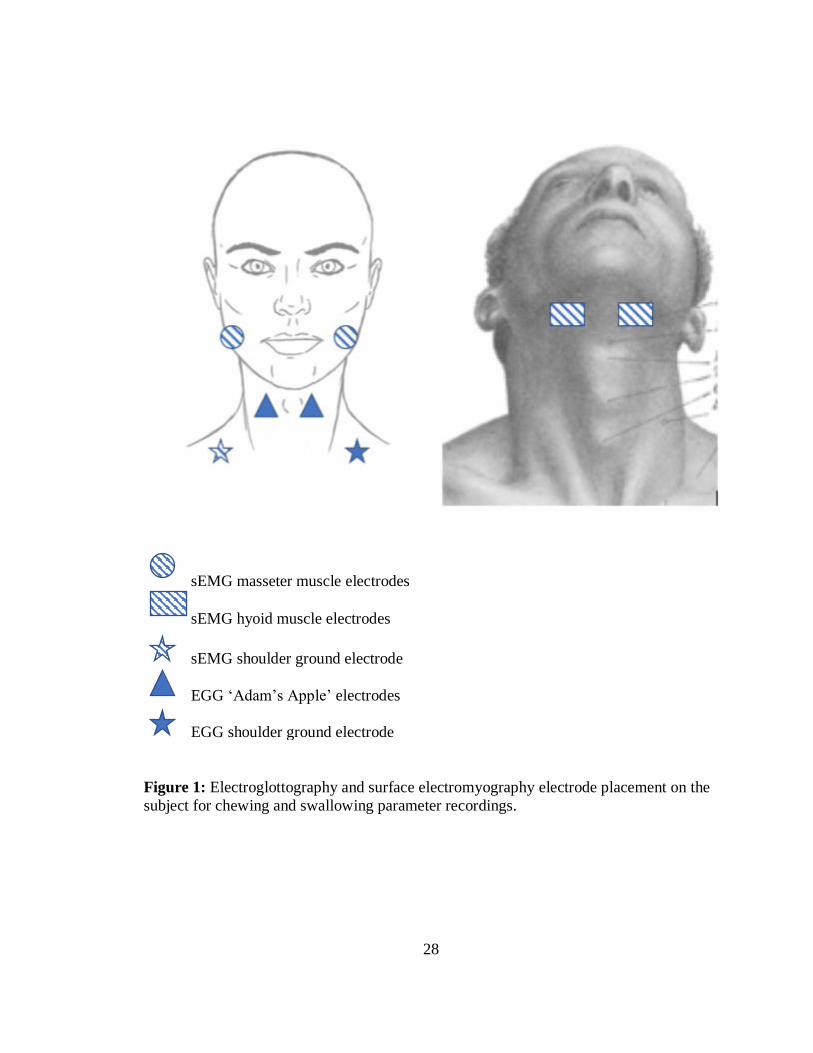
subjects during sEMG analysis of mastication activity. Mastication force variables (Fig.
3) and chewing time, count, and rate variables (Fig. 4) were statistically analyzed using a
regression analysis. The EGG equipment was not consistently reliable across all trials, so

11
only the time of last swallow parameter was examined from the use of the red push
button.
For testing the regression relationship of mastication parameters vs. ranked
bitterness, only intake rankings for bitterness of novelty milk chocolate (for example)
were analyzed against mastication parameters of subjects consuming novelty milk
chocolate during the sEMG test. Thus, n=10 for all regression tests of each textural
attribute ranking. Every chocolate had at least one significant relationship in each ranking
regression, but it was not always significant or not across all regressions.
Regression analysis of sEMG mastication data and bitterness rankings (Table 2)
indicated that the ranked bitterness for all chocolate samples is significantly correlated
with percent maximum masseter force of chews 1-5 and chew rate. The bitterness ranking
of gourmet milk chocolate significantly correlated with all mastication parameters except
average masseter force for chews 1-5 and the percentage of maximum hyoid force of the
entire trial. Gourmet white chocolate’s bitterness ranking significantly correlated with all
sEMG parameters except the percentage of maximum masseter of the entire trial. The
highest significant r2 value existed for the percent maximum hyoid chew force of the
entire trial for gourmet white chocolate’s ranked bitterness. However, every subject
ranked bitterness as 1, so it distorted the results of the statistical test. Significant
relationships with less variance were also observed between ranked bitterness of novelty
milk chocolate and both percent maximum masseter force for chews 1-5 (Figure 5) and
percent maximum masseter force of the entire trial.
The regression of ranked hardness and its collective sEMG data (Table 3) showed
that hardness ranking for all chocolate samples significantly correlated with both the

12
average chew time for chews 1-5 and the maximum hyoid chew time. However, only
gourmet white chocolate showed significant correlation of hardness ranking and time at
last swallow, total chews, and total chewing time. Novelty milk chocolate showed
significant correlation between hardness and all mastication variables except time at last
swallow, total chews, and total chewing time. Maximum masseter chew time showed a
significant relationship with less variance for gourmet milk chocolate. The highest
significant r2 values existed for gourmet dark chocolate’s average masseter force for
chews 1-5 (Fig. 6) and maximum hyoid chew time. Hardness also displayed a significant
relationship with high r2 values meaning less variance around the best fit line for average
chew time of chews 1-5 for novelty milk chocolate.
The regression of mouth coating ranking and sEMG mastication parameters
(Table 4) indicated that mouth coating ranking significantly correlated with chew rate for
all chocolate samples. Within this regression, gourmet dark chocolate showed significant
correlation of mouth coating ranking and all mastication parameters except average
masseter force for chews 1-5, while gourmet milk chocolate’s mouth coating ranking was
only significantly correlated with chew rate. The only strong significant correlations with
the least variance existed for gourmet white chocolate’s mouth coating ranking, in which
the average masseter force for chews 1-5 (Fig. 7) displayed a three-fold difference from
average chew time for chews 1-5.
The final regression of chocolate sample satisfaction and sEMG data (Table 5)
shows significant correlations for all of the chocolates satisfaction rankings and the
average chew time of chews 1-5, percent maximum hyoid force of the entire trial, and
time at last swallow. These were the only parameters that gourmet milk chocolate showed

13
significance correlations with satisfaction. Significant relationships with less variance
existed between satisfaction raking and both average chew time of chews 1-5 and percent
maximum hyoid chew force for gourmet dark chocolate. Gourmet white chocolate’s
satisfaction ranking showed significant correlation with less variance for percent
maximum hyoid force as well. Novelty milk chocolate’s satisfaction ranking of less
variance significantly correlated with chew rate, total chewing time, total chews, time at
last swallow, and percent maximum masseter chew force of the entire trial. The highest r2
value existed for novelty milk chocolate’s time at last swallow (Fig. 8).

14
DISCUSSION
This experiment provides statistically significant evidence that preference and
textural attributes of chocolate have an impact upon individual eating behavior. From
examining the literature of Nasser (2011), it was expected that the chocolate with the
highest sugar and cocoa content would be highly preferred. This holds true for the
gourmet milk chocolate, which contains the two largest proportions of both sugar and
cocoa content (30%), as well as obtained the overall most preferred ranking, and highest
satisfaction ranking. Gourmet dark chocolate was the least preferred chocolate and had
the lowest satisfaction ranking; this is because it contains the largest proportion of cocoa
(90%), but minimum sugar causing its high bitterness evaluation. Dark chocolate is also
the only chocolate sample that does not contain any milk products that add to the
creaminess and therefore sweetness attribute. Because of its high level of cocoa, gourmet
milk chocolate was also perceived to have the highest mouth coating perception. Afoaka
(2007) explains that this is because lipids and cocoa solids coat the oral epithelial surface
providing the perception of mouth coating and melting properties. As chocolate melts in
the mouth, the continuous fat phase inverts into an aqueous phase mixing with saliva to
dissolve sugar. Because gourmet dark chocolate has a minimum level of sugar dissolved,
all that is tasted is the inherently bitter cocoa coated on the mouth. Similarly, Harwood et
al. (2012) found that as bitterness of chocolate increased, preference decreased; also,
subjects that preferred dark chocolate displayed significantly higher rejection thresholds
of bitterness than those who preferred milk chocolate. Another aspect that could
influence preference of dark chocolate is the associated cardiovascular health benefits
such as decreased blood pressure and overall cardiovascular mortality. Dark chocolate’s

15
manufacturing process retains the compound epicatechin from cacoa, which is thought to
be responsible for the associated health benefits. Current data suggests that chocolate
containing at least 60% cacoa and consumed at a maximum of 2 g per day is optimum for
preventing cardiovascular disease (Higginbotham and Taub, 2015).
Both gourmet white chocolate and novelty milk chocolate have sugar as their
primary ingredient, but a lesser cocoa content. Gourmet white chocolate has only cocoa
butter as its cocoa content causing the significantly lowest perceived bitterness ranking.
The novelty milk chocolate lacks cocoa butter, and instead gets its fat from vegetable oil.
For a chocolate to legally be considered a chocolate, it must have a minimum percentage
of cocoa including cocoa butter, or it must be called “chocolate flavored,” as is the case
with the novelty milk chocolate (U.S. Food and Drug Administration, 1988). Without
cocoa butter a chocolate does not have to go through the tempering process, in which a
series of melting and agitation forces the proper crystallization of cocoa butter crystals in
order to further provide creaminess and hardness to the chocolate (Afoaka, 2007). This
makes the chocolate cheaper to manufacture, and easier to mold. The novelty milk
chocolate has the lowest amount of cocoa resulting in its significant low mouth coating
ranking, and also has the significantly lowest hardness ranking because of the lack of the
tempering process. The novelty milk chocolate also was the only chocolate with no
expiration date. These relationships signify that both high, close proportions of sugar and
cocoa positively correlate with preference of chocolate.
Chewing parameters were also indicators of preference among subjects. Average
chew time of chews 1-5, percent maximum masseter chew force across the entire trial,
percent maximum hyoid chew force of the entire trial, time at last swallow, total chews,

16
total chewing time, and chew rate were all variables significantly correlated with the
preference of a chocolate sample type. Chew rate’s correlation to preference is due to the
ease of manipulating the chocolate in the mouth (Brown 2000). However, chew rate and
satisfaction ranking significantly correlated for all of the chocolates except gourmet milk
chocolate possibly due to its significantly high mouth coating ranking. de Lavergne
(2015) concluded that the longer the oral exposure time to the food and the higher the
eating effort, defined as total muscle work, total number of chews, and chew frequency,
the higher the satisfaction. Satisfaction and longer oral exposure time could be related to
the adaptation of a taste because instinctively people desire to rid of a bad stimulus from
the oral cavity with quick eating behaviors or expelling it from the mouth as seen in the
gourmet dark chocolate’s significantly low number of total chews and total chewing time.
Facial grimaces were also recorded for subjects eating the gourmet dark chocolate during
the sEMG recording. I can also conclude that satisfaction and preference of chocolate
significantly correlate with average chew time for chews 1-5, percent maximum hyoid
force of the entire trial, and time at last swallow across all chocolate samples. Overall, the
faster the chewing or the higher number of chews showed preference meaning that
individual’s eating behavior increased with increasing preference.
Chang and Chen (2013) established that food textural properties have the
strongest relationship with muscle activity at first bite causing a correlation between
chew force and hardness of food. Similarly, Iguchi et al. (2015) added that chewing
performance parameters, such as number of chews, chew time, and chew force, are
correlated with food hardness. Supporting these previous findings, average masseter force
for chews 1-5, average chew time for chews 1-5, and maximum masseter and hyoid chew

17
time all displayed significant, positive relationships to hardness. High force for the first
chews is needed to progressively break apart the chocolate into smaller fragments, which
subsequently increases the time of these chews because of the still large bolus in the
mouth. Gourmet dark chocolate had the significantly highest hardness ranking, which
was ranked from the perception of hardness from the first bite of chocolate. However,
gourmet dark chocolate had the lowest mean number of chews, chew time, and chew rate,
which contradicts Iguchi et al.’s (2015) conclusion. This is because, unlike this
experiment, Iguchi et al.’s (2015) experiment did not relate hardness, and the chewing
parameters to preference.
Similar to hardness, the mouth coating ranking also showed a significant positive
relationship with average masseter force for chews 1-5 and average chew time for chews
1-5. With an increasing mouth coating attribute, chewing time is increased because of the
added difficulty due to an oral epithelial coat of milk solids and cocoa particles. Chew
rate is found to be significant across all chocolate samples for mouth coating rankings.
The gourmet milk chocolate had the highest mouth coating ranking, which was
significantly correlated to only chew rate. However, gourmet dark chocolate had the
second highest mouth coating ranking that significantly correlated with all mastication
parameters except average masseter force of chews 1-5. The mastication parameters
involving muscle force were all correlated with different attributes of the chocolate
samples providing significant evidence of a relationship between eating behavior and
textural attributes. In the first five chews, all textural attributes were found to
significantly correlate with a mastication parameter. This indicates that perception of
textural attributes occurs at the beginning of mastication.

18
In previous experiments, such as Carvalho-da-Silva et al. (2011) and Brown
(1994a), subjects were grouped by significant differences in their eating behavior.
Carvalho-da-Silva et al. (2011) grouped subjects into “fast chewers, thorough chewers,
and suckers” based on differences in chew rate, number of chews, time chocolate was
kept in mouth, and muscle work. Brown (1994a) grouped subjects into “fast, slow,
energetic/inefficient, and normal eaters” based on differences in chew rate, total chew
time and muscle work, and concluded that chewing behavior is responsible for variability
in texture and flavor perception. Similarly, my experiment suggests that the underlying
differences in chocolate eating behavior is the chew rate and average chew time of chews
1-5. In the regressions for both bitterness and mouth coating versus the sEMG
parameters, chew rate was significant across all chocolate samples. In the regressions for
both hardness and satisfaction versus the EMG parameters, average chew time of chews
1-5 was significant across all chocolate samples. This data adds to the conclusion that
different chewing behavior causes different flavor and texture perception, and warrants
future experimental investigation to find the causal relationships between food texture,
preference, and eating behavior.
de Lavergne (2015) grouped subjects into fast and slow eaters, and found that
both groups had similar textural perceptions in the beginning, but different towards the
end of mastication. Future experiments may provide a taste evaluation before and after
consuming the chocolate sample in order to better understand this relationship between
chewing behavior, flavor perception, and preference. Also, the blind tasting of chocolate
could be conducted in order to reduce prior preferences. The impact of eating behavior on
sensory perception and preference warrants further study on other food products with

19
different textural attributes. Different methods to examine swallowing parameters might
be explored as well. One objective of this experiment was to test both chewing and
swallowing parameters in order to determine the underlying differences in individual
mastication. However, the EGG equipment did not consistently provide the needed
information, so the red push button determined the time at last swallow only.
Furthermore, the impact of satisfaction on eating behavior should be further studied in
order to determine its benefits and possible effects on health and food intake levels.

20
LIST OF REFERENCES
Afoakwa, E.O., Paterson, A., Fowler, M. (2007). Factors influencing rheological and
textural qualities in chocolate—a review. Trends in Food Science & Technology
18, 290-298.
Brown, W.E. (1994). Method to investigate differences in chewing behavior in humans. I.
Use of electromyography in measuring chewing. J. Texture Studies 25, 1-16.
Brown, W. E., Braxton, D. (2000). Dynamics of Food Breakdown during Eating in
Relation to Perceptions of Texture and Preference: A Study on Biscuits. Food
Quality and Preference 11, 259-67.
Brown, W. E., Dauchel, C., Wakeling, I. (1996). Influence of Chewing Efficiency on
Texture and Flavour Perceptions of Food. J. Texture Studies 27, 433-450.
Brown, W.E., Langley, K., Martin, A., MacFie, H.J.H. (1994a). Characterisation of
patterns of chewing behavior in human subjects and their influence on texture
perception. J.Texture Studies 25, 455-468.
Brown, W.E., Shearn, M., MacFie, H.J.H. (1994b). Method to investigate differences in
chewing behavior in humans: II. Use of electromyography during chewing to
assess chewing behavior. J. Texture Studies 25, 17-31.
Carvalho-Da-Silva, A.M., Damme, I.V., Wolf, B., Hort, J. (2011). Characterisation of
Chocolate Eating Behaviour. Physiology & Behavior 104.5, 929-33.
Carvalho-Da-Silva, A.M., Damme, I.V., Taylor, W., Hort, J., Wolf, B. (2013). Oral
processing of two milk chocolate samples. Food Function 4, 461-469.

21
Chang, H., Chen, H. (2013). Association between textural profiles and surface
electromyographic (sEMG) behaviors of microwavable cassava cuttlefish
crackers with various expansion ratios. Food Research International 53, 334-341.
de Lavergne, D., Derks, J.A.M., Ketel, E.C., de Wijk, R.A., Stieger, M. (2015). Eating
behavior explains differences between individuals in dynamic texture perception
of sausages. Food Quality and Preference 41, 189-200.
Harwood, M., Ziegler, G.R., Hayes, J.E. (2012). Rejection threshold in solid chocolate-
flavored compound coating. Journal of Food Science 77, 390-393.
Higginbotham, E., Taub, P.R. (2015). Cardiovascular benefits of dark chocolate?. Curr
Treat Options Cardio Med 17, 1-12.
Horio, T., Kawamura, Y. (1989). Effects of texture of food on chewing patterns in the
human subject. Journal of Oral Rehabilitation 16, 177-183.
Hort, J., Blissett, A., Taylor, A.J. (2006). Influence of chewing and swallowing behavior
on volatile release in two confectionary systems. J. Texture Studies 37, 476-496.
Iguchi, H., Magara, J., Nakamura, Y., Tsujimura, T., Ito, K., Inoue, M. (2015). Changes
in jaw muscle activity and the physical properties of foods with different textures
during chewing behaviors. Physiology & Behavior 152, 217-224.
Nasser, J.A., Bradley, L.E., Leitzsch, J., Chohan, O., Fasulo, K., Haller, J., Jaeger, K.,
Szulanczyk, B., Del Parigi, A. (2011). Psychoactive Effects of Tasting Chocolate
and Desire for More Chocolate." Physiology & Behavior 104.1, 117-21.
Siegal, S., & Castellan, N. 1988. Nonparametric Stastistics for the Behavioral Sciences,
2nd ed. New York: McGraw-Hill, Inc.

22
U.S. Food and Drug Administration. CPG Sec. 515.800 Labeling of Products Purporting
to Be "Chocolate" or "Chocolate Flavored.” 13 May 1988. Web.

23
Table 1: Chocolate ingredient composition for each chocolate sample in descending
order of quantity.
Milk Chocolate
(Lindt and
Sprüngli)
Dark Chocolate
(Lindt and
Sprüngli, 90%
cocoa)
White Chocolate
(Lindt and
Sprüngli)
Milk Chocolate
(R.M. Palmer
Company)
Sugar
Cocoa butter
Milk
Chocolate
Skim milk
Soya lecithin
Barley malt powder
Artificial flavor
Chocolate
Cocoa powder
Cocoa butter
Sugar
Bourbon vanilla
beans
Sugar
Cocoa butter
Milk
Skim milk
Soya lecithin
Artificial flavor
Sugar
Partially
hydrogenated
vegetable oil
Whey
Cocoa
Lactose
Skim milk
Soy lecithin
Vanillin

24
Table 2: Regression analyses of ranked bitterness vs. mastication parameter by chocolate
type. Significant r2 values (p0.05) are shown in bold. Asterisks indicate less variance
about the best fit line (r2>0.3).
Gourmet Milk
Chocolate
(n=10)
Gourmet Dark
Chocolate
(n=10)
Gourmet
White
Chocolate
(n=10)
Novelty
Milk
Chocolate
(n=10)
Average masseter
force, chews 1-5
(mV)
0.2211
0.0380 0.0086
0.2191
Average chew
time, chews 1-5
(s/chew)
0.0375
0.0469
0.00098
0.0313
% max masseter
force, chews 1-5
(mV)
0.0813
0.0523
0.0017
0.3397**
% max masseter
chew force, entire
trial (mV)
0.1165 0.0010 0.0032 0.2808**
Max masseter
chew time (s)
0.0296 6.5921E-07 0.0010 0.0495
% max hyoid,
entire trial (mV)
0.5755 0.0113 0.3948** 0.2792
Max hyoid chew
time (s)
0.0058 0.0413 0.0267 0.0004
Time at last
swallow (s)
0.0525 0.0258 0.0069 0.0799
Total chews 0.0077 0.1293 0.0007 0.0793
Total chewing
time (s)
0.0621 0.0222 0.0082 0.0850
Chew rate/s 0.0047 0.0755 0.0348 0.0095

25
Table 3: Regression analyses of ranked hardness vs. mastication parameter by chocolate
type. Significant r2 values (p0.05) are shown in bold. Asterisks indicate less variance
about the best fit line (r2>0.3).
Gourmet Milk
Chocolate
(n=10)
Gourmet Dark
Chocolate
(n=10)
Gourmet White
Chocolate
(n=10)
Novelty Milk
Chocolate
(n=10)
Average
masseter force,
chews 1-5
(mV)
0.0012
0.5819**
0.0139 0.1329
Average chew
time, chews 1-
5 (s/chew)
0.0775
0.1976
0.1150
0.2788**
% max
masseter force,
chews 1-5
(mV)
0.0078
0.3205
0.2233
0.1744
% max
masseter chew
force, entire
trial
1.8057E-06 0.1476 0.1711 0.0061
Max masseter
chew time (s)
0.2630**
0.1617 0.2872 0.0630
% max hyoid,
entire trial
(mV)
0.2477 0.0152 0.0926 0.2183
Max hyoid
chew time (s)
0.0357 0.4821** 0.2257 0.0854
Time at last
swallow (s)
0.0201 0.0050 0.0327 0.1929
Total chews 0.0312 0.1098 0 0.1073
Total chewing
time (s)
0.0108 0.0284 0.0402 0.1780
Chew rate/s 0.2270 0.6162 0.1357 0.0325

26
Table 4: Regression analyses of ranked mouth coating vs. mastication parameter by
chocolate type. Significant r2 values (p0.05) are shown in bold. Asterisks indicate less
variance about the best fit line (r2>0.3).
Gourmet Milk
Chocolate
(n=10)
Gourmet Dark
Chocolate
(n=10)
Gourmet White
Chocolate
(n=10)
Novelty Milk
Chocolate
(n=10)
Average
masseter force,
chews 1-5
(mV)
0.0592
0.0355
0.6200**
0.0480
Average chew
time, chews 1-
5 (s/chew)
0.0893
0.0069
0.2741**
0.1189
% max
masseter force,
chews 1-5
(mV)
0.1310
0.0901
0.0827
0.1195
% max
masseter chew
force, entire
trial (mV)
0.0102
0.0006
0.0252
0.1338
Max masseter
chew time (s)
0.0670
0.0388
0.0004
0.0442
% max hyoid,
entire trial
(mV)
0.1463
0.1073
0.1139
0.0614
Max hyoid
chew time (s)
0.0304
0.0207
0.0001
0.0410
Time at last
swallow (s)
0.2872
0.1062
0.0060
0.0231
Total chews 0.0503
0.0095
0.0128
0.0235
Total chewing
time (s)
0.2812
0.0176
0.0001
0.0321
Chew rate/s 0.1883
0.0046
0.0328
0.0107

27
Table 5: Regression analyses of ranked satisfaction vs. mastication parameter by
chocolate type. Significant r2 values (p0.05) are shown in bold. Asterisks indicate less
variance about the best fit line (r2>0.3).
Gourmet Milk
Chocolate
(n=10)
Gourmet Dark
Chocolate
(n=10)
Gourmet White
Chocolate
(n=10)
Novelty Milk
Chocolate
(n=10)
Average
masseter force,
chews 1-5
(mV)
0.1882
0.0390
0.0545
0.4441
Average chew
time, chews 1-
5 (s/chew)
0.0003
0.3428**
0.0106
0.0096
% max
masseter force,
chews 1-5
(mV)
0.0097
0.0003
0.1691
0.2748
% max
masseter chew
force, entire
trial (mV)
0.0041
0.0550
0.0721
0.2596**
Max masseter
chew time (s)
0.0503
0.4798
0.0711
0.1925
% max hyoid
force, entire
trial (mV)
0.0884
0.2555**
0.2880**
0.1141
Max hyoid
chew time (s)
0.2246
0.2030
0.0805
0.0011
Time at last
swallow (s)
0.1314
0.0729
0.0576
0.3476**
Total chews 0.0698
0.0084
0.1319
0.3436**
Total chewing
time (s)
0.1222
0.1254
0.0243
0.3210**
Chew rate/s 0.0252
0.2150
0.0430
0.2505**
28
sEMG masseter muscle electrodes
sEMG hyoid muscle electrodes
sEMG shoulder ground electrode
EGG ‘Adam’s Apple’ electrodes
EGG shoulder ground electrode
Figure 1: Electroglottography and surface electromyography electrode placement on the
subject for chewing and swallowing parameter recordings.

29
Figure 2: Average of student rankings of chocolate characteristics rated on a scale of 1-5
(1=low characteristic perception, 5= high characteristic perception) for each chocolate
sample tested. Error bars represent one standard deviation from the mean.
0
1
2
3
4
5
6
Bitterness Hardness Mouth coating Satisfaction
Ran
kin
g
Chocolate Characteristic
Gourmet Milk Chocolate
Gourmet Dark Chocolate (90%cocoa)
Gourmet White Chocolat
Novelty Milk Chocolate

30
Figure 3: Average sEMG recordings for mastication force parameters for all chocolate
samples. The gourmet white chocolate error bar (SD=4.12) was removed because it was
obscuring visual relationships among groups.
0
0.5
1
1.5
2
2.5
Average Masseter ForceChews 1-5
% Max Masseter ChewForce (chews 1-5)
% Max Masseter ChewForce (entire trial)
% Max Hyoid Chew Force(entire trial)
sEM
G M
easu
rem
ents
(m
V)
Mastication Parameters
Gourmet Milk Chocolate
Gourmet Dark Chocolate (90%cocoa)
Gourmet White Chocolate
Novelty Milk Chocolate
31
Figure 4: Average sEMG recordings for chewing time, count, and rate for all chocolate
samples.
0
10
20
30
40
50
60
Average Chew Time(chews 1-5) (chews/s)
Total Chews Total Chewing Time (s) Chew Rate/s
sEM
G M
easu
rem
ents
Mastication Parameters
Gourmet Milk Chocolate
Gourmet Dark Chocolate (90%cocoa)
Gourmet White Chocolate
Novelty Milk Chocolate

32
Figure 5: The regression analysis of % max masseter force chews 1-5 vs. bitterness
ranking for novelty milk chocolate with a significant, high r2 value.
y = -0.3253x + 2.0376
0
0.5
1
1.5
2
2.5
0 1 2 3 4 5
% M
ax M
asse
ter
Forc
e C
hew
s 1
-5 (
mV
)
Bitterness Ranking

33
Figure 6: The regression analysis of the average masseter force chews 1-5 vs. hardness
ranking of gourmet dark chocolate with the highest, significant r2 value.
y = -0.0729x + 0.4187
0
0.05
0.1
0.15
0.2
0.25
0.3
0.35
0.4
0.45
0 1 2 3 4 5
Ave
rage
Mas
sete
r Fo
rce
Ch
ews
1-5
(m
V)
Hardness Ranking

34
Figure 7: The regression analysis of average masseter chew force chews 1-5 vs. mouth
coating ranking of gourmet white chocolate with the highest, significant r2 value.
y = -0.0114x + 0.0959
0
0.02
0.04
0.06
0.08
0.1
0.12
0 1 2 3 4 5
Ave
rage
Mas
sete
r Fo
rce
Ch
ews
1-5
(m
V)
Mouth coating Ranking

35
Figure 8: The regression analysis of time at last swallow vs. satisfaction ranking of
novelty milk chocolate with the highest, significant r2 value.
y = -5.235x + 39.719
0
5
10
15
20
25
30
35
40
0 1 2 3 4 5
Tim
e at
Las
t Sw
allo
w (
s)
Satisfaction Ranking

36
APPENDIX A
Taste Test Evaluation of Chocolate Samples
Chocolate Sample: A
Rate the degree of bitterness experienced during consumption on a scale from 1 to 5
(1=low degree of bitterness, 5=high degree of bitterness).
1 2 3 4 5
Rate the degree of hardness at first bite on a scale from 1 to 5 (1=low degree of hardness
(low force used), 5=high degree of hardness (high force used)).
1 2 3 4 5
Rate the degree of mouth coating experienced after swallowing on a scale from 1 to 5 (1=
low degree of mouth coating, 5= high degree of mouth coating).
1 2 3 4 5
Rate the degree of satisfaction experienced during consumption on a scale from 1 to 5
(1=low satisfaction, 5=high satisfaction).
1 2 3 4 5

37
APPENDIX A continued
Taste Test Evaluation of Chocolate Samples
Chocolate Sample: B
Rate the degree of bitterness experienced during consumption on a scale from 1 to 5
(1=low degree of bitterness, 5=high degree of bitterness).
1 2 3 4 5
Rate the degree of hardness at first bite on a scale from 1 to 5 (1=low degree of hardness
(low force used), 5=high degree of hardness (high force used)).
1 2 3 4 5
Rate the degree of mouth coating experienced after swallowing on a scale from 1 to 5 (1=
low degree of mouth coating, 5= high degree of mouth coating).
1 2 3 4 5
Rate the degree of satisfaction experienced during consumption on a scale from 1 to 5
(1=low satisfaction, 5=high satisfaction).
1 2 3 4 5

38
APPENDIX A continued
Taste Test Evaluation of Chocolate Samples
Chocolate Sample: C
Rate the degree of bitterness experienced during consumption on a scale from 1 to 5
(1=low degree of bitterness, 5=high degree of bitterness).
1 2 3 4 5
Rate the degree of hardness at first bite on a scale from 1 to 5 (1=low degree of hardness
(low force used), 5=high degree of hardness (high force used)).
1 2 3 4 5
Rate the degree of mouth coating experienced after swallowing on a scale from 1 to 5 (1=
low degree of mouth coating, 5= high degree of mouth coating).
1 2 3 4 5
Rate the degree of satisfaction experienced during consumption on a scale from 1 to 5
(1=low satisfaction, 5=high satisfaction).
1 2 3 4 5
39
APPENDIX A continued
Taste Test Evaluation of Chocolate Samples
Chocolate Sample: D
Rate the degree of bitterness experienced during consumption on a scale from 1 to 5
(1=low degree of bitterness, 5=high degree of bitterness).
1 2 3 4 5
Rate the degree of hardness at first bite on a scale from 1 to 5 (1=low degree of hardness
(low force used), 5=high degree of hardness (high force used)).
1 2 3 4 5
Rate the degree of mouth coating experienced after swallowing on a scale from 1 to 5 (1=
low degree of mouth coating, 5= high degree of mouth coating).
1 2 3 4 5
Rate the degree of satisfaction experienced during consumption on a scale from 1 to 5
(1=low satisfaction, 5=high satisfaction).
1 2 3 4 5

40
APPENDIX A continued
Taste Test Evaluation of Chocolate Samples
Rank the chocolate samples in order of preference (1=highly preferred, 4=least
preferred).
A ______________
B ______________
C ______________
D ______________