
EXAMINATION OF A BANDED, HEAVY SNOWFALL EVENT ASSOCIATED WITH A TROWAL: 10 November 1998 Marc J....
39
EXAMINATION OF A BANDED, HEAVY SNOWFALL EVENT ASSOCIATED WITH A TROWAL: 10 November 1998 Marc J. Singer, James T. Moore, and Charles E. Graves Department of Earth and Atmospheric Sciences Saint Louis University COMET Hydromet RFC Course 27 November – 4 December 2001
-
Upload
marylou-briggs -
Category
Documents
-
view
216 -
download
3
Transcript of EXAMINATION OF A BANDED, HEAVY SNOWFALL EVENT ASSOCIATED WITH A TROWAL: 10 November 1998 Marc J....

EXAMINATION OF A BANDED, HEAVY SNOWFALL EVENT
ASSOCIATED WITH A TROWAL: 10 November 1998
Marc J. Singer, James T. Moore, and Charles E. Graves
Department of Earth and Atmospheric Sciences
Saint Louis University
COMET Hydromet RFC Course
27 November – 4 December 2001

The meteorological features examined in this case study
were chosen by
“trowal and air”

Research Objective
•The primary goal of this research is to investigate banded regions of heavy convective snowfall and their relationship to the trowal.
•Three different cases were examined to illustrate some of the differences between the mechanisms that play a vital role in creating convective regions of heavy snowfall:
• 9 March 1998 (Northern IL)
• 10 November 1998 (Eastern SD)
• 5 December 1999 (Eastern KS)

Methodology
•In order to diagnose the trowal and other characteristics of these systems, we used the following tools:
•GOES-8 Infrared and Water Vapor Satellite Imagery
•WSR-88D Doppler Radar
•Surface and Upper-Air Data (SLU Archives)
•Rapid Update Cycle (RUC) 2 Model Initialization Data
•Surface and Upper-Air data were displayed using the SLUBREW weather analysis package, while the GEMPAK Software Package was used to analyze the RUC 2 data

TROWAL
•The TROugh of Warm air ALoft (TROWAL) is defined as the 3-D sloping intersection of the upper cold frontal portion of the warm occlusion with the warm frontal zone (Martin, 1999).
•The trowal can be identified by examining mid-level theta-e. The exact location of the trowal is along the ridge of high theta-e values.
•By performing a cross-sectional analysis of theta-e, the trowal can be more easily identified as a sloping canyon of high theta-e air (Martin, 1999).
•Air parcels in the atmosphere follow certain trajectories through the trowal airstream which play a significant role in sensible surface precipitation events.

Conceptual Model of a TROWAL Associated With a Warm-Type Occlusion
From Martin (1999)

Conceptual Model of a TROWAL Associated With a Cold-Type Occlusion

Nicosia and Grumm Model for EPV Reduction Near Extratropical Cyclones
Nicosia et. al (1999) proposed a conceptual model in which a zone of EPV reduction in concert with an area of mid-level frontogenesis will aid in the prediction of mesoscale bands of snow.

Case Study: 9-10 November 1998

Introduction
•During the two-day span of 9-10 November 1998, a major extratropical cyclone moved from north-central Nebraska into southern Minnesota.
•This storm system eventually became occluded and was associated with a trowal structure.
•The trowal structure was located east of a narrow band of heavy snow at the surface which reached peak intensity around 1500 UTC 10 November 1998.
•This convective band of thundersnow, which lasted for nearly 5 hours, was located to the northwest of the surface low, and produced nearly 13 inches of snow in parts of east-central South Dakota.

Snowfall Isohyet Analysis Valid 10 November 1998
Snowfall Data Courtesy of Phil Schumacher (SOO-WSFO KFSD)
6” or Greater

Surface Analysis Valid 0000 UTC 10 November 1998

850 mb Analysis Valid 0000 UTC 10 November 1998
L - Low Height Center
LLJ – > 50 kts
X - Maximum Theta-E Advection
0º C Isotherm

500 mb Analysis Valid 0000 UTC 10 November 1998
L - Low Height Center
Representative Height Line
Maximum Winds – > 80 kts
X – Vorticity Center
500 mb Trough

300 mb Analysis Valid 0000 UTC 10 November 1998
ULJ – > 130 kts
X – Maximum Divergence

Surface Analysis Valid 1200 UTC 10 November 1998

850 mb Analysis Valid 1200 UTC 10 November 1998
L - Low Height Center
LLJ
X - Maximum Theta-E Advection
0º C Isotherm

500 mb Analysis Valid 1200 UTC 10 November 1998
L - Low Height Center
Representative Height Line
Maximum Winds – > 80 kts
X – Vorticity Center
500 mb Trough

300 mb Analysis Valid 1200 UTC 10 November 1998
ULJ – > 130 kts
X – Maximum Divergence
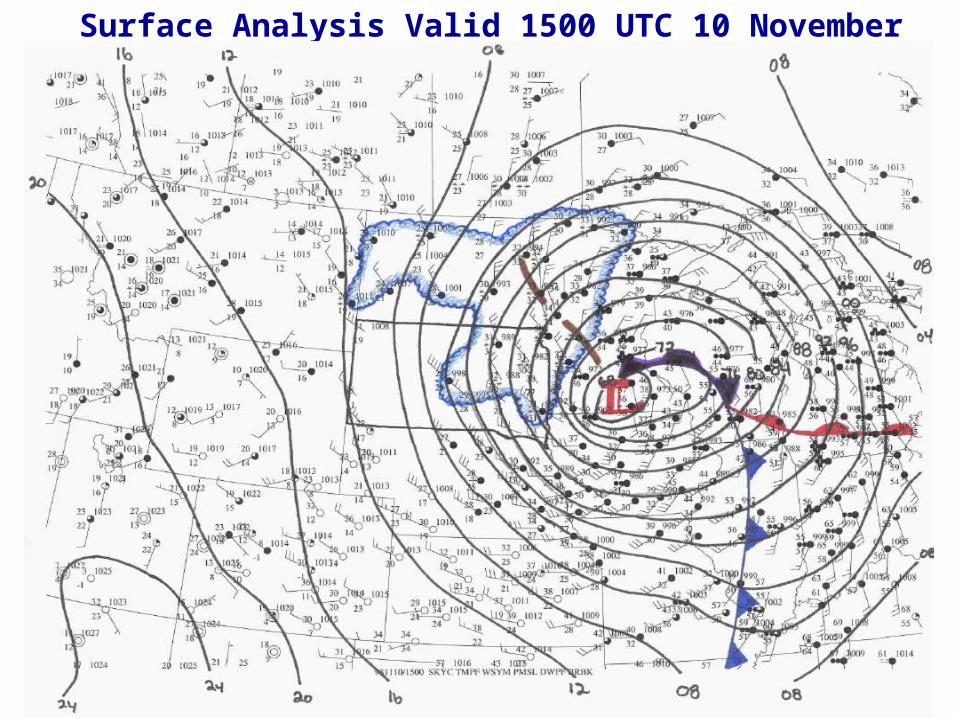
Surface Analysis Valid 1500 UTC 10 November 1998

Infrared Satellite Imagery Loop Valid 0315 UTC to 1715 UTC 10 November 1998

RUC 2 Initialization 650 mb Theta-E Valid 1500 UTC 10 November 1998

Cross-Section Taken Through the Trowal (Jamestown, ND – Peoria, IL)

RUC 2 Initialization Valid 1500 UTC 10 November 1998 Theta-E Cross-Section (JMS
– PIA)

Water Vapor Imagery Loop Valid 0315 UTC to 1715 UTC 10 November 1998

KFSD Reflectivity Loop Valid 1453 UTC to 1707 UTC 10 November 1998

RUC 2 Initialization Valid 1500 UTC 10 November 1998 1000-500 mb Thickness Cross-Section (Chadron, NE –
Lacrosse, WI)

Cross-Section Taken Through Reflectivity
A
B

KFSD Radar Cross-Section Loop Valid 1453 UTC to 1707 UTC 10 November 1998
BA

RUC 2 Initialization 800-600 mb Average Frontogenesis Valid 1200 10 November
1998

Theta-ES Cross-Section Valid 0000 UTC 10 November 1998

700 mb Horizontal EPVValid 0000 UTC 10 November 1998

3-D EPV Cross-SectionValid 0000 UTC 10 November 1998

RUC 2 Initialization Valid 1500 UTC 10 November 1998 Relative Humidity Cross-
Section (CDR - LSE)
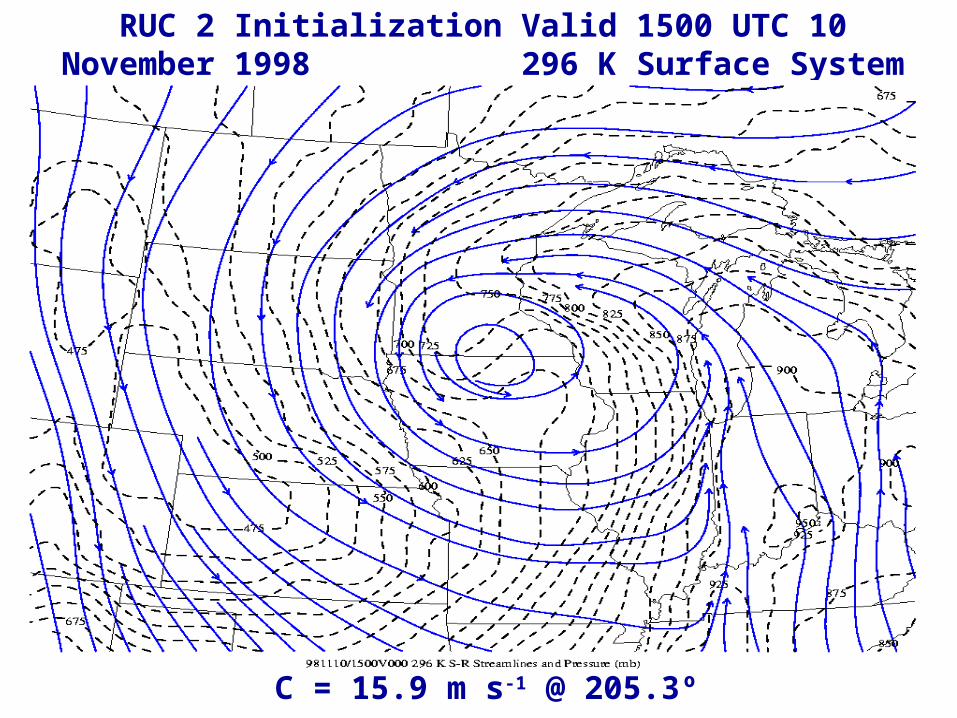
RUC 2 Initialization Valid 1500 UTC 10 November 1998 296 K Surface System –
Relative Streamlines and Pressure
C = 15.9 m s-1 @ 205.3º

RUC 2 Initialization Valid 1500 UTC 10 November 1998 296 K Surface System –
Relative Moisture Transport Vectors

Conclusions
•The heaviest snowfall within a narrow band of snow was co-located with the advection of high theta-e air at the 700 mb level. Further cross-sectional analysis shows that the thundersnow was associated with an elevated thunderstorm.
•Using the 1500 UTC RUC 2 Initialization, we were able to diagnose a trowal structure both in the horizontal and vertical by examining the theta-e profiles. The heaviest snowfall fell west of the trowal structure.
•A trowal associated with a cold-type occlusion was introduced.
•Mid-level frontogenetical forcing was present northwest of the surface low.

Conclusions (cont’d)
•In addition to locating a trowal structure, detailed radar analysis of the narrow band of snow at the surface indicated the type of convective activity that was taking place at the height of the heaviest snow. Cross-sectional radar analysis shows distinct slantwise ascent into the updraft of the storm. This slantwise ascent may be evidence that parcels are rising into the storm in both a inertially and convectively stable environment.
•Examination of theta-es and 3-D EPV cross-sections display a region of possible CSI taking place to the southeast of the heaviest snowfall.
•Mid-level zone of EPV reduction is located southeast of the heaviest snowfall, near the dry slot.

This presentation may be viewed on the CIPS website:
http://www.eas.slu.edu/CIPS/Presentations
Any questions or comments?
Email: [email protected]