
Ex-post Structured Product Returns: Index Methodology and Analysis
23
Ex-post Structured Product Returns: Index Methodology and Analysis Geng Deng, PhD, CFA, FRM * Tim Dulaney, PhD, FRM †, ‡ Tim Husson, PhD, FRM §, ‡ Craig McCann, PhD, CFA ¶ Mike Yan, PhD, FRM k August 20, 2014 Abstract The academic and practitioner literature now includes numerous studies of the substantial issue date mispricing of structured products but there is no large scale study of the ex- post returns earned by US structured product investors. This paper augments the current literature by analyzing the ex-post returns of over 20,000 individual structured products issued by 13 brokerage firms since 2007. We construct our structured product index and sub- indices for reverse convertibles, single-observation reverse convertibles, tracking securities, and autocallable securities by valuing each structured product in our database each day. The ex-post returns of US structured products are highly correlated with the returns of large capitalization equity markets in the aggregate but individual structured products generally underperform simple alternative allocations to stocks and bonds. The observed underperformance of structured products is consistent with the significant issue date under- pricing documented in the literature. * Director of Research, Securities Litigation and Consulting Group. † Financial Analyst, U.S. Securities and Exchange Commission, [email protected]. ‡ The Securities and Exchange Commission, as a matter of policy, disclaims responsibility for any private pub- lication or statement by any of its employees. The views expressed herein are those of the author and do not necessarily reflect the views of the Commission or of the author’s colleagues upon the staff of the Commission. § Financial Analyst, U.S. Securities and Exchange Commission, [email protected]. ¶ President, Securities Litigation and Consulting Group, (703) 539-6760 or Email: [email protected]. k Senior Financial Economist, Securities Litigation and Consulting Group, (703) 539-6780 or Email: [email protected]. 1
Transcript of Ex-post Structured Product Returns: Index Methodology and Analysis
Ex-post Structured Product Returns:Index Methodology and Analysis
Geng Deng, PhD, CFA, FRM∗ Tim Dulaney, PhD, FRM†,‡
Tim Husson, PhD, FRM§,‡ Craig McCann, PhD, CFA¶
Mike Yan, PhD, FRM‖
August 20, 2014
Abstract
The academic and practitioner literature now includes numerous studies of the substantialissue date mispricing of structured products but there is no large scale study of the ex-post returns earned by US structured product investors. This paper augments the currentliterature by analyzing the ex-post returns of over 20,000 individual structured productsissued by 13 brokerage firms since 2007. We construct our structured product index and sub-indices for reverse convertibles, single-observation reverse convertibles, tracking securities,and autocallable securities by valuing each structured product in our database each day.
The ex-post returns of US structured products are highly correlated with the returnsof large capitalization equity markets in the aggregate but individual structured productsgenerally underperform simple alternative allocations to stocks and bonds. The observedunderperformance of structured products is consistent with the significant issue date under-pricing documented in the literature.
∗Director of Research, Securities Litigation and Consulting Group.†Financial Analyst, U.S. Securities and Exchange Commission, [email protected].‡The Securities and Exchange Commission, as a matter of policy, disclaims responsibility for any private pub-
lication or statement by any of its employees. The views expressed herein are those of the author and do notnecessarily reflect the views of the Commission or of the author’s colleagues upon the staff of the Commission.§Financial Analyst, U.S. Securities and Exchange Commission, [email protected].¶President, Securities Litigation and Consulting Group, (703) 539-6760 or Email: [email protected].‖Senior Financial Economist, Securities Litigation and Consulting Group, (703) 539-6780 or Email:
1
c©2014 SLCG Ex-post Structured Product Returns . . .
1 Introduction
Structured products are senior unsecured debt securities with payouts that depend on the valueof one or more underlying assets. The underlying assets are can be individual stocks, baskets ofstocks, stock indexes, interest rates, commodities, or other calculated values. Structured productscan pay fixed coupon payments throughout their term or pay coupons contingent upon changes inthe level of the underlying asset/rate although some products pay no coupons at all. Structuredproducts have existed since the late 1980s, but issuance picked up in the mid 2000s. The issuanceof new structured products declined during the financial crisis but has since rebounded and over$40.5 billion in structured products were issued in the US in 2013.1
Structured products can be classified into several common types according to their payoutstructures. For example, reverse convertibles (also known as reverse exchangeables) are coupon-paying structured products which convert to shares of the stock if the stock price declines belowa specified barrier during the term of the notes. Reverse convertibles are the subject of muchacademic research. For example: Wilkens et al. (2003) found significant mispricing of reverseconvertibles that could be duplicated using options traded on the Eurex Exchange. Szymanowskaet al. (2009) studied reverse convertibles on the Amsterdam Stock Exchange between 1999 and2002 and confirmed significant mispricing in a model-free analysis.
Issuers can completely hedge common structured products by using combinations of options.If banks can issue structured products at prices above the cost of hedging the structured productand issuing a zero coupon bond, then structured products can be used to obtain access to cheapercapital. We showed in (Deng et al., 2009) that Lehman Brothers issuance of structured productsincreased dramatically as its credit risk increased during 2007 and 2008.
Doebeli and Vanini (2010) and Gennaiolita et al. (2012) have argued that investors do notfully understand the risks embedded in structured products, and that this misunderstanding couldwider market implications. Bethel and Ferrel (2007) discuss the policy issues related to structuredproducts with a focus on investor protection concerns.
Several published papers have valued large samples of structured products and found averageissue date values between 92 and 98 cents per dollar.2 Henderson and Pearson (2010) argued thatthe complexity of structured products allows brokerage firms to sell investors mispriced marketexposure and thus book an issue date profit. Bernard and Boyle (2011) drew similar conclusions forlocally-capped structured products and estimated the average initial mispricing of these productsat approximately 6.5%. This issue date mispricing can be interpreted as the present value of theextent to which the structured products expected future returns fall short of the returns requiredto compensate investors for the interest rate, credit and underlying market risks.
There currently is no large scale analysis of realized returns on US structured products to
1 (Bloomberg Structured Notes Brief)2 SLCG’s work includes valuations of absolute return barrier notes (Deng et al., 2011a), autocallables (Deng et al.,
2011b), reverse convertibles Deng et al. (2012a), and dual-directionals (Deng et al., 2013).
2

c©2014 SLCG Ex-post Structured Product Returns . . .
supplement the large and growing literature of ex-ante analyses.3 Such an analysis could helpinvestors understand how the widely documented issue date mispricing of structured productsaffects their likely realized returns.
To study the ex-post returns of structured products in the aggregate, we construct five indexesthat reference common types of structured products registered with the Securities and ExchangeCommission from January 2007 to January 2014. We value our sample of outstanding productson each day and aggregate the results across issuers and underlying assets.
This work builds on SLCG’s published research and is an extension of our structured productreports, which provide valuations and analysis of over 20,000 individual products.4 We comparethe returns of these indexes to several asset classes and find that across product types and marketconditions, structured products underperform alternative allocations to stocks and bonds. Theresults of our index analysis should cause investors and their advisers to avoid retail structuredproducts.
2 Index Methodology
In this section we describe our procedures for (a) collecting individual product data on our samplesof each product type, (b) valuing each product on a daily basis, and (c) aggregating the calculatedvalues into value-weighted indexes.
2.1 Sample of Products
The sample used for our paper consists of US dollar denominated structured products registeredwith the SEC.5 We have developed software to automatically search the SEC website for 424B2forms for several structured product issuers.6 From these forms we obtain the name of the issuer;the name of the product; the pricing, issue, maturity, and final observation dates; the amountissued; the underlying security (or securities) and initial value(s); any coupon payment dates andamounts, if applicable; and any barrier, trigger or other product-specific parameters.
We then gather the tickers of all of the underlying securities referenced by the structuredproducts in our sample and obtain prices/rates, dividend yields (if applicable), and option-implied
3 Bergstresser (2008) studied the performance of a large sample of structured products, but based their analysison pricing data. analysis differs from Bergstresser (2008) in that Bergstresser (2008) used price data to analyzereturns while we use valuation models due to limited secondary market trading.
4 Research reports available free of charge at slcg.com/securities-structured-products.php.5 Offering documents can be searched using the EDGAR system at www.sec.gov/edgar.shtml We use the sub-
scription service EDGAR Pro to search for and download filings (http://pro.edgar-online.com/). Finalstructured product offering documents are filed as form 424B2.
6 See Section 2.2.
3

c©2014 SLCG Ex-post Structured Product Returns . . .
volatilities.7 We also obtain US Treasury rates, USD swap rates, and credit default swap (CDS)rates for each issuer for all available terms on each day.
We apply our index methodology to four product types: reverse convertibles, single-observationreverse convertibles, tracking securities, and autocallable securities. We define each of these typesas:
• Reverse convertibles pay high periodic coupons regardless of the returns on the underlyingasset. The notes return principal at maturity if the market value of the underlying asset onfinal observation date exceeds the initial market value, or if on every date during the life ofthe note the closing value of the linked asset is not less than the barrier level (e.g., 80% ofthe initial market value). Otherwise the note is converted into shares of the asset and theinvestor suffers 1-to-1 losses with declines in the asset price. Reverse convertibles typicallyhave terms of three months to one year.8
• Single-observation reverse convertibles are a type of reverse convertible that pay theprincipal amount at maturity if the underlying asset price closed above the barrier level on thefinal valuation date regardless of the price history during the term of the notes. Otherwisethe notes are converted into shares of the referenced asset and the investor suffers 1-to-1losses with the asset.9
• Tracking securities are notes that do not pay coupons but whose payout at maturitydepends on the value of the underlying security, usually market indexes.10 These productsoften have leveraged upside, typically subject to a maximum return cap, and may include abuffer against losses within a range.11 “Principal-protected notes” belong to this categorysince their returns are completely buffered.12
7 We obtain several implied volatilities for each underlying, ranging from 6 month to 24 month volatilities. Wethen choose the volatility that best matches the term of each product.
8 See the reverse convertible note linked to Apple, Inc. (CUSIP: 617446Z44) issued by Morgan Stanley on December12, 2007 at www.sec.gov/Archives/edgar/data/895421/000095010307002969/dp07869_424b2-ps447.htm.
9 See the single-observation reverse convertible note linked to Ford Motor Company (CUSIP: 06740H526) issuedby Barclays on January 21, 2010 under the brand name “Yield Optimization Notes with Contingent Protection”at www.sec.gov/Archives/edgar/data/312070/000119312510008836/d424b2.htm.
10 Some tracking securities pay a small amount of interest compared to the rate paid in reverse convertible andsingle-observation reverse convertibles. Those coupon-paying tracking securities are not frequently issued, hencewe exclude those products for the index.
11 See the tracking security linked to the S&P 500 Index (CUSIP: 902661719) issued by UBS on January 26, 2010with the brand name “Return Optimization Securities with Partial Protection” at www.sec.gov/Archives/
edgar/data/1114446/000139340110000060/c172345_690437-424b2.htm.12 See the principal-protected note issued by JP Morgan under the brand name “Equity Index-Linked Notes”
(CUSIP: 48125XKS4) on March 30, 2011 at www.sec.gov/Archives/edgar/data/19617/000119312511080977/d424b2.htm.
4
c©2014 SLCG Ex-post Structured Product Returns . . .
• Autocallables have maturity payoffs that are similar to single-observation reverse convert-ible notes. Autocallables also include observation dates on which the notes can be calledprior to maturity if the underlying security closes below or above a trigger level (dependingon the type of autocallable). Autocallable securities pay coupons and typically have a termlonger than either type of reverse convertible discussed above. If the note is called, principaland unpaid coupons are paid to the investor (limiting further coupon payments).13
2.2 Data Description
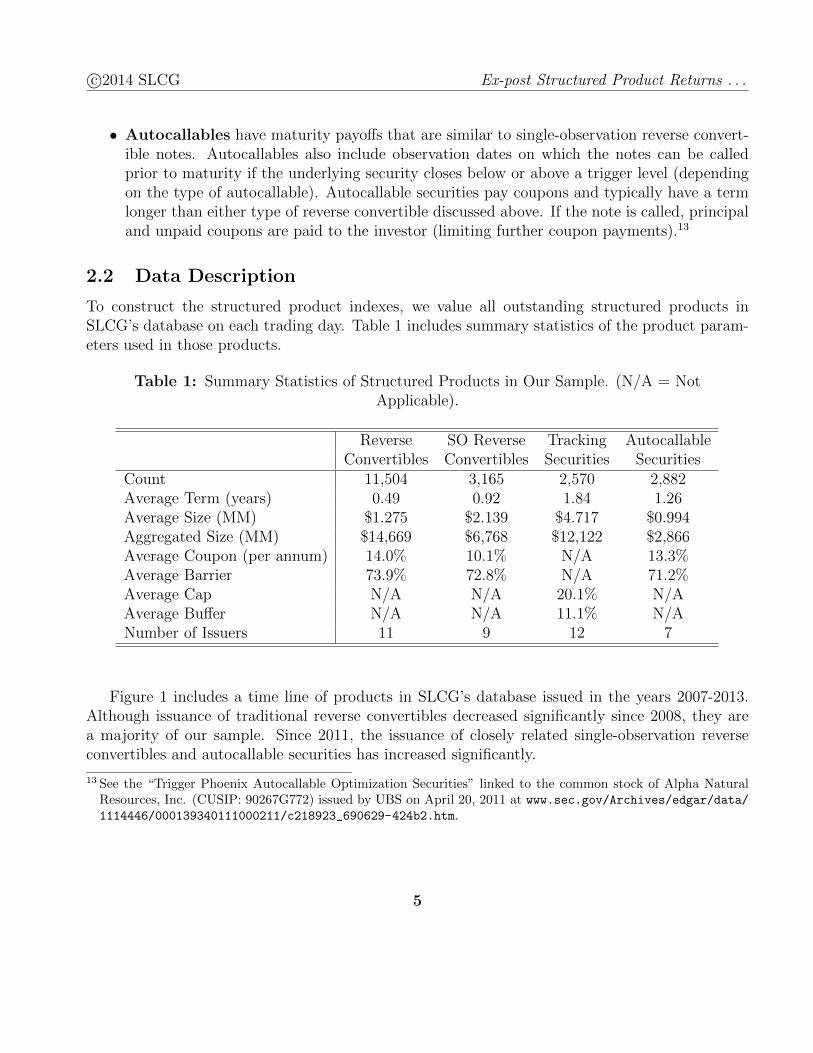
To construct the structured product indexes, we value all outstanding structured products inSLCG’s database on each trading day. Table 1 includes summary statistics of the product param-eters used in those products.
Table 1: Summary Statistics of Structured Products in Our Sample. (N/A = NotApplicable).
Reverse SO Reverse Tracking AutocallableConvertibles Convertibles Securities Securities
Count 11,504 3,165 2,570 2,882Average Term (years) 0.49 0.92 1.84 1.26Average Size (MM) $1.275 $2.139 $4.717 $0.994Aggregated Size (MM) $14,669 $6,768 $12,122 $2,866Average Coupon (per annum) 14.0% 10.1% N/A 13.3%Average Barrier 73.9% 72.8% N/A 71.2%Average Cap N/A N/A 20.1% N/AAverage Buffer N/A N/A 11.1% N/ANumber of Issuers 11 9 12 7
Figure 1 includes a time line of products in SLCG’s database issued in the years 2007-2013.Although issuance of traditional reverse convertibles decreased significantly since 2008, they area majority of our sample. Since 2011, the issuance of closely related single-observation reverseconvertibles and autocallable securities has increased significantly.
13 See the “Trigger Phoenix Autocallable Optimization Securities” linked to the common stock of Alpha NaturalResources, Inc. (CUSIP: 90267G772) issued by UBS on April 20, 2011 at www.sec.gov/Archives/edgar/data/1114446/000139340111000211/c218923_690629-424b2.htm.
5

c©2014 SLCG Ex-post Structured Product Returns . . .
Figure 1: Structured Product Sample by Year Issued
0
1,000
2,000
3,000
4,000
5,000
2007 2008 2009 2010 2011 2012 2013
Reverse Convertibles SO Reverse Convertibles
Tracking Securities Autocallables
Figure 2 illustrates the distribution of products in our sample by issuer. Barclays, UBS, RoyalBank of Canada and JP Morgan issued the great majority of the products in our sample. AlthoughGoldman Sachs issued a relatively small number of products (2% of our sample), the aggregateface value of the Goldman notes is nearly 12% of our sample.
Figure 2: Structured Product Sample by Issuer
0% 10% 20% 30% 40%
Bank of America
Citigroup
Credit Suisse
Deutsche Bank
Morgan Stanley
Goldman Sachs
Lehman Brothers
HSBC
Bank of Montreal
JP Morgan
RBC
UBS
Barclays
Number Issued (% of Sample)
Aggregate Face Value (% of Sample)
6

c©2014 SLCG Ex-post Structured Product Returns . . .
2.3 Valuation
We value each product based on the product specific information we have gathered and market dataon volatilities, dividend yields, interest rates, etc., for each underlying security on each valuationdate reflecting then-current market conditions. We value each product over its entire term (theperiod between its issue date and its final maturity date). We include the effects of credit risk onthe value of each note by augmenting the discount rate used for present value calculations with thecredit default swap rate of the issuer.14 We provide a more detailed description of our valuationmethodology in (Deng et al., 2012b).
Our approach to valuing a structured product depends on the structured product type.15 Sim-ple closed-form solutions exist for reverse convertibles, single-observation reverse convertibles andtracking securities which allow for relatively quick and computationally efficient valuations. Auto-callables, however, are less amenable to closed-form solutions and require Monte Carlo simulations.
2.3.1 Reverse Convertibles
Reverse convertible notes can be valued as a combination of a zero coupon bond from the issuer,a short, down-and-in, at-the-money put option on the underlying asset, and a series of couponpayments. Investors purchasing reverse convertibles effectively sell put options to the issuer andpost the notes issue price as collateral to secure satisfaction of the investors obligations under theoption contracts. The issuer pays investors a coupon that is higher than the issuer pays on itsstraight debt as compensation for the put options and interest on the investors’ posted collateral.
Following (Hernandez et al., 2007) and (Deng et al., 2012a), we write the value of the reverseconvertibles as
V = PVZero Coupon Bond + PVCoupons − PVDown-in-put Option.
2.3.2 SO Reverse Convertibles
Likewise, the value of a single-observation reverse convertible can be written as a zero couponbond, a series of coupon payments and a short European put option
V = PVZero Coupon Bond + PVCoupons − PVEuropean Put Option.
Both of these expressions are based on the intuition that the payoffs from a structured productcan be replicated by a combination of option contracts.
14 To include the effect of the Lehman Brothers Bankruptcy, we changed the market value of all outstanding LehmanBrothers structured products to zero following the filing of bankruptcy on September 15, 2008. The market valueof these products remains zero through expiration. Valuing the Lehman structured products at $0.10 per dollarafter the bankruptcy does not materially change any of our results.
15 (Deng et al., 2012b)
7

c©2014 SLCG Ex-post Structured Product Returns . . .
2.3.3 Tracking Securities
Principal-protected notes are the simplest to value, because their payoffs can be replicated by just(1) a zero-coupon bond issued by the bank, and (2) a European call option on the underlyingsecurity. The value of a principal-protected note is therefore:
V = PVZero Coupon Bond + PVEuropean Call Option.
Buffered and capped tracking securities can be replicated by a combination of options thatincludes a zero coupon bond, a short put that is out-of-the-money by the buffer amount (if any),long at-the-money call options for any leveraged upside L, and short out-of-the-money call optionsif returns are capped. This replication leads to the following expression:
V = PVZero Coupon Bond − PVOTM European Put Option
+ L(PVATM European Call Option − PVOTM European Call Option
).
2.3.4 Autocallables
Valuing autocallable structured products using the option decomposition method is complex be-cause their periodic coupon payments are path-dependent and do not have predefined maturitydates. Instead, we adopt a Monte Carlo simulation-based method, which uses market data tosimulate many possible paths of the underlying asset and value the resulting payoffs of the notefor each path.16 Those payoffs are then discounted to present value using a discount factor thatreflects both the current risk-free interest rate and the credit risk of the issuer (as reflected in itscredit default swap rate).
2.4 Index Construction
The fair value of each structured product is calculated using market data, including stock price,implied volatility, the issuers CDS rate, and market interest rates at the end of each businessday. The fair value includes the present value of all future cash flows from the product, includingscheduled or contingent coupon payments, but excludes any coupons paid before and on day t.The fair value of each structured note at time t (Vt,i) equals its market value if there was a liquidsecondary market. The total return of the structured product Rt,i is calculated based on the fairvalues at day t and (t− 1). If no coupons are paid on date t, the total return is
Rt,i = Vt,i/Vt−1,i − 1. (1)
16 Our approach follows closely the methods described in (Glasserman, 2003). We here use 10,000 simulations foreach valuation.
8
c©2014 SLCG Ex-post Structured Product Returns . . .
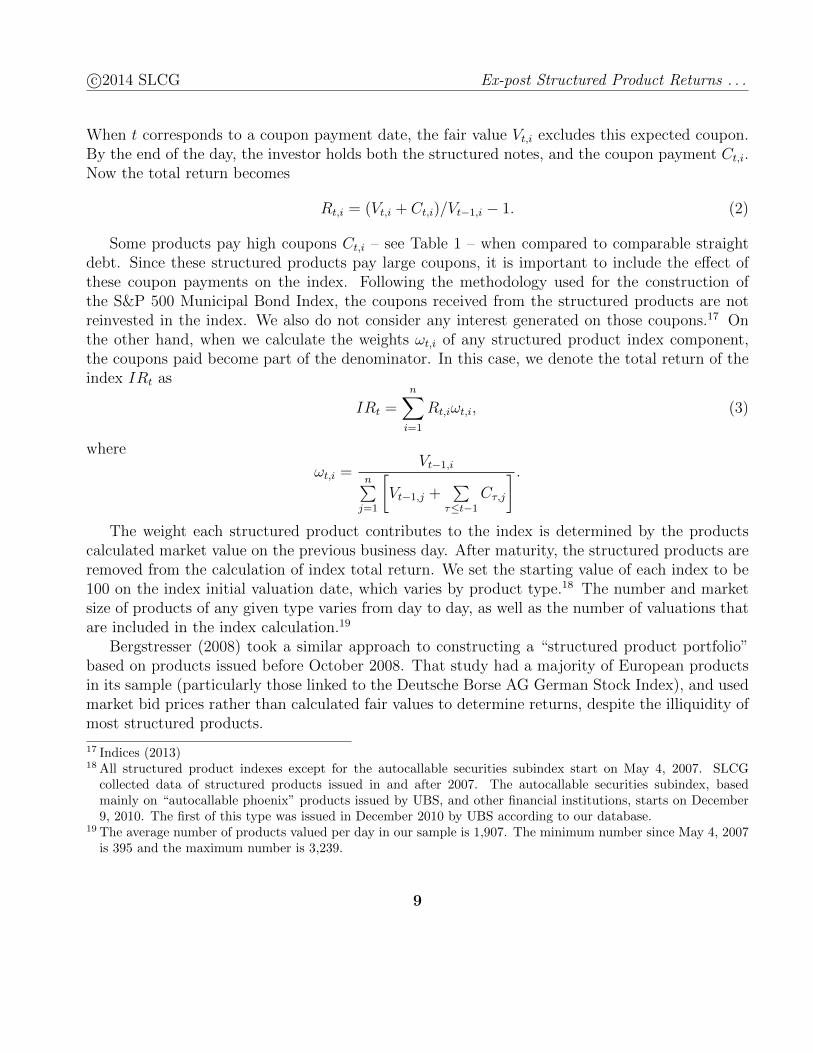
When t corresponds to a coupon payment date, the fair value Vt,i excludes this expected coupon.By the end of the day, the investor holds both the structured notes, and the coupon payment Ct,i.Now the total return becomes
Rt,i = (Vt,i + Ct,i)/Vt−1,i − 1. (2)
Some products pay high coupons Ct,i – see Table 1 – when compared to comparable straightdebt. Since these structured products pay large coupons, it is important to include the effect ofthese coupon payments on the index. Following the methodology used for the construction ofthe S&P 500 Municipal Bond Index, the coupons received from the structured products are notreinvested in the index. We also do not consider any interest generated on those coupons.17 Onthe other hand, when we calculate the weights ωt,i of any structured product index component,the coupons paid become part of the denominator. In this case, we denote the total return of theindex IRt as
IRt =n∑i=1
Rt,iωt,i, (3)
where
ωt,i =Vt−1,i
n∑j=1
[Vt−1,j +
∑τ≤t−1
Cτ,j
] .The weight each structured product contributes to the index is determined by the products
calculated market value on the previous business day. After maturity, the structured products areremoved from the calculation of index total return. We set the starting value of each index to be100 on the index initial valuation date, which varies by product type.18 The number and marketsize of products of any given type varies from day to day, as well as the number of valuations thatare included in the index calculation.19
Bergstresser (2008) took a similar approach to constructing a “structured product portfolio”based on products issued before October 2008. That study had a majority of European productsin its sample (particularly those linked to the Deutsche Borse AG German Stock Index), and usedmarket bid prices rather than calculated fair values to determine returns, despite the illiquidity ofmost structured products.
17 Indices (2013)18 All structured product indexes except for the autocallable securities subindex start on May 4, 2007. SLCG
collected data of structured products issued in and after 2007. The autocallable securities subindex, basedmainly on “autocallable phoenix” products issued by UBS, and other financial institutions, starts on December9, 2010. The first of this type was issued in December 2010 by UBS according to our database.
19 The average number of products valued per day in our sample is 1,907. The minimum number since May 4, 2007is 395 and the maximum number is 3,239.
9

c©2014 SLCG Ex-post Structured Product Returns . . .
3 Analysis
We plot the structured product index values over time in Figure 3. We also overlay the S&P 500Total Return Index and the Barclays Aggregate Bond Total Return Index values for comparison.20
Figure 3: SLCG Aggregate Structured Product Index(Dotted-Line is the scaled S&P 500 Total Return Index, Dashed-Line is the scaled
Barclays Aggregate Bond Total Return Index)
0
50
100
150
200
Bonds
Stocks
SP Index
Changes in the structured product index levels are highly correlated with changes in the S&P500 Total Return Index. During the market downturn 2008, structured product values trackedthe S&P 500 closely. Since early 2009, the returns to structured products have been positive butsubstantially less than the returns to large capitalization stocks.
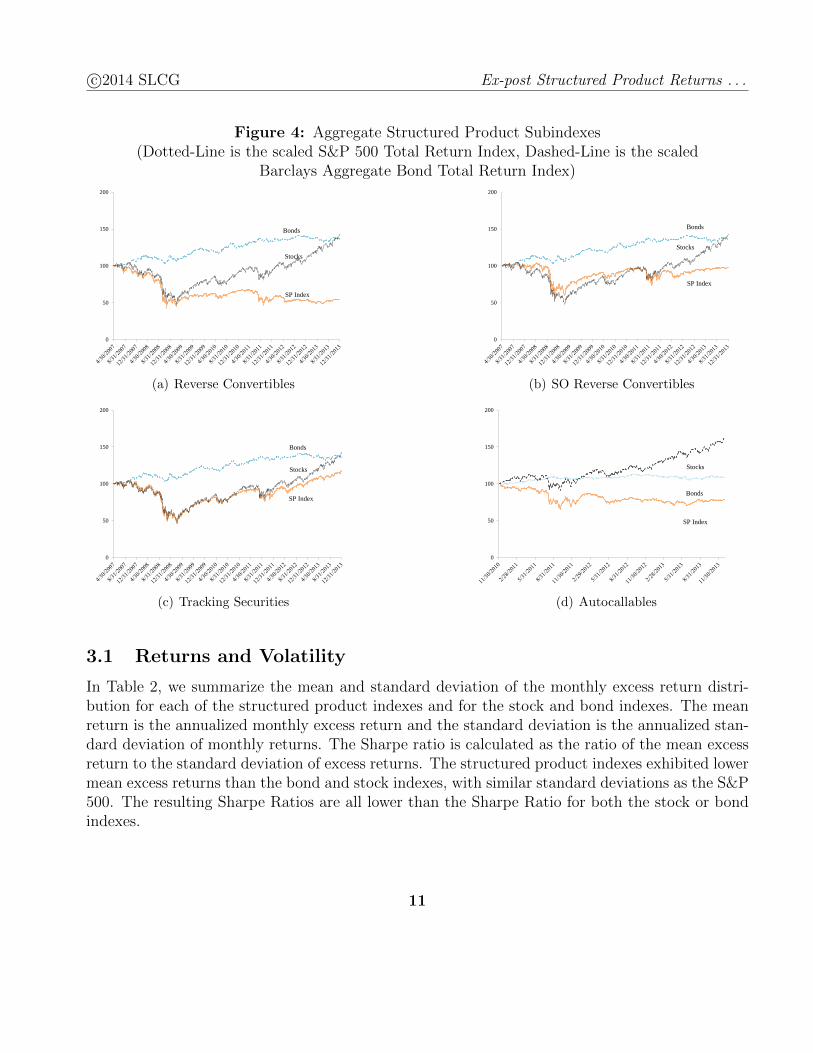
We have also calculated sub-indexes for several types of structured products. Figure 4 illustrateseach of these subindexes. The autocallable security sub-index does not begin until 2011 because oursample contains very few autocallable securities prior to 2011. For comparison, we have includedboth the S&P 500 Total Return Index and the Barclays Aggregate Bond Total Return Index ineach of the figures.
20 The tickers for these indexes are SPXT Index and LEGATRUU Index, respectively.
10
c©2014 SLCG Ex-post Structured Product Returns . . .
Figure 4: Aggregate Structured Product Subindexes(Dotted-Line is the scaled S&P 500 Total Return Index, Dashed-Line is the scaled
Barclays Aggregate Bond Total Return Index)
0
50
100
150
200
Bonds
Stocks
SP Index
(a) Reverse Convertibles
0
50
100
150
200
Bonds
Stocks
SP Index
(b) SO Reverse Convertibles
0
50
100
150
200
Bonds
Stocks
SP Index
(c) Tracking Securities
0
50
100
150
200
Bonds
Stocks
SP Index
(d) Autocallables
3.1 Returns and Volatility
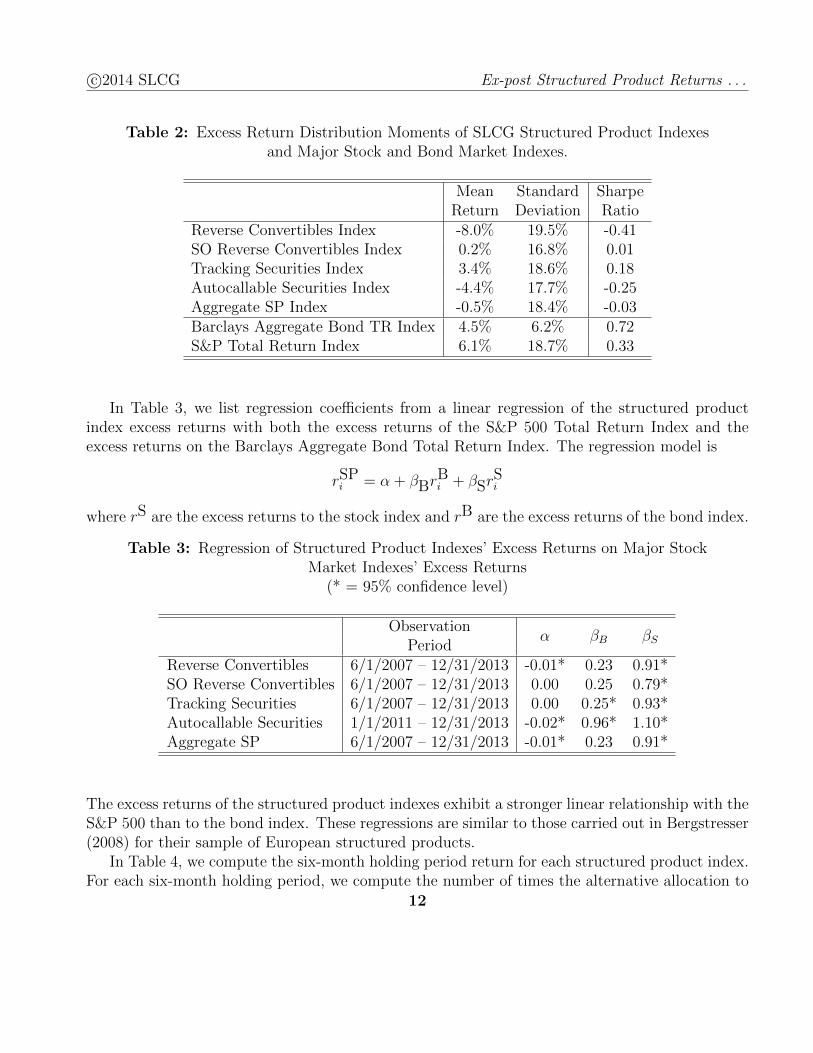
In Table 2, we summarize the mean and standard deviation of the monthly excess return distri-bution for each of the structured product indexes and for the stock and bond indexes. The meanreturn is the annualized monthly excess return and the standard deviation is the annualized stan-dard deviation of monthly returns. The Sharpe ratio is calculated as the ratio of the mean excessreturn to the standard deviation of excess returns. The structured product indexes exhibited lowermean excess returns than the bond and stock indexes, with similar standard deviations as the S&P500. The resulting Sharpe Ratios are all lower than the Sharpe Ratio for both the stock or bondindexes.
11
c©2014 SLCG Ex-post Structured Product Returns . . .
Table 2: Excess Return Distribution Moments of SLCG Structured Product Indexesand Major Stock and Bond Market Indexes.
Mean Standard SharpeReturn Deviation Ratio
Reverse Convertibles Index -8.0% 19.5% -0.41SO Reverse Convertibles Index 0.2% 16.8% 0.01Tracking Securities Index 3.4% 18.6% 0.18Autocallable Securities Index -4.4% 17.7% -0.25Aggregate SP Index -0.5% 18.4% -0.03Barclays Aggregate Bond TR Index 4.5% 6.2% 0.72S&P Total Return Index 6.1% 18.7% 0.33
In Table 3, we list regression coefficients from a linear regression of the structured productindex excess returns with both the excess returns of the S&P 500 Total Return Index and theexcess returns on the Barclays Aggregate Bond Total Return Index. The regression model is
rSPi = α + βBr
Bi + βSr
Si
where rS are the excess returns to the stock index and rB are the excess returns of the bond index.
Table 3: Regression of Structured Product Indexes’ Excess Returns on Major StockMarket Indexes’ Excess Returns
(* = 95% confidence level)
Observationα βB βSPeriod
Reverse Convertibles 6/1/2007 – 12/31/2013 -0.01* 0.23 0.91*SO Reverse Convertibles 6/1/2007 – 12/31/2013 0.00 0.25 0.79*Tracking Securities 6/1/2007 – 12/31/2013 0.00 0.25* 0.93*Autocallable Securities 1/1/2011 – 12/31/2013 -0.02* 0.96* 1.10*Aggregate SP 6/1/2007 – 12/31/2013 -0.01* 0.23 0.91*
The excess returns of the structured product indexes exhibit a stronger linear relationship with theS&P 500 than to the bond index. These regressions are similar to those carried out in Bergstresser(2008) for their sample of European structured products.
In Table 4, we compute the six-month holding period return for each structured product index.For each six-month holding period, we compute the number of times the alternative allocation to
12

c©2014 SLCG Ex-post Structured Product Returns . . .
stocks and bonds outperformed the particular structured product index as a percent of the totalnumber of six-month holding periods.
Table 4: Percentage of Six-Month Holding Periods in which Bond/Stock AllocationsOutperform Structured Product Indexes.
Number of 100% Stocks/ 80% Stocks/ 0% Stocks/Holding Periods 0% Bonds 20% Bonds 100% Bonds
Reverse Convertibles Index 1,550 83.4% 89.9% 65.4%SO Reverse Convertibles Index 1,550 65.5% 73.2% 49.5%Tracking Securities Index 1,550 60.6% 59.3% 42.3%Autocallable Securities Index 650 99.8% 96.8% 65.7%Aggregate SP Index 1,550 78.2% 81.7% 47.5%
Table 4 shows that for the great majority of six-month holding periods, a portfolio of stocks orbonds produced higher returns than a portfolio of structured products. This ex-post comparisonanswers the fundamental question: how do structured products fare, in the aggregate, againstbroad market indexes and alternative allocations to bonds and stocks? The answer is: quitepoorly. 81.7% of the time, investors would be better off owning a diversified portfolio 80% investedin stocks and 20% invested in bonds than they would be as a result of investing in the structuredproducts we have studied.
3.2 Correlations with Other Indexes
We have also calculated the correlation matrix between the excess returns on our structuredproducts since each structured product index inception date and the excess returns to the S&P 500Total Return Index and Barclays Aggregate Bond Total Return Index. Our results are presentedin Table 5 below.21
21 Correlations are calculated based on monthly excess returns over the 1-month US Treasury rates.
13

c©2014 SLCG Ex-post Structured Product Returns . . .
Table 5: Correlation Matrix of Structured Product Indexes with Bond and StockMarkets.
Rev
erse
Con
vert
ible
SO
Rev
erse
Con
vert
ible
Tra
ckin
gSec
uri
ties
Auto
callab
le
Agg
rega
teSP
Index
Bar
clay
sB
ond
TR
Index
S&
P50
0T
RIn
dex
Reverse Convertibles Index 97.1% 93.8% 97.9% 97.6% 39.2% 90.2%SO Reverse Convertibles Index 97.1% 94.1% 95.7% 97.3% 41.2% 91.3%Tracking Securities Index 93.8% 94.1% 91.2% 98.7% 42.6% 96.8%Autocallable Securities Index 98.0% 95.7% 91.4% 95.6% 33.3% 83.1%Aggregate SP Index 97.6% 97.3% 98.7% 95.5% 41.7% 95.7%Barclays Bond Total Return Index 39.2% 41.2% 42.6% 34.2% 41.7% 36.5%S&P 500 Total Return Index 90.2% 91.3% 96.8% 82.4% 95.7% 36.5%
The structured product index changes are highly correlated with changes in the S&P 500 TotalReturn Index, and weakly positively correlated with changes in the Barclays Aggregate BondTotal Return Index. In Figure 5, we plot the correlations of monthly returns to the S&P 500 TotalReturn Index and the Barclays Aggregate Bond Total Return Index with the aggregate structuredproduct index for each year from 2007 to 2014.22
22 2007 includes 10 months of index returns.
14

c©2014 SLCG Ex-post Structured Product Returns . . .
Figure 5: Correlations with the SLCG Aggregate Structured Product Index Over Time(May 2007−January 2014)
-0.2
0.0
0.2
0.4
0.6
0.8
1.0
2007 2008 2009 2010 2011 2012 2013
BarCap Bond Index S&P 500 Total Return Index
3.3 Comparison to Returns on Underlying Securities
Reverse convertibles, single-observation reverse convertibles, and some autocallable structuredproducts are typically linked to individual equities, rather than an index such as the S&P 500, andhave short maturities. The investors in these structured products receive a higher coupon in partdue to a higher implied volatility of the underlying assets. On the other hand, tracking securitiesare typically linked to a basket of equities, or a market index, and usually have a long maturity of5-10 years.
In Figure 6 we plot the distribution of correlations of each structured products value to thevalue/level of the underlying asset. The maturity payoffs of reverse convertibles (Figure 6(a)),single-observation reverse convertibles (Figure 6(b)) and autocallables (Figure 6(d)) are limited bytheir face value. Investors in those notes do not participate in the appreciation of the underlyingequities at maturity; when the market value of the underlying asset increases over the initial value,the fair value of these structured products does not increase on a one-to-one basis. However, whenthe underlying asset value decreases below its barrier, the notes fair value also decreases, usuallyon a one-to-one basis.
The majority of the correlations in Figure 6 are quite positive with much of each distributionabove a correlation of 0.8. The correlation in tracking securities is typically higher (see Figure6(c)) than the correlations of the other three types.
15

c©2014 SLCG Ex-post Structured Product Returns . . .
Figure 6: Correlation between Structured Products and Their Underlying Assets
0%
10%
20%
30%
40%
50%
(a) Reverse Convertibles
0%
10%
20%
30%
40%
50%
(b) SO Reverse Convertibles
0%
20%
40%
60%
80%
100%
(c) Tracking Securities
0%
10%
20%
30%
40%
50%
(d) Autocallables
3.4 Comparison of Structured Product Returns and Index Returns
In Table 6, we summarize the average holding period return for each structured product indexcomponent. This table also summarizes the average over-performance of alternative allocations tostocks and bonds when compared to holding each type of structured product. We computed theannualized holding period return for each structured product and then calculated the annualizedholding period return for the alternative allocations to stocks and bonds over the same periodfrom trade date to the maturity date (or the call date for autocallables that have been called). Wethen compute the difference (stock and bond portfolio return minus the structured product indexcomponent return) and average by product type. Table 6 parenthetically reports the percentage oftimes the alternative allocation to stocks and bonds outperformed an investment in the structuredproduct index component.
Portfolios that primarily hold stocks generally outperform every structured product index com-
16

c©2014 SLCG Ex-post Structured Product Returns . . .
ponent: their average returns are higher, and are, on average, three times more likely to have ahigher return than lower return than the individual structured products. The 100% bond port-folio comparison shows mixed results. The bond portfolio underperforms the tracking securityindex and the probability of the bond portfolio outperforming the SO reverse convertible and thetracking securities indexes are also less than 50%.
Table 6: Percentage of Holding Periods in which Bond/Stock Allocations OutperformStructured Product Index Components and Average Overperformance by Alternative
Bond/Stock Allocations.
Average Portfolio Overperformance (Frequency)Average Holding 100% Stocks/ 80% Stocks/ 0% Stocks/Period Return 0% Bonds 20% Bonds 100% Bonds
Reverse Convertibles Index -8.8% 10.1% (62.6%) 10.7% (63.3%) 15.3% (52.9%)SO Reverse Convertibles Index 1.3% 13.2% (76.5%) 11.0% (74.8%) 3.0% (25.8%)Tracking Securities Index 6.1% 5.3% (71.2%) 4.2% (67.3%) -0.6% (36.8%)Autocallable Securities Index -1.0% 30.0% (90.2%) 24.2% (90.4%) 4.7% (73.0%)
This ex-post analysis of structured product returns shows that a simple portfolio of stocks andbonds are better investments than structured products.
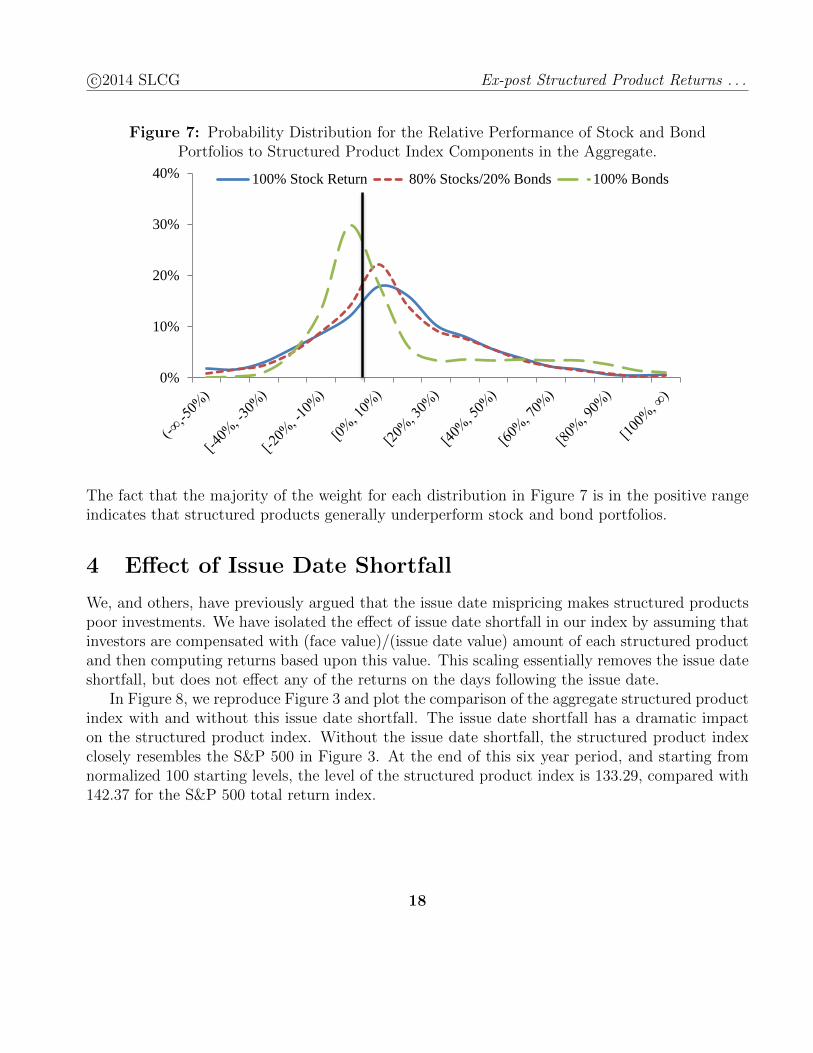
In Figure 7, we show the frequency distribution for the difference between stock/bond portfolioand structured product annualized returns aggregated across product type.
17
c©2014 SLCG Ex-post Structured Product Returns . . .
Figure 7: Probability Distribution for the Relative Performance of Stock and BondPortfolios to Structured Product Index Components in the Aggregate.
0%
10%
20%
30%
40% 100% Stock Return 80% Stocks/20% Bonds 100% Bonds
The fact that the majority of the weight for each distribution in Figure 7 is in the positive rangeindicates that structured products generally underperform stock and bond portfolios.
4 Effect of Issue Date Shortfall
We, and others, have previously argued that the issue date mispricing makes structured productspoor investments. We have isolated the effect of issue date shortfall in our index by assuming thatinvestors are compensated with (face value)/(issue date value) amount of each structured productand then computing returns based upon this value. This scaling essentially removes the issue dateshortfall, but does not effect any of the returns on the days following the issue date.
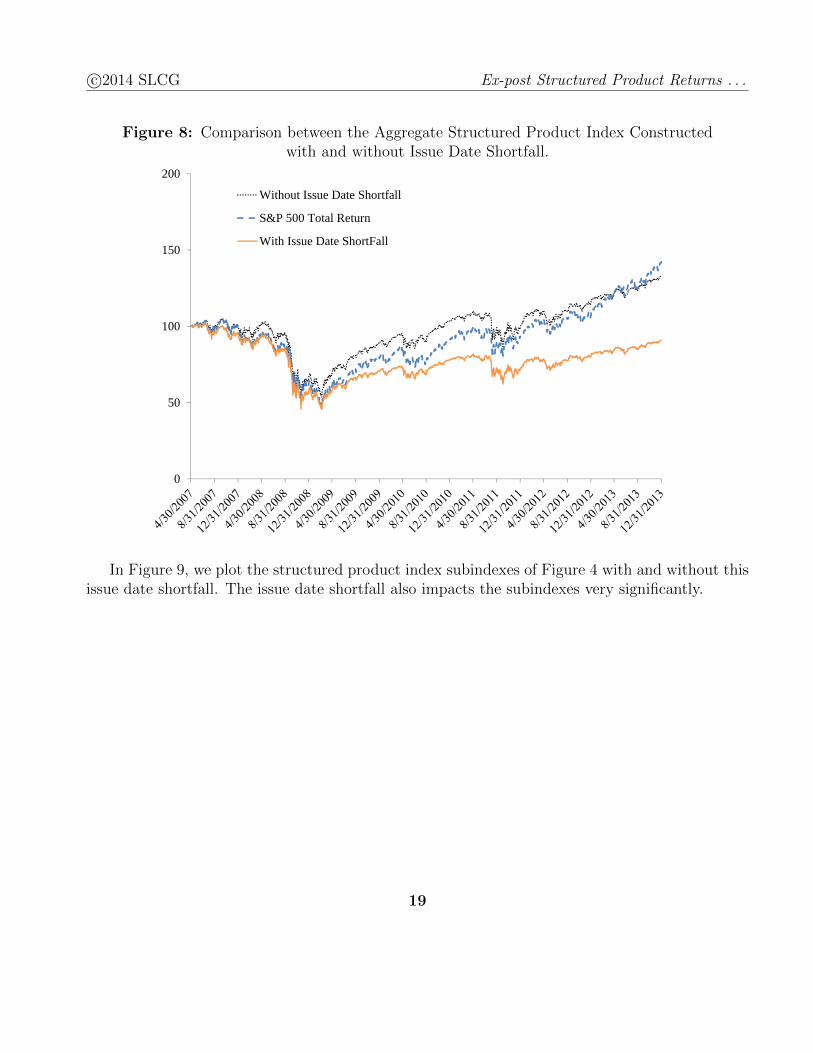
In Figure 8, we reproduce Figure 3 and plot the comparison of the aggregate structured productindex with and without this issue date shortfall. The issue date shortfall has a dramatic impacton the structured product index. Without the issue date shortfall, the structured product indexclosely resembles the S&P 500 in Figure 3. At the end of this six year period, and starting fromnormalized 100 starting levels, the level of the structured product index is 133.29, compared with142.37 for the S&P 500 total return index.
18
c©2014 SLCG Ex-post Structured Product Returns . . .
Figure 8: Comparison between the Aggregate Structured Product Index Constructedwith and without Issue Date Shortfall.
0
50
100
150
200
Without Issue Date Shortfall
S&P 500 Total Return
With Issue Date ShortFall
In Figure 9, we plot the structured product index subindexes of Figure 4 with and without thisissue date shortfall. The issue date shortfall also impacts the subindexes very significantly.
19

c©2014 SLCG Ex-post Structured Product Returns . . .
Figure 9: Comparison between Structured Product Subindexes Constructed with andwithout Issue Date Shortfall.
0
50
100
150
200
Without Issue Date Shortfall
With Issue Date Shortfall
(a) Reverse Convertibles
0
50
100
150
200
Without Issue Date Shortfall
With Issue Date Shortfall
(b) SO Reverse Convertibles
0
50
100
150
200
Without Issue Date Shortfall
With Issue Date Shortfall
(c) Tracking Securities
0
50
100
150
200
Without Issue Date Shortfall
With Issue Date Shortfall
(d) Autocallables
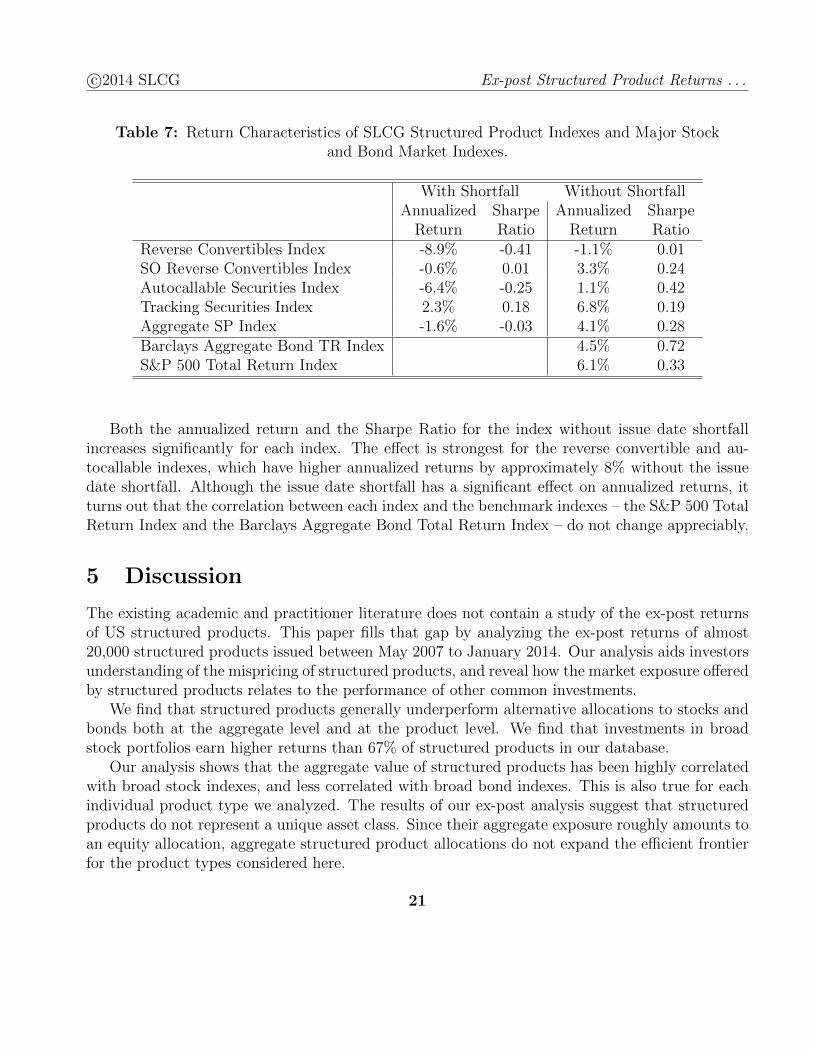
To quantify the impact of the issue date shortfall on ex-post structured product index returns,we have computed the annualized returns and Sharpe Ratio based on monthly returns with andwithout the issue date shortfall. See Table 7.23
23 Annualized returns are calculated based on the total return of the index since inception, while the Sharpe Ratiosare based on excess returns over the 1-month US Treasury rates.
20
c©2014 SLCG Ex-post Structured Product Returns . . .
Table 7: Return Characteristics of SLCG Structured Product Indexes and Major Stockand Bond Market Indexes.
With Shortfall Without ShortfallAnnualized Sharpe Annualized Sharpe
Return Ratio Return RatioReverse Convertibles Index -8.9% -0.41 -1.1% 0.01SO Reverse Convertibles Index -0.6% 0.01 3.3% 0.24Autocallable Securities Index -6.4% -0.25 1.1% 0.42Tracking Securities Index 2.3% 0.18 6.8% 0.19Aggregate SP Index -1.6% -0.03 4.1% 0.28Barclays Aggregate Bond TR Index 4.5% 0.72S&P 500 Total Return Index 6.1% 0.33
Both the annualized return and the Sharpe Ratio for the index without issue date shortfallincreases significantly for each index. The effect is strongest for the reverse convertible and au-tocallable indexes, which have higher annualized returns by approximately 8% without the issuedate shortfall. Although the issue date shortfall has a significant effect on annualized returns, itturns out that the correlation between each index and the benchmark indexes – the S&P 500 TotalReturn Index and the Barclays Aggregate Bond Total Return Index – do not change appreciably.
5 Discussion
The existing academic and practitioner literature does not contain a study of the ex-post returnsof US structured products. This paper fills that gap by analyzing the ex-post returns of almost20,000 structured products issued between May 2007 to January 2014. Our analysis aids investorsunderstanding of the mispricing of structured products, and reveal how the market exposure offeredby structured products relates to the performance of other common investments.
We find that structured products generally underperform alternative allocations to stocks andbonds both at the aggregate level and at the product level. We find that investments in broadstock portfolios earn higher returns than 67% of structured products in our database.
Our analysis shows that the aggregate value of structured products has been highly correlatedwith broad stock indexes, and less correlated with broad bond indexes. This is also true for eachindividual product type we analyzed. The results of our ex-post analysis suggest that structuredproducts do not represent a unique asset class. Since their aggregate exposure roughly amounts toan equity allocation, aggregate structured product allocations do not expand the efficient frontierfor the product types considered here.
21
c©2014 SLCG Ex-post Structured Product Returns . . .
Our results strongly suggest that retail investors should avoid retail structured products. Be-cause of high initial embedded fees, investors have earned ex post returns that are highly correlatedwith, but lower than, returns on simple combinations of liquid stocks and bonds.
References
D. B. Bergstresser. The retail market for structured notes: Issuance patterns and performance,1995 - 2008. 2008. Working paper.
C. Bernard and P. Boyle. Locally-capped structured investment products and the retail investor.Journal of Derivatives, 2011.
J. E. Bethel and A. Ferrel. Policy issues raised by structured products. Brookings-Nomura Paperson Financial Services, 2007.
Bloomberg Structured Notes Brief. 2013 year end review, January 2014.
G. Deng, G. Li, and C. McCann. Structured products in the aftermath of Lehman Brothers. 2009.SLCG working paper, available at http://www.slcg.com/.
G. Deng, I. Guedj, J. Mallett, and C. McCann. The anatomy of absolute return barrier notes.The Journal of Derivatives, 19:61–70, 2011a.
G. Deng, J. Mallett, and C. McCann. Modeling autocallable structured products. Journal ofDerivatives & Hedge Funds, 17:326–340, 2011b.
G. Deng, T. Dulaney, and C. McCann. Valuation of reverse convertibles in the Variance Gammaeconomy. 2012a. SLCG working paper, available at http://www.slcg.com/.
G. Deng, T. Husson, and C. McCann. Valuation of structured products. 2012b. SLCG workingpaper, available at http://www.slcg.com/.
G. Deng, T. Dulaney, T. Husson, and C. McCann. Dual directional structured products. 2013.SLCG working paper, available at http://www.slcg.com/.
B. Doebeli and P. Vanini. Stated and revealed investment decisions concerning structured products.Journal of Banking & Finance, 34:1400–1411, 2010.
N. Gennaiolita, A. Shleiferc, and R Vishnyd. Neglected risks, financial innovation, and financialfragility. Journal of Financial Economics, 104:452468, 2012.
P. Glasserman. Monte Carlo Methods in Financial Engineering. Springer, 2003.
22

c©2014 SLCG Ex-post Structured Product Returns . . .
B. Henderson and N. Pearson. The dark side of financial innovation: A case study of the pricingof a retail financial product. The Journal of Financial Economics, 100:227–247, 2010.
R. Hernandez, W. Y. Lee, and P. Liu. An economic analysis of reverse exchangeable securities:An option-pricing approach. 2007. Working paper, University of Arkansas.
S&P Dow Jones Indices. S&P municipal bond index methodology. March 2013.
M. Szymanowska, J. Ter Horst, and C. Veld. Reverse convertible bonds analyzed. Journal ofFutures Markets, 29:895–919, 2009.
S. Wilkens, C. Erner, and K. Roder. The pricing of structured products in germany. Journal ofDerivatives, 11:55–69, 2003.
23