Faulty Measurements and Shaky Tools: An Exploration into ...
Upload
emerson-ballCategory
view
27download
0description

Wyoming Critical Access Hospital NetworkElkhorn Valley Rehabilitation Hospital
Casper, WYJuly 10, 2014
Eric K. Shell, CPA, MBA
Evolving Rural Healthcare Environment – Surviving the Crossing of the Shaky Bridge

2
• In the past 24 months, the healthcare field has experienced considerable changes with an increased number of rural-urban affiliations, physicians transitioning to hospital employment models, flattening volumes, CEO turnover, etc.
• Federal healthcare reform passed in March 2010 with sweeping changes to healthcare systems, payment models, and insurance benefits/programs
• Many of the more substantive changes will be implemented over the next two years
• State Medicaid programs are moving toward managed care models or reduced fee for service payments to balance State budgets
• Commercial insurers are steering patients to lower cost options
• Thus, providers face new financial uncertainty and challenges and will be required to adapt to the changing market
The Healthcare Environment Has Changed!
INTRODUCTION

3
• State Budget Deficits• Recovery Audit Contractors (RAC)• High Deductible Health Plans
• Non Healthcare CEO quote:• “We just renewed our High
Deductible Plan going into our third year, and guess what.....5% reduction in premium!!! Needless to say everyone is thrilled. Not sure what the average HSA balance is, but I think it is high. Doing what it is supposed to do, turning health care patients into consumers.”
• 3/18/2013 WSJ Article
Market Overview
MARKET OVERVIEW TRANSITION FRAMEWORK STRATEGIES

4
Pressure on State and Local Budgets
MARKET OVERVIEW TRANSITION FRAMEWORK STRATEGIES

5
Growth of High Deductible Plans
MARKET OVERVIEW TRANSITION FRAMEWORK STRATEGIES

6
Trend of Lower Inpatient Use
Inpatient Days per 1,000 Persons, 1991 – 2011
Source: Avalere Health analysis of American Hospital Association Annual Survey data, 2011, for community hospitals. US Census Bureau: National and State Population Estimates, July 1, 2011. Link: http://www.census.gov/popest/data/state/totals/2011/index.html.
Compound Adjusted Annual Rate Decline of 2%
MARKET OVERVIEW TRANSITION FRAMEWORK STRATEGIES
7
Service Area
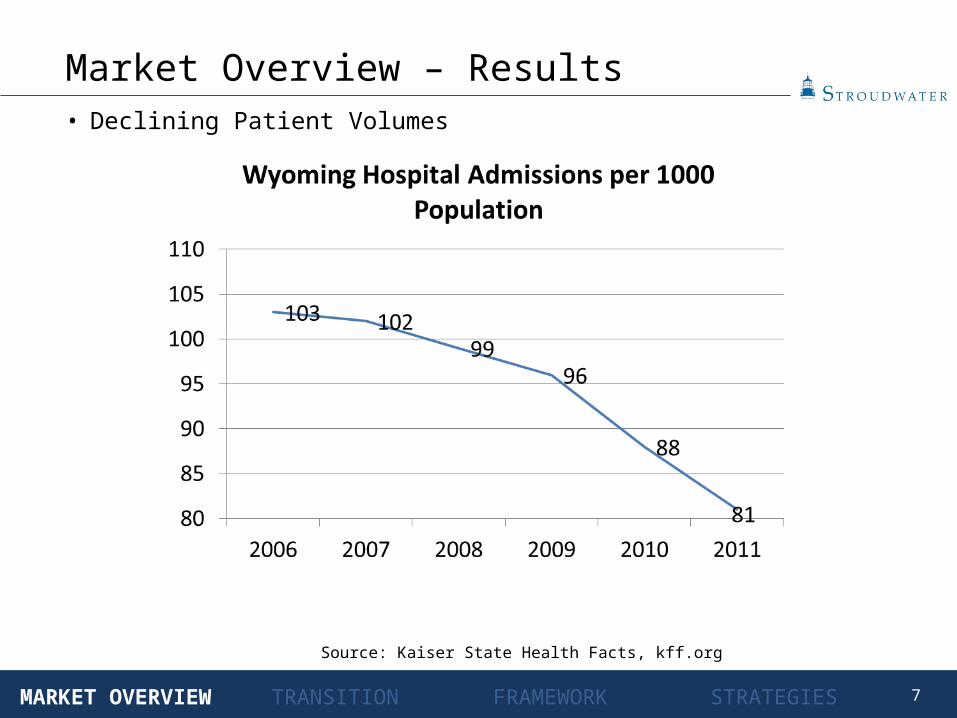
• Declining Patient Volumes
Market Overview – Results
MARKET OVERVIEW TRANSITION FRAMEWORK STRATEGIES
Source: Kaiser State Health Facts, kff.org

8
Service Area
• Coverage Expansion• By 1/1/14, expand Medicaid to all non-Medicare eligible individuals under age 65
with incomes up to 133% FPL based on modified AGI • Currently, Medicaid covers only 45% of poor (≤ 100% FPL)• 16 million new Medicaid beneficiaries; mostly “traditional” patients• FMAP for newly eligible: 100% in 2014-16; 95% in 2017; 94% in 2018; 93% in
2019; 90% in 2020+ • Establishment of State-based Health Insurance Exchanges• Subsidies for Health Insurance Coverage• Individual and Employer Mandate
• Provider Implications• Insurance coverage will be extended to 32 million additional Americans by 2019
• Expansion of Medicaid is major vehicle for extending coverage• May release pent-up demand and strain system capacity• Traditionally underserved areas and populations will have increased provider
competition • Have insurance, will travel!
Market Overview – Healthcare Reform
MARKET OVERVIEW TRANSITION FRAMEWORK STRATEGIES

9
Service Area
• Medicare and Medicaid Payment Policies• Medicare Update Factor Reductions
• Annual updates will be reduced to reflect projected gains in productivity • Medicare and Medicaid Disproportionate Share Hospital (DSH) Payment Reductions • Medicare Hospital Wage Index• Independent Payment Advisory Board (IPAB)
• Charged with figuring out how to reduce Medicare spending to targets with goal of $13B savings between 2014 and 2020
• Summary Impact
Market Overview – Healthcare Reform
MARKET OVERVIEW TRANSITION FRAMEWORK STRATEGIES

10
Service Area
• Medicare and Medicaid Payment Policies (continued)
• Provider Implications• Payment changes will increase pressure on hospital margins and increase competition
for patient volume• “Do more with less and then less with less”• Medicaid pays less than other insurers and will be forced to cut payments further
Market Overview – Healthcare Reform
MARKET OVERVIEW TRANSITION FRAMEWORK STRATEGIES

11
Service Area
• Medicare and Medicaid Delivery System Reforms• Expansion of Medicare and Medicaid Quality Reporting Programs • Medicare and Medicaid Healthcare-Acquired Conditions (HAC) Payment Policy
• By Oct. 2014, the 25% of hospitals with the highest HAC rates will get a 1% overall payment penalty
• Medicare Readmission Payment Policy• Hospitals with above expected risk-adjusted readmission rates will get reduced
Medicare payments • Value based purchasing
• Medicare will reduce DRG payments to create a pool of funds to pay for the VBPP• 1% reduction in FFY 2013, Grows to 2% by FFY 2017
• Bundled Payment Initiative• Accountable Care Organizations
• Each ACO assigned at least 5,000 Medicare beneficiaries• Providers continue to receive usual fee-for-service payments• Compare expected and actual spend for specified time period• If meet specified quality performance standards AND reduce costs, ACO receives
portion of savings
Market Overview – Healthcare Reform
MARKET OVERVIEW TRANSITION FRAMEWORK STRATEGIES

12
Service Area
• Medicare and Medicaid Delivery System Reforms (continued)• Medicare Accountable Care Organizations (continued)
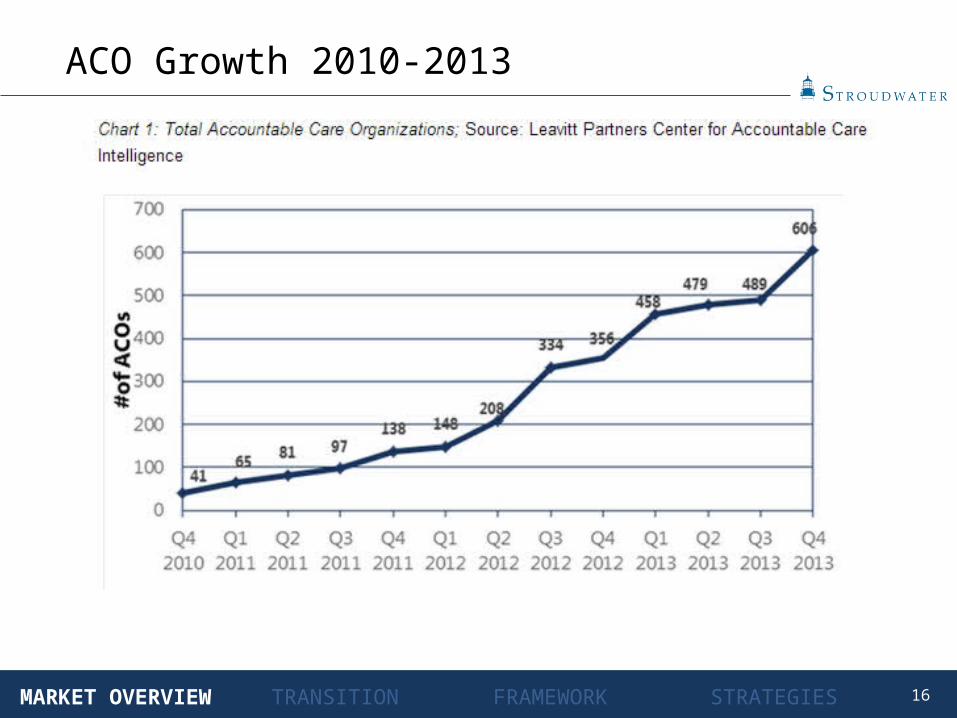
• 154 ACOs effective August, 2012• 287 ACOs effective January, 2013• 401 ACOs effective January, 2014
• More than half of the U.S. population now live in localities served by ACOs and almost 30 percent live in areas served by two or more
• 5.3 million Medicare beneficiaries, or about 14 percent of total Medicare fee-for-service beneficiaries, now in Medicare ACOs
Market Overview – Healthcare Reform
http://www.kaiserhealthnews.org/stories/2011/january/13/aco-accountable-care-organization-faq.aspxhttp://www.cms.gov/Medicare/Medicare-Fee-for-Service-Payment/sharedsavingsprogram/News.html
MARKET OVERVIEW TRANSITION FRAMEWORK STRATEGIES

13
Source: Becker’s Hospital Review
• 1. Aetna Forms 5 New ACOs in MaineAetna announced accountable care agreements with five different healthcare organizations in Maine: Mercy Health System, InterMed, MaineHealth and Martin's Point Health Care, all in Portland, and MaineGeneral Health in Augusta.
• 2. Aetna, New Haven Community Medical Group Partner for Accountable CareAetna announced a new accountable care agreement with New Haven (Conn.) Community Medical Group, an integrated network of 591 providers.
• 3. Aetna, Riverside Health System Ink ACO DealAetna announced an accountable care organization collaboration with Riverside Health System, a five-hospital, 941-bed system based in Newport News, Va.
• 4. St. Vincent's Health Partners, Anthem BCBS Sign Value-Based AgreementSt. Vincent's Health Partners, a Bridgeport, Conn.-based physician hospital organization developed between St. Vincent's Medical Center and regional physicians, announced a value-based reimbursement agreement with Anthem Blue Cross and Blue Shield.
• 5. Providence Health & Services, Southern California Forms Commercial ACOBlue Shield of California, Providence Health & Services, Southern California and its affiliates, Mission Hills, Calif.-based Facey Medical Foundation and Facey Medical Group, announced the formation of a three-year accountable care organization.
• 6. Cigna Announces 2 New Accountable Care PartnershipsCigna launched two new collaborative accountable care initiatives July 1: one with Baycare Health Partners, a physician hospital organization based in Springfield, Mass., and the other with Scottsdale Health Partners, a physician-led clinically integrated network created as a partnership between Scottsdale (Ariz.) Healthcare and Scottsdale Physician Organization.
New ACOS (Since the end of May 2013)
MARKET OVERVIEW TRANSITION FRAMEWORK STRATEGIES

14
New ACOS (Since the end of May 2013)• 7. Cigna Launches 2 Accountable Care Initiatives in ArizonaCigna launched new collaborative accountable care initiatives, the payer's version of accountable care organizations, with physicians affiliated with two different organizations in Tucson: Arizona Community Physicians and Arizona Connected Care.
• 8. CaroMont Medical Group, Cigna Partner for Accountable CareCaroMont Medical Group, a Gastonia, N.C.-based network of 44 physician practices in two states, partnered with Cigna for a collaborative accountable care initiative, Cigna's version of accountable care organizations.
• 9. NYUPN Clinically Integrated Network, Cigna Link for Accountable Care InitiativeCigna is launching a collaborative accountable care initiative, its version of accountable care organizations, with NYUPN Clinically Integrated Network, an organization comprising all clinical faculty affiliated with NYU Langone Medical Center and the University Physicians Network in New York City.
• 10. Valley Preferred, Cigna Partner for Accountable CareValley Preferred, a provider-owned preferred provider organization aligned with Lehigh Valley Health Network in Allentown, Pa., and Cigna launched a collaborative accountable care initiative July 1.
• 11. Hunterdon Healthcare Partners Launches ACOs With Cigna, Horizon BCBSNJHunterdon Healthcare Partners, a physician-hospital organization affiliated with Hunterdon Healthcare in Flemington, N.J., formed two commercial accountable care organizations with Cigna and Horizon Blue Cross Blue Shield of New Jersey.
• 12. Beacon Health Partners, Empire BCBS Sign Value-Based AgreementBeacon Health Partners, a Medicare Shared Savings Program accountable care organization and independent physician association in Manhasset, N.Y., signed a patient-centered primary care agreement with Empire BlueCross BlueShield.
MARKET OVERVIEW TRANSITION FRAMEWORK STRATEGIES
Source: Becker’s Hospital Review

15
New ACOS (Since the end of May 2013)• 13. Highmark Moves Toward Accountable Care With New AllianceHealth insurer Highmark in Pittsburgh formed an accountable care alliance within its newly formed Allegheny Health Network, which will include physicians from Allegheny Health Network and the following six hospitals: Allegheny General Hospital in Pittsburgh, Allegheny Valley Hospital in Natrona Heights, Pa., Canonsburg (Pa.) General Hospital, Forbes Regional Hospital in Monroeville, Pa., Jefferson Regional Medical Center in Jefferson Hills, Pa., and The Western Pennsylvania Hospital in Pittsburgh. 14. Barnabas, Horizon BCBS of New Jersey Partner for ACOWest Orange, N.J.-based Barnabas Health linked with Horizon Blue Cross Blue Shield of New Jersey, the state's largest health insurer, for an accountable care organization.
• 15. Adventist Health, Tuality Healthcare, Regence BCBS Form AC Network in OregonAdventist Health-Portland (Ore.), Tuality Healthcare in Hillsboro, Ore., and Regence BlueCross BlueShield of Oregon announced they are forming an accountable care network.
• 16. Regence BCBS, Willamette Valley Health Sol Announce Accountable Care PartnershipRegence BlueCross BlueShield and McMinnville, Ore.-based Willamette Valley Medical Center's accountable care organization, Willamette Valley Health Solutions, formed an accountable care partnership.
• 17. Mount Carmel Health Partners, UnitedHealthcare Link for ACOMount Carmel Health Partners, a physician hospital organization jointly owned by Columbus, Ohio-based Mount Carmel Health System and 1,500 physicians, formed an accountable care organization with UnitedHealthcare, effective Oct. 1.
• 18. Seton Health Alliance, UnitedHealthcare Form Central Texas' First Commercial ACOAustin, Texas-based Seton Health Alliance, a Pioneer accountable care organization that is a partnership between Seton Healthcare Family and other providers, partnered with UnitedHealthcare for the first-ever commercial ACO in central Texas.
MARKET OVERVIEW TRANSITION FRAMEWORK STRATEGIES
Source: Becker’s Hospital Review
16
ACO Growth 2010-2013
MARKET OVERVIEW TRANSITION FRAMEWORK STRATEGIES

17
Where Are ACOs Forming?
MARKET OVERVIEW TRANSITION FRAMEWORK STRATEGIES

18
ACOs in Wyoming
MARKET OVERVIEW TRANSITION FRAMEWORK STRATEGIES
Source: Becker’s Hospital Review, Billings Gazette, commonwealthfund.org
• In April 2011, the Billings Gazette reported that Wyoming Medical Center in Casper and Cheyenne (Wyo.) Regional Medical Center had reportedly been meeting to establish a statewide ACO
• WMC announced plans to explore the feasibility of a statewide ACO in November 2011, and discussions with Cheyenne intensified as regulations were finalized, according to the report
• Partnership was to be called “The Wyoming Solution”
• Unclear whether project ever came to fruition, or is still in progress
• The Commonwealth Fund reports that the “Cheyenne ACO” is still in a development stage

19
ACOs Serving Wyoming: Billings Clinic
MARKET OVERVIEW TRANSITION FRAMEWORK STRATEGIES
Source: gojunto.com: Franklin Street ACO database
• Based in Billings, Montana, Billings Clinic is a community-owned health care organization consisting of a multi-specialty physician group practice, a 272-bed hospital, and a 90-bed skilled nursing and assisted living facility. Wyoming is included in its service area.
• Billings Clinic was selected as a Medicare ACO. Participants include:• Billings Clinic main campus (all services)• Billings Clinic West• Billings Clinic Heights• Billings Clinic Miles City• Billings Clinic Cody• Bozeman OB/GYN
• Billings Clinic is one of the first four healthcare organizations in the nation to receive accreditation as an ACO through the NCQA

20
ACOs – Results and Projections
• FY 2012 Results from Pioneer ACOs • Costs per beneficiary increased .3% vs. .8% for peer beneficiaries• Overall quality measure performance comparatively better than FFS providers• Pioneer ACOs rated higher than their prior year FFS scores for all patient experience
measures • 7 Pioneer ACOs converted to MSSP ACOs, 2 dropped out
• ACO participation expected to double by end of 2014 (source: Premier 2013 Annual Study)
• Growth of commercial ACOs (source: Becker’s Hospital Review)• 35 Commercial ACOs announced through 9/30/2013• Commercial insurers announce plans to dramatically increase their number of risk-
based, accountable care contracts
MARKET OVERVIEW TRANSITION FRAMEWORK STRATEGIES

21
Fee-For-Service Financial Model
Assumptions• Utilization
• Inpatient and Outpatient• Impact of ACA• Impact of Blue Cross steerage initiatives
• Revenue• Third party price increases• Cost based Medicare revenue• DSH payments (Zeroed out in 2014)• Bad debt % of patient service revenue (75% reduction in 2014)• Impact of ACA• Meaningful use incentive payments• Other operating revenue• Non-operating gains and
• Expenses• Salaries, wages and benefits• Productivity• Supplies and other
MARKET OVERVIEW TRANSITION FRAMEWORK STRATEGIES

22
Jackson WYSundance WYKemmerer WYBuffalo WYAfton WYLaramie WYLusk WYNewcastle WYSheridan WYPowell WYRock Springs WYCody WYEvanston WYDouglas WYGillette WYRawlins WYWY TotalThermopolis WYLovell WYTorr ington WYWheatl and WYWor land WYCasper WYLander WYRiverton WYCheyenne WYUS Total
0
20
40
60
80
100
120
Normalized Discharges/1,000
121.1
94.8
118
96
70
42
93
61
2021 Minimally Managed Market (High 118/Low 96)
2021 U.S. Average (High 93/Low 61)
2021 Highly Managed Market (High 70/Low 42)
Age Normalized Use Rate Comparisons – Discharges/1,000
Current use rates based on Truven Healthcare Analytics population and discharge estimates by Dartmouth Hospital Service Area (HSA).2021 use rates based on Milliman Governance Institute Presentation (2/2012).Use rates are normalized to the United States average.
MARKET OVERVIEW TRANSITION FRAMEWORK STRATEGIES

23
Use Rate Comparisons – Discharges/1,000Current Use
Rates Above US 2012 10 year annual decline Berlin 120 16.4% -1.5%Colebrook 118 13.5% -1.3%Lancaster 114 9.7% -0.9%Littleton 93 -10.2% 1.1%US Average 104 13.2% -1.2%
Current Use Rates
Above MM Projected 2022 10 year annual decline
Berlin 120 12.6% -1.2%Colebrook 118 9.8% -0.9%Lancaster 114 6.1% -0.6%Littleton 93 -13.1% 1.4%Minimally Managed High 118 2.1% -0.2%Minimally Managed Midpoint 107 9.5% -0.9%Minimally Managed Low 96 22.1% -2.0%
Current Use Rates
Above US Average Projected 2022 10 year annual decline
Berlin 120 56.5% -4.6%Colebrook 118 52.6% -4.3%Lancaster 114 47.5% -4.0%Littleton 93 20.8% -1.9%US Average High 93 26.0% -2.3%US Average Midpoint 77 44.3% -3.4%US Average Low 61 82.2% -6.1%
Current Use Rates
Above HM Projected 2022 10 year annual decline
Berlin 120 115.1% -8.0%Colebrook 118 109.9% -7.7%Lancaster 114 102.8% -7.3%Littleton 93 66.0% -5.2%Highly Managed High 70 67.4% -4.7%Highly Managed Midpoint 56 98.5% -7.0%Highly Managed Low 42 157.2% -10.2%
MARKET OVERVIEW TRANSITION FRAMEWORK STRATEGIES

24
Fee-For-Service Financial Model – Results
When operating income becomes negative in 2016, cash reserves start to decline
$(18)
$(16)
$(14)
$(12)
$(10)
$(8)
$(6)
$(4)
$(2)
$-
$2
$4
2012 2013 2014 2015 2016 2017 2018 2019 2020 2021 2022
Mill
ions
Operating income (Consolidated)
• Operational improvement and shared service economies of scale are insufficient to combat
declining utilization
• Can’t cut your way to sustainability
MARKET OVERVIEW TRANSITION FRAMEWORK STRATEGIES

25
Service Area
• Medicare and Medicaid Delivery System Reforms (continued)
• Provider Implications• Hospitals are taking the lead in forming Accountable Care Organizations
with physician groups that will share in Medicare savings• Value based purchasing program will shift payments from low performing
hospitals to high performing hospitals• Acute care hospitals with higher than expected risk-adjusted readmission
rates and HAC will receive reduced Medicare payments for every discharge
• Physician payments will be modified based on performance against quality and cost indicators
• There are significant opportunities for demonstration project funding
Market Overview – Healthcare Reform
MARKET OVERVIEW TRANSITION FRAMEWORK STRATEGIES

26
Service Area
• Stability and US Healthcare Spending
Market Overview – Results
MARKET OVERVIEW TRANSITION FRAMEWORK STRATEGIES
Source: The Wall Street Journal, January 6, 2014

27
Service Area
• Declining Healthcare Employment
Market Overview – Results
MARKET OVERVIEW TRANSITION FRAMEWORK STRATEGIES
Source: modernhealthcare.com

28
Service Area
Market Overview – Results
MARKET OVERVIEW TRANSITION FRAMEWORK STRATEGIES
Source: beckershospitalreview.com

29
Sources: The New York Times, 6/25/14.talkingpointsmemo.com, 6/25/14
• Healthcare Spending Decreased in Q1 2014
Market Overview – Results
MARKET OVERVIEW TRANSITION FRAMEWORK STRATEGIES

30
• Factors that will have a significant impact on rural hospitals over the next 5-10 years • Difficulty with recruitment of providers and aging of current medical staff
• Struggle to pay market rates• Increasing competition from other hospitals and physician providers for
limited revenue opportunities• Small hospital governance members without sophisticated understanding of
small hospital strategies, finances, and operations• Consumer perception that “bigger is better”• Severe limitations on access to capital for necessary investments in
infrastructure and provider recruitment• Facilities historically built around IP model of care
• Increased burden of remaining current on onslaught of regulatory changes• Regulatory Friction / Overload
• Payment systems transitioning from volume based to value based• Increased emphasis of quality as payment and market differentiator• Reduced payments that are “Real this time”
• 3rd party steerage (surgery, lab, and Imaging), RAC audits
Challenges Affecting Rural Hospitals
MARKET OVERVIEW TRANSITION FRAMEWORK STRATEGIES

31
• Subset of most recent challenges
• Payment systems transitioning from volume based to value based• Increased emphasis as quality as payment and market differentiator• Reduced payments that are “Real this time”
•New environmental challenges are the TRIPLE AIM!!!•Market Competition on economic driver of healthcare: PATIENT VALUE
We Have Moved into a New Environment!
MARKET OVERVIEW TRANSITION FRAMEWORK STRATEGIES

32
• Definitions• Patient Value
• Accountable Care:• A mechanism for providers to monetize the value derived from
increasing quality and reducing costs• Accountable care includes many models including bundled
payments, value-based payment program, provider self-insured health plans, Medicare defined ACO, capitated provider sponsored healthcare, etc.
• Different “this time”• Providers monetize value• New information systems to manage costs and quality• Agreed upon evidence-based protocols • Going back is not an option
Quality
Cost
Patient
Value
Future Hospital Financial Value Equation
MARKET OVERVIEW TRANSITION FRAMEWORK STRATEGIES

33
• ACO Relationship to Small and Rural Hospitals
• Revenue stream of future tied to Primary Care Physicians (PCP) and their patients
• Small and rural hospitals bring value / negotiating power to affiliation relationships as generally PCP based• Smaller community hospitals and rural hospitals have value through
alignment with revenue drivers (PCPs) rather than cost drivers but must position themselves for new market:• Functional alignment with PCPs in local service area• Develop a position of strength by becoming highly efficient• Demonstrate high quality through monitoring and actively pursuing
quality goals
Future Hospital Financial Value Equation
MARKET OVERVIEW TRANSITION FRAMEWORK STRATEGIES

34
• Economics
• As payment systems transition away from volume based payment, the current economic model of increasing volume to reduce unit costs and generate profit is no longer relevant • New economic models based on patient value must be developed by
hospitals but not before the payment systems have converted• Economic Model: FFS Rev and Exp VS. Budget Based Payment Rev and Exp
Loss Zone
Service Volumes
Dollars
Cost
Revenue
Profit Zone
Future Hospital Financial Value Equation
MARKET OVERVIEW TRANSITION FRAMEWORK STRATEGIES

35
• Value in Rural Hospitals
• Lower Per Beneficiary Costs
• Revenue centers of the future• PCP based delivery system
• CAH cost-based reimbursement• Incremental volume drives down unit costs• Once commitment to community Emergency Room, system incentives to
drive low acuity volume to CAH• MedPAC Confusion – Limited Incentives to manage costs???
Future Hospital Financial Value Equation
MARKET OVERVIEW TRANSITION FRAMEWORK STRATEGIES

36
The Challenge: Crossing the Shaky Bridge
2012 201520142013 2016
Fee for Service
Payment System
Population Based
Payment System
MARKET OVERVIEW TRANSITION FRAMEWORK STRATEGIES

37
• Shaky Bridge
• Concern of task force members is that transitioning of the delivery system functions must coincide with transitioning payment system of rural hospitals, without adequate reserves, will be a financial risk• “Stepping onto the shaky bridge” analogy
• Necessary for hospitals to survive the gap between pay-for-volume and pay-for-performance• Delivery system has to remain aligned with current payment system while
seeking to implement programs / processes that will allow flexibility to new payment system• Delivery system must be ready to jump when new payment systems
roll out
The Challenge
MARKET OVERVIEW TRANSITION FRAMEWORK STRATEGIES

38
Finance Function Form
Macro-economic Payment System•Government Payers
• Changing from F-F-S to PBPS
•Private Payers• Follow Government
payers• Steerage to lower cost
providers
Provider Imperatives• Transition from• Management of price,
utilization, and costs (under F-F-S system) to
• Management of care for defined population (under PBPS)
• Providers assume insurance risk
Provider organization• Evolution from• Independent organizations
competing with each other for market share based on volume to
• Aligned organizations competing with other aligned organizations for covered lives based on quality and value
The Premise
Network and care management organization• New competencies
required• Network development• Care management• Risk contracting• Risk management
MARKET OVERVIEW TRANSITION FRAMEWORK STRATEGIES

39
Changing Payment System Incentives
MARKET OVERVIEW TRANSITION FRAMEWORK STRATEGIES

40
Micro-economic Environment – Physicians Perspective Current State Phase 1 Phase 2 Phase 3 Future State
PCPs • Loss leaders • Employed to
maintain primary care base in their communities
• Independent PCPs • Relatively low
compensation • Emphasis on high
volume episodic care
• System aligned (employed and independent)
• Increasing compensation
• Revenue centers • System employed
and integrated • Relatively high
compensation • Emphasis on care
management and chronic disease management
• Operating at top of license, leveraging non-physician practitioners and team members
Specialists • Profit centers • Emphasis on high
volume of high dollar procedures
• Caught between volume emphasis and system cost emphasis
• Declining compensation
• Regional consolidation with lower volumes
• Increasing employment by systems
• Cost centers • Increase value
through care management models that drive down costs
• Quality must be demonstrated
• Make (employ) or buy (purchase externally) decision based on cost
Physician Perspectives
MARKET OVERVIEW TRANSITION FRAMEWORK STRATEGIES

41
Micro-economic Environment – Hospitals Perspective Current State Phase 1 Phase 2 Phase 3 Future State
Rural • Profit by increasing volume and reducing unit costs
• Generally primary care based delivery systems
• Demonstrate quality
• Imperative to increase efficiencies
• Seek economies of scale through collaboration
• Full alignment with primary care providers within service area
• Developing sub-regional system
• Rationalize specialty services across sub-region
• Maintaining appropriate primary care, ancillary and urgent care services
• Access point into the delivery system
• Accounting systems to recognize contributed value at system or sub-system level
• Balance sheet linkage to larger system
Hospital Perspectives
MARKET OVERVIEW TRANSITION FRAMEWORK STRATEGIES
42
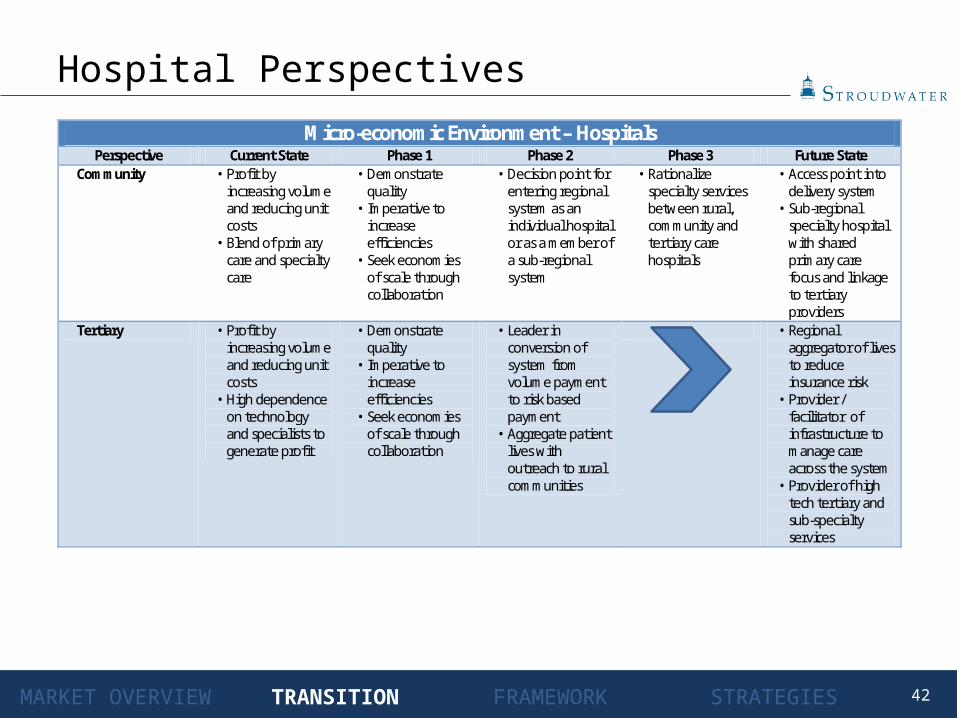
Micro-economic Environment – Hospitals Perspective Current State Phase 1 Phase 2 Phase 3 Future State
Community • Profit by increasing volume and reducing unit costs
• Blend of primary care and specialty care
• Demonstrate quality
• Imperative to increase efficiencies
• Seek economies of scale through collaboration
• Decision point for entering regional system as an individual hospital or as a member of a sub-regional system
• Rationalize specialty services between rural, community and tertiary care hospitals
• Access point into delivery system
• Sub-regional specialty hospital with shared primary care focus and linkage to tertiary providers
Tertiary • Profit by increasing volume and reducing unit costs
• High dependence on technology and specialists to generate profit
• Demonstrate quality
• Imperative to increase efficiencies
• Seek economies of scale through collaboration
• Leader in conversion of system from volume payment to risk based payment
• Aggregate patient lives with outreach to rural communities
• Regional aggregator of lives to reduce insurance risk
• Provider / facilitator of infrastructure to manage care across the system
• Provider of high tech tertiary and sub-specialty services
Hospital Perspectives
MARKET OVERVIEW TRANSITION FRAMEWORK STRATEGIES

43
Implementation Framework – What Is It?• A strategic framework for assisting organizations transition from a payment system
dominated by the FFS payment model to one dominated by population based payment models• Delivery system side addresses strategic imperatives for providers• Provider side addresses strategies for providers to influence the evolution of
the payment system in their market• Requires creation of an integrating vehicle so that providers can contract for
covered lives, create value through active care management and monetize the creation of that value
• Strategic imperatives drive the initiatives that must be designed and timely implemented to successfully make the transition• Each initiative is developed in phases that correspond to the evolution of the
payment models• Work on each initiative needs to begin now so they will be ready to implement
when required
MARKET OVERVIEW TRANSITION FRAMEWORK STRATEGIES

44
Implementation Framework – What Is It?
MARKET OVERVIEW TRANSITION FRAMEWORK STRATEGIES
DELIVERY SYSTEM
POPULATION HEALTH MANAGEMENT
(INTEGRATED DELIVERY AND PAYMENT SYSTEM)
•Provider based health plan
Operating Efficiencies,
Patient Safety, Quality
Primary Care Network Alignment
Planning
Service Network Rationalization
Strategy
•Claims analysis•PCMH•Evidence based protocols
Primary Care Network
Alignment Implementation
Service Network Rationalization
Implementation Planning
•Contracting•Hot-spotting•Value attribution
Service NetworkRationalization Implementation
•Plan design•Risk management•Value based credentialing support
INITIATIVE I
F-F-S
INITIATIVE II
INITIATIVE III
INITIATIVE IV
PHASE I PHASE II PHASE III PBPS
Self-Funded Employee Health
Plan
Transitional payment models
Planning
Transitional payment models Implementation
INITIATIVE II
INITIATIVE I
Full risk capitated plans Strategy
Full risk capitated plans
Implementation Planning
Full risk capitated plans
ImplementationINITIATIVE III
PAYMENT SYSTEM
© Stroudwater Associates 2013

45
Delivery System Path
• Delivery system must respond to at a similar pace to changing payment models in order
to maintain financial viability
• Getting too far ahead or lagging behind will be hazardous to their health
DELIVERY SYSTEM
POPULATION HEALTH MANAGEMENT
(INTEGRATED DELIVERY AND PAYMENT SYSTEM)
•Provider based health plan
Operating Efficiencies,
Patient Safety, Quality
Primary Care Network Alignment
Planning
Service Network Rationalization
Strategy
•Claims analysis•PCMH•Evidence based protocols
Primary Care Network
Alignment Implementation
Service Network Rationalization
Implementation Planning
•Contracting•Hot-spotting•Value attribution
Service NetworkRationalization Implementation
•Plan design•Risk management•Value based credentialing support
INITIATIVE I
F-F-S
INITIATIVE II
INITIATIVE III
INITIATIVE IV
PHASE I PHASE II PHASE III PBPS
© Stroudwater Associates 2013
MARKET OVERVIEW TRANSITION FRAMEWORK STRATEGIES

46
• Hospitals not operating at efficient levels are currently, or will be, struggling financially
• “Efficient” is defined as• Appropriate patient volumes
meeting needs of their service area
• Revenue cycle practices operating with best practice processes
• Expenses managed aggressively• Physician practices managed
effectively• Effective organizational design
Initiative I – Operating Efficiencies, Patient Safety and Quality
MARKET OVERVIEW TRANSITION FRAMEWORK STRATEGIES
Graphic: National Patient Safety Foundation

47
• Grow FFS patient volume to meet community needs• “Catching to pitching”• Opportunities often include swing bed, imaging, lab, ER, etc.
• Increase efficiency of revenue cycle function• Adopt revenue cycle best practices
• Effective measurement system• “Super charging” front end processes including online insurance
verification, point of service collections• Education on necessity for upfront collections• Ensure chargemaster is up to date and reflects market reality
• CAHs to ensure accuracy of the Medicare cost reports• Improving accuracy of Medicare cost reports often results in incremental
Medicare and Medicaid revenue to CAHs• Continue to seek additional community funds to support hospital mission
• Increase millage tax base where appropriate• Ensure ad valorem tax renewal
Initiative I – Operating Efficiencies, Patient Safety and Quality
MARKET OVERVIEW TRANSITION FRAMEWORK STRATEGIES

48
• Increase monitoring of staffing levels staffing to the “sweet spot”
• Staffing education for DONs/Clinical managers
• Salary Survey / Staffing Levels / Benchmarks that are relevant
Performance FY 2012 Hourly FTEs @ Actual
Department Indicator Volume Standard1 Standard FTEs2 VarianceNursing - Med Surg Per Patient Day 3,263 12.00 18.82 36.82 18.00 Nursing - Endoscopy/GI Lab Per Case 120 3.60 0.21 - (0.21) Emergency Room Per Case 2,672 2.40 3.08 - (3.08) UR/Case Mgr/Soc Ser Patient Days 3,263 0.75 1.18 - (1.18) Nursing Administration Per Adj. Admissions 1,835 1.75 1.54 - (1.54) Subtotal Nursing 24.83 36.82 11.99
Radiology Per Procedure 6,368 1.42 4.34 6.99 2.65 Lab/Blood Bank Per Test 36,551 0.30 5.27 8.70 3.43 Physical Therapy Per Treatment 11,014 0.50 2.65 3.08 0.43 Cardiac Rehab Per Procedure 531 1.31 0.33 0.51 0.18 Speech Therapy Per Treatment 333 1.00 0.16 - (0.16) Cardio/Pulmonary Per Procedure 6,381 0.55 1.68 3.63 1.95 Pharmacy Per Adjusted Day 9,969 0.60 2.88 2.00 (0.88) Subtotal Ancillary 17.31 24.91 7.60 Subtotal - Clinical 42.14 61.73 19.59
Hospital Administration Per Adj. Admissions 1,835 1.65 1.46 3.18 1.72 Information Systems Per Adj. Admissions 1,835 1.00 0.88 2.00 1.12 Human Resources Per Adj. Admissions 1,835 1.10 0.97 1.00 0.03 Marketing/Planning/Public RelPer Adj. Admissions 1,835 0.28 0.25 1.94 1.69 Volunteers Per Adj. Admissions 1,835 0.75 0.66 - (0.66) Telecommunications Per Adj. Admissions 1,835 0.36 0.32 - (0.32) General Accounting (5) Per Adj. Admissions 1,835 1.23 1.09 3.00 1.91 Security Gross Square Feet - 0.02 - - - Patient Accounting Per Adj. Admissions 1,835 3.00 2.65 5.03 2.38 Admitting/Patient RegistrationPer Adj. Admissions 1,835 4.25 3.75 2.00 (1.75) Medical Records Per Adj. Admissions 1,835 3.50 3.09 7.71 4.62 Cent Supply/Mtl Mgmt/SterilePer Adjusted Day 9,969 0.30 1.44 2.67 1.23 Housekeeping Net Square Feet 43,795 0.31 6.57 6.99 0.42 Dietary Meals Served 40,801 0.25 4.90 8.99 4.09 Plant Ops/ Maintenance Gross Square Feet - 0.12 - 1.58 1.58 Laundry and Linen Lbs of Laundry 349,015 0.02 3.36 - (3.36) Subtotal Support 31.37 46.09 14.72
73.52 107.82 34.30 1 Hourly Standards based on Stroudwater sample of hospitals2 FY 2012 information provided by hospital administration (average of last three payrolls ending 2/4/2012)
Sample of Selected Departments
Initiative I – Operating Efficiencies, Patient Safety and Quality
MARKET OVERVIEW TRANSITION FRAMEWORK STRATEGIES

49
• Develop LEAN production practices that consider the expenditure of resources for any goal other than the creation of value for the end customer to be wasteful
• Preserving value / quality with less processes• Workflow redesign• Inventory Levels / Standardization• Response Times• Replicating Successes among all hospitals• C-Suite training on LEAN / Six Sigma
• Evaluate self funded health insurance plans for optimal plan design• Self funded health insurance plans offer often overlooked opportunity to
develop accountable care strategies for a defined patient base through aligning employee incentives through improved benefits design and more effective care management processes
• Evaluate 340B discount pharmacy program as an opportunity to both increase profit and reduce costs
• Often 340B is only looked upon as an opportunity to save costs not considering profit potential
Initiative I – Operating Efficiencies, Patient Safety and Quality
MARKET OVERVIEW TRANSITION FRAMEWORK STRATEGIES

50
• Develop physician practice expertise
Financial Performance
Organizational Structure
Revenue
Visits
RVU Benchmarks
Visit Benchmarks
New Patients
Throughput
Price
Collections
Fee Schedules
Payer Mix
Coding
Expense
Non-Provider
Staff Ratios
Overhead Expenses
Provider
Compensation
Physician Ratio
Initiative I – Operating Efficiencies, Patient Safety and Quality
MARKET OVERVIEW TRANSITION FRAMEWORK STRATEGIES

51
• Have an effective organizational design that drives accountability into the organization• Decision Rights
• Drive decision rights down to clinical/operation level• Education to department managers on business of healthcare
• Avoid separation of clinical and financial functions
• Performance Measurement• Department managers to be involved in developing annual budgets• Budget to actual reports to be sent to department managers monthly
• Variance analysis to be performed through regularly scheduled meetings between CFO/CEO and department managers
• Compensation• Recognize performance in line with organizational goals
Initiative I – Operating Efficiencies, Patient Safety and Quality
MARKET OVERVIEW TRANSITION FRAMEWORK STRATEGIES

52
• Focus on Quality and Patient Safety• As a strategic imperative• As a competitive advantage
Initiative I – Operating Efficiencies, Patient Safety and Quality
U.S. HHS Hospital Compare MeasuresNational Average
New Hampshire
Average
Mary Hitchcock Memorial Hospital
Androscoggin Valley Hospital
Littleton Regional
Healthcare
Upper Connecticut
Valley Hospital
Weeks Medical Center
Reported Core Measures:
Heart failure patients given discharge instructions 93% 96% 96% 62% 93% 100% N/A
Heart failure patients given LVS function test 99% 99% 100% 100% 100% 58% 100%
Pneumonia patient ER blood culture before antibiotics 97% 98% 96% 97% 97% N/A 94%
Pneumonia patient given appropriate antibiotic 95% 96% 96% 100% 100% N/A 95%
Surgery patients given timely infection prevention antibiotics 99% 98% 99% 100% 99% N/A 97%
Surgery patients given timely blood clot prevention antibiotics 98% 98% 99% 98% 100% N/A 100%
Surgery patients timely removal of urinary catheter 96% 95% 86% 84% 100% N/A 87%
Reported Use of Medical Imaging:
Combination ("double") outpatient chest CT given 4% 1% 0% N/A N/A 4% 11%
Combination ("double") outpatient abdominal CT given 13% 6% 3% N/A N/A 9% 32%
Patient Satisfaction (HCAHPS) Average: 72% 74% 71% 75% 74% N/A N/A
Nurses "Always" communicated well: 78% 80% 77% 85% 78% N/A N/A
Doctors "Always" communicated well: 81% 81% 79% 82% 85% N/A N/A
"Always" received help when wanted: 67% 71% 70% 78% 72% N/A N/A
Pain "Always" well controlled: 71% 72% 65% 70% 71% N/A N/A
Staff "Always" explained med's before administering: 63% 66% 59% 67% 70% N/A N/A
Room and bathroom "Always" clean: 73% 76% 66% 81% 76% N/A N/A
Area around room "Always" quiet at night: 60% 57% 40% 59% 53% N/A N/A
YES, given at home recovery information: 84% 88% 90% 88% 88% N/A N/A
Gave hospital rating of 9 or 10 (0-10 scale): 70% 72% 76% 73% 72% N/A N/A
YES, definitely recommend the hospital: 71% 75% 84% 70% 71% N/A N/A
Source:: www.hospitalcompare.hhs.gov
MARKET OVERVIEW TRANSITION FRAMEWORK STRATEGIES

53
• Publicly report quality measures• All CAHs to begin reporting to Medicare Beneficiary Quality Improvement
Program (MBQIP) • Increase internal awareness of internet based, publicly available, quality scores • Develop internal monitor systems to “move the needle” • Monitor data submissions to ensure reflect true operations • Consider reporting quality information on hospital website or direct patient to
Hospital Compare• Staying current with industry trends and future measures• Educate staff on impact of how actual or perceived quality affects the hospital
image • Must develop paradigm shift from quality being something in an office down
the hall to something all hospital staff responsible for• Shift from being busy work to being integrated in business plan
Initiative I – Operating Efficiencies, Patient Safety and Quality
MARKET OVERVIEW TRANSITION FRAMEWORK STRATEGIES
54
• Partner with Medical Staff to improve quality • Restructure physician compensation agreements to build quality measures
into incentive based contracts• Modify Medical Staff bylaws tying incentives around quality and outcomes into
them• Ensure most appropriate methods are used to capture HCAHPS survey data
• Consider transitioning from paper survey to phone call survey to ensure that method has increased statistical validity
• Electronic Health Record (EHR) to be used as backbone of quality improvement initiative
• Meaningful Use – Should not be the end rather the means to improving performance
• Increase Board members understanding of quality as a market differentiator• Move from reporting to Board to engaging them (i.e. placing board member
on Hospital Based Quality Council)• Quality = Performance Excellence
Initiative I – Operating Efficiencies, Patient Safety and Quality
MARKET OVERVIEW TRANSITION FRAMEWORK STRATEGIES

55
• Understand that revenue streams of the future will be tied to primary care physicians, which often comprise a majority of the rural and small hospital healthcare delivery network
• Thus small and rural hospitals, through alignment with PCPs, will have extraordinary value relative to costs
• Physician Relationships• Hospital align with employed and independent providers to enable
interdependence with medical staff and support clinical integration efforts• Contract (e.g., employ, management agreements)• Functional (share medical records, joint development of evidence based
protocols)• Governance (Board, executive leadership, planning committees, etc.)
Initiative II – Primary Care Alignment
MARKET OVERVIEW TRANSITION FRAMEWORK STRATEGIES

56
• Develop system integration strategy
• Evaluate wide range of affiliation options ranging from network relationships, to interdependence models, to full asset ownership models• Interdependence models through alignment on contractual,
functional, and governance levels, may be option for rural hospitals that want to remain “independent”
• Explore / Seek to establish interdependent relationships among small and rural hospitals understanding their unique value relative to future revenue streams
• Identify the number of providers needed in the service area based on population and the impact of an integrated regional healthcare system
• Conduct focused analysis of procedures leaving the market
• Understand real value to hospitals• Under F-F-S• Under PBPS (Cost of out of network claims)
Initiative III – Rationalize Service Network
MARKET OVERVIEW TRANSITION FRAMEWORK STRATEGIES

57
Payment System Path
• Providers have opportunities to “shorten” and “stabilize” the shaky bridge by:
• Working with payers to create transitional payment models
• Initiating development with payers of full-capitation payment models
POPULATION HEALTH MANAGEMENT
(INTEGRATED DELIVERY AND PAYMENT SYSTEM)
•Provider based health plan
•Claims analysis•PCMH•Evidence based protocols
•Contracting•Hot-spotting•Value attribution
•Plan design•Risk management•Value based credentialing support
F-F-S
INITIATIVE IV
PHASE I PHASE II PHASE III PBPS
Self-Funded Employee Health
Plan
Transitional payment models
Planning
Transitional payment models Implementation
INITIATIVE II
INITIATIVE I
Full risk capitated plans Strategy
Full risk capitated plans
Implementation Planning
Full risk capitated plans
ImplementationINITIATIVE III
PAYMENT SYSTEM
© Stroudwater Associates 2013
MARKET OVERVIEW TRANSITION FRAMEWORK STRATEGIES

58
Payment System Initiatives
MARKET OVERVIEW TRANSITION FRAMEWORK STRATEGIES
Initiative I: Develop self-funded employer health plan• Hospital is already 100% at risk for medical claims
• Change benefits to encourage greater “consumerism”
• Begin creation of care management infrastructure
• Begin to move up the learning curve
• Cost reduction opportunity for the delivery system
Initiative II: Begin implementation planning for transitional payment models• Transitional payment models include:
• FFS against capitation benchmark w/ shared savings
• Shared savings model Medicare ACOs
• Shared savings models with other governmental and commercial insurers
• Partial capitation and sub-capitation options with shared savings
• Prioritize insurance market opportunities
• Take the initiative with insurers to gauge interest and opportunities for collaborating on transitional payment models
• Explore direct contracting opportunities with self-funded employers
Initiative III: Develop strategy for full risk capitated plans

59
Initiative IV – Population Based Payment System
MARKET OVERVIEW TRANSITION FRAMEWORK STRATEGIES
• A narrow rural/urban provider network focused on patient value
• Aggregates multiple rural/CAH populations for critical mass
• Restricted to payers willing to commit to population health and payment
• On CCO’s terms
• NOT for existing fee-for-service or cost contracts
• Legal entity with corporate powers
• Governance structure for setting strategy, policy, accountability
• Actively secures and manages risk/reward-based payer contracts
• Supports PCP-focused quality & care coordination across the network
• Retains local hospital independence, but with contractual accountability
• Houses care management infrastructure
POPULATION HEALTH MANAGEMENT
(INTEGRATED DELIVERY AND PAYMENT SYSTEM)
•Provider based health plan
•Claims analysis•PCMH•Evidence based protocols
•Contracting•Hot-spotting•Value attribution
•Plan design•Risk management•Value based credentialing support
F-F-S
INITIATIVE IV
PHASE I PHASE II PHASE III PBPS

60
Community Care Organizations (CCO) Initiatives – Phase I and II
MARKET OVERVIEW TRANSITION FRAMEWORK STRATEGIES
Phase I: Develop care management building blocks
• Goal: Infrastructure to manage self insured lives
• Initiatives:• PCMH
• Develop claims analysis capabilities/infrastructure
• Develop evidenced based protocols
Phase II: Develop Strategy for full population health management
• Goal: Infrastructure to manage transitional payment models
• Initiatives:• Develop capability to contract with third party payers including actuarial expertise
• Acquire and analyze third party payer claims targeting high cost users
• Develop payment/measurement system to attribute value and distribute shared savings
• PCMHs are provided tools to better manage patient care to improve outcomes and patient health

61
CCO Initiatives – Phase III and IV
MARKET OVERVIEW TRANSITION FRAMEWORK STRATEGIES
Phase III: Implementation plan for full risk-based population contracts
• Goal: Infrastructure to manage care for a defined population within a budget
• Initiatives:• Risk management capability (e.g., re-insurance)
• Enhanced third-party payer “partnerships” (e.g., plan design, joint marketing, etc.)
• Capability to support value-based credentialing
Phase IV: Implementation of Integrated delivery and payment system
• Goal: Implement full provider-based health plan

62
• For decades, rural hospitals have dealt with many challenges including low volumes, declining populations, difficulties with provider recruitment, limited capital constraining necessary investments, etc. • The current environment driven by healthcare reform and market realities now
offers a new set of challenges. Many rural healthcare providers have not yet considered either the magnitude of the changes or the required strategies to appropriately address the changes
• Core set of new challenges represents the Triple Aim being played on in the market• Locally delivered healthcare (including rural and small community hospitals) has high
value in the emerging delivery system• “Shaky Bridge” crossing will required planned, proactive approach
• Finance will lead function and form• Maintain alignment between delivery system models and payment systems
building flexibility into the delivery system model for the changing payment system
Conclusions / Recommendations
CONCLUSIONS / RECOMMENDATIONS

63
• Important strategies for providers to consider include:• Increase leadership awareness of new environment realities• Improve operational efficiency of provider organizations• Adapt effective quality measurement and improvement systems as a strategic
priority• Align/partner with medical staff members contractually, functionally, and through
governance where appropriate• Seek interdependent relationships with developing regional systems
Conclusions / Recommendations (continued)
CONCLUSIONS / RECOMMENDATIONS

Eric K. Shell, CPA, [email protected]
50 Sewall Street, Suite 102Portland, Maine 04102
(207) 221-8252
www.stroudwater.com