Evolva Biotech SA Microarray and Macro opportunities for Discovery informatics Head of Informatics...
47
Evolva Biotech Evolva Biotech SA SA Microarray and Macro Microarray and Macro opportunities opportunities for for Discovery informatics Discovery informatics www.evolvabio.com www.evolvabio.com S.Shriram S.Shriram Head of Informatics Head of Informatics [email protected] [email protected] Mobile +91 9346738534 Mobile +91 9346738534
-
Upload
martin-byrd -
Category
Documents
-
view
218 -
download
0
Transcript of Evolva Biotech SA Microarray and Macro opportunities for Discovery informatics Head of Informatics...

Evolva Biotech Evolva Biotech SASA
Microarray and Macro opportunitiesMicroarray and Macro opportunitiesforfor
Discovery informaticsDiscovery informatics
www.evolvabio.comwww.evolvabio.com
S.ShriramS.Shriram
Head of InformaticsHead of Informatics
[email protected]@evolvabio.com
Mobile +91 9346738534Mobile +91 9346738534
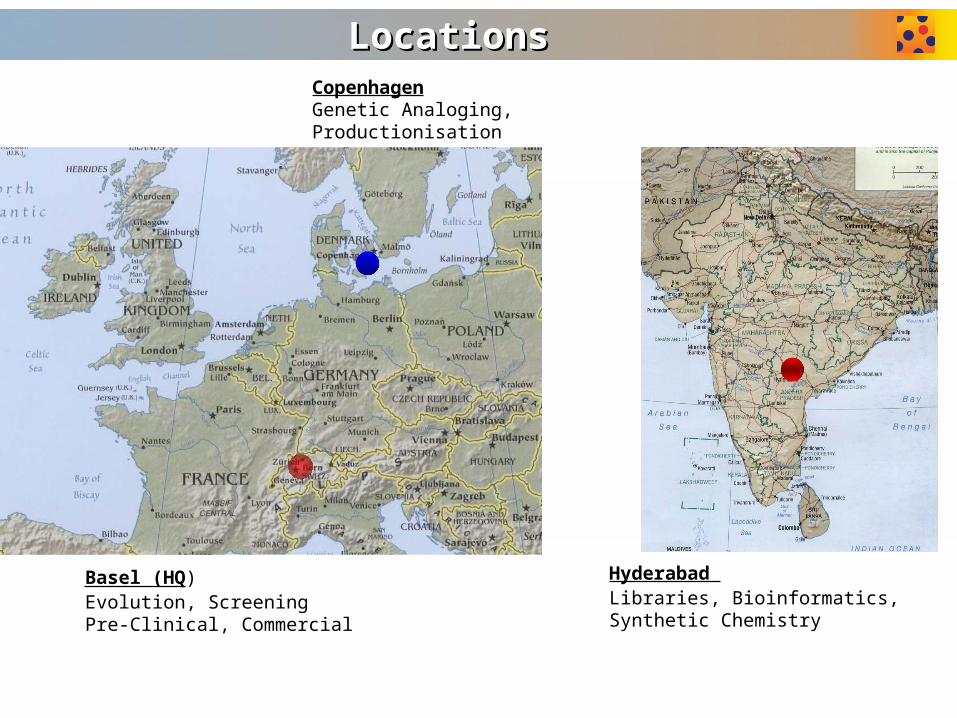
LocationsLocations
Basel (HQ)Evolution, ScreeningPre-Clinical, Commercial
CopenhagenGenetic Analoging,Productionisation
Hyderabad Libraries, Bioinformatics, Synthetic Chemistry
AgendaAgenda
Introduction to DNA microarraysAlso please refer http://203.193.135.94/seminar05.htm
Types of Microarray
Steps in data analysis
Opportunities

• DNA Microarrays are simply small glass or silicon slides upon the surface of which are arrayed thousands of genes (usually between 100-40,000)
• Expression level measurement of genes is done by a conventional DNA hybridization process
• Data are read using laser-activated fluorescence readers
• The process is automated with robots and software and hence “ultra-high throughput”
What are DNA Microarrays?What are DNA Microarrays?

Need for MicroarraysNeed for Microarrays
What genes are Present/Absent in a cell?
What genes are Present/Absent in the experiment vs. control?
Which genes have increased/decreased expression in experiment vs. control?
Which genes have biological significance?

ApplicationsApplications
Discovery
Leads
PreClinical
Clinical
Target Discovery
Target Validation
Screening
Validation
Optimization
Toxicology
Optimization
Genotyping
ADME Screens
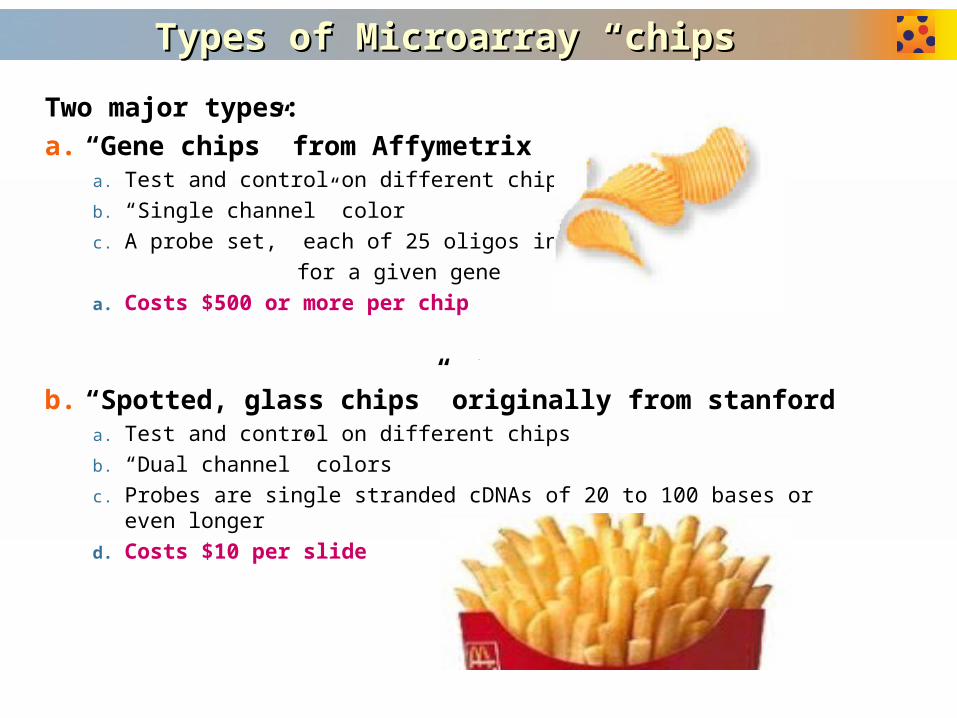
Types of Microarray “chips”Types of Microarray “chips”
Two major types:
a. “Gene chips” from Affymetrixa. Test and control on different chips
b. “Single channel” color
c. A probe set, each of 25 oligos in length
for a given gene
a. Costs $500 or more per chip
b. “Spotted, glass chips” originally from stanforda. Test and control on different chips
b. “Dual channel” colors
c. Probes are single stranded cDNAs of 20 to 100 bases or even longer
d. Costs $10 per slide
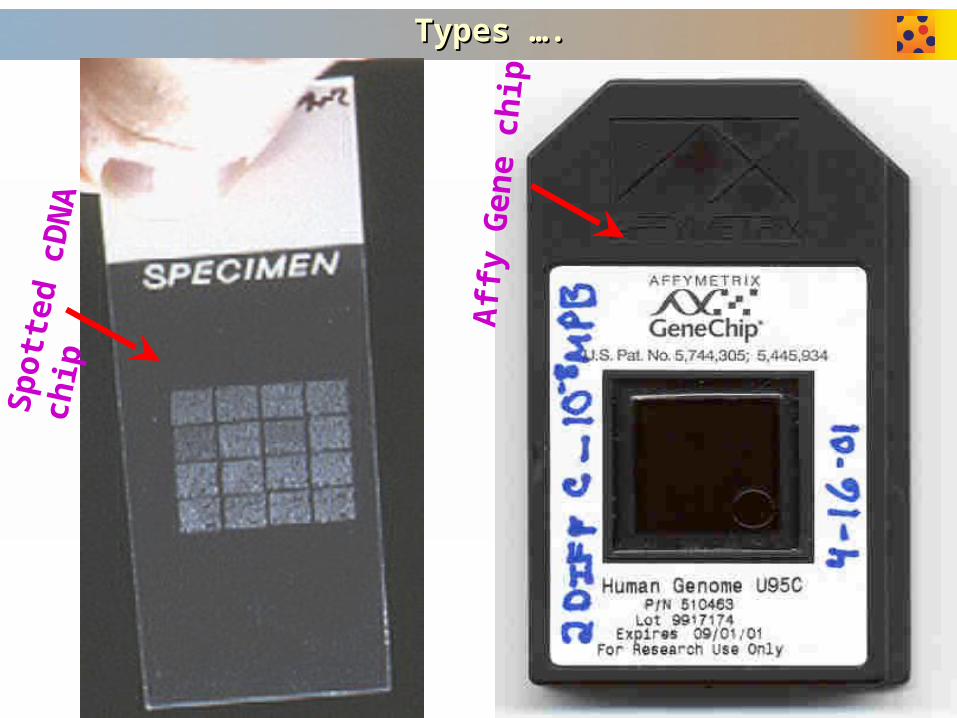
Types ….Types ….S
po
tted
cD
NA
ch
ip
Aff
y G
ene
chip
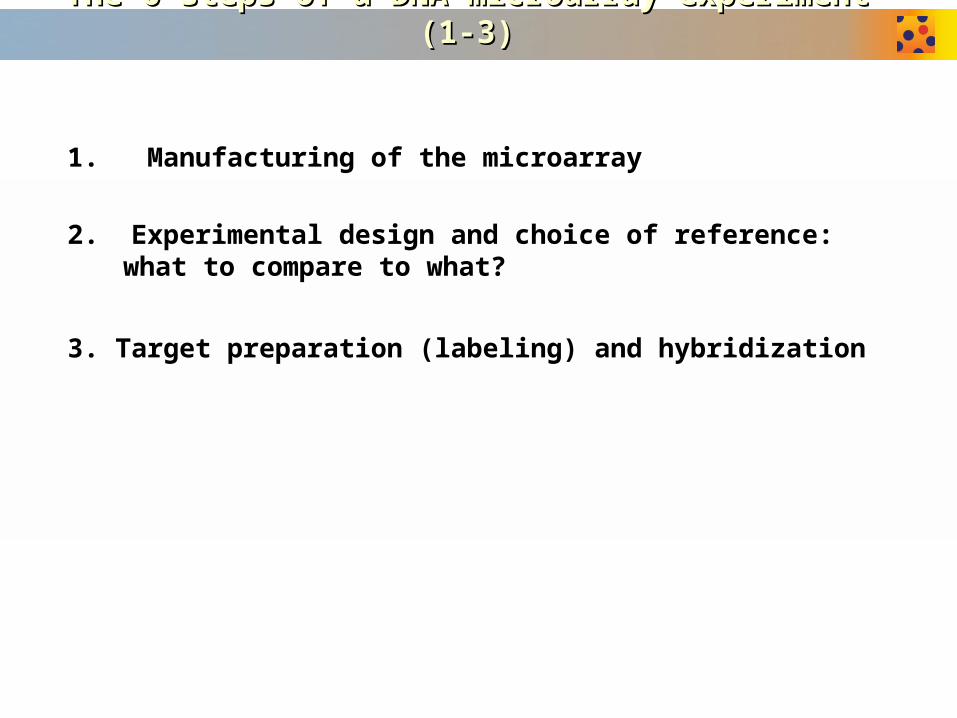
The 6 steps of a DNA microarray experiment (1-3)The 6 steps of a DNA microarray experiment (1-3)
1. Manufacturing of the microarray
2. Experimental design and choice of reference: what to compare to what?
3. Target preparation (labeling) and hybridization
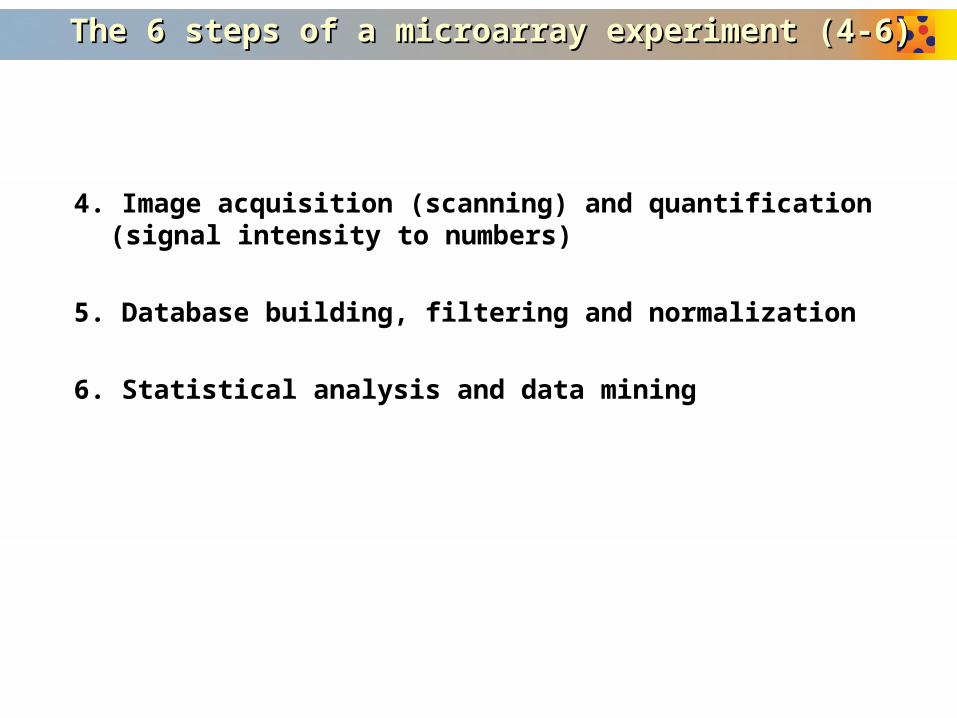
The 6 steps of a microarray experiment (4-6)The 6 steps of a microarray experiment (4-6)
4. Image acquisition (scanning) and quantification (signal intensity to numbers)
5. Database building, filtering and normalization
6. Statistical analysis and data mining
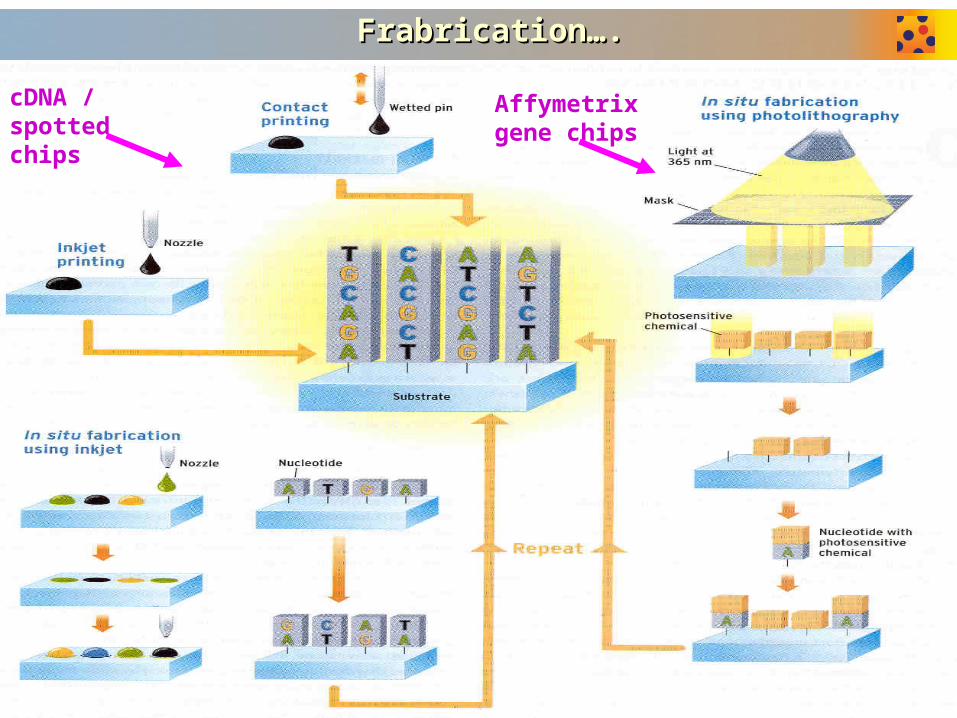
Frabrication….Frabrication….
cDNA / spotted chips
Affymetrix gene chips

Gene chip…..Gene chip…..

GeneChipGeneChip®® Expression Analysis - Hybridization and Staining Expression Analysis - Hybridization and Staining
Array
cRNA Target
Hybridized Array
Streptravidin-phycoerythrinconjugate

Steps in pics… - Quantification of RNASteps in pics… - Quantification of RNA

Steps in pics… - RNA quality checkSteps in pics… - RNA quality check

Steps in pics… - HybridizationSteps in pics… - Hybridization
Rotation: 60 rpm
Temp: 45 C
Time: 16hrs
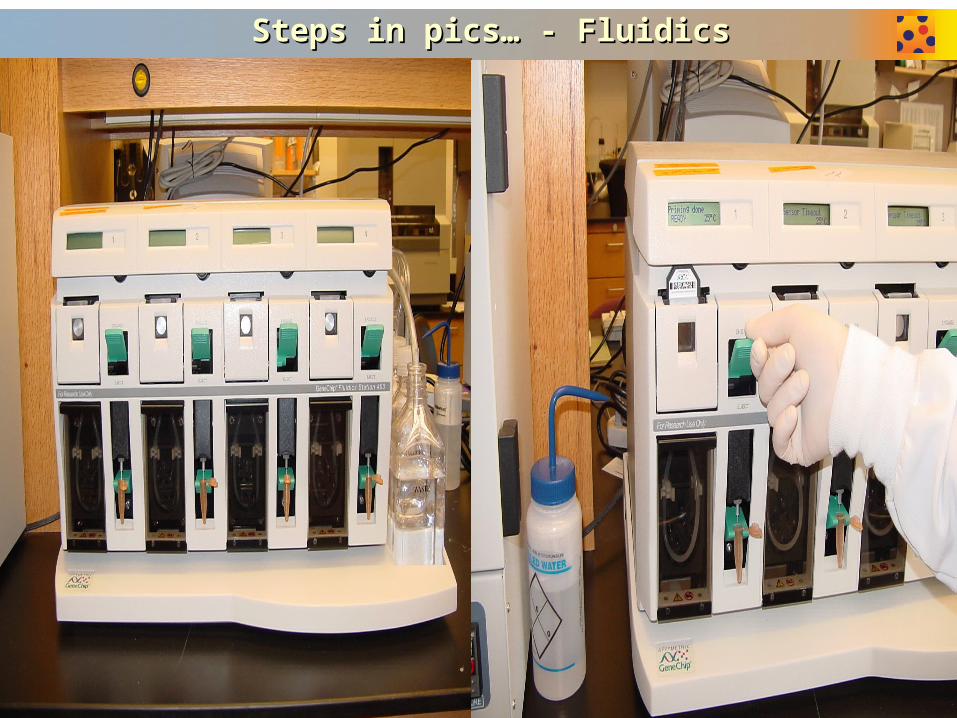
Steps in pics… - FluidicsSteps in pics… - Fluidics
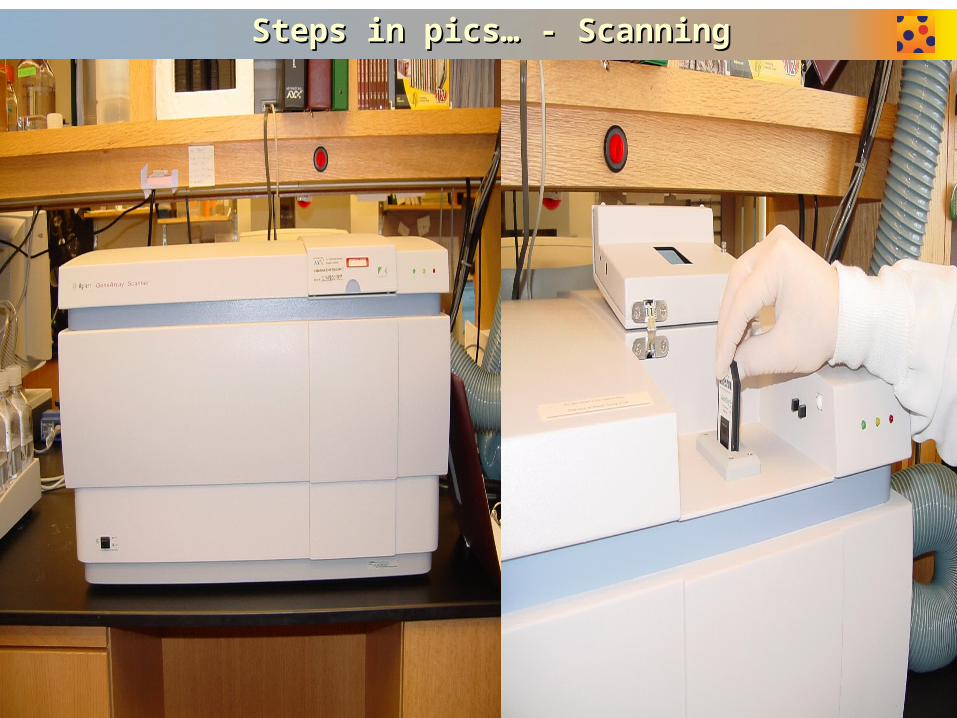
Steps in pics… - ScanningSteps in pics… - Scanning
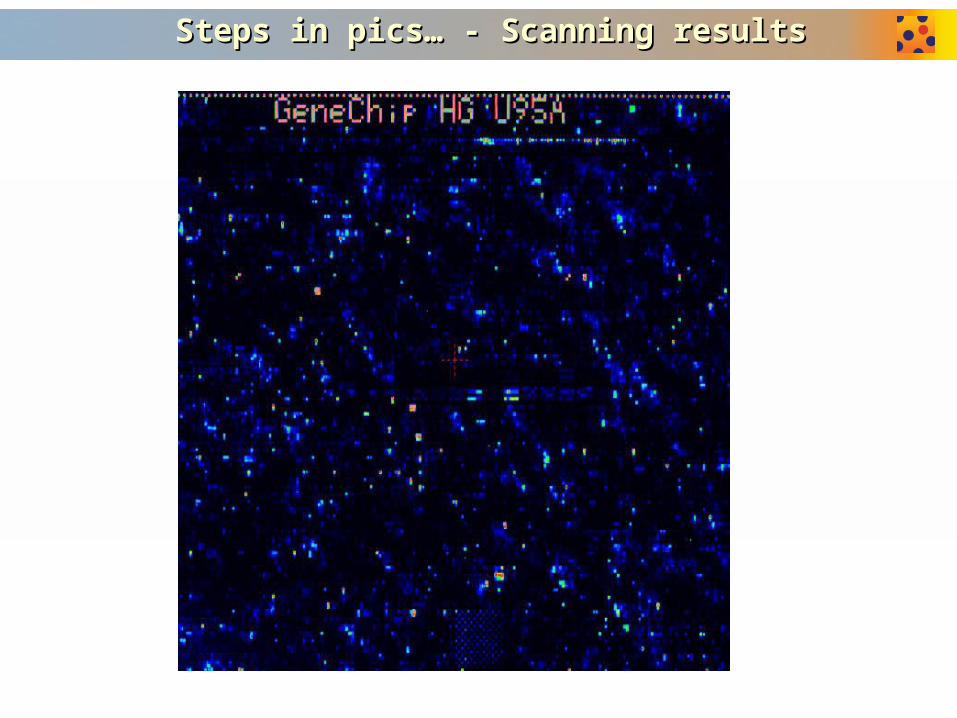
Steps in pics… - Scanning resultsSteps in pics… - Scanning results
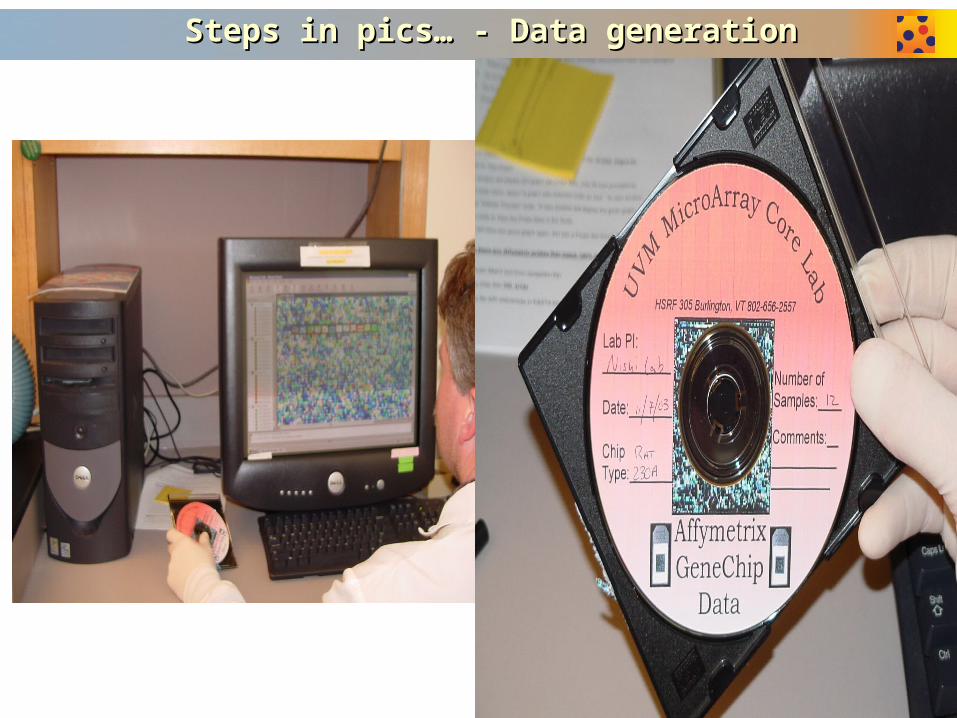
Steps in pics… - Data generationSteps in pics… - Data generation

Affymetrix Movie

cDNA or spotted chipscDNA or spotted chips
Spotted chips Movie

Spotted chip…Spotted chip…
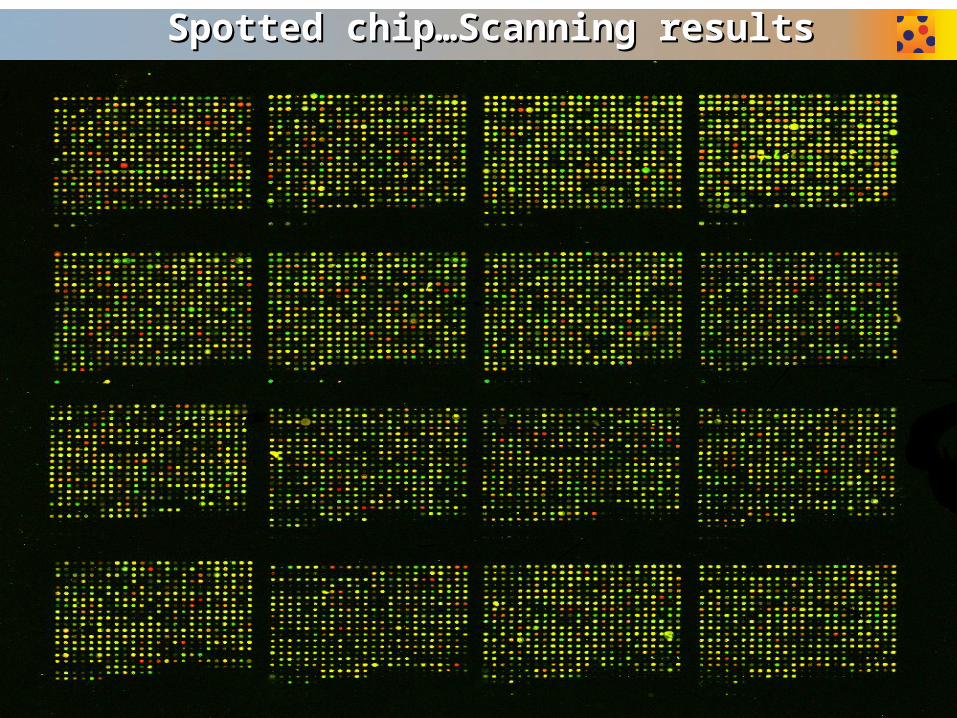
Spotted chip…Scanning resultsSpotted chip…Scanning results
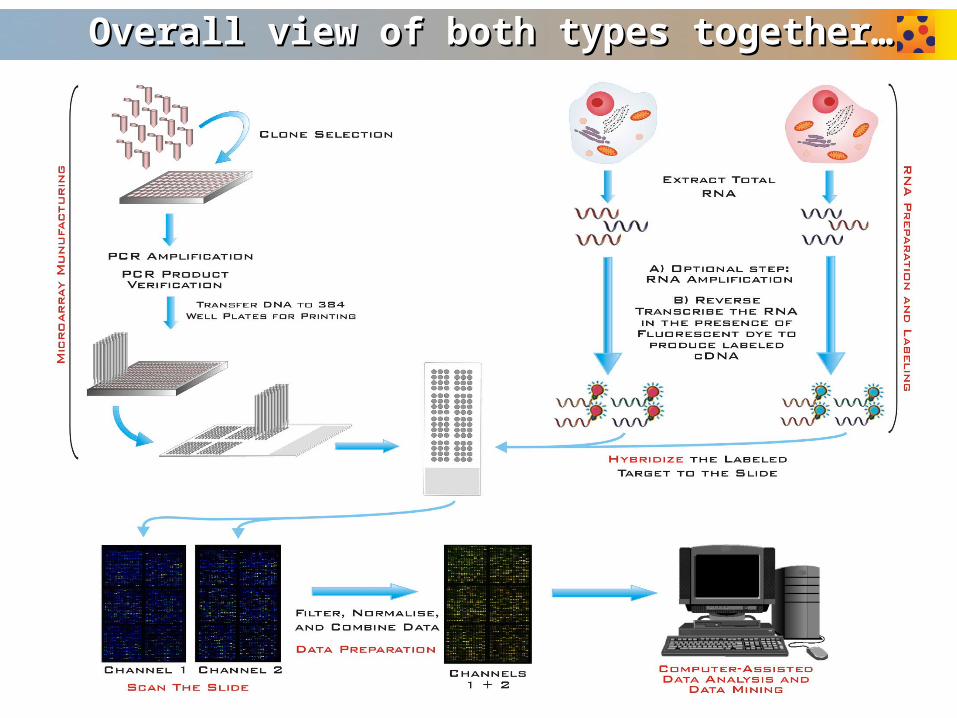
Overall view of both types together…Overall view of both types together…
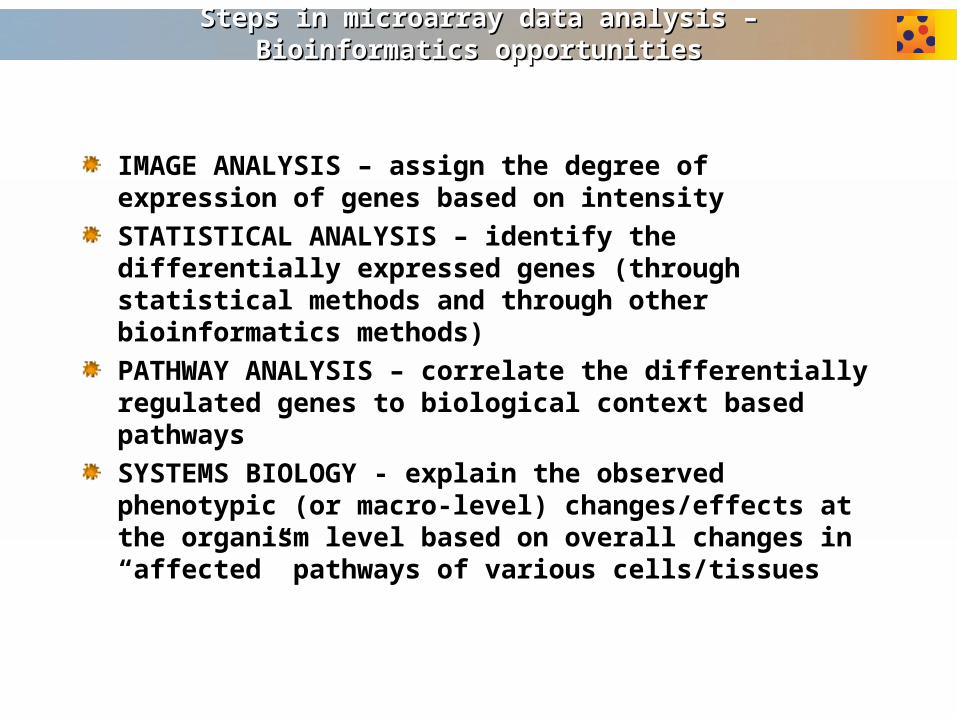
Steps in microarray data analysis – Bioinformatics Steps in microarray data analysis – Bioinformatics opportunitiesopportunities
IMAGE ANALYSIS – assign the degree of expression of genes based on intensity
STATISTICAL ANALYSIS – identify the differentially expressed genes (through statistical methods and through other bioinformatics methods)
PATHWAY ANALYSIS – correlate the differentially regulated genes to biological context based pathways
SYSTEMS BIOLOGY - explain the observed phenotypic (or macro-level) changes/effects at the organism level based on overall changes in “affected” pathways of various cells/tissues

From probe level signals to gene abundance estimatesFrom probe level signals to gene abundance estimates
The job of the expression summary algorithm is to take a set of Perfect Match (PM) and Mis-Match (MM) probes, and use these to generate a single value representing the estimated amount of transcript in solution, as measured by that probeset.
To do this, .DAT files containing array images are first processed to produce a .CEL file, which contains measured intensities for each probe on the array.
It is the .CEL files that are analysed by the expression calling algorithm.

Gene A Over-expressed in normal tissue
Gene B Over-expressed in tumour
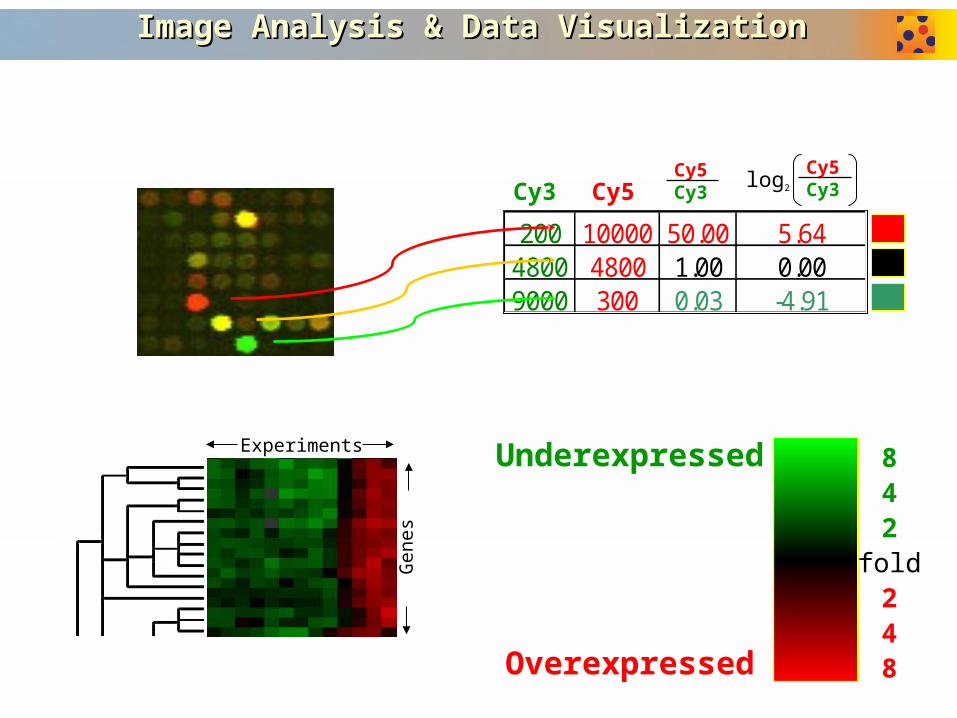
200 10000 50.00 5.644800 4800 1.00 0.009000 300 0.03 -4.91
Cy3 Cy5Cy5Cy3
Cy5Cy3log2
Gen
es
Experiments842
fold248
Underexpressed
Overexpressed
Image Analysis & Data VisualizationImage Analysis & Data Visualization
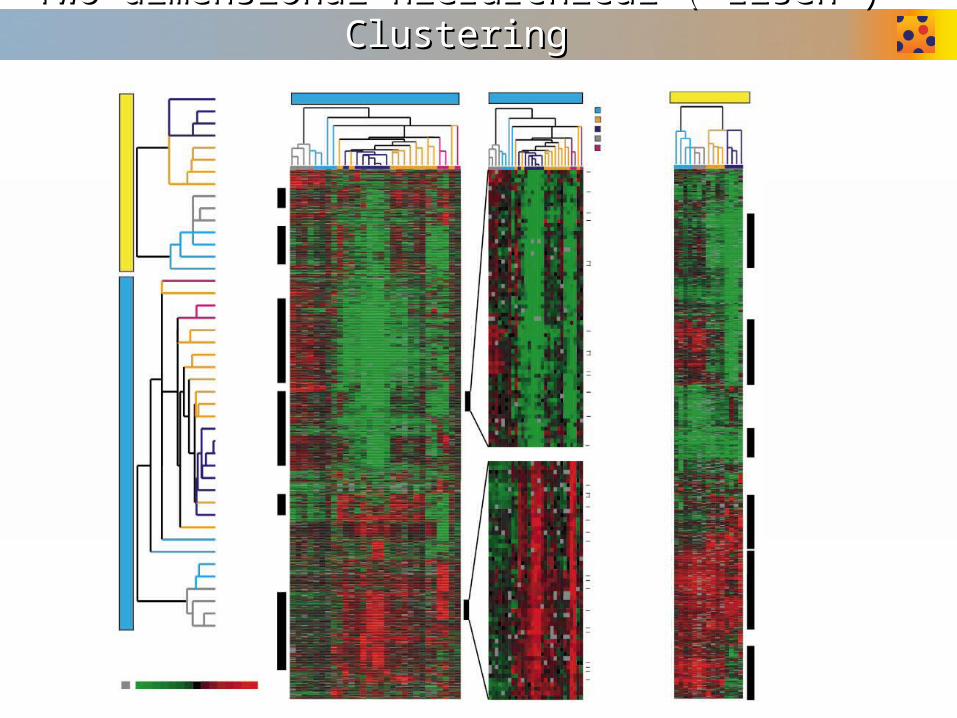
Two dimensional hierarchical (“Eisen”) ClusteringTwo dimensional hierarchical (“Eisen”) Clustering

1. Experimental Design
2. Image Analysis – raw data
3. Normalization – “clean” data
4. Data Filtering – informative data
5. Model building
6. Data Mining (clustering, pattern recognition, et al)
7. Validation
Microarray Data Process

Statistical Data Pre-processingStatistical Data Pre-processing
Filtering Background subtraction Low intensity spotsSaturated spots Low quality spots (ghost spots, dust spots etc)
NormalizationHousekeeping genes/ control genes

Data to information…..Data to information…..

Molecular Function = elemental activity/task
the tasks performed by individual gene products; examples are carbohydrate binding and ATPase activity
Biological Process = biological goal or objective
broad biological goals, such as mitosis or purine metabolism, that are accomplished by ordered assemblies of molecular functions
Cellular Component = location or complex
subcellular structures, locations, and macromolecular complexes; examples include nucleus, telomere, and RNA polymerase II holoenzyme
The 3 The 3 GGene ene OOntologiesntologies

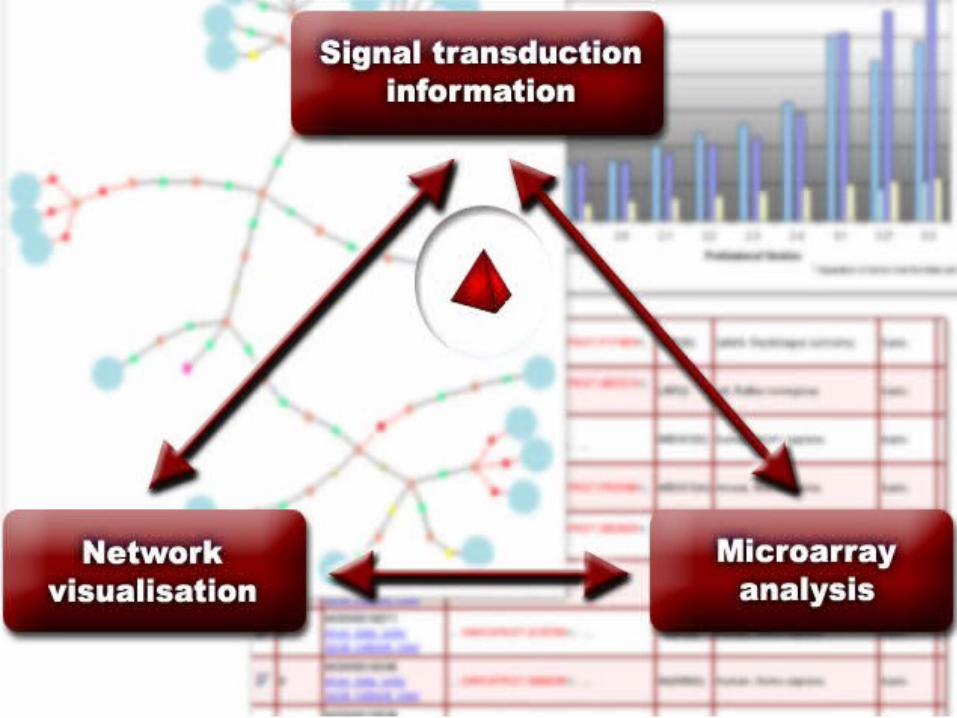
Pathway KnowledgebasePathway Knowledgebase
Tagging of gene expression data (from Microarray, SAGE, etc) onto the simple clickable pathway maps.
In-silico manipulation of pathways – ie predict the alterations in expression levels in any given tissue or disease conditions
Ease target prioritization


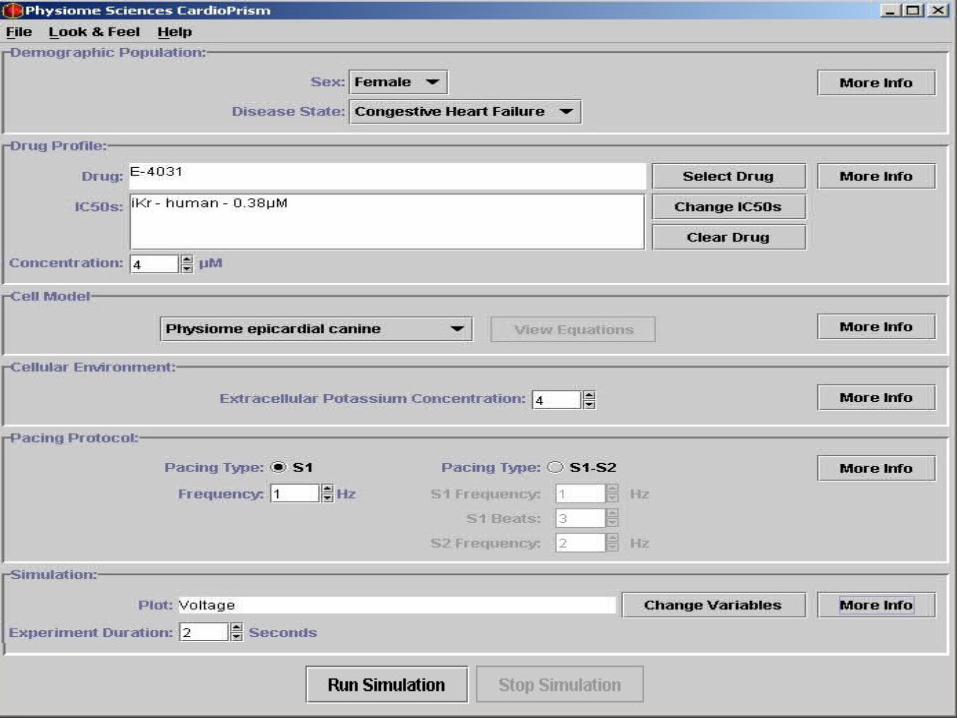


Systems Biology…..the holy grail..Systems Biology…..the holy grail..
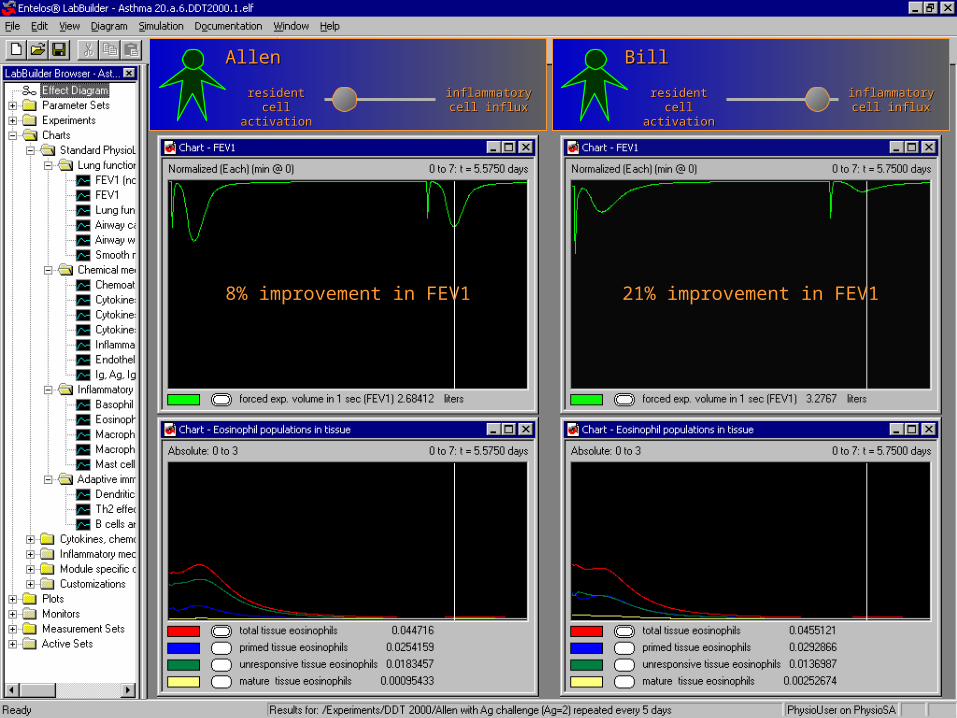
AllenAllen
resident cell resident cell activationactivation
inflammatory inflammatory cell influxcell influx
BillBill
resident cell resident cell activationactivation
inflammatory inflammatory cell influxcell influx
8% improvement in FEV1 21% improvement in FEV1
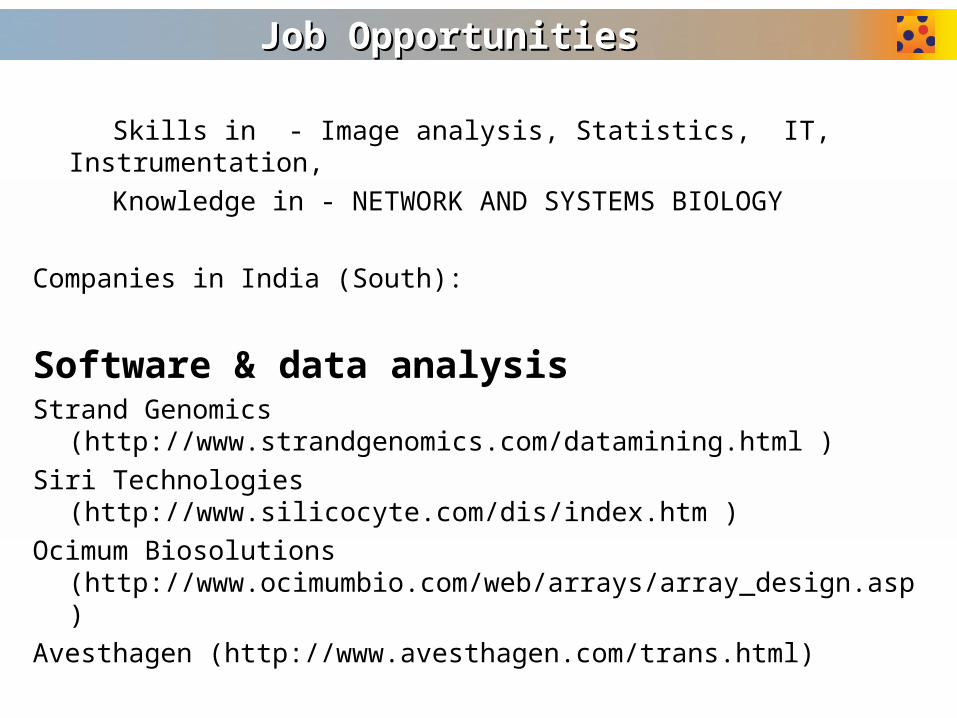
Job OpportunitiesJob Opportunities
Skills in - Image analysis, Statistics, IT, Instrumentation,
Knowledge in - NETWORK AND SYSTEMS BIOLOGY
Companies in India (South):
Software & data analysisStrand Genomics (http://www.strandgenomics.com/datamining.html )
Siri Technologies (http://www.silicocyte.com/dis/index.htm )
Ocimum Biosolutions (http://www.ocimumbio.com/web/arrays/array_design.asp )
Avesthagen (http://www.avesthagen.com/trans.html)
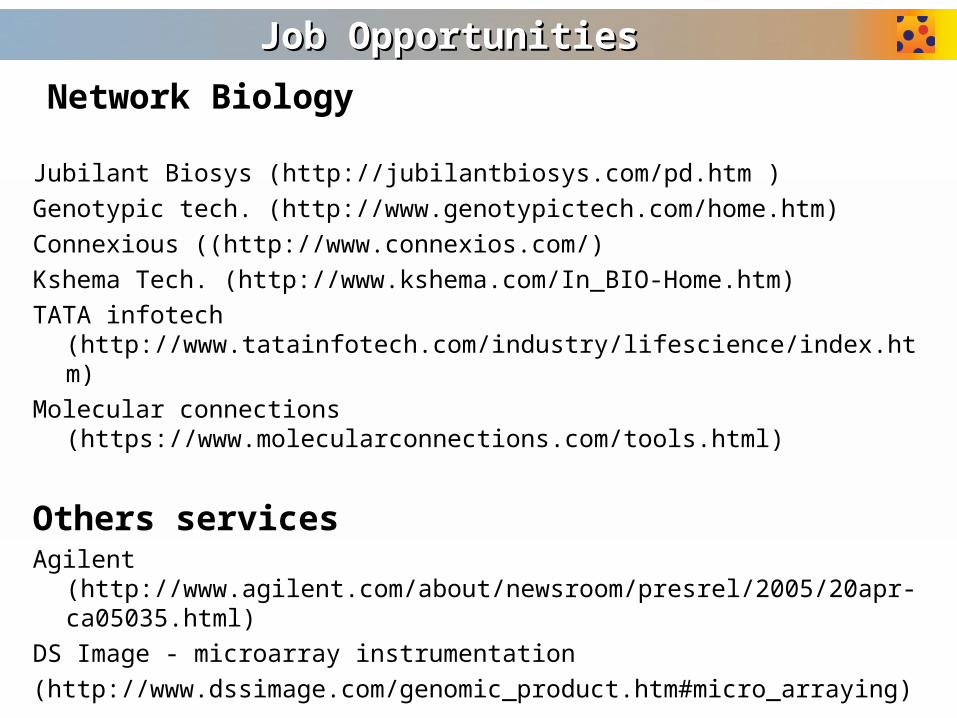
Job OpportunitiesJob Opportunities
Network Biology
Jubilant Biosys (http://jubilantbiosys.com/pd.htm )
Genotypic tech. (http://www.genotypictech.com/home.htm)
Connexious ((http://www.connexios.com/)
Kshema Tech. (http://www.kshema.com/In_BIO-Home.htm)
TATA infotech (http://www.tatainfotech.com/industry/lifescience/index.htm)
Molecular connections (https://www.molecularconnections.com/tools.html)
Others servicesAgilent (http://www.agilent.com/about/newsroom/presrel/2005/20apr-
ca05035.html)
DS Image - microarray instrumentation
(http://www.dssimage.com/genomic_product.htm#micro_arraying)

The Future of DNA chips….The Future of DNA chips….
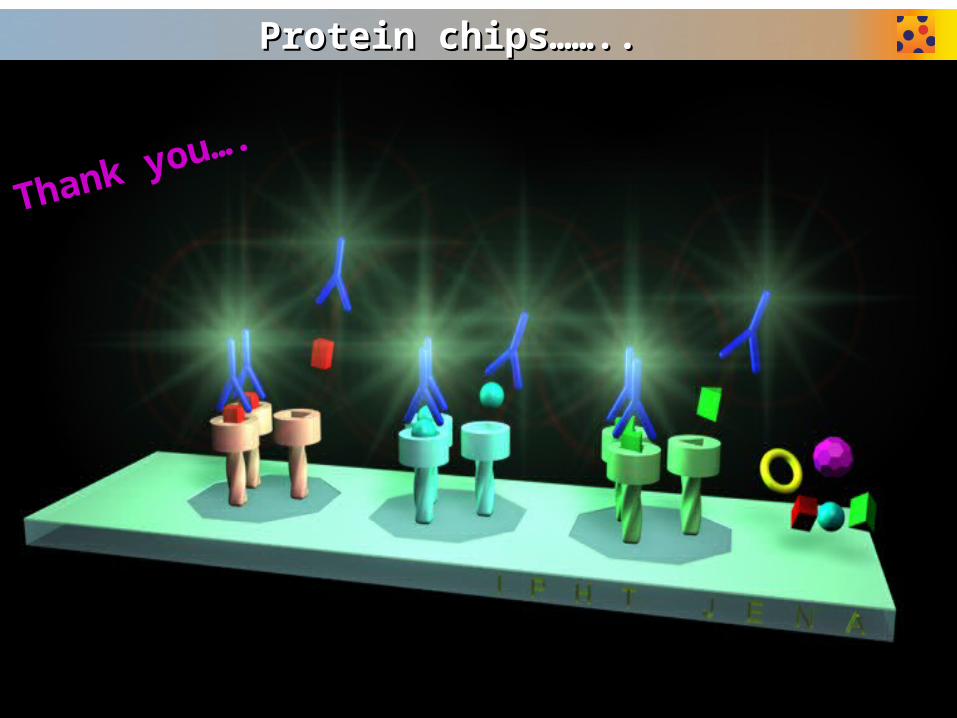
Protein chips……..Protein chips……..
Thank you….