
Evolutionary Design of Human-Robot Interfaces for Teaming
174
Sapienza - Universit` a di Roma Dipartimento di Informatica e Sistemistica ”Antonio Ruberti” Universidad Polit´ ecnica de Madrid Departamento de Autom´atica, Ingenier´ ıa Electr´onica e Inform´atica Industrial Evolutionary Design of Human-Robot Interfaces for Teaming Humans and Mobile Robots in Exploration Missions Alberto Valero G´omez Doctoral Thesis in Computer Engineering, Advisors: Prof. Fernando Mat´ ıa Espada Prof. Daniele Nardi Supervisor: Prof. Tiziana Catarci External Reviewers: Prof. Stefano Carpin Prof. Nicholas Roy
Transcript of Evolutionary Design of Human-Robot Interfaces for Teaming

Sapienza - Universita di RomaDipartimento di Informatica e Sistemistica ”Antonio Ruberti”
Universidad Politecnica de MadridDepartamento de Automatica, Ingenierıa Electronica e Informatica Industrial
Evolutionary Design of Human-RobotInterfaces for Teaming Humans and
Mobile Robots in Exploration Missions
Alberto Valero Gomez
Doctoral Thesis in Computer Engineering,
Advisors:Prof. Fernando Matıa Espada
Prof. Daniele Nardi
Supervisor:Prof. Tiziana Catarci
External Reviewers:Prof. Stefano CarpinProf. Nicholas Roy


A great adventureshared with great people.

Contents
1 Introduction 21.1 Motive and Problem Statement . . . . . . . . . . . . . . . . . . . . . 21.2 Preliminary Note . . . . . . . . . . . . . . . . . . . . . . . . . . . . . 41.3 Document organization . . . . . . . . . . . . . . . . . . . . . . . . . . 51.4 Contributions . . . . . . . . . . . . . . . . . . . . . . . . . . . . . . . 7
2 Background 82.1 Humans and Automation . . . . . . . . . . . . . . . . . . . . . . . . . 8
2.1.1 From Ergonomy to Human-Robot Interaction . . . . . . . . . 92.1.2 Automation Critical Issues . . . . . . . . . . . . . . . . . . . . 11
2.2 Human-Robot Interaction . . . . . . . . . . . . . . . . . . . . . . . . 122.2.1 Definition . . . . . . . . . . . . . . . . . . . . . . . . . . . . . 122.2.2 Human-Robot Interaction Taxonomies . . . . . . . . . . . . . 132.2.3 Human-Robot Interaction Metrics . . . . . . . . . . . . . . . . 17
2.3 HRI in Search and Exploration Robotics . . . . . . . . . . . . . . . . 192.3.1 Situational Awareness . . . . . . . . . . . . . . . . . . . . . . 192.3.2 Measurement of Situation Awareness . . . . . . . . . . . . . . 20
2.4 Research Methodology . . . . . . . . . . . . . . . . . . . . . . . . . . 222.4.1 System Evaluation . . . . . . . . . . . . . . . . . . . . . . . . 222.4.2 Data Analysis . . . . . . . . . . . . . . . . . . . . . . . . . . . 23
3 Providing Situational Awareness 273.1 Introduction . . . . . . . . . . . . . . . . . . . . . . . . . . . . . . . . 273.2 Related Work . . . . . . . . . . . . . . . . . . . . . . . . . . . . . . . 27
3.2.1 Desktop Interfaces . . . . . . . . . . . . . . . . . . . . . . . . 293.2.2 PDA Interfaces . . . . . . . . . . . . . . . . . . . . . . . . . . 33
3.3 Interface Version 1 . . . . . . . . . . . . . . . . . . . . . . . . . . . . 353.3.1 Desktop Interface . . . . . . . . . . . . . . . . . . . . . . . . . 363.3.2 PDA Interface . . . . . . . . . . . . . . . . . . . . . . . . . . . 40
3.4 Interface Evaluation . . . . . . . . . . . . . . . . . . . . . . . . . . . 423.4.1 Experiment Design and Procedure . . . . . . . . . . . . . . . . 423.4.2 Desktop Interface . . . . . . . . . . . . . . . . . . . . . . . . . 433.4.3 PDA Interface . . . . . . . . . . . . . . . . . . . . . . . . . . . 473.4.4 Usability Heuristics . . . . . . . . . . . . . . . . . . . . . . . . 48
3.5 Interface EvolutionVersion 2 . . . . . . . . . . . . . . . . . . . . . . . . . . . . . . . . . . 48

CONTENTS CONTENTS
3.5.1 Desktop Interface . . . . . . . . . . . . . . . . . . . . . . . . . 503.5.2 PDA Interface . . . . . . . . . . . . . . . . . . . . . . . . . . . 52
3.6 Conclusions . . . . . . . . . . . . . . . . . . . . . . . . . . . . . . . . 55
4 Designing for Multi-robot Missions (I)Initial Exploration. 574.1 Introduction . . . . . . . . . . . . . . . . . . . . . . . . . . . . . . . . 574.2 Related Work . . . . . . . . . . . . . . . . . . . . . . . . . . . . . . . 59
4.2.1 Autonomy Levels and Autonomy Adjustment . . . . . . . . . 594.2.2 Types of Control in Automated Systems . . . . . . . . . . . . 62
4.3 Interface Version 2.Operation Modes . . . . . . . . . . . . . . . . . . . . . . . . . . . . . 64
4.4 Interface Evaluation . . . . . . . . . . . . . . . . . . . . . . . . . . . 694.4.1 Experiment Design and Procedure . . . . . . . . . . . . . . . . 694.4.2 Data analysis . . . . . . . . . . . . . . . . . . . . . . . . . . . 694.4.3 Questionnaires . . . . . . . . . . . . . . . . . . . . . . . . . . 784.4.4 Discussion . . . . . . . . . . . . . . . . . . . . . . . . . . . . . 82
4.5 Conclusions . . . . . . . . . . . . . . . . . . . . . . . . . . . . . . . . 85
5 Designing for Multi-robot Missions (II)Improving the Autonomy Management. 865.1 Introduction . . . . . . . . . . . . . . . . . . . . . . . . . . . . . . . . 865.2 Interface Version 3 . . . . . . . . . . . . . . . . . . . . . . . . . . . . 87
5.2.1 Design evolution . . . . . . . . . . . . . . . . . . . . . . . . . 875.2.2 Operation Modes Evolution . . . . . . . . . . . . . . . . . . . 88
5.3 Interface Evaluation . . . . . . . . . . . . . . . . . . . . . . . . . . . 955.3.1 Experiment Design and Procedure . . . . . . . . . . . . . . . . 955.3.2 Data analysis . . . . . . . . . . . . . . . . . . . . . . . . . . . 975.3.3 Questionnaires . . . . . . . . . . . . . . . . . . . . . . . . . . 1025.3.4 Discussion . . . . . . . . . . . . . . . . . . . . . . . . . . . . . 103
5.4 Interface Version 4 . . . . . . . . . . . . . . . . . . . . . . . . . . . . 1045.4.1 Enhancing the Autonomy Mode . . . . . . . . . . . . . . . . . 1055.4.2 Motion Planner Layer . . . . . . . . . . . . . . . . . . . . . . 108
5.5 Conclusions . . . . . . . . . . . . . . . . . . . . . . . . . . . . . . . . 109
6 Experimental comparison betweenthe PDA and the Desktop Interfaces 1116.1 Introduction . . . . . . . . . . . . . . . . . . . . . . . . . . . . . . . . 1116.2 Situational Awareness and Spatial Cognition . . . . . . . . . . . . . . 1126.3 Initial Experiment . . . . . . . . . . . . . . . . . . . . . . . . . . . . 113
6.3.1 Experiment Design and Procedure . . . . . . . . . . . . . . . . 1136.3.2 Data Analysis . . . . . . . . . . . . . . . . . . . . . . . . . . . 1146.3.3 Discussion . . . . . . . . . . . . . . . . . . . . . . . . . . . . . 116
6.4 Second Experiment . . . . . . . . . . . . . . . . . . . . . . . . . . . . 1166.4.1 Experiment Design and Procedure . . . . . . . . . . . . . . . . 1176.4.2 Preliminary Hypothesis . . . . . . . . . . . . . . . . . . . . . . 1176.4.3 Data Analysis . . . . . . . . . . . . . . . . . . . . . . . . . . . 118
iii

CONTENTS CONTENTS
6.4.4 Discussion . . . . . . . . . . . . . . . . . . . . . . . . . . . . . 1226.5 Conclusions . . . . . . . . . . . . . . . . . . . . . . . . . . . . . . . . 123
7 Conclusions 1257.1 Introduction . . . . . . . . . . . . . . . . . . . . . . . . . . . . . . . . 1257.2 Interface Evolution . . . . . . . . . . . . . . . . . . . . . . . . . . . . 126
7.2.1 Interface Version 1 . . . . . . . . . . . . . . . . . . . . . . . . 1267.2.2 Interface Version 2 . . . . . . . . . . . . . . . . . . . . . . . . 1267.2.3 Interface Version 3 . . . . . . . . . . . . . . . . . . . . . . . . 1297.2.4 Interface Version 4 . . . . . . . . . . . . . . . . . . . . . . . . 1307.2.5 Interfaces Comparison . . . . . . . . . . . . . . . . . . . . . . 131
7.3 Further Work . . . . . . . . . . . . . . . . . . . . . . . . . . . . . . . 1317.4 Final Note . . . . . . . . . . . . . . . . . . . . . . . . . . . . . . . . . 133
A The Robotic System 134A.1 Robotic Platforms . . . . . . . . . . . . . . . . . . . . . . . . . . . . 134
A.1.1 Rotolotto: Pioneer 2AT Robot . . . . . . . . . . . . . . . . . . 134A.1.2 Nemo: Pioneer 3AT Robot . . . . . . . . . . . . . . . . . . . . 135
A.2 Development Framework . . . . . . . . . . . . . . . . . . . . . . . . . 135A.2.1 Robotic Simulators: Player/Stage and USARSim . . . . . . . 135A.2.2 OpenRDK . . . . . . . . . . . . . . . . . . . . . . . . . . . . . 137
A.3 Navigation System . . . . . . . . . . . . . . . . . . . . . . . . . . . . 139A.3.1 Exploration Layer . . . . . . . . . . . . . . . . . . . . . . . . . 140A.3.2 Path Planning and Motion Layers . . . . . . . . . . . . . . . . 141A.3.3 Safe Motion Layer and Robot Interface Layers . . . . . . . . . 141
A.4 Localization and Mapping . . . . . . . . . . . . . . . . . . . . . . . . 142A.4.1 2D Localization and Mapping . . . . . . . . . . . . . . . . . . 142A.4.2 3D Mapping and Ground Detection . . . . . . . . . . . . . . . 143
A.5 Application taxonomy . . . . . . . . . . . . . . . . . . . . . . . . . . 143
B ANOVA 147B.1 One-Way ANOVA . . . . . . . . . . . . . . . . . . . . . . . . . . . . . 147B.2 Two-Way ANOVA . . . . . . . . . . . . . . . . . . . . . . . . . . . . 148
C Questionnaire I 151
D Questionnaire II 155
iv

List of Figures
2.1 Taxonomy of human-robot ratio and their coordination. . . . . . . . . 152.2 Autonomy Levels . . . . . . . . . . . . . . . . . . . . . . . . . . . . . 17
3.1 Idaho National Lab Interfaces [7] . . . . . . . . . . . . . . . . . . . . 303.2 Different perspectives of a 3d map-centred interface [47] . . . . . . . 313.3 UMass-Lowell Interfaces [77] . . . . . . . . . . . . . . . . . . . . . . . 323.4 EECS Department, Vanderbilt University PDA interface [3] . . . . . 343.5 Desktop Interface v.1 showing laser readings on 3D view . . . . . . . 363.6 Desktop Interface v.1 showing map on 3D view . . . . . . . . . . . . 373.7 PDA Interface. . . . . . . . . . . . . . . . . . . . . . . . . . . . . . . 413.8 Distribution of Operation Modalities. Single Robot . . . . . . . . . . 463.9 Distribution of Operation Modalities. Two Robots . . . . . . . . . . . 463.10 Desktop Interface. Version v.2 . . . . . . . . . . . . . . . . . . . . . . 513.11 PDA Interface v.2. Laser/Sonar View . . . . . . . . . . . . . . . . . . 533.12 PDA Interface v.2. Map View . . . . . . . . . . . . . . . . . . . . . . 54
4.1 Effect of operator neglect over system performance . . . . . . . . . . 614.2 Shared Control Operation Mode . . . . . . . . . . . . . . . . . . . . . 664.3 Speed control in interface version 1 . . . . . . . . . . . . . . . . . . . 664.4 Speed control in interface version 2 . . . . . . . . . . . . . . . . . . . 674.5 Speed limit in interface version 2 . . . . . . . . . . . . . . . . . . . . 684.6 Autonomy Adjustment State Machine . . . . . . . . . . . . . . . . . . 684.7 Indoor Scenario used in the Experiments . . . . . . . . . . . . . . . . 704.8 Outdoor Scenario used in the Experiments . . . . . . . . . . . . . . . 704.9 Interactions and 90% Bonferroni Intervals, dependent variable log(Area/Total
time) . . . . . . . . . . . . . . . . . . . . . . . . . . . . . . . . . . . . 724.10 Time Distribution of Operation Modes for the Indoor Environment . 744.11 Time Distribution of Operation Modes for the Outdoor Environment 754.12 sqrt(Y 1). Main effect Number of Robots. Means and 95% Bonfer-
roni intervals. . . . . . . . . . . . . . . . . . . . . . . . . . . . . . . . 764.13 log(Y 4). Main effect number of robots. Means and 95% Bonferroni
intervals. . . . . . . . . . . . . . . . . . . . . . . . . . . . . . . . . . . 774.14 log(Y 5). Main effect number of robots. Means and 95% Bonferroni
intervals. . . . . . . . . . . . . . . . . . . . . . . . . . . . . . . . . . . 784.15 Preferred Number of Robots. X Axis: Scenario, Number of Robots
Controlled, Preferred Number of Robots . . . . . . . . . . . . . . . . 794.16 Operation Mode Scoring . . . . . . . . . . . . . . . . . . . . . . . . . 82

LIST OF FIGURES LIST OF FIGURES
5.1 Interface with Sonar Readings (green) and Laser Readings (red) . . . 895.2 Interface with the 3D Map . . . . . . . . . . . . . . . . . . . . . . . . 895.3 Different Display Angles of the Video Feed-back . . . . . . . . . . . . 905.4 Interface with the 3D View Display . . . . . . . . . . . . . . . . . . . 915.5 Shared Mode. Operator sets a path . . . . . . . . . . . . . . . . . . . 935.6 Shared Mode. Operator sets robot speed . . . . . . . . . . . . . . . . 945.7 Desktop Interface - Shared Mode Commands . . . . . . . . . . . . . . 965.8 PDA Interface - Shared Mode Commands . . . . . . . . . . . . . . . 975.9 Explored Area - Confidence Intervals (95 %) . . . . . . . . . . . . . . 995.10 Time Distribution of Operation Modes . . . . . . . . . . . . . . . . . 1005.11 Stop in Tele-Operation - Confidence Intervals (95 %) . . . . . . . . . 1015.12 Stop in Shared Control - Confidence Intervals (95 %) . . . . . . . . . 1015.13 GUI with compulsory areas (green border square and robot color)
and forbidden regions (red border squares and robot color) . . . . . . 1065.14 GUI with Preferred Directions . . . . . . . . . . . . . . . . . . . . . . 1085.15 Path adjustment made by the Motion Planner . . . . . . . . . . . . . 109
6.1 The P2AT robot in the outdoor area during one of the experimentalruns . . . . . . . . . . . . . . . . . . . . . . . . . . . . . . . . . . . . 113
6.2 Area covered in square meters by the operator using the PDA (lowercurve) and the operator using the desktop-interface (upper curve) . . 115
6.3 Completion times - Confidence Intervals (95 %) . . . . . . . . . . . . 1166.4 Operator guiding the robot with the PDA interface. The operator is
trying to see the robot through a window of the building . . . . . . . 117
7.1 Desktop Interface Evolution . . . . . . . . . . . . . . . . . . . . . . . 1277.2 PDA Interface Evolution . . . . . . . . . . . . . . . . . . . . . . . . . 1287.3 GUI with quad-rotor . . . . . . . . . . . . . . . . . . . . . . . . . . . 132
A.1 Real and Simulated Rotolotto . . . . . . . . . . . . . . . . . . . . . . 135A.2 Real and Simulated Nemo . . . . . . . . . . . . . . . . . . . . . . . . 136A.3 Simulated ATRVJr3D robot. . . . . . . . . . . . . . . . . . . . . . . . 137A.4 RDK Agent Example . . . . . . . . . . . . . . . . . . . . . . . . . . . 139A.5 System Architecture . . . . . . . . . . . . . . . . . . . . . . . . . . . 140A.6 Exploration Layer . . . . . . . . . . . . . . . . . . . . . . . . . . . . . 141A.7 Path Planning Layer . . . . . . . . . . . . . . . . . . . . . . . . . . . 142A.8 Motion Layer . . . . . . . . . . . . . . . . . . . . . . . . . . . . . . . 143A.9 3D map obtained with the simulated Nemo Robot on USARSim . . . 144
vi

List of Tables
2.1 HRI taxonomies (Taxonomy categories and values got from [72]) . . . 142.2 Common Metrics for Human-Robot Interaction . . . . . . . . . . . . 18
3.1 Adapted Nielsen Heuristics . . . . . . . . . . . . . . . . . . . . . . . . 49
4.1 Explored Area . . . . . . . . . . . . . . . . . . . . . . . . . . . . . . . 714.2 ANOVA for log(AREA/TOTAL TIME) . . . . . . . . . . . . . . . . 724.3 Time Distribution of Operation Modes for the Indoor Environment . 734.4 Time Distribution of Operation Modes for the Outdoor Environment 734.5 Simultaneous operation of all the robots of a the team . . . . . . . . 744.6 ANOVA for sqrt(total time in which the robots are operating simul-
taneously). . . . . . . . . . . . . . . . . . . . . . . . . . . . . . . . . . 754.7 ANOVA for log(stop time autonomy/total autonomy time ). . . . . . 774.8 ANOVA for log(stop time shared/total shared) . . . . . . . . . . . . . 774.9 ANOVA for log(stop time tele-operation/total tele-operated) . . . . . 784.10 Preferred Number of Robots . . . . . . . . . . . . . . . . . . . . . . . 794.11 Preferred View . . . . . . . . . . . . . . . . . . . . . . . . . . . . . . 804.12 View Scoring (1-Worst; 5-Best) . . . . . . . . . . . . . . . . . . . . . 814.13 Operation Mode Scoring . . . . . . . . . . . . . . . . . . . . . . . . . 82
5.1 Explored Area (square meters) . . . . . . . . . . . . . . . . . . . . . . 985.2 Explored Area - ANOVA . . . . . . . . . . . . . . . . . . . . . . . . . 985.3 Time Distribution of Operation Modes . . . . . . . . . . . . . . . . . 995.4 Stop Condition . . . . . . . . . . . . . . . . . . . . . . . . . . . . . . 1005.5 Tele Operation Stop Condition - ANOVA . . . . . . . . . . . . . . . . 1015.6 Shared Control Stop Condition - ANOVA . . . . . . . . . . . . . . . 1015.7 Preferred Number of Robots . . . . . . . . . . . . . . . . . . . . . . . 1025.8 Operation Mode Scoring . . . . . . . . . . . . . . . . . . . . . . . . . 1025.9 Preferred Shared Mode Commanding Method . . . . . . . . . . . . . 103
6.1 Completion Time in Seconds . . . . . . . . . . . . . . . . . . . . . . . 1156.2 Navigation Time - ANOVA . . . . . . . . . . . . . . . . . . . . . . . 1156.3 Completion Times - Outdoor Scenario . . . . . . . . . . . . . . . . . 1186.4 Completion Times - Indoor Scenario . . . . . . . . . . . . . . . . . . 1206.5 Navigation Time - Outdoor - ANOVA . . . . . . . . . . . . . . . . . . 1206.6 Navigation Time - Maze - Outdoor - ANOVA . . . . . . . . . . . . . 1216.7 Navigation Time - Narrow Space - Outdoor - ANOVA . . . . . . . . . 121

LIST OF TABLES LIST OF TABLES
6.8 Navigation Time - Clusters - Outdoor - ANOVA . . . . . . . . . . . . 1216.9 Navigation Time - Narrow Space - Outdoor - ANOVA . . . . . . . . . 1216.10 Navigation Time - Maze - Indoor - ANOVA . . . . . . . . . . . . . . 1226.11 Navigation Time - Narrow Space - Indoor - ANOVA . . . . . . . . . . 1226.12 Navigation Time - Clusters - Indoor - ANOVA . . . . . . . . . . . . . 1226.13 Best performing operator depending on the interface, task, and visibility123
A.1 Application taxonomies . . . . . . . . . . . . . . . . . . . . . . . . . . 144A.2 Provided sensory data . . . . . . . . . . . . . . . . . . . . . . . . . . 145A.3 Provided sensory data . . . . . . . . . . . . . . . . . . . . . . . . . . 146
B.1 One-Way ANOVA Table . . . . . . . . . . . . . . . . . . . . . . . . . 148B.2 Two-Way ANOVA Table . . . . . . . . . . . . . . . . . . . . . . . . . 150
viii

Abstract
Mobile robots are increasingly becoming an aid to humans in accomplishing dan-gerous tasks. Examples of such tasks include search and rescue missions, militarymissions, surveillance, scheduled operations (such as checking the reactor of a nuclearplant for radiation), and so forth. The advantage of using robots in such situations isthat they accomplish highrisk tasks without exposing humans to danger: robots gowhere humans fear to tread. Teaming humans and robots requires a Human-RobotInteraction (HRI) system. The purpose of such a system is to permit humans androbots to cooperate in order to accomplish cognitively demanding tasks within aspectrum of possibilities ranging between full autonomy and full teleoperation. Agood HRI system should improve the accomplishment level of a task by drawing onthe capabilities of both the artificial and the human agent. To this end, the opera-tors should be able to control and/or supervise the operations of the robots througha Graphical User Interface (GUI). The GUI should provide these operators withthe Situational Awareness (SA) and command capabilities required for an effectiveoperation.
A commonly accepted definition of SA in connection with HRI is ”the under-standing that the human has of the location, activities, status, and surroundings ofthe robot”. Two aspects of SA are important for a GUI design: location awareness,defined as a map-based concept allowing the user to locate the robot in the scenario,and surroundings awareness, which pertains to obstacle avoidance and allows theuser to recognize the immediate surroundings of the robot. Spatial Cognition stud-ies have shown that a navigator (in our case, the remote operator) having access toboth of the above-mentioned perspectives exhibits more accurate performance.
Clearly, when the operator is not physically in the navigation scenario, the inter-face must enhance his spatial cognitive abilities by offering multilevel informationabout the environment (route and survey knowledge). Complex interfaces can pro-vide different perspectives on the environment (a bird’s eye view or a first-personview). Such information allows an operator looking at a GUI to have access to morethan one perspective at the same time. Contrarily, if the operator is in the scenario,part of the information can be acquired by direct observation, depending on the vis-ibility the operator has. In such situations less information is required in the GUI.These spatial cognitive aspects should be taken in consideration when designing ahuman-robot interface for remote teleoperation.
The command capabilites are the means used by the operator to direct theactions of the robot, from a full tele-operated system to a fully autonomous one.The interaction system must offer the operator a set of commands and autonomylevels that matches his abilities and the requirements of the task. The granularity

of the autonomy spectrum must fit both requirements, it should not overload theoperator with too much knwoledge of the robot and task, but at the same time itshould allow him to make all the operations needed for a correct operation of therobot.
The research reported in this dissertation concerns the design, implementation,and experimental evaluation of two GUIs, one for stationary remote operators, im-plemented for a PC computer, and the other for roving operators, implemented forhandheld devices. Both GUIs were designed taking account of the aspects commonto both Human-Robot Interaction and and Human-Computer Interaction. As an ini-tial design, they took the GUIs present in the literature three years ago. The initialdesign, reported in this dissertaion, then evolved through experimental evaluation.Furthermore, new functionalities not present in the initial version were included inthis study: more granulated autonomy adjustment, multirobot teams, heterogenousteams (Unmanned Aerial Vehicles and Unmanned Ground Vehicles).
The main contributions of this work are:
• Design, implementation and evaluation of a PC Interface that allows one op-erator to control one robot. The lessons learnt provide a set of guidelines todesign Human-Robot interfaces in terms of providing Situational Awareness.
• Extension of such interface to the multi-robot paradigm, analysing experi-mentally how the granulation of the autonomy levels may affect the optiamaloperator-robot ratio. A way of managing the autonomy adjustment was im-plemented and evaluated, resulting in a set of autonomy levels and its man-agement.
• Design, implementation, and evaluation of an interface for hand-held devices,allowing field operators to support remote operators, improving the task per-formance. No previous experimental study of how to team mobile operatorswith stationary ones was present in the literature.
• Experimental comparison between commandig a robot using a desktop-basedinterface and a PDA-based interface; and a proposal of a transfer of controlpolicy that would dictate when control should be passed from a remote sta-tionary operator to a roving operator who can move inside the robot scenario.
The final result of this work consists of two fully-implemented and evaluatedGUIs, one for Desktop Computers, the other for PDAs. The experimental evaluationhas resulted in 1) a set of guidelines for providing situational awareness to theoperator, and 2) an autonomy adjustment model for human-robot interaction. TheDesktop Interface was used in the last two editions of the RoboCup InternationalCompetition for the Rescue Simulation League (2008 - China and, 2009 - Austria).In the last edition, the GUI received a Technical Award as the Most InnovativeInterface.

Chapter 1
Introduction
This thesis focuses on improving human-robot interaction for search and explorationrobotics. These applications are defined broadly as those in which a human triesto cover an unknown environment with a remote robot partner or team of robots.This chapter lays out the motive for our research and presents the background of thetopic in order to set a theoretical basis for the remainder of the document. We willmake an overall study of Human and Automation, beginning from Human Factorsin order to arrive at Human-Robot Interaction (HRI). Within the HRI field, we willfocus on the remote control and/or supervision of mobile robots.
1.1 Motive and Problem Statement
Let’s consider the explosion and subsequent fire at the Chernobyl Plant in the SovietUnion in 1986. A major challenge facing first response team in accidents of this kindis to assess the extent of the damages and the associated risks. For their part, robotscan be deployed to help such first responders make a proper situation assessment.When an initial situation assessment has been made, and areas safe for humans havebeen identified, responders can go into the affected zones, aided by the robots and,as the case may be, interacting with them through hand-held devices. Being in thedamaged scenario they in principle have partial visibility both of the robots and ofthe scenario in general.
Terrorist attacks are another example of situations in which robots could beused whenever the structure under attack is not seriously damaged. An exampleis the Sarin attack on the Tokyo subway on 1995. In five coordinated attacks, theperpetrators released sarin gas on several lines of the Tokyo Metro, killing a dozenpeople, severely injuring fifty, and causing temporary vision problems for nearly athousand others. The toxic shock was a threat for responders, who could not goinside the affected areas. Similarly to the Chernobyl case, the infrastructure wasnot gravely damaged, a fact that would have allowed existing robots to be deployedand move within the affected area.
Another example is that of scheduled operations, like the inspection of chemicalor nuclear plants, which make it necessary to release a sensor into a place or placesdifficult to reach for operators, due, for example, to high temperatures. Remoteoperators could drive a mobile robot to the desired point, where the equipment for

Introduction Motive and Problem Statement
sensing, or even for implementation of the scheduled operations, needs to be placed.Unfortunately, as Julie A. Adams highlights in [2], HRI development tends to
be an after-thought when designing robotic systems, and advances in AI, sensoryfusion, path planning, autonomous navigation, image processing, etc. are not of-ten integrated into interaction systems properly. Currently, most robot interfacesare system-oriented, permitting developers to have low level control of the systemand facilitating the debugging process, but these are very difficult to operate fornon-expert users. Robot operators are not likely to be experts in robotics, whilethey usually have good knowledge and experience of the environment they need toexplore. The HRI system should make possible the interaction between the robotand its operator. The motivation of the studies carried out for this dissertation isto contribute to some extent to fill this research gap that exists in many roboticsresearch groups.
We will study how to team humans and robots, which robots may either be onsite or re- mote. The general focus of this research is the interaction system andthe graphical interface that allows one or more operators to control and supervise ateam of robots. Several aspects must be dealt with:
1. The development of the interaction system and the graphical user interfacethat allow stationary and mobile operators to control and supervise a robot(single-operator-single-robot interaction system). This will require to analysethe spatial cognition abilities required by an operator to control remotely a mo-bile robot, and to study and evaluate how this requirements may be providedby a graphical interface.
2. The extension of this system to the case in which one operator needs to operatea team of robots (single-operator-multiple-robot interaction system). Thisinvolves a system capable of adjusting the autonomy to the requirements ofthe task and the needs of the operator. The autonomy levels need to be definedand the management of the autonomy adjustment implemented.
3. Defining a policy for transferring the control of the robots from one operator toanother whenever a team of operators shares the control of one robot (multiple-operator-single-robot). No known studies are present in the literature so wewill have to make an exploratory study to arrive to valid conclusions.
Initially, human-robot interfaces began in the form of robotic-arms tele-operation,limited by the lack of sensing and intelligence; in this first stage, the robot was justseen as an extension of the operator body. As computational capabilities increased,research advances were made in sensing, artificial intelligence, computer graphics,etc. This drastically changed the HRI system, from a master-slave system to col-laborative systems. Such an HRI system should improve the mission or task resultsbecause it benefits from the capabilities of the artificial agent and the human. Ac-cording to an early work of Murphy, this system should bring four advantages tothe simple master-slave telesystem [45]:
1. Improve both the speed and quality of the operator’s problem-solving perfor-mance;
3

Introduction Preliminary Note
2. reduce cognitive fatigue by managing the presentation of information;
3. maintain low communication bandwidths associated with semi-autonomouscontrol by requesting only the relevant sensory data from the remote;
4. improve efficiency by reducing the need for supervision so that the operatorcan perform other tasks; and
5. support the incremental evolution of telesystems to full autonomy
1.2 Preliminary Note
The research presented in this dissertation was conducted within the Artificial Intel-ligence Research Group (Sapienza, Universita di Roma) and the Intelligent ControlGroup (Universidad Politecnica de Madrid). Among other research areas, the groupsare devoted to the development of mobile robotic applications, investigating localiza-tion, mapping, path planning, motion planning, exploration, and so forth. I startedmy research with the Rome group, in the rescue robotics section. At that time theonly interface in existence was a graphical console (a kind of adapted debugger),used by the developers, that allowed them to have low-level control of the softwarerunning on the mobile platforms, which in fact, for them, was enough.
Julie A. Adams recalls in [2]:
Many years of Human Factors research have shownthat the development of effective, efficient, and usableinterfaces requires the inclusion of the user’s perspec-tive throughout the entire design and development pro-cess. [Unfortunately] Human-Robot Interface develop-ment tends to be an after thought, as researchers ap-proach the problem from an engineering perspective.Such a perspective implies that the interface is designedand developed after the majority of the robotic systemdesign has been completed.
Realizing of the importance of this, Prof. Daniele Nardi, head of the Collabo-rative Cognitive Robotics group, at La Sapienza-University of Rome, with whomI began my Ph.D. research, encouraged me to design, implement, and evaluate anHRI system, even if this was not at that moment among the lines of research pursuedby the group.
This fact is important for the understanding of the development of this Ph.D.work, due to the following reasons:
1. Given the absence of any previous GUI in the group, the research here pre-sented involved the design of an HRI system from its basis. This resultedin the design of a GUI for exploration robotics intended to deal with allthe aspects of the topic: single-operator-single-robot, single-operator-multiple-robot, multiple-operator-multiple-robot, and heterogeneous robot-teams in-cluding UGVs and UAVs. The single-operator-multiple-robot paradigm was
4

Introduction Document organization
the principal goal, as this interface was to be used in the Search and RescueRoboCup Competition.
2. None of these paradigms could be analysed exclusively of the others. Thismay produce the impression that we have not gone deeply into any of them,which is true. Conversely, we took as initial designs those present in the lit-erature, considering the great amount of experimentation and results alreadyin existence (mostly in relation to single-operator-single-robots). The exper-imentation results published in the last few years mostly focus on one of theparadigms; we have considered all three as a whole (SOSR, SOMR, MOMR).This is a novelty in the literature.
3. Our contribution is a full human-robot system, capable of working with multiple-operators controlling multiple-robots, evaluated experimentally in all the com-binations, with a variety of both simulated and real robots, and tested duringthe Rescue Robot RoboCup Competition. Due to its generality, this systemconstitutes an excellent test-bed for further research and experimentation. Bythe time of this thesis publication, all the HRI software code, alongside withthe robotic software code, will be available on-line for free use.
The advantage has been that, belonging to a robotics research group, I havehad access to the most advanced techniques in SLAM, path planning, exploration,sensory fusion, etc, which has allowed me to focus on the HRI system, withoutneeding to focus on the robotic side. Furthermore, the close interaction with mycolleagues has made it possible during the last few years to fill the lacuna Adamsobserved: the inclusion of the users perspective throughout the entire design anddevelopment process. This has turned out to be the best way to build a human-machine system.
1.3 Document organization
This dissertation analyses the HRI system development in its evolution. The con-tents have been grouped into three thematic aspects: 1) providing situational aware-ness, 2) designing for robot teams, and 3) exploring the multiple-operator-multiple-robot paradigm. This separation, in some way, matches the temporary evolutionof the system design, but it should not be drawn too strictly. In fact, chapterscorresponding to points 1 and 2 each consider aspects present in the other. Thissubdivision, which not everybody needs to agree with, has been made in order tofacilitate the understanding of the document. The system was designed from thebeginning with a view to a single-operator-multiple-robot system. With the addi-tional aim of research into the general multiple-operator-multiple-robot case, withstationary and mobile operators, we developed and evaluated a PDA interface; thisallowed us to investigate our paradigm experimentally, but that investigation is notthe main focus of the research presented here. Chapters are organized as follows:
1. Chapter 2 reviews the literature concerning human-machine systems, payingspecial attention to the machines that are automated to some extent. This will
5

Introduction Document organization
lead us from the most general human-factors theories to the specific aspects ofHuman-Robot Interaction. At the end of the chapter the methodology usedfor this research is presetented, giving a motivation for the structure of eachchapter.
2. Chapter 3 begins with a theoretical exposition of the spatial abilities re-quired by a human that deals with navigation. Afterwards it is reviewed thestate-of-the-art in human-robot interfaces, showing some previous guidelinesfor designing single-operator-single-robot interfaces. At the beginning of thisresearch several interfaces for the single-operator-single-robot paradigm werebeing designed and presented in the literature, both for PDAs and DesktopComputers. Based on these designs we have designed a new GUI for control-ling a mobile robot, evaluating its usability through experimentation of ourown. New guidelines for interface design, focusing on the operator situationalawareness are provided. This Chapter describes the first and second prototypeof the interfaces.
3. Chapter 4 analyses the theoreital aspects and state-of-the-art of multi-robotinterfaces, autonomy adjustment and control modalities. Laboratory experi-ments were conducted with users, in order to study how the second versionof the desktop interface supported multi-robot remote control. The collecteddata highlights the major problems of multi-robot tele-operation and someguidelines for designing a better interface. In this chapter the second versionof the interface is evaluated.
4. Chapter 5 explores how the autonomy levels and the operation modes couldbe enhanced in order to improve the multi-robot remote control. The existingtheories in humans and automation alongside with our own experimentationhave been used to model an autonomy adjustment system. New laboratoryexperiments were ran using the third prototype of the interface. The results ofthese experiments were used to design a fourth prototype which is describedin detail in this chapter.
5. Chapter 6 makes an experimental comparison between our desktop-basedinterface and the pda-based interface. There are no studies of this type presentin the robotic literature. One of the strengthes of this study is that it sets aground to determine the optimal way to distribute the control of a robotbetween the available operators roving with hand-held devices and stationaryoperators using desktop computers, so as eventually to work out a controltransfer policy for determining when robot-guidance should be passed fromone operator to another.
6. The last chapter collects the contributions of this dissertation and describesthe current and further work.
6

Introduction Contributions
1.4 Contributions
The works presented in Chapter 3 are representative of the state-of-the-art in mo-bile robot interfaces. In that chapter we will discuss the limitations of those inter-faces, concerning the situational awareness and their scalability to the multiple-robotparadigm. In any chapter we will show where our research goes beyond the state-of-the-art and in which points it confirms or completes other research results. Themain contributions of the research presented in this dissertation are:
1. Application and adaptation of classical Human Factors theories to human-robot systems.
2. Identification of the human cognitive abilities required for controlling remotelya mobile robot.
3. Implementation and evaluation of two interfaces, for hand-held devices andfor desktop computers, in order to provide such requirements.
4. Development and evaluation of a model for adjusting the robot autonomy levelin order to control and/or supervise a team of robots.
5. Experimental study of the system performance and the operator:robot optimalratio in multi-robot missions.
6. Comparison between a pda-based interface and a desktop-base interface forcommanding a remote robot.
7

Chapter 2
Background
This chapter presents a literature review covering the theoretical background andthe state-of-the-art in human-machine systems and human-robot interfaces.
A user interface provides the means by which humans and machines interact. An-other term for user interface is a man-machine interface (MMI). The MMI includesall the components that the user encounters. The components include the inputlanguage, output language and interaction protocol. The term ”human-computerinteraction” was adopted in the mid-1980’s, and it describes a field of study thatdeals with all aspects of interaction between participants and computers. Human-Computer Interaction (HCI) is defined by the Association for Computing Machin-ery (ACM) Special Interest Group on Computer-Human Interaction (SIGCHI) as”a discipline concerned with the design, evaluation, and implementation of interac-tive computing systems for human use and with the study of the major phenomenonsurrounding them”.
In the next sections we will provide the required background for the understand-ing of the problem and the proposed solution. We will follow a general-to-particularapproach. We will first give an overview of human-machine systems when automa-tion is involved. We will focus afterwards on cases in which machines are robots.Finally, we will discuss our case study, which involves the scenario of an operatorusing a robot for exploring an unknown environment. Instead of concentrating allthe related work and state-of-the-art in this chapter we have considered more suit-able to distribute it through the document. Consequently, the aspects related toour work that require further explanation will be analysed as needed during the restof the document.
2.1 Humans and Automation
A human-automation system is a particular case of a human-machine system, inwhich the machine is automated to some extent. Many engineers think of automa-tion as the replacing of the human labour. This is a mistake: in the fact that themachine is automated only to a certain extent means that human participation willalso be required to some degree.
The interaction between a machine and a human became a scientific disciplineunder the name of ”human factors engineering” or simply, ”human factors”, de-

Background Humans and Automation
fined by Sheridan as ”the application of behavioural and biological sciences to thedesign of machines and human-machines systems” [63]. When machines were poorlyautomated, this was also known as ”ergonomics”, dealing mostly with anthropom-etry, biomechanics, and body kinematics. As machines became automated devices,human sensory and cognitive functions became correspondingly more present, and”ergonomics” gave way to the more general term ”human factors”. The purpose ofdesign, from the point of view of the human factors engineer, is to achieve a properrelationship between the behaviour of the hardware and software technology andthe behaviour of the human user.
The human factors designer must start from the viewpoint of the human user.This immediately places human factors among the experimental and empirical sci-ences, like medicine or psychology. As a consequence, there are few quantitativemodels in human factors science, as humans cannot be modelled in the strict sense.Humans can only be broadly studied in a qualitative way (even if, of course, somequantitative models can be used and are helpful; the fact remains, however, thatthere are few mathematical models that generalize, for example, the transducerproperties of the eyes, ears, etc., and the musculo-skeletal system). The humanfactors engineer, after an initial design, and considering all the theoretical contri-butions of ergonomics, the cognitive sciences, etc., must validate his hypothesis byexperimentation, as in any other applied human science. The designer will haveto use statistics to make rational inferences from observations and to apply mathe-matical modelling where appropriate. The human factors professional also needs anappreciation of the variability among people and the variability of behaviour withinthe same person.
2.1.1 From Ergonomy to Human-Robot Interaction
According to Sheridan [63] there are three stages in the science that studies theinteraction between humans and automation:
1. Ergonomy. Human factors as a discipline began during the World War II,when it was fully appreciated that modern weapons of war required explicitengineering of the interface between the human and machine. This engineeringconcerned mainly ergonomics. The soldier should fit the weapon in terms ofmobility, weight, etc. but also in terms of vision, hearing, etc. After the war,the lessons learnt were applied to improve industrial processes.
2. Borrowed engineering models. Quantitative performance models of informa-tion processing, signal detection, and control began to be applied to humans,with the aim of facilitating the insertion of the human agent into the mathe-matical working loop, as a sensor and actor.
3. Human-Computer Interaction. The computer changed human-machine sys-tems profoundly. Computers especially changed display technology and con-trols. Displays and controls were no longer dedicated to precise information orcommand, for it was now possible to perform many operations with one device.This flexibility has made human-computer interaction, broadly speaking, themajor focus of research in human factors studies.
9
Background Humans and Automation
Sheridan does not consider Human-Robot Interaction as a new step in the evo-lution of man-machine systems. His definition of human-computer interaction alsoincludes human-robot systems, considering robots a type of computers. A compar-ison between both disciplines was posted by Erik Stolterman on his TransformingGrounds blog. The post reads: ”It is clear that the two fields are moving closer toeach other with a growing overlap. If HRI has primarily been addressing the internalworkings of a robot, HCI has been all about interaction. When HRI now actually canbuild robots with quite interesting and sophisticated qualities, the design challengesbetween the fields are becoming similar. Interaction design is becoming more awareof the dynamic and interactive (even intelligent) environment that people experienceas part of their reality. Maybe the only difference is that robots move and environ-ments do not!”1. The initial ”system approach” noted by Stolterman as a differencefrom HCI was criticized by Adams as one of the major drawbacks of initial roboticresearch. Her work ”Critical considerations for human-robot interface development”[2] signalled a change in HRI research, as the human factors have repeatedly shown.Adams insisted on the importance of starting interface design and development fromthe user perspective rather than from the engineering perspective. In light of Adam’swork, many researchers have begun applying user centered HCI methodologies todesign and evaluate their HRI systems; some examples are [24][76][23][61][46][28],and there are many more besides.
In [56], Aaron Powers lists key HCI/HRI principles, or ”heuristics” designed totake account of the lessons learnt in the HCI domain that could be applied to HRI.These heuristics could be understood as an update of Nielsen Heuristics [49] appliedto HRI.
• Required information should be present and clear.
• Prevent errors if possible, if not, help users diagnose and recover.
• Use metaphors and language the users already know.
• Make it efficient to use.
• Design should be aesthetic and minimalist.
• Make the architecture scalable and support evolution of platforms.
• Simplify tasks through autonomy.
• Allow precise control.
• Strive for a natural human-human interaction.
In any case, a fundamental difference must be observed: robots must deal withthe real world, while computers create their own interaction environment. Robotsmove and environments don’t, and as soon as a machine moves in an unknownenvironment, there are shifts of context that bring with them changes in the specificsof interaction, changes which are very hard to anticipate and to design for in advance.
1http://transground.blogspot.com/2007/11/hci-and-human-robot-interaction.html
10

Background Humans and Automation
Further- more, the interaction is conditioned by the capabilities of the robot itself: itslimited mobility (robots won’t go wherever they are sent), the incomplete sensing ofthe environment (it may fail to sense or interpret the changes in the environment orthe human actions/commands), and so forth. In our case study, we are quite close toHCI, as we are designing a GUI to be run on a computer, but when the interactionhas to occur directly with the robot, differences become clear. For example, thedisplays are no longer the main source of communication, but rather the robot’sgestures, speech, movements, etc. Moreover, the robot must be able to understandthe commands of the human, not only the explicit ones, such as speech commandsor gestures, but also the implicit commands, such as his mood, his intentions whenmoving, etc.
2.1.2 Automation Critical Issues
Many years of human factors research have concentrated on complex man-machinesystems. Such domains include aircraft and air traffic control, automobiles andhighway systems, trains, ships, spacecraft, chemical processing plants, etc. Whilethese domains differ from robotics, there are many theories and results related tooperator workload, vigilance, situation awareness, and human error that should alsobe applied to HRI development.
In his book ”Humans and automation” [63], Sheridan highlights some criticalissues associated with automation, that must be taken into consideration in anyhuman-robot system in which the human and the robot must collaborate to accom-plish a common goal.
• Design engineers automate because they can, and this is not always a goodidea. The automation is supposed to serve the people, not the other wayaround. As Adams says in [2], robotic research is usually over-interested inbuilding as many autonomous behaviours as possible into the robots. Thedesigner should identify which tasks are more suitable for the operator, andwhich ones should be assigned to the artificial agent.
• When people don’t understand automation: i) they may not trust it, or else ii)they may over-trust it. An interaction system should then inform the humanof the status and activities of the artificial agent, in order to give the operatoran understanding of what is going on. Of course this implies that the operatorshould also be trained in the use of the robotic system he is using, and shouldbe familiar with its capabilities, and its limitations.
• Automation is not robust nor adaptable. It does what it is programmed todo, which is not always what is desirable or even what the humans using it oraffected by it expect it to do.
• Automation can work properly for a long time. This makes the job of moni-toring the automated process quite boring, but when automation fails, it maybe very difficult for the operator to wake up, figure out what has failed, andtake corrective action.
11

Background Human-Robot Interaction
• One form of automation is the decision aid, the advice giver, the expert system,the management information system. It does not act, it just tells people howto act. The myth is that decision aids are always safer than automatic controlsbecause the human operators can still be depended on. The problem with suchsystems is that people come to trust them and then to over-trust them. Theoperator tends to cease acting and he just ”presses the OK button” wheneverhe is asked to confirm an action.
In the next section, we will study the case in which the automated machine is arobot. Robots are just a particular case of automated machines. The InternationalOrganization for Standardization gives a definition of a robot in ISO 8373: ”an auto-matically controlled, reprogrammable, multi-purpose, manipulator programmable inthree or more axes, which may be either fixed in place or mobile for use in indus-trial automation applications.” This definition is used by the International Federa-tion of Robotics, the European Robotics Research Network (EURON), and manynational standards committees. This definition, though, focuses mainly on ma-nipulator robots. The Merriam-Webster definition considers the term robot withgreater generality: a robot is a ”machine that looks like a human being and performsvarious complex acts (as walking or talking) of a human being,” or a ”device thatautomatically performs complicated often repetitive tasks,” or a ”mechanism guidedby automatic controls”. These three definitions are more general and include a widerrange of robotic applications.
2.2 Human-Robot Interaction
2.2.1 Definition
We have just presented a short introduction to human factors engineering and tothe ways in which this discipline evolved from ergonomics to humans interactingwith highly sophisticated systems, such as computers or robots. Some critical issueswere listed. In this section, we provide a background to the human-robot interactionfield. In the the next section, we will focus on the remote control of mobile robots,whose special characteristic is the ability to move around in their environment. Ourspecific topic of research is the design, implementation, and evaluation of an HRIsystem for search and exploration missions.
As we defined it above, an HRI system is a system that aims to improve themission or task results by taking advantage of the capabilities of the artificial agentand of the human operator. This definition is goal-oriented and may risk under-emphasizing that the term ”interaction” involves communication. Goodrich andSchultz define the HRI field focusing on the interaction itself: it is ”a field of studydedicated to understanding, designing, and evaluating robotic systems for use withor by humans” [34]. This definition captures the fact that the robotic system andthe human-partner must interact with each other.
1Merriam-Webster Dictionary. http://www.merriam-webster.com/dictionary/robot. Retrievedon 2008-08-04.
12

Background Human-Robot Interaction
In search and exploration missions, we can combine both definitions in order tounderstand the precise goal of the HRI system, which is enhancing the performanceof the elements involved: The human, by providing him information on the remoteenvironment in order to guide his activities; the robot, which needs human controland supervision to counterbalance the limitations of the artificial agent running onit; and finally the goal of the mission, which is to explore an unknown area with aprecise intention, such as searching for victims and assessing the extent of damagesafter an explosion, reconnaissance missions, etc.
In the following we will present the taxonomies that define an HRI paradigm.
2.2.2 Human-Robot Interaction Taxonomies
A taxonomy, or taxonomic scheme, is a particular classification of something, ar-ranged in a hierarchical structure. Since HRI is a relatively new discipline, founda-tional studies are still endeavouring to define the taxonomies of the problem [10][72][73].
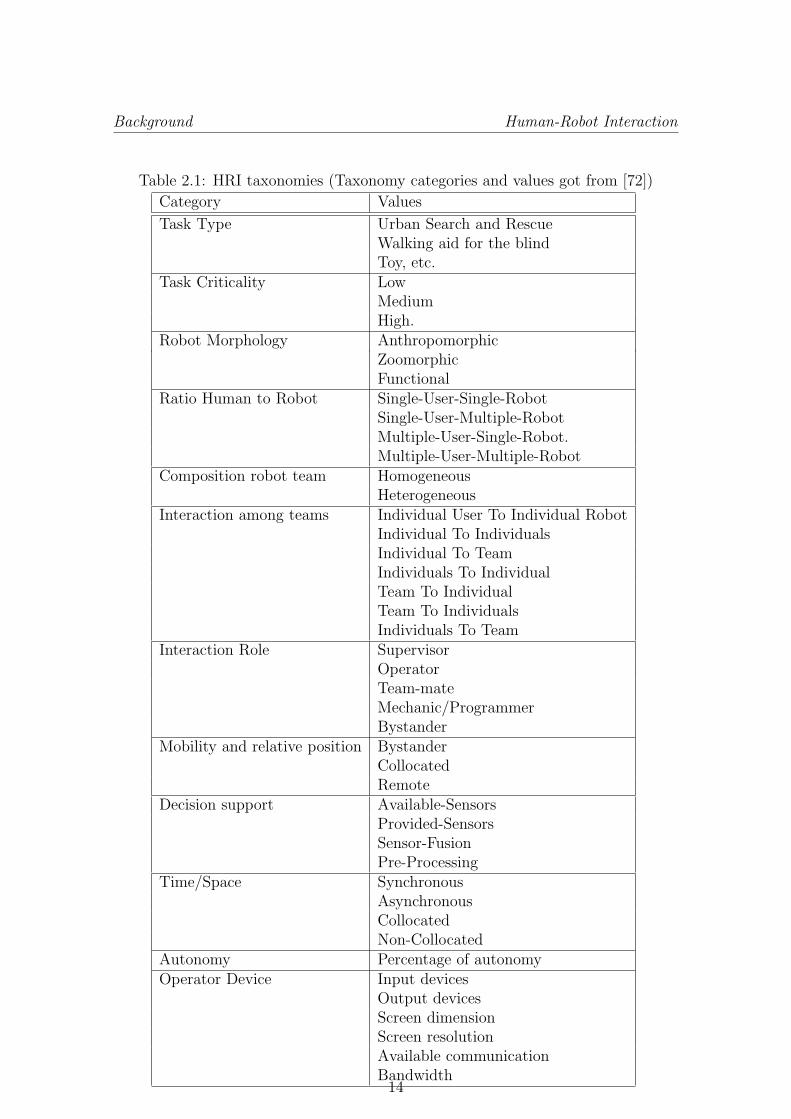
We present these taxonomies in Table 2.1.The taxonomies of Table 2.1 capture the robot characteristics (sensors installed,
sensors involved in data-fusion, etc.), the relations between the robots and the users,as well as the roles and hierarchy within the teams, the devices used for the inter-action (if any), the information about the mission (task criticality).
Many of these categories will have a defined value for a particular working sce-nario or mission, and this will condition the Interaction System. In any case, someof these values will not be defined a priori, but will vary during the mission. Thesevarying values will determine the unfolding of the Interaction according to the situ-ation. The more the taxonomies are granulated in the interaction model, the betterthe Interaction System will be adapted to the requirements of the mission.
We now attempt to explain some of the categories included in the table that areimportant for this dissertation.
Interaction Among Teams and Human:Robot Ratio
These taxonomies let us know the coordination mechanism among the robots andthe operators. Individuals denotes a number of operators or robots that are notcoordinated among them, while team denotes a coordinated group of operators ofrobots. This is important for the HRI system, as if it receives commands fromdifferent operators that are not coordinated, it must prioritize and/or de-conflictthem prior to send them to the robot. Instead, if the commands come from acoordinated team this is not necessary as is it made by the team. The same holdsfor the robots. A team of robots would receive mission commands and the robotsthemselves would allocate the tasks in order to accomplish the mission. Instead ifthe robots are not coordinated this task lies on the HRI system. Let’s note thatthere can be situations in which this configuration cannot be fixed for the wholemission. For example, in a search and rescue mission robots can begin to work incoordination until the moment in which they loose communications, at that momentthey begin to work as individuals. The same holds for the operators. This variabilitymust be considered by the HRI System.
13
Background Human-Robot Interaction
Table 2.1: HRI taxonomies (Taxonomy categories and values got from [72])
Category Values
Task Type Urban Search and RescueWalking aid for the blindToy, etc.
Task Criticality LowMediumHigh.
Robot Morphology AnthropomorphicZoomorphicFunctional
Ratio Human to Robot Single-User-Single-RobotSingle-User-Multiple-RobotMultiple-User-Single-Robot.Multiple-User-Multiple-Robot
Composition robot team HomogeneousHeterogeneous
Interaction among teams Individual User To Individual RobotIndividual To IndividualsIndividual To TeamIndividuals To IndividualTeam To IndividualTeam To IndividualsIndividuals To Team
Interaction Role SupervisorOperatorTeam-mateMechanic/ProgrammerBystander
Mobility and relative position BystanderCollocatedRemote
Decision support Available-SensorsProvided-SensorsSensor-FusionPre-Processing
Time/Space SynchronousAsynchronousCollocatedNon-Collocated
Autonomy Percentage of autonomyOperator Device Input devices
Output devicesScreen dimensionScreen resolutionAvailable communicationBandwidth
14

Background Human-Robot Interaction
(a)Single-
Human-
Single-
Robot
(SHSR)
(b) Single-
Human-Robot-
Team (SHRT)
(c) Single-
Human-Multi-
Robot (SHMR)
(d) Human-
Team-Single-
Robot (HTSR)
(e) Multi-
Human-Single-
Robot (MHSR)
(f) Human-
Team-Robot-
Team (HTRT)
(g) Human-
Team-Multi-
Robot (HTMR)
(h) Multi-
Human-Robot-
Team (MHRT)
Figure 2.1: Taxonomy of human-robot ratio and their coordination.
15

Background Human-Robot Interaction
The interaction between the human and the robot depends on the number ofhumans and robots involved in the interaction and the coordination mechanismsamong the robots and the humans. A simple taxonomy can be defined in order tocharacterize the human:robot ratio and their coordination. Figure 2.1 shows thedifferent cases that may occur [72].
Decision Support
This category concerns the information about how the sensor data are used to informthe user. With the values mentioned, we can ascertain which data and which pre-processed information are supporting the decisions taken by the operator. TheAVAILABLE-SENSORS is the list of sensors installed in the robotic platform. Thesensor information provided to the operator, PROVIDED-SENSORS, is also a list ofsensing types, which is a subset of AVAILABLE-SENSORS. The difference betweenthe two lists derives from the fact that not all of the available sensors data may berequired for decision support. For example, a robot may use its sonar sensors tonavigate, but only a video image is provided in the interface. The type of sensorfusion, SENSOR-FUSION, is specified as a list of functions. For example, if sonarand ladar values were used to build a map that was displayed, the sensor fusion listwould contain {sonar, ladar → map}.
The PRE-PROCESSING list shows the sensor data that are first processed inorder to be shown to the user so as to enhance the information provided. If theimages received from a stereo-camera were used to detect the existence of ground,the list would include {stereo − vision → grounddetection}.
Autonomy Level
A way to improve the possible results benefiting from the capabilities of the artificialand the human agent can be obtained by providing the system with several levelsof autonomy that allow the human and the artificial agent to collaborate in orderto accomplish a common goal. The works of Parasuraman and Sheridan offer someof the deepest theoretical and experimental insights on the topic [49]. A simpletaxonomy applied to mobile robotics can be defined, on the basis of the degree ofautonomy of the robot and the degree of control that the operator has over it. Thistopic has been specially studied in the last few years by Goodrich [51]. A simpletaxonomy applied to mobile robotics can be defined, on the basis of the degreeof autonomy of the robot and the degree of control that the operator has over it.This topic is being particularly studied in the last years by Goodrich [33] [16]. Arepresentation of the Autonomy Level can be seen in Figure 2.2; On the left side theuser has full control of the robot (Tele-Operation). On the right side the artificialagent has full control (Full Autonomy). In the middle there are the “mixed initiativesof control”, in which both an artificial and a human agent collaborate to control therobot. In Assisted Autonomy the artificial agent is responsible for the motion whilein Assisted Tele-Operation the human sends the motion commands. In the nextchapters, we will present the different levels of autonomy we have implemented inour HRI system, with an eye to how the granulation of these levels may affect theperformance of the mission.
16

Background Human-Robot Interaction
Figure 2.2: Autonomy Levels
Mobility and Relative Position
These aspects characterize the spatial relation between the human and the robot[72]. Three kind of relations define this taxonomy.
• Bystander. The human operator is close to the robot and can follow it.
• Collocated. The human operator is in the same scenario the robot is navi-gating, but cannot follow it and thus it may be temporally hidden to him.
• Remote. The human operator is not in the robot’s scenario. He cannot seeeither the scenario or the robot.
2.2.3 Human-Robot Interaction Metrics
An important field of research concerns the metrics that enable us to evaluate theeffectiveness of an HRI system, or to compare different systems with one another.Researchers are currently discussing and looking for adapted metrics for evaluatinginteraction [65][9][50].
Steinfeld, Fong, Kaber, Lewis, Scholtz, Schultz and Goodrich, in a comprehensivejoint work, have chosen to focus on task-oriented metrics. They present their metricsin terms of five task categories: navigation, perception, management, manipulation,and social. They selected these tasks because they can be performed with a high-level of human direction (pure tele-operation), a high-level of robot independence(full autonomy), with anything in-between on the interaction spectrum. By doing so,they assert that: 1) such metrics are broadly relevant to a wide range of applications,and 2) they can assess the impact of different levels/types of HRI on performance.These metrics are presented in Table 2.2. For further information, see [65]. Aspresented, the metrics are too general to be applied straightforwardly in experiments,and specific applications call for deriving precise metrics. This point will be studiedin the following section. In our application, the metric that appropriately specifieswhat has just been presented is Operator Situational Awareness, as we will shortlysee.
17

Background Human-Robot Interaction
Table 2.2: Common Metrics for Human-Robot Interaction
NavigationGlobal navigation Where the robot is inside the whole working areaLocal navigation What potential hazards are close byObstacle encounter How to deal with an obstacle (e.g.. how to avoid
it or extracting it)Perception
Passive Perception Involves interpreting sensor data: identification,judgement of extent, and judgement of motion.
Active Perception Ranges from relatively passive tasks such as con-trol of pan and tilt of a camera to control of robotmovement in search. To differentiate active per-ception from mobility/navigation tasks we requirethat active perception involving mobility be initi-ated by detection of a possible search target.Management
Fan out It is a measure of how many robots (with simi-lar capabilities) can be effectively controlled by ahuman.
Intervention response time Whenever an operator does not devote total atten-tion to a robot, there will be delay between whenthe robot encounters problems and when the op-erator intervenes.
Level of autonomy discrepancy Measures the performance of the human to acti-vate the optimal autonomy mode depending on themission situation. This metric encompasses severalfactors (situation awareness, trust, etc), but servesas a good indicator of system efficiency.
Manipulation, and SocialWe are not considering these metrics as they are not directly relatedwith our approach to mobile robots HRI
18

Background HRI in Search and Exploration Robotics
2.3 HRI in Search and Exploration Robotics
In the sort of scenario we presented at the beginning of the Chapter, which involvesan information rich space, successful navigation requires human cognitive abilitiessuch as orientation, way-finding, visuospatial representation of the environment,planning, etc. When a human operator guides a robot using a Graphical User Inter-face (GUI), he must have a proper Situational Awareness (SA). The SA definitiongiven by Endsley: ”the perception of environmental elements within a volume of timeand space, the comprehension of their meaning, and the projection of their status inthe near future” [25], is widely accepted in the Human Factors literature.
In the following, we will analyse in greater depth the concept of Situation Aware-ness as applied to the remote control of mobile robots. The operator SA will be themetric used for evaluating the design of the interfaces presented in this dissertation.
2.3.1 Situational Awareness
Endsley’s SA definition was adapted to HRI by Yanco, Drury and Scholtz, whothus defined it as ”the understanding that the human has of the location, activities,status, and surroundings of the robot; and the knowledge that the robot has of thehuman’s commands necessary to direct its activities and the constraints under whichit must operate” [76]. This definition distinguishes three components within theconcept of SA: human-robot SA, robot-human SA, and the human’s overall missionawareness [76]. Some authors might feel uncomfortable with the idea of a robot-human SA. Considering a robot SA, the definition may be flawed, as it suggests SAis achievable by non-human agents. SA is dependent upon aspects of informationprocessing that are unique to humans, including perception, working memory, long-term memory, planning, decision-making and action. Consequently, it is not strictlyspeaking possible for a robot to develop awareness. In any case, we believe thatwhen Yanco et al. speak of robot SA they use the term merely in an analogous way,without intending to place artificial agents on a level with humans.
Within the human-robot awareness and the human’s overall mission awarenessYanco, Drury and Scholtz define five categories:
• Location awareness, defined as a map-based concept: orientation with respectto landmarks.
• Activity awareness, pertaining to an understanding of the progress the robotwas making towards completing its mission; this was especially pertinent incases where the robot was working autonomously.
• Surroundings awareness, pertaining to obstacle avoidance: an operator couldbe quite aware of where the robot was on a map but still run into obstacles.
• Status awareness, pertaining to understanding the health (e.g., battery level,a camera that was knocked askew, a part that had fallen from the robot) andmode of the robot, plus what the robot was capable of doing in that mode atany given moment.
19

Background HRI in Search and Exploration Robotics
• Overall mission awareness, defined as the understanding that the humans hadof the progress of all the robots.
2.3.2 Measurement of Situation Awareness
While the SA construct has been widely researched, the multivariate nature of SAposes a considerable challenge to its quantification and measurement (for a detaileddiscussion of SA measurement, see [26]). In general, techniques vary in terms of di-rect measurement of SA (e.g., objective real-time probes or subjective questionnairesassessing perceived SA) or methods that infer SA based on operator behaviour orperformance. These SA measurement approaches are further described next.
Objective measures of SA
Objective measures directly assess SA by comparing an individual’s perceptions ofthe situation or environment to some ”ground truth” reality. Specifically, objectivemeasures collect data from the individual on his perceptions of the situation andcompare them to what is actually happening, so as to score the accuracy of theirSA at a given moment in time. Thus, this type of assessment provides a directmeasure of SA and does not require operators or observers to make judgements aboutsituational knowledge on the basis of incomplete information. Objective measurescan be gathered in one of two ways: real-time as the task is being completed (e.g.,”real-time probes” presented in the form of open questions embedded as verbalcommunications during the task) or during an interruption in task performance(e.g., Situation Awareness Global Assessment Technique [SAGAT]). This methodhas the difficulty that you must interrupt the task, which may be not possible andwhich affects task execution. A solution could be to make a post-test followingcompletion of the task, the obstacle here being that the perception of the user aftercompleting the task is different from his perception at a given time during it.
Subjective measures of SA
Subjective measures directly assess SA by asking individuals to rate their own SAon an anchored scale. Subjective measures of SA are attractive in that they are rel-atively straightforward and easy to administer. However, several limitations shouldbe noted: Individuals making subjective assessments of their own SA are oftenunaware of what information they do not know (the ”unknown unknowns”). Sub-jective measures also tend to be global in nature, and, as such, do not fully exploitthe multivariate nature of SA to provide the detailed diagnostics obtainable by ob-jective measures. Nevertheless, self-ratings may be useful in that they can providean assessment of operators’ degree of confidence in their SA and their own perfor-mance. Measuring how SA is perceived by the operator may provide information asimportant as the operator’s actual SA, since errors in perceived SA quality (over-confidence or under- confidence in SA) may have just as harmful an effect on anindividual’s or team’s decision-making as errors in their actual SA [25].
20

Background HRI in Search and Exploration Robotics
Performance and behavioural measures of SA
Performance measures ”infer” SA from the end result (i.e., task performance out-comes), based on the assumption that better performance indicates better SA. Com-mon performance metrics include quantity of output or productivity level, timeneeded to perform the task or respond to an event, and the accuracy of the responseor, conversely, the number of errors committed. The main advantage of performancemeasures is that these can be collected objectively and without disrupting task per-formance. However, although evidence exists to suggest a positive relation betweenSA and performance, this connection is probabilistic and consequently conclusionsmust be drawn from experimentation with groups and from significant statisticaldata.
Behavioural measures also ”infer” SA from the actions that individuals chooseto take, based on the assumption that good actions will follow from good SA andvice-versa. Behavioural measures rely primarily on observer ratings, and are, thus,somewhat subjective in nature. To address this limitation, observers can be askedto evaluate the degree to which individuals are carrying out actions and exhibitingbehaviours that could be expected to promote the achievement of higher levels ofSA.
The LASSOing technique
Yanco and Drury [23] propose a simple method for measuring SA, called LASSO(Location Activity Surroundings Status Overall Awareness). This technique is notsubjective, as the operators must not evaluate their own SA, but neither is it basedon the task performance. The subject must ”think aloud” during the task and theobserver notes down what he says. Afterwards, the comments of the subject areevaluated according to their relation with one of the five SA categories defined in[23] (location awareness, surroundings awareness, etc.). This enables us to measurethe Situational Awareness (SA) that the system provides the operator (operator-robot SA and operator-mission SA), classifying the operator’s utterances as positive,neutral or negative in each of five awareness categories:
• Location awareness: for example, positive if the operator recognizes that hehas been in a given place before.
• Activity awareness: for example, positive if the operator understands that therobot has stopped because it is looking for a path to avoid an obstacle.
• Surroundings awareness: negative, for example if the operator collides an ob-ject.
• Status awareness: negative, for example, if the battery level gets too low andthe operator does not realize this.
• Overall mission awareness: positive, for example, if the operator knows thathe has reached all the targets he was asked to reach.
21

Background Research Methodology
The LASSO metrics are concise and simple to use. They evaluate how well theHRI system provides the operator with the situation awareness required to commandthe robot. A problem with this technique is that it requires the subject to ”thinkaloud” during the task. Our experience is that when the task is very demandingfor the operator, he tends to keep quiet, even when he has been asked to express”everything that comes to mind.” A solution to this problem would be to record theinterface display so as to show the operator afterwards how he acted, asking him tocomment what he was doing at a given moment. Unfortunately, this solution is notalways possible, as not all devices enable the operator physically to take hold of thedisplay device (for example a PDA).
2.4 Research Methodology
As the title of this document indicates, the methodology of this dissertation is basedon evolution through evaluation. The evaluation methodology used is based on thebook of Alan Dix: Human Computer Interaction [20], applied to the particularitiesof the interaction between a human and a robot using an interface. Dix highlightsthree goals of evaluation:
• to asses the extent and accessibility of the system’s functionality,
• to assess users’ experience of the interaction, and
• to identify any specific problems with the system.
2.4.1 System Evaluation
There are two kinds of evaluation: Evaluation through expert analysis, and evaluationthrough user participation. Within the user evaluation we can distinguish laboratorystudies, where users are taken out of their normal work environment to take partin controlled tests; and field studies, where the tests are run into the user’s workenvironment in order to observe the system in action.
For this research, the review of the related and previous works has been used asthe ”expert analysis”. The experience of other researchers gives a best basis for aninitial design. The review of the literature (considered as ”the expert”) allows:
• An initial prototype, including some novelties and including the major resultsof previous research and related work.
• A description of the task.
• A list of the actions needed to complete the task.
• An understanding of how human will try to perform the task.
Running controlled experiments the evaluator can collect a big amount of data.This data has the power to provide an empirical evidence to support a particularclaim or hypothesis. Any experiment has the same basic form. The evaluator chooses
22

Background Research Methodology
a hypothesis to test, which can be determined by measuring some attributes. In ourcase we have focused on the operator situation awareness. The different ways ofmeasuring the situational awareness have been explained above.
The methodology used in this research consists of the following steps:
1. Each particular aspect is studied theoretically,
2. related work is analysed and the solutions proposed in literature evaluated,
3. a new proposal is designed and implemented,
4. an experiment is designed: number of participants, variables to measure, inorder to evaluate the novelties implemented,
5. an hypothesis, or prediction of the outcome of the experiment is made,
6. experiments with users are conducted,
7. collected data is analysed, using mostly statistical measures, and
8. a new prototype is proposed according to the conclusions of the evaluation.
In general terms, this will be the structure of each chapter.The first two steps concentrate on evaluating a design through the study of the
theoretical aspects and the confrontation with the existing solutions. The thirdstep is the design phase, in which a prototype is produced. Steps 4, 5, and 6 con-cern user testing. Any interaction system requires user evaluation. The evaluationtests the usability, functionality and acceptability of the interactive system guidingthe evolution of the system: the lessons learnt are applied to the next prototypedesign, resulting in the evolution of the interfaces that will be presented. The ex-periments presented in Chapters 3 and 6 were conducted in real scenarios with realrobots. They are the more similar to field experiments. The experiments presentedin Chapters 4 and 5 were conducted in laboratory with simulated robots. Unfortu-nately, due to the logistic limitations of this research, no proper field studies withfinal users could be run.
The evaluation of the interface is conducted using objective, performance andsubjective measures of the operator situational awareness. The performance mea-sures gives a direct idea of how the system supports the operator. Several variableswere measured and statistically analysed. For the subjective measures the LASSOtechnique was used and subjects were asked to fill questionnaires. The used ques-tionnaires can be seen in the appendixes.
2.4.2 Data Analysis
Performance data has been analysed using the Analysis of Variance (ANOVA).
23

Background Research Methodology
One-Way ANOVA
When there is only one independent variable we applied the one-way ANOVA. Aone-way analysis of variance (ANOVA) is a statistical method through which thedifferences between the means of two or more independent groups can be evaluated.A one-way ANOVA is carried out by partitioning the total model sum of squaresand degrees of freedom into a between-groups (treatment) component and a within-groups (error) component. The significances of inter-group differences in the one-wayANOVA are then evaluated by comparing the ratio of the between and within-groupsmean squares to a Fisher F-distribution.
In order for a one-way analysis of variance to be tenable, several assumptionsregarding the source data must be met. These assumptions include:
1. Homogeneity of variances - the variance of the data in each group must bestatistically indistinguishable.
2. Case independence - the cases which comprise the dataset must be statisticallyindependent within the context of probability theory.
3. Data normality - The data that comprise each group in the analysis must benormally-distributed.
4. Normality of error variances - the error variances for each group in the analysismust be normally (and independently) distributed.
The null hypothesis will be that all population means are equal, the alternativehypothesis is that at least one mean is different.
Two-Way ANOVA
For Chapters 4 and 6 there were two independent variables, so we used the two-wayANOVA. The two-way analysis of variance is an extension to the one-way analysisof variance. There are two independent variables (hence the name two-way).
The assumptions are:
• The populations from which the samples were obtained must be normally orapproximately normally distributed.
• The samples must be independent.
• The variances of the populations must be equal.
• The groups must have the same sample size.
There are three sets of hypothesis with the two-way ANOVA.
1. The population means of the first factor are equal. This is like the one-wayANOVA for the row factor.
2. The population means of the second factor are equal. This is like the one-wayANOVA for the column factor.
24

Background Research Methodology
3. There is no interaction between the two factors. This is similar to performinga test for independence with contingency tables.
Based on the ANOVA we can ascertain when a factor is statistically significant,that is, we can assess that data collected in two different experimental conditions isdifferent. For example, if we analyse the data collected using two kind of interfaces,and apply the analysis of variance to a variable measuring the performance, we canknow whether there are ”significant” performance differences between the interfacesor not.
More about the ANOVA can be seen in Appendix B.In the following chapters we will apply this methodology to design and evaluate
the prototypes of our interfaces. In Chapter 3 the existing interfaces in the literaturewill dictate the design of our first prototype. Field experiments were run. Subjectswere asked to think aloud, and what they said was used for applying the LASSOtechnique. This evaluation drove to the design of prototype 2, for both the PDAand the Desktop interfaces. In Chapter 4 the theories about multi-robot remotecontrol and autonomy adjustment were studied. According to them laboratory ex-periments were run using the desktop interface. Some variables were logged in orderto measure the operator performance, having an indirect measure of his situationalawareness. Usability questionnaires were also used. The conclusions guided the de-sign of prototype 3, the results were also used to design a new version of the PDAinterface. The hypothesis was that with the third prototype the operator:robot ratiowould increase. New laboratory experiments were run. The design was very similarto those conducted with the second version of the interface, in order to ascertainthe improvements. This is explained in Chapter 5. A fourth prototype has beendesigned and implemented and is explained at the end of that chapter. The fourthprototype has been used in the RoboCup 2009 Competition. Chapter 6 makes a ex-ploratory study on the multiple-operator-multiple-robot paradigm, throwing somepreliminary guidelines for solving the problem.
25

Background Research Methodology
26

Chapter 3
Providing Situational Awareness
3.1 Introduction
Exploration robotics involves the deployment of autonomous robots that work incomplex, real-world scenarios. In real missions, users are not likely to be experts inrobotics, but they will have considerable domain knowledge concerning the explo-ration task, the environment, the hazards, etc. Even if the robot were able work incomplete autonomy, its human-partner would still have to retrieve the informationcollected by the sensors in a way that he can understand. Furthermore, in many sit-uations the robot would be unable to finalize its task autonomously, with the resultthat the operator would need to understand the status of the robot, its surroundingsand its capabilities, in order to command the robot with a competence that coun-terbalances the limitations of its autonomy. Human and robot must collaborate inorder to accomplish the given task.
In our iterative design process, each version underwent user testing, the results ofwhich were used to inform the next version of the interface. In addition to exploringthe design of the interface, we also adapted the robotic system in order to make it fitthe requirements of the interaction. In this chapter, we will discuss the design of thefirst version of our graphical user interface (GUI) and interaction system. The majoreffort of the first version was to provide the operator with the situational awarenessrequired to tele-operate a robot in order to explore an unknown environment. Wewill first review the bibliography currently existing on the topic. Next, we willlay out the design and evaluation of the first version of our interface prototype.The evaluation sets the stage for the second prototype, which will be describedat the end of the chapter. This second prototype focuses on issues surroundingoperation modalities with a view to the enhancement of operator performance whenthe operator is controlling a team of robots. New operation modalities and someusability modifications to increase operator situational awareness will emerge inconnection with the third prototype.
3.2 Related Work
In the last several years, there has been a surge of great interest in human-robotinterface design. Adams article ”Critical Considerations for Human-Robot Interface

Providing Situational Awareness Related Work
Development,” written in the year 2002 [2], set researchers working on how to fill thegap between human factors engineering and robotic research. Drury, Yanco, Scholtzand Adams herself, as well as their collaborators, have applied the knowledge thusgained to the specific field of Search and Rescue Robots in number of publications,[61][24][75][22][40][42]. These works have resulted in a set of guidelines for Human-Robot Interface design, which can be summarily presented in the following list:
1. Enhance awareness.
• Location Awareness: Provide a map of where the robot has been andlocate the robot within the map.
• Surroundings Awareness: Provide more spatial information about therobot in the environment and so make operators more aware of theirrobots immediate surroundings.
2. Lower cognitive load. Provide fused sensor information to avoid making theuser fuse the data mentally.
• Provide user interfaces that support multiple robots in a single window,if possible.
• In general, minimize the use of multiple windows.
3. Provide a granulation of the autonomy spectrum according to operator taskand abilities.
4. Provide help in choosing robot autonomy level.
5. Prevent/manage the operators errors and anticipate/interpret his intentions.
An important aspect of Human-Robot Interaction research is the conviction thatuser evaluation is the only way to assess such interaction. As Nielsen asserts: ”Usertesting with real users is the most fundamental usability method and is in some senseirreplaceable, since it provides direct information about how people use computersand what their exact problems are with the concrete interface being tested” [48].
There are many GUIs for tele-operating a mobile robot present in the literature.In this chapter, we review some interfaces and look at their evaluation from thepoint of view of how well they provide the operator with the situational awarenessrequired for controlling a robot. The existing GUIs could be grouped into two designlines: map-centric interfaces and video-centric interfaces.
We will comment in some detail on the three interfaces that influenced the initialdesign of ours. Two of them are for desktop computers, and the other is for hand-held devices. The desktop interfaces are those of the University of Massachusetts-Lowell (UMass-Lowell), developed in the laboratory headed by Holly A. Yanco1;and the interface designed at the Idaho National Lab on the Unmanned GroundVehicle Research Group led by David J. Bruemmer2, As for the hand-held interfaces,we will focus on the interface developed at the Human-Machine Teaming Lab of
1http://robotics.cs.uml.edu/2http://www.inl.gov/adaptiverobotics/
28

Providing Situational Awareness Related Work
Vanderbilt University, founded by Julie A. Adams3 and we will also survey theusability evaluations they have run on this interface.
3.2.1 Desktop Interfaces
When an operator is controlling a robot by means of a desktop computer, we cansuppose that in the majority of the cases he will not be able to see the robot orthe navigating scenario. In this situation, the humans knowledge of the robotssurroundings, location, activities and status is gathered solely through the interface.An insufficient or mistaken situational awareness of the robot surroundings may, forexample, provoke a collision, and inadequate location awareness may mean that theexplored area does not fit the requirements of the mission or that the task is notaccomplished efficiently. When this happens, the use of robots can be more of adetriment to the task than a benefit to it.
Map-Centric Interfaces
Map-centric interfaces are those that stress the representation of the robot inside theenvironment map and thereby seek to enhance the operators locations awareness.They provide a birds eye view of the scenario. The operator may follow the robot,or else he may concentrate on the map with the robot located inside it.
Map-centric interfaces are better suited for operating remote robot teams thanvideo-centric interfaces, given the inherent location awareness that a map-centricinterface can easily provide. The relation of each robot in the team to other robots,as well as its position in the search area, can be seen in the map. However, it is lessclear that map-centric interfaces are better for use with a single robot. If the robotdoes not have adequate sensing capabilities, creating the maps that these interfacesrely on may not be possible. If the map is not generated correctly on account ofthe interference of moving objects in the environment, the presence of open spaceswithout objects within the laser range, faulty sensors, software errors, and otherfactors, the user could become confused as to the true state of the environment.Moreover, the emphasis on location awareness may inhibit the effective mediationof good surroundings awareness.
The INL Interface. The Idaho National Laboratory has in the last few yearsbeen developing a map-centric interface. The INL interface has been tested andmodified numerous times, as can be seen in the literature. The major change wastheir switch from a video-centric interface (Figure 3.1(a)) to a map-centric interface(Figure 3.1(b)). The argument for this change is laid out in [46]. The currentinterface combines pseudo-3D map information with the robot video. The videofeedback is displayed in the pan-tilt position corresponding at the given time withthe robot, and in this way indicates the robots orientation with respect to the currenttarget of the camera. The operator can change his point of view on the environment.The perspective can be egocentric, focused a little bit above and behind the robot,or allocentric, having and aerial view (Figure 3.2). This interface is very similar to
3http://eecs.vanderbilt.edu/research/hmtl/wiki/
29

Providing Situational Awareness Related Work
(a) INL video-centric interface (b) INL map-centric interface
Figure 3.1: Idaho National Lab Interfaces [7]
the one developed by Goodrich et al. at Brigham Young University [47]. Anotherinterface following the same design principles can be seen in [21].
These interfaces share the strength of integrating map and video in a singledisplay. As experiments reported in [46]show, when both map and video are shown indifferent displays, the operator tends to pay attention to one of them while neglectingthe other. The solution of the Idaho lab insures that the operator has only a singlesource of information.
The major weaknesses, according to this writer, of this interface design are:
• If the perspective is focused behind the robot, the operator lacks the properlocation awareness, since he loses the aerial perspective; however,
• if the operator chooses an aerial perspective the video feed-back is no longervisible, so the operator must choose between the aerial map view or the view(including video) of the immediate surroundings (see Figure 3.2).
• The interface presents 2D information (map) as if it were 3D information. Theoperator knows this, but during the mission, he could ”forget” this fact. Thiscould lead to confusion, as obstacles which are above or below the laser rangescanner are not detected (but in map drawing it seems as if these kinds of ob-stacles are detected). The same happens with possible holes, as no informationis relayed about the surface on which the robot must move.
• When the perspective is behind the robot, the distance to obstacles may beunclear for the operator, both on the video and on the map. Our experienceis that for narrow spaces this perspective easily leads to collisions.
• When there are obstacles behind the robot, they can partially hide the robot,since they are represented as elevated on the map.
30

Providing Situational Awareness Related Work
Figure 3.2: Different perspectives of a 3d map-centred interface [47]
Video-Centric Interfaces
It has been shown in studies that operators rely heavily on the video feed from therobot. Video-centric interfaces are thought to provide the most important informa-tion through the video, even if other information, including a map, is present (this isthe case with INL first interface -Figure 3.1(a)-). Video-centric interfaces are by farthe most common type of interface used with remote robots, and they range frominterfaces that consist only of the video image to more complex interfaces that incor-porate other information and controls. The problem with video-centric interfaces,however, is that whenever they include other information apart from the video, thisinformation tends to be ignored, as demonstrated in [74][46].
The UMass-Lowell Interface The Robotics Lab of UMass-Lowell has devel-oped an interface for remotely controlling a mobile wheeled robot to be used forexploration and search tasks (such as urban search and rescue missions). The in-terface design process has been published in the most important conferences andjournals during the last few years, and one can track its evolution in terms of con-tinuous adaptation to the requirements of the operators and the tasks to be achieved[74][24][77][23]. In the literature, the metamorphosis of the interface is explained andjustified with reference to experiments that test for usability and performance. Twoof the interface prototypes are shown in Figure 3.3.
This design is very appropriate for outdoor environments in which video feedbackis the best source of information for the operator. In outdoor environments, actualSLAM techniques may lead to errors in map calculation (very significant errors ifthe SLAM fails to close the loop) and robot localization due to open spaces andlaser max range. Consequently, the video and obstacle information presented in thisinterface is an optimal aid for guiding robots without crashing into obstacles. Inthis writers opinion, indoor environments would have called for a fuller battery ofinformation, with a better use of the map for proper location situational awareness.
31

Providing Situational Awareness Related Work
(a) UML video-centric interface (v.1) (b) UML video-centric interface (v.2)
Figure 3.3: UMass-Lowell Interfaces [77]
This interface mostly stresses the operators surroundings awareness through thevideo feedback (including rear video images) and obstacles around the robot, ele-ments that are present in both prototypes. Location awareness is provided by themap on the top left corner. For Search and Rescue Missions, the spatial model thatthe operator makes of the explored area is crucial. An operator who does not knowwhere he is and where he has been will perform badly. In the opinion of this writer,the interface concentrates the design on providing surroundings awareness, but lit-tle attention is paid to location awareness. Our experience in evaluating interfacesfor exploration robotics leads us to believe that the map the authors display in theinterface is too small. As the explored area expands, the space dedicated to the mapbecomes as tiny as to make it difficult to localize the robot inside it.
In the opinion of this writer, the evolution of the interface leads to a designvery similar to the one proposed by INL. In [46] it was proven that integrating thevideo feedback into a pseudo-3D display enhances robot-teleoperation when a videoimage is required (as in the case of search and exploration tasks). When video isnot relevant, for example when the robot is required just to follow a certain path,a local 2D map is the most effective tool for the task. This respects the principlethat it is good to provide no more information than is required. When both videoand obstacle information is required, the integration of both types of data leads to abetter performance than does their separate presentation, since the operator cannotpay attention to two sources of information at once. The UMass prototypes suggestan analogous conclusion.
The main difference with the INL GUI lies in the fact that the UMass-Lowellinterface keeps the video centred, and it is the robot and the map or obstacles thatare rotated. Instead, with the INL interface, the display keeps the robot orientationfixed, and it is the camera that appears rotated according to its position in relationto the robot. A joint work between INL and UMass compares their interfaces [23].The authors demonstrate that this difference does not influence the performance ofthe operators. Accordingly, at the end of the evolution process we find two interfacedesigns that from the point of view of spatial cognition are analogous. The sole
32

Providing Situational Awareness Related Work
relevant difference between them is the operator viewpoint.The major weakness this writer believes is present in both interfaces has to do
with the support for multiple robots in a single display. Single-operator-multiple-robot interfaces constitute one of the hot topics in exploration robotics. Theseinterfaces seem not to have been originally designed to support multiple robots, asthe main view (display) in both is robot-centred. In these interface designs it wouldbe difficult to visualize the whole of the explored area and all the robots in thedisplay: the INL interface would show the aerial view, losing the video feedback,while in the UMass-Lowells interface the top-left corner space dedicated to the mapis too small. These interfaces are mainly designed for tele-operation of one robot.They fail to provide proper location awareness.
Some of the conclusions drawn from the experimentation and research presentedin this dissertation lead us speak of ”weaknesses” in the interfaces just discussed.Nevertheless, this in no way devaluates the work done by these research groups. Onthe contrary, it reveals its fundamental solidity. After all, both interfaces constitutethe basis of the design of our interface, the lessons learnt from the research behindthem are the ground on which the work conducted for this dissertation is based,and the creators vast list of publications prove their contribution to human-robotinterface design.
3.2.2 PDA Interfaces
As we have seen in the previous considerations regarding spatial cognition, intra-scenario operator mobility is a great advantage in the context of acquiring situationalawareness in robot tele-operation, as the operator has visual access to the environ-ment and in some situations may have visual contact with the robot.
In search and exploration missions, such as disaster situations or scheduled op-erations, a human team may be composed of on-site operators, who can carry onlyhand-held devices, and remote operators, who have access to wider computerizedsystems. Even if remote operators, using powerful work stations, can visualize andprocess a larger amount of data, responders carrying a PDA interface can boost
the pervasiveness of robotic systems in mobile applications where operators can-not be pinned down in a particular place. Even if mobile devices are less powerfulthan desktop computers, they offer the operator the capacity to move, thus allowinghim partially to view the actual scenario with the robot that he is controlling. Thedisadvantages related to device limitations could be balanced by the advantage ofmobility. Mobility could facilitate better situational awareness and so enhance thecontrol of the robot. first responders could control a robot team with a PDA inter-face while having a partial view of the environment, and thus could obtain on-fieldinformation not retrievable by the robot sensors.
With these sorts of goals in mind, some research groups have designed graphicaluser interfaces for PDAs. In the last few years, many interfaces have been developedfor use on hand-held devices: for military applications: [29][30][27]; for explorationand navigation: [42][43][38]; and for service robots: [54][41][64].
In this section, we will present the results of three studies on PDA interface de-sign, studies that focused on operator workload, situational awareness, and usability.
33

Providing Situational Awareness Related Work
(a) PDA Sensory Only Screen (b) PDA Vision Only Screen (c) PDA Vision-Sensory Screen
Figure 3.4: EECS Department, Vanderbilt University PDA interface [3]
These studies have been conducted by means of user evaluation, which affords abroad view of PDA interface design for exploration robotics. The interface underanalysis provides the operator with three displays.
• Sensory display, showing the obstacles around the robot as these are retrievedfrom the laser/sonar sensor (Figure 3.4(a)).
• Video display, showing only video feedback (Figure 3.4(b)).
• Integrated display, in which both video and sensory data are integrated in onesingle display (Figure 3.4(c)).
Operator Workload One of the major disadvantages of a PDA is the small sizeof the screen. We had seen in the desktop interfaces how the integration of theinformation in one display reduces the cognitive load of the operator. The problemhere is that the PDAs small screen makes such reduction quite difficult, as theintegration of the information may lead to confusion on account of the smallness ofthe available screen space. This aspect was studied by Adams et al. in [3]. Theirstudies conclude:
• When operators can directly view the environment and robot, their perceivedworkload is significantly lower with the sensor-only screen (Figure 3.4(a)) thanwith the results for the vision-only (Figure 3.4(b)) and the vision with sensoryoverlay screens (Figure 3.4(c)).
• When operators cannot see the environment, the vision-with-sensory-overlayand sensor-only interface screens induce higher workload levels for the defineduser group than the vision-only interface screen.
Both results indicate that the simpler the information displayed, the better, andthat video feedback is preferred in the absence of visual contact with the robot.
34

Providing Situational Awareness Interface Version 1
Situation Awareness Another work of Adams et al. experimented for operatorperformance with each one of the displays previously shown in Figure 3.4. As wesaw on Section 2.3.2 performance measures infer SA from the end result (i.e., taskperformance outcomes), based on the assumption that better performance indicatesbetter SA. The conclusions of this study are [42]:
• Performance greatly improves when participants are permitted to view therobot directly during a task.
• The vision-with-sensory-overlay screen yields poor performance.
• The participants completed the task fastest when they had access to the sensoronly display and they were permitted to view the robot and environmentdirectly.
In many respects, the performance analysis supports the results from the fullstatistical analysis of perceived workload and usability.
The authors of [42] attribute this result to the screen processing delay, as all im-ages and sensory information must be processed. We hypothesize that the inclusionof too much information in the small display is a further problem, in that it confusesthe operator who must interpret it. In fact, the display includes the arrow cursorsto control the robot, the stop button, laser/sonar readings and video feed-back.
Usability A third study, analysing usability, was conducted by Adams et al. withthe same interface [43]. This study completes a broad user evaluation of the GUIunder examination, and it results in a set of useful guidelines for interfaces that areto run on hand-held devices. The conclusions of the usability study are:
• The Image-with-Sensory-Overlay and Sensor-Based interfaces induce higherworkload levels for the defined user group than the Vision-Based interface.
• The Vision Based interface is easier to use for the defined user group than theImage-with-Sensory-Overlay and Sensor-Based interfaces.
• The Vision-Based interface is the tele-operation interface preferred by the de-fined user group.
• Image-with-Sensory-Overlay interface is preferred for tele-operation over theSensor-Based interface by the defined user group.
3.3 Interface Version 1
Our first interface prototype was mainly inspired by the INL interface, as it will beseen.
35

Providing Situational Awareness Interface Version 1
Figure 3.5: Desktop Interface v.1 showing laser readings on 3D view
3.3.1 Desktop Interface
Our desktop interface is designed for controlling multiple robots in structured andpartially unstructured environments. Its goal is the ability to control a robot teamin such situations, which mainly involve exploration, navigation and mapping issues.The first version of the interface is principally concerned with providing surroundingsand location situational awareness to an operator who must control a team of robots.Its main purpose is to enhance the operators tele-operation of a robot by affordinghim a comprehensive global overview of the whole team. Our concern was that theglobal information should be visible at all times on the screen in order to enablemonitoring the entire robot team while controlling each individual robot. We willnow describe the display of the data and the operation modes.
Operator Display
The interface is shown in Figures 3.5 and 3.6. In the topmost part there is a listof the robots belonging to the team. The operator can switch from one robot toanother, or connect to a new robot, by clicking the corresponding button or. On theright-hand side there are some controls and a tracker for the speed of the selectedrobot. There is also a digital clock for counting the mission time. At the bottom,
36

Providing Situational Awareness Interface Version 1
Figure 3.6: Desktop Interface v.1 showing map on 3D view
37
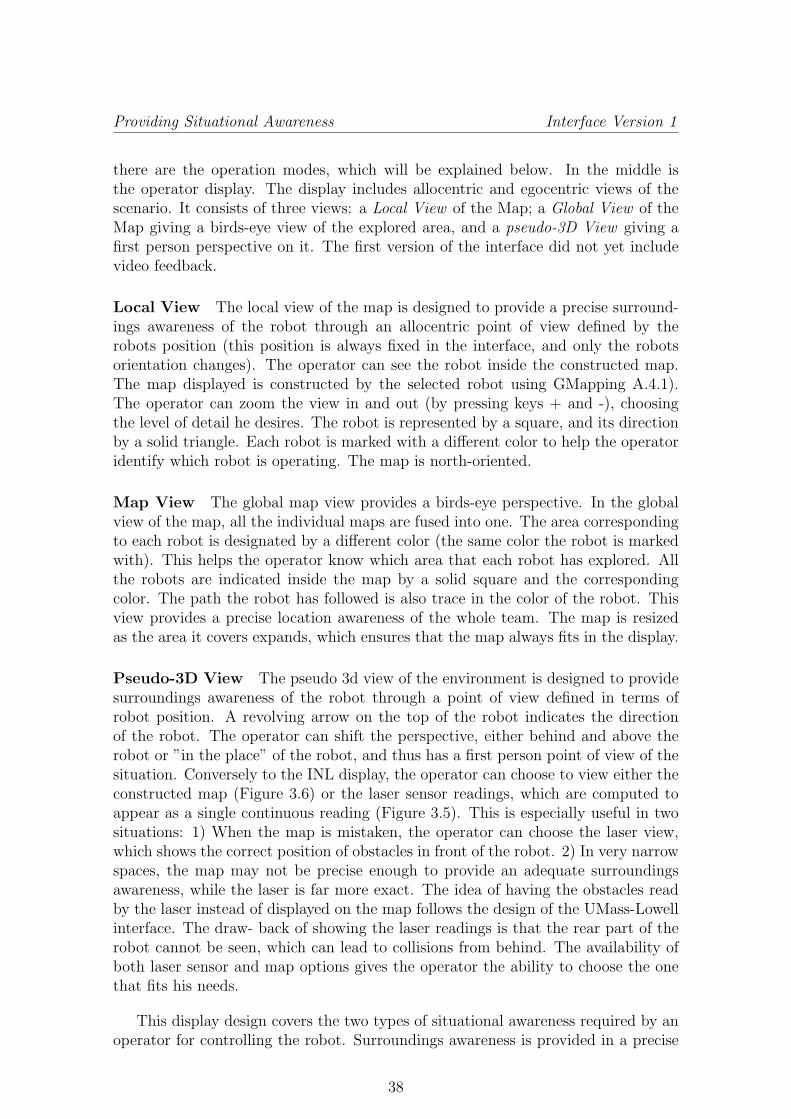
Providing Situational Awareness Interface Version 1
there are the operation modes, which will be explained below. In the middle isthe operator display. The display includes allocentric and egocentric views of thescenario. It consists of three views: a Local View of the Map; a Global View of theMap giving a birds-eye view of the explored area, and a pseudo-3D View giving afirst person perspective on it. The first version of the interface did not yet includevideo feedback.
Local View The local view of the map is designed to provide a precise surround-ings awareness of the robot through an allocentric point of view defined by therobots position (this position is always fixed in the interface, and only the robotsorientation changes). The operator can see the robot inside the constructed map.The map displayed is constructed by the selected robot using GMapping A.4.1).The operator can zoom the view in and out (by pressing keys + and -), choosingthe level of detail he desires. The robot is represented by a square, and its directionby a solid triangle. Each robot is marked with a different color to help the operatoridentify which robot is operating. The map is north-oriented.
Map View The global map view provides a birds-eye perspective. In the globalview of the map, all the individual maps are fused into one. The area correspondingto each robot is designated by a different color (the same color the robot is markedwith). This helps the operator know which area that each robot has explored. Allthe robots are indicated inside the map by a solid square and the correspondingcolor. The path the robot has followed is also trace in the color of the robot. Thisview provides a precise location awareness of the whole team. The map is resizedas the area it covers expands, which ensures that the map always fits in the display.
Pseudo-3D View The pseudo 3d view of the environment is designed to providesurroundings awareness of the robot through a point of view defined in terms ofrobot position. A revolving arrow on the top of the robot indicates the directionof the robot. The operator can shift the perspective, either behind and above therobot or ”in the place” of the robot, and thus has a first person point of view of thesituation. Conversely to the INL display, the operator can choose to view either theconstructed map (Figure 3.6) or the laser sensor readings, which are computed toappear as a single continuous reading (Figure 3.5). This is especially useful in twosituations: 1) When the map is mistaken, the operator can choose the laser view,which shows the correct position of obstacles in front of the robot. 2) In very narrowspaces, the map may not be precise enough to provide an adequate surroundingsawareness, while the laser is far more exact. The idea of having the obstacles readby the laser instead of displayed on the map follows the design of the UMass-Lowellinterface. The draw- back of showing the laser readings is that the rear part of therobot cannot be seen, which can lead to collisions from behind. The availability ofboth laser sensor and map options gives the operator the ability to choose the onethat fits his needs.
This display design covers the two types of situational awareness required by anoperator for controlling the robot. Surroundings awareness is provided in a precise
38
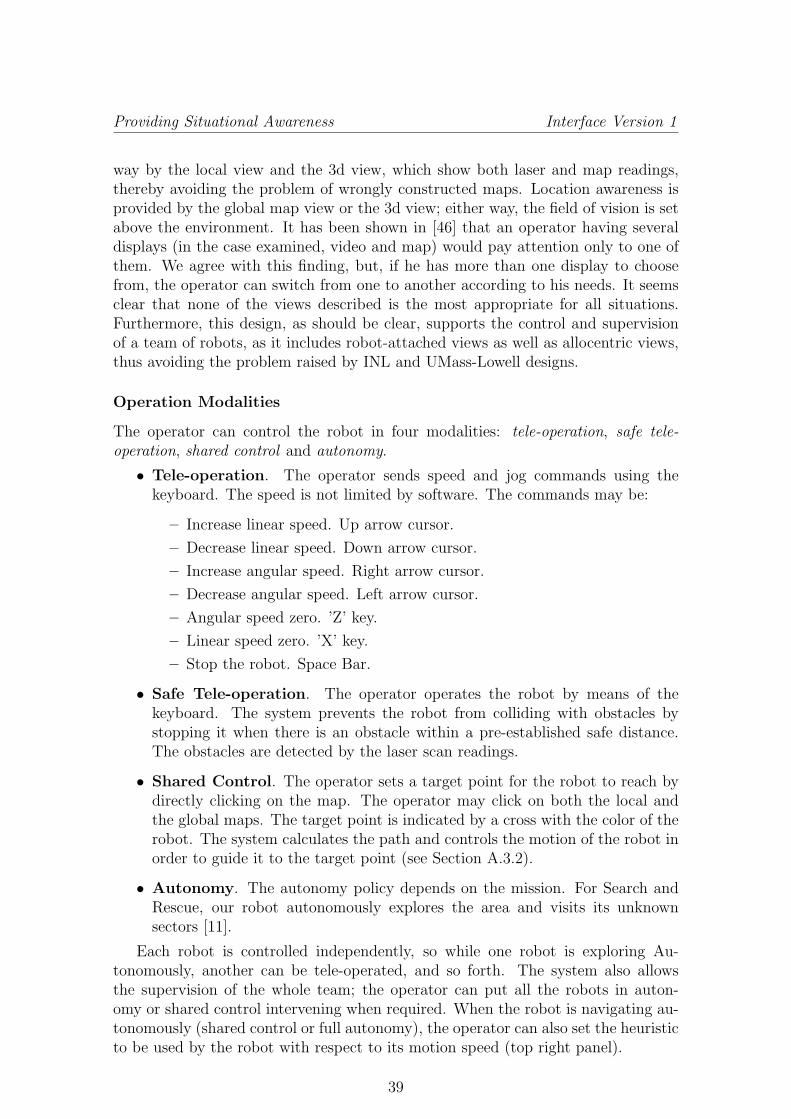
Providing Situational Awareness Interface Version 1
way by the local view and the 3d view, which show both laser and map readings,thereby avoiding the problem of wrongly constructed maps. Location awareness isprovided by the global map view or the 3d view; either way, the field of vision is setabove the environment. It has been shown in [46] that an operator having severaldisplays (in the case examined, video and map) would pay attention only to one ofthem. We agree with this finding, but, if he has more than one display to choosefrom, the operator can switch from one to another according to his needs. It seemsclear that none of the views described is the most appropriate for all situations.Furthermore, this design, as should be clear, supports the control and supervisionof a team of robots, as it includes robot-attached views as well as allocentric views,thus avoiding the problem raised by INL and UMass-Lowell designs.
Operation Modalities
The operator can control the robot in four modalities: tele-operation, safe tele-operation, shared control and autonomy.
• Tele-operation. The operator sends speed and jog commands using thekeyboard. The speed is not limited by software. The commands may be:
– Increase linear speed. Up arrow cursor.
– Decrease linear speed. Down arrow cursor.
– Increase angular speed. Right arrow cursor.
– Decrease angular speed. Left arrow cursor.
– Angular speed zero. ’Z’ key.
– Linear speed zero. ’X’ key.
– Stop the robot. Space Bar.
• Safe Tele-operation. The operator operates the robot by means of thekeyboard. The system prevents the robot from colliding with obstacles bystopping it when there is an obstacle within a pre-established safe distance.The obstacles are detected by the laser scan readings.
• Shared Control. The operator sets a target point for the robot to reach bydirectly clicking on the map. The operator may click on both the local andthe global maps. The target point is indicated by a cross with the color of therobot. The system calculates the path and controls the motion of the robot inorder to guide it to the target point (see Section A.3.2).
• Autonomy. The autonomy policy depends on the mission. For Search andRescue, our robot autonomously explores the area and visits its unknownsectors [11].
Each robot is controlled independently, so while one robot is exploring Au-tonomously, another can be tele-operated, and so forth. The system also allowsthe supervision of the whole team; the operator can put all the robots in auton-omy or shared control intervening when required. When the robot is navigating au-tonomously (shared control or full autonomy), the operator can also set the heuristicto be used by the robot with respect to its motion speed (top right panel).
39

Providing Situational Awareness Interface Version 1
3.3.2 PDA Interface
The PDA interface can boost the pervasiveness of robotic systems in mobile ap-plications, where operators cannot be pinned down in a particular place. Even ifmobile devices are less powerful than desktop computers, they offer the operator thecapacity to move, allowing a partial view of the actual scenario with the robot thathe is controlling. The disadvantages tied to device limitations could be balancedby the advantage of mobility, which could afford better situational awareness andso enhance the control of the robot. In a case such as the Chernobyl disaster, de-scribed on the introduction, first responders could control a robot team with a PDAinterface while having a partial view of the environment, and thus obtain on-fieldinformation not retrievable by the robot sensors. The PDA interface is obviouslysuited to exploiting just this advantage of mobility.
Operator Displays
Due to the reduced size of a PDA and its computational limitations, the displaycannot present on-screen all the data provided by the HRI system. In order topreserve the same functions offered by the desktop-based interface, we implementedthem using various simplified layouts. This underlines how critically important it isto present the operator only with the crucial data, as each layout change implies alonger interaction time with the device. Another critical point was to consider theslower input capacities of the operator with a PDA: these consist of a touch screenand a four-way navigation joystick. Thus, it is important to minimize the numberof interactive steps required to change a setting or to command the robot.
The PDA has two kinds of 2D views, each selectable with its own tab. The first,centred on the robot, is the Laser View (Figure 3.7(a)). The second is the MapView (Figure 3.7(b)), equivalent to the desktop interface Global Map View.
A third tab (Figure 3.7(c)) is dedicated to the Robot Control functionalities.
Laser View. This is an egocentric view attached to the robot; it remains station-ary at the bottom part of the display. It offers a precise real-time local representationof what obstacles the robot is facing. The graphic for this view is very simple and noother information relative to the robots status (orientation, speed, etc.) is provided.This view can be zoomed in and out.
Map View. This is an allocentric view relative to the explored environment. Itallows the operator to retrieve the map of the explored area. It can be zoomed in orout. By clicking on a point within the map, the operator commands the robot to goto a target point (shared control). As the whole map is computationally expensive,we decided to eliminate periodic self-updating; the map refreshes itself only on theusers demand.
Autonomy Levels Panel. This allows the user to set his desired robot controlmode. In Shared Control or Autonomy Mode, he can also set the kind of heuristicthat will be used by the robot with respect to its motion speed.
40

Providing Situational Awareness Interface Version 1
(a) PDA Interface v.1: LaserView
(b) PDA Interface v.1: MapView
(c) PDA Interface v.1: Auton-omy Levels
Figure 3.7: PDA Interface.
41

Providing Situational Awareness Interface Evaluation
Operation Modalities
The operation modalities for the PDA are equivalent to those for the desktop in-terface. When the operator is in the laser view or the map view mode, he cantele-operate the robot using the cursor of the PDA. There are two speed controlmodalities:
• fixed control. When the operator presses the ”up” cursor, the robot movesforward at a fixed speed, which is the same for right, left and back directions.When the operator releases the cursor, the robot stops.
• Incremental control. Each time the operator presses the cursor, the robotspeed increases or decreases by increments or decrements (according to thecursor). To stop the robot, the operator must press the middle button.
For shared control, the operator must select the map view. The operator can usethe pen-stick to click onto the desired target point the robot is supposed to reach.
3.4 Interface Evaluation
The evaluation of the first prototype was designed to measure the usability of theinterface developed. Since it was a first prototype, no particular aspect was givenspecial attention.
3.4.1 Experiment Design and Procedure
This first experiment was something intermediate between a field experiment anda laboratory experiment, due to the logistic limitations of this research experimen-tation could not be conducted with final users. For this experiment students wereenrolled and a disaster scenario was simulated on the playground of the University.The experiments involved twenty-four subjects, nineteen undergraduates and fivePhD candidates ranging in age between 20 and 30 and distributed among four fe-males and twenty males. No participant had previous experience of either of the twointerface prototypes. All the subjects went through the experiments in the same or-der, which ensured that no one had more experience than the others. Every subjectwent through a twenty-minute training program to acquire a basic knowledge of thefunctionalities provided by the interfaces. After the training, they ran through theexperiments in order. Each subject had a single trial.
Experiments were conducted with the real Rotolotto P2AT robot (the roboticplatform is presented in Section A.1.1) in both indoor and outdoor scenarios. Sub-jects were asked to explore a maze and navigate along a path , approximately 15meters in length, made up of narrow spaces and clustered areas. The subjects car-rying the PDA could see the outdoor scenario and the robot but not the indoorscenario. Subjects working with the desktop computer were not able to see thescenario at any time during the experiment.
We asked users to ”think aloud” during the task, as we wished afterwards toapply the LASSO evaluation technique (see Section 2.3.2).
42

Providing Situational Awareness Interface Evaluation
3.4.2 Desktop Interface
The desktop interface evaluation involved controlling the real robot in the way justexplained. In addition, however, subjects using the desktop interface were dividedinto two groups. One group was asked to perform an exploration task controlling onerobot, and the other group to perform it controlling two robots. This experimentwas run using the Player/Stage simulator.
For this first version of the interface we sought to measure whether the variationswe had introduced in the INL interface would meet our expectations. We would liketo recall these variations here.
• 3D View including laser data. The 3D view can display the map orthe laser readings, in order to avoid the problems proceeding from wrong orimprecise maps.
• 2D Local View. A local view attached to the robot and its surroundingswas included to enhance operator surroundings awareness.
• 2D Global View. The global view allows the operator to monitor the teamof robots, providing him with an allocentric point of view of the environment.
We enumerate here the main usability concerns expressed by the majority of sub-jects. We will list their positive and negative usability remarks regarding operatorsituational awareness.
Surroundings Awareness
Negative Remarks
• 3D View
– When the perspective in the 3D view is behind the robot correct percep-tion of the distance to the obstacles is compromised.
– The 3D view with the laser readings is dangerous with backward motion,as rear obstacles are not seen.
– The map of the 3D view sometimes hides the robot.
– The map may become too imprecise to guide the robot through verynarrow spaces.
– Most users found this view to be of no use.
• Local Map View
– Usually the operator gave the wrong direction command when the robotwas facing down
– The map may become too imprecise in narrow spaces, even when it iszoomed.
– The design of the robot is not appropriate. One tends to imagine thatthe robot is only the solid triangle on the map.
43

Providing Situational Awareness Interface Evaluation
• Global Map View. There was no comment regarding this view as it relatesto surrounding awareness.
Positive Remarks
• 3D View
– The laser view helps to identify with precision where the real obstaclesare.
– The laser view shows moving obstacles that do not appear on the map.
– Looking at the 3D view from above with the laser view, one can navigateeasily through narrow spaces.
• Local Map View
– If the map is right, this view is very useful for narrow spaces, becauseone can zoom as much as one wishes.
– Most users mainly used this view.
• Global Map View. There was no comment regarding this view as it relatesto surrounding awareness.
Location Awareness
Negative Remarks
• 3D View
– As the robot is always facing up, one can go south while thinking thatone is going north.
• Local Map View. No negative remarks.
• Global Map View
– The map is too small when the explored area is very big and it is veryhard to localize the robot.
– The path can become a source of confusion when the robot has beenmoving for a long time.
– The robot design (solid square) is not appropriate. It is not possible topinpoint its orientation.
Positive Remarks
• 3D View
– One can see the robot from a certain distance and thus have an overviewof the environment.
• Local Map View
44

Providing Situational Awareness Interface Evaluation
– One can see the orientation of the robot.
– When the global map is too big for the global view, one can zoom outthe local view and have a good idea where the robot is.
• Global Map View.
– One knows where every robot is.
– The design of the path indicates where the robot has been previously.
Status and Activity Awareness
Negative Remarks
• When visualizing the map in the 3D view, it is difficult to know if a robot hascollided with an obstacle, with the result that it is difficult to ascertain whyit is no longer in motion.
• The visualization of the linear speed is not useful, as one cannot distinguishwhen the robot is standing still from when it is only moving slowly.
• It is difficult to know when a robot (not selected) has stalled, as only the robotitself, but not its speed, is displayed on the global map.
• Shared control does not enable the operator to ascertain which path the robotwill follow to reach the target point.
• When the robot is still in shared control, there is no way of knowing whetherthe path planner has failed or whether the motion control is impeded fromfollowing the calculated path.
• In autonomy there is no telling where the robot is going.
• When the robot is still in autonomy, there is no way of gauging whether itdoes not know where to go or whether it does not know how to get there.
Positive Remarks
• Marking each robot with a different color is very useful.
• The yellow arrow on the robot indicating the robot jog (3D view) is very useful.
• The clock is helpful for gauging how much time one has been operating (andfor estimating the battery life time remaining)
45

Providing Situational Awareness Interface Evaluation
Figure 3.8: Distribution of Operation Modalities. Single Robot
Figure 3.9: Distribution of Operation Modalities. Two Robots
Operation Modalities
We measured the amount of time that each robot spent in each of the four operationmodalities (tele-operation, safe tele-operation, shared control, and autonomy). Thedistribution of the operation modes for one robot can be seen in Figure 3.8. For tworobots it can be seen on Figure 3.9.
When the operators were controlling one robot, they preferred tele-operation.When they were controlling two robots, they found shared control to be most suited,but the lack of status feedback (planned path, error messages) discouraged themfrom using it more extensively. Almost no operator used autonomy, since it affordedthem no idea of what the robot was doing (lack of activity and status awareness).
As for safe-teleoperation, operators thought that stopping the robot when there isan obstacle in the vicinity inhibits navigation in narrow spaces and causes abruptnessin the robots motion.
46

Providing Situational Awareness Interface Evaluation
3.4.3 PDA Interface
The PDA does not support the control of multiple robots at one time, so operatorswere asked only to control the real Rotolotto P2AT robot. We enumerate herethe chief usability concerns on which the majority of subjects agreed. We willlist the positive and negative usability remarks regarding the operators situationalawareness.
Surroundings Awareness
Negative Remarks
• Laser View. As the robot is indicated at the bottom of the screen (see Figure3.7(a)) it is difficult to keep track of the obstacles behind the robot.
• Map View. Too small to provide proper surroundings awareness. The useof an arrow to indicate robot orientation (see Figure 3.7(b)) hides part of themap.
Positive Remarks
• Laser View. The position of obstacles in front of the robot is quite preciseand is sufficient for navigating even in narrow spaces.
• Map View. In open spaces, this view is sufficient for navigating withoutcolliding with obstacles.
Location Awareness
Negative Remarks
• Laser View
– It is very difficult to keep track of the position and orientation of therobot.
– It is very difficult to know where the operator has been previously.
• Map View
– It is easy to forget where the robot has been (the path it has followed).
– The map design is very small.
Positive Remarks
• Laser View. This view was inadequate for providing location awareness.
• Map View. This view does not provide information as to where the robothas been.
47

Providing Situational AwarenessInterface Evolution
Version 2
Status and Activity Awareness
As for robot status and activities, apart from the aspects described in the desktopInterface, the operators would have liked to know the speed of the robot, which isnot indicated by this interface. This was an issue raised by all the subjects.
One of the major weaknesses in the operation of the robot was the size of thecursor pad. On a standard PDA device, the cursor is quite small and not designed tobe used continuously and precisely. Almost all the subjects wished to have anotherinput device. Most operators preferred the tele-operation modality in which theycould increase and decrease the speed and were unfavourable to the modality witha set speed (see Section 3.3.2). They argued that, while the fixed speed can be veryconvenient (for example, when the operator releases the cursor, the robot stops),there are areas calling for greater speed—such as open spaces—as well as areascalling for greater slowness —such as narrow spaces. spaces, where you need to goslower.
In conclusion, for the PDA interface, the surroundings awareness is providedmainly by the laser view, while the contribution of the map view is negligible.Conversely, the laser view is not appropriate for location awareness and even leadsto confusion. The major problem with this interface is that the operator must changeview modes in order to acquire a proper location and surrounding awareness. Sincesuch view shifts are time-consuming due to the reduced computation capabilities ofthe PDA, the operator tends to use only one of the views provided, even though noone view is sufficient for the task at hand.
Another problem with the PDA interface lies in its low computation speed and itscommunications latency. Given both of these issues, the refresh rate of the displayeddata is too high to be compatible with fast and safe operation. A related problem isthat it is difficult to tell whether the robot is not moving or if the problem is simplythat the display has not yet been refreshed.
Nevertheless, as the last chapter will show, the intra-scenario mobility of theoperator counterbalances, for some tasks and situations, all of the limitations shownhere.
3.4.4 Usability Heuristics
In Section 2.1.1 we showed a set of heuristics that evaluated the usability of a human-robot interaction system. We will summarize the results of the experiments appliedbased on these heuristics. The results can be seen in Table 3.1.
3.5 Interface Evolution
Version 2
The evaluation presented above propelled the evolution of the interface toward thenext prototype, version 2. This version will be evaluated in next chapter.
48

Providing Situational AwarenessInterface Evolution
Version 2
Heuristic Desktop PDARequired informationshould be present andclear
Yes, except with rearobstacles and video.
Rear obstacles shouldbe visible. Map is toosmall.
Prevent errors if pos-sible, if not, help usersdiagnose and recover
Badly designed, thereis no informationabout errors.
Very difficult to dis-tinguish robot errorsfrom device limita-tions
Use metaphors andlanguage the users al-ready know
Yes, the information isclear
Yes
Make it efficient to use Safe Tele-Operation isnot efficient. Sharedcontrol and Autonomydo not provide sta-tus and activities feed-back needed for effi-cient performance.
The device is too lim-ited and efficiency islow
Design should be aes-thetic and minimalist
Yes, but laser andmap should be inte-grated in one view in-stead of two (for the3D view)
Yes, but the windowfor choosing the au-tonomy level shouldbe integrated with theothers.
Make the architecturescalable and supportevolution of platforms
Yes This is difficult due tothe device limitations
Simplify tasksthrough autonomy
Yes, but more sharedbehaviours could beimplemented
Yes
Allow precise control Yes Yes, but cursor pad istoo small and difficultto use with precision
Table 3.1: Adapted Nielsen Heuristics
49

Providing Situational AwarenessInterface Evolution
Version 2
3.5.1 Desktop Interface
The issues discussed above led to the evolution of the first version into the interfaceshown in Figure 3.10.
The major novelties of this version are:
• The inclusion of a Team View (Figure 3.10(b)). More space is given to theteam map design. Both this view and the former global map view includednew functionalities:
– The operator can select an area to zoom.
– The robots are designated with a solid square and solid triangle indicatingthe direction.
– The active robot (the one being controlled) is surrounded by a yellowcircle.
– The operator can choose the active robot by clicking directly on the robot.
– The planned path to reach a target point is indicated on the map (forshared control and autonomy).
– The map contribution of each robot is no longer coloured.
– Some control buttons are included to set which information is to be shown(from left to right):
∗ Show/hide the path.
∗ Show/hide the corresponding explored area of each robot (on thecolor of the robot).
∗ Show/hide an indication of where a victim has been located (forsearch and rescue missions; this could be generalized for presentingother information). By clicking on the victim icon, the operator canedit a description of the victim (on the right panel).
∗ Show/hide the location where pictures of the environment had beentaken (a click on the picture icon makes the image appears in apop/up window). The operator can use the mouse to tag a victimwith a picture.
∗ The three last controls are for showing/hiding a priori maps used forthe Rescue Robocup Competition. They can be generalized to showany kind of a priori information about the environment, terrain, andso forth.
• The innovations in the local view are (Figure 3.10(a)):
– Map and laser readings are fused. Map in black and white, laser readingsin green. This avoids the problem of wrong or imprecise maps, as thelaser readings are shown. Plus, as both are shown in the same view, evenif the operator is relying on the laser readings, he can keep rear obstaclesin view.
– The robots are designed with a solid square and a solid triangle for indi-cating the direction.
50

Providing Situational AwarenessInterface Evolution
Version 2
(a) Desktop Interface v.2 Robot View
(b) Desktop Interface v.2 Team View
Figure 3.10: Desktop Interface. Version v.2
51

Providing Situational AwarenessInterface Evolution
Version 2
– The inclusion of some control buttons to configure the way the informa-tion is displayed (from left to right)
∗ Show/hide laser readings design.
∗ Show/hide map; this makes it easy for the operator simply to ignorethe map when it is incorrect.
∗ Show/hide robot path.
∗ Keep the robot facing up, or keep the map oriented northwards. Ifthe robot is kept facing up, its location on the screen remains fixed(position and angle) and it is the map that moves. The map is nolonger turned north, but the difficulties involved in controlling therobot when it is facing down are avoided. If the map is orientednorthwards, then the orientation of the robot on the map shows itsreal orientation.
• The innovations in the 3D view are (Figure 3.10(a)):
– Map and laser readings are fused. Map in blue blocks, laser readingsin dark red. This avoids the problem of wrong or imprecise maps. Theicons controlling the laser and map design for the local view also affectthis view, so the operator can choose to see one of them of both at thesame time.
– The video feed-back is included in the 3D view, as it is in the INL inter-face.
• The video feed-back is always present in the top right part of the interface.This is especially useful when the operator chooses the team view.
• The inclusion of a robots panel on the left side indicating the speed of eachrobot, the operation mode, and error conditions: robot stalled, path error, andexploration error.
• A button in the top-left corner for switching between team view and robotview.
3.5.2 PDA Interface
The limitations of the PDA do not allow the implementation of all the user desires.Fusing the map and the laser readings in a single view as in the desktop interfacewould be overtaxing device computation capabilities. Nevertheless, we developeda new prototype, the second version, which is a great improvement over the first.This prototype is shown in Figures 3.5.2 and 3.5.2.
The innovations are:
• Laser/Sonar View. Figure 3.5.2.
– The robot has been moved to the middle of the screen, and the sonarreadings (including rear sonars) are also designated.
52

Providing Situational AwarenessInterface Evolution
Version 2
(a) Player/Stage Screen-shot
Figure 3.11: PDA Interface v.2. Laser/Sonar View
53

Providing Situational AwarenessInterface Evolution
Version 2
(a) Player/Stage Screen-shot
Figure 3.12: PDA Interface v.2. Map View
54

Providing Situational Awareness Conclusions
– Ray-tracing has been done, in order to distinguish free areas from un-known areas.
– The operator can also change the zoom of this view.
– The operator can control the robot speed by touching the screen directly.Transparent cursors avoid the hiding of information. The operator canclick on the direction that he wants the robot to take, and the speed(linear speed and jog) is set according to the direction. If the operatorclicks on the robot, the robot stops. This works in both speed controlmodalities: incremental and pre-set.
– A menu has been added to enable selection of the operation mode, elim-inating the need for the operator to change display.
• Map View. Figure 3.5.2.
– The operator can select an area on the map view to be zoomed.
– The control of the speed and jog is also integrated into the screen.
– A menu for changing the autonomy mode is also present on the screen.
3.6 Conclusions
In this chapter, we have presented the first prototype of our human-robot interfaces.These interfaces, while keeping the same interaction pattern, are designed for twodifferent devices: a desktop computer and a PDA. The interfaces were designedtaking account of the most important guidelines present in the literature. Previousinterface designs were reviewed and their experimental evaluation was taken as a ba-sis for our interface development. The usability studies conducted on our interfacesled to the elaboration of a second prototype, presented at the end of the chapter.The main contributions presented in this chapter are:
1. Set of principles for a robotic interface design that would provide the operatorwith both surroundings and location awareness. Existing literature definestwo types of interface: map centric and video centric. This separation stressesthe locations awareness (map centric) or the surroundings awareness (videocentric). Our interface does not stress any of them, but provides differentviews, integrated in a single display, permitting the operator to use the mostsuitable according to the task.
2. Design, implementation and evaluation of two interface prototypes, for desktopcomputers and for hand held devices. Both interfaces were considered by theusers as simple and minimalist. The information is clearly presented on thescreen on an intuitive way and following the user requirements.
3. After conducting user evaluation it was made the design and implementationof a second prototype of the interfaces. The usability of the interface wasimproved including configuration options, allowing the operator to decide the
55

Providing Situational Awareness Conclusions
way in which the information should be shown and which information to vi-sualize. Furthermore the location awareness was enhanced by adding a globalmap view.
4. The integration of the map-centric and video-centric principles resulted in aninterface capable of supporting multi-robot control and supervision, which wasnot possible in the interfaces reviewed.
The lessons learnt in this chapter indicate that the subdivision made previouslyin the literature between map-centric and video-centric does not cope with the gen-eral requirements of interface design. Map-centric displays are suited for providinglocation awareness, while video-centric are more suitable for providing surroundingsawareness. In any case, video helps to identify visual landmarks, what permits theoperator to localize the robot (location awareness) and a proper map can give aprecise localization of close obstacles. According to this, our interlace breaks withthat distinction, and in fact, it cannot be said to be map-centred, nor video-centred,as it implements both kinds of information not prioritizing any of them. This designallows the operator to pay attention to the most suitable according to the task. Evenif there are more displays than in INL and UML interfaces, ours remains simple andeasy to use.
While the first prototype evaluation was a general usability study, focused mainlyon the operator SA for controlling one robot, the next chapters will evaluate the sec-ond prototype, paying special attention to the operation modalities and the operatorSA required for controlling a team of robots. Next chapter contains a preliminaryexperimental study, to ascertain the requirements of multi-robot missions and thelimitations of the existing prototypes. The following chapter proposes a new proto-type and runs a new evaluation to test the improvements.
56

Chapter 4
Designing for Multi-robotMissions (I)Initial Exploration.
4.1 Introduction
Increases in the degree of robot autonomy and new robot-coordination techniquesare leading researchers to deploy teams of robots for exploration missions. Thisbrings a new challenge to the Human-Robot-Interaction system: How does the in-formation coming from robots working in different places need to be integrated intoa Graphical User Interface?; and how can the robots be controlled both individuallyand/or as a team? The answers to these questions would be crucial for enablinga single operator to be control and/or supervise a team of robots deployed in anunknown environment. Consequently, researchers are being encouraged to analyse,design, and test multi-robot teams controlled by a single operator. An example ofthis new interest are the RoboCup Rescue Virtual Robot Simulation InternationalCompetitions, organized by the National Institute of Standards (NIST) of the USA.The USARSim Simulator (used in the RoboCup) allows researchers to test theirsoftware on a variety of robotic platforms and emergency scenarios [5]. Militarymissions, surveillance, scheduled operations, and so forth, are also examples of ap-plication of this research.
Developments in Graphical User Interfaces (GUIs) for tele-operating mobilerobots have mainly focused on the single-robot paradigm. As we have seen withthe UMass-Lowell and INL interfaces, the main concern is how to provide the oper-ator with the required Situational Awareness for controlling a remote mobile robot[76]. A multi-year study conducted for the RoboCup Competition [75], revealedpoor interface designs. Yanco et al. designed and evaluated a video-centric interface[74], thus creating a great interest in the GUI design. The Human Robot InteractionINL research group1, designed a map-centred interface [46], giving the operator afirst-person point of view on the environment. Both interfaces were experimentallycompared in [23]. As we have seen in the previous chapter, the limitation of thesetwo interfaces is that they are difficult to extend to the multi-robot paradigm with-
1http://www.inl.gov/adaptiverobotics/

Designing for Multi-robot Missions (I)Initial Exploration. Introduction
out considerable re-design. In the first GUI mentioned above, the video informationis closely related to robot localization, and is thus unfeasibile for managing a teamof robots that are spread out over a given area; the INL GUI, which is map-centred,would be easier to extend to the multi-robot scenario, as the mapped environmentis common to all robots. Nevertheless, it has been designed in order to maintainthe operator’s point of view mainly above the robot, which thus creates the sameproblem flagged just now.
These works have laid the basis for a good single-robot interface design. The thenext step has to pass through multi-robot systems. There are many advantages tousing multiple robots in complex exploration tasks such Search and Rescue: Properlycoordinated robots can cover a given area faster than a single robot, and they can bedeployed to create an ad-hoc network structure. The key problem to be solved is howto coordinate the robots so that they simultaneously explore different regions of theirenvironment. Our group has studied this point in a number of articles, for example[57] and [11]. SLAM can also benefit from the use of multiple-robot sensing thanksto the reduction of the uncertainty associated with localization and map-building[58][66]. To act effectively in a situation of uncertainty the operator needs to be ableto estimate accurately the state of the environment, and thus to have a constantsupply of fresh information on the dynamically changing situation. But individualrobots, fitted out with unreliable sensors, may be unable accurately to determinethe current situation, whereas the team as a whole can exchange information so asto perform a better situation assessment through the verification of hypotheses [62].
From the operator’s point of view, the control and supervision of a team of robotsbrings a challenging novelty coupled with many difficulties. It is not only a questionof the time the operator has at his disposal during the mission. He needs more thanjust ”free” time to switch control from one robot to another while supervising themsequentially; he also needs to process and integrate all the information coming fromthe robots deployed in order to gain a global Situation Awareness of the scenarioand the robots [76]. He must be able to send the proper commands, not only to theindividual robots, but also to the team in order to guide their coordinated action,and so forth. The more the Interaction System supports the operator in this task,the better he will perform.
Robots, considered as single entities, are individual sources of information, in-formation that cannot be ”processed” by a human if not properly integrated. Oneoperator cannot tele-operate several robots simultaneously. If he merely switchescontrol from one robot to another, the performance effectiveness of the operation isgreatly reduced. Adams et al. address this problem by proposing to focus, not onthe individual robots, but on the team as a whole, integrating the information fromthe team and sending team commands [40][69]. This approach is limited in that itpresupposes that the robots are able to carry out autonomously the low level tasksassigned to them by the team coordination layer, which is not feasible in hazardousscenarios such as Urban Search and Rescue. Goodrich et al., propose dynamic ad-justment of the autonomy level to keep the operator workload within acceptableranges in response to environment and workload changes [33]. This would minimizethe time required by each robot, permitting the operator to switch among them. Thelimitation is that the robots are not treated as a team. Burke and Murphy, basing
58

Designing for Multi-robot Missions (I)Initial Exploration. Related Work
themselves on field studies, consider that an operator is not suitable for controllingmore than one robot simultaneously in real Search and Rescue Missions [8]. Similarideas were presented in [67]. Scholtz et al. experimented with autonomous off-roaddriving, analysing the number of times that an UGV requires operator assistanceto complete the task. Based on this analysis they conclude that one operator cansupervise only two UGVs simultaneously in outdoor environments [60]. Fong et al.proposed a system in which the operator is just a supervisor who is asked for helpby the robot when his assistance is required [28]. Unfortunately, no study of thescalability of Fong’s system was made. A preliminary proposal similar to Fong’s wasmade in [68].
In this chapter, we will study how our desktop interface supports the multi-robotparadigm. We will present the results of an analysis of a controlled experiment inwhich a Search and Rescue Operation was simulated using USARSim. We modifiedthe number of robots, from 1 to 4, and analysed the performance of the operators.They also filled out questionnaires. The data analysed enables us to identify the crit-ical points in multi-robot tele-operation. On the basis of the results, we developed athird interface prototype, which will be explained and evaluated in the next chapter.The goal of this study is to design and implement an adequate single-operator-multi-robot interaction system. The present chapter is organized as follows. We will be-gin with a section on related work, where some literature on operation modalitiesand autonomy adjustment will be reviewed. Section 4.4 describes the experimentdesign and data analysis. The discussion will argue in favor of the design of the nextprototype, which will be evaluated in turn in a corresponding experiment.
4.2 Related Work
Vehicle tele-operation is the act of operating a machine at a distance. Distance is avague concept, as it may refer to a great distance, such as in the remote control of anunmanned vehicle on Mars, but also to a micro-robot in tele-surgery, in which bothsurgeon and robot may be working on-site. In exploration and search missions,tele-operation generally refers to the operation of unmanned vehicles in difficult-to-reach environments for the sake of reducing mission cost and avoiding loss oflife. Tele-operation can include any level or type of robot control, from manualto supervisory. Furthermore, the type of control may be shared/traded betweenoperator and vehicle. In this section, we introduce the types of control involved inautomated systems, analysing the levels of autonomy and the modalities in whichone operator can control the remote system.
4.2.1 Autonomy Levels and Autonomy Adjustment
Automation is the use of control systems (such as numerical control, programmablelogic control, and other industrial control systems) to guide any process or machinerywithout the need for continuous input from an operator, and consequently, withreduced need for human intervention. A completely automated system would be asystem capable of running all the required tasks it has been programmed for withoutthe need for any human intervention, or even of any human supervision. For many
59

Designing for Multi-robot Missions (I)Initial Exploration. Related Work
tasks this is not feasible, and the automated system needs a human partner (or teamof humans). This leads to the following question: given certain technical capabilities,which system functions should be automated and to what extent? There cannot bejust one answer to this question. Suppose, for example, that a system were able toperform a task in complete autonomy; it could nonetheless happen that the taskis completed better, safer, faster, and the like with the aid of a human supervisor.Conversely, there may be tasks that an automated system can perform better dueto its ability to process large amounts of data very rapidly. There are also tasksthat humans do not wish to perform because they are dangerous or repetitive, andin that case, even if the human could perform better, a machine would be preferred.
We study here the utilisation of a team of robots to explore an unknown area.We present the design of a system that enables one operator to control and super-vise the mission. As one person cannot tele-operate several robots simultaneously,they must have some degree of autonomy in order to achieve an acceptable level ofperformance. In this application, automation does not aim to supplant the human,but to make him a team-mate. Consequently, in our application, the word ”automa-tion” refers to the full or partial replacement of a function previously carried outby the human operator. For example, if the operator sets a target point that therobot reaches autonomously, the motion control functionality would be carried outby the system. Another example: If the system prevents collisions by limiting robotspeed, the operator would still tele-operate, but the function of avoiding collisionswould be partially guaranteed by the system. This implies that automation is notan ”all or nothing” affair, but can vary across a continuum of levels, from the lowestlevel of fully manual performance to the highest level of full automation. Parasur-aman, Sheridan and Wickens define a 10-point scale, with lower levels representingincreased autonomy of computer over human action [51]:
1. The computer decides everything, acts autonomously, ignoring the human.
2. The computer informs the human only if asked, or
3. executes automatically, then necessarily informs the human, and
4. allows the human a restricted time to veto before automatic execution, or
5. executes that suggestion if the human approves, or
6. suggests one alternative
7. narrows the selection down to a few choices, or
8. The computer offers a complete set of decision/action alternatives, or
9. The computer offers no assistance: the human must make all decisions andperform all actions.
The variation of the level of autonomy and its influence on the system, appliedto mobile robotics, has been studied in recent years by Michael A. Goodrich andhis colleagues. In [16] they experimentally studied the influence of operator neglectand automation level on mission performance. They concluded that the lower the
60

Designing for Multi-robot Missions (I)Initial Exploration. Related Work
Figure 4.1: Effect of operator neglect over system performance
autonomy level was, the larger was the negative impact of operator neglect; and,conversely, the greater the autonomy level was, the less was the impact of suchneglect. A graph representing this effect can be seen in Figure 4.1. If the systemis fully autonomous, the operator has no effect, while if it is fully tele-operatedthe performance diminishes drastically as soon as the operator neglects the control.We can also learn from this graph that a tele-operated system will perform better(whenever it is not neglected). The research question arising in this situation is, aswe said at the beginning of the section, that of finding out to what extend we shouldautomate in order to achieve the best performance.
In [33] Goodrich et al. study the differences between two operation styles whencontrolling a team of robots: the sequential style, in which the operator gives acontrol command to each robot sequentially, and the playbook-style, in which thehuman manages clusters or subteams of agents and issues high-level directives thatthe agents implement in a coordinated manner. Adams has designed and evaluatedseveral interaction systems implementing the playbook-style; examples are [40] and[69]. An example of an interface implementing the sequential style and its evalua-tion can be seen in [70]. Our system is designed for managing teams from one tosix robots. We have chosen the sequential style to the extent that there is no coor-dination layer among the robots. We have focused on providing the adequate levelof autonomy to each robot, so that the robot receives high-level goals and performsautonomously while the operator is commanding the rest of the team. With this inmind, we must consider how many robots one operator can control without a highdecrease in performance.
In a recent work, Goodrich et al. explore the so called ”mixed initiatives” [37].They present an experiment that concludes that a supervisor and group of searcherswho jointly decide the correct level of autonomy for a given situation (”mixed ini-tiative”) render a better overall performance than when an agent is given exclusive
61

Designing for Multi-robot Missions (I)Initial Exploration. Related Work
control over the level of autonomy (”adaptive autonomy”). Their performance isalso better than when a supervisor receives exclusive control over the agent’s level ofautonomy (”adjustable autonomy”), regardless of the supervisor’s expertise or work-load. An example of a mixed-initiative system can be seen in [30]. In our presentimplementation, the operator is responsible for the level of autonomy, so we work inan ”adjustable autonomy” mode. When we explore the multi-operator paradigm inChapter 6, a preliminary system following the ”mixed initiatives” paradigm will beproposed in order to improve mission performance and reduce operator the workload.
There are different ways in which an operator can remotely control an automatedsystem. In the following we will present two types of operation: supervisory controland collaborative control. These apply to any man-machine system, including theremote control of mobile robots.
4.2.2 Types of Control in Automated Systems
Supervisory Control
According to Sheridan, ”supervisory control means that one or more human oper-ators are intermittently programming and continually receiving information from acomputer that itself closes an autonomous control loop from the artificial sensorsand through the actuators to the controlled process or task environment” [63]. Inrelation to the autonomy levels previously presented, this means that, with the ex-ception of a fully tele-operated system (where the system does not take any actionby itself, and only sends information to the operator), the operator always works asa supervisor.
In general, supervisory control requires a human-machine interface to enablethe operator to monitor a machine and assist it if necessary. Under supervisorycontrol, an operator divides a problem into a sequence of tasks, which the robotmust achieve on its own. The mobile robot must be able to perceive and to movein order to perform tasks autonomously. A critical point occurs when the operatormust intervene. If he is controlling many robots, he can focus only on the mostcritical issues. If several robots fail simultaneously, he would have to act sequentially,diminishing performance. It might also happen that robots are not failing, but thatthey are not performing well, and the operator must decide which robot is in mostneed of attention, in order to increase overall mission performance. In [45] Murphyand Rogers lay the basis for a supervisory control system capable of managingerrors. They present a system in which the intelligent sensing capabilities of a robotallow it autonomously to identify certain sensing failures and to adapt its sensingconfiguration accordingly. If the remote system cannot resolve the difficulty, it mustrequest assistance from the operator. Such a cooperative computerized assistantmust present the relevant sensor data from other perceptual processes and a log ofthe remote robot’s hypothesis analysis. This information is presented to the user ina form that can lead to an efficient and viable response. As we have already said inthe introduction to this chapter, such a system must:
1. Improve both the speed and quality of the operator’s problem-solving perfor-mance;
62

Designing for Multi-robot Missions (I)Initial Exploration. Related Work
2. reduce cognitive fatigue by managing the presentation of information;
3. maintain low communication bandwidths associated with semi-autonomouscontrol by requesting only the relevant sensory data from the remote; and
4. improve efficiency by reducing the need for supervision so that the operatorcan perform other tasks.
5. support the incremental evolution of telesystems to full autonomy
According to Adams [1], the five basic human supervisory functions include:
• the task planning which entails learning about the process and how it is carriedout, setting goals and objectives which the computer can understand and thenformulating the plan to move from the initial state to the goal state;
• teaching (programming) the computer by translating goals and objectives intodetailed instructions such that the computer can automatically perform por-tions of the task;
• the monitoring the autonomous execution either via direct viewing or remotesensing instruments to ensure proper performance;
• the ability to intervene by updating instructions or direct manual control if aproblem exists during execution; and
• the ability to learn from the experience by reviewing recorded data and modelsand then applying what was learned to the above phases in the future.
Collaborative Control
In human-robot interfaces, there must be a dialogue between the operator and therobot. The human should be able to express intent and interpret what the robothas done, while the robot should be able to provide contextual information and toask the human for help when needed. One approach to this type of interaction iscollaborative control, a tele-operation model in which humans and robots work aspeers to perform tasks [63].
Cooperative tele-operation tries to improve tele-operation by supplying expertassistance. Several robot control architectures have addressed the problem of mix-ing humans with robots. Fong proposed a new control model, called ”collabora-tive control” [30][28]. A human and a robot collaborate to perform tasks and toachieve goals. Instead of a supervisor dictating to a subordinate, the human andthe robot engage in dialogue to exchange ideas and resolve differences. An impor-tant consequence is that the robot decides how to use the human’s advice. Withcollaborative control, the robot has more freedom in execution of the goal. As aresult, tele-operation is more robust and better able to accommodate varying levelsof autonomy and interaction.
This type of control would be an example of mixed-initiative interaction. Inthe most general cases, the agents’ roles are not determined in advance, but are
63

Designing for Multi-robot Missions (I)Initial Exploration.
Interface Version 2.Operation Modes
opportunistically negotiated between them as the problem is being solved. At anyone time, one agent might have the initiative in controlling the interaction whilethe other works to assist him/it, contributing to the interaction as required. Atother times, the roles are reversed, and at still other times the agents might beworking independently, assisting each other only when specifically asked. The agentsdynamically adapt their interaction style to address the problem at hand in the bestmanner. The best way to view interaction between agents is as a dialogue, whichmeans that mixed-initiative is a key property of effective dialogue [4].
4.3 Interface Version 2.
Operation Modes
Our system follows the supervisory control paradigm. In supervisory control, robotswork nearly autonomously, but a human is watching and can stop or correct therobot at any time. Interaction occurs at the task (sequencing) level, and the humanhas the opportunity to rearrange the robots’ task plans or to stop the robot com-pletely. We present in what follows a single-operator-multiple-robot interface. Theoperator monitors the whole team, setting goals and assigning tasks to each robot.Then he typically monitors the execution of such tasks, acting whenever there isa failure or the autonomous system is not performing as he would have expected.We will define in this section the autonomy levels that e our interface provides anddiscuss how the operator controls the team of robots.
In the last chapter, we described the evolution between the first and secondprototypes of our interface in terms of providing operator situational awareness. Theevaluation we present in this chapter, while not leaving out the issue of situationalawareness, is more focused on operation modes. We can recall here the four operationmodes the interface provides the operator (we are currently working on the secondinterface version).
1. Tele-Operation. The operator directly sets the speed of the robot.
2. Safe Tele-Operation. The operator sets the speed and jog control values, andthe system parses them according to obstacles distance.
3. Shared Control. The operator sets a target point that the robot tries to reachautonomously.
4. Autonomy. The robot does not expect any operator input and navigates au-tonomously maximizing the explored area.
In order to understand better how the adjustment of autonomy works, we willexplain further how the operation modes act upon the robotic system. In AppendixA, we explain the robotic system. It consists of the classic multi-layered architecture,in which the higher layers command the lower ones. The layers are:
1. Exploration layer,
64

Designing for Multi-robot Missions (I)Initial Exploration.
Interface Version 2.Operation Modes
2. path planning layer,
3. motion layer,
4. safe motion layer, and
5. robot interface layer.
These layers were explained in detail in Appendix A. Here we will here onlysummarize their functioning. The exploration layer computes a target point. Suchtargets depend on the mission: search for victims, map an unknown environment,deploy robots in order to build an ad-hod network, and so forth. At this level,robots in a team may be coordinated or not. In our experiments, they were notcoordinated. The target point is passed on to the path-planning layer, whose taskis to build a secure path to reach the point. The path may be computed usinggeometrical information, semantic information, etc. Our software calculates the pathbased on the map that is built. Our map is represented by a grid map containing2D and 3D information. The operator, using the interface, can include informationabout transitable and non-transitable areas in the map, and these areas are usedto calculate the path. The motion layer receives the path and tries to follow it.Our motion layer is reactive, and it modifies the path locally according to dynamicobstacles that may be in the way. The obstacles are ongoingly tracked by the 2Dlaser range scanner. This layer sets a control speed and control jog for the robot.These are processed by the safe motion layer, which adjusts the speed on the basisboth of the obstacles around the robot and a set of parameters: safe frontal distance,safe lateral distance, maximum frontal speed, and so forth. This layer uses severalkinds of information to detect obstacles: 2D laser, 3D laser, sonars, and map. Theoperator can adjust the safe motion parameters in order to activate or deactivatethe use of any of this information for obstacle detection. For example, if the mapis badly constructed, the operator can ”command” the safe motion layer not to usethe map, and so forth. The robot interface layer sends the actual speed and jog tothe robot. This layer may contain the mechanical limitations placed on the robot’sspeed, parsing the speed and jog that it receives from the layer above it.
In Version 2 of the interface, depending on the operation mode, the operatoractivates a sub-set of layers. In Autonomy Mode, all layers are working and nocommand is expected from the operator. In Shared Control, only layers 2 to 5are activated, and the operator sets the target point. In Safe Tele-Operation, theoperator directly sets the control speed and jog, and layers 1, 2, and 3 are deacti-vated. In Tele-Operation, only the robot interface layer is working, and we are in amaster-slave operation mode. An example of Shared Control can be seen in Figure4.2.
The Safe Tele-Operation mode of the second prototype is different from thefirst version. We recall that the subjects who evaluated the first prototype statedthat stopping the robot whenever an obstacle is within the safe distance causesabruptness of motion in the robot. Furthermore, it was not possible to navigate innarrow spaces, even if obstacles were not in the direction in which the operator wasattempting to move. Figure 4.3 represents these problems.
65

Designing for Multi-robot Missions (I)Initial Exploration.
Interface Version 2.Operation Modes
Exploration Layer
Path Planning Layer
Motion Layer
Safe Motion Layer
Robot Interface Layer
Human-Robot Interaction Layer
Target Point
Target Point
Path
Control speed and Jog
Effective speed and jog
Shared Control
Figure 4.2: Shared Control Operation Mode
Figure 4.3: Speed control in interface version 1
66

Designing for Multi-robot Missions (I)Initial Exploration.
Interface Version 2.Operation Modes
Figure 4.4: Speed control in interface version 2
In the second version of the interface, we have implemented a new safe motionpolicy. It works as follows.
• Robot linear speed is limited proportionally to the distance to obstacles infront of (or behind) the robot width.
• There is a ”closest safe distance”; once within this distance, the robot isstopped.
• Robot angular speed is limited proportionally to the distance to lateral obsta-cles, the limit being different for the right and left sides.
In this way, the robot’s speed begins to decrease as it approaches an obstacle,until it completely stops within a safe distance. As linear and angular speeds aretreated independently, the robot can be navigating a narrow space between lateralobstacles without the linear speed’s being limited (provided the robot moves alongbetween the obstacles, and not towards them). The same holds when the robot hasto turn a corner. Even if it comes very close to the wall in front of it, it will be ableto turn right or left without any limitation in angular speed (while the linear speedlimit will be very low or even zero). For purposes of clarification, this mechanism isshown in Figures 4.4 and 4.5.
We use an adjustable autonomy paradigm. The operator is responsible for choos-ing the most suitable operation mode. The operator changes autonomy level byclicking on the corresponding button on the bottom, or by sending a command thatbelongs to another operation mode than the one he is working in. For example, ifthe operator is in Autonomy Mode and sets a target point (by clicking on the map),the system will change automatically to Shared Control. If the robot is working inShared Control, and the operator sends a speed command by pressing the corre-sponding key, the system will change to Safe Tele-operation. The states machinethat regulates this adjustment of the autonomy level can be seen in Figure 4.6.
67

Designing for Multi-robot Missions (I)Initial Exploration.
Interface Version 2.Operation Modes
Max. speed
SPEED LIMIT
Safe distance OBSTACLE DISTANCE
Figure 4.5: Speed limit in interface version 2
A
BD
C
Operator sets Safe Tele-Op
Operator sets Tele-Op
Operator sets Shared Control, OROperator sets a Target Point
Operator sets Safe Tele-Op, OROperator sends speed cmd
Operator sets Tele-Op
Operator sets Autonomy
Operator sets Shared Control, OROperator sets a Target
Operator sets Safe Tele-Op, OROperator sends speed cmd
Operator sets Tele-Op
A: Tele OperationB: Safe Tele-OperationC: Shared ControlD: Autonomy
Operator sets Autonomy
Figure 4.6: Autonomy Adjustment State Machine
68

Designing for Multi-robot Missions (I)Initial Exploration. Interface Evaluation
4.4 Interface Evaluation
As we said at the beginning, an effective operation of multiple robots requires thatthe operator’s time be distributed among the robots; this allows him to supervisethe whole team and intervene whenever this is required. The experiment we are pre-senting here aimed to evaluate scalability of the mechanism of autonomy adjustmentthat we implemented. Furthermore, subjects were asked to fill out questionnairesas a way of measuring the usability of the interface for multiple-robot control andsupervision.
4.4.1 Experiment Design and Procedure
Forty subjects (thirty-five males, five females) participated in the experiments. Allof them were either master students, PhD students, or senior researchers in the fieldof engineering. None of them had had previous experience with the interface. Thesubjects were randomly divided into four groups. Each subject in a given grouphad to accomplish a Search and Rescue Mission while controlling a team of robots(number of robots ∈ [1 − 4]). Every subject went through a twenty-minute trainingprogram to acquire a basic knowledge of the functionalities provided by the interface.The training scenario was taken from the RoboCup Competition and was similar indifficulty to the scenarios used for the experiments.
The subjects were asked to run two experiments. In the first experiment, theyhad to explore an unknown office building (indoor scenario) in order to search forvictims. They were given 15 minutes. After completing this experiment, they filledout a usability questionnaire. In the second experiment, they were asked to explorean unknown urban outdoor area (with the same number of robots), also with the aimof finding victims. They were given 12 minutes. After completion of the experiment,they had to fill out another questionnaire. A victim was considered to be ”found”when the ”victim sensor” installed on the robots detected him, or when the operatortook a picture of him. After the training, subjects ran through the experiments inorder. Each subject had a single trial. No support was given to the subjects duringthe runs. Figure 4.7 shows a screen-shot of the indoor scenario. Figure 4.8 showsthe the outdoor environment.
4.4.2 Data analysis
The focus of our analysis is the influence of the factors Scenario ∈{indoor, out-door} and the number of robots ∈{1, 2, 3, 4}. Although we analysed more of thedata collected, here we are presenting only the data which led to more significantconclusions. The variables studied are:
• The area explored divided by the total time of the mission (Y 2). This is adirect measure of mission performance.
• The time distribution of the operation modes, that is, how much time eachrobot spent in each operation mode.
69

Designing for Multi-robot Missions (I)Initial Exploration. Interface Evaluation
Figure 4.7: Indoor Scenario used in the Experiments
Figure 4.8: Outdoor Scenario used in the Experiments
70

Designing for Multi-robot Missions (I)Initial Exploration. Interface Evaluation
• The percentage of the total time in which the robots were operating (moving)simultaneously (Y 1). If one or more robots are not moving, this indicates thatthe operator is unable to manage all of them. By the same token, these datawill inform us whether or not the size of the robot team is suitable.
• The relation between the time the robot remained stationary in AutonomyMode and the total time in that mode (Y 3). The robot’s not moving inautonomy mode indicates that: 1) the operator has not realized that the robotis not moving (lack of status awareness), or that the operator is aware of thisfact, but is busy with other tasks (size of robot team excessive).
• The relation between the time the robot remained stationary in Shared Modeand the total time in that mode (Y 4);
• The relation between the time the robot remained stationary in Tele-operationMode and the total time in that mode (Y 5);
Area Explored
Another measure of operator performance is the area covered by the team of robots.When an operator is controlling several robots simultaneously, he may neglect someof them, thus decreasing the time of simultaneous operation, as we have just seen.That said, this ”low utilization” might be justified if the area explored by the robotsis significantly large.
The following table shows collected data averages and standard deviations foreach experimental condition:
Indoor Scenario1 Robot 2 Robots 3 Robots 4 Robots
Average 285.7 366.38 451.43 424.5Std. Dev. 61.42 68.26 123.72 111.98
Outdoor Scenario1 Robot 2 Robots 3 Robots 4 Robots
Average 558.73 499.38 573.13 512.09Std. Dev. 163.97 150.71 136.65 136.56
Table 4.1: Explored Area
The results of the log(Y 2) Analysis of Variance (ANOVA) are shown in Table4.22. Both the scenario factor and the interaction are significant, leading to a level ofsignificance of 0.1, which translates into a confidence rate of 90%. Since interactionis a significant factor, the main effects must not be interpreted separately.
2log(Y 2) was studied because of the heteroskedasticity that appeared before transforming theresponse variable.
71

Designing for Multi-robot Missions (I)Initial Exploration. Interface Evaluation
Figure 4.9: Interactions and 90% Bonferroni Intervals, dependent variablelog(Area/Total time)
Source Sum sq D. f. Variance F-stat p-valA: Number of robots 0.5265 3 0.1755 1.81 0.1558B: Scenario 2.3579 1 2.3579 24.26 0.0AB: Interaction 0.7476 3 0.2492 2.56 0.0630Residual 5.8312 60 0.0971
TOTAL 9.5839 67
Table 4.2: ANOVA for log(AREA/TOTAL TIME)
fig. 4.9 shows the interaction plot. The best combination of the levels of thefactors corresponds to indoor scenario and 1 robot, but it is not significantly differentfrom indoor and 2, 3 or 4 robots, because the intervals are overlapped. The worstcombination of the levels of the factors under study corresponds to outdoor and 1robot, but it is not significantly different from outdoor with 2, 3 or 4 robots.
Operation Modes Distribution
The operation modes distribution is the percentage of time the robots spent in eachmode. It has been calculated adding the time each robot on the team spent in eachmode and then dividing the result of this addition by the number of robots and themission time. Values can be seen in the following table. They are represented inFigures 4.10 and 4.11.
72

Designing for Multi-robot Missions (I)Initial Exploration. Interface Evaluation
Indoor Environment
1 RobotTele-Operation Shared Control Autonomy
Average 0.85 0.15 0.01Std. Dev. 0.24 0.23 0.02
2 RobotsTele-Operation Shared Control Autonomy
Average 0.43 0.5 0.07Std. Dev. 0.3 0.38 0.13
3 RobotsTele-Operation Shared Control Autonomy
Average 0.3 0.56 0.14Std. Dev. 0.14 0.33 0.22Conf. Int. (95%) 0.11 0.25 0.16
4 RobotsTele-Operation Shared Control Autonomy
Average 0.3 0.48 0.21Std. Dev. 0.31 0.36 0.24
Table 4.3: Time Distribution of Operation Modes for the Indoor Environment
Outdoor Environment
1 RobotTele-Operation Shared Control Autonomy
Average 0.93 0.07 0.00Std. Dev. 0.16 0.16 0.00
2 RobotsTele-Operation Shared Control Autonomy
Average 0.48 0.41 0.11Std. Dev. 0.29 0.33 0.2
3 RobotsTele-Operation Shared Control Autonomy
Average 0.27 0.58 0.15Std. Dev. 0.19 0.38 0.21
4 RobotsTele-Operation Shared Control Autonomy
Average 0.42 0.41 0.17Std. Dev. 0.31 0.28 0.21
73

Designing for Multi-robot Missions (I)Initial Exploration. Interface Evaluation
(a) 1 Robot (b) 2 Robots
(c) 3 Robots (d) 4 Robots
Figure 4.10: Time Distribution of Operation Modes for the Indoor Environment
Table 4.4: Time Distribution of Operation Modes for the Outdoor Environment
Simultaneous Operation
When controlling a team of robots, the operator must try to use all of the robotssimultaneously. As he can tele-operate only one robot at a time, the rest of therobots have to be working at some level of autonomy: Shared Control, when atarget point is set, or, when it is not, then Full Autonomy. In the best case scenario,all the robots composing the team should be operating (moving) at any given time.This study measures the amount of time that all the robots were moving.
The following table shows the average portion of time in which all the robotswere moving simultaneously. Standard deviations are also shown.
Indoor Scenario1 Robot 2 Robots 3 Robots 4 Robots
Average 0.76 0.17 0.12 0.02Std. Dev. 0.11 0.13 0.07 0.02
Outdoor Scenario1 Robot 2 Robots 3 Robots 4 Robots
Average 0.8 0.15 0.1 0.03Std. Dev. 0.1 0.16 0.08 0.04
Table 4.5: Simultaneous operation of all the robots of a the team
74

Designing for Multi-robot Missions (I)Initial Exploration. Interface Evaluation
(a) 1 Robot (b) 2 Robots
(c) 3 Robots (d) 4 Robots
Figure 4.11: Time Distribution of Operation Modes for the Outdoor Environment
Source Sum sq D.f. mean sq F-stat p-ValA: Num of Robots 6.3302 3 2.1100 145.51 0.0B: Scenario 0.0018 1 0.0018 0.12 0.72Residual 0.9135 63 0.0145TOTAL 7.2455 67
Table 4.6: ANOVA for sqrt(total time in which the robots are operating simultane-ously).
Table 4.6 shows the ANOVA table (Analysis of Variance) of√
Y 13. The maineffect of the number of robots is significant, while the effect of the scenario is not.Since interactions are not significant and the F-statistic here is less than 1, the modelcan be re-estimated only including main effects.
fig. 4.12 shows the main effects of number of robots and scenario4. The√
Y 1 issignificantly greater when the operator is controlling 1 robot. There are no significantdifferences between Indoor and Outdoor scenarios.
Stop Condition Analysis
We also found it useful to analyse the conditions in which a robot was neglectedby the operator. A robot is neglected when the operator is not aware of the state
3We analysed the square root of the variable Y 1 because without this transformation the ho-moskedasticity hypothesis was violated.
4Bonferroni adjustment has been applied to solve the multiple comparisons problem.
75
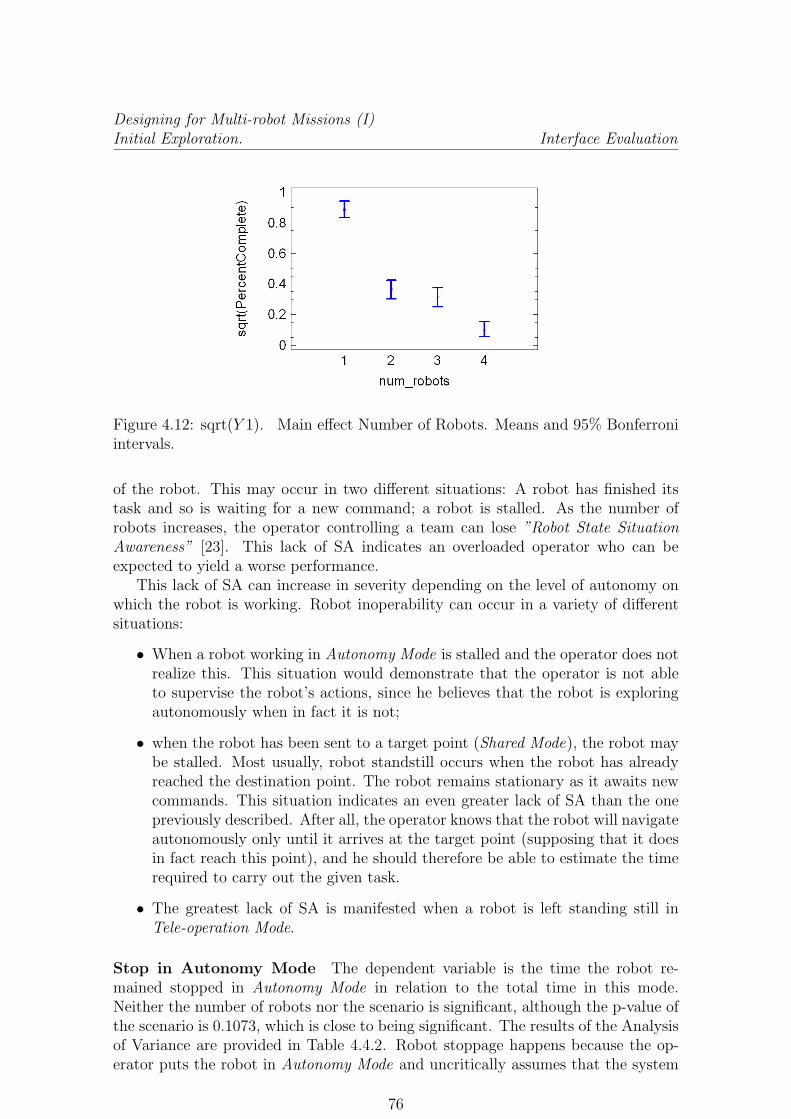
Designing for Multi-robot Missions (I)Initial Exploration. Interface Evaluation
Figure 4.12: sqrt(Y 1). Main effect Number of Robots. Means and 95% Bonferroniintervals.
of the robot. This may occur in two different situations: A robot has finished itstask and so is waiting for a new command; a robot is stalled. As the number ofrobots increases, the operator controlling a team can lose ”Robot State SituationAwareness” [23]. This lack of SA indicates an overloaded operator who can beexpected to yield a worse performance.
This lack of SA can increase in severity depending on the level of autonomy onwhich the robot is working. Robot inoperability can occur in a variety of differentsituations:
• When a robot working in Autonomy Mode is stalled and the operator does notrealize this. This situation would demonstrate that the operator is not ableto supervise the robot’s actions, since he believes that the robot is exploringautonomously when in fact it is not;
• when the robot has been sent to a target point (Shared Mode), the robot maybe stalled. Most usually, robot standstill occurs when the robot has alreadyreached the destination point. The robot remains stationary as it awaits newcommands. This situation indicates an even greater lack of SA than the onepreviously described. After all, the operator knows that the robot will navigateautonomously only until it arrives at the target point (supposing that it doesin fact reach this point), and he should therefore be able to estimate the timerequired to carry out the given task.
• The greatest lack of SA is manifested when a robot is left standing still inTele-operation Mode.
Stop in Autonomy Mode The dependent variable is the time the robot re-mained stopped in Autonomy Mode in relation to the total time in this mode.Neither the number of robots nor the scenario is significant, although the p-value ofthe scenario is 0.1073, which is close to being significant. The results of the Analysisof Variance are provided in Table 4.4.2. Robot stoppage happens because the op-erator puts the robot in Autonomy Mode and uncritically assumes that the system
76

Designing for Multi-robot Missions (I)Initial Exploration. Interface Evaluation
Figure 4.13: log(Y 4). Main effect number of robots. Means and 95% Bonferroniintervals.
is working properly, which is not always true. The analysis of variance is shown inthe following table:
Source Sum sq D. f. Variance F-stat p-valA: Number of robots 2.23 2 1.115 0.86 0.44B: Scenario 3.73 1 3.73 2.89 0.107Residual 21.97 17 1.292
TOTAL 27.22 20
Table 4.7: ANOVA for log(stop time autonomy/total autonomy time ).
Stop in Shared Mode We analysed the time the robots were stopped in SharedMode. The results of the Analysis of Variance are shown in Table 4.4.2. Theinteraction was removed as it was not significant and the F-ratio was less than 1.
Source Sum sq D. f. Variance F-stat p-valA: Number of robots 42.90 3 14.30 22.11 0.00B: Scenario 9.54 1 0.54 0.85 0.36Residual 29.10 45 0.64
TOTAL 73.64 49
Table 4.8: ANOVA for log(stop time shared/total shared)
fig. 4.13 shows the main effect of number of robots, which is the only significantfactor. The log(Y 4) is significantly smaller when operating 1 robot. In addition,there are significant differences between 3 and 4 robots, since the intervals are notoverlapped.
Stop in Tele-Operation We studied the time the robots remained stopped inTele-operation Mode. We analysed the log(Y 5). Results are shown in the followingtable.
77
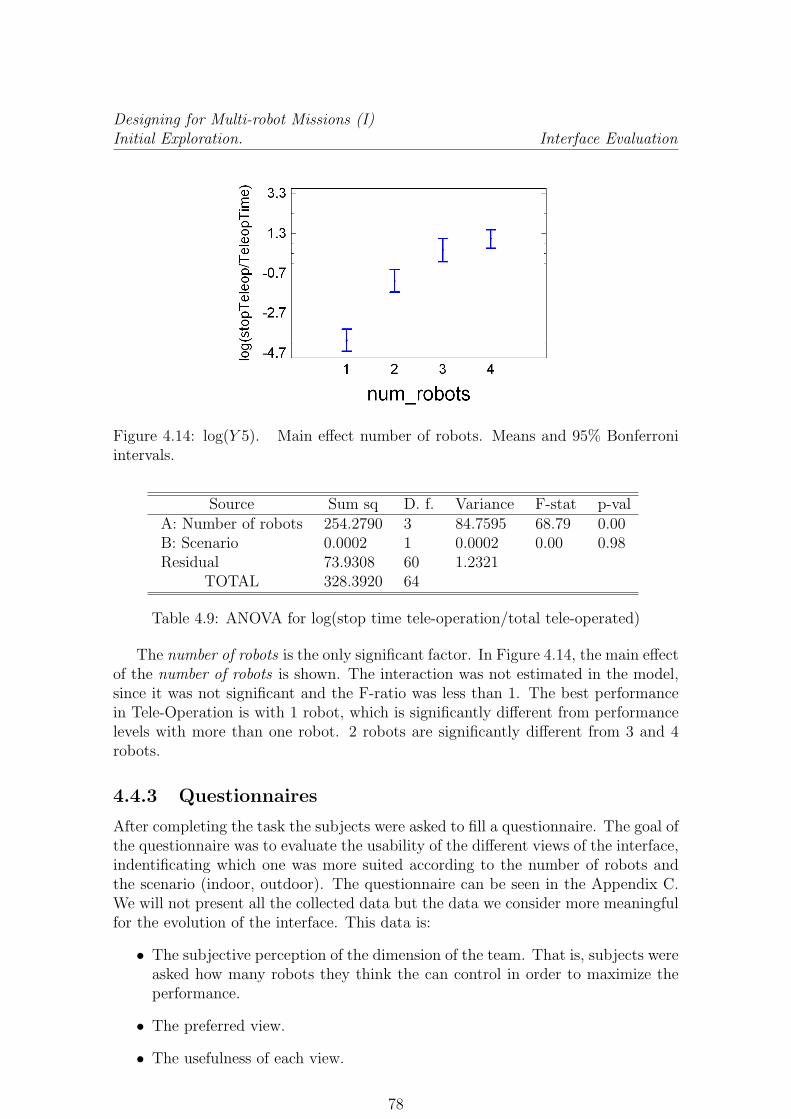
Designing for Multi-robot Missions (I)Initial Exploration. Interface Evaluation
Figure 4.14: log(Y 5). Main effect number of robots. Means and 95% Bonferroniintervals.
Source Sum sq D. f. Variance F-stat p-valA: Number of robots 254.2790 3 84.7595 68.79 0.00B: Scenario 0.0002 1 0.0002 0.00 0.98Residual 73.9308 60 1.2321
TOTAL 328.3920 64
Table 4.9: ANOVA for log(stop time tele-operation/total tele-operated)
The number of robots is the only significant factor. In Figure 4.14, the main effectof the number of robots is shown. The interaction was not estimated in the model,since it was not significant and the F-ratio was less than 1. The best performancein Tele-Operation is with 1 robot, which is significantly different from performancelevels with more than one robot. 2 robots are significantly different from 3 and 4robots.
4.4.3 Questionnaires
After completing the task the subjects were asked to fill a questionnaire. The goal ofthe questionnaire was to evaluate the usability of the different views of the interface,indentificating which one was more suited according to the number of robots andthe scenario (indoor, outdoor). The questionnaire can be seen in the Appendix C.We will not present all the collected data but the data we consider more meaningfulfor the evolution of the interface. This data is:
• The subjective perception of the dimension of the team. That is, subjects wereasked how many robots they think the can control in order to maximize theperformance.
• The preferred view.
• The usefulness of each view.
78

Designing for Multi-robot Missions (I)Initial Exploration. Interface Evaluation
Figure 4.15: Preferred Number of Robots. X Axis: Scenario, Number of RobotsControlled, Preferred Number of Robots
Preferred Number of Robots
The following table shows the preferred number of robots depending on the numberof robots the subject controlled and the scenario.
Number of robots the operator controlled1 Robot 2 Robots 3 Robots 4 Robots
Indoor 1.77 2.55 3.14 3.81Outdoor 1.81 2.14 3 2.37Indoor Total 2.86Outdoor Total 2.27Grand Total 2.57
Table 4.10: Preferred Number of Robots
This data is represented in Figure 4.4.3
Preferred View
Table 4.11 shows how many subjects preferred each view depending on the numberof robots they controlled and the scenario.
View Scoring
Table 4.12 shows the scoring (1-worst, 5-best) the subjects gave to each view de-pending on the number of robots and scenario.
Operation Mode Scoring
Subjects scored each operation mode (1-worst, 5-best). The collected data is shownin the Table 4.13 depending on the number of robots that the subject controlled.
79

Designing for Multi-robot Missions (I)Initial Exploration. Interface Evaluation
Scenario Num. of Robots View Total
Indoor 1 Local Map 7Global Map 23D View 0Team View 0
2 Local Map 7Global Map 13D View 1Team View 0
3 Local Map 3Global Map 53D View 0Team View 3
4 Local Map 3Global Map 53D View 0Team View 3
Total Indoor Local Map 20Global Map 133D View 1Team View 6
Outdoor 1 Local Map 4Global Map 03D View 7Team View 0
2 Local Map 1Global Map 03D View 6Team View 0
3 Local Map 2Global Map 03D View 3Team View 2
4 Local Map 1Global Map 03D View 5Team View 2
Total Outdoor Local Map 6Global Map 03D View 21Team View 4
Table 4.11: Preferred View
80

Designing for Multi-robot Missions (I)Initial Exploration. Interface Evaluation
Scenario Num. of Robots View Scoring
Indoor 1 Local Map 4.5556Global Map 3.88893D View 3.4444Team View 2.2222
2 Local Map 4.7778Global Map 3.55563D View 3.1111Team View 2.2222
3 Local Map 4.4286Global Map 43D View 3.1429Team View 2.4286
4 Local Map 3.9091Global Map 4.45453D View 3Team View 3.2727
Total Indoor Local Map 4.3889Global Map 43D View 3.1667Team View 2.5833
Outdoor 1 Local Map 3.5455Global Map 3.72733D View 4.4545Team View 1.6364
2 Local Map 3.1429Global Map 3.42863D View 4.4286Team View 2.7143
3 Local Map 3.2857Global Map 3.85713D View 3.5714Team View 2.4286
4 Local Map 3Global Map 3.3753D View 4.375Team View 2.75
Total Outdoor Local Map 3.2727Global Map 3.60613D View 4.2424Team View 2.303
Total Local Map 3.8551Total Global Map 3.8116Total 3D View 3.6812Total Team View 2.4493
Table 4.12: View Scoring (1-Worst; 5-Best)
81
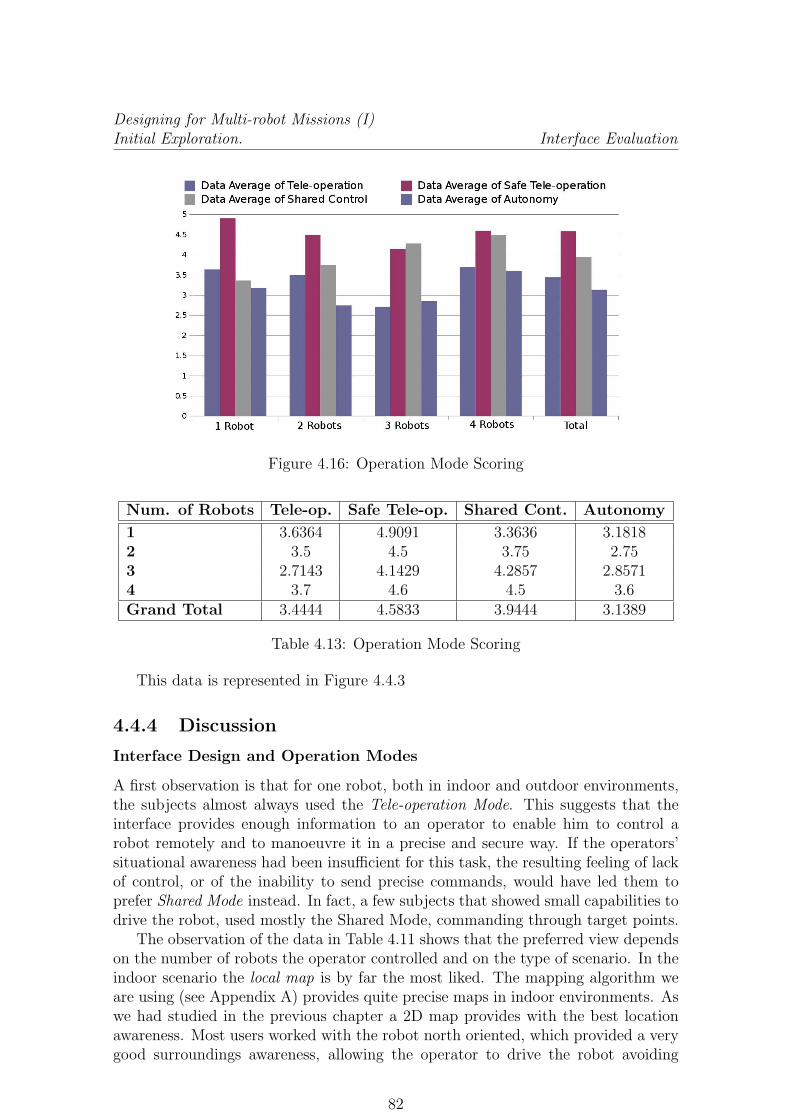
Designing for Multi-robot Missions (I)Initial Exploration. Interface Evaluation
Figure 4.16: Operation Mode Scoring
Num. of Robots Tele-op. Safe Tele-op. Shared Cont. Autonomy
1 3.6364 4.9091 3.3636 3.18182 3.5 4.5 3.75 2.753 2.7143 4.1429 4.2857 2.85714 3.7 4.6 4.5 3.6Grand Total 3.4444 4.5833 3.9444 3.1389
Table 4.13: Operation Mode Scoring
This data is represented in Figure 4.4.3
4.4.4 Discussion
Interface Design and Operation Modes
A first observation is that for one robot, both in indoor and outdoor environments,the subjects almost always used the Tele-operation Mode. This suggests that theinterface provides enough information to an operator to enable him to control arobot remotely and to manoeuvre it in a precise and secure way. If the operators’situational awareness had been insufficient for this task, the resulting feeling of lackof control, or of the inability to send precise commands, would have led them toprefer Shared Mode instead. In fact, a few subjects that showed small capabilities todrive the robot, used mostly the Shared Mode, commanding through target points.
The observation of the data in Table 4.11 shows that the preferred view dependson the number of robots the operator controlled and on the type of scenario. In theindoor scenario the local map is by far the most liked. The mapping algorithm weare using (see Appendix A) provides quite precise maps in indoor environments. Aswe had studied in the previous chapter a 2D map provides with the best locationawareness. Most users worked with the robot north oriented, which provided a verygood surroundings awareness, allowing the operator to drive the robot avoiding
82

Designing for Multi-robot Missions (I)Initial Exploration. Interface Evaluation
obstacles. This conclusion is coherent with the results provided in [46]. In any case,we observe that with 3 and 4 robots the global map is preferred. This was alsoexpected, as the local map does not allow to track the positions of all the robots,losing the team location awareness. If we compare this result with the utilisationof the operation modes (see Table 4.3 and Figure 4.10) we observe that for 3 and4 robot the Shared Control Operation Mode was the most used. This gives us theoperation profile of the operator: when he is controlling several robots he mostlyuses the global map, sending target points sequentially to the robots.
For the outdoor scenario results are drastically different. Operators mostly pre-ferred the 3D view. The reason is simple: our scan matching algorithm was not ableto localize the robot correctly, and consequently the map was completely wrong.While the local map was still ”locally” correct, the global map was completely use-less. This led the operators to trust mostly on the video feed-back and the laserreadings, which provided them with a proper surroundings awareness. For the loca-tion awareness they should rely on the visual landmarks. Analysing the utilisationof the operation modes, we observe that for several robots, the Shared Control isnot as used as in the indoor scenario while the Tele-operation mode is more used.Even if the global map is wrong, the Shared Mode is still used because locally themaps were correct, and the operator could command the robot giving near targetpoints to the robots.
In both scenarios operators preferred the global map of the Complex View to theTeam View. We conclude that even when they use the global map, they prefer tokeep under sight the local map and the 3D view with the video feed back. This resultis supported by the scoring the subjects gave to the views (Table 4.12), in whichthe Team View receives the lower scoring for both indoor and outdoor scenarios.This conclusion enforces our thesis that an integrated display is a better design (asit provides a better situational awareness) than the subdivision proposed in [77]between map-centric and video-centric interfaces.
Analysing the scoring the operator gave to the Operation Modes (Table 4.13and Figure 4.4.3) we conclude that the Tele-operation mode is the less appreciated.Operators considered this mode very dangerous, as collisions were not prevented atall. Instead the Safe Tele-operation Mode received a good scoring, which showedthat the changes applied to the second version of the interface were successful. TheAutonomy Mode received also a low scoring, and it remains the major re-design tobe applied, to both the robotic system and the interface.
Operator Performance
The data analysis concludes that, for the second version of the interface, the optimalrobot:human ratio, when account is taken of the utilization of robots and of the areaexplored, is 1:1. When we consider the utilization of the robots, this result is notsurprising. When an operator controls more than one robot, he inevitably neglectssome to a certain degree, which results in correspondingly less optimal utilization.We can see in fig. 3.12 that, when the operator is controlling one robot, the robotis moving almost all the time; as soon, however, as he must control more thanone robot, his performance diminishes greatly. There are no significant differencesamong 2 and 3 robots, while for 4 robots the performance (in terms of simultaneous
83

Designing for Multi-robot Missions (I)Initial Exploration. Interface Evaluation
utilization) drops off yet again. In any case, the main decrease in performance occurswhen we pass from 1 to 2 robots.
The use of several robots would be justified, even when they are not fully ex-ploited, if the area explored increased with the number of robots. We had hypothe-sized that the area would expand to its with 2 or 3 robots, and would subsequentlydecrease due to an excessive operator workload. In actuality, the result of the ex-periments shows that the area covered by the robot team does not increase as thenumber of robots increases. We can perceive a tendency to our hypothesis in theoutdoor scenario, but the differences are not statistically significant. We believe thatthis result is caused by the great decrease in robot utilisation due to the shift fromone robot to two. As we can see in Figure 4.12, when the operator is controllingtwo robots, they are moving simultaneously less than the half of the time. Thus,even if both robots explore different areas, the total area is not bigger than whenan operator controls just one robot.
The Stop Condition Analysis helps us to understand why this performance fall-off occurs when the operator is using more than one robot. Let us suppose that therobot is working in Shared Mode (in other words, when the operator has set a targetpoint that the robot must try to reach autonomously). If the operator is controllingmultiple robots, he usually does not realize immediately that the particular robothas arrived at the target point. When the operator is controlling one robot, however,this does not happen, as he maintains supervision of the robot’s actions during theentire task. Again, the problem arises only when he is controlling two or morerobots. This is consistent with the usability questionnaires. Most users said thatthey felt unable to keep track of the state and task of all the robots composing theteam.
Something slightly different happened when the robot was left stationary inTele-operation Mode. Direct observation of the experimental runs revealed to us thereason why this situation happened. When a robot was moving in Autonomy Modeor Shared Control and got stalled (that is, became unable to follow its path), assoon as the operator realized this, he switched control to the stalled robot, leavingthe robot he was controlling previously in whatever state it happened to be in atthe time of the switch. For example, if this old robot was in Tele-operation, it wasleft stationary, and the operator usually forgot about it and simply continued tomanoeuvre the the new robot until he realized that he had forgotten the old one.When we asked the operators if they were aware of their mistake in this regard, theytypically answered that it was very difficult to keep track of everything they weredoing on account of the complicated nature of the task they were performing.
In Autonomy Mode there are no meaningful results, but this is due to the factthe operators very rarely used this mode, resulting in an insufficient pool of datacollected.
Analysing the subjective perception that the subjects had of the optimal teamdimension (see Table 4.10 and Figure 4.4.3) we observe that operators consideredthey were able to command a team of up to 3 robots in the indoor scenario and upto 2 for the outdoor scenario. This perception changes with the number of robotsthey effectively commanded. Operators commanding 4 robots considered that thenumber was excessive, operators controlling 3 robots felt the number was ok, while
84

Designing for Multi-robot Missions (I)Initial Exploration. Conclusions
for 1 and 2 robots they thought they could control more robots. It is interestingthat this result contradicts the optimal robot number resulting from the performanceanalysis. We conclude that at this point the interface was not yet well designed forsupporting robot teams, as the operator ”optimism” indicates that he is capable ofmore.
4.5 Conclusions
In this chapter, we have presented a first analysis of the critical situations in multi-robot control and supervision. Our results show that when an operator has to controlmore than one robot at a time, his performance decreases significantly in terms ofrobot utilisation, by way of contrast the area explored does not increase.
The contributions of this chapter are:
• Collected data proves that an integrated design of the interface (avoiding tobe ”map-centric” or ”video-centric”) is preferred by the operators.
• Identification of the major difficulties facing an operator controlling a teamof robots. The biggest difficulty was to keep in mind the state of the robots.This difficulty led to a lack of Team Situational Awareness, with the resultthat the robots were neglected when they required operator control.
• A Shared Control Mode, in which the operator sets a target point for the robot,proved to be unsuitable for multi-robot tele-operation (this is the most usedway of commanding a robot in the literature -apart from the classical tele-operation). The reason is that, if the target point is too far from the robot,the operator has little over the path it will follow, which naturally leads tobad performance. If, on the other hand, the target point is too close, theoperator completes the task quickly, but then he must assign new tasks withgreat frequency, which increases his workload in proportion to the increase inthe number of robots.
We conclude that a multi-robot system should implement two basic functionali-ties:
1. a system of alerts for informing the operator of the system errors: wrong path,stall condition, etc., and
2. improved autonomy management to adjust the level of autonomy according tothe mission requirements.
In light of the usability questionnaires, we realized that operators needed moregranulated shared control modalities. These aspects were implemented in the thirdprototype, which will be presented in the next chapter. After this evaluation, afourth prototype will be presented.
85

Chapter 5
Designing for Multi-robotMissions (II)Improving the AutonomyManagement.
5.1 Introduction
In the preceding chapter, we presented a preliminary exploratory study of multi-robot missions. Using the second version of the interface, we conducted controlledexperiments with users, measuring their performance and evaluating the usabilityof the interface. From a usability point of view, the subjects who participated inthe experiment were on the whole satisfied with the interface design. On the otherhand, our system proved to be unable to support efficiently one operator controllinga team of robots. In fact, the optimal human:robot ratio turned out to be 1:1.This is not completely a surprise. Exploration robotics in hazardous environmentsis one of the most complicated tasks from the point of view of the operator. Indeed,Burke and Murphy contend that, rather than concentrating on multi-robot systems,we should focus on multi-operator-single-robot systems. In [8] they support theirthesis, concluding that one robot requires two operators for efficient supervision.Note, though, that they are evaluating rescue robots in real disasters. For the sakeof research, we relaxed our constraints somewhat: We use the USARSim simulatorand the Rescue RoboCup worlds, which do not have the hazards present in realmissions, as a test-bed.
Another study, completed by Scholtz et al. in [60], analyses the theoretical max-imum operator:robot ratio in the supervision of on-road unmanned ground vehicles(UGV) navigation. Basing themselves on experimental data, they analyse the num-ber of interventions in autonomous on-road driving. This analysis then leads themto conclude that one operator is able to supervise two UGVs simultaneously withouta drop-off in task performance. Again, Scholtz et al. are dealing with the real world,but the task is simpler, as they do not have to explore, but just to follow a givenpath. For the third version of the interface, our aim was to arrive at similar results.We set out to repeat the former experiments expecting to find that the optimal size

Designing for Multi-robot Missions (II)Improving the Autonomy Management. Interface Version 3
of the robot team consists of at least two robots.The major weakness that appeared in version 2 concerns the excessive amount of
time the robots were neglected when they were not performing a task, that is, whenthey had stopped and were waiting for incoming commands. Taking account ofsystem performance and the test subjects’ input, we hypothesized that the problemmight be caused by one of the following two factors:
• The robotic system was unable to complete the task autonomously and noerror message was sent to the operator.
• The operation modes were not enough adequate to the operator’s task
In fact, in the questionnaires, the operators regretted the lack of certain controlcapabilities. They would have appreciated the possibility of setting the path them-selves, instead of letting the robot decide which path to follow. They would alsohave liked to be able to set a sequence of target points, with the aim of assigninglong-term tasks to the robots without needing to supervise them continuously.
All these issues led to the development of Interface Version 3, focused on enhanc-ing the operation modes, particularly the Shared Mode, understood as the spectrumbetween full autonomy and the Safe Tele-operation. Some usability improvementswere also implemented in order to support the operator’s situational awareness. Wewill describe these improvements in next section. This chapter does not have a re-lated work section, as the related work has already been presented in the precedingchapter. After describing the interface, we will present a set of controlled experi-ments performed for the sake of analysing the improvements. A fourth prototypewill be presented on the basis of the experimental results.
5.2 Interface Version 3
In the following we will describe the third version of the interface. The main changesoccur in the operation modes. Some design changes have been also applied, mainlyto the pseudo-3D view, and a new display has been added.
5.2.1 Design evolution
The test results presented in the previous chapter were satisfied with the 2D maps,the local display providing surroundings situational awareness, and the global mapdisplay (including the global map view) giving a comprehensive view of the wholerobot team. The majority of their comments concerned the 3D view. We cansummarize them in the following list:
• The elevated map sometimes hides the robot.
• When the laser and the map do not coincide exactly, the map may become asource of confusion.
• Rear obstacles are not visualized if they are not on the map, which may there-fore be imprecise and confusing.
87

Designing for Multi-robot Missions (II)Improving the Autonomy Management. Interface Version 3
• The video dimension is too small when the focus of the video is on items at adistance from the robot.
• When the camera pans, the video may be difficult to see.
Furthermore, subjects noted that when the map is completely mistaken (thishappened often in the outdoor run, as the open spaces caused the scan-matchingalgorithm to fail) they have to rely completely on the video and the laser, while the2D maps are useless.
With these issues in mind, we made the following changes in the 3D view:
• We included the sonar readings coming from the robot, which affords a real-time position of rear obstacles. These obstacles are marked similarly to thelaser readings, but they are indicated in another colour. See Figure 5.2.1; thevideo feed-back has been removed for the sake of clarity.
• We drew the map flat and not elevated, so that it does not hide the robot andis not confused with the robot.
• We gave the operator the option of showing or hiding the earlier 3D displayof the map. See Figure 5.2.1.
• The point of view can be set in such a way that the image always remains inthe front part of the display, while the robot and the environment are rotatedaccording to the pan of the camera. See Figure 5.3.
• We included a set of control icons independent of the 2D view to show/hidelaser readings, sonar readings, and 3D map.
Furthermore, we added a new display to the two existing ones: ”robot view” and”team view.” The new display shows only the 3D view, which gives the operatormore viewing room when he wishes to see only the video and the laser and sonarreadings. See Figure 5.2.1
5.2.2 Operation Modes Evolution
The operation modes of version 2 were explained in Section 4.3. There were fourindependent operation modes, and the operator decided which one was more suitableto the task requirements. In version 3, the management of the autonomy levelchanged. The system no longer waits for a ”precise command” for each operationmode: target point in Shared Control, speed and jog in Tele-Operation. In thethird version, the autonomy is adjusted in a multi-layered form. The following listdescribes the different autonomy levels, beginning with full autonomy and endingwith pure tele-operation.
1. The system proposes a target point;
2. if there is no input from the operator the system proposes a path to reach it,or
88

Designing for Multi-robot Missions (II)Improving the Autonomy Management. Interface Version 3
Figure 5.1: Interface with Sonar Readings (green) and Laser Readings (red)
Figure 5.2: Interface with the 3D Map
89

Designing for Multi-robot Missions (II)Improving the Autonomy Management. Interface Version 3
(a) Robot-Centred View
(b) Camera-Centred View
Figure 5.3: Different Display Angles of the Video Feed-back
90

Designing for Multi-robot Missions (II)Improving the Autonomy Management. Interface Version 3
Figure 5.4: Interface with the 3D View Display
3. the operator sets a target point and the system proposes a path to reach it;
4. if the operator does not change the path the system follows the path, or
5. the operator sets a path and the system follows it;
6. The operator sets a control speed and jog and the system adjust the real speedand jog to avoid collisions.
7. The operator sets the real speed and jog.
From this list we can see that the operator has five command possibilities pos-sibilities: set a target point (or sequence of target points), set a path, set a controlspeed and jog, set the real speed and jog. Depending on the operation mode ofthe robot: Tele-Operation, Safe Tele-Operation, Shared Control or Autonomy, thesystem will react differently to each input. The possibilities are:
Tele-Operation and Safe Tele-Operation. If the operator sets a target pointor path, the robot changes to shared control.
Shared Control. In shared control mode, the system tries to reach the targetpoint, or sequence of target points, set by the operator. This is done by means oftwo mechanisms (see Section A.3.2): the calculation of a path and the control ofrobot motion to follow that path. The operator can give the following commands.
91

Designing for Multi-robot Missions (II)Improving the Autonomy Management. Interface Version 3
• The system remains in Shared Control, but while the operator continues send-ing speed commands, the robot’s motion is not controlled by the system. Whenthe operator stops sending commands, the system retakes motion control. Thisis very efficient when the robot is following a path and remains stalled, becausethe operator can get the robot out of its stalled condition without modifying itsformer task. As soon as the operator releases the control, the robot continuesthe previous task.
• The operator sets a path, the robot follows that path, and it then calculatesa new path to the former target point, if there was one. In this way, if theoperator disagrees with the path proposed by the system, he can modify it,and the robot adjusts its proposed path to the path set by the operator.
Figures 5.2.2 and 5.2.2 show an example of how this works. In both cases, the sys-tem is in Shared Control Mode. In the first figure, the operator modifies the pathproposed by the system, deactivating temporarily the Path-Planning Layer. Oncethe robot has completed the path, this layer will re-activate. In the second figure,the operator bypasses both the Path-Planning and the Motion Layers, directly com-manding robot speed and jog. When the robot stops sending motion commands,both layers are activated again.
Autonomy. In full autonomy, the system chooses the most suitable target pointin order to accomplish the mission (see Section A.3.1). The operator may send thefollowing commands:
• Speed, Jog and Path, as in Shared Mode. The system gives the suitable controlto the operator, but remains in autonomy, so that, when the operator stopscommanding, the system keeps on working in autonomy. Like shared mode,this mode is suitable in situations in which the operator does not approve theactions taken by the system.
• The operator sets a target point or sequence of target points. The system triesto reach them, and, once they have all been reached, it keeps on exploringautonomously.
• The operator sets a desired path. The system tries to follow it, once it hascompleted the task, and if there are not target points, it keeps on exploringautonomously (if there is a desired path and a sequence of target points it willfollow firstly the desired path, and afterwards it will try to reach the targetpoints).
Each layer is in charge of performing an action. The more layers are working,the higher the autonomy level is. Thus, if all the layers are running, the system isworking in full autonomy, while, if none of them is working, the operator has fullcontrol of the robot. The operator can command at every level of the layered system,substituting the actions of the higher layers. It is important to notice that this doesnot require him to change the operation mode. For example: The system may beoperating in ”Autonomy Mode,” so that, by default, all the layers are running, but
92

Designing for Multi-robot Missions (II)Improving the Autonomy Management. Interface Version 3
Exploration Layer
Path Planning Layer
Motion Layer
Safe Motion Layer
Robot Interface Layer
Human-Robot Interaction Layer
Path
Path
Control speed and Jog
Effective speed and jog
Shared Control
I don’t l ike this path,let’s change it
Figure 5.5: Shared Mode. Operator sets a path
93

Designing for Multi-robot Missions (II)Improving the Autonomy Management. Interface Version 3
Exploration Layer
Path Planning Layer
Motion Layer
Safe Motion Layer
Robot Interface Layer
Human-Robot Interaction Layer
Control speed and Jog
Effective speed and jog
Shared Control
Control speed and Jog
The robot is blockedlet’s take it out
Figure 5.6: Shared Mode. Operator sets robot speed
94

Designing for Multi-robot Missions (II)Improving the Autonomy Management. Interface Evaluation
at any moment the operator can command at any level, while the system remainsin ”Autonomy Mode”. At the same time, every layer provides feed-back indicatingwhether or not it has performed its respective task, so the operator has correctsystem state awareness and knows at which level he must act.
The new autonomy management is thought to provide the operator with twoadvantages:
• Fast recovery from navigation and exploration errors or bad performance. Theoperator can act at the error level, without re-configuring the robot task orchanging the operation mode.
• Long-term commands and more granulated autonomy levels. The operator canset a sequence of target points, giving the robot a longer-term task. Moreover,since he can set the path, something that was not possible in previous version,he can send the robot along safe paths.
In this way, the system takes more advantage of the operator’s expertise.These innovations have been implemented for both the desktop and the PDA
interfaces. Figures 5.7 and 5.8 show the cases in which the operator sets a sequenceof target points and a desired path.
5.3 Interface Evaluation
As we said at the beginning, an effective operation of multiple robots requires that anoperator distribute his operating time among the robots, so that he can supervisethe whole team and intervene whenever this is required. The experiment we arepresenting here aimed to evaluate the scalability of the mechanism of autonomyadjustment that we implemented. Furthermore, subjects were requested to fill outquestionnaires as a way of measuring the usability of the interface for multiple-robotcontrol and supervision.
5.3.1 Experiment Design and Procedure
The experiment was organized as a competition. A web page was designed and”call for participation” posters were distributed around the department. A two-hour lecture was given to introduce participants to the Search and Rescue Roboticsand Human-Robot Interaction fields. Participants were given the incentive of twoprizes (an iPod and an HTC cell phone). They were scored following the RoboCupVirtual Rescue Robots League criteria: area covered and cleared and number ofvictims found. Forty-five subjects (forty-one males, four females) participated inthe competition. All of them were either master’s students or Ph.D. candidates.The subjects were randomly divided into three groups. Each subject in a givengroup had to accomplish a Search and Rescue Mission while controlling a team ofrobots (number of robots ∈ [1 − 3]). Every subject went through a forty-minutetraining program to acquire a basic knowledge of the functionalities provided bythe interface. The training scenario was taken from the RoboCup Competition andwas similar in difficulty to the scenarios used for the experiments. The first four
95

Designing for Multi-robot Missions (II)Improving the Autonomy Management. Interface Evaluation
(a) Operator sets a way point
(b) Operator sets a desired path
Figure 5.7: Desktop Interface - Shared Mode Commands
96

Designing for Multi-robot Missions (II)Improving the Autonomy Management. Interface Evaluation
(a) Operator sets a way point (b) Operator sets a desired path
Figure 5.8: PDA Interface - Shared Mode Commands
who qualified from each group went to the final. They worked in operator-couples.Each couple had to operate a 4 robot team. We stipulated this in order to carryout a preliminary exploration of how two operators interact with each other whencontrolling a team of robots. The best couple received the prizes.
The participants were asked to explore an unknown office building (indoor sce-nario) in search of victims. This scenario was the same as that used in the previousexperiment. As the previous experiment data showed that the differences betweenindoor and outdoor scenarios were not significant in most cases, we did not studythis variable in the experiment presented here. Subjects who had run the previousexperiment did not remember the scenario; in fact, the winners were not among thesubjects who had participated in the preceding experiment. Subjects were given 20minutes. After completing this experiment, they filled out a usability questionnaire.A victim was considered ”found” when the ”victim sensor” installed on the robotsdetected him. Each subject had a single trial. No support was given to the subjectsduring the runs.
5.3.2 Data analysis
The focus of our analysis is the influence of the factor number of robots ∈{1, 2,3}. Though we analysed more of the data collected, here we present only the moresignificant elements. The variables studied were:
• The area explored divided by the total time of the mission. This is a direct
97

Designing for Multi-robot Missions (II)Improving the Autonomy Management. Interface Evaluation
measure of the mission performance.
• The proportion of time the robot spent in each operation mode.
• The percentage of the total time in which the robots are operating (moving)simultaneously. If one or more robots are not moving, this means that theoperator is unable to manage all of them. Consequently, these data will informus if the size of the team of robots is suitable.
• The relation between the time the robot remained stationary in Shared Modeand the total time it spent in that mode.
Area Explored
The explored area means, standard deviations, maximum and minimum values, andconfidence intervals, all varying in function of the number of robots, can be seen inTable 5.1. The area explored is measured in square meters. The number of subjectsin each group is 15.
1 Robot 2 Robots 3 Robots
Mean 302.71 400.93 389.64Std. dev. 57.04 117.58 103.44Max 420 562 606Min 206 188 190Conf. int. (95%) 29.88 61.59 54.18
Table 5.1: Explored Area (square meters)
A one-way ANOVA was carried out to study if there were any significant differ-ences. A one-way analysis of variance (ANOVA) is a statistical method by means ofwhich which the differences between the means of two or more independent groupscan be evaluated. A one-way ANOVA is carried out by partitioning the total modelsum of squares and degrees of freedom into a between-groups (treatment) compo-nent and a within-groups (error) component. Significant inter-group differences inthe one-way ANOVA are then evaluated by comparing the ratio of the between andwithin-groups mean squares to a fisher F-distribution (see Appendix B).
Results can be seen in Table 5.2.
Sum of Sq. df Mean Sq. F-value p-value
Between Gr. 80880.135 2 40440.067 4.367 0.019Within Gr. 361119.871 39 9259.484Total 442000.005 41
Table 5.2: Explored Area - ANOVA
As the p-value was less than 0.05, we saw that the area explored differs signifi-cantly from group to group. We then calculated the confidence intervals for a 95%value in order to get a handle on these. Confidence intervals can be seen in Figure5.9
98

Designing for Multi-robot Missions (II)Improving the Autonomy Management. Interface Evaluation
1 2 3250
275
300
325
350
375
400
425
450
475
500
Number of Robots
Exp
lore
d A
rea
(squ
are
met
ers)
Figure 5.9: Explored Area - Confidence Intervals (95 %)
Operation Modes Distribution
The operation modes distribution is the percentage of time the robots spent in eachmode. It has been calculated adding the time each robot on the team spent in eachmode and then dividing the result by the number of robots and the mission time.Values can be seen in the following table. They are represented in Figure 5.10.
1 RobotTele-Operation Shared Control Autonomy
Average 0.82 0.18 0.00Std. Dev. 0.21 0.24 0.00
2 RobotsTele-Operation Shared Control Autonomy
Average 0.36 0.62 0.02Std. Dev. 0.21 0.24 0.09
3 RobotsTele-Operation Shared Control Autonomy
Average 0.27 0.68 0.05Std. Dev. 0.19 0.24 0.16
Table 5.3: Time Distribution of Operation Modes
Stop Condition Analysis
As we said in the previous chapter, ”stop condition” refers to situations in whicha robot is stationary. In a mission such as the one we used in our experiments,operators need to cover the greatest possible area. It follows that, in such a scenario,
99
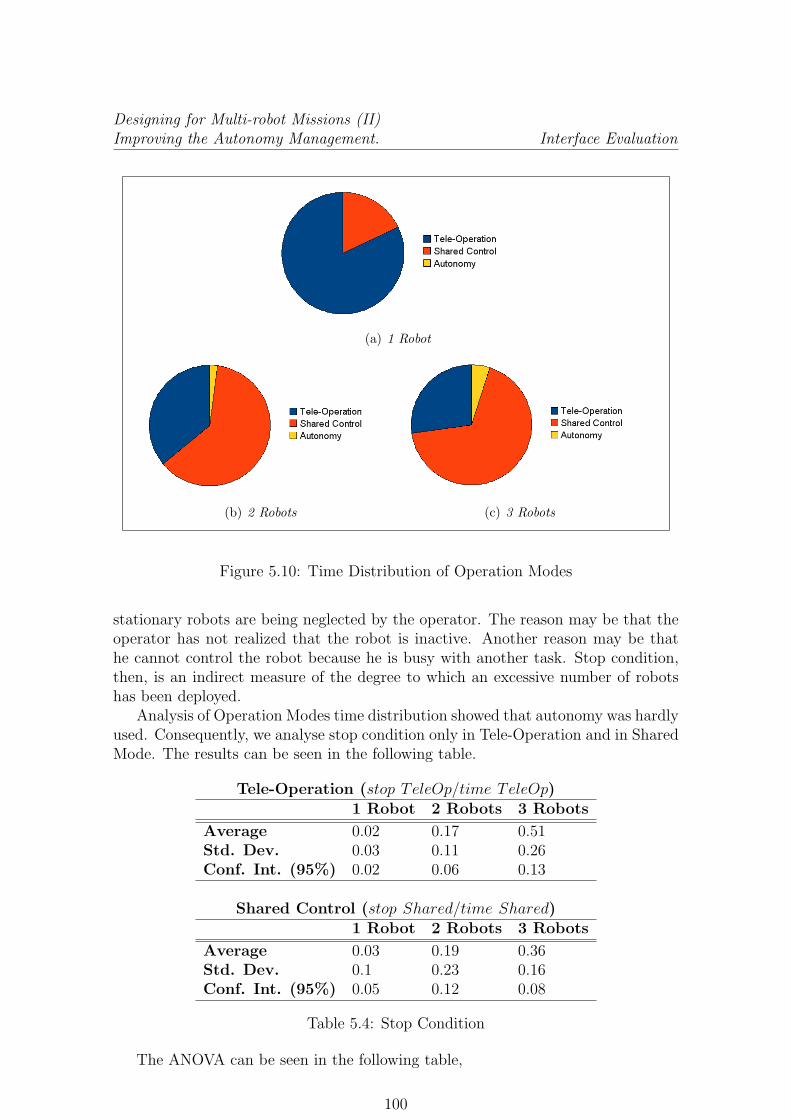
Designing for Multi-robot Missions (II)Improving the Autonomy Management. Interface Evaluation
(a) 1 Robot
(b) 2 Robots (c) 3 Robots
Figure 5.10: Time Distribution of Operation Modes
stationary robots are being neglected by the operator. The reason may be that theoperator has not realized that the robot is inactive. Another reason may be thathe cannot control the robot because he is busy with another task. Stop condition,then, is an indirect measure of the degree to which an excessive number of robotshas been deployed.
Analysis of Operation Modes time distribution showed that autonomy was hardlyused. Consequently, we analyse stop condition only in Tele-Operation and in SharedMode. The results can be seen in the following table.
Tele-Operation (stop TeleOp/time TeleOp)1 Robot 2 Robots 3 Robots
Average 0.02 0.17 0.51Std. Dev. 0.03 0.11 0.26Conf. Int. (95%) 0.02 0.06 0.13
Shared Control (stop Shared/time Shared)1 Robot 2 Robots 3 Robots
Average 0.03 0.19 0.36Std. Dev. 0.1 0.23 0.16Conf. Int. (95%) 0.05 0.12 0.08
Table 5.4: Stop Condition
The ANOVA can be seen in the following table,
100

Designing for Multi-robot Missions (II)Improving the Autonomy Management. Interface Evaluation
Sum of Sq. df Mean Sq. F-value p-value
Between Gr. 1.891 2 0.946 35.192 0.000Within Gr. 1.128 42 0.027Total 3.019 44
Table 5.5: Tele Operation Stop Condition - ANOVA
Sum of Sq. df Mean Sq. F-value p-value
Between Gr. 0.817 2 0.409 13.847 0.000Within Gr. 1.239 42 0.030Total 2.056 44
Table 5.6: Shared Control Stop Condition - ANOVA
The results are displayed in the form of a graph in Figures 5.11 and 5.12.
1 2 30
0.1
0.2
0.3
0.4
0.5
0.6
0.7
Number of Robots
stop
Tel
eOp
/ tim
e T
eleO
p
Figure 5.11: Stop in Tele-Operation - Confidence Intervals (95 %)
1 2 3−0.05
0
0.05
0.1
0.15
0.2
0.25
0.3
0.35
0.4
0.45
Number of Robots
stop
Sha
red
/ tim
e S
hare
d
Figure 5.12: Stop in Shared Control - Confidence Intervals (95 %)
101

Designing for Multi-robot Missions (II)Improving the Autonomy Management. Interface Evaluation
5.3.3 Questionnaires
After completing the task the subjects were asked to fill a questionnaire. The goalof the questionnaire was to evaluate the usability of the different operation modes,identifying which one was more suited according to the number of robots. Thequestionnaire can be seen in the Appendix D. We will not present all the collecteddata but the data we consider more meaningful for the evolution of the interface.This data is:
• The subjective perception of the dimension of the team. That is, subjects wereasked how many robots they think the can control in order to maximize theperformance.
• The preferred operation mode.
• The usefulness of each operation mode.
Preferred Number of Robots
The following table shows the preferred number of robots depending the number ofrobots the subject controlled and the scenario.
Num. of robots controlled1 Robot 2 Robots 3 Robots
2 2 2.55Total: 2.19
Table 5.7: Preferred Number of Robots
Operation Mode Scoring
The following table shows the scoring (1-worst, 5-best) the subjects gave to eachoperation mode depending on the number of robots.
Num. of Robots Tele-op. Safe Tele-op. Shared Control
1 2.88 4.66 4.112 2.09 4 4.093 2.54 4.36 4.18Grand Total 2.48 4.32 4.12
Table 5.8: Operation Mode Scoring
Preferred Shared Mode Commanding Method
The following table shows how many subjects preferred each shared mode commanddepending on the number of robots they controlled. The methods are: setting atarget point, setting a sequence of target points, setting a desired target.
102

Designing for Multi-robot Missions (II)Improving the Autonomy Management. Interface Evaluation
Count of Preferred Shared MethodNum. of robots Preferred Shared Method Total
1 Sequence of Target Points 4Desired Path 5
2 Sequence of Target Points 5One Target Point 3Desired Path 3
3 Sequence of Target Points 2One Target Point 6Desired Path 3
Grand Total One Target Point 9Sequence of Target Points 11Desired Path 11
Table 5.9: Preferred Shared Mode Commanding Method
5.3.4 Discussion
Operation Modes
The major improvements made to the third version of the interface regarded theautonomy management and the new Shared Control commands. Table 5.8 showsthe valuation that the subjects made of each operation mode. If we compare it withTable 4.13 we can see that the Shared Mode is more appreciated in this version.Also comparing the amount of time that operators used it Shared Mode was moreused than in the previous experiments (compare Tables 4.3 and 5.3). As we willsee afterwards, the stop time in Shared Mode was smaller than in the previousexperiments, which lead us to believe that we have achieved the goal of improvingthis operation mode.
Regarding each specific way to command the robot in Shared Mode: setting atarget point, setting a sequence of targets, or setting the desired path; in generalsubjects preferred the long term commands: way point and desired path (see Table5.9). This was our initial hypothesis, as giving long term commands would decreasethe number of required actions of the operator. Surprisingly, this fact is moreaccentuated for 1 robot than for 2 and 3 robots. Actually, for 3 robots subjectspreferred to set just one target point. We believe that this happens because theoperator’s workload increases with the number of robots, and consequently is moredifficult for him to plan long term actions, resulting in the collected data.
Operator Performance
The results obtained for the previous version, and analysed in Chapter 4 showed thatthe optimal number of robots for maximizing the area explored and minimizing thenumber of robots deployed was 1. This experimental result led us to conclude thatthe interface did not provide the operator with suitable mechanisms for adjustingrobot autonomy, which is crucial for the control of multiple robots. At the beginning
103
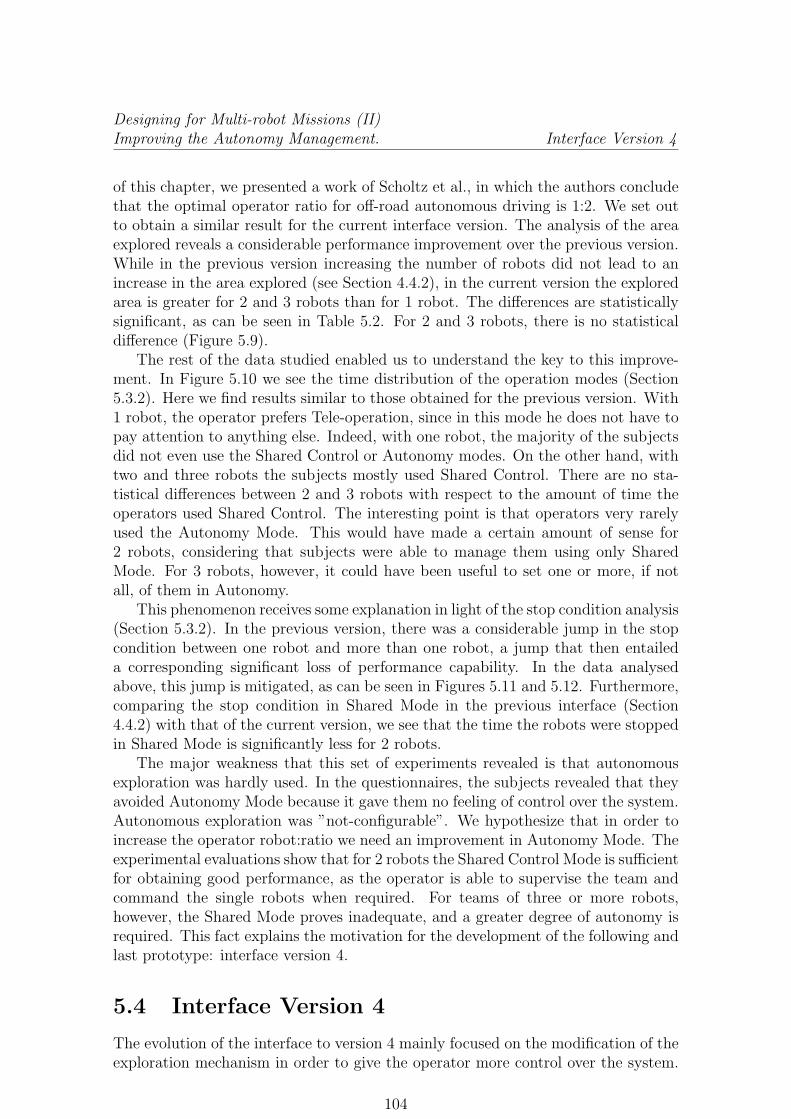
Designing for Multi-robot Missions (II)Improving the Autonomy Management. Interface Version 4
of this chapter, we presented a work of Scholtz et al., in which the authors concludethat the optimal operator ratio for off-road autonomous driving is 1:2. We set outto obtain a similar result for the current interface version. The analysis of the areaexplored reveals a considerable performance improvement over the previous version.While in the previous version increasing the number of robots did not lead to anincrease in the area explored (see Section 4.4.2), in the current version the exploredarea is greater for 2 and 3 robots than for 1 robot. The differences are statisticallysignificant, as can be seen in Table 5.2. For 2 and 3 robots, there is no statisticaldifference (Figure 5.9).
The rest of the data studied enabled us to understand the key to this improve-ment. In Figure 5.10 we see the time distribution of the operation modes (Section5.3.2). Here we find results similar to those obtained for the previous version. With1 robot, the operator prefers Tele-operation, since in this mode he does not have topay attention to anything else. Indeed, with one robot, the majority of the subjectsdid not even use the Shared Control or Autonomy modes. On the other hand, withtwo and three robots the subjects mostly used Shared Control. There are no sta-tistical differences between 2 and 3 robots with respect to the amount of time theoperators used Shared Control. The interesting point is that operators very rarelyused the Autonomy Mode. This would have made a certain amount of sense for2 robots, considering that subjects were able to manage them using only SharedMode. For 3 robots, however, it could have been useful to set one or more, if notall, of them in Autonomy.
This phenomenon receives some explanation in light of the stop condition analysis(Section 5.3.2). In the previous version, there was a considerable jump in the stopcondition between one robot and more than one robot, a jump that then entaileda corresponding significant loss of performance capability. In the data analysedabove, this jump is mitigated, as can be seen in Figures 5.11 and 5.12. Furthermore,comparing the stop condition in Shared Mode in the previous interface (Section4.4.2) with that of the current version, we see that the time the robots were stoppedin Shared Mode is significantly less for 2 robots.
The major weakness that this set of experiments revealed is that autonomousexploration was hardly used. In the questionnaires, the subjects revealed that theyavoided Autonomy Mode because it gave them no feeling of control over the system.Autonomous exploration was ”not-configurable”. We hypothesize that in order toincrease the operator robot:ratio we need an improvement in Autonomy Mode. Theexperimental evaluations show that for 2 robots the Shared Control Mode is sufficientfor obtaining good performance, as the operator is able to supervise the team andcommand the single robots when required. For teams of three or more robots,however, the Shared Mode proves inadequate, and a greater degree of autonomy isrequired. This fact explains the motivation for the development of the following andlast prototype: interface version 4.
5.4 Interface Version 4
The evolution of the interface to version 4 mainly focused on the modification of theexploration mechanism in order to give the operator more control over the system.
104

Designing for Multi-robot Missions (II)Improving the Autonomy Management. Interface Version 4
Subjects in the mentioned above experiment were unable to configure the way inwhich the team of robots explored the environment. As the robots were not coor-dinated with one another and did not share any information, several robots usuallytried to explore the same area, which impaired good performance. The operatorwas aware of this fact, but was not capable of modifying the situation. Conse-quently, version 4 of the interface includes ways of configuring the exploration layer.A modification in the Motion Planner Layer was also introduced.
5.4.1 Enhancing the Autonomy Mode
Compulsory and Forbidden Areas
In order to preventing several robots from exploring the same area, the operator canuse the the interface to set compulsory and forbidden areas. As we explained in thefirst chapter, the exploration layer is responsible for choosing a target point, whichthe robot then tries to reach. This target point is chosen according to the missiongoal. In the case of search or exploration missions, the policy is to maximize theexplored area. Choosing a compulsory area to explore, the operator sets a specificsubset of the environment for robot exploration, so that the target point must beinside that area. The same holds for the forbidden area, by setting which theoperator excludes the chosen target points from certain regions. The operator setsthis region by selecting a rectangular area on the 2D map view of the interface.He can set as many regions as we wishes. A screen-shot of the interface in whichsome compulsory and forbidden areas are shown for a particular robot can be seenin Figure 5.4.1.
Setting different compulsory areas for each robot, the operator coordinates teamexploration according to the characteristics of the environment. This should improveexploration performance based on the operator’s expertise and his perception ofthe environment. The operator, going on the information he retrieves through thesensors, or on a priori information he has of the place, can set an exploration policy,can determine the number of robots, and can decide which ones should explore aparticular region.
This is specially useful when working with heterogeneous teams, as differentrobots may have different sensing or mobility capabilities and so be more or lesssuitable for particular places. We have not spoken so far of heterogeneous teams;in the last chapter, where we will discuss current and future work, we will describethe current prototype of our interface, which supports not only wheeled robots,but also robots with tracks, which increases the range of team mobility capabilities.Since version 2, the interface has also supported unmanned aerial vehicles, but as wehave not evaluated this aspect, we have also said nothing about it in the foregoingdiscussion.
By setting forbidden areas, the operator prevents the robot from entering placeswhich may be jeopardize its integrity, or which he knows it is unable to navigate.These places may also be free of victims, in the case of search and rescue missions,or there may be some other information indicating that the robot should not or neednot enter the area in question. Once again, the setting of compulsory and forbiddenareas enables the system to benefit more fully from the’s operator expertise and
105

Designing for Multi-robot Missions (II)Improving the Autonomy Management. Interface Version 4
Figure 5.13: GUI with compulsory areas (green border square and robot color) andforbidden regions (red border squares and robot color)
106

Designing for Multi-robot Missions (II)Improving the Autonomy Management. Interface Version 4
cognitive capabilities.
Compulsory and Forbidden Navigation Regions
This is a variation on the preceding configuration. The operator can decide wherethe chosen target points are to be. Using this option, he also sets the navigableregions, so that the path-planner computes only the path inside the compulsoryregions while avoiding the forbidden areas. The operator must take care to ensurethat there is a path by which the point can be reached; in the case that there is notsuch a path, an error message will be triggered from the Path-Planner layer. Thisconfiguration can be used in combination with the preceding one or independentlyof it. Of course, the compulsory target points must be a subset of the compulsorynavigation regions.
This mechanism gives the operator a high level of control over robot motion, bywhich he avoids dangerous places and thus reducing stoppage, which, as we haveseen, is the major cause of low performance.
Preferred Directions
The operator can set preferred exploration directions. This means that the explo-ration layers will ”weight” all the possible target points according to their proximityto the preferred direction in order to select the most useful option. This directionis relative to the world, and not to the robot. An example of the utilisation of thisfunction is given by a team composed of four robots. The operator can send onerobot North, another South, and the other two East and West, respectively. In thisway, he ensures that the whole area will be covered. In order to see this parameter,the operator simply selects a robot and then draws an oriented line on the mapcorresponding to the preferred direction. This action can be combined with any ofthe preceding ones. An image showing the robots’ preferred direction can be seenin Figure 5.4.1.
Final Destination
As a complement to the preferred direction setting, the operator may set a finaldestination, that is, a point that he would eventually like to reach. Among thepossible target points, the exploration layer will choose the one closest to the finaldestination. This configuration is useful when the operator wants to reach a targetpoint, but there is not yet a map for the path-planner to construct a path. In thisway, the exploration layer will try to approach the selected point as closely as itcan, until eventually reaching it (if that is possible). As the environment is notyet known, the solution may not be optimal, as the robot may encounter dead-endsclose to the final destination or meet with other eventualities. As an example ofuse, consider a destination position that is geo-referenced inside the environment.The operator can set that point towards a final destination and command the robotto try to reach it. In combination with the preferred directions function, this mayresult in useful action on the part of the robot. If the operator does not know howto reach the desired point, he can set two robots the same final destination and the
107

Designing for Multi-robot Missions (II)Improving the Autonomy Management. Interface Version 4
Figure 5.14: GUI with Preferred Directions
same preferred directions. The combination of both policies aims at attaining thesame final point by two different means. This strategy may also be combined withany of the previous configurations.
5.4.2 Motion Planner Layer
The motion planner used up to and in the design of Interface version 4 has alreadybeen described in Appendix A. This motion planner, as was explained, adjusted therobot’s trajectory in order to avoid abrupt changes of speed and direction. Althoughthe computed path consists of rectilinear segments, the actual trajectory of the robotis less angular and smoother. This has many advantages: Avoidance of abrupt speedchanges saves energy reserves in the battery, while avoidance of angles along motiontrajectories enables human-robot interaction to proceed along more natural lines,which is especially useful in service robotics, etc. An example of a path adjustmentcan be seen in Figure 5.15.
That having been said, under some circumstances the operator may wish therobot to follow the computed path precisely. For example, if the path has beenplanned to avoid forbidden regions, it would make no sense for the motion plannerto plot a course inside them. Consequently, we have implemented an alternativemotion planner that adjusts robot motion to follow the path provided (by the Path-Planning Layer or by the operator). The interface enables the operator to switchfrom one to another according to task requirements.
108

Designing for Multi-robot Missions (II)Improving the Autonomy Management. Conclusions
Computed Path
Real Trajectory
Figure 5.15: Path adjustment made by the Motion Planner
5.5 Conclusions
In this chapter, we have evaluated the third version of our interface. This evalu-ation was presented on the basis of controlled user experiments. The experimentswere similar to the ones presented in the previous chapter. Comparison of the twopresentations will convey an idea of the performance improvements.
The major change in the third version was the inclusion of new command capa-bilities for the Shared Mode as well as for adjustable autonomy management, whichbecame more flexible and granulated than the one present in version 2. In version 2,the operator could set a target point only when working in Shared Control Mode. Inversion 3, the operator can set a sequence of target points or a path. Furthermore,each operation mode allows him to bypass any of its ”proper” functionalities. Forexample, even if he is working in Autonomy Mode, the operator can set a targetpoint, or temporarily control the speed and jog of the robot. These changes led toan improvement in the optimal operator robot:ratio. While in version 2 the perfor-mance of the operator decreased for more than one robot, in version 3 the operatorachieves a better performance with 2 and 3 robots.
We have learnt that commanding a team of robots requires proper shared con-trol capabilities which enable the operator to act at the required autonomy levelaccording to the task he must perform and the team state. If some of the robots areperforming well in autonomy he can send higher level commands while commandingat a lower level those robots in most need of attention. Splitting the former SharedMode into 3 commanding possibilities has been proven to be more suitable for this,as it has been seen in the experiments. Furthermore, long term commands, like
109

Designing for Multi-robot Missions (II)Improving the Autonomy Management. Conclusions
setting the desired path or the sequence of target points decrease the negative effectof neglecting a robot.
The evaluation of the third version lead to the fourth version, in which a con-figurable autonomy mode was implemented. While previously autonomous explo-ration was defined completely within the robot’s software, now the operator canparametrize it, which allows him to configure exploration policies for the roboticteam. The functionalities included are:
• Set compulsory and forbidden destination areas,
• define navigable and non-navigable regions,
• set preferred exploration directions, and
• set a final destination that the robot should eventually reach if it can.
Furthermore, a new motion planner was implemented. Its characteristics differfrom those of the one implemented in Version 3; depending on the task, the operatorcan choose the most suitable type of motion.
This version of the interface was used in the last RoboCup Edition (2009, Aus-tria), in the Rescue Simulation League. It received a Technical Award for the mostinnovative interface. Further work will include the conducting of user experimentsto evaluate the improvements brought by Version 4. We hypothesize that, with thenew functionalities offered in Autonomy Mode, operators will use it more often. Thegoal is to increase optimal team size to three or even four robots.
110

Chapter 6
Experimental comparison betweenthe PDA and the DesktopInterfaces
6.1 Introduction
Until now we have addressed the interaction between one operator and the team ofrobots he is controlling. In real operations it would be more usual that a team ofoperators interact with a team of robots. In search and rescue missions the team ofresponders is usually constituted by remote personnel, in the Centre of Operations,and field responders who must go into the disaster scenario. Robots may be usedas an aid to reach zones unreachable for humans, or to explore the area before theresponders incursion. This involves a team of operators controlling and retrievinginformation from a team of robots.
Such missions are characterized by remote stationary personnel and on-site re-sponders. Robots are a useful aid for dealing with situations involving hazard orinaccessibility. Thus, it is important to identify which sort of operator is the bestable to control them. Intra-scenario operator mobility is often said to be advanta-geous for acquiring Situational Awareness in the context of robot tele-operation, butfixed devices can provide a greater volume of processed information. This shouldnot be discounted when seeking to construct more effective Human-Robot Interac-tion in Search and Rescue or Exploration missions. In this chapter, on the basis ofextensive experimentation comparing a desktop-based interface with a PDA-basedinterface for remote control of mobile robots, we attempt to do two things. Firstwe undertake to define which kinds of operators have the best SA under differentconditions. Second, we seek to lay the groundwork for a control transfer policy fordetermining when one should hand over to another depending on the device, taskand the context.
The chapter is divided into three main sections. We begin by presenting sometheoretical aspects concerning the cognitive differences between a PDA and a Desk-top Interface for controlling a remote robot. We then go on to explore the differencesbetween the desktop interface and the pda interface under the same operational con-ditions. Next we asses how variation of the operation conditions influences operator

Experimental comparison betweenthe PDA and the Desktop Interfaces Situational Awareness and Spatial Cognition
performance for each interface prototype. We present afterwards the results and thecontribution of this study. The two-fold research question is the following: Whenshould the remote operator take the control of the robot, and when should it be trans-ferred to the on-site operator? ; Under what sort of circumstances and/or in thecontext of what sorts of tasks?.
6.2 Situational Awareness and Spatial Cognition
We can recall here the five human-robot situational awareness categories presented in[76]: location awareness, activity awareness, surroundings awareness, status aware-ness, and overall mission awareness. Among these we will further analyse locationawareness and surroundings awareness, since they are fundamental for the remotetele-operation of a robot. In order better to understand how SA enhances an opera-tors performance when he is guiding a robot it is useful to introduce two importantconcepts from human spatial-cognition: route knowledge and survey knowledge. Thedistinction between route and survey knowledge helps us to understand what cog-nitive skills are needed by a human operator remotely controlling a robot.
Route perspective is closely linked to perceptual experience: it occurs from theegocentric perspective in a ”retinomorphous reference system,” such that the subjectis able to perceive himself in space [39], with a special emphasis on spatial relationsbetween objects composing the scene in which the subject is situated. An example isthe case of an operator controlling a robot by means of a three-dimensional displayon a screen that simulates the visual information that he would obtain by directlynavigating in the environment. Route-based information, gathered from a groundperspective, is stored in memory; this makes it possible to keep track of turningpoints, distances and landmarks or relevant points of reference in the observed con-text. By contrast, survey perspective is characterized by an external and allocentricperspective, such as an aerial or map-like display, and it thus facilitates direct accessto the global spatial layout [15]. In this sense, it reproduces the situation that wouldobtain if operator had a device that enabled a global, aerial view of environment andthat carried the robot inside it. Previous studies have shown that a navigator (inour case: the operator) having access to both perspectives exhibits more accurateperformances [39].
We see that there is a relation between location awareness and survey knowledge,while surroundings awareness is correlated with route knowledge. Path-planning, forthe sake of obstacle-avoidance, depends on the operators surroundings awareness; itdeploys an egocentric system of reference for deciding the robots direction of move-ment. The problem, however, is that information about the overall environmentremains rigid and relatively poor. By contrast, survey knowledge, for way-finding,depends on the operators location awareness, which is generally considered an inte-grated form of representation permitting fast, route-independent access to selectedlocations structured in an allocentric coordinate system [71].
Our case study consists of a human operator remotely controlling a robot usinga human-robot interface. When the operator is not physically in the navigation sce-nario, the interface must enhance his spatial cognitive abilities by offering multilevelinformation about the environment (route and survey knowledge). Complex inter-
112

Experimental comparison betweenthe PDA and the Desktop Interfaces Initial Experiment
Figure 6.1: The P2AT robot in the outdoor area during one of the experimentalruns
faces can provide different perspectives on the environment (offering either a birdseye view or a first-person view). Such richly varied information enables an operatorlooking at a graphical user interface to have more than one perspective at the sametime. Contrarily, if the operator is in the scenario, part of the needed informationcan be acquired by direct observation, depending on the visibility the operator has.In such situations less information needs to be displayed on the GUI.
The above-mentioned spatial-cognitive aspects should be taken into considera-tion when designing a human-robot interface for remote tele-operation.
6.3 Initial Experiment
The goal of this exploratory study is to compare the usefulness of a PDA with aDesktop GUI in order to determine the optimal way to distribute the control of arobot between an operator roving with a hand-held device and a remote stationaryoperator using a desktop computer, so as eventually to work out a control transferpolicy for determining when robot-guidance should be passed from one operatorto another. A particular goal of our research was to investigate which of the twointerfaces is more effective when used in navigation and/or in exploration tasks,depending on different conditions of visibility, operator mobility, and environmentalspatial structures.
Although both desktop and PDA interfaces can provide both of the kinds of spa-tial knowledge mentioned above, the PDA may allow less access to survey knowledge(location awareness), due to the need to switch screens and to the amount of timerequired to retrieve, process, and design the map. In the desktop interface, surveyand route knowledge are always provided simultaneously on the same screen.
6.3.1 Experiment Design and Procedure
Our initial intuition was that the desktop-based interface would provide better SAto an operator using it for remote robot control. The importance of this questionis obvious: The better an operator’s SA will be, the better his or her performancewill be. There are two major tasks that an operator must carry out when remotely
113
Experimental comparison betweenthe PDA and the Desktop Interfaces Initial Experiment
guiding a robot: navigation and exploration. Navigation involves reaching a targetpoint while avoiding obstacles, exploration, on the other hand, requires choosingamong multiple alternative ways to reach a particular goal, as is the case whensearching for victims in a disaster area, assessing the extent of damages after anexplosion, and so forth. We set up one controlled experiment for each of these twotasks. We hypothesized that in both cases the operator using the desktop-basedinterface would perform better than the operator using the PDA-based interface.
The operators should perform two tasks: exploration and navigation. For theexploration task we set up the experiment using the Player/Stage [32] robotics sim-ulator. The subjects were asked to explore an unknown virtual environment of 20mx 20 m using a mobile robot equipped with a laser range scanner. Users were giventwenty minutes each to explore the maximum area without colliding with any ob-stacles. Each candidate was randomly assigned one interface-type and had a singletrial with it. In order to give the subjects a plausible reason for performing thetask, we asked them to look for ”radioactive sources” distributed in the area. The”radioactive” spots were detected by a simulated sensor installed in the robot. Forthe navigation task subjects were asked to navigate with the real Rotolotto PioneerP2AT robot equipped with a SICK Laser Range Finder (Fig. 6.1) along a path,approximately 15 meters in length, made up of narrow spaces, clustered areas, andcorridors. Users were not required to find a route, but simply to complete the des-ignated one in the minimum time and without colliding. The subjects were notfamiliar with the scenario and were not able to see it at any point. This experimentaimed to reproduce the situation in which operators must remotely guide a robotto a target, for example, in order to bring a sensor to a certain pinpointed area.
The experiments involved twenty-four subjects, nineteen undergraduates andfive PhD candidates ranging in age between 20 and 30 and distributed betweenfour females and twenty males. The scenario of each of the two experiments wasdifferent from that of the other and no participant had previous experience of eitherof the two interface prototypes. All the subjects went through the experiments inthe same order, which ensured that so none had more experience than the others.Every subject went through a twenty-minute training program to acquire a basicknowledge of the functionalities provided by the interfaces. After the training, theyran through the experiments in order. Each subject had a single trial.
6.3.2 Data Analysis
For the exploration task analysis we have sub-divided an exploration time of 10minutes in twenty discrete values (from 0.5 to 10); then a 2x20 ANOVA on the ex-plored area (in m2) was carried on with the ”between-participants” factor of Interface(Desktop and PDA) and the ”between-participants” factor of Time (in minutes from0.5 to 10). The area covered was taken as a measure of exploration performance.
Results are shown in Figure 6.2. The analysis showed a significant interactionbetween Interface and Time [F (19, 361) = 13.65, p < .00001]. A planned comparisonfor each level of time was calculated. The calculation showed that at after 1.5minutes of exploration the difference between Desktop and PDA, in terms of exploredarea, crosses the significance threshold [p < .05]. After this point, the difference
114

Experimental comparison betweenthe PDA and the Desktop Interfaces Initial Experiment
Figure 6.2: Area covered in square meters by the operator using the PDA (lowercurve) and the operator using the desktop-interface (upper curve)
remains significant and its significance increases with each higher level of time.For the second task (navigation), a one way ANOVA on navigation times (mea-
sured in seconds) was calculated to compare the interfaces in order to see if the differ-ences under the PDA condition and the desktop condition had significant differenceswhen the operator had to navigate without being required to do any exploration(way-finding).
The collected data is shown in the following table.
Desktop Interface PDA Interface
Average 341 391.89Std. Dev. 116.7 117.38Max 560 543Min 144 245Conf. Int. (95%) 68.96 76.68
Table 6.1: Completion Time in Seconds
The ANOVA results are:
Sum of Sq. df Mean Sq. F-value p-value
Between Gr. 12819.471 1 12819.471 1.259 0.277Within Gr. 183227.479 18 10179.304Total 196046.950 19
Table 6.2: Navigation Time - ANOVA
The results can be seen graphically in Figure 6.3.
115

Experimental comparison betweenthe PDA and the Desktop Interfaces Second Experiment
Desktop Interface PDA Interface250
300
350
400
450
500C
ompl
etio
n T
ime
(sec
onds
)
Figure 6.3: Completion times - Confidence Intervals (95 %)
6.3.3 Discussion
Unexpectedly, the ANOVA on navigation times turned out non significant ([p <0.05]), revealing no difference in performance times between the two types of in-terfaces. We therefore conclude that operators perform practically identically whennavigating remotely, independently of the interface type, while the interfaces leadto a highly significant difference in the context of exploration. We hypothesize thatthis difference in range of performance between navigation and exploration might de-rive from differences in information requirements that each type of task respectivelyentails. Arguably, not all of the information given by the desktop (local, global,and three-dimensional perspectives) is necessary for navigation, whereas all of it isindispensable for exploration, inasmuch as exploration requires Location Awareness.
6.4 Second Experiment
Once we experimentally checked the differences between the two interfaces underthe same conditions (no-visibility), we designed an experiment modifying those con-ditions in order to determine when an operator using the PDA-interface can performbetter than an operator using our Desktop-interface. We modified the visibility con-ditions for the operator equipped with the PDA, since the portability of the PDAaffords the user intra-scenario mobility, while the operator on the Desktop remainedremote. Ascertaining differences in performance according to task, context, and de-vice is, we felt, an important step towards working out a control transfer policy forpassing control of the robot to the best-preforming operator.
116
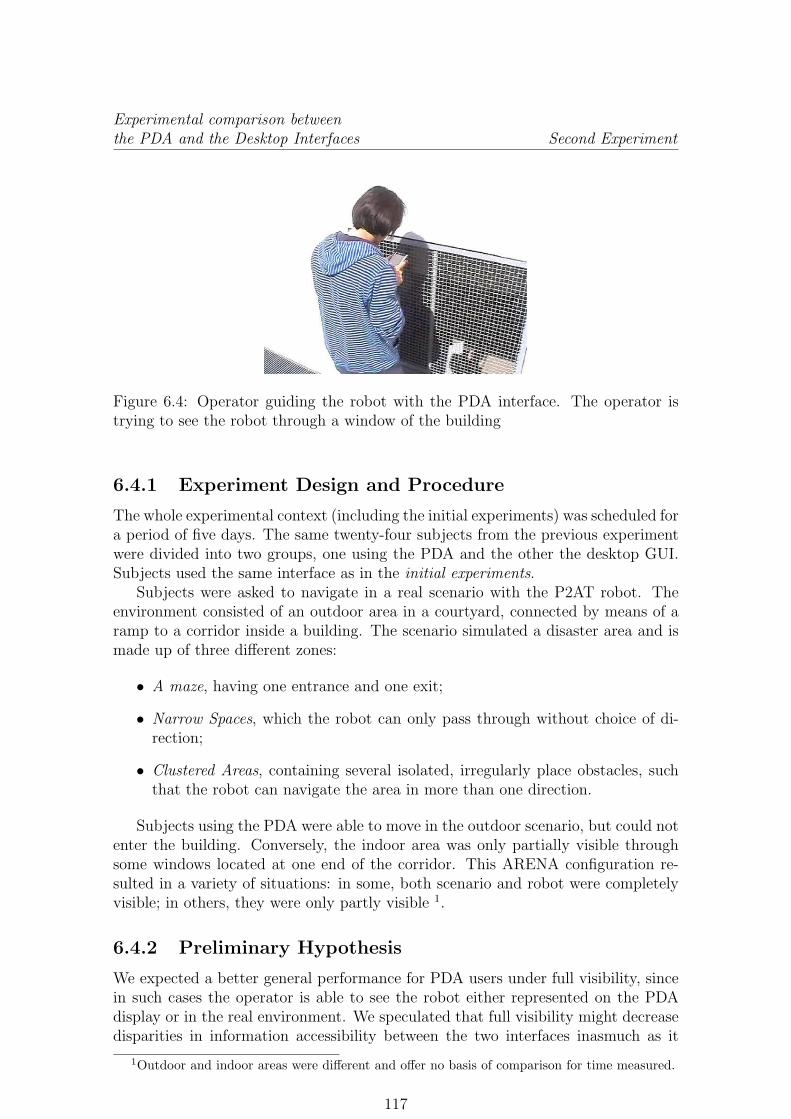
Experimental comparison betweenthe PDA and the Desktop Interfaces Second Experiment
Figure 6.4: Operator guiding the robot with the PDA interface. The operator istrying to see the robot through a window of the building
6.4.1 Experiment Design and Procedure
The whole experimental context (including the initial experiments) was scheduled fora period of five days. The same twenty-four subjects from the previous experimentwere divided into two groups, one using the PDA and the other the desktop GUI.Subjects used the same interface as in the initial experiments.
Subjects were asked to navigate in a real scenario with the P2AT robot. Theenvironment consisted of an outdoor area in a courtyard, connected by means of aramp to a corridor inside a building. The scenario simulated a disaster area and ismade up of three different zones:
• A maze, having one entrance and one exit;
• Narrow Spaces, which the robot can only pass through without choice of di-rection;
• Clustered Areas, containing several isolated, irregularly place obstacles, suchthat the robot can navigate the area in more than one direction.
Subjects using the PDA were able to move in the outdoor scenario, but could notenter the building. Conversely, the indoor area was only partially visible throughsome windows located at one end of the corridor. This ARENA configuration re-sulted in a variety of situations: in some, both scenario and robot were completelyvisible; in others, they were only partly visible 1.
6.4.2 Preliminary Hypothesis
We expected a better general performance for PDA users under full visibility, sincein such cases the operator is able to see the robot either represented on the PDAdisplay or in the real environment. We speculated that full visibility might decreasedisparities in information accessibility between the two interfaces inasmuch as it
1Outdoor and indoor areas were different and offer no basis of comparison for time measured.
117

Experimental comparison betweenthe PDA and the Desktop Interfaces Second Experiment
could more salient route information access from direct experience of the environ-ment. Due to the initial results it was difficult to construct hypotheses concerningthe differences given partial visibility, since the degree of difference in such condi-tions depends on the task: significant difference for exploration, no difference fornavigation.
6.4.3 Data Analysis
The collected data is shown in the following tables. There are two scenarios. In thefirst one, outdoor, the PDA operator had full visibility of the robot and scenario,while the Desktop operator does not have visibility of them. In the second scenario,indoor, the PDA operator had partial visibility of the robot and scenario, while theDesktop operator had no visibility of them.
Desktop Interface - No VisibilityMaze Narrow Space Clusters
Mean 182.73 504 237.82Std. dev. 120.62 199 84.52Max 480 804 375Min 88 204 118Conf. int. (95%) 71.28 117.6 49.95
PDA Interface - Full VisibilityMaze Narrow Space Clusters
Mean 107.89 147.56 182.44Std. dev. 20.14 40.84 37.92Max 143 232 264Min 79 108 150Conf. int. (95%) 13.16 26.68 24.77
Table 6.3: Completion Times - Outdoor Scenario
118

Experimental comparison betweenthe PDA and the Desktop Interfaces Second Experiment
Maze Narrow Space Clustered Area0
100
200
300
400
500
600
700
Space Type
Nav
igat
ing
Tim
es (
seco
nds)
DesktopPDA
(a) Operator using PDA with full visibility of the scenario wrt. operator usingdesktop. Mean times and confidence intervals (95%) are represented
Maze Narrow Space Clustered Area50
100
150
200
250
300
Space Type
Nav
igat
ing
Tim
es (
seco
nds)
Desktop
PDA
(b) Operator using PDA with partial visibility of the scenario wrt. operatorusing desktop. Mean times and confidence intervals (95%) are represented
119

Experimental comparison betweenthe PDA and the Desktop Interfaces Second Experiment
Desktop Interface - No VisibilityMaze Narrow Space Clusters
Mean 174 175.55 85.64Std. dev. 28.8 74.71 34.14Max 225 289 140Min 142 93 33Conf. int. (95%) 17.02 43.79 20.18
PDA Interface - Partial VisibilityMaze Narrow Space Clusters
Mean 242.67 166.33 94.67Std. dev. 76.62 89.45 37.86Max 415 317 172Min 150 70 42Conf. int. (95%) 50.06 58.44 24.73
Table 6.4: Completion Times - Indoor Scenario
Two separated ANOVA’s (since the visibility variable did not vary in the Desktopinterface) on navigation times for each condition of PDA visibility: Total Visibility(TV) and Partial Visibility (PV), were carried out to study the PDA visibility effecton performance. First of all we analysed the three space conditions together, byadding the times of every space. The ANOVA analysis is:
Sum of Sq. df Mean Sq. F-value p-value
Between Gr. 1352208.704 1 1352208.704 34.032 0.000Within Gr. 715200.016 18 39733.334Total 2067408.720 19
Table 6.5: Navigation Time - Outdoor - ANOVA
Afterwards we repeated the analysis for each space condition. The ANOVA datacan be seen in the following tables.
120

Experimental comparison betweenthe PDA and the Desktop Interfaces Second Experiment
Sum of Sq. df Mean Sq. F-value p-value
Between Gr. 27725.077 1 27725.077 3.355 0.084Within Gr. 148736.801 18 8263.156Total 176461.878 19
Table 6.6: Navigation Time - Maze - Outdoor - ANOVA
Sum of Sq. df Mean Sq. F-value p-value
Between Gr. 628894.894 1 628894.894 27.654 0.000Within Gr. 409353.245 18 22741.847Total 1038248.139 19
Table 6.7: Navigation Time - Narrow Space - Outdoor - ANOVA
Sum of Sq. df Mean Sq. F-value p-value
Between Gr. 15181.375 1 15181.375 3.295 0.086Within Gr. 82939.715 18 4607.762Total 98121.090 19
Table 6.8: Navigation Time - Clusters - Outdoor - ANOVA
The same was made for the indoor scenario, the first ANOVA results are:
Sum of Sq. df Mean Sq. F-value p-value
Between Gr. 23219.856 1 23219.856 1174 0.293Within Gr. 356083.527 18 19782.418Total 379303.384 19
Table 6.9: Navigation Time - Narrow Space - Outdoor - ANOVA
The Analysis for each space condition is:
121

Experimental comparison betweenthe PDA and the Desktop Interfaces Second Experiment
Sum of Sq. df Mean Sq. F-value p-value
Between Gr. 27725.077 1 27725.077 3.355 0.084Within Gr. 148736.801 18 8263.156Total 176461.878 19
Table 6.10: Navigation Time - Maze - Indoor - ANOVA
Sum of Sq. df Mean Sq. F-value p-value
Between Gr. 420.792 1 420.792 0.064 0.804Within Gr. 118918.520 18 6606.584Total 119339.312 19
Table 6.11: Navigation Time - Narrow Space - Indoor - ANOVA
Sum of Sq. df Mean Sq. F-value p-value
Between Gr. 403.627 1 403.627 0.314 0.582Within Gr. 23122.433 18 1284.580Total 23526.060 19
Table 6.12: Navigation Time - Clusters - Indoor - ANOVA
Results are shown in Figures 6.5(a) and 6.5(b). A simple glance at the figuresshows that the operator using the PDA with full visibility drove the robot faster.Considering the three scenarios together this difference is significant (p < 0.05 -Table 6.5). Considering each space condition the differences are not significant forthe maze and the clustered areas (Tables 6.6 and 6.8) as p > 0.05, but they havea tendency to be significant (p < 0.1). For the narrow spaces the difference issignificant (Table 6.7).
For the condition of partial visibility data analysis is shown in Tables 6.9, 6.10,6.11 and 6.12. These results can be seen in Figure 6.5(b). There is no statisticaldifference for the addition of the three spaces, nor for each space considered sepa-ratedly. In any case, for the maze space the operator using the desktop interfaceshowed a better performance with an statistical tendency to be significantly different(p < 0.1)
6.4.4 Discussion
The data analysis of the experiment shows that operators using the PDA-interfacein conditions of total visibility performed better in terms of navigation times thanthe operators controlling remotely with the desktop GUI. That is, the informationthe operator receives through the PDA, completed by information he obtains di-rectly from the operating scenario, provides him or her with better SA for guidingthe robot. This suggests that a PDA permits successful task-accomplishment whenthe robot is monitored with the help of both on-screen information and real environ-ment cues. This capacity for information integration, together with the simplicityof the interface, makes it possible to compensate for the limitations of the device.
122

Experimental comparison betweenthe PDA and the Desktop Interfaces Conclusions
Analysing each Space-Type separatedly the difference was significant only for thenarrow spaces, but there is a tendency to be statistically different also for the othertwo space-types. This let us think again that the location awareness provided di-rectly by the operator allowed him to drive the robot in narrow passages.
In conditions of partial visibility, results indicate that an operator guiding therobot with our desktop-interface got no better results that the operator drivingwith the PDA. In the maze-like space there is a tendency showing that the opera-tor using the desktop achieves faster navigation times than the operator using ourPDA-interface. We hypothesize that this effect is due to the respective amount ofinformation provided by the two interfaces: While the desktop-interface makes localand global (Survey Perspective - Location Awareness) and three-dimensional (Route- Surrounding Awareness) perspectives available simultaneously. By contrast, thePDA can display only one of these perspectives at any given moment, and the op-erator must therefore employ more time switching between tabs to change from oneperspective to the other. This problem occurs mostly in mazes, presumably becausein these kinds of environments a global configuration of the spatial structure (SurveyPerspective) is needed in order to find a way out.
The results of the experiments clearly indicate a difference between interfacesdepending on the type of task, as shown in the initial experiments. Table 6.13illustrates the different cases that were considered and indicates which operatorperforms better depending on interface, task, scenario, and condition of visibility.This table could help pinpoint when one operator should transfer control to anotheroperator depending on task and context. In analysing the data, we kept in mindthat finding a way through the maze is an exploration task, driving through narrowspaces is a navigation task, and driving in a clustered area is a combination of both.
Exploration Expl./Nav. Navigation
Total VisibilityPDA
Partial VisibilityDesktop Desktop/PDA Desktop/PDA
No VisibilityDesktop Desktop/PDA
Table 6.13: Best performing operator depending on the interface, task, and visibility
6.5 Conclusions
We have studied the influence of task and operator mobility on controlling a robotusing a PDA-interface wrt. controlling a robot using a desktop-interface in view ofproviding a transfer of control policy among stationary remote operators and rovingoperators. Even if the results here analysed apply only to our interfaces, we believethat they can be generalized according to device. Our thesis is therefore that similarresults would be obtained even if the same experiments were run with differentlydesigned interfaces.
123

Experimental comparison betweenthe PDA and the Desktop Interfaces Conclusions
As a main conclusion, we can state that the SA of the operator is reducedwhen he uses the PDA (Location Awareness suffers most), due to the fact that thesmall size and low computation capacity of a PDA device prevent the operator fromaccessing the same amount of information he has available when using a desktop.Nonetheless, the ability to move inside the operating scenario ensured by a hand-held device may counterbalance this disadvantage, as our results suggest. Once itis determined which operator has a better SA, according to task and context, thiswould presumably provide a basis for a control transfer policy governing whencontrol is to be handed over to the most suitable operator.
The chapter elucidations provide a triple potential. First, it helps determinewhich operators have the best SA in different situations (mobility, device, visibility).Second, it provides a first step towards identifying when a particular operator shouldtransfer control to another operator. Third, it enhances the optimal operator:robotratio by offering a transfer of control policy for distributing the control of the robotsamong the available operators.
In the future we propose to work on finding ways to enhance Survey Knowledge(Location Awareness) through the PDA-interface in order to diminish the differencesin performance that we have mentioned. For the time being, our results demonstratethat when the operator is not required to explore, but only to navigate, the twointerfaces enabled an equal level of performance in controlling the robot.
124

Chapter 7
Conclusions
7.1 Introduction
In this dissertation we have surveyed some of the major lines of research in remoterobot control and supervision in exploration missions, mainly related with emer-gency situations. We have begun covering the theoretical background required forthe understanding of this research and the proposed solution. We have followeda general-to-particular approach. We began giving an overview of human-machinesystems when automation is involved. Afterwards we focused on the cases in whichmachines are robots. Finally, we discussed our case study, which involves the sce-nario of an operator using a robot for exploring an unknown environment.
The dissertation began explaining the importance of the human in automatedsystems. Whenever machines are automated only to a certain extent, human par-ticipation will also be required to some degree. Having this in mind, and supportedby the existing literature, we motivated the inclusion of the human point of viewin the full design process of any automated system. We may remember here thewords of Julie A. Adams: ”Many years of Human Factors research have shown thatthe development of effective, efficient, and usable interfaces requires the inclusion ofthe user’s perspective throughout the entire design and development process. [Un-fortunately] Human-Robot Interface development tends to be an after thought, asresearchers approach the problem from an engineering perspective. Such a perspec-tive implies that the interface is designed and developed after the majority of therobotic system design has been completed.”.
This fact constitutes the ”heart” of our research, we have designed, implemented,and evaluated, a human-machine system which from the beginning has taken inconsideration the human role. This has involved the re-design of many aspects ofthe robotic system:
1. in order to make it capable of supporting the operator, and
2. in order to take advantage of the operator abilities.
That is to say, it is not only the system that must support the human, but thesystem must also be able to be supported by him. This way of understanding thedesign of robotic systems is the basis of the human-robot interaction discipline, asa particular sub-field of the human-factors science.

Conclusions Interface Evolution
This research methodology resulted in the design of two human-robot interfacesthrough evolution. In the dissertation we have explained the full process: from theinitial design, to its evaluation and evolution. Each prototype was supported bythe results already existing in the literature. Afterwards the prototypes were eval-uated conducting user experiments, and the results obtained from the experimentspropelled the design of the following prototype. In the following sections we willrecapitulate the evolution of the interfaces, hightlighting the hypothesis and theconclusions.
7.2 Interface Evolution
The evolution of the interfaces can be seen graphically in Figures 7.1 and 7.2
7.2.1 Interface Version 1
The first version of the interfaces was designed considering the several existing stud-ies about designing human-robot interfaces and situational awareness. The desktopinterface was based on the well-known interfaces of the Idaho National Labora-tories and the University of Massachusetts-Lowell (see Chapter 3). These groupsdistinguish between map-centric interfaces and video-centric interfaces. They claim,supported with experimental data, that video-centric interfaces are more suitedfor acquiring surroundings awareness, while map-centric provide a better locationawareness. We hypothesized that this subdivision limits the field of application ofthe interface and designed a new layout integrating both perspectives: video-centricand map-centric. The first version of the interface is explained in detail in Section3.3.
The evaluation of the first prototype was designed to measure the usability ofthe interface developed. Since it was a first prototype, we paid an special attentionto the operator situational awareness, considering that this is the basis of a goodpreliminary design. The lessons learnt indicated that the subdivision made previ-ously in the literature between map-centric and video-centric does not cope with thegeneral requirements of interface design. Even if map-centric displays may be moresuited for providing location awareness, while video-centric may be more suitable forproviding surroundings awareness, video helps to identify visual landmarks, whatpermits the operator to localize the robot (location awareness) and a proper mapcan give a precise localization of close obstacles. According to this, our interlacebreaks with that distinction, and in fact, it cannot be said to be map-centred, norvideo-centred, as it implements both kinds of information not prioritizing any ofthem. This design allows the operator to pay attention to the most suitable accord-ing to the task. Even if there are more displays than in INL and UML interfaces,ours remains simple and easy to use, as it was concluded from the usability tests.
7.2.2 Interface Version 2
The evaluation conducted with version 1 propelled the evolution of the interfacetowards the next prototype, version 2. The main changes in relation with the first
126

Conclusions Interface Evolution
(c) Version 1
(d) Version 2. Complex View (e) Version 2. Team View
(f) Version 3. Complex View (g) Version 3. 3D View
(h) Version 4. Team View
Figure 7.1: Desktop Interface Evolution127

Conclusions Interface Evolution
(a) Version 1. Laser View (b) Version 1. Map View (c) Version 1. AutonomyLevels
(d) Version 2. Laser View (e) Version 2. Map View (f) Version 2. AutonomyLevels
(g) Version 3. Way point (h) Version 3. Desiredpath
Figure 7.2: PDA Interface Evolution
128

Conclusions Interface Evolution
version are explained in Sections 3.5 and 4.3. The innovations included severalmodifications of the displays, in order to enhance the operator situational awarenessand a re-design of the autonomy adjustment and operation modes, including thefeed-back provided in the interface. Once the aspects of the operator situationalawareness were studied goal of version 2 was to allow the control and supervisionof a team of robots. For the design of the second version the theories of autonomylevels, autonomy adjustment and operations modes were studied, as well as thestate-of-the-art in multi-robot interfaces. In Chapter 4 experiments conducted withthis version are described and data analysed and discussed.
Our results show that when an operator has to control more than one robot ata time, his performance decreases significantly in terms of robot utilisation, by wayof contrast the area explored does not increase.
The conclusions of the study proved that for multi-robot tele-operation, an in-tegrated design of the interface is preferred by the operators, enforcing the lessonslearnt with version 1. The study helped to identify the major difficulties facing anoperator controlling a team of robots. Experiments concluded that at version 2, ourinterface did not allowed for an improvement of the mission performance with thenumber of robots. From the experiment results we learn two lessons:
• Multi-robot systems require a proper autonomy management to adjust thelevel of autonomy according to the mission requirements, and
• operators need granulated shared control modalities that allow them to givea variety of commands according to the task. Up to this version the operatorcould set only one target point, which was not suited for long term tasks.
These aspects were implemented in the third prototype, which was presented inChapter 5.
7.2.3 Interface Version 3
With version 2 we made a preliminary exploratory study of multi-robot missions.We conducted controlled experiments with users, measuring their performance andevaluating the usability of the interface. From a usability point of view, the subjectswho participated in the experiment were on the whole satisfied with the interfacedesign. On the other hand, our system proved to be unable to support efficientlyone operator controlling a team of robots. In fact, the optimal human:robot ratioturned out to be 1:1.
Regarding the design, the view that required major changes was the 3D one.We included the sonar readings coming from the robot, which affords a real-timeposition of rear obstacles. Another change was made in the map design, we drewthe map flat and not elevated, so that it does not hide the robot and is not confusedwith the robot. Finally we gave the operator the opportunity to set the point ofview in such a way that the image always remains in the front part of the display,while the robot and the environment are rotated according to the pan of the camera.Furthermore, we added a new display showing only the 3D view, which gives theoperator more viewing room when he wishes to see only the video and the laser andsonar readings.
129

Conclusions Interface Evolution
The major change applied in version 3 regarded the management of the autonomylevel. From that version the system no longer waits for a ”precise command” foreach operation mode but the the autonomy is adjusted in a multi-layered form (seeSection 5.2.2). The operator was provided with four possible commands:
• Set a desired path,
• set a sequence of target points,
• set a control speed and jog, and
• set the real speed and jog.
Depending on the operation mode of the robot: Tele-Operation, Safe Tele-Operation, Shared Control or Autonomy, the system reacts differently to each input.
The evaluation conducted with users revealed a considerable performance im-provement over the previous version (in relation with the support of multi-robotcontrol). While in the previous version increasing the number of robots did notlead to an increase in the area explored (see Section 4.4.2), in the third version theexplored area was greater for 2 and 3 robots than for 1 robot.
From the evaluation of the third version we learnt that commanding a team ofrobots requires proper shared control capabilities which enable the operator to actat the required autonomy level according to the task he must perform and the teamstate. If some of the robots are performing well in autonomy he can send higherlevel commands while commanding at a lower level those robots in most need ofattention. Splitting the former Shared Mode into 3 commanding possibilities hasbeen proven to be more suitable for this, as it has been seen in the experiments.Furthermore, long term commands, like setting the desired path or the sequence oftarget points decrease the negative effect of neglecting a robot.
7.2.4 Interface Version 4
The evaluation of the third version lead to the fourth version. The evolution ofthe interface mainly focused on the modification of the exploration mechanism inorder to give the operator more control over the system. In the third version it wasnot possible to configure the way in which the team of robots explored the environ-ment. As the robots are not coordinated with one another and do not share anyinformation, several robots usually try to explore the same area, which impairedgood performance. Consequently, version 4 of the interface includes ways of config-uring the exploration layer. While previously autonomous exploration was definedcompletely within the robot’s software, now the operator can parametrize it, whichallows him to configure exploration policies for the robotic team. The functionalitiesincluded are:
• Set compulsory and forbidden destination areas,
• define navigable and non-navigable regions,
• set preferred exploration directions, and
130

Conclusions Further Work
• set a final destination that the robot should eventually reach if it can.
Furthermore, a new motion planner was implemented. Its characteristics differfrom those of the one implemented in Version 3; depending on the task, the operatorcan choose the most suitable type of motion (see Section 5.4).
This version of the interface was used in the last RoboCup Edition (2009, Aus-tria), in the Rescue Simulation League. It received a Technical Award for the mostinnovative interface. Further work will include the conducting of user experimentsto evaluate the improvements brought by Version 4.
7.2.5 Interfaces Comparison
The first chapters have been dedicated to the interfaces design, considered sepa-rately. Chapter 6 compares the pda-based interface with the desktop-based inter-face considering the mobility, the task, and the interface type as the experimentalfactors. This experiment is a novelty in the human-robot interaction literature. Theperformance of the operators constitutes the basis for the comparison.
The goal of the study was to compare the usefulness of a PDA in comparisonwith a Desktop GUI in order to determine the optimal way to distribute the con-trol of a robot between an operator roving with a hand-held device and a remotestationary operator using a desktop computer, so as eventually to work out a con-trol transfer policy for determining when robot-guidance should be passed from oneoperator to another. A particular goal of our research was to investigate which ofthe two interfaces is more effective when used in navigation and/or in explorationtasks, depending on different conditions of visibility, operator mobility, and environ-mental spatial structures. The experiments are analysed in detail in Chapter 6 andconclusions summarized in Table 6.13.
As a main conclusion, we can state that the SA of the operator is reduced when heuses the PDA (Location Awareness suffers most), due to the fact that the small sizeand low computation capacity of a PDA device prevent the operator from accessingthe same amount of information he has available when using a desktop. Nonetheless,the ability to move inside the operating scenario ensured by a hand-held device maycounterbalance this disadvantage, as the experimental results suggest.
7.3 Further Work
As we said in the Introduction the contribution of this research is a full human-robotsystem, capable of working with multiple-operators controlling multiple-robots, eval-uated experimentally in all the combinations, with a variety of both simulated andreal robots, and which was used in the last two Rescue Robot RoboCup editions.Due to its generality, this system constitutes an excellent test-bed for further re-search and experimentation. Several lines of research remain open:
Autonomous Exploration Evaluation
One of the first programmed works is the evaluation of the fourth prototype of theinterface. The major innovations of this version was the possibility of configuring
131

Conclusions Further Work
the autonomous exploration from the interface in order to increase the optimaloperator:robot ratio by coordinating the actions of the robots. Experiments likethose presented in Chapters 4 and 5 are programmed to be done in year 2010 inorder to evaluate the modifications applied to the exploration layer.
Support of Heterogeneous Teams
The inclusion of heterogeneous robots asks for an integral re-design of the displays.Different kind of robots require a different visualization of the information and com-manding capabilities. For the RoboCup competition the interface was enabled tosupport aerial vehicles. The camera pointing to the floor replaced the Local View,the UAV was located inside the global map (its position was given by a GPS sen-sor). The 3D view showed the sensed distance to the ceiling and to the ground. Anscreen-shot taken in the RoboCup Competition can be seen in Figure 7.3. This sup-port was made ad-hoc for the competition requirements, but there was not a properdesign, nor any evaluation. For year 2010, apart from the UAVs, the interface isprogrammed to support ground vehicles with deployable tracks. The novelty withtracked vehicles is the change on their shape and their roll, pitch, yaw angles. The3D view, that currently considers that the robot is parallel to the floor, will neednew functionalities to represent the robot’s position and orientation.
Figure 7.3: GUI with quad-rotor
Real 3D Display
As we said in Chapter 3, the so called 3D display is really a pseudo-3D view, asthe information coming from the system is 2D. We re-create a 3D environment
132

Conclusions Final Note
in order to fuse video feed-back and obstacles in one single view. Currently thegroup is researching on 3D mapping, as we explain in Appendix A. This researchis propelling the interface to include a 3D display with real 3D data. This willrequire for a full battery of experiments in order to evaluate the operator situationalawareness, comparing it with the current information displayed. At present theinterface already includes ground detection. In fact some of the Figures shown inthe previous chapters show green areas on the maps, these regions represent thenavigable ground detected from 3D data.
Team Commands
Another of the novelties that are currently being implemented is the possibility tosend team commands, that is, instead of operating the robots as individual entitiesthe operator will be able to send commands to the team. This is the approach ofthe of the play-book commanding style, explained in Section 4.2.1. At present theoperator can send a set of target points to a sub-set of the robots composing theteam. The robots negotiate among them which of the target points to reach. At theend, the target points are distributed among the sub-set of robots according to thecomputed paths length.
7.4 Final Note
This dissertation describes the research made during the last three years in thecontext of a Ph.D. program. The research topic was motivated by the growing needof developing robotic systems that can be used by humans. Although the human-factors discipline has proven to be very useful in other fields as ergonomics, aerialcontrol, automated plants, etc. robotics is still lacking of a proper human-robotinteraction layer that makes robots usable. Exploration Robotics is one of the majorlines of research of the Ph.D. groups I have worked in, with a particular interest onSearch & Rescue Robotics. Applying the human-factors theories and, in particular,the human-computer interaction experimental methodology, we have developed twohuman-robot interfaces, and have re-designed our robotic system in order to supportand be supported by the human. The lessons learnt and our contributions to thefield are spread through the document, summarized in the Conclusions Section ofeach chapter and recapitulated in this final chapter, consisting of a set of guidelinesfor designing systems involving human-robot interaction.
133

Appendix A
The Robotic System
In this appendix, we present an overview of the robotic system used in our research.The work presented for this dissertation was carried out in the Cognitive Coopera-tive Robotics Laboratory1 of the University of Rome, Sapienza and the IntelligentControl Group2 of Universidad Politecnica de Madrid. Both groups share an interestin mobile robotics. The Spanish group is mostly focused on SLAM techniques, andis currently working on 3D localization and mapping. The Italian research teamfocuses on autonomous exploration and navigation, and have also worked on SLAM2D.
We will show the robotic platforms with which the system has been evaluated.It will be presented the robotic framework, used for the code development and a setof techniques for mapping, localization, motion, etc. From this, we will define thetaxonomy of the interaction.
A.1 Robotic Platforms
Real platforms are the best way to test any robotic software system. For the eval-uation of our interaction system, we have used both real and simulated robots, andexperiments with users have also been conducted with them. Even though simula-tions can be quite close to reality, they are never the same as both the environmentand the robots, which always differ in unpredictable ways.
In the following, we will describe the robotic platforms used for the developmentof the interaction system. These platforms have been used for the evaluation of theinterface. In Table A.2, we list the provided sensory data for each robot.
For research purposes we have also used virtual platforms, which will be describedbelow, aided by the USARSim Simulator and Player/Stage.
A.1.1 Rotolotto: Pioneer 2AT Robot
Rotolotto is a Pioneer 2-AT robot, belonging to the Cooperative Cognitive RoboticsLaboratory in Rome. The Pioneer 2-AT is a highly versatile all-terrain roboticplatform, chosen by many DARPA grantees and others requiring a high-performance
1http://sied.dis.uniroma1.it/2http://www.intelligentcontrol.es

The Robotic System Development Framework
(a) P2AT robot equipped with a SICK laserrange scanner
(b) Simulated Rotolotto P2AT robot
Figure A.1: Real and Simulated Rotolotto
robot. It has 8 forward and 8 rear sonar to sense obstacles from 15 cm to 7 m away.It is equipped with a SICK LMS200 laser range scanner and a pan/tilt camera. Apicture can be seen on figure A.1.1.
A.1.2 Nemo: Pioneer 3AT Robot
The Intelligent Control Group of the Universidad Politecnica de Madrid has a Pi-oneer 3AT Robot by MobileRobots.Inc. Like the Rotolotto robot, it is suited forindoor and outdoor navigation. It is equiped with a laser range scanner mountedon a pan/tilt device (figure A.1.2). This mobile platform is used for acquiring 3Drange data while navigating. The scanner is a SICK LMS200 laser sensor. Theservo pan-tilt unit is a PowerCube Wrist 070, by Amtec Robotics. Both the laserand the wrist are connected to an on-board computer. A data server processes thedata and sends synchronized updated information concerning odometry, PW70 andlaser measurements at clients cyclical requests. For further details, see [19].
A.2 Development Framework
A.2.1 Robotic Simulators: Player/Stage and USARSim
For daily testing we have used the Player/Stage simulator [32]. For final testingof the system and for conducting user evaluation we have used USARSim and thereal robots. USARSim (Unified System for Automation and Robot Simulation) isa high-fidelity simulation of robots and environments based on the Unreal Tour-nament game engine. Kinematically accurate models of new robots can be addedusing vehicle classes from the Karma Physics Engine, a rigid multi-body dynamicssimulator that is part of the Unreal development environment. It is intended as aresearch tool and is the basis for the RoboCup Rescue Virtual Robot Competition[5][13]. USARSim is extensively used in exploration robotics research [55][6][59][19].
There are three major advantages to using simulation:
135

The Robotic System Development Framework
(a) P3AT robot equippedwith a SICK laser rangescanner mounted on a Pow-erCube Pan/Tilt device
(b) Simulated Nemo P3ATrobot
Figure A.2: Real and Simulated Nemo
• Robotic platforms matching the requirements of the task can be easily built,
• The integrity of the robot is not at risk in the case of accidents.
• It is possible to model an environment according to the requirements of thetask.
The Simulated Rotolotto P2AT Robot
A P2AT robot is already modelled on USARSim, having the same specificationsof the real Pioneer 2AT robot, and reproducing our Rotolotto robot. The P2ATsimulated robot can be seen on figure A.1.1.
The Simulated Nemo P3AT Robot
Our simulated Nemo is shown in figure A.1.2. Its base is the P2AT standard plat-form. We added an tilting device already existing on USARSim (ScannerSides) tothe P2AT model. Unfortunately, this configuration has some drawbacks, which ourreal system does not have.
• It cannot provide feedback about the value of the tilt angle. This problemcan be solved in two ways. The first option is to adjust with a small angleincrement and wait long enough in order to make sure that the command hasbeen implemented. An alternative may be to mount an additional sensor,such as an INS (to attain the angle directly) or an encoder. Both solutionsare relatively easy to implement in USARSim.
• Tilt angle can be controlled only with reference to a final angle. Conversely,the Power- Cube wrist can be controlled by position, speed and torque. Forsolving this problem, we developed a new pan/tilt device, as will be discussedin the next section.
136

The Robotic System Development Framework
Figure A.3: Simulated ATRVJr3D robot.
The ATRVJr3D Simulated Robot
Odometry is quite imprecise and the robots position cannot be accurately correctedusing only odometry. Our 3D mapping algorithm is not yet sufficiently developedto localize the robot while performing a 3D scan. Due to this situation, the real andsimulated P3AT could conduct the 3D scans only while the robot was stationary,since for building the point clouds we need to have ascertained the position of therobot. This presents no problem for evaluating the 3D mapping algorithm, butfor exploration purposes this way of working is too slow. We sought the ability toachieve both 2D localization and 3D data acquisition at the same time. The solutionwas to use two laser scanners, one fixed and the other tilting. Since a P3AT cannotafford to carry two SICK range scanners without compromising the dynamics ofthe platform, we decided to mount them on an ATRVJr platform, which we calledATRVJr3D.
Moreover, as the ScannerSides device existing in USARSim did not match thecharacteristics of the PowerCube device, we decided to build a pan/tilt device emu-lating the real PowerCube070 wrist. We built a laserpantilt mission package whichconsisted of two rotational joints. These joints can be controlled independently withangle, speed and torque, and they provide feedback about their position. On oneoccasion, the SICK range scanner was mounted on top of such a device. With thisconfiguration, we were able to acquire 3D data in pretty much the same way as withour real robot, while the position of the robot was corrected by the usual SLAMtechniques using the 2D laser. The ATRVJr3D can be seen in figure A.3. A moredetailed description of both the simulated Nemo and ATRVJr3D can be found in[19].
A.2.2 OpenRDK
The entire robotic software application has been developed in an Open Sourcerobotic framework called OpenRDK (Open Robot Development Kit). This frame-work has been elaborated in the last few years by the Cognitive Cooperative RoboticsLaboratory of La Sapienza and was recently adopted by the Intelligent Control
137

The Robotic System Development Framework
Group of Madrid. It can be found at Source Forge3.OpenRDK is a modular software framework focused on rapid development of
distributed robotic systems. It has been designed following users advice and hasbeen in use within our research group for several years. To date, OpenRDK has beensuccessfully applied in diverse applications with heterogeneous robots including:
• Wheeled mobile platforms: Pioneer 2-AT, i-Robot PatrolBot, Pioneer 2-DX.
• Tracked vehicles: Tarantula, Kenaf.
• Unmanned aerial vehicles: AscTec Quad-rotor.
• Legged robots: Sony Aibo, Aldebaran Nao.
• Simulated robots in Player/Stage, USARSim, Webbots.
Some of the features of OpenRDK are:
• An agent is a list of modules that are instantiated, together with the valuesof their parameters and their interconnection layout. This agent is initiallyspecified in a configuration file.
• Modules communicate using a blackboard-type object, called a ”repository”(see figure A.4), in which the modules present some of their internal variables(parameters, inputs and outputs), called ”properties.” A module defines itsproperties during initialization; after that, it can access its own and othermodules data, within the same agent or from other ones, by means of a globalURL-like addressing scheme. Access to remote properties is transparent froma module perspective; on the other hand, it boils down to shared memory(OpenRDK provides easy built-ins for concurrency management) in the caseof local properties.
Each module typically implements a task or behaviour, like scan-matching, map-ping, path-planning, and so forth. All these entities are implemented in the Open-RDK core and usually all a developer is requested to do is to create a new module.This is a very easy task indeed (from the point of view of the framework; he can thuscon- centrate on the real problem, without having to expend too much attention onthe framework). The ensemble of all the modules required constitutes the agent.
Every agent will usually have:
• A module for communicating with the robot: simulated or real,
• a set of modules for processing the sensor data, and
• a set of modules that uses the processed data to command the robot.
figure A.4 shows an example of an agent that communicates with a robot. Theprocess is as follows: The agent retrieves the laser data. The scan matcher modulelocalizes the robot. The mapper module constructs a map, and then the explorationmodules move the robot according to the map and to the robots position.
3http://openrdk.sourceforge.net
138

The Robotic System Navigation System
Figure A.4: RDK Agent Example
A.3 Navigation System
In this section, we will present the architecture of our robotic navigation system.This architecture has been implemented for OpenRDK. The system follows theclassical layered structure, in which each layer receives an input from the previouslayer, process it, and generates an output for the next layer. This structure can beseen in figure A.5.
As we have already said above, a module has a certain number of inputs, whichit processes to generate an output. A mapping module will have the laser readingsand the robot position as input, while it will output a map. An exploration modulewill receive the map and robot position and will give a target point as output. Forits part, path-planning will take this target goal, together with the map, and willuse both to process a safe path to reach the goal.
In this structure, the HRI layer is in charge of the interaction among the operatorand the robot.
• It receives inputs from the interface, that sends to the corresponding systemlayer.
• It receives the outputs of each layer: target point, path, real speed, errors; andsends them to the interface.
• It manages the autonomy adjustment.
These modules include the majority of the up-to-date techniques used nowadaysin mobile robotics. Some of them have been developed as part of the group research,while others are those present in literature.
139

The Robotic System Navigation System
Exploration Layer
Path Planning Layer
Motion Layer
Safe Motion Layer
Robot Interface Layer
Human-Robot Interaction Layer
Target Point
Path
Control speed and Jog
Effective speed and jog
Figure A.5: System Architecture
A.3.1 Exploration Layer
The exploration task depends on the goal of the mission. One may wish to build amap of an unknown environment, in which case one needs only to maximize the areacovered while maintaining the consistency of the map. Or one may want to deploy ateam of robots in order to create an ad-hoc communications structure, or to searchfor victims in a disaster area. Depending on the goal, the exploration algorithmswill vary accordingly.
The latest research of our groups has focused on exploration for search and rescuerobot missions. ”Exploration and search” is a typical task for autonomous robotsacting in rescue missions; specifically, it concerns the problem of exploring the envi-ronment while searching for interesting features within it. We model this problemas a multi-objective exploration and search problem. In particular, we use a StateDiagram formalism that enables the representation of decisions, loops, interruptionsdue to unexpected events or action failures within an otherwise coherent framework.While autonomous exploration has been widely investigated in the past, we havefocused on the problem of searching for victims in the environment during the map
140

The Robotic System Navigation System
building process [11][12].Our current exploration system works as an state machine. It can be seen in
figure A.6.
Figure A.6: Exploration Layer
A.3.2 Path Planning and Motion Layers
The Path Planning and Navigation Layers have been developed within the Cogni-tive Cooperative Robotics Laboratory of Rome. They are responsible for movingthe robot to a given target point aided by a 2D grid map. They are implementedimplemented using the well-known two-level decomposition technique in which aglobal algorithm computes a path towards the goal (path-planning layer), using asimplified model of the environment; this path is followed by a local algorithm (nav-igation layer), which then generates the motion commands to steer the robot to thecurrent goal. The global algorithm computes a graph that models the connectivityof the environment, modifying this model in accord with how the robot perceives in-formation about the unknown environ ment: the path computation is thus reducedto a path search in a graph [14]. The local algorithm uses a variation of the DynamicWindow Approach [31]. The resulting trajectories are very smooth, thanks to thefact that the DWA generates only commands and trajectories that can be followedby the robot, with kinematic and dynamic constraints being taken into account.
The diagrams representing their working can be seen in figures A.7 and A.8
A.3.3 Safe Motion Layer and Robot Interface Layers
The safe motion layer is in charge of avoiding collisions. It parse the commandspeed and jog that receives as inputs according to the sensed obstacles, producingthe final speed and jog speeds. The way this layer works has changed during thesystem evolution, and will be explained in detail in Chapters 3 and 4.
The robot interface layer manage the communications with the robots.
141

The Robotic System Localization and Mapping
Figure A.7: Path Planning Layer
A.4 Localization and Mapping
All these layers work on the basis of a map where the robot is located. This in-volves that the system must localize the robot and build the map using the senseddata. Currently the navigation is based on a grid map. In this map it is includedthe 2D map; 3D information: obstacles, holes and ground detection; and semanticinformation.
A.4.1 2D Localization and Mapping
In the course of our group research, different localization techniques have been de-veloped. These include scan matching techniques, obtaining grid maps, and feature-based localization and mapping for obtaining maps of characteristics. All of thesetechniques use the data provided by the laser range scanner and the odometry func-tion.
The most recent feature-based technique involved here was developed within theIntelligent Control Group of the Universidad Politecnica de Madrid. It provides anovel solution to the Simultaneous Localization and Map building (SLAM) problemfor complex indoor environments, using a set of splines for describing the geometriesdetected by the laser range finder; this range finder was mounted on the mobileplatform. The maps obtained are more compact that the traditional grid maps, asthey contain only geometric information on the environment described with splines[53][52]. This map representation reduces considerably the amount of informationexchange with the interface.
A localization and mapping algorithm based on scan matching was developedwithin the Cognitive Cooperative Robotics Laboratory of the Sapienza Universityin Rome [36][35]. The software was distributed under the name of ”GMapping” andit is among most popular algorithms used for laser based SLAM for mobile robotics.The author of GMapping has also produced an OpenRDK implementation.
3http://www.openslam.org
142

The Robotic System Application taxonomy
Figure A.8: Motion Layer
A.4.2 3D Mapping and Ground Detection
In the Intelligent Control Group in Madrid, de la Puente is currently working onfull 3D mapping and localization. To date, she has developed a feature-based 3Dmapping approach with a view to obtaining compact models of semi-structuredenvironments, such as partially destroyed buildings where mobile robots are calledupon to carry out rescue activities. In order to gather the 3D data, we use a laserscanner, employing a nodding data acquisition system mounted on both real andsimulated robots [18][17]. The 3D map is built up from 3D point clouds. The pointclouds are extracted from the laser range scanners. Each scan has a different tiltangle covering a different 3D area. An example of the sort of 3D map constructedin this manner is shown in figure A.9.
Moreover, a ground detection algorithm has been developed, in order to detectnavigable areas safe for mobile robots [19]. The navigable areas are displayed on a2D grid map that can be sent to the operator interface or processed by the pathplanning and motion modules.
A.5 Application taxonomy
Considering the robotic platforms, the system architecture and the processed datawe can finally define our application taxonomy.
Table A.1 presents the application taxonomy. Table A.2 lists the sensory dataprovided. Table A.3 offers more detail concerning the information processed.
143

The Robotic System Application taxonomy
Figure A.9: 3D map obtained with the simulated Nemo Robot on USARSim
Table A.1: Application taxonomies
Category Values
Task Type Exploration roboticsTask Criticality Medium, HighRobot Morphology FunctionalHuman to Robot Ratio Single-User-Single-RobotInteraction among teams Individual User To Individual RobotInteraction Role OperatorMobility and relative position Collocated (PDA interface)
Remote (Desktop interface and PDA interface)Decision support Available-Sensors
Provided-SensorsSensor-FusionPre-Processing
Time/Space SynchronousCollocated
Autonomy Full spectrumOperator Device PDA Input device: PDA keys and pad, touch screen
Output devices: ScreenScreen dimension: around 3 inchesScreen resolution: 320 x 240Available communication: Wifi
Operator Device Desktop PC Input device: keyboard, gamepadOutput devices: ScreenScreen dimension: 17 inchesScreen resolution: 1440 x 900Available communication: Wifi
144

The Robotic System Application taxonomy
Table A.2: Provided sensory data
Mobile Platform Provided data
Rotolotto P2AT Odometry(real and simulated) 6 front sonar ranges
4 side sonar ranges6 rear sonar rangesLaser range scans (180 grad)Camera imagesCamera device pan/tilt
Nemo P3AT Odometry(real) Tilted laser range scans (180 grad)
Laser device tilt angleCamera imagesCamera device pan/tilt
Nemo P3AT Odometry(simulated) 6 front sonar ranges
4 side sonar ranges6 rear sonar rangesTilted laser range scans (180 grad)Camera imagesCamera device pan/tilt
ATRVJr3D Odometry(simulated) 5 front sonar ranges
10 side sonar ranges2 rear sonar ranges2D laser range scans (180 grad)Tilted laser range scans (180 grad)Laser device tilt angleCamera imagesCamera device pan/tilt
145

The Robotic System Application taxonomy
Table A.3: Provided sensory data
Processed information Required data
Obstacle position Laser readings(relative to robot) 6 Sonar readingsRobot Jog/Speed OdometryLocalization Odometry
Laser readings2D Map Localization
Laser readings3D Map Localization
Tilted Laser readingsLaser tilt angle
Camera Image Camera frameCamera Pan/Tilt angle
146
Appendix B
ANOVA
B.1 One-Way ANOVA
Grand Mean
The grand mean of a set of samples is the total of all the data values divided by thetotal sample size. This requires that you have all of the sample data available to you,which is usually the case, but not always. It turns out that all that is necessary tofind perform a one-way analysis of variance are the number of samples, the samplemeans, the sample variances, and the sample sizes.
Total Variation
The total variation (not variance) is comprised the sum of the squares of the differ-ences of each mean with the grand mean.
There is the between group variation and the within group variation. The wholeidea behind the analysis of variance is to compare the ratio of between group varianceto within group variance. If the variance caused by the interaction between thesamples is much larger when compared to the variance that appears within eachgroup, then it is because the means aren’t the same.
Between Group Variation The variation due to the interaction between thesamples is denoted SS(B) for Sum of Squares Between groups. If the sample meansare close to each other (and therefore the Grand Mean) this will be small. Thereare k samples involved with one data value for each sample (the sample mean), sothere are k − 1 degrees of freedom.
The variance due to the interaction between the samples is denoted MS(B) forMean Square Between groups. This is the between group variation divided by itsdegrees of freedom. It is also denoted by s2
b .
Within Group Variation The variation due to differences within individual sam-ples, denoted SS(W) for Sum of Squares Within groups. Each sample is consideredindependently, no interaction between samples is involved. The degrees of freedomis equal to the sum of the individual degrees of freedom for each sample. Sinceeach sample has degrees of freedom equal to one less than their sample sizes, and

ANOVA Two-Way ANOVA
there are k samples, the total degrees of freedom is k less than the total sample size:df = N − k.
The variance due to the differences within individual samples is denoted MS(W )for Mean Square Within groups. This is the within group variation divided by itsdegrees of freedom. It is also denoted by s2
w. It is the weighted average of thevariances (weighted with the degrees of freedom).
F test statistic Recall that a F variable is the ratio of two independent chi-squarevariables divided by their respective degrees of freedom. Also recall that the F teststatistic is the ratio of two sample variances, well, it turns out that’s exactly whatwe have here. The F test statistic is found by dividing the between group varianceby the within group variance. The degrees of freedom for the numerator are thedegrees of freedom for the between group (k− 1) and the degrees of freedom for thedenominator are the degrees of freedom for the within group (N − k).
One-Way ANOVA Table
SS df MS F
Between SS(B) k − 1 SS(B)k−1
MS(B)MS(W )
Within SS(W ) N − k SS(W )N−k
Total sum of others N − 1
Table B.1: One-Way ANOVA Table
Notice that each Mean Square is just the Sum of Squares divided by its degreesof freedom, and the F value is the ratio of the mean squares. Do not put thelargest variance in the numerator, always divide the between variance by the withinvariance. If the between variance is smaller than the within variance, then the meansare really close to each other and you will fail to reject the claim that they are allequal. The degrees of freedom of the F-test are in the same order they appear inthe table (nifty, eh?). Decision Rule
The decision will be to reject the null hypothesis if the test statistic from thetable is greater than the F critical value with k-1 numerator and N-k denominatordegrees of freedom.
If the decision is to reject the null, then at least one of the means is different.However, the ANOVA does not tell you where the difference lies. For this, you needanother test, either the Scheffe’ or Tukey test.
B.2 Two-Way ANOVA
The two independent variables in a two-way ANOVA are called factors. The ideais that there are two variables, factors, which affect the dependent variable. Eachfactor will have two or more levels within it, and the degrees of freedom for eachfactor is one less than the number of levels.
148

ANOVA Two-Way ANOVA
The Treatment Groups are formed by making all possible combinations of thetwo factors. For example, if the first factor has 3 levels and the second factor has 2levels, then there will be 3x2=6 different treatment groups.
The basic idea of factorial designs is to obtain values of the response variable forall the possible combinations of the levels of the factors under study. Each combi-nation is named ”treatment”, and each one may be assigned to one experimentationunit or several ones. When there are more than one experimentation unit for eachtreatment then the factorial design has replications. For example, if there is a factorwith I levels(for example I temperatures), and another one, for example the pres-sure, with J levels, then, there are I × J possible treatments. The data could berepresented in a double entrance table, where yijk corresponds to the value of theresponse variable for the k-th replication of the combination corresponding to thefirst factor fixed to level i, and the second one fixed to its j-th level.
For example in the experiments of Chapter 4 we will have two factors: scenario(indoor, outdoor) and number of robots (1, 2, 3, 4). We will want to measure theinfluence of this factors on the measured variable, for example, the covered area bythe robots.
To study the influence of the factors Scenario and Number of Robots on thevariables under study we carry out a design of experiments, see [44]. The equationfor the model is:
yijk = µ + αi + βj + (αβ)ij + uijk, uijk ∼ NID(0, σ)
where µ is a global effect, i.e, the average level of the response (percentage of thetotal time in which the robots are operating simultaneously, area explored dividedby the total time of operation...), αi and βj are respectively the main effects of thescenario and number of robots. They measure the increase/decrease of the averageresponse for scenario i or number of robots j, respectively, with respect to the averagelevel. The term (αβ)ij measures the difference between the expected value of theresponse and the one computed using a model that does not include the interactions.The random effect, uijt, includes the effect of all other causes.
An ANOVA table is based on variability decomposition. It includes the sum ofsquares of each effect as well as its variance (s2
effect), calculated dividing the sumof squares by the degrees of freedom. For each effect the F-statistic is calculated asfollows.
F − statistic =s2
effect
s2residual
The null hypothesis H0 : E[s2effect] = σ2 = E[s2
residual] is rejected when the valueof the F-statistic is significantly large. Bonferroni adjustment has been applied tosolve multiple comparisons problem, [44].
Main Effect
The main effect involves the independent variables one at a time. The interaction isignored for this part. Just the rows or just the columns are used, not mixed. This isthe part which is similar to the one-way analysis of variance. Each of the variancescalculated to analyse the main effects are like the between variances
149

ANOVA Two-Way ANOVA
Interaction Effect
The interaction effect is the effect that one factor has on the other factor. Thedegrees of freedom here is the product of the two degrees of freedom for each factor.
Within Variation
The within variation is the sum of squares within each treatment group. You haveone less than the sample size (remember all treatment groups must have the samesample size for a two-way ANOVA) for each treatment group. The total number oftreatment groups is the product of the number of levels for each factor. The withinvariance is the within variation divided by its degrees of freedom.
The within group is also called the error.
F-test
There is an F-test for each of the hypotheses, and the F-test is the mean squarefor each main effect and the interaction effect divided by the within variance. Thenumerator degrees of freedom come from each effect, and the denominator degreesof freedom is the degrees of freedom for the within variance in each case.
Two-Way ANOVA Table
It is assumed that main effect A has a levels (and A = a − 1df), main effect B hasb levels (and B = b − 1df), n is the sample size of each treatment, and N = abn isthe total sample size. Notice the overall degrees of freedom is once again one lessthan the total sample size.
Source SS df MS F
Main Effect A given A, a − 1 SSdf
MS(A)MS(W )
Main Effect B given B, b − 1 SSdf
MS(B)MS(W )
Interaction Effect given A ∗ B SSdf
MS(A∗B)MS(W )
Within given N − ab, ab(n − 1) SSdf
Total sum of others N − 1, abn − 1
Table B.2: Two-Way ANOVA Table
150

Appendix C
Questionnaire I
This questionnaire was applied to the experiments presented in Chapter 4. Subjectsanswered it after completing the task.
HRI EXPERIMENTS
MADRID, 15th-19th DECEMBER 2008
FINAL QUESTIONNAIRE
NAME:
NUMBER OF ROBOTS: 1 2 3 4
SCENARIO TYPE: Indoor Outdoor
Do you consider the number of robots deployed excesive? Yes, NoWhat do you think is the optimal number of robots for the task?
About the views
Which of the four views do you consider more useful (1) Local Map; (2) Full Map;(3) 3D View; (4) Team View)?
About the Local Map
• Could you quantify the usefullness of this view (1-worst; 5-best)?
• Could you quantify the usefullness of designing the robot path (1-5)?
• Could you quantify the usefullness of changing the orientation of the view(1-5)?
• Could you quantify the usefullness of visualizing a victim icon where the vic-tims are detected (1-5)?

Questionnaire I
• Could you quantify the usefullness of visualizing a snapshot icon where apicture has been taken (1-5)?
• Could you quantify the usefullness of the zoom (1-5)?
How would you improve this view?
About the global map view
• Could you quantify the usefullness of this view (1-worst; 5-best)?
• Could you quantify the usefullness of showing the target point (1-5)?
• Could you quantify the usefullness of designing the trajectory to reach thetarget point (1-5)?
• Could you quantify the usefullness of designing the robot path (1-5)?
• Could you quantify the usefullness of visualizing a victim icon where the vic-tims are detected (1-5)?
• Could you quantify the usefullness of visualizing a snapshot icon where apicture has been taken (1-5)?
• Could you quantify the usefullness of selectin an area to zoom (1-5)?
How would you improve this view?
About the 3D view
• Could you quantify the usefullness of this view (1-worst; 5-best)?
• Could you quantify the usefullness of showing the video video (1-5):
• Could you quantify the usefullness of visualizing a cone where the victims aredetected (1-5)?
• Could you quantify the usefullness of visualizing the video snapshot where apicture has been taken (1-5)?
• Could you quantify the usefullness of changing the perspective of the view(1-5)?
How would you improve this view?
152

Questionnaire I
About the Team view
• Could you quantify the usefullness of this view (1-worst; 5-best)?
• Could you quantify the usefullness of showing the target point (1-5)?
• Could you quantify the usefullness of designing the trajectory to reach thetarget point (1-5)?
• Could you quantify the usefullness of designing the robot path (1-5)?
• Could you quantify the usefullness of visualizing a victim icon where the vic-tims are detected (1-5)?
• Could you quantify the usefullness of visualizing a snapshot icon where apicture has been taken (1-5)?
• Could you quantify the usefullness of selectin an area to zoom (1-5)?
How would you improve this view?
About the Operation Modes
Tele-Operation
1. Could you quantify the usefullness of this mode (1-worst; 5-best)?
2. What is the major weakness?
3. What is the major strength?
Safe Tele-Operation
1. Could you quantify the usefullness of this mode (1-worst; 5-best)?
2. What is the major weakness?
3. What is the major strength?
Shared Control
1. Could you quantify the usefullness of this mode (1-worst; 5-best)?
2. What is the major weakness?
3. What is the major strength?
153

Questionnaire I
Autonomy
1. Could you quantify the usefullness of this mode (1-worst; 5-best)?
2. What is the major weakness?
3. What is the major strength?
Write what you think that would improve the interface
154

Appendix D
Questionnaire II
This questionnaire was applied to the experiments presented in Chapter 5. Subjectsanswered it after completing the task.
HRI EXPERIMENTS
MADRID, 18th-22nd MAY 2009
FINAL QUESTIONNAIRE
NAME:
NUMBER OF ROBOTS: 1 2 3
Do you consider the number of robots deployed excesive? Yes, NoWhat do you think is the optimal number of robots for the task?
About the Operation Modes
Tele-Operation
1. Could you quantify the usefullness of this mode (1-worst; 5-best)?
2. What is the major weakness?
3. What is the major strength?
Safe Tele-Operation
1. Could you quantify the usefullness of this mode (1-worst; 5-best)?
2. What is the major weakness?

Questionnaire II
3. What is the major strength?
Shared Control
1. Could you quantify the usefullness of this mode (1-worst; 5-best)?
2. Could you indicate your preferred commanding method (1-set a target point;2-set a sequence of target points; 3-set the desired path)?
3. What is the major weakness?
4. What is the major strength?
156

Bibliography
[1] Julie A. Adams. Human Management of a Hierarchical System for the Controlof Multiple Mobile Robots. PhD thesis, University of Pennsylvania, 1995.
[2] Julie A. Adams. Critical considerations for human-robot interface development.Technical report, 2002 AAAI Fall Symposium: Human Robot InteractiomnTechnical Report, 2002.
[3] Julie A. Adams and Hande Kaymaz-Keskinpala. Analysis of perceived workloadwhen using a pda for mobile robot teleoperation. In Proceedings of the 2004IEEE International Conference on Robotics and Automation, pages 4128–4133,2004.
[4] James Allen. Mixed-Initiative Interaction. IEEE Intelligent Systems, 14(5):14–23, 1999.
[5] Stephan Balakirsky. Usarsim: Providing a framework for multi-robot perfor-mance evaluation. In In: Proceedings of PerMIS, pages 98–102, 2006.
[6] Andreas Birk, Jann Poppinga, Todor Stoyanov, and Yashodhan Nevatia. Plan-etary exploration in usarsim: A case study including real world data from mars.In RoboCup 2008: Robot Soccer World Cup XII, pages 463–472, 2008.
[7] David J. Bruemmer, Douglas A. Few, Miles C. Walton, Ronald L. Boring,Julie L. Marble, Curtis W. Nielsen, and Jim Garner. ”turn off the television!”:Real-world robotic exploration experiments with a virtual 3-d display. In 38thHawaii International Conference on System Sciences, 2005.
[8] J. L. Burke and R. R. Murphy. Human-robot interaction in usar technicalsearch: Two heads are better than one. In in IEEE International Workshop onRobot and Human Interactive Communication, pages 307–312, 2004.
[9] Jennifer L. Burke, Robin R. Murphy, Dawn R. Riddle, and Thomas Fincan-non. Task performance metrics in human-robot interaction: Taking a systemsapproach. In Performance Metrics for Intelligent Systems, 2004.
[10] Jennifer L. Burke, Robin R. Murphy, Erika Rogers, Vladimir J. Lumelsky, andJean Scholtz. Final report for the darpa/nsf interdisciplinary study on human-robot interaction. Technical report, IEEE, May 2004.

BIBLIOGRAPHY BIBLIOGRAPHY
[11] D. Calisi, A. Farinelli, L. Iocchi, and D. Nardi. Multi-objective exploration andsearch for autonomous rescue robots. Journal of Field Robotics, Special Issueon Quantitative Performance Evaluation of Robotic and Intelligent Systems,24:763–777, August - September 2007.
[12] D. Calisi, L. Iocchi, D. Nardi, G. Randelli, and V.A. Ziparo. Improving searchand rescue using contextual information. Advanced Robotics, 23(9):1199–1216,2009.
[13] Stefano Carpin, Michael Lewis, Jijun Wang, Stephen Balakirsky, and ChrisScrapper. Usarsim: a robot simulator for research and education. In 2007IEEE International Conference on Robotics and Automation, ICRA 2007, pages1400–1405, 2007.
[14] A. Censi, D. Calisi, A. De Luca, and G. Oriolo. A bayesian framework foroptimal motion planning with uncertainty. In Proc. of the IEEE Int. Conferenceon Robotics and Automation (ICRA), pages 1798–1805, May 2008.
[15] G. Cohen. Memory in the real world. Hove: Erlbaum, 1989.
[16] Jacob W. Crandall, Michael A. Goodrich, Dan R. Olsen, and Curtis W.Nielsen. Validating human-robot interaction schemes in multitasking envi-ronments. IEEE Transactions on Systems, Man, and Cybernetics, Part A,35(4):438–449, 2005.
[17] Paloma de la Puente, Diego Rodrıguez-Losada, Raul Lopez, and FernandoMatıa. Extraction of geometrical features in 3d environments for service roboticapplications. In Hybrid Artificial Intelligence Systems, pages 441–450, 2008.
[18] Paloma de la Puente, Diego Rodriguez-Losada, Alberto Valero, and FernandoMatia. 3D Feature Based Mapping towards Mobile Robots Enhanced Perfor-mance in Rescue Missions. In 2009 IEEE/RSJ International Conference onIntelligent Robots and Systems, 2009.
[19] Paloma de la Puente, Alberto Valero, and Diego Rodriguez-Losada. 3D Map-ping: testing algorithms and discovering new ideas with USARSim. In Robots,Games, and Research: Success stories in USARSim. IROS 2009, 2009.
[20] Alan Dix, Janet Finlay, Gregory D. Abowd, and Russel Beale. Human-Computer Interaction. Pearson - Prentice Hall, 2004.
[21] Frauke Driewer, Markus Sauer, and Klaus Schilling. Design and evaluationof an user interface for the coordination of a group of mobile robots. In 17thIternational Symposium on Robot and Human Interactive Communication. RO-MAN 2008, pages 237–242, August 2008.
[22] Jill L. Drury, Dan Hestand, Holly A. Yanco, and Jean Scholtz. Design guide-lines for improved human-robot interaction. In Extended abstracts of the 2004Conference on Human Factors in Computing Systems, page 1540, 2004.
158

BIBLIOGRAPHY BIBLIOGRAPHY
[23] Jill L. Drury, Brenden Keyes, and Holly A. Yanco. Lassoing hri: analyzing sit-uation awareness in map-centric and video-centric interfaces. In Proceedings ofthe Second ACM SIGCHI/SIGART Conference on Human-Robot Interaction,pages 279 – 286, 2007.
[24] Jill L. Drury, Holly A. Yanco, and Jean C. Scholtz. Beyond usability evaluation:Analysis of human-robot interaction at a major robotics competition. Human-Computer Interaction Journal, January 2004.
[25] Mica R. Endsley. Design and evaluation for situation awareness enhancement.In Proceedings of the Human Factors Society 32nd Annual Meeting, pages 97–101, 1988.
[26] Mica R. Endsley and Daniel J. Garland. Situation Awareness: Analysis andMeasurement. LAWRENCE ERLBAUM ASSOCIATES, 2000.
[27] Terrence Fong, Charles Thorpe, and Betty Glass. Pdadriver: A handheld sys-tem for remote driving. In In IEEE International Conference on AdvancedRobotics, 2003.
[28] Terrence Fong, Charles E. Thorpe, and Charles Baur. Advanced interfaces forvehicle teleoperation: Collaborative control, sensor fusion displays, and remotedriving tools. Auton. Robots, 11(1), 2001.
[29] Terrence Fong, Charles E. Thorpe, and Charles Baur. Advanced interfaces forvehicle teleoperation: Collaborative control, sensor fusion displays, and remotedriving tools. Autonomous Robots, 11(1):77–85, 2001.
[30] Terrence Fong, Charles E. Thorpe, and Charles Baur. Robot, asker of questions.Robotics and Autonomous Systems, 42(3-4):235–243, 2003.
[31] D. Fox, W. Burgard, and S. Thrun. The dynamic window approach to collisionavoidance. volume 4, 1997.
[32] Brian P. Gerkey, Richard T. Vaughan, and Andrew Howard. The player/stageproject: Tools for multi-robot and distributed sensor systems. In 11th Interna-tional Conference on Advanced Robotics (ICAR 2003), Portugal, pages 317–323,June 2003.
[33] Michael A. Goodrich, Timothy W. McLain, Jeffrey D. Anderson, Jisang Sun,and Jacob W. Crandall. Managing autonomy in robot teams: observationsfrom four experiments. In Proceedings of the Second ACM SIGCHI/SIGARTConference on Human-Robot Interaction, HRI 2007, Arlington, Virginia, USA,March 10-12, 2007, pages 25–32, 2007.
[34] Michael A. Goodrich and Alan C. Schultz. Human-robot interaction: A survey.Foundations and Trends in Human-Computer Interaction, 1(3):203–275, 2007.
[35] Giogio Grisetti, Gian D. Tipaldi, C. Stachniss, Wolfgang Burgard, and DanieleNardi. Fast and accurate slam with rao-blackwellized particle filters. Roboticsand Autonomous Systems, 2006. In press.
159

BIBLIOGRAPHY BIBLIOGRAPHY
[36] Giorgio Grisetti, Gian D. Tipaldi, C. Stachniss, Wolfgang Burgard, and DanieleNardi. Speeding-up rao-blackwellized slam. pages 442–447, Orlando, FL, USA,2006.
[37] Benjamin Hardin and Michael A. Goodrich. On using mixed-initiative control:a perspective for managing large-scale robotic teams. In Proceedings of the 4thACM/IEEE International Conference on Human Robot Interaction, HRI 2009,pages 165–172, 2009.
[38] Andreas Hedstrom, Henrik I. Christensen, and Carl Lundberg. A wearable guifor field robots. In Field and Service Robotics, pages 367–376, 2005.
[39] Th. Herrmann. Blickpunkte und blickpunktsequenzen. In Sprache & Kognition,volume 15 of 217-233. 1996.
[40] Curtis M. Humphrey, Christopher Henk, George Sewell, Brian W. Williams,and Julie A. Adams. Assessing the scalability of a multiple robot interface.In Proceedings of the Second ACM SIGCHI/SIGART Conference on Human-Robot Interaction, HRI 2007, Arlington, Virginia, USA, March 10-12, 2007,pages 239–246, 2007.
[41] Helge Httenrauch and Mikael Norman. Pocketcero - mobile interfaces for servicerobots. In In Proceedings of the International Workshop on Human ComputerInteraction with Mobile Devices, 2001.
[42] Hande Kaymaz-Keskinpala and Julie A. Adams. Objective data analysis for apda-based human robotic interface. In Proceedings of the IEEE InternationalConference on Systems, Man & Cybernetics, pages 2809–2814, 2004.
[43] Hande Kaymaz-Keskinpala, Kazuhico Kawamura, and Julie A. Adams. Pda-based human-robotic interface. In Proceedings of the IEEE International Con-ference on Systems, Man & Cybernetics, volume 4, pages 3931 – 3936, 2003.
[44] D. C. Montgomery. Design and Analysis of Experiments”. John Wiley andSons, Inc, 1984.
[45] Robin R. Murphy and Erika Rogers. Cooperative assistance for remote robotsupervision. Presence, special issue on Starkfest, 5(2):224 – 240, 1996.
[46] Curtis W. Nielsen and Michael A. Goodrich. Comparing the usefulness ofvideo and map information in navigation tasks. In Proceedings of the 1st ACMSIGCHI/SIGART Conference on Human-Robot Interaction, HRI 2006, pages95–101, 2006.
[47] Curtis W. Nielsen, Michael A. Goodrich, and Robert W. Ricks. Ecologicalinterfaces for improving mobile robot teleoperation. IEEE Transactions onRobotics, 23(5):927–941, 2007.
[48] Jakob Nielsen. Usability Engineering. Academic Press, 1993.
160

BIBLIOGRAPHY BIBLIOGRAPHY
[49] Jakob Nielsen and Robert L. Mack, editors. Usability inspection methods. JohnWiley & Sons, Inc., New York, NY, USA, 1994.
[50] Dan R. Olsen and Michael A. Goodrich. Metrics for evaluating human-robotinteractions. In Proceedings of PERMIS 2003, 2003.
[51] Raja Parasuraman, Thomas B. Sheridan, and Christopher D. Wickens. A modelfor types and levels of human interaction with automation. Systems, Man andCybernetics, Part A, IEEE Transactions on, 30(3):286–297, 2000.
[52] Luis Pedraza, Diego Rodriguez-Losada, Fernando Matia, G. Dissanayake, andJ.V. Miro. Extending the Limits of Feature-Based SLAM With B-Splines. IEEETransactions on Robotics, pages 353–366, April 2009.
[53] Luis Pedraza, Diego Rodrıguez-Losada, Pablo San Segundo, and FernandoMatıa. Building maps of large environments using splines and geometric anal-ysis. In 2008 IEEE/RSJ International Conference on Intelligent Robots andSystems, pages 1600–1605, 2008.
[54] Dennis Perzanowski, Alan C. Schultz, William Adams, Elaine Marsh, and Mag-dalena D. Bugajska. Building a multimodal human-robot interface. IEEE In-telligent Systems, 16(1):16–21, 2001.
[55] Giuliano Polverari, Daniele Calisi, Alessandro Farinelli, and Daniele Nardi.Development of an autonomous rescue robot within the usarsim 3d virtualenvironment. In RoboCup 2006: Robot Soccer World Cup X, pages 491–498,2006.
[56] Aaron Powers. What robotics can learn from hci. Interactions, 15(2):67–69,2008.
[57] Sarvapali D. Ramchurn, Alex Rogers, Kathryn Macarthur, Alessandro Farinelli,Perukrishnen Vytelingum, Ioannis A. Vetsikas, and Nicholas R. Jennings.Agent-based coordination technologies in disaster management. In 7th In-ternational Joint Conference on Autonomous Agents and Multiagent Systems(AAMAS 2008), Estoril, Portugal, May 12-16, 2008, Demo Proceedings, pages1651–1652, 2008.
[58] Diego Rodriguez-Losada, Fernando Matia, Agustin Jimenez, and Ramon Galan.Local map fusion for real-time indoor simultaneous localization and mapping.Journal of Robotic Systems, 23(5):291 – 309, April 2006.
[59] Tijn Schmits and Arnoud Visser. An omnidirectional camera simulation for theusarsim world. In RoboCup 2008: Robot Soccer World Cup XII, pages 296–307,2008.
[60] Jean Scholtz, Brian Antonishek, and Jeff Young. Operator interventions in au-tonomous off-road driving: effects of terrain. In Proceedings of the IEEE Inter-national Conference on Systems, Man & Cybernetics: The Hague, Netherlands,10-13 October 2004, pages 2797–2802, 2004.
161

BIBLIOGRAPHY BIBLIOGRAPHY
[61] Jean Scholtz, Jeff Young, Jill L. Drury, and Holly A. Yanco. Evaluation ofhuman-robot interaction awareness in search and rescue. In Robotics and Au-tomation, 2004. Proceedings ICRA’04, volume 3, pages 2327 – 2332. IEEE, May2004.
[62] Giuseppe P. Settembre, Paul Scerri, Alessandro Farinelli, Katia P. Sycara, andDaniele Nardi. A decentralized approach to cooperative situation assessmentin multi-robot systems. In 7th International Joint Conference on AutonomousAgents and Multiagent Systems (AAMAS 2008), pages 31–38, 2008.
[63] Thomas B. Sheridan. Humans and Automation. System Engineering and Man-agement. John Wiley and Sons, Inc, 2002.
[64] M. Skubic, C. Bailey, and G Chronis. A Sketch Interface for Mobile Robots.In In Proc. IEEE 2003 Conf. on SMC, pages 918–924, 2003.
[65] Aaron Steinfeld, Terrence Fong, David Kaber, Michael Lewis, Jean Scholtz,Alan Schultz, and Michael Goodrich. Common metrics for human-robot inter-action. In Proceeding of the 1st ACM SIGCHI/SIGART conference on Human-robot interaction, pages 33 – 40, 2006.
[66] Sebastian Thrun and Yufeng Liu. Multi-robot slam with sparse extended in-formation filers. In Robotics Research, The Eleventh International Symposium,ISRR, October 19-22, 2003, Siena, Italy, pages 254–266, 2003.
[67] Alberto Valero. About splitting telepresence and remote control interfaces inrescue robots. In IADIS International Conference Interfaces and Human Com-puter Interaction 2007, July 2007.
[68] Alberto Valero, Fernando Matia, Massimo Mecella, and Daniele Nardi. Adapta-tive human-robot interaction for mobile robots. In 17th Iternational Symposiumon Robot and Human Interactive Communication. RO-MAN 2008, 2008.
[69] Lovekesh Vig and Julie A. Adams. A framework for multi-robot coalition for-mation. In Proceedings of the 2nd Indian International Conference on ArtificialIntelligence, Pune, India, December 20-22, 2005, pages 347–363, 2005.
[70] Huadong Wang, Michael Lewis, Prasanna Velagapudi, Paul Scerri, and Katia P.Sycara. How search and its subtasks scale in n robots. In Proceedings of the 4thACM/IEEE International Conference on Human Robot Interaction, HRI 2009,pages 141–148, 2009.
[71] Steffen Werner, Bernd Krieg-Bruckner, Hanspeter A. Mallot, Karin Schweizer,and Christian Freksa. Spatial cognition: The role of landmark, route, andsurvey knowledge in human and robot navigation. In GI Jahrestagung, pages41–50, 1997.
[72] Holly A. Yanco and Jill L. Drury. A taxonomy for human-robot interaction.In AAAI Fall Symposium on Human-Robot Interaction, pages 111 – 119. AIII,November 2002.
162

BIBLIOGRAPHY BIBLIOGRAPHY
[73] Holly A. Yanco and Jill L. Drury. Classifying human-robot interaction: anupdated taxonomy. In 2004 IEEE International Conference on Systems, Manand Cybernetics, volume 3, pages 2841 – 2846. IEEE, October 2004.
[74] Holly A. Yanco and Jill L. Drury. ”where am i?” acquiring situation aware-ness using a remote robot platform. In Proceedings of the IEEE InternationalConference on Systems, Man & Cybernetics: The Hague, Netherlands, 10-13October 2004, pages 2835–2840, 2004.
[75] Holly A. Yanco and Jill L. Drury. Rescuing interfaces: A multi-year study ofhuman-robot interaction at the aaai robot rescue competition. Auton. Robots,22(4):333–352, 2007.
[76] Holly A. Yanco, Jill L. Drury, and Jean Scholtz. Awareness in human-robotinteractions. In Proceedings of the IEEE Conference on Systems, Man andCybernetics, Washington, DC, October 2003, 2003.
[77] Holly A. Yanco, Brenden Keyes, Jill L. Drury, Curtis W. Nielsen, Douglas A.Few, and David J. Bruemmer. Evolving interface design for robot search tasks.Journal on Field Robotics, 24(8-9):779–799, 2007.
163