
Evolutionary Clustering and Analysis of Bibliographic …charuaggarwal.net/asonam-cluster.pdf ·...
8
Evolutionary Clustering and Analysis of Bibliographic Networks Manish Gupta University of Illinois at Urbana-Champaign [email protected] Charu C. Aggarwal IBM T. J. Watson Research Center [email protected] Jiawei Han University of Illinois at Urbana-Champaign [email protected] Yizhou Sun University of Illinois at Urbana-Champaign [email protected] Abstract—In this paper, we study the problem of evolutionary clustering of multi-typed objects in a heterogeneous bibliographic network. The traditional methods of homogeneous clustering methods do not result in a good typed-clustering. The design of heterogeneous methods for clustering can help us better understand the evolution of each of the types apart from the evolution of the network as a whole. In fact, the problem of clustering and evolution diagnosis are closely related because of the ability of the clustering process to summarize the network and provide insights into the changes in the objects over time. We present such a tightly integrated method for clustering and evolution diagnosis of heterogeneous bibliographic information networks. We present an algorithm, ENetClus, which performs such an agglomerative evolutionary clustering which is able to show variations in the clusters over time with a temporal smoothness approach. Previous work on clustering networks is either based on homogeneous graphs with evolution, or it does not account for evolution in the process of clustering heterogeneous networks. This paper provides the first framework for evolution- sensitive clustering and diagnosis of heterogeneous information networks. The ENetClus algorithm generates consistent typed- clusterings across time, which can be used for further evolution diagnosis and insights. The framework of the algorithm is specifically designed in order to facilitate insights about the evolution process. We use this technique in order to provide novel insights about bibliographic information networks. I. I NTRODUCTION Information networks have become ubiquitous in recent years because of the large number of networked applications such as social networks, the web and other linked entities. For example, academic networks such as DBLP, biological networks, and massive entity-relation models are all examples of information networks. Such networks have the common property that they contain different kinds of entities which interact with one another. Some of the examples such as social networks and the web are inherently homogeneous, since they contain entities of the same type. For example, a social network contains actors that are linked by friendship relationships, whereas the web contains documents which are linked by hyper-links. Most work in the area of graph and network mining has focused on the homogeneous domain. However, a heteroge- neous representation is much richer; for example a richer representation of a bibliographic network may contain nodes corresponding to different entities such as author, confer- ence, paper and term. Edges may denote more diverse relationships such as written-by between an author node and a paper node, contains between a term node and a paper node, published-in between a paper node and a conference node. Clearly, the richer representation of a heterogeneous network makes it powerful; on the other hand it is also much more challenging for mining purposes. In recent years, there has been an increasing interest in the area of heterogeneous information networks. In this paper, we will examine the problem of clustering and evolution diagnosis in massive information networks. Heterogeneous information networks are often encountered in dynamic environments which are continuously evolving. The problem of clustering has been studied recently in the context of non-evolving and static information networks. E.g., Sun et al. [15] present NetClus, which is a clustering algorithm for star schema-based heterogeneous information networks. The center of the star is termed as the target type while other type nodes are connected to this center type and are called as attribute type nodes. E.g. for the DBLP graph, paper is a target type while authors, conference, terms are attribute type nodes. Figure 1 illustrates a net-cluster view of the DBLP network. The star-schema is a particularly important case, because of its representational power in a variety of scenarios. Conf Authors Paper 2 Terms Authors Paper 1 Paper 2 Paper 1 Authors Conf Paper 3 Conf Paper 3 Cluster 1 Terms Fig. 1. Net-cluster view of DBLP network While NetClus is a powerful algorithm for determining heterogeneous clusters, it incorporates no notion of evolution. NetClus, if used over multiple snapshots, would produce clusters which would have no correspondence with the ones in the previous snapshot. This effect becomes much more prominent because NetClus clusters depend immensely on the initial seeds. The problem of evolutionary clustering has been studied in the context of homogeneous networks [4]. The basic principle is to create a clustering which focuses on both maintaining high quality clusters, and on creating clusters in which a natural correspondence can be maintained among the clusters across different snapshots. This broad technique is referred to as temporal smoothing. A variety of techniques
Transcript of Evolutionary Clustering and Analysis of Bibliographic …charuaggarwal.net/asonam-cluster.pdf ·...

Evolutionary Clustering and Analysis ofBibliographic Networks
Manish GuptaUniversity of Illinois at
Charu C. AggarwalIBM T. J. WatsonResearch Center
Jiawei HanUniversity of Illinois at
Yizhou SunUniversity of Illinois at
Abstract—In this paper, we study the problem of evolutionaryclustering of multi-typed objects in a heterogeneous bibliographicnetwork. The traditional methods of homogeneous clusteringmethods do not result in a good typed-clustering. The designof heterogeneous methods for clustering can help us betterunderstand the evolution of each of the types apart from theevolution of the network as a whole. In fact, the problem ofclustering and evolution diagnosis are closely related because ofthe ability of the clustering process to summarize the networkand provide insights into the changes in the objects over time.We present such a tightly integrated method for clustering andevolution diagnosis of heterogeneous bibliographic informationnetworks. We present an algorithm, ENetClus, which performssuch an agglomerative evolutionary clustering which is ableto show variations in the clusters over time with a temporalsmoothness approach. Previous work on clustering networks iseither based on homogeneous graphs with evolution, or it does notaccount for evolution in the process of clustering heterogeneousnetworks. This paper provides the first framework for evolution-sensitive clustering and diagnosis of heterogeneous informationnetworks. The ENetClus algorithm generates consistent typed-clusterings across time, which can be used for further evolutiondiagnosis and insights. The framework of the algorithm isspecifically designed in order to facilitate insights about theevolution process. We use this technique in order to providenovel insights about bibliographic information networks.
I. I NTRODUCTION
Information networks have become ubiquitous in recentyears because of the large number of networked applicationssuch as social networks, the web and other linked entities.For example, academic networks such as DBLP, biologicalnetworks, and massive entity-relation models are all examplesof information networks. Such networks have the commonproperty that they contain different kinds of entities whichinteract with one another. Some of the examples such associal networks and the web are inherently homogeneous,since they contain entities of the same type. For example, asocial network contains actors that are linked by friendshiprelationships, whereas the web contains documents which arelinked by hyper-links.
Most work in the area of graph and network mining hasfocused on the homogeneous domain. However, a heteroge-neous representation is much richer; for example a richerrepresentation of a bibliographic network may contain nodescorresponding to different entities such asauthor, confer-ence, paper and term. Edges may denote more diverserelationships such aswritten-by between an author node and
a paper node,contains between a term node and a papernode,published-in between a paper node and a conferencenode. Clearly, the richer representation of a heterogeneousnetwork makes it powerful; on the other hand it is also muchmore challenging for mining purposes. In recent years, therehas been an increasing interest in the area of heterogeneousinformation networks. In this paper, we will examine theproblem of clustering and evolution diagnosis in massiveinformation networks.
Heterogeneous information networks are often encounteredin dynamic environments which are continuously evolving.The problem of clustering has been studied recently in thecontext of non-evolving and static information networks. E.g.,Sun et al. [15] present NetClus, which is a clustering algorithmfor star schema-based heterogeneous information networks.The center of the star is termed as thetarget typewhile othertype nodes are connected to this center type and are called asattribute typenodes. E.g. for the DBLP graph, paper is a targettype while authors, conference, terms are attribute type nodes.Figure 1 illustrates a net-cluster view of the DBLP network.The star-schema is a particularly important case, because ofits representational power in a variety of scenarios.
Conf Authors
Paper 2Terms
Authors
Paper 1
Paper 2
Paper 1Authors
Conf
Paper 3
Conf
Paper 3Cluster 1
Terms
Fig. 1. Net-cluster view of DBLP network
While NetClus is a powerful algorithm for determiningheterogeneous clusters, it incorporates no notion of evolution.NetClus, if used over multiple snapshots, would produceclusters which would have no correspondence with the onesin the previous snapshot. This effect becomes much moreprominent because NetClus clusters depend immensely onthe initial seeds. The problem of evolutionary clustering hasbeen studied in the context ofhomogeneous networks[4]. Thebasic principle is to create a clustering which focuses on bothmaintaining high quality clusters, and on creating clusters inwhich a natural correspondence can be maintained among theclusters across different snapshots. This broad techniqueisreferred to astemporal smoothing. A variety of techniques
[5], [12] have been designed for determining evolutionaryclusters using temporal smoothing. However, these techniquesare inherently designed for the homogeneous case. For hetero-geneous networks, we wish to cluster entire entity (group ofrelated objects) as a whole rather than clustering of individualtypes separately. It is challenging to cluster the entities(eachconsisting of multiple types of nodes) with temporal smooth-ness such that the snapshot quality is maintained.
In this paper, we will study the problem of evolutionaryclustering and diagnosis in information networks. We willtake a broader view of clustering and evolution analysis astwo tightly integrated problems which can be used in orderto derive interesting insights from data. This is especially truein the case of heterogeneous information networks, since onecan study how the trends in the different kinds of entitiesare affected by one another. For example, in an authorshipnetwork, evolutionary clustering can be combined with carefulevolutionary diagnosis and metrics to determine merges andsplits of different topical areas, authorship evolution andtopical evolution. Such insights are critical in understandingthe nature of the changes which occur in dynamic and rapidlyevolving information networks. Since clustering can be viewedas a network summarization technique, it is a natural approachfor integrating with the problem of evolutionary diagnosisinorder to understand and summarize the key changes whichmay occur in a network over time.
In this paper,we make the following contributions:
1. While the problem of evolutionary clustering has beenstudied for the homogeneous case, the problem is muchmore challenging for the heterogeneous case, because of thedifferent entity-types which may evolve over time. This paperis the first to present an evolutionary clustering algorithmfor heterogeneous networks. Our algorithm returns temporallysmoothed, high quality agglomerative clusters, and leverageson some concepts derived from the NetClus framework.
2. We tightly integrate the problems of evolutionary cluster-ing and diagnosis; the evolutionary diagnosis is achieved bydefining metrics and techniques to characterize the clusteringbehavior over time. For example, we can design techniquesto identify the birth, continuation and slow disappearanceofa community. We also study the influence of one communityonto another and flux between two different kinds of commu-nities. Our techniques are general enough to deal with differenttime granularities and entity types.
3. One of the additional results of this effort is to providenovel insights into the evolution of bibliographic networkswith the use of the techniques proposed in this paper. As aspecific example, we use the DBLP dataset in order to providenovel insights about the evolution process.
The paper is organized as follows. In Section II, we firstpresent our extension to the NetClus framework. In Section III,we define evolution diagnosis methods and metrics. We presentexperimental results on the DBLP dataset in Section IV. Wethen present an overview of related work in Section V. Weconclude with a summary and future work in Section VI.
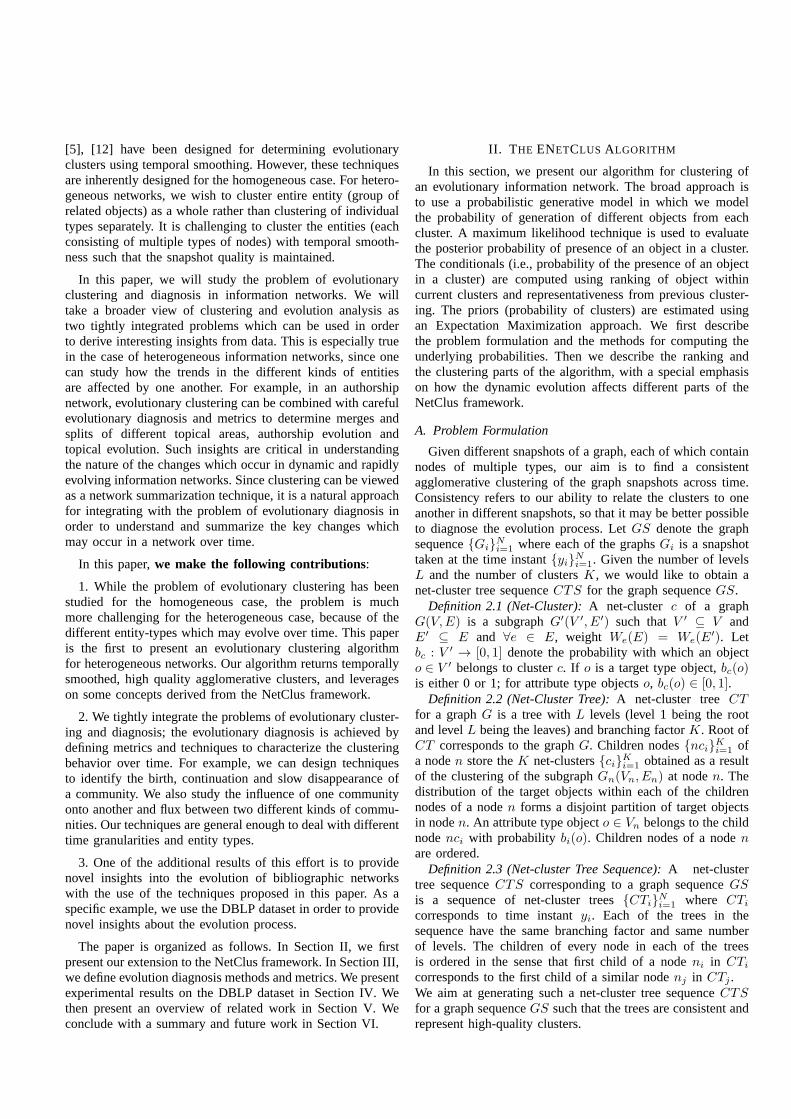
II. T HE ENETCLUS ALGORITHM
In this section, we present our algorithm for clustering ofan evolutionary information network. The broad approach isto use a probabilistic generative model in which we modelthe probability of generation of different objects from eachcluster. A maximum likelihood technique is used to evaluatethe posterior probability of presence of an object in a cluster.The conditionals (i.e., probability of the presence of an objectin a cluster) are computed using ranking of object withincurrent clusters and representativeness from previous cluster-ing. The priors (probability of clusters) are estimated usingan Expectation Maximization approach. We first describethe problem formulation and the methods for computing theunderlying probabilities. Then we describe the ranking andthe clustering parts of the algorithm, with a special emphasison how the dynamic evolution affects different parts of theNetClus framework.
A. Problem Formulation
Given different snapshots of a graph, each of which containnodes of multiple types, our aim is to find a consistentagglomerative clustering of the graph snapshots across time.Consistency refers to our ability to relate the clusters to oneanother in different snapshots, so that it may be better possibleto diagnose the evolution process. LetGS denote the graphsequence{Gi}
Ni=1 where each of the graphsGi is a snapshot
taken at the time instant{yi}Ni=1. Given the number of levelsL and the number of clustersK, we would like to obtain anet-cluster tree sequenceCTS for the graph sequenceGS.
Definition 2.1 (Net-Cluster):A net-cluster c of a graphG(V,E) is a subgraphG′(V ′, E′) such thatV ′ ⊆ V andE′ ⊆ E and ∀e ∈ E, weight We(E) = We(E
′). Letbc : V ′ → [0, 1] denote the probability with which an objecto ∈ V ′ belongs to clusterc. If o is a target type object,bc(o)is either 0 or 1; for attribute type objectso, bc(o) ∈ [0, 1].
Definition 2.2 (Net-Cluster Tree):A net-cluster treeCTfor a graphG is a tree withL levels (level 1 being the rootand levelL being the leaves) and branching factorK. Root ofCT corresponds to the graphG. Children nodes{nci}Ki=1 ofa noden store theK net-clusters{ci}Ki=1 obtained as a resultof the clustering of the subgraphGn(Vn, En) at noden. Thedistribution of the target objects within each of the childrennodes of a noden forms a disjoint partition of target objectsin noden. An attribute type objecto ∈ Vn belongs to the childnodenci with probability bi(o). Children nodes of a nodenare ordered.
Definition 2.3 (Net-cluster Tree Sequence):A net-clustertree sequenceCTS corresponding to a graph sequenceGSis a sequence of net-cluster trees{CTi}
Ni=1 where CTi
corresponds to time instantyi. Each of the trees in thesequence have the same branching factor and same numberof levels. The children of every node in each of the treesis ordered in the sense that first child of a nodeni in CTi
corresponds to the first child of a similar nodenj in CTj .We aim at generating such a net-cluster tree sequenceCTSfor a graph sequenceGS such that the trees are consistent andrepresent high-quality clusters.

B. ENetClus Framework
To perform evolutionary clustering in a heterogeneousnetwork, one could use any of the homogeneous clusteringalgorithms to cluster each type of nodes individually. But thatwould not guarantee that all the objects related to same entitylie in the same cluster and also the mutual information betweendifferent types of objects would not be exploited. To achieveagglomerative temporally smoothed clusters, we exploit anatural variation of the NetClus algorithm. NetClus performsiterative ranking and clustering. We use the knowledge fromthe current snapshot clustering to initialize the clustersforthe next snapshot and also to influence the ranking of objectsin these new clusters using the priors. Note that the priorsare propagated in the forward direction as time progresses.This means that the algorithm can be executed as an onlineevolutionary clustering algorithm. Supplying good priorsac-tually improves the quality of NetClus algorithm. Thus, withgreater consistency, we achieve better quality unlike otherevolutionary clustering algorithms. Algorithm 1 shows ourframework. We explain each of the steps in further subsections.
Algorithm 1 NetClus with Evolution-Aware Priors
1: Priors: Initialize prior probabilities{P (o|ck)}Kk=1.
2: Initialize: Generate initial net-clusters.{c0k}Kk=1.
3: Rank: Build probabilistic generative model for each net-cluster, i.e.,{P (o|ctk)}
Kk=1.
4: Cluster-target: Compute(p(ctk|o)) for target objects andadjust their cluster assignments.
5: Iterate: Repeat steps 3 and 4 until the clusters don’t changesignificantly.
6: Cluster-attribute: Calculatep(c∗k|o) for each attribute ob-ject in each net-cluster.
7: return p(c∗k|o)
C. Initialization of Priors and Net-Clusters
At the first snapshot, which is denoted byy1, prior probabil-ities are defined intuitively. E.g., if we believe that the data has4 clusters, we can define high prior probabilities for the termsrepresentative of each cluster. For other time instants, the priorprobabilities{P (o|ck)}
Kk=1 are defined as follows. The prior
probability of an objecto belonging to clusterck is definedas its representativeness in the corresponding cluster withinthe net-cluster tree for the previous time instant (step 1).Theuse of these priors ensures temporal smoothness, because thecomputation of cluster membership in a particular snapshotisaffected by the membership behavior in previous snapshots.The representativeness of an objecto in clusterc depends onthe probability of generating that object (given clusterc), andis inversely proportional to the entropy of the cluster member-ship distribution of the objecto. An object with a distributionpeaked at clusterc will have a high representativeness valuefor clusterc. Subsection II-D illustrates how the ranking partof the algorithm uses these priors.
The initialization of clusters should be done in a waythat provides a smooth transition from the clustering in theprevious snapshot. Hence, the algorithm generates initialpar-titions for target objects as follows. Let{oi}Li=1 be theL
attribute type objects connected to an objecto. Consider aprobability distribution using the priors mentioned in step 1,{pk =
∑Li=1 P (oi|ck)}
Kk=1. A target objecto is assigned to
cluster ck with max probabilitypk. Then initial net-clustersare induced from the original network according to thesepartitions, i.e.,{c0k}
Kk=1. This corresponds to step 2 of the
algorithm. Initializing clusters using representativeness valuesensures faster convergence to a better local maxima.
D. Ranking and Clustering
In step 3, the algorithm builds ranking-based probabilisticgenerative model for each net-cluster, i.e.,{P (o|ctk)}
Kk=1.
The ranking process constructs representative objects fromthe different clusters. The corresponding probability canbedecomposed by conditioning on the type of the object in thecorresponding cluster. In other words, we haveP (o|ck) =P (To|ck) × P (o|To, ck). P (To|ck) is estimated as the maxi-mum likelihood estimate of typeTo in clusterck. P (o|To, ck)can be computed using two different notions of ranking. Forsome attributes, we can use a frequency-based approach ofestimating this probability. For example, in a bibliographicinformation network, the probability for a term is the weightedratio of number of papers containing this term to the totalnumber of papers, where weights are associated with everypaper.P (o|To, ck) can also be computed using authority-basedranking. In this case, ranking of an objecto is estimated bypropagating authority scores from objects of other attributetypes via the target type. Finally, the overall probabilityP (o|To, ck) is computed as a weighted sum of ranking-basedP (o|To, ck) and the priors generated in step 1. The priorweight (λP ) controls how much the current ranking andtherefore the current clustering depends on the clusteringat theprevious time instant. Thus,λP controls the tradeoff betweenthe snapshot clustering quality and temporal smoothness.
By using the ranked attribute object probabilities, we cancompute the conditional probability of a target objecto asP (o|ck) =
∏
x∈NGk(o) P (Tx|ck)
W (o,x) × P (x|Tx, ck)W (o,x),
whereNGkis the neighborhood set of objects in subgraphGk.
In step 4, the algorithm calculates the posterior probabilitiesfor each target object. This is done by iterating over theEM equationspt(ck|o) ∝ p(o|ck) × pt(ck) and pt+1(ck) =∑|O|
i=1 pt(ck|oi)/|O|.
Once the posterior probabilitiesP (ck|o) have been com-puted, these can be used to express the objecto as a vectorvo = (p(c1|o), p(c2|o), ...p(cK |o)). This new vector space canbe leveraged for similarity computation and object assignment.By using previous cluster assignments, vectorv for the clustercentroids is computed as an average of objects belonging tothat cluster. The objecto is re-assigned to a cluster, by usingthe cosine similarity value betweenvo and cluster centroids.
The steps 3 and 4 are repeated until the clusters do notchange significantly, i.e.,{c∗k}
Kk=1 = {ctk}
Kk=1 ≈ {ct−1
k }Kk=1
in theK-dimensional vector space.Finally, in step 6, posterior probabilities for each attribute
object (p(c∗k|o)) in each net-cluster are computed using theposterior probabilities of its neighboring target objects. Notethat the way the priors are propagated automatically ensures

matching of the clusters at all levels in the hierarchy. Thisisanother advantage of our maximum likelihood based modelcompared to other evolutionary clustering schemes wheregreedy methods are used to find corresponding clusters acrossdifferent snapshots.
E. Complexity Analysis
As mentioned in [15], clustering once requiresO(c1|E| +c2N) time, whereN is the number of target objects. A net-cluster tree withL levels is created after clustering of allinternal nodes i.e.,K
L−1−1K−1 nodes. But, on an average, the size
of the graph at a node decreasesK times per level. Hence,the creation of a cluster tree requiresO(L × (c1|E| + c2N))time. The time required to compute the entireCTS would alsodepend on the number of time granularities and the number oftime instants per time granularity. The exact complexity woulddepend on how dense the graph becomes at different instantsand intervals of time.
III. E VOLUTION DIAGNOSIS AND METRICS
In this section, we discuss methods for evolution diag-nosis and metrics. We define metrics for evolution quan-tification such as appearance and disappearance rate, con-tinue/merge/split rate, stability and sociability of objects. Wefurther note that an algorithmic tradeoff exists between cluster-ing quality and the consistency of the clusters over time. Whilemost of the properties studied in this section are properties ofthedata, the latter are the properties of the algorithm in termsof the level of smoothness. We examine methods to quantifyand understand this tradeoff at the algorithmic level.
A. Quantifying Consistency
ENetClus performs a clustering of the attribute type nodes,in which membership probabilities are assigned to nodes. Letthe current data set being clustered belong to the time instant yand let the type we are interested in bet. Let the prior weightbe fixed toλP , number of clusters beK and current level bel. Then, the membership probability of objecto of type t toclusterci is denoted by{bi(o)}Ki=1.
Intuitively, consistency between two sets of cluster mem-bership distributions is the degree of similarity betweendistributions of the intersecting objects. This implies thatthe insights derived from one set of the clusters shouldcontinue to hold valid over the next set, unless a majorevolution has occurred. We can define consistency of theclustering c as the average cosine similarity between thecluster membership probability distributions of an objectattime y1 and time y2. consistency(clusteringc, y1, y2)=1
|O|
∑
o∈O
∑
K
k=1bk(o)y1×bk(o)y2
√
∑
K
k=1bk(o)y1
2
√
∑
K
k=1bk(o)y2
2
Such a comparison of consistency between two sets ofclusters should be based only on the objects present in bothtime instants. Therefore, the setO used for the computationprocess denotes the set of intersecting objects at timey1and timey2. Furthermore, we can define consistency for aparticular level of the hierarchical clustering as the averageconsistency of sets of clusters at that level, each weighted
by the number of objects in that set of clusters. Overallconsistency is then an average of the consistencies at eachlevel. Finally, we can express consistency across differenttypes as a weighted sum of consistency with respect to eachof the types.
The above definition defines the consistency only oversuccessivesnapshots. However, it can be easily generalizedto the case of arbitrary intervals, by using the objects in thecorresponding intervals. Furthermore, we can define achainedpath consistencyover a sequence of intervals as the productof consistencies over these corresponding intervals.
B. Quantifying Snapshot Clustering Quality
ENetClus represents each objecto in aK-dimensional spacewhen performing clustering. We could use the average ratio ofintra-cluster similarity to inter-cluster similarity as ameasureof the quality of a cluster. This is also calledcompactness.Higher values of compactness usually imply that the clusteringis of better quality . The compactnessC is defined as follows:
C = 1|O|
∑Kk=1
∑|Ok|i=1
s(oki,ck)∑
k′ 6=ks(oki,c′k)/(K−1)
whereO is the set of the target objects,ck is the centroid forclusterk and s(a, b) measures the cosine similarity betweenK-dimensional vectorsa andb.
We can define averageentropy of a cluster asE =− 1
|O|
∑Kk=1
∑|Ok|o=1 bk(o) × log(bk(o)). Lower entropy means
that on an average the objects belong to a particular clusterwith high probability and so the clustering is of higher quality.
C. Cluster Merge and Splits
As the network evolves, different clusters can merge intoa single cluster or a cluster can split into multiple clusters.Our soft clustering process has a fixed number of clusters foreach time period. However, we can still study the merging andsplitting of clusters as follows. Consider a set of clustersc atlevel l at time y. If at time y + 1, a substantial part of themembership probabilities moves out of a clusterci to otherclusters at the same level, then we can say that the clusterci has split into multiple parts. Similarly, if clusterci hasobtained a substantial part of membership probabilities fromother clusters at the same level at timey − 1, then we canclaim that clusterci has been formed from a merge of otherclusters. While measuring the amount of merge or split of aclusterci, we should consider only those objects which occurin the network at both the times i.e., aty and y − 1 whenstudying the “merge” phenomena and aty and y + 1 whenstudying the “split” phenomena.
Continue rate: This is the rate at which the objects appearto continue in the cluster. If the membership probability ofan object belonging to clusterci decreases, ratio of newprobability to old probability is the continue rate of the objectin cluster ci. If the membership probability increases, theobject is said to continue in the cluster with continue rateof 1.
Continue rate of clusterci = 1|O|
∑
o∈O min(bi(o)y
bi(o)y−1, 1)
whereO is the set of the objects that occur in the networkboth aty andy − 1.

Merge rate: This is the rate at which the objects appear tomerge into a particular clusterci from all other clusters. Anobject is said to be merging into a clusterci if its clustermembership probability forci increases over time. If thecluster membership probability decreases for the object wrtclusterci, it contributes0 to the merge rate of clusterci.
Merge rate of clusterci = 1|O|
∑
o∈O max(bi(o)y−bi(o)y−1
bi(o)y, 0)
Split rate: This is the rate at which the objects appearto split out of a particular clusterci to all other clusters.An object is said to be splitting out from a clusterci if itscluster membership probability forci decreases over time. Ifthe cluster membership probability increases for the object wrtclusterci, it contributes0 to the split rate of clusterci.
Split rate of clusterci = 1|O|
∑
o∈O max(bi(o)y−1−bi(o)y
bi(o)y−1, 0)
Such rates can help us define interesting characteristics ofthe evolving data. E.g., in the case of bibliographic data, themerge and split rates can help us determine the influence ofdifferent research areas on another. The ability to determineboth the evolutions of the clusters as well as the interactionsof different parts of the network is key to the inference ofinteresting evolutionary insights in a multi-typed network.
D. Cluster Appearance and Disappearance
A cluster can be considered new, when most of its objectswere not present in the previous time period. This can beformally defined in terms of the membership probabilities as
follows: Appearance rate=
∑
o∈O′ bc(o)y∑
o∈O′′ bc(o)y
Here, the setO′ consists of objects which were not presentat time y − 1 and are present at timey. The setO′′ consistsof all objects in the cluster at timey.
Similarly, a cluster can be considered to be disappearing ifmost of the objects in it are absent at timey+1. Disappear-
ance rate=
∑
o∈O′′′ bc(o)y∑
o∈O′′ bc(o)y
where the setO′′′ consists of objects which were present attime y and are not present at timey + 1 and setO′′ consistsof all objects in the cluster at timey.
E. Stability of Objects
While many of the afore-mentioned definitions quantifythe behavior ofclusters, it is also interesting to quantify theevolutionary behavior ofobjects. The stability of an objectquantifies the level to which the object is stable wrt its clusteror the network.
1) Temporal Stability:An object may appear continuouslyover multiple time instants or may appear intermittently.Simple temporal stability can be defined as the ratio of thenumber of time instants the object appears to the numberof time instants in the observed time interval.Sequentialtemporal stability can be defined as the ratio of the numberof time instants the object disappears to the number of timeinstants in the observed time interval.Maximum sequentialtemporal stability can be defined as the ratio of the maximumtime interval for which the object is present in the network tothe number of time instants in the observed time interval.
2) Simple Social Stability:The concept of social stabilityis based on cluster membership, and how frequently objectsshift clusters. We definesimple social stabilityas the ratio ofnumber of times the object is retained in the same cluster tonumber of time instants it appears in the data. For soft clusters,we can assign every object to the cluster for which it hasthe maximum membership probability. We can also adapt thedefinition as the ratio of similarity between cluster membershipdistribution for the object over consecutive time instantsto thenumber of times the object appears in the data.
3) Ranked Social Stability:The ranked social stabilitydefines the level of stability among themost representativeobjects in the cluster. This is a natural metric for a clus-tering process which incorporates multi-typed ranking intothe underlying algorithm. LetLy and Ly+1 be the list ofthe top k representative objects in a cluster at timey andy + 1. Ranked social stability of clusterc can be formallyevaluated by |Ly∩Ly+1|
|Ly|. By varying the value ofk, it is
possible to gain deeper insights into the effects of the evolutionon the most representative objects in the cluster. Since themost representative objects in the cluster can provide intuitiveinsights into the nature of the clusters, this provides a differentperspective on how the clusters may have changed over time.
F. Sociability of Objects
Sociability of an object is the degree to which it interactswith different clusters. An object which belongs to manyclusters is more sociable compared to one which belongs to asingle cluster. It is a measure of the entropy of the membershipof the object to different clusters. Therefore, social stability
over a time intervalI can be defined as−∑
ipi×log(pi)
log(K) whereK is the number of clusters andpi is the ratio of number oftimes the object belongs to clusteri to the number of timeinstants in intervalI for which the object was present in thedata. For soft clusters,pi can be defined as the ratio of sum ofmembership probability of the object in clusteri over I to thenumber of time instants in intervalI for which the object waspresent in the data. This can often provide novel insights inamulti-typed network. E.g., in a bibliographic network, it canprovide insights about how the terms or authors may evolveacross different topical areas.
G. Effect of Social Influence
Multiple authors may move out of one research area toanother. But there would still be some authors who maynot. We need a metric to quantify the degree to whichan object follows the cluster trend. Consider a vectorV ′
which has sizeK2. Let V ′(i, j) denote the movement ofmembership probabilities of an objecto from cluster ci toclustercj at time periody + 1 i.e. the influence that clusterci has on clustercj via object o. Intuitively if cluster ciinfluencescj through objecto, bi(o)y+1 should be less thanbi(o)y and bj(o)y+1 should be more thanbj(o)y, otherwiseV’(i,j)=0. In the first case,V ′(i, j) can be computed asV ′(i, j) = (bi(o)y − bi(o)y+1)× (bj(o)y+1 − bj(o)y). Finally,we normalizeV ′(i, j) so that all elements add up to 1.

Consider another similar vectorV of sizeK2. We computeV ′(i, j) for every objecto ∈ O and store the average influencevalues inV . The cosine similarity between the vectorsV andV ′ provides a good metric to measure the degree to which theobject follows the trend. This can be callednormality .
IV. EXPERIMENTS
In this section, we will study the power of our tightlyintegrated approach of studying evolution and clustering infinding interesting cases in bibliographic networks. We usetheDBLP network. Such a network affords the ability to examineappearance of new research areas, cluster appearance ratefor terms, authors and conferences. The goal of this sectionis to illustrate the power of our techniques in determininginteresting changes in such a data set. Since the focus of thispaper is to study clustering as a tool for evolutionary analysisof information networks, the focus of this section is also tomake interesting observations about the underlying evolutionwith the use of such an approach.
A. Data Set
We perform clustering and study of evolution on DBLP datafrom 1993 to 2008. This data set contains approximately 654Kpapers, 484K authors, 107K title terms and 3900 conferences.The number of clusters was set to 4. We varied the priorweight between 0 and 1. The priors were specifically usedfor terms. The different node types in the graph were papers,authors, conferences and terms. Edges exist between paperand author node types, paper and conference node types andbetween paper and term node types. Our algorithm explicitlyassigns paper nodes to particular partitions, and maintains amembership probability distribution for other nodes.
We also use a four area data set, which has been used earlierin [15]. This data set focuses on four information processingrelated areas. This is a subset of the DBLP data set containingapproximately 24K papers (with 12K title terms) written by26K authors in 20 conferences in the four areas of data mining,databases, information retrieval and machine learning over theyears 1993 to 2008. We study the entire DBLP dataset in termsof slices and four area dataset in terms of snapshots.
B. Evolutionary Analysis of DBLP Data Set
We present some interesting results for the DBLP dataset. Figure 2 shows that the #authors per paper has beenincreasing over time. We conjecture that this general trendin bibliographic networks is a result of greater collaborativeefforts in recent years as a result of better communicationsand networking abilities, as well as better software supportand enablement of collaborative efforts. We also observed thatthe #terms in the title of a paper has also increased overtime. This is because the increasing complexity of researchhas brought in new terms into the vocabulary, while the oldterms also continue to be used. With increasing maturity ofresearch areas, authors have been writing more detail-orientedpapers which need to use both the old terms and the new termsin order to describe the underlying topic.
We also studied the power law behavior of the bibliographicnetwork. Figure 2 shows that the number of papers using a
100%
60%
80%
100%
#authors=5
#authors=4
# h 3
20%
40%#authors=3
#authors=2
#authors=1
0%
1993
1995
1997
1999
2001
2003
2005
2007
1 1 1 1 2 2 2 2
1000002008 2007
100
1000
10000
2008 2007
2006 2005
2004 2003
2002 2001
10
100
000
2000 1999
10
1
10
11
1 5001 10001 15001 20001
(a) (b)
Fig. 2. (a) Evolution in the number of authors per paper (b) Power laws inthe DBLP network: #papers vs. rank of a term(left), #papers vs. rank of anauthor(right)
TABLE ICONSISTENCY VERSUS PRIOR WEIGHT
Prior wt 0.0 0.2 0.4 0.6 0.8 1.0Author 0.108 2.432 1.199 1.342 2.818 5.273Term 0.470 3.105 2.168 2.222 3.646 6.024Conf 0.567 2.730 1.800 1.326 3.293 6.709
particular term in the title or the number of papers publishedby an author follow the expected power laws. One interestingobservation was that the power law curve became more gentleover time. This is a result of the fact that the size of thenetwork has increased over time. This suggests that largerbibliographic networks tend to have gentler power law curves.
C. Effect of Prior Weights
Table I shows the effect of varying the prior weight whenperforming clustering. The use of a higher prior-weight resultsin more consistency and smoothness in the clustering overdifferent time-periods. We note that the consistency values riseas we increase the prior weight. The increase in prior weightincreases the influence of the previous clustering on the currentclustering. Introduction of new nodes in the network can resultin fluctuations of the underlying consistency values. Thus,compared to the original NetClus, we achieve much moreconsistent clusters. Table II shows the variation in compactness(defined in subsection III-B) with increasing prior weight.Notice that the quality decreases initially and then improves aswe increase the prior weight. The decrease happens becausefor lower prior weight, the clustering is confused between theprior information and the current information while when theprior weight is high, the clustering iterations align the currentinformation around the prior information and tend to convergeto a better local maxima of log likelihood. The prior infor-mation provide a firm initial clustering. This nature is quitedifferent from other clustering algorithms where it has beenshown that the snapshot quality decreases as the consistencyincreases. Also note that as prior weight is increased, thecorrespondence between two clusters between two snapshotsincreases. Hence, as against evolutionary K-means clustering,our clustering automatically results into matched clusters. Thusa prior weight of 0.8 helps provide both good consistencyas well as good clustering quality. It would be interestingto see how quality and consistency change when priors aredefined over other types like authors and conference also andat different time granularities. We leave it as part of futurework.
D. Continue, Merge and Split Rates
Figure 3 shows the continue, merge and split rates fordifferent types of nodes where prior weight is fixed at 0.8. The

TABLE IIQUALITY VARIATION WITH PRIOR WEIGHT
Prior wt 0.0 0.2 0.4 0.6 0.8 1.0Compactness 4594.175155 2166.869518 1978.39471 2932.194099 4267.585485 3972.629098
0.4
0.5
0.6
0.7
rge/Split
s
Level 1 Level 2 Level 3
0
0.1
0.2
0.3
0.4
e r r e e t e e tContinue/M
er
Rates
Author
continue
Author
Merge
Author
Split
Term
Continue
Term
Merge
Term
Split
Conf
Continue
Conf
Merge
Conf SplitC
11.2
es
L l 1
0.40.60.81
earance/
arance
rat Level 1
Level 2
Level 3
00.2
nce
r nce
nce
nce
nce
nce
Appe
Diappea
Level 4
Appearan
author
Appearan
term
Appearan
conf
sappearan
author
sappearan
term
sappearan
conf
Dis
Dis
Dis
(a) (b)
Fig. 3. (a) Variation of the merge, continue and split rates (b) Variation ofthe appearance and disappearance rates
rate values are averaged over all the years from 1993 to 2008.Also, in each histogram, each bar represents values for onelevel of the agglomerative clustering. Notice that the continuerate is more than merge and split rates. Also, merge rate isgenerally lower than the split rate. Looking out for outliers,we did observe a high split rate in DB cluster of 0.892 anda high merge rate of 0.8578 for DM cluster for authors in2002 (denoting the rise of data mining from databases). Thereis a high merge rate for terms in IR cluster in time period1998-1999 (possibly due to publications related to rankingtechniques).
E. Cluster Appearance and Disappearance
Figure 3 illustrates the appearance and disappearance ratesfor entire DBLP dataset for different types. The rate valuesare averaged over all the years from 1993 to 2008. A barin each histogram represents values for one level of theagglomerative clustering. On average, the appearance and thedisappearance rates increase as we go deeper into the lowerlevels of clustering, which represent finer grained topics ofthe bibliographic network. An intuition for this is as follows.Authors often publish in different sub-areas in different years,as a result of which they can appear to have disappeared fromthat sub-area in that time period. However, the author’s majorarea usually remains the same, and hence the disappearancerate for authors would be higher in sub-areas than in majorareas. This broad intuition is true across different kinds ofevolution of the clustering process.
In the four area dataset, ML is the most dominant clusterin the first few years. We observe ML conferences at the topin DM and IR clusters for those years. But slowly in late 90s,we see IR and DM conferences appearing at the top.
F. Evolution of Individual Nodes
While our afore-mentioned observations discuss the evolu-tion of clusters, we will now study the evolution of individualnodes. We perform these experiments on the entire DBLPdataset. We study the evolution of individual nodes in termsof the stability metrics. Figure 4 shows the different typesof temporal stability values in terms of the number of years.The figure shows the number of objects versus the temporalstability expressed in terms of number of years. Note that theconferences and terms are more stable than the authors. Astability value of 4 implies that the object disappeared from
1 E 05
1.E+06Simple (term)
1 E 03
1.E+04
1.E+05
f objects Simple (author)
Simple (conf)
Max seq (term)
1 E 01
1.E+02
1.E+03
Num
ber o
Max seq (author)
Max seq (conf)
Seq (Term)
1.E+00
1.E+01
1 3 5 7 9 11 13 15
N q ( )
Seq (author)
Seq (conf)
1 1 1
Number of years
0.6
0.8
1
Stability
0
0.2
0.4
le Social S
author
term
conf0
1994
1996
1998
2000
2002
2004
2006
2008Simp
(a) (b)
Fig. 4. (a) Temporal stability (b) Simple social stability
0 7
0.8
y
At level=1 and prior wt=0.8k=1000
k
0.5
0.6
0.7
al Stability
k=100
k=10
0.2
0.3
0.4
nked
Socia
0
0.1
4 5 6 7 8 9 0 1 2 3 4 5 6 7 8
Ran
1994
199
199
199
199
199
200
200
200
200
200 4
200
200
200
200
0 1
0.12
0.14
0.16
0.18
flence
author term conf
0
0.02
0.04
0.06
0.08
0.1
Social Inf
0
IR!>IR
IR!>DM
IR!>DB
IR!>ML
DM
!>IR
DM
!>DM
DM
!>DB
DM
!>ML
DB
!>IR
DB
!>DM
DB
!>DB
DB
!>ML
ML!>IR
ML!>DM
ML!>DB
ML!>ML
(a) (b)
Fig. 5. (a) Ranked social stability (b) Influences among the four areas
the graph 4 times in the 16 years in which it was represented.The trend for sequential stability is quite different comparedto the simple and maximum sequential stability values.
Next, we plot the simple social stability values for the mosttemporally stable objects (i.e., objects which were present inour data for all the 16 years). Figure 4 shows that on anaverage objects maintain their cluster membership distributionupto a degree of 70%. The membership behavior of termsand conferences in clusters is much more stable as comparedto the membership behavior of authors. This is reasonableto expect, because the broad topics in the clusters evolverelatively slowly, whereas the authors may move in and outof different topical areas more rapidly. We note that suchobservations about the evolutionary behavior of informationnetworks can be useful in order to identify the object typeswhich show the most interesting evolution trends over time.
Further, we study ranked social stability for the nodesof type “term” with a prior weight of 0.8. The results areillustrated in Figure 5(a). The number of representative objectsin the ranking was varied at top-k = 10, 100, 1000. Whilethere is some variation in the results across different years,the results show that higher stability values are achieved byfixing k=10 as compared to k=100 or 1000. This suggests thatonly the most representative objects in the cluster continue tobe stable, whereas the “modestly” representative objects mayvary more significantly.
Figure 5(b) shows average social influence among differentresearch areas using the fourarea dataset across 16 years.Different bars represent different types. We can clearly seethe influence between the DB and IR areas. We also noticeML to IR influence which is somewhat counter-intuitive. Wethink that this happens because in the first few years, since IRwas not much developed, ML authors, conferences and termsoccupy the “IR” cluster. Mutual influence between DM andML is quite natural.

V. RELATED WORK
Traditionally, clustering has been performed using mincut,min-max cut, normalized cut, spectral and density-based meth-ods in homogeneous graph networks. Sun et al. present asystem called RankClus [14] and then NetClus [15] for clus-tering over heterogeneous information networks. We extendedNetClus to perform agglomerative evolutionary clusteringandthen provided metrics to analyse these clusters and measureevolution. Our method could be extended by building onecluster tree sequence per type similar to [3], [11], which havedifferent number of clusters per type.
Evolutionary clustering has been studied in some of theworks [5], [4]. Chakrabarti et al. [4] proposed heuristic so-lutions to evolutionary hierarchical clustering problemsandevolutionary k-means clustering problems. They introducetheconcepts of consistency of clusters and cluster correspondence.Chi et al. [5] incorporate temporal smoothness in evolution-ary spectral clustering which provides stable and consistentclustering results. They also handle the case when new datapoints are inserted and old ones are removed over time. Whileour framework automatically takes care of the new and olddata points, we incorporate them separately when evaluatingthe similarity between clusterings. Also, unlike these works,we focus on evolution of heterogeneous networks. Mei etal. [12] discover and summarize the evolutionary patterns ofthemes in a text stream. Kumar et al. [7] study the evolutionof structure within large online social networks. They presenta segmentation of the network into three regions and study theevolution of these regions. The area of evolutionary clusteringis also closely related to areas like clustering data streams. Weleave storage and clustering of network data streams as futurework.
Sun et al. [13] propose a system, GraphScope, which iden-tifies communities in a parameter-free way, using the MDLprinciple. Kim and Han [6] perform evolutionary clusteringusing density-based methods. We use NetClus to identifyclusters. Similar to their work, we can also track changesin clusters, appearance and disappearance of various clustersover time. Backstrom et al. [2] present an analysis of groupformation and evolution in LiveJournal and DBLP. Some ofour evolution metrics are influenced by their work. However,they define conferences in DBLP as clusters while we havetyped-clusters obtained using NetClus. Leskovec et al. [8],[9] present a detailed study of network evolution. However,they do not deal with clustering of these graphs or study ofthe evolution of clusters. Tang et al. [16] study communityevolution in a multi-mode network using a spectral framework.FacetNet [10] provides a framework for analysing commu-nities and their evolution. We study evolution of clusters inmuch more detail. Apart from that the clusters obtained usingthe iterative NetClus algorithm have been shown to be moremeaningful and hence studying their evolution is interesting.Asur et al. [1] characterize complex behavioral patterns ofindividuals and communities over time. They do not performany temporally smoothed clustering.
VI. CONCLUSION AND FUTURE WORK
In this paper, we designed a clustering algorithm forevolution diagnosis of heterogeneous information networks.This approach tightly integrates the evolution and clusteringprocess, and provides novel insights into the evolution both atthe object level and the clustering level. We studied the appli-cation of our approach on bibliographic information networks.We provided novel insights for evolution diagnosis on theDBLP data set, and showed the effectiveness of the evolution-sensitive clustering approach for heterogeneous informationnetworks.
We can further modify the technique to incorporate variablenumber of clusters at different time periods. Also, it wouldbeinteresting to study the effect on compactness for differenttime granularities and when priors are defined for other nodetypes. Such an evolutionary clustering over heterogeneousinformation networks can also be helpful in identifying outliersin the network both in the static as well as evolutionary sense.
VII. A CKNOWLEDGEMENTS
The work was supported in part by NSF IIS-09-05215, andthe U.S. Army Research Laboratory under Cooperative Agree-ment Number W911NF-09-2-0053 (NS-CTA). The views andconclusions contained in this document are those of the authorsand should not be interpreted as representing the officialpolicies, either expressed or implied, of the Army ResearchLaboratory or the U.S. Government. The U.S. Government isauthorized to reproduce and distribute reprints for Governmentpurposes notwithstanding any copyright notation here on.
REFERENCES
[1] S. Asur, S. Parthasarathy, and D. Ucar. An event-based framework forcharacterizing the evolutionary behavior of interaction graphs.KDD ’07
[2] L. Backstrom, D. Huttenlocher, J. Kleinberg, and X. Lan. Groupformation in large social networks: membership, growth, and evolution.KDD ’06
[3] R. Bekkerman, R. El-Yaniv, and A. McCallum. Multi-way distributionalclustering via pairwise interactions.ICML ’05
[4] D. Chakrabarti, R. Kumar, and A. Tomkins. Evolutionary clustering.KDD ’06
[5] Y. Chi, X. Song, D. Zhou, K. Hino, and B. Tseng. Evolutionary spectralclustering by incorporating temporal smoothness.KDD ’07
[6] M. Kim and J. Han. A Particle-and-Density Based EvolutionaryClustering Method for Dynamic Networks.VLDB 2009
[7] R. Kumar, J. Novak, and A. Tomkins. Structure and evolutionof onlinesocial networks.KDD ’06
[8] J. Leskovec, L. Backstrom, R. Kumar, and A. Tomkins. Microscopicevolution of social networks.KDD ’08
[9] J. Leskovec, J. Kleinberg, and C. Faloutsos. Graphs overtime: densifi-cation laws, shrinking diameters and possible explanations. KDD ’05
[10] Y. Lin, Y. Chi, S. Zhu, H. Sundaram, and B. Tseng. Facetnet: aframework for analyzing communities and their evolutions in dynamicnetworks.WWW ’08
[11] B. Long, Z. Zhang, X. Wu, and P. Yu. Spectral clustering for multi-typerelational data.ICML ’06
[12] Q. Mei and C. Zhai. Discovering evolutionary theme patterns from text:an exploration of temporal text mining.KDD ’05
[13] J. Sun, C. Faloutsos, S. Papadimitriou, and P. Yu. Graphscope:parameter-free mining of large time-evolving graphs.KDD ’07
[14] Y. Sun, J. Han, P. Zhao, Z. Yin, H. Cheng, and T. Wu. Rankclus: inte-grating clustering with ranking for heterogeneous information networkanalysis.EDBT ’09
[15] Y. Sun, Y. Yu, and J. Han. Ranking-based clustering of heterogeneousinformation networks with star network schema.KDD ’09
[16] L. Tang, H. Liu, J. Zhang, and Z. Nazeri. Community evolution indynamic multi-mode networks.KDD ’08