Evolution of the global phosphorus...
16
386 | NATURE | VOL 541 | 19 JANUARY 2017 LETTER doi:10.1038/nature20772 Evolution of the global phosphorus cycle Christopher T. Reinhard 1 *, Noah J. Planavsky 2 *, Benjamin C. Gill 3 , Kazumi Ozaki 1,4 , Leslie J. Robbins 5 , Timothy W. Lyons 6 , Woodward W. Fischer 7 , Chunjiang Wang 8 , Devon B. Cole 2 & Kurt O. Konhauser 5 The macronutrient phosphorus is thought to limit primary productivity in the oceans on geological timescales 1 . Although there has been a sustained effort to reconstruct the dynamics of the phosphorus cycle over the past 3.5 billion years 2–5 , it remains uncertain whether phosphorus limitation persisted throughout Earth’s history and therefore whether the phosphorus cycle has consistently modulated biospheric productivity and ocean– atmosphere oxygen levels over time. Here we present a compilation of phosphorus abundances in marine sedimentary rocks spanning the past 3.5 billion years. We find evidence for relatively low authigenic phosphorus burial in shallow marine environments until about 800 to 700 million years ago. Our interpretation of the database leads us to propose that limited marginal phosphorus burial before that time was linked to phosphorus biolimitation, resulting in elemental stoichiometries in primary producers that diverged strongly from the Redfield ratio (the atomic ratio of carbon, nitrogen and phosphorus found in phytoplankton). We place our phosphorus record in a quantitative biogeochemical model framework and find that a combination of enhanced phosphorus scavenging in anoxic, iron-rich oceans 6,7 and a nutrient- based bistability in atmospheric oxygen levels could have resulted in a stable low-oxygen world. The combination of these factors may explain the protracted oxygenation of Earth’s surface over the last 3.5 billion years of Earth history 8 . However, our analysis also suggests that a fundamental shift in the phosphorus cycle may have occurred during the late Proterozoic eon (between 800 and 635 million years ago), coincident with a previously inferred shift in marine redox states 9 , severe perturbations to Earth’s climate system 10 , and the emergence of animals 11,12 . Phosphorus (P) has only one stable isotope, making it impossible to track mass fluxes directly with traditional isotope mass balance approaches. Inverting for P budgets, therefore, relies heavily on the development of techniques for estimating ancient seawater phosphate concentrations and P burial fluxes 2 . With the goal of tracking the secular evolution of marginal marine P burial—the largest sink in the modern P cycle 13 —we present a compilation of new and published geochemical data from fine-grained siliciclastic sedimentary rocks (referred to here as ‘shales’; see Supplementary Table 1). The marine shale record is a particularly useful archive for constraining element budgets within the oceans because this lithology is ubiqui- tous in the stratigraphic record and, taken in aggregate, records the large-scale sediment geochemistry of marine continental margin environments 14 . Indeed, the chemical composition of shales has long been used to diagnose element fluxes at Earth’s surface through time 15 . Our data set was compiled from published literature (n > 15,000 shale samples) and supplemented with new analyses from Precambrian successions. We were intentionally broad in our sample filters, selecting a subset of samples that contain 1% or greater aluminium (by weight), a reliable proxy for the detrital mineral contents that are typical of this rock type. This very basic requirement ensures that the samples have a relatively large siliciclastic contribution. We note that it also allows for the inclusion of a diverse set of samples—thus capturing a wide range of marginal marine depositional environments. The intent is to compare all available P data from typical continental margin sediments and epicontinental seaways (excluding dominantly chemical sedimen- tary rocks and quartz sandstones). Abyssal marine sediments are not explicitly excluded from our database but are very rare in sedimentary sequences older than Cretaceous in age, that is, more than 150 million years old. The final filtered data set for marginal marine siliciclastics yields P data from 7,970 individual samples spanning Earth’s history (see Supplementary Table 1), and we focus here on bulk P content with the aim of tracking broad changes in bulk authigenic P burial in marginal marine sediments (principally fluorapatite (CFA), iron- oxide-bound P and organic P) through time. The most striking first-order trend observed in the data (Fig. 1) is a large increase in the variability and overall mean P content of shales from the Cryogenian period (720–635 Myr ago), the Ediacaran period (635–541 Myr ago) and the Phanerozoic eon (541–0 Myr ago) relative to those deposited during earlier Precambrian time. The average P content of post-Tonian (less than 720 Myr old) samples is over a factor of four greater than that of pre-Cryogenian samples—0.209 ± 0.023 wt% versus 0.051 ± 0.003 wt% (±2 standard errors)—with the difference in mean values being very unlikely to have emerged from a continuous underlying distribution with the same mean P content (P < 0.001, α = 0.01, unpaired Student’s t-test). Importantly, this pattern is inde- pendent of bulk organic carbon content, the mean of which is not significantly different between the two sample sets (P = 0.106, α = 0.01). The decoupling of bulk P content from organic carbon indicates that organic matter flux to the sediment column, though an important factor for local authigenic P enrichment, did not exert first-order control over the temporal shift we observe (Extended Data Fig. 1). The observed increase in mean bulk P content is clearly captured in frequency distributions of data binned coarsely by age and remains a robust feature during bootstrap resampling (Fig. 1c). Simply put, marginal marine sedimentary rocks that are strongly enriched in authigenic P are exceptionally rare throughout most of Precambrian time, but are common in Phanerozoic sedimentary sequences. This observation is consistent with the previously noted dearth of Precambrian phosphorites (Fig. 1a; ref. 16), with a notable exception in the Palaeoproterozoic era that is potentially linked to an inferred transient rise in surface oxygen levels 17–19 . There are no reported Archean sedimentary phosphorites, and phosphorites are stratigraphically limited and not found in typical continental mar- gin successions during the Mesoproterozoic 17 . In addition, there is a notable increase in the overall variability of authigenic P enrichment 1 School of Earth and Atmospheric Sciences, Georgia Institute of Technology, Atlanta, Georgia 30332, USA. 2 Department of Geology and Geophysics, Yale University, New Haven, Connecticut 06511, USA. 3 Department of Geosciences, Virginia Tech, Blacksburg, Virginia 24061, USA. 4 Center for Earth Surface System Dynamics, University of Tokyo, Kashiwanoha 277-8561, Japan. 5 Department of Earth and Atmospheric Sciences, University of Alberta, Edmonton, Alberta T6G 2E3, Canada. 6 Department of Earth Science, University of California, Riverside, California 92521, USA. 7 Division of Geological and Planetary Sciences, California Institute of Technology, Pasadena, California 91125, USA. 8 State Key Laboratory of Petroleum Resources and Prospecting, China University of Petroleum, Beijing 102249, China. *These authors contributed equally to this work. © 2017 Macmillan Publishers Limited, part of Springer Nature. All rights reserved.
Transcript of Evolution of the global phosphorus...

3 8 6 | N A T U R E | V O L 5 4 1 | 1 9 J A N U A R Y 2 0 1 7
LETTERdoi:10.1038/nature20772
Evolution of the global phosphorus cycleChristopher T. Reinhard1*, Noah J. Planavsky2*, Benjamin C. Gill3, Kazumi Ozaki1,4, Leslie J. Robbins5, Timothy W. Lyons6, Woodward W. Fischer7, Chunjiang Wang8, Devon B. Cole2 & Kurt O. Konhauser5
The macronutrient phosphorus is thought to limit primary productivity in the oceans on geological timescales1. Although there has been a sustained effort to reconstruct the dynamics of the phosphorus cycle over the past 3.5 billion years2–5, it remains uncertain whether phosphorus limitation persisted throughout Earth’s history and therefore whether the phosphorus cycle has consistently modulated biospheric productivity and ocean–atmosphere oxygen levels over time. Here we present a compilation of phosphorus abundances in marine sedimentary rocks spanning the past 3.5 billion years. We find evidence for relatively low authigenic phosphorus burial in shallow marine environments until about 800 to 700 million years ago. Our interpretation of the database leads us to propose that limited marginal phosphorus burial before that time was linked to phosphorus biolimitation, resulting in elemental stoichiometries in primary producers that diverged strongly from the Redfield ratio (the atomic ratio of carbon, nitrogen and phosphorus found in phytoplankton). We place our phosphorus record in a quantitative biogeochemical model framework and find that a combination of enhanced phosphorus scavenging in anoxic, iron-rich oceans6,7 and a nutrient-based bistability in atmospheric oxygen levels could have resulted in a stable low-oxygen world. The combination of these factors may explain the protracted oxygenation of Earth’s surface over the last 3.5 billion years of Earth history8. However, our analysis also suggests that a fundamental shift in the phosphorus cycle may have occurred during the late Proterozoic eon (between 800 and 635 million years ago), coincident with a previously inferred shift in marine redox states9, severe perturbations to Earth’s climate system10, and the emergence of animals11,12.
Phosphorus (P) has only one stable isotope, making it impossible to track mass fluxes directly with traditional isotope mass balance approaches. Inverting for P budgets, therefore, relies heavily on the development of techniques for estimating ancient seawater phosphate concentrations and P burial fluxes2. With the goal of tracking the secular evolution of marginal marine P burial—the largest sink in the modern P cycle13—we present a compilation of new and published geochemical data from fine-grained siliciclastic sedimentary rocks (referred to here as ‘shales’; see Supplementary Table 1). The marine shale record is a particularly useful archive for constraining element budgets within the oceans because this lithology is ubiqui-tous in the stratigraphic record and, taken in aggregate, records the large-scale sediment geochemistry of marine continental margin environments14. Indeed, the chemical composition of shales has long been used to diagnose element fluxes at Earth’s surface through time15.
Our data set was compiled from published literature (n > 15,000 shale samples) and supplemented with new analyses from Precambrian successions. We were intentionally broad in our sample filters, selecting
a subset of samples that contain 1% or greater aluminium (by weight), a reliable proxy for the detrital mineral contents that are typical of this rock type. This very basic requirement ensures that the samples have a relatively large siliciclastic contribution. We note that it also allows for the inclusion of a diverse set of samples—thus capturing a wide range of marginal marine depositional environments. The intent is to compare all available P data from typical continental margin sediments and epicontinental seaways (excluding dominantly chemical sedimen-tary rocks and quartz sandstones). Abyssal marine sediments are not explicitly excluded from our database but are very rare in sedimentary sequences older than Cretaceous in age, that is, more than 150 million years old. The final filtered data set for marginal marine siliciclastics yields P data from 7,970 individual samples spanning Earth’s history (see Supplementary Table 1), and we focus here on bulk P content with the aim of tracking broad changes in bulk authigenic P burial in marginal marine sediments (principally fluorapatite (CFA), iron- oxide-bound P and organic P) through time.
The most striking first-order trend observed in the data (Fig. 1) is a large increase in the variability and overall mean P content of shales from the Cryogenian period (720–635 Myr ago), the Ediacaran period (635–541 Myr ago) and the Phanerozoic eon (541–0 Myr ago) relative to those deposited during earlier Precambrian time. The average P content of post-Tonian (less than 720 Myr old) samples is over a factor of four greater than that of pre-Cryogenian samples—0.209 ± 0.023 wt% versus 0.051 ± 0.003 wt% (±2 standard errors)—with the difference in mean values being very unlikely to have emerged from a continuous underlying distribution with the same mean P content (P < 0.001, α = 0.01, unpaired Student’s t-test). Importantly, this pattern is inde-pendent of bulk organic carbon content, the mean of which is not significantly different between the two sample sets (P = 0.106, α = 0.01). The decoupling of bulk P content from organic carbon indicates that organic matter flux to the sediment column, though an important factor for local authigenic P enrichment, did not exert first-order control over the temporal shift we observe (Extended Data Fig. 1). The observed increase in mean bulk P content is clearly captured in frequency distributions of data binned coarsely by age and remains a robust feature during bootstrap resampling (Fig. 1c).
Simply put, marginal marine sedimentary rocks that are strongly enriched in authigenic P are exceptionally rare throughout most of Precambrian time, but are common in Phanerozoic sedimentary sequences. This observation is consistent with the previously noted dearth of Precambrian phosphorites (Fig. 1a; ref. 16), with a notable exception in the Palaeoproterozoic era that is potentially linked to an inferred transient rise in surface oxygen levels17–19. There are no reported Archean sedimentary phosphorites, and phosphorites are stratigraphically limited and not found in typical continental mar-gin successions during the Mesoproterozoic17. In addition, there is a notable increase in the overall variability of authigenic P enrichment
1School of Earth and Atmospheric Sciences, Georgia Institute of Technology, Atlanta, Georgia 30332, USA. 2Department of Geology and Geophysics, Yale University, New Haven, Connecticut 06511, USA. 3Department of Geosciences, Virginia Tech, Blacksburg, Virginia 24061, USA. 4Center for Earth Surface System Dynamics, University of Tokyo, Kashiwanoha 277-8561, Japan. 5Department of Earth and Atmospheric Sciences, University of Alberta, Edmonton, Alberta T6G 2E3, Canada. 6Department of Earth Science, University of California, Riverside, California 92521, USA. 7Division of Geological and Planetary Sciences, California Institute of Technology, Pasadena, California 91125, USA. 8State Key Laboratory of Petroleum Resources and Prospecting, China University of Petroleum, Beijing 102249, China.*These authors contributed equally to this work.
© 2017 Macmillan Publishers Limited, part of Springer Nature. All rights reserved.

1 9 J A N U A R Y 2 0 1 7 | V O L 5 4 1 | N A T U R E | 3 8 7
LETTER RESEARCH
in siliciclastic sedimentary rocks during and after Cryogenian time (Fig. 1c). We interpret this variation, as well as much of the sample- to-sample variability for any given time interval within our database, as the natural outcome of a shift from predominantly detrital P in marginal siliciclastic sediments to a large (and often locally variable) authigenic component.
Although oxygen levels in bottom waters and surface sediment pore waters can have an important role in the local efficiency of P burial in siliciclastic sediments (see, for example, ref. 20), enrichment of P in Phanerozoic shales, on average, does not appear to be governed entirely by local redox controls. For example, anoxic sedimentary rocks of Phanerozoic age in our database contain much more P than their Precambrian counterparts, and this observation is supported through a range of oxic/anoxic sampling filters based on redox-sensitive trace- element content (Fig. 1d; see Methods). Thus, after controlling for local depositional redox we still observe a noticeable difference in overall P enrichment between similar Precambrian and Phanerozoic systems (Extended Data Figs 2–4). Second, we find no empirical evidence for more effective P sequestration in oxic depositional environments during Phanerozoic time relative to anoxic Phanerozoic settings or their Precambrian counterparts (Fig. 1d). Indeed, many independently established anoxic Phanerozoic shales also have very high amounts of P, while the vast majority of Precambrian samples (>95%) fall within the expected range of the detrital P content of modern marine sediments and average upper continental crust21 despite broadly equiva lent organic carbon contents.
We suggest that this shift in the style of P burial in shallow marine sediments was controlled predominantly by evolving ocean redox and its effect on surface P levels. Data generated over the last decade has led to the idea that ferruginous (anoxic and Fe-rich) conditions have dom-inated the ocean interior for much of Earth’s history6,7,22. This Fe-rich deep marine redox state would have led to the effective scavenging and removal of bioavailable P from the surface ocean (that is, a deep-sea P trap) through a combination of mechanisms including formation of ferrous phosphate phases (such as vivianite)23, removal during the formation of carbonated/sulfated green rust species24, and possibly co-precipitation with ferric iron oxides2,5. In addition, the oxygenic photosynthetic biosphere has been dominated by cyanobacteria for the vast majority of Earth’s history25, and under conditions of nutrient P scarcity these organisms can display extremely high ratios of carbon (C) to P26.
We therefore hypothesize that pervasively ferruginous oceans would have caused severe surface water P limitation, which in turn would have driven increases in the C/P ratio of primary producers (Extended Data
Fig. 5). Because the burial of authigenic P in shallow marine sediments is tightly linked to the rapid transfer of organic P to a dissolved phase in sedimentary pore fluids during organic matter remineralization27–29, these combined effects would be expected to dramatically alter the burial fluxes of P from the shallow ocean. In other words, the down-stream processing and delivery of initially high-C/P organic matter to marine sediments would inhibit authigenic P burial in marginal marine settings even at relatively high organic matter fluxes, a view of secular P-cycle evolution that is broadly consistent with previously proposed models based on iron-rich chemical sediments4,5,15. While the iron oxide record most probably tracks changes in the overall size of the marine P reservoir (see Methods), we propose that the marine sediment database presented here serves directly as a proxy for the effectiveness of the marginal marine authigenic P sink and indirectly as a proxy for the major-element stoichiometry of the marine biosphere and P stress in the surface ocean.
To explore the combined effects of mineral P scavenging and dynamic C/P stoichiometry of marine biomass we used an ocean- sediment biogeochemical cycle model (CANOPS30), modified here to incorporate two critical components of our conceptual framework. First, we allowed for dynamic C/P stoichiometry for primary producers in response to varying marine nutrient levels (Extended Data Fig. 6). Second, we specified a redox-dependent net scavenging/burial of P in the ocean interior in order to examine the effect of ferruginous (anoxic and Fe-rich) conditions6,7,22 on P cycling (Extended Data Figs 7 and 8). This model framework builds on previous treatments2,31, but is the first to explicitly represent the relationships between the stoichiom-etry of primary producers, Fe–P trapping in sedimentary basins, and their combined effects on the coupled P, C, nitrogen (N), and molecular oxygen (O2) cycles.
We performed a series of simulations in which we imposed the par-tial pressure of atmospheric oxygen p( )O2
as a boundary condition and used the model to diagnose the response(s) of the marine biosphere and the burial/weathering/metabolic fluxes required to achieve a stable coupled C–N–P–O2 cycle at steady state. Even with modest P scaveng-ing, our model predicts photic-zone P concentrations that are markedly depleted relative to modern values (Fig. 2a). This surface water limita-tion leads to photosynthetic C/P ratios that are substantially elevated (Fig. 2b), as predicted by our conceptual framework. It would also lead to inhibited sink switching of P within shallow marine sediments (such as through conversion of organic P to CFA).
We find that a redox-dependent P trap results in much lower organic carbon burial (and O2 production) for a given marine P inventory (Fig. 3a); this behaviour provides a simple mechanism for stabilizing
0.1 0.30.20.00.0
0.3
0.2
0.1
2,0000 1,000 3,000
Age (Myr)
log(
[P] (
wt%
))
–3.0
–2.0
–1.0
0.0
1.0b
[P] (wt%)0.0 0.2 0.4 0.6 0.8 1.0
0.4
0.6
0.8
1.0
f (no
rmal
ized
)
d[P]mean (wt%)
c
f (no
rmal
ized
)
Pho
spho
rite
occu
rren
ces 25
15
5
a
Figure 1 | P content of fine-grained, marine siliciclastic sedimentary rocks through time. a, Sedimentary phosphorite occurrences through time, as compiled in ref. 16. b, P concentrations through time for pre-Cryogenian (blue) and post-Tonian (red) samples. c, Frequency distributions of bootstrap resampled mean P concentrations (n = 10,000) for pre-Cryogenian (blue) and post-Tonian (red) samples. d, Cumulative
frequency distributions of P content for Precambrian (blue), oxic Phanerozoic (green), and anoxic Phanerozoic (red) siliciclastic sedimentary rocks. Shaded envelopes for the oxic and anoxic Phanerozoic samples denote a range of filters for local depositional redox (see Methods, Extended Data Figs 1–8 and Supplementary Table 1).
© 2017 Macmillan Publishers Limited, part of Springer Nature. All rights reserved.

3 8 8 | N A T U R E | V O L 5 4 1 | 1 9 J A N U A R Y 2 0 1 7
LETTERRESEARCH
atmospheric pO2 at values much lower than that of the modern Earth
despite reduced O2 consumption during weathering under low-O2 conditions23,32. However, this should not necessarily be taken to imply that ocean–atmosphere O2 levels were always strictly controlled by seawater P abundance. Indeed, we observed that the inclusion of a redox-dependent Fe–P trap gives rise to a nutrient-driven bistability in the O2 cycle. We suggest that this bistable behaviour arises from the interaction between the redox-dependent water column Fe–P trap and microbial N cycling within the ocean interior.
In a pervasively reducing ocean the Fe–P trap dominates Earth’s surface P cycle, greatly reducing overall nutrient P availability in the surface ocean. At the same time, oxygen-dependent fixed N loss through the microbial nitrification–denitrification cycle is minimized within the strongly reducing ocean interior because of muted microbial oxidation of ammonium (NH4
+). The ultimate result is an ocean system that accumulates NH4
+, making it more likely to be P-limited on long timescales (Fig. 3b).
In contrast, a strongly oxidizing ocean such as the modern ocean is characterized by an attenuated water-column Fe–P trap but more wide-spread continental-margin P burial through capture of initially organic- bound P within the sediment pile as oxides and CFA (Extended Data Fig. 8). At the same time, a pervasively oxygenated ocean allows for extensive microbial production of nitrate (NO3
−; nitrification) while inhibiting anaerobic microbial NO3
− consumption (denitrification). As a result, a large standing NO3
− reservoir can build up in the deep
sea31, with the ultimate consequence that biospheric productivity is likely to be limited by P on long timescales1.
However, there is a range of intermediate (weakly reducing) pO2 states, between about 0.1 to 0.4 times the present atmospheric level (PAL) in our baseline model (Fig. 3b), within which the rates of biospheric N2 fixation required to balance the coupled P–C–N–O2 cycle are markedly elevated (Fig. 3b). We hypothesize that this results from the combined effects of an inhibited deep-sea Fe–P trap and a microbial N cycle that supports widespread NO3
− production in surface environments but pervasive N loss through denitrification in the ocean interior. Under these conditions, it is possible that biospheric productivity and global O2 fluxes may be N-limited on long timescales.
In aggregate, these model calculations imply that P fluxes control biospheric productivity and O2 stability at very low or very high pO2 values, but transitions between the two states could be inhibited by the need for substantially elevated biospheric N-fixation rates at interme-diate pO2 states. As a result, transient variations in P input fluxes (due to changes in tectonic activity, for example) are unlikely to lead to large-scale shifts in organic carbon burial (and thus atmospheric O2) unless they are rather extreme, despite the system being intrinsically P-limited on long timescales. Although the model behaviour appears robust, defining the precise pO2
range over which these dynamics emerge will require more sophisticated representations of open-system Fe cycling than the current generation of Earth system models afford.
scav
0.01
[C/P
] bio
mas
s
b
0.1 1
50
150
250
350
450
400
Red�eld
300
200[P
O43–
] surf (μ
mol
kg–1
)
10–2 10–110–3
pO2 (atm)
a
0.1
0.2
0.3scav = 0
scav = 0.25
Figure 2 | Results from the global ocean-sediment biogeochemical model. a, Nutrient P concentrations within low-latitude surface waters as a function of steady-state atmospheric pO2
for model simulations with (solid red) and without (black dashed) redox-dependent P scavenging
(scavenging efficiency, σscav, set at 0.25). b, Biomass C/P ratios for primary producers in simulations with dynamic C/P stoichiometry as a function of net P scavenging efficiency. Each contour shows a different assumed maximum C/P ratio.
scav
0.0–20
–10
0
10
20
30
org
(Tm
ol C
yr–1
)Δ
0.1
1
10
J N/J
N0
400300
200
106
a b
0.2 0.4 0.6 0.8 1.0
0.5
0
0.01
0.25
0.1 10.01pO2
(PAL)
Figure 3 | Results from the global ocean-sediment biogeochemical model. a, Relative differences in organic carbon burial rate (∆org) between low-O2 (0.1% modern) and high-O2 (modern) experiments as a function of redox-dependent net P scavenging (σscav), with contours labelled according to the maximum possible C/P ratio of cyanobacterial biomass. Negative values indicate that globally integrated organic carbon burial
rates are lower in low-pO2 simulations than in high-pO2
simulations. b, Biospheric N fixation rates JN relative to the modern rate JN
0 as a function of steady-state atmospheric pO2
, with contours labelled according to relative net P scavenging efficiency. The open circle in b represents the modern Earth system.
© 2017 Macmillan Publishers Limited, part of Springer Nature. All rights reserved.

1 9 J A N U A R Y 2 0 1 7 | V O L 5 4 1 | N A T U R E | 3 8 9
LETTER RESEARCH
Theoretical predictions and observations from the geochemical record provide strong evidence that the first 80%–90% of Earth’s 4.5-billion-year history was characterized by limited P burial in near-shore sediments, a pattern that we link to high C/P ratios in primary producers resulting from an Fe-based nutrient P trap. The shale record we present here, when coupled with our ocean-sediment biogeochem-ical model, illuminates an Earth system state in which dynamically coupled P- and N-limitation stabilized surface oxygen levels on billion-year timescales23,32. However, there is evidence for at least periodic shifts away from pervasive Fe-rich waters in the late Tonian, or Ediacaran periods6–8,22,33, coincident with our observed increase in sedimentary P enrichments. We propose that models seeking to explain the transition to an oxygen-rich ocean–atmosphere system in which early animals thrived and complex ecosystems developed should focus on mechanisms for overcoming enhanced P scavenging and transit-ing the N-fixation barrier that would act to prevent P-driven increases in ocean–atmosphere O2 levels during nascent global oxygenation events.
Online Content Methods, along with any additional Extended Data display items and Source Data, are available in the online version of the paper; references unique to these sections appear only in the online paper.
Received 14 December 2015; accepted 1 November 2016.
Published online 21 December 2016.
1. Tyrrell, T. The relative influences of nitrogen and phosphorus on oceanic primary production. Nature 400, 525–531 (1999).
2. Bjerrum, C. J. & Canfield, D. E. Ocean productivity before about 1.9 Ga ago limited by phosphorus adsorption onto iron oxides. Nature 417, 159–162 (2002).
3. Konhauser, K. O., Lalonde, S. V., Amskold, L. & Holland, H. D. Was there really an Archean phosphate crisis? Science 315, 1234 (2007).
4. Planavsky, N. et al. The evolution of the marine phosphate reservoir. Nature 467, 1088–1090 (2010).
5. Jones, C., Nomosatryo, S., Crowe, S. A., Bjerrum, C. J. & Canfield, D. E. Iron oxides, divalent cations, silica, and the early earth phosphorus crisis. Geology 43, 135–138 (2015).
6. Poulton, S. W. & Canfield, D. E. Ferruginous conditions: a dominant feature of the ocean through Earth’s history. Elements 7, 107–112 (2011).
7. Planavsky, N. J. et al. Widespread iron-rich conditions in the mid-Proterozoic ocean. Nature 477, 448–451 (2011).
8. Lyons, T. W., Reinhard, C. T. & Planavsky, N. J. The rise of oxygen in Earth’s early ocean and atmosphere. Nature 506, 307–315 (2014).
9. Shields-Zhou, G. & Och, L. The case for a Neoproterozoic oxygenation event: geochemical evidence and biological consequences. GSA Today 21, 4–11 (2011).
10. Hoffman, P. F. & Schrag, D. P. The Snowball Earth hypothesis: testing the limits of global change. Terra Nova 14, 129–155 (2002).
11. Erwin, D. H. et al. The Cambrian conundrum: early divergence and later ecological success in the early history of animals. Science 334, 1091–1097 (2011).
12. Love, G. D. et al. Fossil steroids record the appearance of Demospongiae during the Cryogenian period. Nature 457, 718–721 (2009).
13. Ruttenberg, K. C. in Treatise on Geochemistry Vol. 8 (eds Holland, H. D. & Turekian, K. K.) 585–643 (Elsevier, 2003).
14. Taylor, R. & McLennan, S. M. The Continental Crust: its Composition and Evolution (Blackwell Science Publishing, 1985).
15. Holland, H. D. The Chemical Evolution of the Atmosphere and Ocean (Princeton Univ. Press, 1984).
16. Planavsky, N. J. The elements of marine life. Nat. Geosci. 7, 855–856 (2014).
17. Holland, H. D. Sedimentary mineral deposits and evolution of Earth’s near surface environments. Econ. Geol. 100, 1489–1509 (2005).
18. Partin, C. A. et al. Large-scale fluctuations in Precambrian atmospheric and oceanic oxygen levels from the record of U in shales. Earth Planet. Sci. Lett. 369–370, 284–293 (2013).
19. Lepland, A. et al. Potential influence of sulphur bacteria on Palaeoproterozoic phosphogenesis. Nat. Geosci. 7, 20–24 (2013).
20. Ingall, E. D. & Jahnke, R. Evidence for enhanced phosphorus regeneration from marine sediments overlain by oxygen depleted waters. Geochim. Cosmochim. Acta 58, 2571–2575 (1994).
21. Rudnick, R. L. & Gao, S. in Treatise on Geochemistry Vol. 3 (eds Holland, H. D. & Turekian, K. K.) 1–64 (Elsevier, 2003).
22. Sperling, E. A. et al. Statistical analysis of iron geochemical data suggests limited late Proterozoic oxygenation. Nature 523, 451–454 (2015).
23. Derry, L. A. Causes and consequences of mid-Proterozoic anoxia. Geophys. Res. Lett. 42, 8538–8546 (2015).
24. Zegeye, A. et al. Green rust formation controls nutrient availability in a ferruginous water column. Geology 40, 599–602 (2012).
25. Knoll, A. H. Paleobiological perspectives on early eukaryotic evolution. Cold Spring Harb. Perspect. Biol. 8, http://dx.doi.org/10.1101/cshperspect.a016121 (2014).
26. White, A. E., Spitz, Y. H., Karl, D. M. & Letelier, R. M. Flexible elemental stoichiomtery in Trichodesmium spp. and its ecological implications. Limnol. Oceanogr. 51, 1777–1790 (2006).
27. Frolich, P. N. et al. Pore water fluoride in Peru continental margin sediments: uptake from seawater. Geochim. Cosmochim. Acta 47, 1605–1612 (1983).
28. Jahnke, R. A., Emerson, S. R., Roe, K. K. & Burnett, W. C. The present-day formation of apatite in Mexican continental-margin sediments. Geochim. Cosmochim. Acta 47, 259–266 (1983).
29. Ruttenberg, K. C. Reassessment of the oceanic residence time of phosphorus. Chem. Geol. 107, 405–409 (1993).
30. Ozaki, K. & Tajika, E. Biogeochemical effects of atmospheric oxygen concentration, phosphorus weathering, and sea-level stand on oceanic redox chemistry: implications for greenhouse climates. Earth Planet. Sci. Lett. 373, 129–139 (2013).
31. Fennel, K., Follows, M. & Falkowski, P. G. The co-evolution of the nitrogen, carbon and oxygen cycles in the Proterozoic ocean. Am. J. Sci. 305, 526–545 (2005).
32. Laakso, T. A. & Schrag, D. P. Regulation of atmospheric oxygen during the Proterozoic. Earth Planet. Sci. Lett. 388, 81–91 (2014).
33. Reinhard, C. T. et al. Proterozoic ocean redox and biogeochemical stasis. Proc. Natl Acad. Sci. USA 110, 5357–5362 (2013).
Supplementary Information is available in the online version of the paper.
Acknowledgements This research was supported by funds from from NSF-EAR and the NASA Astrobiology Institute. C.T.R. acknowledges support from the Alfred P. Sloan Foundation. K.O. acknowledges support from JSPS KAKENHI.
Author Contributions C.T.R., N.J.P. and B.C.G. designed the research. N.J.P., B.C.G., D.B.C. and C.W. generated new analytical data. C.T.R., N.J.P., B.C.G., L.J.R. and D.B.C. compiled and analysed the database. C.T.R., N.J.P. and K.O. designed the biogeochemical model. K.O. wrote code and performed model simulations. All authors contributed to data interpretation and the writing of the manuscript.
Author Information Reprints and permissions information is available at www.nature.com/reprints. The authors declare no competing financial interests. Readers are welcome to comment on the online version of the paper. Correspondence and requests for materials should be addressed to C.T.R. ([email protected]) and N.J.P. ([email protected]).
Reviewer Information Nature thanks S. Crowe and the other anonymous reviewer(s) for their contribution to the peer review of this work.
© 2017 Macmillan Publishers Limited, part of Springer Nature. All rights reserved.
LETTERRESEARCH
METHODSOverview of the modern P cycle. As a context for exploring the evolution of marine P burial and the P cycle through time it is useful to consider certain aspects of the modern P cycle. However, because there have been several relatively recent reviews of the global P cycle13,34,35 we provide only a brief overview here. The modern reactive P flux to the oceans, sourced primarily by rivers, is estimated to be approximately (2–3) × 1011 mol yr−1 (ref. 1). The vast majority of P in rivers is present as a solid phase; according to most estimates >90% of the P delivered by rivers to the ocean is in particulate form13,36. Atmospheric P sources are thought to be a relatively small flux on a global scale, although aerosol and dust deposi-tion can sometimes provide a non-trivial P source to open-ocean ecosystems37. Groundwater entering the ocean may also be an important source of phosphate to the ocean, but this flux is currently poorly constrained13.
Both positive and negative deviations from conservative mixing occur in estu-aries, with flocculation driving P uptake and desorption linked to shifts in salinity and pH driving P release38,39. Roughly 20%–50% of both particulate and dissolved P in modern fluvial systems is organic40, though this fraction would have been much less important before the development of extensive terrestrial ecosystems. In many catchments iron-oxide-bound P may constitute a large portion of the par-ticulate P pool and oxide precipitation may sometimes play a key part in regulating dissolved riverine P levels (for example, ref. 4).
Global marine P burial fluxes have been estimated to be approximately (2–3) × 1011 mol yr−1 (ref. 1), with marine shelf environments shallower than 200 m probably accounting for approximately half of global marine P burial34,41. Even using conservative estimates, these shallow-water sedimentary environments have P accumulation rates that are around 50 times higher than less-productive, open-ocean settings34,41,42. Burial of authigenic CFA is the largest single burial flux of P in the modern oceans—accounting for at least half of all reactive P burial13,34,41–44. Organic P, iron-oxide-bound P, and phosphate adsorbed on mineral surfaces, listed in decreasing order of importance, account for the remaining marine P burial flux13,34. The best current estimate for the residence time of P in the oceans is about 12,000–17,000 kyr—much less than that proposed before the recognition of widespread authigenic CFA burial in ‘typical’ marine sediments44.Lithological and sampling controls on sedimentary P enrichment. New P and Al data were generated for this study in either the Biogeochemistry Laboratory at the University of California, Riverside, or the Metal Geochemistry Center at Yale University using inductively coupled plasma mass spectrometry (ICP-MS) follow-ing previously described methods45,46. Error was less than 5% based on duplicate measurements of USGS geostandards. A wide range of analytical methods were used to generate the legacy data within the database. Although data quality varies between different studies, error in the majority of the legacy data has been esti-mated to be less than about 10% (ref. 15).
A statistical framework is a crucial component of using large geochemical databases to diagnose secular trends in Earth surface environments (for example, ref. 16). However, regardless of database size and statistical significance, overall trends observed in geochemical databases will in some cases be strongly controlled by upstream biases associated with sampling and analytical focus. For example, the vast majority of legacy data for iron (Fe) speciation and redox-sensitive trace elements have been obtained from organic-rich black shales7,18,33,47–49. For some applications, this bias can be useful—indeed, in certain cases, this would be more accurately viewed as a ‘filter’ than a ‘bias’. For example, attempts to diagnose broader oceanic redox state by analysis of environments in which redox- sensitive trace-element sequestration should be most effective33,47 require that data be derived from organic-rich, reducing sediments with similar background depositional redox.
In this case, we have intentionally used relatively broad sample filters in this study in order to avoid any facies-based sampling bias beyond our primary target of marginal siliciclastic depositional settings. To this end, our original database was designed simply to include all siliciclastic marine sediments and sedimentary rocks, with the exception of coarse-grained quartz sandstones. Samples with less than 1 wt% total Al (about 2 wt% Al2O3) were then removed. Conceptually, our aim was to focus on relatively fine-grained siliciclastic marine sediments and sed-imentary rocks from marginal marine settings across an inclusive range of depo-sitional rates and environmental conditions. Further, we have avoided coals and successions with clear evidence for late-stage P mobility (for example, P-rich veins that crosscut sedimentary lamination), excluding several Mesozoic and Cenozoic units and some Palaeoproterozoic units. The Palaeoproterozoic data in particular is intriguing, as this is an interval that has been previously linked to an oxygenation event, potentially providing additional support for our proposed link between the P and O2 cycles (see main text). However, it is difficult to justify any assertion that these rocks are representative of typical marine sediments. This basic screening does not imply that no samples in our database have been affected by later-stage
P mobility, as lithological descriptions or images of the samples are not provided in many of the used studies. However, diagenesis is a process that should act across the entire geologic record so it is unclear to us how a diagenetic process could be the principal forcing mechanism for the observed temporal trend in P enrichments. The resulting database is given in Supplementary Table 1. The cross-section of environments analysed here can provide broad insight to the large-scale sediment geochemistry of continental margin environments.
It is not immediately clear how a bias in the depositional environments sampled by our database would lead to a spurious secular change in authigenic P burial in marginal siliciclastics during Cryogenian time. Analysis of P content is performed as a basic component of most geochemical studies, in contrast to more specialized analyses such as those employed in the reconstruction of local depositional redox, or TOC, typically performed on TOC-rich rocks. As a result, there is a large amount of data on the P content of otherwise unremarkable siliciclastic sediments and sedimentary rocks, making it very unlikely that the secular shift we observe is driven by any kind of sampling bias that is conceptually relevant for our purposes.
That said, we expect that there will be some differences in the degree and type of diagenetic recycling of P related to sedimentation rate, the redox state of local bottom waters, and pore fluid mineral saturation states (see below). Indeed, we interpret much of the sample-to-sample variability at any given time in our data-base, as well as the notable increase in the dispersion around bootstrap resampled mean P content observed during Phanerozoic time, to be related to variation in these factors. We therefore reanalysed our database after filtering samples for deposition under oxic and anoxic conditions using independent redox-sensitive trace-element systematics50–53.
Because of oceanic reservoir dynamics33,54 and inherent asymmetries in the application of Fe-based palaeoredox proxies55 it is very difficult to diagnose oxic deposition in Precambrian siliciclastic sedimentary rocks with confidence. We thus focus here on Phanerozoic systems that can be confidently filtered according to oxic and anoxic deposition, and compare these filtered data to siliciclastic sedimen-tary rocks deposited during Precambrian time—the vast majority of which would probably have been deposited in anoxic systems6,7. We employed three separate filters to subsample the Phanerozoic data, with all three schemes producing similar results (Extended Data Figs 2–4).
For molybdenum (Mo), anoxic deposition was defined as [Mo] > 50 parts per million (p.p.m.), while oxic conditions were defined as [Mo] < 25 p.p.m. (ref. 50). For V, anoxic settings were defined according to [V] > 300 p.p.m., while oxic dep-osition was defined as [V] < 100 p.p.m. This cutoff for oxic settings is conservative, and is similar to the likely mean detrital contribution given an average [V] of the upper continental crust of 97 p.p.m. (ref. 56). The chemistry of the detrital V load has the potential to vary greatly. However, we suggest that this value is a reasonable choice, especially when compared with samples that are only diagnosed as anoxic if enriched by over a factor of three relative to this value. The final filtering method was based on U, whereby samples with [U] > 10 p.p.m. were classified as anoxic and samples with [U] < 10 p.p.m. were considered oxic. For reference, average sediment concentrations of U in the anoxic and sulfidic (euxinic) Cariaco basin in Venezuela are about 14 p.p.m. (ref. 57). Additionally, because reduction of U occurs primarily in the sediment column and is not directly linked to cycling of Fe and Mn in the water column57–60, authigenic enrichments can be highly variable.
Reanalysis of our database using a range of accessory filters for local deposi-tional redox provides no evidence for an overriding redox control on the temporal patterns we observe (Extended Data Figs 2–4). In fact, we find that the highest P contents are most likely to be observed in anoxic Phanerozoic siliciclastic sedi-mentary rocks (Fig. 1c; Extended Data Figs 2–4), and that both oxic and anoxic Phanerozoic samples contain more P than Precambrian depositional systems in terms of average content, highest observed P concentration, and overall variability. Thus, it is critical to acknowledge the importance of diagenetic recycling in many environments, and emphasize that a broad suite of factors will ultimately regulate the burial of authigenic P in a given marine sediment (see below). However, we find strong evidence that these differences are not the dominant factor controlling the temporal patterns we observe in our database. These differences hold regardless of subsampling protocol, indicating that the temporal pattern we observe is robust and is not related to first-order changes in local depositional redox conditions.Controls on sedimentary CFA formation. The largest single removal flux of P from the modern marine system is the burial of authigenic CFA in marine sediments (see above), the vast majority of which on the modern Earth occurs in shallow, marginal marine sediments. We argue that our geochemical record directly tracks a secular change in the relative effectiveness of this major P burial sink through time (Extended Data Fig. 5). Our conceptual model is based on the notion that decreased dissolved PO4
3− availability in the surface ocean on a planet in which marine primary production is dominated by cyanobacteria will lead to unusually high C/P ratios of primary producer biomass, and that this, combined
© 2017 Macmillan Publishers Limited, part of Springer Nature. All rights reserved.
LETTER RESEARCH
with an overall decrease in dissolved PO43− abundance in seawater, will severely
curtail CFA burial in marginal marine sediments. However, it is important to con-sider alternative mechanisms for ‘sink-switching’ marine P burial fluxes due to inhibited CFA formation that are not linked to the elemental stoichiometry of marine biomass. We note also that our conceptual model implies the subduction of P buried in the deep sea, similar to P buried with modern oceanic crust but removed via a range of alternative scavenging mechanisms.
There is a wide range of factors that can influence the formation of CFA in marine sedimentary environments. In particular, the CFA saturation state of sed-imentary pore fluids is affected by carbonate chemistry. Carbonate ion substitution into CFA scales with ambient carbonate ion activity and increases the solubility of CFA61. This substitution into the fluorapatite structure, therefore—somewhat counterintuitively—results in an increase in the level of dissolved P needed for CFA precipitation61. In addition, inorganic dissolved P speciation is controlled by pore fluid pH. As a result, changes in CFA phase solubility may be important when considering secular evolution of the P cycle given that sedimentary pore water carbonate ion concentrations may have changed over time in concert with changes in marine carbonate saturation state62–66. These changes could have correspondingly raised or lowered the concentration of pore water P required for CFA formation. However, carbonate chemistry and pH in pore waters in conti-nental margin sediments will be largely decoupled from ambient (bottom water) carbonate chemistry67.
The saturation state of pore waters may have also undergone changes coinciding with changes in the amount of aerobic versus anaerobic organic-matter reminer-alization in marine settings68. In the Precambrian the ratio of anaerobic/aerobic remineralization in the sediment column would be higher than in the Phanerozoic, potentially resulting in higher average pore water carbonate ion concentrations (and thus higher CFA solubility). However, it is important to note that sulphate reduction often induces a drop in carbonate saturation state because of sulphide production69, and that the net effect of anaerobic metabolism on the pore fluid car-bonate system will thus often depend strongly on reactive iron availability. Further, increases in pore water pH driven by anaerobic remineralization of organic matter may promote CFA supersaturation through their effect on dissolved inorganic P speciation.
Given the considerations discussed above, pore fluid carbonate chemistry is expected to be highly variable in shallow marine sediments, and thus the factors regulating CFA phase solubility will vary locally over a very wide range across sedimentary environments on the continental margin. Indeed, some of the sample-to-sample variability at any given time within our database may well be attributable to local variation in these and other factors. However, it is very unlikely that variations in parameters of the local depositional environment are capable of explaining a pronounced, systematic shift in the efficiency of CFA formation through time across the spectrum of marginal marine environments represented by our database.Estimates of marine phosphate concentrations from iron-rich sedimentary rocks. The geologic record of P/Fe ratios in iron-oxide-rich rocks (P/Feox) has had a key role in shaping our view of the evolution of the marine P reservoir and, in particular, marine phosphate concentrations2. Therefore, it is important to explore whether our presented shale P record is consistent with insights provided by P/Feox records. The basis for using P/Fe ratios in iron-oxide-rich rocks to track phosphate levels comes from a sound understanding of the mechanics of P scavenging in modern hydrothermal systems, in which there is a strong correlation between ambient phosphate levels and the P/Fe ratio of hydrothermal plume particles70. During diagenesis there may be P sink switching (P moving from oxide-sorbed to other authigenic mineral phases) but P/Fe ratios, at least in certain cases, appear to be relatively unaffected by this process71. However, the extent of phosphate sorption is strongly affected by the presence of other dissolved species whose concentrations may have changed dramatically through Earth’s history—complicating efforts to use P/Fe ratios to provide a new view of the secular evolution of the marine P reservoir. In particular, the extent of phosphate sorption is strongly dependent upon dissolved silica (Si) concentrations3,4, but this inhibitory effect of Si has, in turn, been suggested to be strongly dependent on ambient magnesium and calcium concentrations5. The central uncertainty associated with this approach is related to the lack of well-constrained marine concentrations for dissolved calcium, magnesium or Si through the majority of Earth’s history.
The long-term geologic record of P/Feox ratios can be divided into four intervals2,4: (1) the Archean and early Proterozoic; (2) the Cryogenian (3) the early to middle Phanerozoic; and (4) the late Phanerozoic. Although P/Fe ratios display variability through each of these intervals, each interval is also characterized by distinct averages. The Archean–Proterozoic and early Phanerozoic yield average molar P/Fe ratios between 0.1 and 1, well below Cryogenian and late Phanerozoic ratios (averages between 1 and 3). This trend in P/Feox ratios seems at first
counterintuitive, but can be explained by shifts in marine P and Si levels. The late Phanerozoic increase can be linked to a drop in marine Si levels caused by the radiation of diatoms. Marine Si concentrations were higher than the modern value until the marine silicon cycle become biologically controlled—with decreased seawater Si concentrations probably linked to the radiation of diatoms, as well as heterotrophic siliceous organisms (sponges and radiolarians).
Elevated Cryogenian P/Feox ratios, despite high marine Si levels, are probably linked to a large marine phosphate reservoir. However, new age and geologic constraints72,73 suggest that globally distributed Cryogenian iron formations (the only source of the P/Feox ratios) were probably deposited synchronously and formed within or during the terminal stages of the Sturtian Snowball Earth glacial event about 720 million years ago. In this light, the Cryogenian P/Feox ratios reflect conditions specific to Snowball Earth events, instead of an extended interval of elevated marine phosphate levels, as previously proposed4. In contrast, low Archean and early Proterozoic P/Feox ratios probably reflect high marine silicon concentrations and near-modern or lower-than-modern marine phosphate levels, depending on how much the cation composition affected phosphate sorption5.
Further, it is also important to bear in mind that Archean and early Proterozoic P/Feox ratios probably reflect sub-chemocline phosphate levels—not surface phosphate concentrations. Much of the Phanerozoic P/Feox data comes from hydrothermal deposits where phosphate was scavenged from oxic waters, in strong contrast to the Precambrian record. Indeed, enhanced P scavenging near the chemocline can result in extremely low surface-water phosphate concentrations and moderate bottom-water phosphate concentrations, which is consistent with the upper end of Archean P/Feox ratios. Seen in this light, the iron oxide record tracks the evolution of the deep-water marine P reservoir, whereas the shale record tracks the dynamics of marginal marine authigenic P burial, which is strongly affected by surface-water phosphate levels and the corresponding major-element stoichiometry of the marine biosphere. Lastly, as noted above, marine Si concentrations were probably higher in the Archean and early Proterozoic than in the early Phanerozoic. In sum, P/Feox ratios provide a qualitative view of marine phosphate evolution that is generally consistent with the conclusions reached from the shale record presented here.Biogeochemical modelling. We use a one-dimensional ocean-sediment trans-port-reaction model30 to examine the impact of P scarcity due to P scavenging in a ferruginous ocean (Extended Data Fig. 5). The CANOPS model includes a range of ocean-sediment processes, both physical (ocean overturning circulation, vertical diffusion, and horizontal water exchange) and biogeochemical (export produc-tion, respiration, sedimentation and burial of organic matter, and several redox reactions in aerobic and anaerobic environments). The basic model configuration and physical properties are presented in ref. 50. Dissolved inorganic carbon (DIC), total alkalinity (ALK), oxygen (O2), phosphate (PO4
3−), nitrate (NO3−), ammo-
nium (NH4+), sulphate (SO4
2−), and total sulphide (∑H2S) are considered to be dissolved tracers. The model’s biogeochemical scheme is based on the cycling of a primary limiting nutrient (phosphate), which controls the extent of biological pro-ductivity in the surface ocean. It is assumed that any N depletion is compensated by N fixation from the atmosphere, but fixation rates are explicitly calculated. This does not amount to any implicit assumption that the N-fixation capacity of Earth’s biosphere is limitless—rather, it allows a simple approach towards diagnosing the biological N-fixation fluxes required to balance the coupled C–N–P–O2 cycle at steady state without the need to specify any additional free parameters required to ‘cap’ globally integrated rates of N2 fixation. Further details and discussion of the general modelling approach can be found in ref. 50.
We have modified the original CANOPS model to explicitly include two crucial components of the deep-time P cycle that have previously been largely neglected in large-scale quantitative models. First, we specify a redox-dependent net scaveng-ing/burial of P in the ocean interior, which arises from recent work demonstrating that ferruginous (anoxic and Fe-rich) conditions have dominated the ocean interior for much of Earth’s history6,7,22,74. This deep marine redox state would have led to the effective scavenging and burial of bioavailable P through a combination of mechanisms, including co-precipitation with iron oxides2,5, formation of iron phos-phate phases23, and removal during the formation of carbonated/sulfated green rust species24,75, any of which could result in an effective deep-sea P sink. Second, we allow the C/P stoichiometry of primary producers to respond dynamically to varying marine nutrient levels. This framework builds on previous treatments2,31, but is designed to explore the dynamics of oceanic Fe–P trapping on a planet dominated by cyanobacterial photosynthesis and resulting effects on the coupled P, C, N and O2 cycles.
We assume that when the ocean interior just below the photic zone becomes anoxic ([O2]z = 150 m < 1 μM) there is a net scavenging flux of P from the surface ocean J( )P
scav that is proportional to the upward flux of phosphate to the photic zone J( )P
up scaled by a fractional scavenging efficiency (escav) (for example,
© 2017 Macmillan Publishers Limited, part of Springer Nature. All rights reserved.

LETTERRESEARCH
=J e JPscav
scav Pup). The upward flux of phosphate to the photic zone is expressed as
the sum of fluxes due to advection (upwelling) and turbulent diffusion, yielding the aggregate scavenging flux as follows:
=
⋅ + ⋅
∂∂
−=
−
=
J e w Kz
[PO ][PO ]
(1)z h v
z hPscav
scav 43 4
3
m
m
where w and Kv are upwelling velocity and turbulent diffusivity beneath the photic zone, respectively, and hm is the photic zone depth. The scavenged P is removed from the system and is presumed to be deposited as an authigenic phase within the ocean interior. Rather than attempt to parameterize coupled P–Fe recycling, we specify escav as a constant in each simulation and use it as a principal sensitivity parameter for our experiments. Though there are good a priori reasons to expect that scavenged P would be removed efficiently in association with a wide range of phases (see above), we consider that a more explicit parameterization of the coupled Fe–P cycle would be highly desirable. However, it is important to note conceptually that it is possible to have similar biospheric effects with more efficient P scavenging at the base of the photic zone if an explicit P redissolution term is included (for example, a P cycle dominated by extensive P scavenging by ferric oxides with subsequent iron reduction and P release). Modelling the P cycle in this manner would result in a larger total marine P reservoir at equivalent surface P limitation. Indeed, on the basis of the P/Fe value in Archean and Proterozoic iron-oxide-rich rocks it is likely that there were at least intervals characterized by a modest P reservoir size (marked by higher P/Fe ratios; see above), consistent with this mode of P cycling.
We have also modified the CANOPS model to include C/P stoichiometry of primary producers that can dynamically respond to marine nutrient availability (Extended Data Fig. 6). In the original CANOPS model (and in most other large-scale biogeochemical models) the canonical Redfield ratio of C:N:P = 106:16:1 is used to define the stoichiometry of particulate organic matter. However, laboratory culture experiments and field studies show that the elemental composition of com-mon cyanobacteria, such as Trichodesmium, Prochlorococcus and Synechococcus, depends strongly on ambient phosphate concentrations, with biomass C/P ratios in particular greatly exceeding the canonical Redfield value under certain growth conditions26,76–78.
We have modified the CANOPS model to include the field-tested flexible- stoichiometry model employed by ref. 77, in which the C/N/P stoichiometry of cyanobacteria responds dynamically to ambient phosphate availability in surface waters according to:
γγ
= +−
⋅
+
−
∗∗ −
r r r r2
1 tanh[PO ]
(2)l
NP NPNPmax
NP P0 43
P1
γγ
= +−
⋅
+
−
∗∗ −
r r r r2
1 tanh[PO ]
(3)l
NP NPNPmax
NP P0 43
P1
where the canonical Redfield values are ∗rCP = 106 and ∗r NP = 16, the asymptotic C/N/P ratios are rCP
max = 400 and r NPmax = 60 for our reference run, and the fitting
parameters γP0 and γP1 are 0.10 μM and 0.03 μM, respectively (Extended Data Fig. 6). We vary the maximum C/P ratio r( )CP
max as a principal sensitivity parameter in our experiments.
The inclusion of a redox-dependent water-column Fe–P trap results in effective sequestration of inorganic P in the ocean interior and severe nutrient P deficiency in the surface ocean at low steady-state atmospheric pO2 (Extended Data Fig. 7). As mentioned above, this result is quantitatively consistent with the lower end of empirical estimates of average seawater [PO4
3−] for much of Precambrian time5. This nutrient P scarcity leads to elevated C/P ratios in primary producer biomass in runs with dynamic elemental stoichiometry. Both of these effects are consistent with the predictions of our conceptual model, allowing us to quantitatively explore the effects of these two processes on steady-state energy flow and mass fluxes in the coupled C–N–P–O2 cycle.
In the original configuration of the CANOPS model, the burial flux of organic carbon (JC
bur, in mol C m−2 yr−1) at a given water depth z is calculated on the basis of the depositional flux to the sediment–water interface J( )C
depo and a burial efficiency e( )C
bur (such as the ratio of organic carbon buried in sediments to that deposited at the sediment–water interface), the latter of which is taken to be a function solely of linear sedimentation rate at depth z (S, in cm yr−1):
= ⋅J z e S z J z( ) ( ( )) ( ) (4)Cbur
Cbur
Cdepo
We parameterize S(z) following ref. 79:
= ⋅ . +z S2,700 erfc[2 1 log ] (5)
where ‘erfc’ is the Gauss or error function. We have also modified the original CANOPS formulation to include an oxygen dependence on overall organic carbon burial efficiency according to ref. 80:
δ δδ
δ=
−
+
+−
e A z S z( ( )) [ ] 1 ( ) (6)Cbur
1 23
1
2
where A is the sediment mass accumulation rate (in g cm−2 yr−1), and δ1 and δ 2 are the burial efficiencies at zero and infinite A, respectively. For normal marine settings, ([O2] > 200 μM), δ1 = 0.5%, δ2 = 75%, and δ3 = 0.07 g cm−2 yr−1, whereas δ1 = 5%, δ2 = 75%, and δ3 = 0.01 g cm−2 yr−1 for low-oxygen settings ([O2] < 30 μM). For the range 30 μM < [O2]z < 200 μM, eC
bur is calculated by assuming a log-linear average of the normal and low-oxygen values. We convert sedimentation rates S to mass accumulation rates A by assuming a porosity of 0.9 and a dry bulk density of 2.65 g cm−3.
In the original CANOPS model, the burial rate of reactive P is computed on the basis of the C/P ratio of buried sediments, (C/P)bur, and the net burial rate of organic carbon:
= ⋅ / −J z J z( ) ( ) [(C P) ] (7)Pbur
Cbur
bur1
where (C/P)bur is a function of both bottom-water oxygen levels and linear sedi-mentation rate S at depth z. However, this approach does not incorporate an explicit role for dynamic rCP in sedimenting particulate organic matter, which we argue should be a crucial parameter in an ocean dominated by cyanobacterial primary production. We thus modify reactive P burial fluxes in CANOPS as follows.
As in the original CANOPS model configuration it is assumed that P burial fluxes are proportional to the depositional flux of P at depth z J z( ( ))P
depo and a burial efficiency (ei) for each sedimentary P phase:
= ⋅J z e z J z( ) ( , [O ] ) ( ) (8)i i zbur
2 Pdepo
where i denotes each of the primary burial fluxes of P—organic P, Fe-bound P and authigenic P (for example, CFA). The depositional flux of P at depth z J z( ( ))P
depo is in turn evaluated according to the organic carbon deposition rate at a given depth and the C/P stoichiometry of particulate organic matter as calculated above by our dynamic stoichiometry model:
= ⋅ ⋅ − −( )J z J z r( ) ( ) [PO ] (9)lPdepo
Cdepo
CP 43 1
Burial efficiencies for each form of P (ei) are then expressed as a function of bottom-water oxygen concentration and sedimentation rate at a given depth z:
= ⋅∗e z e S z f( , [O ] ) ( ( )) ([O ] ) (10)i z i i z2 2
where ∗ei denotes the reference burial efficiency that is controlled only by sedimen-tation rate S at depth z and fi([O2]z) represents the oxygen dependency of a given burial efficiency term. We assume that organic P, Fe-bound P, and authigenic P account for 25%, 25% and 50% of the total reactive P burial under fully oxygenated conditions29. The burial efficiency of organic P as a function of sediment accumu-lation rate is parameterized as:
= ⋅ + − . /∗ −e e S S( ) (1 exp[ 0 001 ]) (11)org Cbur 1
where the second term represents the preferential regeneration of organic P relative to organic carbon, the effect of which becomes weak in the deep sea81. This is an important component of our model—it allows for some degree of pref-erential P regeneration in shallow environments most likely to accumulate dis-solved sulphide82,83, while implicitly allowing for effective P scavenging in the ocean interior. Burial efficiencies are assumed for Fe-bound and authigenic P that are proportional to organic-P burial efficiency according to ∗eFebound = ∗eorg and
∗eauth = ∗e2 org.We formulate the oxygen-dependent component of P burial according to:
α α= + − ⋅ ∗f ([O ] ) (1 )[O ][O ]
(12)zz
org 22
2
= ∗f ([O ] )[O ][O ]
(13)zz
Febound 22
2
© 2017 Macmillan Publishers Limited, part of Springer Nature. All rights reserved.
LETTER RESEARCH
It has been proposed that authigenic P burial, which currently dominates P removal from the modern ocean (see below), depends on bottom-water oxygen levels84,85. However, in contrast, recent work suggests that authigenic P burial, in cases with extensive CFA formation, can actually be enhanced under anoxic conditions86. Hence, we assume no direct oxygen dependency on authigenic P burial (for example, fauth([O2]z) = 1), and instead allow authigenic P burial to scale more directly with the input C/P ratio to the sediment–water interface, consistent with the conceptual model discussed below and in the main text. We set α = 0.25 and [O2]* = 250 μM such that the globally averaged (C/P)bur value is about 250 under pervasively anoxic conditions87. All other parameters not explicitly specified above are set to the reference values shown in ref. 50.Data availability. All analytical data generated or analysed during this study are included in this published article (and the Supplementary Information). Model output data are available from the corresponding author on reasonable request.
34. Filippelli, G. M. The global phosphorus cycle. Rev. Mineral. Geochem. 48, 391–425 (2002).
35. Benitez-Nelson, C. R. The biogeochemical cycling of phosphorus in marine systems. Earth Sci. Rev. 51, 109–135 (2000).
36. Froelich, P. N. Kinetic control of dissolved phosphate in natural rivers and estuaries—a primer on the phosphate buffer mechanism. Limnol. Oceanogr. 33, 649–668 (1988).
37. Duce, R. A. et al. The atmospheric input of trace species to the world ocean. Glob. Biogeochem. Cycles 5, 193–259 (1991).
38. Fox, L. E., Lipschultz, F., Kerkhof, L. & Wofsy, S. C. A chemical survey of the Mississippi estuary. Estuaries 10, 1–12 (1987).
39. Fox, L. E., Sager, S. L. & Wofsy, S. C. The chemical control of soluble phosphorus in the Amazon estuary. Geochim. Cosmochim. Acta 50, 783–794 (1986).
40. Meybeck, M. Carbon, nitrogen, and phosphorus transport by world rivers. Am. J. Sci. 282, 401–450 (1982).
41. Filippelli, G. M. Controls on phosphorus concentration and accumulation in oceanic sediments. Mar. Geol. 139, 231–240 (1997).
42. Filippelli, G. M. & Delaney, M. L. Phosphorus geochemistry of equatorial Pacific sediments. Geochim. Cosmochim. Acta 60, 1479–1495 (1996).
43. Delaney, M. L. Phosphorus accumulation in marine sediments and the oceanic phosphorus cycle. Glob. Biogeochem. Cycles 12, 563–572 (1998).
44. Ruttenberg, K. C. & Berner, R. A. Authigenic apatite formation and burial in sediments from non-upwelling, continental-margin environments. Geochim. Cosmochim. Acta 57, 991–1007 (1993).
45. Li, C. et al. Marine redox conditions in the middle Proterozoic ocean and isotopic constraints on authigenic carbonate formation: insights from the Chuanlinggou Formation, Yanshan Basin, North China. Geochim. Cosmochim. Acta 150, 90–105 (2015).
46. Wang, X. et al. Chromium isotope fractionation during subduction-related metamorphism, black shale weathering, and hydrothermal alteration. Chem. Geol. 423, 19–33 (2016).
47. Scott, C. et al. Tracing the stepwise oxygenation of the Proterozoic biosphere. Nature 452, 456–459 (2008).
48. Shen, Y., Canfield, D. E. & Knoll, A. H. Middle Proterozoic ocean chemistry: evidence from McArthur Basin, Northern Australia. Am. J. Sci. 302, 81–109 (2002).
49. Shen, Y., Knoll, A. H. & Walter, M. A. Evidence for low sulfate and anoxia in a mid-Proterozoic marine basin. Nature 423, 632–635 (2003).
50. Scott, C. & Lyons, T. W. Contrasting molybdenum cycling and isotopic properties in euxinic versus non-euxinic sediments and sedimentary rocks: refining the paleoproxies. Chem. Geol. 324/325, 19–27 (2012).
51. Tribovillard, N., Algeo, T. J., Lyons, T. & Riboulleau, A. Trace metals as paleoredox and paleoproductivity proxies: an update. Chem. Geol. 232, 12–32 (2006).
52. Algeo, T. J. & Maynard, J. B. Trace-metal covariation as a guide to water-mass conditions in ancient anoxic marine environments. Geosphere 4, 872–887 (2008).
53. Algeo, T. J. & Maynard, B. Trace-element behavior and redox facies in core shales of Upper Pennsylvanian Kansas-type cyclothems. Chem. Geol. 206, 289–318 (2004).
54. Scott, C. et al. Tracing the stepwise oxygenation of the Proterozoic ocean. Nature 452, 456–459 (2008).
55. Reinhard, C. T. et al. in Reading the Archive of Earth’s Oxygenation Vol. 3 (eds V. A. Melezhik et al.) 1483–1492 (Springer, 2013).
56. Rudnick, R. & Gao, S. in Treatise on Geochemistry 2nd edn, Vol. 4 (eds Holland, H. D. & Turekian, K. K.) 1–51 (Elsevier, 2014).
57. Calvert, S. E. & Pederson, T. F. Geochemistry of Recent oxic and anoxic marine sediments: implications for the geological record. Mar. Geol. 113, 67–88 (1993).
58. Anderson, R. F., Fleischer, M. Q. & LeHuray, A. P. Concentration, oxidation state, and particulate flux of uranium in the Black Sea. Geochim. Cosmochim. Acta 53, 2215–2224 (1989).
59. Anderson, R. F., LeHuray, A. P., Fleisher, M. Q. & Murray, J. W. Uranium deposition in Saanich Inlet sediments, Vancouver Island. Geochim. Cosmochim. Acta 53, 2205–2213 (1989).
60. McManus, J., Berelson, W. M., Klinkhammer, G. P., Hammond, D. E. & Holm, C. Authigenic uranium: relationship to oxygen penetration depth and organic carbon rain. Geochim. Cosmochim. Acta 69, 95–108 (2005).
61. Jahnke, R. A. The synthesis and solubility of carbonate fluorapatite. Am. J. Sci. 284, 58–78 (1984).
62. Grotzinger, J. P. in Early Life on Earth (ed Bengston, S.) Nobel Symposium No. 84, 245–258 (Columbia Univ. Press, 1994).
63. Grotzinger, J. P. & James, N. P. in Carbonate Sedimentation and Diagenesis in the Evolving Precambrian World (eds Grotzinger, J. P. & James, N. P.) Special Publication 67, 1–20 (SEPM, 2000).
64. Pope, M. C., Grotzinger, J. P. & Schreiber, B. C. Evaporitic subtidal stromatolites produced by in situ precipitation: textures, facies associations, and temporal significance. J. Sediment. Res. 70, 1139–1151 (2000).
65. Ridgwell, A. A mid Mesozoic revolution in the regulation of ocean chemistry. Mar. Geol. 217, 339–357 (2005).
66. Ridgwell, A. & Zeebe, R. E. The role of the global carbonate cycle in the regulation and evolution of the Earth system. Earth Planet. Sci. Lett. 234, 299–315 (2005).
67. Boudreau, B. P. & Canfield, D. E. A comparison of closed- and open-system models for porewater pH and calcite-saturation state. Geochim. Cosmochim. Acta 57, 317–334 (1993).
68. Higgins, J. A., Fischer, W. W. & Schrag, D. P. Oxygenation of the ocean and sediments: consequences for the seafloor carbonate factory. Earth Planet. Sci. Lett. 284, 25–33 (2009).
69. Ben-Yaakov, S. pH buffering of pore water of recent anoxic marine sediments. Limnol. Oceanogr. 18, 86–94 (1973).
70. Feely, R. A., Trefry, J. H., Lebon, G. T. & German, C. R. The relationship between P/Fe and V/Fe ratios in hydrothermal precipitates and dissolved phosphate in seawater. Geophys. Res. Lett. 25, 2253–2256 (1998).
71. Poulton, S. W. & Canfield, D. E. Co-diagenesis of iron and phosphorus in hydrothermal sediments from the southern East Pacific Rise: implications for the evaluation of paleoseawater phosphate concentrations. Geochim. Cosmochim. Acta 70, 5883–5898 (2006).
72. Halverson, G. P. et al. Fe isotope and trace element geochemistry of the Neoproterozoic syn-glacial Rapitan iron formation. Earth Planet. Sci. Lett. 309, 100–112 (2011).
73. Rooney, A. D., Strauss, J. V., Brandon, A. D. & Macdonald, F. A. A Cryogenian chronology: two long-lasting synchronous Neoproterozoic glaciations. Geology 43, 459–462 (2015).
74. Canfield, D. E. et al. Ferruginous conditions dominated later Neoproterozoic deep-water chemistry. Science 321, 949–952 (2008).
75. Guilbaud, R., White, M. L. & Poulton, S. W. Surface charge and growth of sulphate and carbonate green rust in aqueous media. Geochim. Cosmochim. Acta 108, 141–153 (2013).
76. Bertilsson, S., Berglund, O., Karl, D. M. & Chisholm, S. W. Elemental composition of marine Prochlorococcus and Synechococcus: implications for the ecological stoichiometry of the sea. Limnol. Oceanogr. 48, 1721–1731 (2003).
77. Kuznetsov, I., Neumann, T. & Burchard, H. Model study on the ecosystem impact of a variable C:N:P ratio for cyanobacteria in the Baltic Proper. Ecol. Modell. 219, 107–114 (2008).
78. Larsson, U., Hajdu, S., Walve, J. & Elmgren, R. Baltic Sea nitrogen fixation estimated from the summer increase in upper mixed layer total nitrogen. Limnol. Oceanogr. 46, 811–820 (2001).
79. Tromp, T. K., Vancappellen, P. & Key, R. M. A global model for the early diagenesis of organic carbon and organic phosphorus in marine sediments. Geochim. Cosmochim. Acta 59, 1259–1284 (1995).
80. Dale, A. W., Meyers, S. R., Aguilera, D. R., Arndt, S. & Wallmann, K. Controls on organic carbon and molybdenum accumulation in Cretaceous marine sediments from the Cenomanian-Turonian interval including Oceanic Anoxic Event 2. Chem. Geol. 324/325, 28–45 (2012).
81. Ingall, E. D. & Vancappellen, P. Relation between Sedimentation-Rate and Burial of Organic Phosphorus and Organic-Carbon in Marine-Sediments. Geochim. Cosmochim. Acta 54, 373–386 (1990).
82. Reinhard, C. T., Raiswell, R., Scott, C., Anbar, A. D. & Lyons, T. W. A Late Archean Sulfidic Sea Stimulated by Early Oxidative Weathering of the Continents. Science 326, 713–716 (2009).
83. Poulton, S. W., Fralick, P. W. & Canfield, D. E. Spatial variability in oceanic redox structure 1.8 billion years ago. Nat. Geosci. 3, 486–490 (2010).
84. Slomp, C. P., Thomson, J. & de Lange, G. J. Enhanced regeneration of phosphorus during formation of the most recent eastern Mediterranean sapropel (S1). Geochim. Cosmochim. Acta 66, 1171–1184 (2002).
85. Slomp, C. P. & Van Cappellen, P. The global marine phosphorus cycle: sensitivity to oceanic circulation. Biogeosciences 4, 155–171 (2007).
86. Goldhammer, T., Brüchert, V., Ferdelman, T. G. & Zabel, M. Microbial sequestration of phosphorus in anoxic upwelling sediments. Nat. Geosci. 3, 557–561 (2010).
87. Algeo, T. J. & Ingall, E. Sedimentary Corg:P ratios, paleocean ventilation, and Phanerozoic atmospheric pO2. Palaeogeogr. Palaeoclimatol. Palaeoecol. 256, 130–155 (2007).
© 2017 Macmillan Publishers Limited, part of Springer Nature. All rights reserved.

LETTERRESEARCH
log
[P]
[wt%
]
-3.0
-2.0
-1.0
0.0
1.0
2.0
-2 0 2log [Corg] [wt%]
0.0
mea
n [P
] [w
t%]
2000
1000
0
0.1
0.2
0.3
86420mean [Corg] [wt%]
n
1500500n
Extended Data Figure 1 | Comparison of bulk P content and Corg content in marine siliciclastic sedimentary rocks. There are large differences in bulk P content despite statistically indistinguishable Corg content (see main text). The crossplot shows bulk concentrations, and the
histograms show bootstrap resampled mean values for each parameter. Note the differing scales between the raw data plot and resampled mean histograms.
© 2017 Macmillan Publishers Limited, part of Springer Nature. All rights reserved.
LETTER RESEARCH
0.
1
0.
0.
0.5 1.5 2.00.0
5
1.0
0.1 0.2 0.30.0
0.
2
3
1.0
0.2
0.1
0.2
0.1
0.2
0.1
0.00.00 0.05 0.10 0.15 0.20
[P]mean [wt%][P] [wt%]0.0
f [no
rmal
ized
]
0.0
pre-Cryogenianf [
norm
aliz
ed]
f [no
rmal
ized
]
AnoxicPhanerozoic
Oxic Phanerozoic
[P] [wt%]
pre-CryogenianAnoxic PhanerozoicOxic Phanerozoic
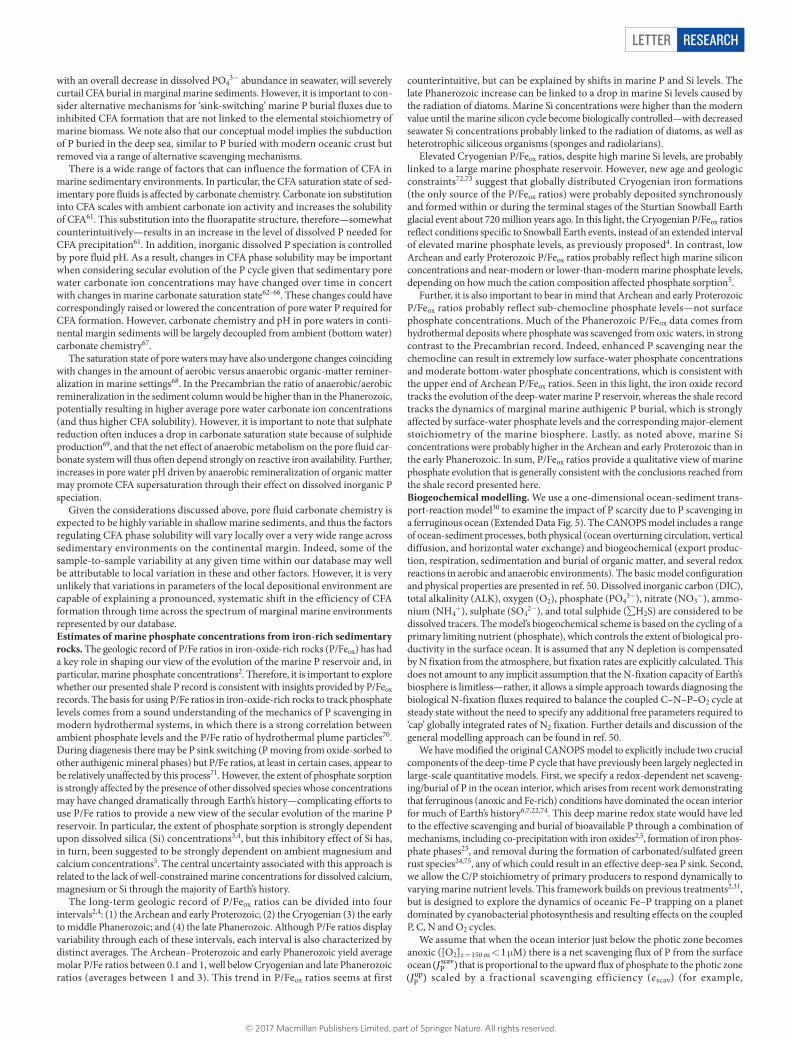
Extended Data Figure 2 | Distributions of P content in marine siliciclastic sedimentary rocks from our database. On the left, from top to bottom, are pre-Cryogenian samples, anoxic Phanerozoic samples, and oxic Phanerozoic samples. For the Phanerozoic data, oxic and anoxic samples were delineated on the basis of sedimentary Mo enrichments
(see main text). The shaded box denotes values greater than 0.2 wt%. On the right are cumulative frequency distributions (top) and bootstrap resampled mean P concentrations (bottom) for the same subsampled data sets.
© 2017 Macmillan Publishers Limited, part of Springer Nature. All rights reserved.

LETTERRESEARCH
0.
0.5 1.5 2.00.0
5
1.0
0.1 0.30.00
0.08
0.20
1.0
[P]mean [wt%]0.0
f [no
rmal
ized
]
0.0
f [no
rmal
ized
]
[P] [wt%]
0.2
0.1
0.2
0.1
0.2
0.1
0.00.00 0.05 0.10 0.15 0.20
[P] [wt%]
f [no
rmal
ized
]
pre-CryogenianAnoxic PhanerozoicOxic Phanerozoic
pre-Cryogenian
AnoxicPhanerozoic
Oxic Phanerozoic
0.2
0.16
0.12
0.04
Extended Data Figure 3 | Distributions of P content in marine siliciclastic sedimentary rocks from our database. On the left, from top to bottom, are pre-Cryogenian samples, anoxic Phanerozoic samples and oxic Phanerozoic samples. For the Phanerozoic data, oxic and anoxic samples were delineated on the basis of sedimentary uranium (U)
enrichments (see main text). The shaded box denotes values greater than 0.2 wt%. On the right are cumulative frequency distributions (top) and bootstrap resampled mean P concentrations (bottom) for the same subsampled data sets. A single outlier containing 33 wt% P was removed during bootstrap resampling based on U content.
© 2017 Macmillan Publishers Limited, part of Springer Nature. All rights reserved.

LETTER RESEARCH
0.
1
0.
0.5 1.5 2.00.0
5
1.0
0.1 0.2 0.30.0
0.
2
0.3
1.0
[P]mean [wt%]0.0
f [no
rmal
ized
]
0.0
f [no
rmal
ized
]
[P] [wt%]
0.2
0.1
0.2
0.1
0.2
0.1
0.00.00 0.05 0.10 0.15 0.20
[P] [wt%]
f [no
rmal
ized
]
pre-CryogenianAnoxic PhanerozoicOxic Phanerozoic
0.4
pre-Cryogenian
AnoxicPhanerozoic
Oxic Phanerozoic
Extended Data Figure 4 | Distributions of P content in marine siliciclastic sedimentary rocks from our database. On the left, from top to bottom, are pre-Cryogenian samples, anoxic Phanerozoic samples and oxic Phanerozoic samples. For the Phanerozoic data, oxic and anoxic samples were delineated on the basis of sedimentary vanadium (V)
enrichments (see main text). The shaded box denotes values greater than 0.2 wt%. On the right are cumulative frequency distributions (top) and bootstrap resampled mean P concentrations (bottom) for the same subsampled data sets.
© 2017 Macmillan Publishers Limited, part of Springer Nature. All rights reserved.
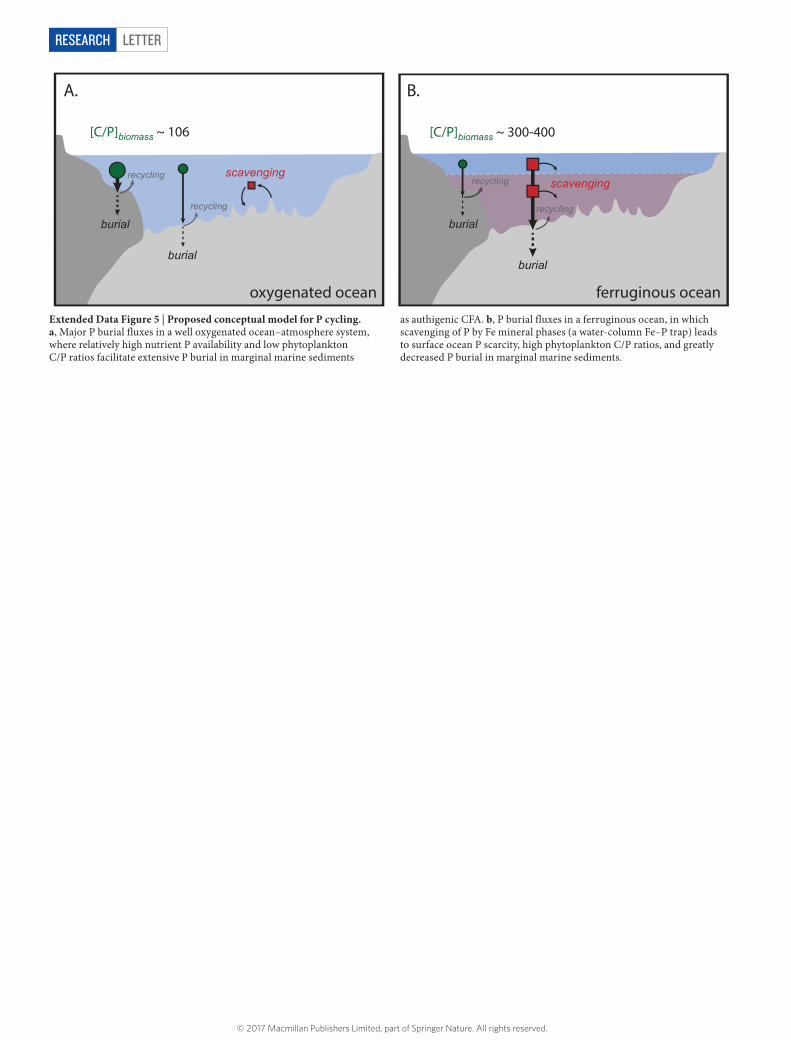
LETTERRESEARCH
[C/P]biomass ~ 300-400[C/P]biomass ~ 106
burial
scavenging
burial
burial
burialrecycling
recycling
recycling
recycling
oxygenated ocean ferruginous ocean
A. B.
scavenging
Extended Data Figure 5 | Proposed conceptual model for P cycling. a, Major P burial fluxes in a well oxygenated ocean–atmosphere system, where relatively high nutrient P availability and low phytoplankton C/P ratios facilitate extensive P burial in marginal marine sediments
as authigenic CFA. b, P burial fluxes in a ferruginous ocean, in which scavenging of P by Fe mineral phases (a water-column Fe–P trap) leads to surface ocean P scarcity, high phytoplankton C/P ratios, and greatly decreased P burial in marginal marine sediments.
© 2017 Macmillan Publishers Limited, part of Springer Nature. All rights reserved.
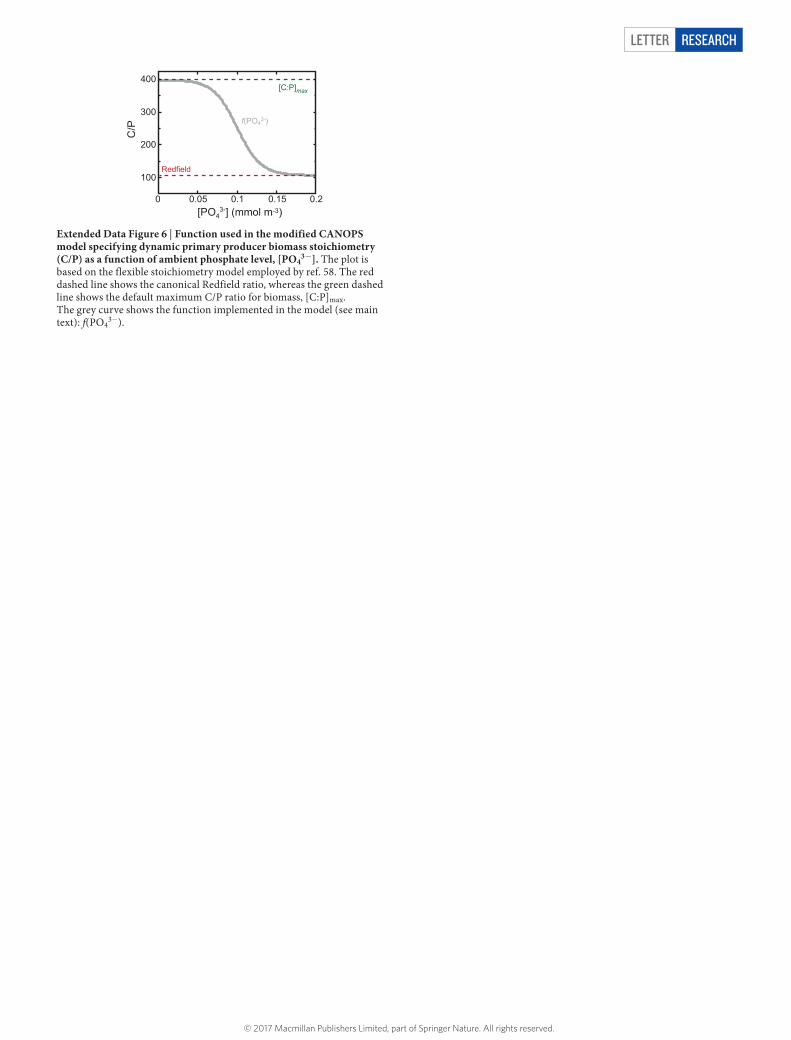
LETTER RESEARCH
400
300
200
100
0.05 0.1 0.150 0.2[PO4
3-] (mmol m-3)
C/P
Redfield
[C:P]max
f(PO43-)
Extended Data Figure 6 | Function used in the modified CANOPS model specifying dynamic primary producer biomass stoichiometry (C/P) as a function of ambient phosphate level, [PO4
3−]. The plot is based on the flexible stoichiometry model employed by ref. 58. The red dashed line shows the canonical Redfield ratio, whereas the green dashed line shows the default maximum C/P ratio for biomass, [C:P]max. The grey curve shows the function implemented in the model (see main text): f(PO4
3−).
© 2017 Macmillan Publishers Limited, part of Springer Nature. All rights reserved.

LETTERRESEARCH
Extended Data Figure 7 | Illustrative results of output from the ocean-sediment biogeochemical model. a–d, Steady-state P removal fluxes from the model as a function of atmospheric pO2
for a range of net scavenging efficiencies, σscav. The Fe-bound, organic, authigenic, and scavenged P fluxes are denoted as ‘Fe’, ‘org’, ‘auth’ and ‘scav’, respectively.
© 2017 Macmillan Publishers Limited, part of Springer Nature. All rights reserved.

LETTER RESEARCH
Extended Data Figure 8 | Illustrative results of output from the ocean-sediment biogeochemical model discussed in the text. a–c, All panels show a given P burial flux (in mmol P m−2 yr−1) contoured as a function of steady-state atmospheric pO2
and ocean depth. a, The organic P burial flux; b, the Fe-bound P burial flux; and c, the authigenic P burial flux.
© 2017 Macmillan Publishers Limited, part of Springer Nature. All rights reserved.