Evolution of Lineaments on Europa: Clues from Galileo … · 2013-07-25 · EVOLUTION OF LINEAMENTS...
20
ICARUS 135, 107–126 (1998) ARTICLE NO. IS985980 Evolution of Lineaments on Europa: Clues from Galileo Multispectral Imaging Observations P. E. Geissler, R. Greenberg, G. Hoppa, A. McEwen, R. Tufts, and C. Phillips Lunar and Planetary Laboratory, University of Arizona, Tucson, Arizona 85712 E-mail: [email protected] B. Clark, M. Ockert-Bell, P. Helfenstein, J. Burns, and J. Veverka Laboratory for Planetary Science, Cornell University, Ithaca, New York 14853 R. Sullivan and R. Greeley Department of Geology, Arizona State University, Box 871404, Tempe, Arizona 85287 R. T. Pappalardo and J. W. Head III Department of Geological Sciences, Box 1846, Brown University, Providence, Rhode Island 02912 M. J. S. Belton National Optical Astronomy Observatories, P.O. Box 26732, Tucson, Arizona 85726 and T. Denk DLR, Institute for Planetary Exploration, Rudower Chaussee 5, 12489 Berlin, Germany Received October 7, 1997; revised May 8, 1998 landscape that has escaped erasure by heating from below is imprinted with generation after generation of intersecting Four distinct classes of lineaments can be described on the ridges at various scales and orientations. Relatively recent frac- basis of Galileo’s improved spectral and spatial coverage of tures expose coarse-grained, clean ice in the shallow subsurface, Europa: (1) incipient cracks are narrow (,1.6 km wide) and possibly accounting for the distinctive color of the satellite in are generally colorless fractures which tend to crosscut other comparison to the other icy moons of Jupiter. The process of lineament types, (2) ridges have raised relief, tend to be wider lineament formation may be continuing today; the bright band (3–6 km) than the cracks, and are distinct in color from the Agenor Linea is among the leading candidates for current icy plains they transect, (3) triple bands have dim medial stripes activity. 1998 Academic Press similar in color and width to the ridges and broad (8–12 km wide) diffuse low-albedo margins tainted by a red–brown non- ice contaminant, and (4) ancient bands are generally similar in width to ridges and triple bands and have colors intermediate 1. INTRODUCTION between those of triple bands and the undisturbed icy plains. They are only slightly darker than the plains at visible wave- Viewed from a distance, the most striking aspect of Eu- lengths—hence, they were largely undetected by Voyager—but ropa is its wreath of global-encircling bands. Voyager im- are distinctly brighter than the plains in the infrared, precluding ages (Smith et al. 1979a, 1979b) revealed a criss-crossing the possibility that they have simply faded from their formerly network of lineaments on Europa’s surface, some ex- darker appearance. tending thousands of kilometers in length. They have also The morphologies, spectral properties, and orientations of shown evidence for distinct morphological lineament types the lineaments vary systematically with age, suggesting that and indicated age relationships among them (Lucchitta these four classes represent different stages of development in and Soderblom 1982). Among the distinct categories of an evolutionary sequence. Lineament formation appears to be the dominant resurfacing mechanism on Europa, and every lineaments mapped by Lucchitta and Soderblom are dark 107 0019-1035/98 $25.00 Copyright 1998 by Academic Press All rights of reproduction in any form reserved.
Transcript of Evolution of Lineaments on Europa: Clues from Galileo … · 2013-07-25 · EVOLUTION OF LINEAMENTS...

ICARUS 135, 107–126 (1998)ARTICLE NO. IS985980
Evolution of Lineaments on Europa: Clues from GalileoMultispectral Imaging Observations
P. E. Geissler, R. Greenberg, G. Hoppa, A. McEwen, R. Tufts, and C. Phillips
Lunar and Planetary Laboratory, University of Arizona, Tucson, Arizona 85712E-mail: [email protected]
B. Clark, M. Ockert-Bell, P. Helfenstein, J. Burns, and J. Veverka
Laboratory for Planetary Science, Cornell University, Ithaca, New York 14853
R. Sullivan and R. Greeley
Department of Geology, Arizona State University, Box 871404, Tempe, Arizona 85287
R. T. Pappalardo and J. W. Head III
Department of Geological Sciences, Box 1846, Brown University, Providence, Rhode Island 02912
M. J. S. Belton
National Optical Astronomy Observatories, P.O. Box 26732, Tucson, Arizona 85726
and
T. Denk
DLR, Institute for Planetary Exploration, Rudower Chaussee 5, 12489 Berlin, Germany
Received October 7, 1997; revised May 8, 1998
landscape that has escaped erasure by heating from below isimprinted with generation after generation of intersectingFour distinct classes of lineaments can be described on theridges at various scales and orientations. Relatively recent frac-basis of Galileo’s improved spectral and spatial coverage oftures expose coarse-grained, clean ice in the shallow subsurface,Europa: (1) incipient cracks are narrow (,1.6 km wide) andpossibly accounting for the distinctive color of the satellite inare generally colorless fractures which tend to crosscut othercomparison to the other icy moons of Jupiter. The process oflineament types, (2) ridges have raised relief, tend to be widerlineament formation may be continuing today; the bright band(3–6 km) than the cracks, and are distinct in color from theAgenor Linea is among the leading candidates for currenticy plains they transect, (3) triple bands have dim medial stripesactivity. 1998 Academic Presssimilar in color and width to the ridges and broad (8–12 km
wide) diffuse low-albedo margins tainted by a red–brown non-ice contaminant, and (4) ancient bands are generally similarin width to ridges and triple bands and have colors intermediate 1. INTRODUCTIONbetween those of triple bands and the undisturbed icy plains.They are only slightly darker than the plains at visible wave- Viewed from a distance, the most striking aspect of Eu-lengths—hence, they were largely undetected by Voyager—but ropa is its wreath of global-encircling bands. Voyager im-are distinctly brighter than the plains in the infrared, precluding ages (Smith et al. 1979a, 1979b) revealed a criss-crossingthe possibility that they have simply faded from their formerly
network of lineaments on Europa’s surface, some ex-darker appearance.tending thousands of kilometers in length. They have alsoThe morphologies, spectral properties, and orientations ofshown evidence for distinct morphological lineament typesthe lineaments vary systematically with age, suggesting thatand indicated age relationships among them (Lucchittathese four classes represent different stages of development inand Soderblom 1982). Among the distinct categories ofan evolutionary sequence. Lineament formation appears to be
the dominant resurfacing mechanism on Europa, and every lineaments mapped by Lucchitta and Soderblom are dark
1070019-1035/98 $25.00
Copyright 1998 by Academic PressAll rights of reproduction in any form reserved.

108 GEISSLER ET AL.
TABLE IImages Used in This Study
Latitude LongitudeImage Picture range range Resolution
number number Filter Incidence Emission Phase (deg) (deg) (km/pixel)
Figs. 2, 3, 4, 13349875152 G1E0005 GRN 52.98 22.85 37.39 13.39 89.52 2176.44 2100.67 1.572349875165 G1E0006 RED 52.65 22.84 37.41 13.31 89.90 2175.60 299.65 1.572349875178 G1E0007 VIO 52.77 22.92 37.42 13.39 89.75 2175.76 299.79 1.572349875200 G1E0008 756 52.91 22.76 37.43 13.31 89.41 2176.38 2100.65 1.572349875213 G1E0009 968 52.67 22.79 37.44 13.28 89.76 2175.71 299.82 1.572349875226 G1E0010 889 52.72 22.51 37.45 13.08 89.14 2176.34 2100.77 1.572
Fig. 6389772500 G7E0040 GRN 47.10 38.29 15.70 27.48 40.47 141.00 152.23 0.5954389772507 G7E0042 VIO 46.99 38.11 15.75 27.33 40.27 141.04 152.24 0.5950389773000 G7E0044 968 47.37 37.22 18.66 28.00 39.90 141.37 151.73 0.5748
Fig. 9374685439 E4E0028 CLR 74.39 24.90 96.56 5.36 6.17 234.60 233.75 0.0257
Fig. 10349875113 G1E0002 CLR 61.60 27.39 37.27 29.98 51.97 2232.22 2140.53 1.572
Fig. 11389768800 G7E0030 GRN 36.25 36.27 0.02 25.87 41.86 155.80 172.90 0.391389768813 G7E0031 VIO 36.12 36.11 0.05 25.74 41.73 155.87 172.93 0.391389768826 G7E0032 968 35.76 35.73 0.10 25.41 41.32 156.01 172.96 0.391
Fig. 12 C, A, B/D383717500 E6E0050 CLR 80.58 38.11 47.99 8.53 10.29 285.46 283.09 0.055383717513 E6E0051 CLR 78.89 36.27 48.53 8.56 10.31 287.13 284.86 0.054383718652 E6E0074 CLR 78.14 46.69 78.62 14.42 15.34 286.57 285.91 0.020
Fig. 15374649013 E4E0002 CLR 43.75 34.42 55.99 252.26 29.08 2142.36 278.06 1.222383694600 E6E0001 CLR 40.88 49.02 36.56 260.64 226.02 2214.28 2154.83 1.671383694605 E6E0002 CLR 50.40 41.08 36.20 260.42 226.08 2163.16 2133.65 1.668
Fig. 16 A, B, C, DVGR2065022 1255J2001 CLR 62.63 31.94 93.70 261.91 21.31 131.22 226.49 1.776383694600 E6E0001 CLR 40.88 49.02 36.56 260.64 226.02 2214.28 2154.83 1.671374649013 E4E0002 CLR 43.75 34.42 55.99 252.26 29.08 2142.36 278.06 1.222360063900 G2E0001 GRN 22.03 23.97 2.17 288.97 90.0 2157.41 22.59 6.878
bands, triple bands (dark bands having a bright, central various locations, frequently at high solar incidence anglesnear the terminator. For comparison, the best Voyagerstripe), gray bands (intermediate in albedo between the
dark bands and the background icy plains), small raised images were 2 km/pixel. Second, while multispectral im-ages recorded by Voyager were limited to wavelengths lessridges and arcuate ridges, and short, stubby wedge-shaped
bands concentrated near the equator. The oldest of these than 0.59 em, Galileo’s Solid State Imaging (SSI) system issensitive to wavelengths up to 1 em, extending the spectralare generally gray bands, such as those located at high
southern latitudes on the leading side of Europa, while the range of the images into the near-infrared. Detailed de-scriptions of the imaging system are given by Belton et al.youngest lineaments, as determined by superposition and
crosscutting relations, are the ridges. The europan linea- (1992) and Klaasen et al. (1997); filters used to date forEuropa color imaging are designated ‘‘violet’’ (413 nmments have been generally interpreted as extensional in
origin and variously attributed to tidal flexing (Helfenstein effective wavelength when illuminated by white light;Klaasen et al. 1997), ‘‘green’’ (560 nm), ‘‘red’’ (665 nm),and Parmentier 1980), long-term orbital evolution
(Helfenstein and Parmentier 1983), and nonsynchronous ‘‘756’’ (757 nm), ‘‘889’’ (888 nm), and ‘‘968’’ (991 nm).Four sets of color observations have so far been obtainedplanetary rotation (Helfenstein and Parmentier 1985,
McEwen 1986a). of Europa from Galileo, at resolutions ranging from 390m/pixel to 6.9 km/pixel (Table I). Targets for color imagingGalileo data have expanded our knowledge of europan
lineaments in two important ways. First, high-resolution included the Tyre impact structure at 348 N, 146.58 W at589 m/pixel resolution during Galileo’s seventh orbit (G7)images down to 6 m/pixel have sampled the lineaments at

EVOLUTION OF LINEAMENTS ON EUROPA 109
FIG. 1. Location diagram (mosaic of data from Voyager and Galileo orbits G1 to G7). Orthographic projection of the trailing hemispherecentered at 08N, 2008W. Outlines show positions of numbered figures.
(Moore et al. 1998), an image of the spacecraft’s shadow and data from two additional filters (red and 889) werepartially returned.point at 308 N, 1628 W at 390 m/pixel also during G7
(Helfenstein et al. 1998), and a global view of the trailing The importance of the new spectral coverage can beseen from Fig. 2, which compares visible and near-infraredhemisphere centered at 18 N, 2938 W acquired at 6.9 km/
pixel during encounter G2. The most comprehensive cov- images of the region for which all six-color data are avail-able. The top panel (Fig. 2A, a red–green–violet compos-erage was obtained of Europa’s northern high-latitude re-
gion at 1.6 km/pixel resolution and 378 phase angle from ite) approximates the visual appearance of Europa, exceptthat a violet filter image is used to portray blue. No photo-a nontargeted flyby during Galileo’s first (G1) orbit of
Jupiter (Belton et al. 1996). The imaged region extends metric correction has been applied; illumination is fromthe southwest (lower left) and the surface darkens as theacross the trailing side of the antijovian hemisphere of
Europa (longitudes 180 to 270), centered at 458 N, 2218 terminator is approached, toward the right. At visiblewavelengths, and to Voyager’s camera, the lineaments ap-W (Fig. 1). Four-color coverage extends across the entire
region, obtained with the violet, green, 756, and 968 filters, pear in shades of brown with a maximum contrast of p50%

110 GEISSLER ET AL.
FIG. 2. Comparison of visible and near-infrared images of europan lineaments: (top) red, green, violet composite, (bottom) false color compositewith 968-, 889-, 756-nm filter images shown as red, green, and blue (picture numbers G1E0005–G1E0010).
(in the violet filter). In the near-infrared, however, these 2. CLASSIFICATION OF LINEAMENTSlineaments display a diversity of colors unseen by Voyager
2.1. Morphology and Superposition Relationships(Fig. 2B, a false-color composite in which the 968, 889,and 756 filter images are shown as red, green, and blue, Figure 3 is a close-up of a region of intersecting linea-respectively) and allow us to map bands barely distinguish- ments, about 350 km across and centered at 488 N, 2508able at shorter wavelengths.
W. Linear features of different ages can be seen to haveIn this paper, we discuss Galileo’s new insights into thea variety of morphologies and associated color characteris-formation and evolution of Europa’s lineaments, concen-tics in this 968, 756, and violet filter composite (shown heretrating on the color observations but drawing analogies toas red, green, and blue). The youngest of these is a dark,features seen at higher resolution elsewhere on Europa1-pixel-wide line running from top to bottom of the picture(no very high resolution data have yet been acquired in(labeled F1 in Fig. 3). This fracture is no wider than thethe areas with color coverage). We will show that europandimensions of a pixel (1.6 km) and crosscuts, i.e., is youngerlineaments exhibit systematic changes in morphology,than, every other lineament in the scene. It is darker thanspectral properties, and orientation with age, and we sug-but similar in color to its surroundings and exhibits nogest a possible sequence of development and offer interpre-
tations for the evolution of these intriguing features. discernible relief along its thousand kilometer length, only

EVOLUTION OF LINEAMENTS ON EUROPA 111
FIG. 3. Close-up of a region of intersecting lineaments about 350 km across and centered at 488N, 2508W. Composite of 968, 756, and violetimages. Labeled are simple fractures (F), ridges (R), triple bands (TB), and ancient bands (AB). The prominent triple band TB1 is Cadmus Linea(picture numbers G1E0005–G1E0010).
a portion of which is shown here. It curves as it crosses Slightly wider bands, 2 or more pixels across, are distinctin color from the icy plains and can be seen to have raisedCadmus Linea (TB1 in Fig. 3), suggesting that it is a tension
crack rather than a transform fault. This feature is repre- relief when viewed near the terminator. Several examplesappear in slightly greenish hues in Fig. 3 (bands R1 to R5),sentative of a class of lineaments formed by the most recent
(perhaps current) stresses at their locations. By analogy indicating a reduced 968-nm filter reflectance. The colorcharacteristics of these ridges are shared by the dim medialto features seen at much higher resolution elsewhere on
Europa, these ‘‘incipient cracks’’ will later be identified stripes at the cores of triple bands like Cadmus (TB1),contrasting with the diffuse red–brown materials at theirwith simple fractures lacking associated marginal ridges,
or having at most a single pair of ridges below the resolu- margins. Subtle color differences can be seen, for example,at the intersection of an irregular ridge (R2) with Cadmustion limit (Section 4).

112 GEISSLER ET AL.
Linea near the center of the picture. Greenish hues indicat- and Soderblom (1982) from Voyager images. Pappalardoing reduced 968-nm reflectance are also seen in the dark and Sullivan (1996) interpret the southern hemisphere graycentral portion of the crater at the bottom of Fig. 3. band Thynia Linea to have formed by crustal extension.
Next in age after the ridges is Cadmus Linea (TB1), The bright wedge in Fig. 4 is much wider than other linearan example of a fully developed triple band. The brown features in the region and could be an ancient pull-apartcoloration extends in both directions 8 to 12 km from the zone which has brightened with age.center of the band, varying remarkably little along the The relative ages of these various lineament types aregreat length of this lineament. Cadmus crosscuts many well shown by the four-way intersection near the top ofolder lineaments (representatives are labeled AB1, AB2, Fig. 4: the narrow incipient crack F2 crosscuts ridge R5,and AB3 in Fig. 3), which appear white or in pale orange which in turn postdates triple band TB2. All of these eventsand yellow shades in the false color composite. On the overprinted the bright wedge AB5, the oldest in the se-whole, these ‘‘ancient bands’’ are indistinct in visible light quence. The orientation of these particular lineaments ap-(Fig. 2A) but notably brighter than the surrounding icy pears to rotate systematically in a clockwise sense withplains at infrared wavelengths. At least one (band AB1) decreasing age, a point we shall return to in Section 5.retains a bright medial stripe, similar to the darker triplebands. 2.2. Color and Albedo Properties
These four classes of lineaments—cracks, ridges, tripleThe spectral properties of the lineaments vary markedlybands, and ancient bands—are seen again in Fig. 4, an
with illumination and viewing geometry and with geo-enlargement of the eastern portion of the six-color datagraphic location on Europa. Lineaments and mottled ter-set shown as a 968, 756 and violet filter false-compositerain on the trailing hemisphere are much redder than theirwhich has been photometrically corrected to compensateyellowish counterparts on the leading side, probably duefor near-terminator darkening (details of the correctionto the exogenic effects of charged particles (McEwenare given in Section 5). This scene is about 575 km in width1986b). We can minimize differences due to photometricand is centered at 508 N, 2028 W. Lineament F2 (labeledand exogenic effects by comparing the colors of representa-in Fig. 4) appears to be a simple fracture less than a pixeltive features from nearby locations in the area of G1 colorin width, devoid of relief, and invisible in color ratio images.coverage. The spectral variability of these features is exam-Band R5, also shown in the previous figure, can be clearlyined by Clark et al. (1998), who also estimate absoluteseen to be a ridge: its western (sun-facing) slope is brightnormal albedos for the units.in comparison to the opposite side. Seen at high resolution,
As previously mentioned, the incipient cracks are nota-ridges on Europa commonly occur in symmetric pairs orble for their lack of distinguishing color—these thin ‘‘pencilas multiple-ridge sets with central valleys (Greeley et al.lines’’ darken both bright and dark terrains equally, inde-1998), but the detailed topography of R5 cannot be madependent of wavelength. This is illustrated in Fig. 5, whichout at this resolution. Its green color, again indicating re-compares the six-filter SSI spectra of various lineamentsduced 968-nm reflectance, contrasts markedly with bothwith the color of the surrounding plains, measured fromthe blue background plains and the reddish brown of triplenearby locations to minimize differences in illuminationbands TB2 and TB3, which it crosscuts.and viewing geometry. These data are plotted in units ofDark brown units in this region include isolated spotsradiance factor RF, the ratio of the observed radiance toas well as the prominent triple bands Cadmus (TB1), Minosthat expected from a normally illuminated Lambertian tar-(TB3), and Asterius (TB4) Lineae. Asterius has a crenu-get at the same heliocentric distance, and were extractedlated margin, unlike the more regular curvilinear shapesfrom images calibrated with procedures derived by Klaasentypical of triple bands. Several indistinct, brighter bandset al. (1997). Figure 5 shows that fracture F1 is darker than,crossing from left to right near the center of Fig. 4 (suchbut similar to the neighboring icy plains in color. Theas AB4) represent the oldest lineaments preserved in thespectrum is contaminated by the plains, since the fractureregion. These wispy traces are actually brighter than theis less than a pixel wide, but comparing the two spectrasurrounding plains at infrared wavelengths, and they cansuggests that topographic shadows along the fracture maybe traced for hundreds of kilometers. Their widths are onsimply darken the plains, leaving the color unchanged.the order of 4.5 to 6 km, similar to that of the ridges. The
Even though the fractures have no intrinsic coloration,bright wedge near the top of the picture (AB5) appearsthey may expose subsurface materials which are distinctsimilar in age to the ancient bands on the basis of superpo-in color from the surficial deposits. This is especially appar-sition relationships. Like the ancient bands, it is brighterent in the region near the Tyre impact structure (Fig. 6).than adjacent, undisturbed plains in the near-infrared butRelatively young fractures imaged at 589 m/pixel in thisslightly darker at visible wavelengths (see Section 2.2). Inarea are actually brighter than the average icy plains mate-this respect, the bright wedge AB5 is similar to the gray
bands identified in the southern hemisphere by Lucchita rial in the violet and green filters (by about 15 and 7%,

EVOLUTION OF LINEAMENTS ON EUROPA 113
respectively) and have much deeper absorptions in the and near-infrared reflectance of the darker, nonice contam-inant on Europa’s trailing hemisphere. This material is968-nm filter. These features were presumed to be ridges
until recently, when higher resolution (170 m/pixel) near- strongly absorbing in the violet (and ultraviolet, from Voy-ager observations, Johnson et al. 1983, McEwen, 1986b)terminator images obtained in orbit E14 showed them to
be simple cracks a few hundred meters across. The high and exhibits a steep positive spectral slope (red color) upto 1 em. These characteristics are remarkably consistentalbedo of the fractures can be explained if they expose
relatively clean ice, whereas the 1-em absorption is attrib- between exposures of the red–brown contaminant acrossthe trailing hemisphere as seen in the G2 global coloruted to relatively large grain sizes in comparison to the
surface materials. The long wavelength filters of SSI are imaging observations, including thermally disrupted (‘‘ice-raft’’) terrain and the continuous ejecta from recent impactsensitive to ice grain size, particularly since the camera’s
968 filter lies on the shoulder of the weak water ice absorp- craters like Pwyll. Slight differences can probably be as-signed to variations in the water abundance and grain sizetion band at 1.04 em. For example, Galileo multispectral
imaging observations of Antarctica taken as the spacecraft of ice/contaminant mixtures (see also Clark et al. 1998).The identity of the contaminant remains elusive at thisflew past Earth en route to Jupiter (Geissler et al. 1995)
yield 968/green ratios near unity for continental snows writing; Galileo Ultraviolet Spectrometer (UVS) observa-tions associate exposures of the red–brown materials with(average grain diameters of a few tens of micrometers)
decreasing to p0.85 for shelf and sea ice (diameters of deep absorptions at 0.28 em, attributed to sulfur com-pounds such as SOX (Hendrix et al. 1996), while Galileoseveral hundred micrometers). The 968/green ratio for the
young fractures in Fig. 6 averages p0.93 1/2 0.02. This Near Infrared Mapping Spectrometer (NIMS) results sug-gest heavily hydrated materials such as hexahydritecomparison suggests that the mean ice grain diameter of
shallow subsurface ice in the Tyre region is on the order (MgSO4 · 6H2O) (Fanale et al. 1998, McCord et al. 1998).Such salts and sulfates are colorless at visible wavelengths,of 100 em or larger. The deep 1-em absorption of the
near-surface ice may explain Europa’s relatively ‘‘blue’’ however, requiring an additional compositional compo-nent to account for the coloration.color in comparison to the other icy Galilean satellites;
Ganymede and Callisto have much redder near-infrared Europa’s ancient bands were noted to brighten with ageon the basis of Voyager observations, and it was assumedspectral slopes than Europa, even allowing for spectral
mixing with the dark contaminants on their surfaces (Geis- that these features progressively reverted over time to thecolor and albedo of the undisturbed icy plains (e.g., Pappa-sler et al. 1996).
Ridges display a great variety of colors and albedos, lardo and Sullivan 1996). However, the bands do notmerely fade away, but rather brighten beyond the plains’possibly related to their age. Figure 5 shows that the
‘‘green’’ ridges in the 1.6-km/pixel G1 data are spectrally albedo, especially at long wavelengths. Figure 7 demon-strates the phenomenon by comparing lineaments of threedistinct from both the background icy plains and the dark
triple band margins. Ridge R2 (Fig. 3) is similar in color different ages. Cadmus Linea (spectrum TB1) is the youn-gest of the three, overprinting an older lineament (AB1)to the dark margins of Cadmus Linea, but is brighter and
has a deeper 1-em absorption. The bright core of Cadmus which still retains a recognizable triple band albedo pat-tern. Both crosscut an ancient band (AB3) which is darkerhas similar but less pronounced color characteristics. Color
observations at higher resolution during G7 (Fig. 6) con- than the background plains at short wavelengths but con-siderably brighter in the near-infrared. This spectral behav-firm that these spectral properties are common to ridges.
Ridge doublet R6 is bright and blue in comparison to its ior, common among the oldest lineaments imaged, pro-duces a contrast reversal with wavelength; ancient bandssurrounds, similar to the ridges at the cores of triple bands
TB5 and TB6, suggesting that the ice was relatively clean are slightly darker than ice at visible wavelengths, butunexpectedly bright at infrared wavelengths not seen byat the time it was extruded.
The distinguishing characteristic of triple bands is not Voyager. Unfortunately, the crossover point is near themiddle of SSI’s spectral range, making the older lineamentsthe dim medial cores, which resemble less adorned ridge
sets elsewhere on Europa, but the dark, diffuse coloration indistinct in the clear filter used for most Europa imagingin the nominal mission (Fig. 1). Ancient bands and wedgesextending 8–12 km from the central ridges. At high resolu-
tion, triple bands can be seen to be composed of sets of up are intermediate in color between the icy plains and thedark red–brown component and appear to be mixtures ofto 8 parallel ridges, with darkened and somewhat subdued
topography along their margins. The discoloration seems these two end members (Fig. 8). This conclusion is sup-ported by the linear spectral mixing models of Clark et al.to be confined to the surface: fracture F3 in Fig. 6 appears
to cut across the dark margins of triple bands TB5 and (1998), who extend the analysis to include the isolatedspots (‘‘lenticulae’’) which make up Europa’s mottled ter-TB6, revealing clean, coarse-grained ice just below the
surface. The spectrum of Cadmus’ dark margins (TB1 in rain; most of the endogenic spectral variability on Europa’strailing hemisphere can be adequately accounted for byFig. 5) represents our best estimate to date of the visible

114 GEISSLER ET AL.
FIG. 4. Close-up of a region of intersecting lineaments about 575 km across and centered at 508N, 2028W. Composite of 968, 756, and violetfilter images. Labeled are simple fractures (F), ridges (R), triple bands (TB), and ancient bands (AB). Shown is the intersection of Cadmus (TB1)and Minos (TB3), with Asterius Linea (TB4) to the south (picture numbers G1E0005–G1E0010).
mixtures of the dark brown contaminant with ice of various (,1.6 km wide) and are generally colorless fractures whichtend to crosscut other lineament types, (2) ridges havegrain sizes. The fact that the color of the ancient bands is
intermediate between those of the dark contaminant and raised relief, tend to be wider (3–6 km) than the cracks,and are distinct in color from the icy plains they transect,ice units, but their long-wavelength albedos exceed that
of either end-member, implies that the brightening is in- (3) triple bands have medial stripes similar in color andwidth to the ridges, and broad (p10 km wide) diffuse low-trinsic to the ancient bands. It cannot be due to simply
blanketing both the bands and the plains with a mantling albedo margins tainted by a red–brown nonice contami-nant, and (4) ancient bands are generally similar in widthdeposit, for example. Instead, a local frost deposit or reduc-
tion in the grain size of the icy matrix or the dark contami- to ridges and triple bands and have colors intermediatebetween those of triple bands and the undisturbed icynant is required (or the production of a spectrally neutral
brightening agent from the breakdown of the red– plains. They are only slightly darker than the plains atvisible wavelengths—hence, they were largely undetectedbrown material).
In summary, four distinct classes of lineaments can be by Voyager—but are distinctly brighter than the plains inthe infrared, precluding the possibility that they have sim-described on the basis of Galileo’s improved spectral and
spatial coverage of Europa: (1) incipient cracks are narrow ply faded from their formerly darker appearance. In the

EVOLUTION OF LINEAMENTS ON EUROPA 115
FIG. 6. Fractures, ridges, and triple bands in the Tyre region. Image is about 115 km across and centered on 328N, 1488W. (A) The youngestlineae are both brighter and bluer than the average icy plains in this false color (968, green, and violet filters) composite. (B) 968/green color ratioimage scaled so that a ratio of 1.3 appears white, 0.9 black. Labeled are simple fractures (F), ridges (R), and triple bands (TB). Relatively recentfractures expose coarse-grained ice, which appears dark due to absorption in the 968-nm filter (picture numbers G7E0040, G7E0042, and G7E0044).
next sections we will show examples of lineaments transi- or regional differences in the properties of the lithosphere,such as thickening of an ice shell toward the pole (Ojakan-tional between these four classes and suggest an evolution-gas and Stevenson 1989a).ary sequence which implies that these diverse features rep-
Examples of cracks which grade into double-ridges areresent the results of a single set of processes seen atsurprisingly rare in the high-resolution Galileo images re-different stages of development.turned to date, despite the preponderance of both linea-ment types. One lineament suggestive of this transition3. TRANSITIONAL LINEAMENTSintersects Asterius Linea at 13.78 N, 2728 W, just north of
Important clues to the sequence of development of the intersection of triple bands Asterius and Agave. Thiscracks, ridges, and bands are found among examples of crack shows little evidence of positive relief at the pointfeatures transitional from one lineament type to the next. it crosses Asterius, but grades southward into a prominentEuropan lineaments range up to thousands of kilometers if modestly sized double ridge over a distance of less thanin length and tend on the whole to be remarkably uniform 30 km. Other possible examples originate in the largeover great distances. Longitudinal variations may be ringed impact structures Tyre (Fig. 6, ridge R6) and Cal-
lanish, at 16.58 S, 3338 W, where they are expressed ascaused by changes in strain history with location or by local
FIG. 11. Feature transitional between triple bands and ancient bands located at 288N, 1618W. Arrows point out bright margins of dark materialflanking the central ridge (picture numbers G7E0030–G7E0032).
116 GEISSLER ET AL.
FIG. 5. Six-filter SSI spectra comparing colors of developing linea- FIG. 8. SSI spectra of various lineaments normalized to unity green-ments with the surrounding ice plains. Labels refer to features shown in filter reflectance. Ancient bands and wedges are intermediate in colorFig. 3. Error bars represent the standard deviation within each sam- between the icy plains and the dark red–brown triple band margins andpled location. appear to be mixtures of the two end members. Labels refer to features
shown in Fig. 4. Error bars represent the standard deviation within eachsampled location.
fractures showing little positive relief within the macula,but grow in stature as they radiate outward into less dis-rupted (and presumably more competent) terrain. A small- ance, in contrast to the more regular shapes of typicalscale structure connecting two nearby regions of disrupted double ridges. The eastward bifurcation of the crack is alsoterrain at 118 N, 327.58 W displays unusual morphological very uncommon; most lineament intersections occur wherevariations along its length (Fig. 9). Both ends of this 15-km one lineament clearly overprints another.long crack terminate in disrupted terrain, the westernmost Examples of features transitional between ridges andof which is vaguely circular and possibly of impact origin. triple bands are comparatively common. Several are seenThe rough surface and irregular planform of the crack’s in Fig. 3. At the bottom of the picture, ridge R4 gradesmarginal ridges give this feature a freshly formed appear- to the southwest (left) into a fully developed triple band
complete with gradually widening red–brown staining. An-other gradual transition can be seen by following ridge R5eastward; its orange–brown color in Fig. 3 changes slowlyalong its length to a more greenish appearance in Fig. 4,an effect perhaps contributed to by the changing illumina-tion and viewing geometry (Fig. 4 is nearer the terminator).In contrast to these gradual transitions, many lineae darkenat discrete points along their lengths. Irregular discolor-ation is associated with ridges R1 and R2 in Fig. 3, notablyat their intersections with other lineae.
Rhadamanthys Linea (Fig. 10) is remarkable in that itmay represent a ridge ‘‘caught in the act’’ of forming atriple band (Belton et al. 1996). Dark brown spots haveformed along its length that are indistinguishable in colorfrom more fully developed triple bands such as Minos andCadmus. Other bands appear transitional in morphologybetween Rhadamanthys and the more common triplebands that are uniform along their lengths. We have al-ready remarked on the crenulated margins of Asterius
FIG. 7. SSI spectra of lineaments of three different ages. Europa’s Linea (Figs. 1 and 4, TB4), which appears as though aancient bands brighten beyond the albedo of the background plains,multitude of spots coalesced along its length. Two exam-particularly at long wavelengths. Labels refer to features shown in Fig. 3.
Error bars represent the standard deviation within each sampled location. ples of double ridges with discontinuous dark discoloration

EVOLUTION OF LINEAMENTS ON EUROPA 117
FIG. 9. Feature transitional between fractures and double ridges, located at 118N, 327.58W. Scale bar is 5 km long (picture numberE4E0028).
along their flanks were imaged at 420 m/pixel during Gali- indicates that the bands do not brighten uniformly acrosstheir surfaces, but brighten from the outside inward in-leo’s third (C3) orbit at 13.58 S, 1968 W in a region of dark,
wedge-shaped extensional tectonic features west of the stead. The brightening of europan terrain is not restrictedto the lineaments; it is also apparent among the darkantijove point (Greeley et al. 1998). These particular ridges
have a knotty appearance, and the larger relief sections of wedges interrupting older plates in the equatorial region(Greeley et al. 1998, Fig. 18).the ridges occupy the centers of the localized dark spots.
The implication is that activity along the fracture, i.e., ridgebuilding, is related to the degree of darkening of adjacent 4. SEQUENCE OF DEVELOPMENTice surfaces.
Bands in the process of brightening make up the final Based on the observations described above, we suggestthat the various europan lineaments do not develop bygroup of transitional lineaments. As already noted, band
AB1 in Fig. 3 is intermediate in color and albedo between separate processes, but instead they are genetically relatedand evolve through the sequence of morphological stagesCadmus Linea (TB1) and the ancient bands crosscut by
both lineaments (see Fig. 7), yet still retains the distinctive outlined in Table II. Analogous landforms selected fromhigh-resolution imagery obtained elsewhere on Europa arealbedo pattern of a triple band. Other triple bands can be
seen to have brightened at their outermost margins. A shown in Fig. 12 to illustrate these stages. Initially, linea-ments form as simple fractures of the brittle crust withbright margin is faintly visible on Minos Linea (TB3) in
Fig. 4, but is better detailed by spectral mapping of the little perceptible positive relief (Fig. 12A). Marginal ridgesare built up over time on the flanks of favorably orientedlineae as discussed in Section 5. A better example was
photographed in a color imaging sequence on Galileo’s fractures (Fig. 12B). The paucity of features transitionalfrom cracks to double ridges may reflect the rapidity of the7th orbit (G7) at 288 N, 1618 W (Fig. 11). This small (5 km
wide) triple band has margins which are brighter in all ridge-building process once begun. Ridges may increase insize until their weight exceeds the limiting load that canthree filters (violet, green, and 968 nm) than its interior,
as well as an indistinct dim medial core. This example be supported by the crust, which bends and buckles under

118 GEISSLER ET AL.
FIG. 10. Rhadamanthys Linea, a feature transitional between ridges and triple bands. Image centered at 18.58N, 1988W. Scale bar is 50 km(picture number G1E0002).
the stress (cf. Pappalardo and Coon 1996); note the small example). The ridges at the core of triple bands retain theirappearance to some extent while icy surfaces immediatelyfractures parallel to the ridge set in Fig. 12B. In some cases,
repeated activity along the lineaments apparently takes adjacent to the ridges darken and local preexisting topogra-phy is erased, possibly as the ridges sink under their ownadvantage of these parallel fractures, and the ridges enlarge
to form multiridged structures such as those found at the weight. Finally, the ridges relax and reequilibrate (Fig.12D), and the bands brighten beginning with their outer-center of the largest triple bands (Fig. 12C) (c.f. Greenberg
et al. 1998). Triple bands apparently form only after activity most margins.The net effect of these processes is to create a surfacealong the largest lineaments ceases; all the triple bands
so far imaged at high resolution are crosscut by younger everywhere overprinted with a dense network of super-posed ridges. Regions referred to here as ‘‘plains’’ can infeatures and inferred to be presently inactive (small cracks
can be seen to crosscut the triple band in Fig. 12C, for fact be seen at high resolution to be made up of complex

EVOLUTION OF LINEAMENTS ON EUROPA 119
TABLE IImeshes of ridge sets. Ridge-building is the dominant pro-Evolution of Lineamentscess shaping the moon’s surface, and every landscape that
has escaped erasure by heating from below is imprintedLineament
with generation after generation of intersecting ridges at type Morphology Color/albedo Agevarious scales and orientations. Relief along these older
Fractures narrow (,1 km); Generally colorless; may youngestridge sets is subdued in comparison to younger terrains,negative relief expose coloredsuggesting that the ridges viscously relax over time.
subsurface materialsSpecific conditions must be met at each step of thisRidges raised relief (100–200 m) initially bright blue, younger
sequence, and not all lineaments necessarily evolve from double or multiple deep 1 em absortion;one stage to the next. Fractures must remain active for ridge sets; 1–5 km possible frost cover
wide. during active phaseextended periods before marginal ridges can be built up.Triple multiple ridge sets bright blue to dark red olderThe brown margins along triple bands may be visible only
bands flanked by smooth, ridges; darkerafter activity ceases and the ridges sink, a process thatdark margins red–brown margins
depends both on the strain history (i.e., the size of the Ancient presumed similar to intermediate in color oldestridges) and the local ability of the lithosphere to support bands triple bands, between triple bands
perhaps relaxed. and icy plains;a load. Few triple bands are observed at latitudes higherbrighter than plainsthan 1/2 608, for example, perhaps because of the greaterat long wavelengthsthickness of the ice shell toward the poles. Subsequent
brightening and ultimate erasure takes place over timescales which may depend on the rate of topographic relax-ation (faster near the equator) or the flux of charged parti-cles (greater on the trailing side). particularly at longer wavelengths. Qualitatively similar
distributions result from the spectral mapping when a valueWhile we cannot be sure that any given crack will evolveinto a ridge, or ridge into a triple band, we can assert with of L 5 0.7 (Buratti and Veverka 1983) is used instead.
Each pixel in the image cube is compared to the refer-some confidence that the bright ancient bands seen in themultispectral data are the products of formerly dark red– ence spectra of the type areas and accepted as a member
of the class if it falls within a given range of the targetbrown lineae such as triple bands, and that the presentlyprominent triple bands started out as mere incipient cracks. mean radiance at every wavelength, where the range is
specified in terms of the target spectrum’s standard devia-This is sufficient for the purpose of interpreting the resultsof the next section. tion. Each type area is classified independently, and the
results are combined to form classes. Type areas definedfor the triple bands included Minos, Cadmus, and Asterius5. ORIENTATION OF LINEAMENTSLineae. Areas chosen to be representative of the ancient
Because of the diverse spectral and morphological char- bands include the bright wedge AB5 and several lineaeacteristics of europan lineaments, their orientations can be running parallel to the wedge that could clearly be seenmapped without presupposing any particular model for to predate the triple bands. Both types of lineae weretheir formation. Both the bright ancient bands and the sampled at several points along their lengths, to allow fordark triple bands can be easily distinguished on the basis imperfections in the photometric correction. The youngerof their color and albedo contrast with the icy plains. These incipient cracks in this area cannot be mapped on the basisspectral units were mapped in the area of G1 four-color of their color characteristics and were simply defined tocoverage using a supervised classification approach. Spec- include all narrow fractures younger than the triple bandstra of ‘‘type areas’’ representative of the target lineaments without discernible relief or color differences; they werewere measured from images photometrically corrected for traced along their lengths in the green filter image—theillumination and viewing geometry using a Lunar–Lambert sharpest of the four-color set.function of the form (Buratti 1984, McEwen 1991) The results are shown in Fig. 13. The stratigraphically
oldest lineaments, those with spectral reflectance similarRF 5 R0[2Le0/(e0 1 e) 1 (1 2 L)e0], to the bright wedge AB5, generally tend to have south-
west–northeast orientations (Fig. 13A). The intermediateaged triple bands trend generally east–west (Fig. 13B),where RF is the recorded radiance, R0 is the corrected
radiance or normal albedo, e0 and e are the cosines of the while the youngest lineaments have northwest–southeasttrends, roughly radial to the antijove point (Fig. 13C). Inincidence and emission angles, respectively, and L is an
empirically chosen constant equal to 0.4 (here assumed this part of Europa, the orientations of the lineaments varysystematically with age, suggesting that the principal stressindependent of wavelength). This value of L best serves to
flatten the brightness variations across the disk of Europa, directions have rotated clockwise over time. Several as-

120 GEISSLER ET AL.
FIG. 12. High-resolution examples of lineaments representative of (A) simple fractures, (B) double-ridges, (C) multiple ridged triple bands(Asterius Linea) and (D) ancient, topographically relaxed bands. Scale bars are 5 km (picture numbers E6E0051 (A), E6E0050 (C), E6E0074 (Band D)).
FIG. 13. Spectral maps showing systematic rotation of lineaments with stratigraphic age. (A) Bright ancient bands trend southwest–northeast;(B) dark, intermediate aged triple bands trend generally east–west; young incipient fractures trend northwest–southeast, roughly radial to theantijove point. In (B), ‘‘1’’ and ‘‘2’’ refer to the order of placement of two prominent triple bands, Minos (TB3) and Cadmus (TB1) Lineae, while‘‘R’’ marks Rhadamanthys Linea (Fig. 10).

EVOLUTION OF LINEAMENTS ON EUROPA 121
pects of the spectral mapping results should be emphasized.First, the maps show the average orientations of numerousbands interpreted to be widely separated in age. The gen-eral sense of rotation is suggested by the crosscutting rela-tionships at several major lineament intersections—for ex-ample, the younger of the two prominent triple bands(Cadmus Linea, marked ‘‘2’’ in Fig. 13B) has a more north-westerly trend than the older (Minos Linea, marked ‘‘1’’),consistent with clockwise rotation. However, there are nu-merous exceptions to this rule, particularly among lineaeof similar age, and intersections between particular pairsof bands often run counter to the general trend. Reasonsfor this may include the tendency for faults to follow preex-isting crustal weaknesses and the occurrence of fracturesin conjugate sets. We are aided in our analysis by the factsthat relationships are established over a wide area (theimages extend over 1500 km in the east–west direction),
FIG. 14. Clockwise rotation of stress directions over time as a resultbetween lineaments distinctly different in age, and betweenof nonsynchronous planetary rotation. As the surface gradually migrateslineaments that have certain morphological elements ineastward, it fractures in the direction perpendicular to the maximumcommon, including great lengths and straight, nearly lineartensile stresses (shown as contours).
planforms—no wedges and few arcuate ridges are presentin the region. An interesting detail is the inclusion of themargins of Minos with the older bright materials, inagreement with other indications that bands begin bright- Europa’s forced eccentricity, but shifted eastward by non-ening along their outside edges (Section 3). Finally, we synchronous rotation over much longer time scales (cf.note that Rhadamanthys Linea (marked ‘‘R’’ in Fig. 13B) Greenberg et al. 1998).has spectral characteristics similar to fully developed triplebands, but an orientation closer to that of the youngest 6. AN ACTIVE LINEAMENT?fractures (Fig. 13C). As mentioned in Section 3, Rhada-manthys’ morphology is also transitional between that of Of Europa’s many diverse lineaments, Agenor Linea
demands particular attention. Only partially imaged byfractures/ridges and that of triple bands, supporting thesuggestion (Belton et al. 1996) that the lineament may be Voyager, Agenor and its short companion Katreus Linea
to the north were seen as narrow E–W trending bandsa triple band seen at an early stage of formation.Nonsynchronous planetary rotation may provide an ex- that were brighter than comparable lineaments and
younger than any others in the region (Pieri 1981, Lucchittaplanation for the apparent changes in orientation of thenorthern hemisphere lineaments (Geissler et al. 1998). Cal- et al. 1981, Lucchitta and Soderblom 1982, Schenk and
McKinnon 1989). Galileo has now mapped the entire 1500-culations by Greenberg and Weidenschilling (1984) predictthat Europa may rotate slightly faster than the synchronous km length of Agenor at moderate resolution (Fig. 15) and
measured the spectral and photometric properties of thisrate, due to tidal torques caused by Europa’s orbital eccen-tricity. As Europa’s surface is reoriented relative to the interesting feature. It is located in southern mid latitudes
from 378 to 448 S, and closely circumscribes the equatorialtidal figure, the pattern of stresses experienced in the north-ern hemisphere should rotate clockwise, consistent with rift zone of wedge-shaped bands west of the antijove point.
Its position and orientation are such that its maximumthe observations (Fig. 14). This is equally true whetherthe fractures are produced by the daily tidal distortions diurnal tensional stress (due to tidal flexing, as Europa
orbits Jupiter) coincides with the tensional stress due to(Helfenstein and Parmentier 1980) or by the long-termstresses induced by nonsynchronous rotation itself (Hel- long-term rotational reorientation (Greenberg et al. 1998,
Hoppa et al. 1998), making it a likely candidate for recentfenstein and Parmentier 1985, McEwen 1986a). Interest-ingly, the orientation of the youngest fractures (incipient and perhaps current activity. Agenor was noted in high
phase angle Voyager images to be relatively blue at visiblecracks, along with Rhadamanthys Linea) is roughly radialto the antijove point. This is not consistent with the stress wavelengths compared to other europan terrains (Schenk
and McKinnon 1989). From Galileo data it is now clearpattern predicted for nonsynchronous rotation, which isdisplaced 458 to the east (Helfenstein and Parmentier that Agenor’s color is markedly phase-angle dependent.
Measured at low phase (2.28, during G2) its spectrum is1985), but instead fits the current tidal stress regime. Thelineaments may be produced by diurnal stresses due to relatively neutral, similar to the bright rays of crater Pwyll.
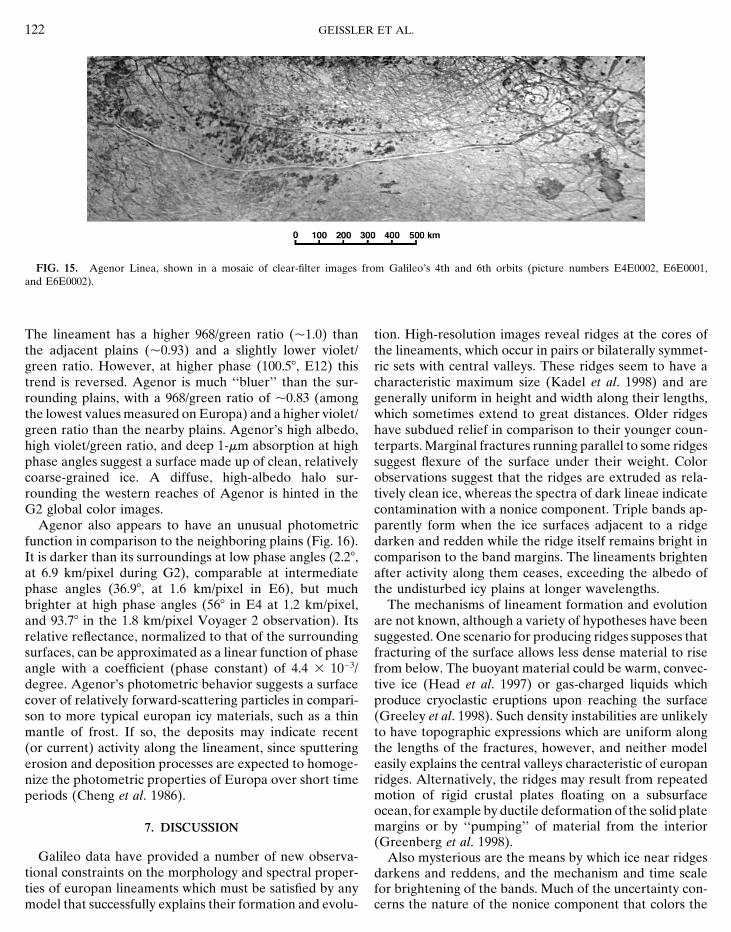
122 GEISSLER ET AL.
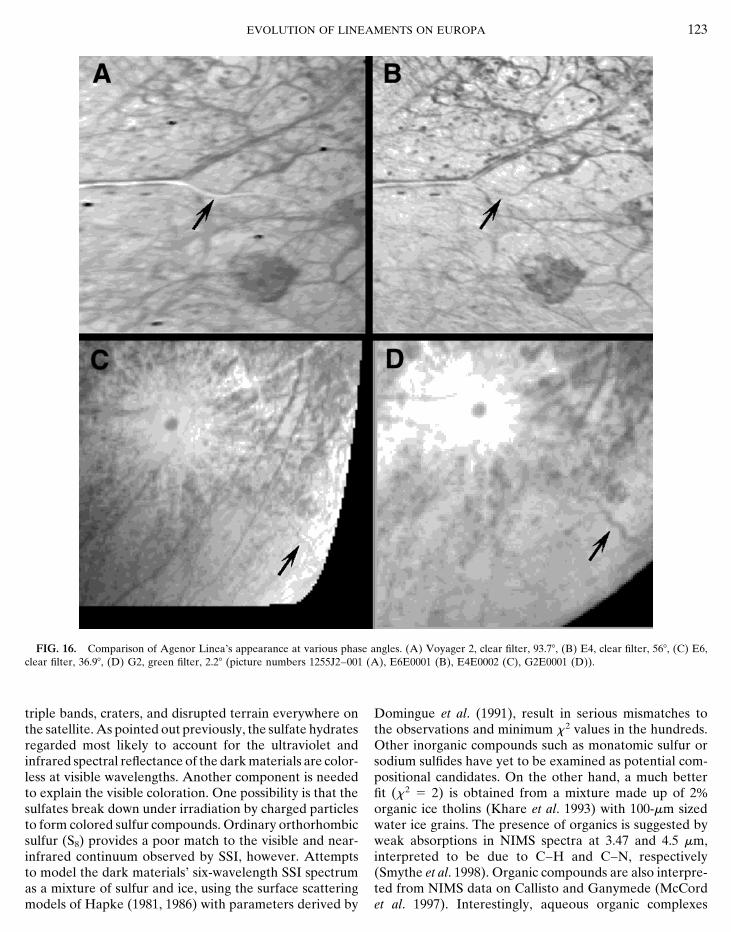
FIG. 15. Agenor Linea, shown in a mosaic of clear-filter images from Galileo’s 4th and 6th orbits (picture numbers E4E0002, E6E0001,and E6E0002).
The lineament has a higher 968/green ratio (p1.0) than tion. High-resolution images reveal ridges at the cores ofthe lineaments, which occur in pairs or bilaterally symmet-the adjacent plains (p0.93) and a slightly lower violet/
green ratio. However, at higher phase (100.58, E12) this ric sets with central valleys. These ridges seem to have acharacteristic maximum size (Kadel et al. 1998) and aretrend is reversed. Agenor is much ‘‘bluer’’ than the sur-
rounding plains, with a 968/green ratio of p0.83 (among generally uniform in height and width along their lengths,which sometimes extend to great distances. Older ridgesthe lowest values measured on Europa) and a higher violet/
green ratio than the nearby plains. Agenor’s high albedo, have subdued relief in comparison to their younger coun-terparts. Marginal fractures running parallel to some ridgeshigh violet/green ratio, and deep 1-em absorption at high
phase angles suggest a surface made up of clean, relatively suggest flexure of the surface under their weight. Colorobservations suggest that the ridges are extruded as rela-coarse-grained ice. A diffuse, high-albedo halo sur-
rounding the western reaches of Agenor is hinted in the tively clean ice, whereas the spectra of dark lineae indicatecontamination with a nonice component. Triple bands ap-G2 global color images.
Agenor also appears to have an unusual photometric parently form when the ice surfaces adjacent to a ridgedarken and redden while the ridge itself remains bright infunction in comparison to the neighboring plains (Fig. 16).
It is darker than its surroundings at low phase angles (2.28, comparison to the band margins. The lineaments brightenafter activity along them ceases, exceeding the albedo ofat 6.9 km/pixel during G2), comparable at intermediate
phase angles (36.98, at 1.6 km/pixel in E6), but much the undisturbed icy plains at longer wavelengths.The mechanisms of lineament formation and evolutionbrighter at high phase angles (568 in E4 at 1.2 km/pixel,
and 93.78 in the 1.8 km/pixel Voyager 2 observation). Its are not known, although a variety of hypotheses have beensuggested. One scenario for producing ridges supposes thatrelative reflectance, normalized to that of the surrounding
surfaces, can be approximated as a linear function of phase fracturing of the surface allows less dense material to risefrom below. The buoyant material could be warm, convec-angle with a coefficient (phase constant) of 4.4 3 1023/
degree. Agenor’s photometric behavior suggests a surface tive ice (Head et al. 1997) or gas-charged liquids whichproduce cryoclastic eruptions upon reaching the surfacecover of relatively forward-scattering particles in compari-
son to more typical europan icy materials, such as a thin (Greeley et al. 1998). Such density instabilities are unlikelyto have topographic expressions which are uniform alongmantle of frost. If so, the deposits may indicate recent
(or current) activity along the lineament, since sputtering the lengths of the fractures, however, and neither modeleasily explains the central valleys characteristic of europanerosion and deposition processes are expected to homoge-ridges. Alternatively, the ridges may result from repeatednize the photometric properties of Europa over short timemotion of rigid crustal plates floating on a subsurfaceperiods (Cheng et al. 1986).ocean, for example by ductile deformation of the solid platemargins or by ‘‘pumping’’ of material from the interior7. DISCUSSION(Greenberg et al. 1998).
Galileo data have provided a number of new observa- Also mysterious are the means by which ice near ridgestional constraints on the morphology and spectral proper- darkens and reddens, and the mechanism and time scaleties of europan lineaments which must be satisfied by any for brightening of the bands. Much of the uncertainty con-
cerns the nature of the nonice component that colors themodel that successfully explains their formation and evolu-
EVOLUTION OF LINEAMENTS ON EUROPA 123
FIG. 16. Comparison of Agenor Linea’s appearance at various phase angles. (A) Voyager 2, clear filter, 93.78, (B) E4, clear filter, 568, (C) E6,clear filter, 36.98, (D) G2, green filter, 2.28 (picture numbers 1255J2–001 (A), E6E0001 (B), E4E0002 (C), G2E0001 (D)).
triple bands, craters, and disrupted terrain everywhere on Domingue et al. (1991), result in serious mismatches tothe observations and minimum x 2 values in the hundreds.the satellite. As pointed out previously, the sulfate hydrates
regarded most likely to account for the ultraviolet and Other inorganic compounds such as monatomic sulfur orsodium sulfides have yet to be examined as potential com-infrared spectral reflectance of the dark materials are color-
less at visible wavelengths. Another component is needed positional candidates. On the other hand, a much betterfit (x 2 5 2) is obtained from a mixture made up of 2%to explain the visible coloration. One possibility is that the
sulfates break down under irradiation by charged particles organic ice tholins (Khare et al. 1993) with 100-em sizedwater ice grains. The presence of organics is suggested byto form colored sulfur compounds. Ordinary orthorhombic
sulfur (S8) provides a poor match to the visible and near- weak absorptions in NIMS spectra at 3.47 and 4.5 em,interpreted to be due to C–H and C–N, respectivelyinfrared continuum observed by SSI, however. Attempts
to model the dark materials’ six-wavelength SSI spectrum (Smythe et al. 1998). Organic compounds are also interpre-ted from NIMS data on Callisto and Ganymede (McCordas a mixture of sulfur and ice, using the surface scattering
models of Hapke (1981, 1986) with parameters derived by et al. 1997). Interestingly, aqueous organic complexes

124 GEISSLER ET AL.
should be expected to brighten upon exposure to the sur- 4. Based on the few triple-bands so far imaged at highresolution, the dark, red–brown coloration of ice surfacesface of Europa. McDonald and Ockert-Bell (1997) present
the results of a laboratory experiment in which an organic adjacent to ridges and multiple-ridge sets becomes evidentonly after activity along the lineament ceases. The colorsample with water frost was irradiated by low-energy
charged particles. The sample’s visible absorbance was of triple bands is indistinguishable from that of thermallydisrupted terrain and ejecta of recent craters like Pwyll,measurably reduced as the carbon–carbon double bonds
transformed into single bonds by reactions with water radi- suggesting a single, as yet unidentified nonice contaminantwhich is uniformly distributed in the shallow subsurface.olysis products: simple organic breakdown that ultimately
leads to carbon dioxide. Because they are soluble, the 5. Ancient bands are observed to have brightened atlong wavelengths beyond the albedo of the undisturbedtholins (or similar compounds) could be dissolved along
with salts and other materials in a subsurface liquid layer icy plains and not merely faded as believed on the basisof Voyager data. Because bands brighten and ultimatelyand exposed wherever the surface has been penetrated by
impactors, melted from below, or fractured by changing disappear, the continued presence of dark lineaments mayplace constraints on the age of geologic activity on Europa.global stresses.
6. Spectral mapping of lineaments in Europa’s northpolar region suggests a clockwise rotation of stress direc-tion with time, consistent with faster-than-synchronous8. SUMMARYplanetary rotation.
Galileo imaging observations have enlarged our knowl- 7. Agenor Linea’s spectral and photometric propertiesedge of europan lineaments in two fundamental ways. First, are consistent with a surface covering of frost, suggestinghigh-resolution images have sampled these landforms in recent or perhaps current activity along this unusual linea-several different locations, shedding light on the morpho- ment. Agenor is targeted for high-resolution, stereo, andlogical characteristics of lineae in various stages of develop- color observations during Galileo’s extended mission, be-ment. Second, multispectral observations in the near-infra- ginning with orbit E16 in July, 1998.red have revealed ancient lineae scarcely distinguishableat shorter wavelengths, allowing inference of systematic ACKNOWLEDGMENTSchanges in the orientation of the lineaments with time.
We thank B. K. Lucchitta and B. J. Buratti for constructive reviewsThe new insights provided by Galileo and their possibleand J. M. Moore for helpful discussion. The spectral modeling was per-implications may be summarized as follows:formed at Cornell University under the direction of the late Carl Saganand with the help of P. Wilson, G. McDonald and W. Calvin.
1. Indications from both the high-resolution and colordata suggest that the lineaments progress through an evolu-
REFERENCEStionary sequence over time. All start out as simple cracks,but favorably positioned fractures form marginal ridges, a Belton, M. J. S., K. P. Klaasen, M. C. Clary, J. L. Anderson, C. D. Anger,
M. H. Carr, C. R. Chapman, M. E. Davies, R. Greeley, D. Anderson,process which may be repeated until multiple ridged tripleL. K. Bolef, T. E. Townsend, R. Greenberg, J. W. Head III, G. Neukum,bands develop. These bands ultimately brighten and vis-C. B. Pilcher, J. Veverka, P. J. Gierasch, F. P. Fanale, A. P. Ingersoll,cously relax, leaving a landscape crisscrossed with a net-H. Masursky, D. Morrison, and J. B. Pollack 1992. The Galileo solid-
work of chaotically interwoven lineae. state imaging experiment. Space Sci. Rev. 60, 413–455.2. The youngest lineaments seem to be tensional frac- Belton, M. J. S., J. Head, A. Ingersoll, R. Greeley, A. McEwen, K.
tures which meander and change direction, taking advan- Klaasen, D. Senske, R. Pappalardo, G. Collins, A. Vasavada, R. Sulli-van, D. Simonelli, P. Geissler, M. Carr, M. Davies, J. Veverka, P.tage of preexisting crustal weaknesses. The youngest frac-Gierasch, D. Banfield, M. Bell, C. Chapman, C. Anger, R. Greenberg,tures visible in the G1 color observations are orientedG. Neukum, C. Pilcher, R. Beebe, J. Burns, F. Fanale, W. Ip, T. V.roughly radial to the antijove point, suggesting that theseJohnson, D. Morrison, J. Moore, G. Orton, P. Thomas, and R. West
particular lineaments formed in response to tidal stresses. 1996. Galileo’s first images of Jupiter and the Galilean satellites. Science3. Lineament formation appears to be the dominant 274, 377–385.
resurfacing mechanism on Europa, and every landscape Buratti, B. 1984. Voyager disk-resolved photometry of the saturniansatellites. Icarus 59, 392–405.that has escaped erasure by heating from below is im-
printed with generation after generation of intersecting Buratti, B., and J. Veverka 1983. Voyager photometry of Europa. Icarus55, 93–110.ridges at various scales and orientations. Recently devel-
Carlson, R., W. Smythe, K. Baines, E. Barbinis, K. Becker, R. Burns, S.oped ridges appear to be made up of relatively clean ice,Calcutt, W. Calvin, R. Clark, G. Danielson, A. Davies, P. Drossart, T.suggesting segregation of materials from the murky inte-Encrenaz, F. Fanale, J. Granahan, G. Hansen, P. Herrera, C. Hibbitts,
rior. The colors of the cracks and ridges may account for J. Hui, P. Irwin, T. Johnson, L. Kamp, H. Kieffer, F. Leader, E. Lellouch,the distinctive hue of the satellite in comparison to the R. Lopes-Gautier, D. Matson, T. McCord, R. Mehlman, A. Ocampo,
G. Orton, M. Roos-Serote, M. Segura, J. Shirley, L. Soderblom, A.other icy moons of Jupiter.

EVOLUTION OF LINEAMENTS ON EUROPA 125
Stevenson, F. Taylor, J. Torson, A. Weir, and P. Weissman 1996. Near- Helfenstein, P., N. Currier, B. E. Clark, J. Veverka, M. Bell, R. Sullivan,infrared spectroscopy and spectral mapping of Jupiter and the Galilean J. Klemaszewski, R. Greeley, R. T. Pappalardo, J. W. Head III, T.satellites: Results from Galileo’s initial orbit. Science 274, 385–388. Jones, K. Klaasen, K. Magee, P. Geissler, R. Greenberg, A. McEwen,
C. Phillips, T. Colvin, M. Davies, T. Denk, G. Neukum, and M. J. S.Cheng, A. F., P. K. Haff, R. E. Johnson, and L. J. Lanzerotti 1986.Belton 1998. Galileo observations of Europa’s Opposition Effect.Interactions of planetary magnetospheres with icy satellite surfaces. InIcarus 135, 41–63.Satellites of Jupiter (D. Morrison, Ed.), pp. 403–436. Univ. of Arizona
Press, Tucson. Hendrix, A. R., C. A. Barth, C. W. Hord, A. I. Stewart, W. R. Pryor,Clark, B. E., P. Helfenstein, J. Veverka, M. Ockert-Bell, R. J. Sullivan, K. E. Simmons, W. E. Mcclintock, J. J. Gebben, J. M. Ajello, K. L.
P. E. Geissler, C. B. Phillips, A. S. McEwen, R. Greeley, G. Neukum, Naviaux, J. J. Aiello, A. L. Lane, W. K. Tobiska, and S. K. StephensT. Denk, K. Klaasen, and the Galileo SSI Team 1998. Multispectral 1996. Galileo ultraviolet spectrometer observations of Europa. Bull.terrain analysis of Europa from Galileo images. Icarus 135, 95–106. Am. Astron. Soc. 28, 1140.
Domingue, D. L., B. W. Hapke, G. W. Lockwood, and D. T. Thompson Hoppa, G., R. Greenberg, P. Geissler, B. R. Tufts, C. B. Phillips, D.1991. Europa’s phase curve—Implications for surface structure. Icarus Durda, and the Galileo Imaging Team 1998. Comparison of global90, 30–42. stress models with geographical features on Europa. Lunar Planet.
Fanale, F., J. Granahan, T. McCord, G. Hansen, R. Carlson, D. Matson, Sci. XXIX, Abstract 1865, Lunar and Planetary Institute, Houston.A. Ocampo, L. Kamp, W. Smythe, F. Leader, R. Mehlman, R. Greeley, [CD-ROM]R. Sullivan, P. Geissler, C. Barth, A. Hendrix, B. Clark, P. Helfenstein, Johnson, T. V., J. A. Mosher, P. Kupferman, L. A. Soderblom, G. E.J. Veverka, M. J. S. Belton, K. Becker, and T. Becker 1998, Galileo’s Danielson, and A. F. Cook 1983. Global multispectral mosaics of themulti-instrument spectral view of Europa’s surface composition. icy Galilean satellites. J. Geophys. Res. 88, 5789–5805.Icarus, submitted.
Kadel, S. D., S. A. Fagents, and R. Greeley 1998. Trough-bounding ridgeGeissler, P., W. R. Thompson, R. Greenberg, J. Moersch, A. McEwen, pairs on Europa—Considerations for an endogenic model of formation.
and C. Sagan 1995. Galileo multispectral imaging of Earth. J. Geophys.Lunar Planet. Sci. XXIX, Abstract 1078. Lunar and Planetary Institute,
Res. 100, 16,895–16,906.Houston. [CD-ROM]
Geissler, P., R. Greenberg, G. Hoppa, P. Helfenstein, A. McEwen, R.Klaasen, K., M. Belton, H. Breneman, A. McEwen, M. Davies, R. Sulli-Pappalardo, R. Tufts, M. Ockert-Bell, R. Sullivan, R. Greeley, M. J. S.
van, C. Chapman, G. Neukum, C. Heffernan, A. Harch, J. Kaufman,Belton, T. Denk, B. Clark, J. Burns, J. Veverka, and the Galileo ImagingW. Merline, L. Gaddis, W. Cunningham, P. Helfenstein, and T. ColvinTeam 1998. Evidence for non-synchronous rotation of Europa. Nature1997. Inflight performance characteristics, calibration, and utilization391, 368–371.of the Galileo SSI camera. Opt. Eng. 36, 3001–3027.
Geissler, P., C. Phillips, and T. Denk 1996. The color of Europa: Compari-Leith, A. C., and W. B. McKinnon 1996. Is there evidence for polarsons with Ganymede, Callisto and Antarctica (No. 8.5). Workshop on
wander on Europa? Icarus 120, 387–398.Remote Sensing of Planetary Ices: Earth and other Solid Bodies, Flag-staff, Arizona, June 11–13, 1996. [Abstract] Lucchitta, B. K., L. A. Soderblom, and H. M. Ferguson 1981. Structures
on Europa. Proc. Lunar Planet. Sci. 12, 1555–1567.Greeley, R., R. Sullivan, J. Klemaszewski, K. Homan, J. W. Head III,R. T. Pappalardo, J. Veverka, B. E. Clark, T. Johnson, K. P. Klaasen, Lucchitta, B. K., and L. A. Soderblom 1982. Geology of Europa. InM. Belton, J. Moore, E. Asphaug, M. H. Carr, G. Neukum, T. Denk, Satellites of Jupiter (D. Morrison, Ed.), pp. 521–555. Univ. of ArizonaC. R. Chapman, C. B. Pilcher, P. E. Geissler, R. Greenberg, and R. Tufts Press, Tucson.1998. Europa: Initial Galileo geological observations. Icarus 135, 4–24. McCord, T. B., R. Carlson, W. Smythe, G. Hansen, R. Clark, C. Hibbitts,
Greenberg, R., and S. Weidenschilling 1984. How fast do Galilean satel- F. Fanale, J. Granahan, M. Segura, D. Matson, T. Johnson, and P.lites spin? Icarus 58, 186–196. Martin 1997. Organics and other molecules in the surfaces of Callisto
Greenberg, R., P. Geissler, G. Hoppa, B. R. Tufts, D. D. Durda, R. and Ganymede. Science 278, 271–275.Pappalardo, J. W. Head, R. Greeley, R. Sullivan, and M. H. Carr 1998. McCord, T. B., G. Hansen, F. P. Fanale, R. W. Carlson, D. Matson, T. V.Tectonic processes on Europa: Tidal stresses, mechanical response, Johnson, W. Smythe, J. K. Crowley, P. D. Martin, A. Ocampo, C. A.and visible features. Icarus 135, 64–78.
Hibbitts, J. C. Granahan, and the Galileo NIMS team 1998. Salts onHapke, B. 1981. Bidirectional reflectance spectroscopy. 1. Theory. J. Europa’s Surface From the Galileo NIMS Investigation. Lunar Planet.
Geophys. Res. 86, 4571–4586. Sci. XXIX, Abstract 1560. Lunar and Planetary Institute, Houston.Hapke, B. 1986. Bidirectional reflectance spectroscopy. IV—The extinc- [CD-ROM]
tion coefficient and the opposition effect. Icarus 67, 264–280.McDonald, G. D., and M. E. Ockert-Bell 1997. Oxidative destruction of
Head, J. W., R. T. Pappalardo, R. Greeley, R. J. Sullivan, C. Pilcher, G. polymeric material on the surface of Europa. Lunar Planet. Sci. XXIII,Schubert, W. Moore, M. Carr, J. Moore, and M. Belton 1997. Evidence Abstract 1475. Lunar and Planetary Institute, Houston. [CD-ROM]for recent solid-state convection on Europa: The nature of pits, domes,
McEwen, A. S. 1986a. Tidal reorientation and the fracturing of Jupiter’sspots, and ridges. Bull. Am. Astron. Soc. 29, 983. [Abstract]moon Europa. Nature 321, 49–51.
Helfenstein, P., and A. F. Cook 1984. Active venting of Europa? AnalysisMcEwen, A. S. 1986b. Exogenic and endogenic albedo and color patternsof a transient bright surface feature. Lunar Planet. Sci. Conf. XV,
on Europa. J. Geophys. Res. 91, 8077–8097.354–355. [Abstract]McEwen, A. S. 1991. Photometric functions for photoclinometry andHelfenstein, P., and E. M. Parmentier 1980. Fractures on Europa: Possible
other applications. Icarus 92, 298–311.response of an ice crust to tidal deformation. Proc. Lunar Planet. Sci.Conf. 11th, pp. 1987–1998. Moore, J. M., E. Asphaug, R. J. Sullivan, J. E. Klemaszewski, K. C.
Bender, R. Greeley, P. E. Geissler, A. S. McEwen, E. P. Turtle, C. B.Helfenstein, P., and E. M. Parmentier 1983. Patterns of fracture and tidalstresses on Europa. Icarus 53, 415–430. Phillips, B. R. Tufts, J. W. Head III, R. T. Pappalardo, K. B. Jones,
C. R. Chapman, M. J. S. Belton, R. L. Kirk, and D. Morrison 1998.Helfenstein, P., and E. M. Parmentier 1985. Patterns of fracture and tidalLarge impact features on Europa: Results of the Galileo nominal mis-stresses due to nonsynchronous rotation: Implications for fracturing
on Europa. Icarus 61, 175–184. sion. Icarus 135, 127–145.
126 GEISSLER ET AL.
A. F. Cook, J. Boyce, G. E. Danielson, T. Owen, C. Sagan, R. Beebe,Ojakangas, G. W., and D. J. Stevenson 1989a. Thermal state of an iceshell on Europa. Icarus 81, 220–241. J. Veverka, R. Strom, J. McCauley, D. Morrison, G. Briggs, and V. E.
Soumi 1979a. The Jupiter system through the eyes of Voyager 1. ScienceOjakangas, G. W., and D. J. Stevenson 1989b. Polar wander of an ice204, 951–972.shell on Europa. Icarus 81, 242–270.
Pappalardo, R. T., and M. Coon 1996. A sea-ice analog for the surface Smith, B. A., L. A. Soderblom, R. Beebe, J. Boyce, G. Briggs, M. Carr,of Europa. Lunar Planet. Sci. Conf. XXVII, pp. 997–998. S. A. Collins, A. F. Cook, G. E. Danielson, M. E. Davies, G. E. Hunt,
A. Ingersoll, T. V. Johnson, H. Masursky, J. McCauley, D. Morrison,Pappalardo, R. T., and R. J. Sullivan 1996. Evidence for crustal separationT. Owen, C. Sagan, E. M. Shoemaker, R. Strom, V. E. Soumi, and J.on Europa. Icarus 123, 557–567.Veverka 1979b. The Galilean satellites and Jupiter: Voyager 2 imagingPieri, D. C. 1981. Lineament and polygon patterns on Europa. Natureresults. Science 206, 927–950.289, 17–21.
Smythe, W. D., R. W. Carlson, A. Ocampo, D. Matson, T. V. Johnson,Schenk, P. M., and W. B. McKinnon 1989. Fault offsets and lateral crustalmovement on Europa: Evidence for a mobile ice shell. Icarus 79, T. B. McCord, G. E. Hansen, L. A. Soderblom, and R. N. Clark 1998.75–100. Absorption bands in the spectrum of Europa detected by the Galileo
NIMS instrument. Lunar Planet. Sci. Conf. XXIX, Abstract 1532. LunarSmith, B. A., L. A. Soderblom, T. V. Johnson, A. Ingersoll, S. A. Collins,.E. M. Shoemaker, G. E. Hunt, H. Masursky, M. Carr, M. E. Davies, and Planetary Institute, Houston. [CD-ROM]