Evolution and deformation of the onshore Eucla Basin ...
72
RECORD 2016/10 EVOLUTION AND DEFORMATION OF THE ONSHORE EUCLA BASIN DURING THE CENOZOIC by LC Mounsher Government of Western Australia Department of Mines and Petroleum
Transcript of Evolution and deformation of the onshore Eucla Basin ...

RECORD 2016/10
EVOLUTION AND DEFORMATION
OF THE ONSHORE EUCLA BASIN
DURING THE CENOZOIC
by
LC Mounsher
Government of Western AustraliaDepartment of Mines and Petroleum

Record 2016/10
EVOLUTION AND DEFORMATION
OF THE ONSHORE EUCLA BASIN
DURING THE CENOZOIC
by
LC Mounsher
Perth 2016

MINISTER FOR MINES AND PETROLEUM
Hon. Sean K L’Estrange MLA
DIRECTOR GENERAL, DEPARTMENT OF MINES AND PETROLEUM
Richard Sellers
EXECUTIVE DIRECTOR, GEOLOGICAL SURVEY OF WESTERN AUSTRALIA
Rick Rogerson
REFERENCE
The recommended reference for this publication is:
Mounsher, LC 2016, Evolution and deformation of the onshore Eucla Basin during the Cenozoic: Geological Survey of Western
Australia, Record 2016/10, 70p.
National Library of Australia Card Number and ISBN PDF 978-1-74168-695-1
About this publication
This Record is an Honours thesis researched, written and compiled as part of a collaborative project between the Geological Survey
of Western Australia (GSWA) and Curtin University, Western Australia. Although GSWA has provided support for this project including
access to core, the scientific content of the Record, and the drafting of figures, was the responsibility of the author. No editing has been
undertaken by GSWA.
Disclaimer
This product was produced using information from various sources. The Department of Mines and Petroleum (DMP) and the State
cannot guarantee the accuracy, currency or completeness of the information. DMP and the State accept no responsibility and disclaim
all liability for any loss, damage or costs incurred as a result of any use of or reliance whether wholly or in part upon the information
provided in this publication or incorporated into it by reference.
Published 2016 by Geological Survey of Western Australia
This Record is published in digital format (PDF) and is available online at <www.dmp.wa.gov.au/GSWApublications>.
Further details of geological products and maps produced by the Geological Survey of Western Australia
are available from:
Information Centre
Department of Mines and Petroleum
100 Plain Street
EAST PERTH WESTERN AUSTRALIA 6004
Telephone: +61 8 9222 3459 Facsimile: +61 8 9222 3444
www.dmp.wa.gov.au/GSWApublications
Cover image: Elongate salt lake on the Yilgarn Craton — part of the Moore–Monger paleovalley — here viewed from the top of
Wownaminya Hill, 20 km southeast of Yalgoo, Murchison Goldfields. Photograph taken by I Zibra for the Geological Survey of Western
Australia

Department of Applied Geology
Honours Manuscript - 2013
Evolution and deformation of the onshore Eucla Basin during the Cenozoic
Lewis Clark Mounsher
Supervised and edited by Dr Milo Barham (Department of Applied Geology) and
Dr Michael O’Leary (Department of Environment and Agriculture)
A research project in partial fulfilment of the requirements of the unit ‘Geology Honours Dissertation 400’ for the degree Bachelor of Science (Honours) at Curtin University

Affirmation of Research
I hereby declare this to be a reflection of my own work. The following list details the
work I took on personally in the course of completing this project:
Field work: my supervisors and I surveyed the elevations of subsurface
carbonate horizons at 27 sites (predominately caves) across the Nullarbor and
Roe Plains. This was done over a period of 10 days.
Acquisition of supplementary data: I supplemented the field data set with
horizon elevations acquired from 63 drill holes. This data was sourced by
sifting through 100+ online drillhole logs retained by the Geological Survey of
South Australia. My supervisors and I also logged the depths of the carbonate
horizons in an additional 12 Eucla Basin cores at the Carlisle Core Library.
I created and managed a database of the field and supplementary data, and
interrogated the data within Esri ArcMap and Esri Arcscene to produce 2D and
3D models as required.
Fault analysis: I identified a number of faults on the Nullarbor and Roe Plains
using a DEM and conducted various analyses on them (including the
generation of displacement profiles and fault trace orientation analyses).
Lewis Mounsher

List of Contents
1.0 Introduction.....................................................................................................12.0 Regional Setting..............................................................................................1
2.1 Geological evolution of Australia’s southern margin .........................................2
2.2 Eucla Basin stratigraphy ...................................................................................2
2.2.1 Sedimentological descriptions of the Eucla Platform limestones............3
2.3 An overview of Cenozoic tectonics in the onshore Eucla Basin........................5
3.0 Materials and Methods ...................................................................................7
3.1 Acquisition of contact elevation data.................................................................7
3.1.1 Field data acquisition .............................................................................8
3.1.2 Supplementary data acquisition .............................................................8
3.1.3 Analysis and visualisation of contact elevation data...............................9
3.2 Fault analyses.................................................................................................10
3.2.1 Generation of displacement profiles.....................................................10
3.2.2 Analysis of fault orientations ................................................................11
3.2.3 Review of magnetic data......................................................................11
4.0 Data ................................................................................................................11
4.1 Field data evidencing marine planation...........................................................11
4.2 Contact elevation data ....................................................................................12
4.3 Fault data........................................................................................................12
5.0 Data Interpretation ........................................................................................13
5.1 Character of the basal Nullarbor Limestone horizon.......................................13
5.2 Interpretation of fault data ...............................................................................14
6.0 Discussion.....................................................................................................15
6.1 The basal Nullarbor Limestone horizon – constraints on tilting.......................15
6.2 Localised faulting and the stress field .............................................................16
i

6.2.1 The continent-scale neotectonic stress field ........................................16
6.2.2 The local neotectonic stress field .........................................................17
6.3 Fault kinematics, growth rates and growth models .........................................18
6.3.1 Kinematics............................................................................................18
6.3.2 Fault growth rates ................................................................................19
6.3.3 Fault growth models.............................................................................20
6.4 The Mundrabilla Fault and historic stress field partitioning .............................20
7.0 Conclusions ..................................................................................................21
8.0 Acknowledgements ......................................................................................22
9.0 References ....................................................................................................23
10.0 Figures...........................................................................................................26
11.0 Tables ............................................................................................................51
12.0 Appendices ...................................................................................................52
ii

List of FiguresFigure 1 A map depicting the location and extent of the Eucla Basin…….. ..........26
Figure 2 Stratigraphic chart of the Eucla Basin……..............................................27
Figure 3 The inferred position of the Lasseter Shear Zone…….. .........................28
Figure 4 Locations of the 27 field sites and 75 additional sites from which
elevation data was obtained…….. ..........................................................29
Figure 5 Fault traces for the 46 Nullarbor and Roe Plains faults…….. .................30
Figure 6 The expression of the contact between the Abrakurrie Limestone and the
Mullamullang Member of the Nullarbor Limestone at Kutawala
Cave…….. ..............................................................................................31
Figure 7 The location of the Madura Quarry and the degree of horizontality of the
underlying planation surface.……...........................................................32
Figure 8 A model depicting the character of the basal Nullarbor Limestone
horizon.……............................................................................................33
Figure 9 Vertical displacement profiles for the 27 onshore faults deemed to be
significant.…….. ............................................................................... 34-36
Figure 10 A rose diagram depicting the strike orientation of faults (and discretely-
oriented fault segments) across the Nullarbor and Roe Plains……........37
Figure 11 Magnetic data (reduced to pole) acquired over the onshore portion of the
Eucla Basin…….. ...................................................................................38
Figure 12 Fault offsets ‘forced’ into the model of the basal Nullarbor Limestone
horizon.……............................................................................................39
Figure 13 Locations of the ~E-W transects across the Miocene palaeoshoreline and
the basal Nullarbor Limestone horizon.…….. .........................................40
Figure 14 The continent-scale neotectonic stress field, as predicted from plate
boundary force modelling…....................................................................41
Figure 15 Map of the southern margin displaying the limited stress data available
for the Eucla Basin surrounds.…….. ......................................................42
Figure 16 An example of the ambiguity encountered when examining fault system
kinematics on the karstified Eucla Platform.…….. ..................................43
iii

Figure 17 Characterisation of the onshore faults according to their respective ‘scarp
length to displacement’ ratios.…….. .......................................................44
Figure 18 A comparison of growth rates (m.Ma-1) for faults occurring on the
Nullarbor and Roe Plains.……................................................................45
Figure 19 Established fault growth models and an alternative growth model .........46
Figure 20 Evidence of fault linkage on the Eucla Platform…….. ............................47
Figure 21 Maps depicting crustal thickness and crustal temperature each showing a
distinct boundary in their respective parameter that aligns with the
position of the Mundrabilla Fault.…….....................................................48
Figure 22 Rose diagrams depicting strike orientations for faults located to the west
and east of the Mundrabilla Fault.…….. .................................................49
Figure 23 Growth patterns for faults situated either side of the Mundrabilla
Fault.…….. .............................................................................................50
List of TablesTable 1 Summary statistics for each of the 27 faults examined herein................51
iv

Abstract
The onshore component of the Eucla Basin, constituting the modern day Nullarbor and Roe
Plains, has traditionally been considered a tectonically quiescent domain. However, very few
studies have sought to substantiate this claim by considering the preserved evidence of
onshore deformation. This study investigates the Cenozoic tectonic evolution of the onshore
Eucla Basin through an examination of palaeo planation surfaces and an assessment of
upper crustal faulting. A Miocene planation surface is used as a benchmark to assess the
stratigraphic character of the basin, whilst the origin and nature of 46 onshore faults are
speculated upon according to derived fault displacement and orientation data.
No evidence of intrabasinal warping or folding is identified in the present-day expression of
the Miocene planation surface, however, an E-W elevation differential across this surface
implies that the basin has undergone a degree of long-wavelength tilting. This tilting aligns
with a previously described elevation differential recorded along an inboard Miocene
palaeoshoreline, and accordingly, it is attributed to the dynamic topographic uplift of
southwestern Australia. Analyses conducted on the suite of onshore faults suggest that they
likely developed under a neotectonic compressional regime. A component of strike slip
displacement or fault reactivation can be inferred from anomalously low ‘vertical
displacement : scarp length’ ratios, while the coincidence of DEM lineaments and deep
magnetic anomalies (indicative of fault displacement or juxtaposition of basement subcrop)
implies the faults likely propagated along pre-existing crustal weaknesses. Stress field
heterogeneity does not appear to have occurred across the expanse of the basin, as
established by a comparison of fault characteristics either side of the centrally located (and
historically significant) Mundrabilla Fault. Cumulatively, these findings describe a relatively
subdued deformation history that seemingly affirms the proposed notion of tectonic
quiescence.
Keywords
Eucla Basin; Nullarbor Plain; Roe Plain; Tectonics; Planation; Fault displacement
v

1.0 Introduction
The onshore component of the Eucla Basin is an emergent platform comprising an
accumulation of Cenozoic carbonates deposited atop rift-related clastic sediments (Lowry,
1970). The present-day surface of the platform is remarkably flat, and evidence of upper
crustal deformation across the region remains largely undocumented. This study seeks to
broaden the understanding of Cenozoic deformation in the onshore Eucla Basin through an
examination of fossil planation surfaces and an assessment of upper crustal faulting. These
planation surfaces will be treated as tectonic benchmarks which, in conjunction with the
faulting assessment, will shed light on the manner in which the platform evolved.
A number of factors combine to make the onshore Eucla Basin an ideal laboratory for studies
assessing Cenozoic deformation. Firstly, and perhaps most importantly, the basin is
geographically extensive and is characterised by the widespread development of distinctive
sedimentary units. When coupled with very low erosion rates, this provides an opportunity to
assess different types of upper crustal deformation operating over a range of temporal and
spatial scales. Additionally, the land surface is largely devoid of vegetative cover (which
readily exposes subtle landforms and outcrop), and intensive cave development across the
region provides access to subsurface stratigraphy in an area with few stratigraphic drillholes
(Burnett et al., 2013; Lowry, 1970).
The implications of understanding the tectonic history of the onshore Eucla Basin are varied.
In a broad sense, studies of this nature have the capacity to shed light on the processes
driving basin evolution on stable continental blocks. From a localised perspective, research
outcomes will benefit current and future greenfields mineral exploration endeavours and
hydrological studies. These findings complement the recent GSWA stratigraphic drilling
program, enabling a more resolved understanding of the cover development between limited
drillcore data. Furthermore, understanding the tectonic evolution of the Nullarbor Plain may
improve the accuracy of palaeo-sea level estimates that are derived from the present-day
elevations of ancient shorelines.
2.0 Regional Setting
The Eucla Basin lies on Australia’s southern margin, bounded by the Precambrian Musgrave
Province (to the north), the Gawler Craton (to the east) and the Yilgarn Craton (to the west;
Fig.1; Hou et al., 2008). With spatial dimensions of ~2000 km (east-west) by ~500 km (north-
south), the basin contains the most extensive onshore accumulation of Cenozoic marine
1

sediments recorded globally (Clarke et al., 2003). The onshore basin margins are taken as
the western, northern and eastern limits of the sedimentary Eucla Group units, whilst the
offshore extent is demarcated by the 200 m isobath on the continental shelf to the south
(Lowry, 1970). Given its location, the development and evolution of the Eucla Basin was
intimately tied to that of Australia’s southern margin.
2.1 Geological evolution of Australia’s southern margin
The Australian continent was adjoined to Antarctica and India from 520-180 Ma, forming the
eastern edge of the Gondwana supercontinent (Johnson, 2004). The Southern Australian
passive continental margin originated as a fracture in the supercontinent (McGowran, 1972),
which led to rifting and subsidence during the late-Jurassic to middle-Cretaceous (Veevers,
1984). The onset of seafloor spreading between the Australian and Antarctic continents
during the late-Cretaceous (Cenomanian) marked the beginning of Australia’s northward
drift, triggering the first incidence of marine-influenced sedimentation along the southern
margin (Li et al., 2003). Continental divergence continued at slow rates (~4 mm / yr) until the
middle Eocene (Veevers, 2000), when a significant increase in seafloor spreading rates
widened and deepened the gulf between the two continents (O'Connell, 2011). This
acceleration in spreading rates was followed by a series of marine transgressions, ultimately
forming a thick succession of carbonate deposits along Australia’s southern margin (Li et al.,
2003; McGowran et al., 1997). As such, the sedimentary sequence of the present-day
margin is typically expressed as a succession of Mesozoic terrigenous clastic sedimentary
rocks, overlain by Cenozoic marine clastics and carbonates (Stagg et al., 1999).
2.2 Eucla Basin stratigraphy
Sediments of the Eucla Basin are underlain by a lithologically variable basement, comprising
Precambrian granite, gneiss, schist and quartzite in the southwest, and Proterozoic
sedimentary rocks in the north (Lowry, 1970; O'Connell, 2011). Siliciclastic sediments of the
Loongana Formation and the conformable Madura Formation (heterolithics) were deposited
directly atop the basement during Cretaceous rifting, largely concealing undulations and
irregularities of the basement and forming a near-horizontal surface for the deposition of
subsequent units (Lowry, 1970). With the increase in marine influence prevailing in the
Cenozoic, and the resultant reduction in siliciclastic sedimentation, calcareous sandstones
and limestones of the Eucla Group were deposited atop the sequence (Fig. 2; O'Connell,
2

2011). The onshore expression of the Eucla Group limestone succession is termed the
‘Eucla Platform’ (O'Connell, 2011); incorporating the Wilson Bluff Limestone, the Abrakurrie
Limestone and the Nullarbor Limestone, with sediments from the later Plio-Pleistocene
transgression termed the Roe Calcarenite. These units are separated by Eocene to Miocene
subaerial disconformities (sequence boundaries of second and third order cycles),
representing the series of marine transgressions and regressions that influenced
sedimentation patterns along much of the southern margin (Li et al., 2003; O'Connell et al.,
2012). The depositional extent and thickness of each of the limestones varies according to
the magnitude and longevity of its corresponding transgressive event, but in spite of this,
each of the units appears to retain approximate horizontality at basin-scale and displays a
surprising degree of continuity across the platform (James and Bone, 2000). The limestones
of the Eucla Platform represent the key stratigraphic interval for this particular study.
2.2.1 Sedimentological descriptions of the Eucla Platform limestones
The Wilson Bluff Limestone
The middle- to late-Eocene Wilson Bluff Limestone is the basal carbonate unit of the Eucla
Platform. It is characteristically white, poorly-sorted, chalky and bryozoan-rich; commonly
bearing whole and fragmented echinoids, bivalves, brachiopods and foraminifers (Lowry,
1970). The chalkiness has been attributed to an abundance of indeterminate skeletal
fragments (Lowry, 1970), resulting in a dominance of mudstone, wackestone and packstone
textures (James and Bone, 1991). The Wilson Bluff Limestone extends to the inner margin of
the Eucla Platform (James and Bone, 1991), attaining a maximum (known) thickness of
approximately 300 m (Lowry, 1970). It is interpreted to have been deposited on a cool to
temperate continental shelf in water depths of 90 - 120 m (Lowry, 1970).
The Abrakurrie Limestone
Disconformably overlying the Wilson Bluff Limestone is the late-Oligocene to lower-Miocene
Abrakurrie Limestone (Webb and James, 2006). Two broad units are recognised. The lower
unit is a moderately well-sorted, thin-bedded, friable, bryozoan-rich calcarenite with
foraminifera (rotalid and miliolid), bivalves, brachiopods and echinoids (Craig, 2002; Lowry,
1970; O'Connell, 2011), and commonly displays cross-bedding (Craig, 2002). The upper unit
is indurated and thick-bedded, containing a notably higher abundance of echinoid tests
(whole and fragmented; Craig, 2002; O'Connell, 2011). It is cyclical in nature, with
hardground-capped individual cycles showing vertical gradations in grain size and faunal
assemblage (O'Connell, 2011). Serpulid worms, solitary corals, gastropods and coralline
algae are also present in particular regions of the upper and lower units, but are less
3

common than the aforementioned dominant biological constituents (James and Bone, 1991).
Microbioclastic micrite commonly forms the matrix of the Abrakurrie Limestone, seemingly
derived from the zooecia of cheilostome bryozoans (James and Bone, 1991). The Abrakurrie
Limestone occurs in the central region of the Eucla Platform as a lens-shaped deposit
(O'Connell, 2011). It attains a maximum thickness of ~90 m (Li et al., 1996), however, it has
been suggested that the original depositional thickness may have been greater to the south
(prior to the onset of Pleistocene marine erosion; Lowry, 1967). The Abrakurrie Limestone is
interpreted to have been deposited on a shallow, open shelf (Lowry, 1970), further defined by
Li et al. (1996) as a temperate-neritic environment with water depths of ~100 m.
The Nullarbor Limestone
The penultimate unit in the Cenozoic carbonate succession is the lower- to middle-Miocene
Nullarbor limestone. It disconformably overlies the Abrakurrie Limestone in the central region
of the platform (Webb and James, 2006), and the Wilson Bluff Limestone elsewhere
(O'Connell, 2011). Two discrete members are recognised: the basal Mullamullang Member,
and the conformable upper member (unofficially referred to as the Rawlinna Member).
The basal Mullamullang Member is an algal limestone comprising an accumulation of
nodular lithothamnium-type coralline algae (rhodoliths) within a matrix of comminuted algae
and foraminifera (Lowry, 1967). Floatstone and rudstone textures are dominant throughout
the member (O'Connell, 2011), and the abundance of rhodoliths gives the rock a distinctive
pink colouration on unweathered surfaces (O'Connell et al., 2012). The Mullamullang
Member of the Nullarbor Limestone represents a basal biostrome that underlies the more
diverse upper member, with a comparatively restricted distribution. It thickens southward
from its depocentre (the town of Madura), attaining a maximum thickness of approximately
10 m along the Hampton Range (Lowry, 1967). It is interpreted to represent a transgressive
rhodolith gravel deposit, typical of those that form in the lower photic zone (15 – 30 m) in
mesotrophic waters (O'Connell et al., 2012).
The upper member of the Nullarbor Limestone is, by comparison, lithologically diverse and
highly fossiliferous (O'Connell, 2011). The faunal assemblage of the unit is dominated by
fragmented echinoids, foraminifers (benthic and planktonic) and coralline algae, but also
contains bivalves, gastropods, serpulid worm tubes, bryozoans and scleractinian corals
(Lowry, 1967; O'Connell et al., 2012). Many skeletal grains display micrite envelopes under
magnification, and moldic preservation, particularly of bivalves and gastropods, is common
(Lowry, 1967). Textures range from mudstones to rudstones across the basin (James and
Bone, 1991), and the unit is generally well-cemented and devoid of sedimentary structures
(O'Connell, 2011). The Nullarbor Limestone upper member was deposited extensively across
4

the Eucla Platform, covering approximately 120,000 km2 of the present-day plateau surface
(O'Connell, 2011). Although its maximum depositional thickness is indeterminate (given the
effects of post-Miocene subaerial and submarine erosion), drillhole logs suggest that it
exceeds 50 m in parts. The upper member of the Nullarbor Limestone grades laterally into
the calcareous Colville Sandstone inboard, and is considered to represent widespread
shallow marine deposition (O'Connell, 2011). Lowry (1970) proposed that the unit was
deposited across a broad, open shelf that was characterized by good circulation, normal
marine salinities and water depths in the range of 30 – 45 m.
The Roe Calcarenite
The youngest limestone deposited on the Eucla Platform, the Roe Calcarenite, veneers the
Roe Plain; a marine erosional surface that was cut into the centre of the Great Australian
Bight during the late-Pliocene to early-Pleistocene (James and Bone, 2007). The calcarenite
is weakly lithified, coarse-grained, poorly-bedded and highly fossiliferous (Lowry, 1970). The
macro-faunal assemblage is dominated by molluscs (a diverse range of bivalves and
gastropods), echinoids, large benthic foraminifera and coralline algae (James and Bone,
2007). The finer-grained fraction of the rock comprises fragmented particles of echinoids,
foraminifera, serpulid worm tubes, molluscs and coralline algae (James and Bone, 2007).
Detrital clasts (including quartz grains, intraclasts and lithic fragments) typically constitute 10-
15% of the rock (James and Bone, 2007). Minor micrite occurs around bioclasts (Lowry,
1970), and the commonly occurring textures are rudstones, grainstones and floatstones
(James and Bone, 2007). The Roe Calcarenite was deposited relatively uniformly across the
Roe plain, covering approximately 8,000 km2 at a thickness of 2-3 m (James and Bone,
2007; Lowry, 1970). It disconformably overlies the Wilson Bluff Limestone in the eastern
parts of the Roe Plain, and the Abrakurrie Limestone elsewhere (Lowry, 1970). The
calcarenite has been broadly interpreted as a product of shallow marine, subtidal
sedimentation in a seagrass-dominated environment (James and Bone, 2007). The
composition of the faunal assemblage suggests that the shallow marine setting in which the
calcarenite accumulated was at least periodically influenced by tidal currents and/or open
ocean swell (James et al., 2006).
2.3 An overview of Cenozoic tectonics in the onshore Eucla Basin
The Nullarbor Plain has traditionally been considered a tectonically quiescent domain (Hillis
et al., 2008), with very few early studies considering the onshore evidence of Cenozoic
tectonic activity. In an extensive study of the Eucla Basin geology, Lowry (1970) made some
preliminary, yet important observations regarding local tectonic features. A northward
5

trending fault lying immediately north of the town of Madura was recognised as having a
significant amount of vertical displacement. Based on field observations, Lowry inferred that
this structure was associated with apparent folding to the south. Another substantial fault
approximately 25 km NNW of Caiguna was correlated with a geophysical gravity anomaly,
with the resultant assessment of the data revealing that the fault plane was likely very steep
(dipping at approximately 89° to the west). Given the linearity of the fault scarps identified at
the time, and the traditional inference of relative tectonic quiescence, Lowry postulated that
the faults were most likely to have a normal sense of displacement.
More recently, the tectonic history of the onshore Eucla Basin has received greater attention
from the scientific community. Studies of Australian ‘neotectonic’ deformation (defined as
deformation that occurred under the current crustal stress regime) have reviewed faulting on
the Nullarbor Plain as a means of investigating intraplate deformation in stable continental
regions. Clark et al. (2012) recognised a large number of previously unidentified faults in the
Nullarbor region via a digital elevation model, concluding that maximum vertical
displacements had not exceeded a few tens of metres over the last 15 million years. This
corresponds to average neotectonic slip rates of 1-3 m Ma-1; values that have been said to
reflect the continuing tectonic stability of the local Proterozoic basement (Clark et al., 2012).
Given the shortage of local stress field data from the Nullarbor region, and the approximately
N-S orientation of many of the fault scarps being scrutinised, it has been proposed that this
deformation occurred in response to the regional-scale, E-W oriented maximum horizontal
stress that has been inferred from plate boundary force modelling (Hillis et al., 2008). Current
research has also highlighted the tectonic significance of one particular fault, the Mundrabilla
Fault, which occurs in the south-central region of the Nullarbor Plain. Although this fault
initially appears to be a localised feature on the Plain, it is thought to correlate with the N-S
trending, continent-scale Lasseter Shear Zone (Fig. 3; D'Ercole and Lockwood, 2003). Whilst
the current research effort is largely focused on large-scale Precambrian motions on the
shear, it has been suggested that the Mundrabilla Fault is lithospheric-scale and it may be
sustaining a large differential stress (A Aitken 2013, pers. comm., 11 Sep.).
The Eucla Basin has also yielded important evidence of continent-scale Cenozoic crustal
deformation. Sandiford (2007) noted a distinct latitudinal asymmetry in the geomorphology of
the Australian landmass, expressed through a number of irregularities in the sedimentary
record. The continental shelf along Australia’s southern margin is characteristically 20 – 200
km wide. Onshore, Cenozoic marine sediments have been preserved up to 250 m above the
present-day sea level. In contrast, the continental shelf along Australia’s northern margin is
typically 200 – 500 km in width, with Cenozoic marine sediments lying almost exclusively
below present-day sea level. When the eustatic signal is eliminated, this data implies that
6
significant continent-scale tilting transpired throughout the Cenozoic (SW up, NNE down),
generating a total differential vertical displacement of as much as 300 m over the last 15
million years (Sandiford, 2007). This apparent uplift of the south western region of the
continent is also evidenced by variability in the present-day elevations of coeval (early
Neogene) palaeoshorelines, which decrease eastward by approximately 150 m over a 760
km interval in the onshore Eucla Basin (Quigley et al., 2010; Sandiford, 2007). The primary
mechanism believed to be responsible for this long-wavelength (103 km) tilting is dynamic
topography - defined as upper crustal deflection in response to differential mantle buoyancy
patterns (Quigley et al., 2010). Zones of mantle downwelling are manifested at the earth’s
surface as topographic lows, and upwellings tend to produce topographic highs (Sandiford,
2007). For 15 million years the Australian continent has been steadily drifting away from a
significant zone of mantle downwelling that lies to the south (as evidenced by the Australian-
Antarctic Discordance), while simultaneously, the northern margin has been drifting towards
a dynamic topographic low defined by the Indonesian subduction zone (Sandiford, 2007).
The theoretical result of this drift path would be subsidence of the northern margin and
emergence of the southern margin, as has been inferred from the sedimentary record.
3.0 Materials and Methods
Cenozoic tectonism in the Eucla Basin was assessed in two phases. The first phase involved
the acquisition, analysis and modelling of a data set representing the present-day elevations
of key subsurface lithostratigraphic contacts at a number of sites across the Nullarbor and
Roe Plains. These horizons represent fossil planation surfaces and, as such, an evaluation
of their present-day character can potentially highlight any local or regional-scale Cenozoic
deformation that prevailed on the platform. In the subsequent phase of the study, faults
expressed on the surface of the plains were analysed through the interrogation of a high
resolution digital elevation model. This characterisation of regional faulting was important in
the context of elucidating poorly-defined local stress regimes, and developing an
understanding of the rate at which brittle deformation has modified the platform.
3.1 Acquisition of contact elevation data
The basal Abrakurrie Limestone horizon (i.e. Wilson Bluff – Abrakurrie Limestone contact),
the basal Nullarbor Limestone horizon (composite surface comprising the coeval ‘Abrakurrie
– Nullarbor Limestone’ and ‘Wilson Bluff – Nullarbor Limestone’ contacts) and the basal Roe
7

Calcarenite horizon (composite surface encompassing the ‘Abrakurrie – Roe Calcarenite’
and the ‘Wilson Bluff – Roe Calcarenite’ contacts) are all thought to have approximated
horizontal surfaces at the time of their formation. The use of these stratigraphic horizons as
tectonic benchmarks is justifiable according to the mode of formation of the Eucla Platform.
As previously alluded to, the deposition of Cretaceous clastic sediments in the Eucla Basin
largely neutralised topographic undulations and irregularities in the basement surface,
thereby generating a relatively flat foundation for the deposition of the Cenozoic limestones
(Lowry, 1970). James and Bone (2000) acknowledged the high degree of basin-scale
horizontality exhibited by these limestones; a fact that is substantiated by the extremely
shallow present day N-S slopes of the Nullarbor Plain (0.02°), the Roe Plains (0.01°) and the
Great Australian Bight sea floor (0.02°). It has also been noted that each of the Eucla
Platform limestones was deposited during a discrete transgressive event. As such, it is
postulated that marine planation would have immediately preceded the deposition of each
limestone, further levelling the upper surface of the underlying unit. Whilst localised
palaeotopographic and/or karstic features may prevail in certain areas, approximate
horizontality of the planation surfaces would be expected to predominate at a kilometre-
scale. Thus, visualisation of the present-day character of these originally planar horizons
should yield evidence of significant post-depositional tectonic deformation.
3.1.1 Field data acquisition
A total of 27 field sites were selected on the Nullarbor and Roe Plains. The suite of sites
comprised 19 caves/rockholes, three road cuts, two coastal outcrops, two gullies along the
Hampton Escarpment and one quarry. Horizons were constrained at each site based on the
sedimentological parameters of the bounding limestones, and elevations were measured to a
high degree of accuracy (+/- 15cm) through the use of a differential GPS and a laser total
station (methodology is outlined in Appendix 1). Sedimentological data were also recorded at
each field site (Appendix 2). All horizons were examined for evidence of karstification,
erosion or irregular depositional topography. These records represented a means by which
excessive or anomalous local variability in contact elevations could be investigated.
3.1.2 Supplementary data acquisition
Given the vast geographic extent of the Eucla Platform, it was advantageous to supplement
the field data set with additional elevation data. Supplementary data was sourced from online
drilling records (from the South Australian Geological Survey), published literature and
8

drilling chips. In each case, the logged contact depths were converted to elevations using
DEM values taken at each site. Figure 4 depicts the locations of the field sites, and the sites
from which supplementary elevation data was obtained.
Online drilling records
Elevation data for an additional 63 sites were acquired through an extensive review of online
drilling logs supplied by the Geological Survey of South Australia. The ‘basal Nullarbor
Limestone’ horizon was the benchmark horizon that had been intersected in each of these
drill holes.
Published literature
Lowry (1970) produced stratigraphic logs for 18 sites on the Nullarbor Plain. Although
elevations were determined using comparatively simplistic equipment (an aneroid altimeter),
Lowry’s technique enabled him to log deep stratigraphic sections in caves where a high
degree of passage tortuosity precluded the use of the laser sighting system. As such,
numerous contact elevations that were not able to be accurately measured in the field were
adapted from Lowry’s work and incorporated into the data set.
Drilling chips
The final set of supplementary elevation data was acquired through the logging of RC drilling
chips retained by the Geological Survey of Western Australia. Twelve drill holes were logged,
providing contact elevation data for the central to northern regions of the Nullarbor Plain.
3.1.3 Analysis and visualisation of contact elevation data
Following the conversion of all elevations to the Australian Height Datum (representing
elevations above mean sea level), the complete contact elevation data set was stored,
interrogated and analysed within ESRI ArcMap10. This facilitated visualisation and
interpretation of the data in the context of a digital elevation model and regional geological
maps. Additionally, the benchmark horizons were able to be modelled as two-dimensional
colour-contoured raster images, providing simple representations of the present-day
character of these originally planar surfaces. To further assist with data interpretation, the
digital elevation model and the horizon raster images were also modelled in three
dimensions within ESRI ArcScene10.
9

3.2 Fault analyses
A total of 46 faults on the surface of the Nullarbor and Roe Plains were identified through the
interrogation of a high resolution (shuttle radar topography mission [SRTM] 30 m) digital
elevation model (Fig. 5). Displacement profiles were generated for the 27 faults that were
deemed significant (with respect to their apparent vertical displacement or fault scarp length),
in order to investigate fault displacement patterns across the Eucla Platform. Additionally, an
analysis of fault trace orientations was conducted for the entire suite of faults for the purpose
of making inferences with respect to the local vs. regional stress regimes. All fault data was
then reviewed in the context of available magnetic geophysical data.
3.2.1. Generation of displacement profiles
In the absence of reliable offset markers through which strike slip movement could be
quantified, vertical displacement profiles were generated to assess surficial throws on faults
across the region. These displacement profiles were created using the following
methodology. First, land surface elevation profiles were generated for the up-thrown and
down-thrown side of each fault. This was achieved through the application of Esri ArcMap
profiling operations to the digital elevation model, with data acquired at 100 m intervals along
each fault trace. Fault throws (calculated as the difference between corresponding data
points on the up-thrown and down-thrown sides) were then plotted against distance along the
trace of the fault scarp.
The effects of modern karstification has degraded the elevation of the present day land
surface by up to 5 m with short-wavelength, quasi-random variability. Therefore, where more
recent geomorphological features could be discounted, the maximum elevation of a surface
(typically representing outcrop) were assumed to represent the pre-karst elevation of the
surface. The effects of inferred karstification on the displacement profiles were nullified
through the addition of trend lines from these highs. These trend lines were manually applied
so as to honour long-wavelength displacement patterns whilst adhering to the peak
displacement values preserved along each fault scarp (Appendix 3). However, it should be
noted that weathering and erosion of fault scarps, reducing the immediate apparent
displacement of the land-surface, is difficult to constrain. Whilst Clark et al. (2012) had
previously provided collective displacement estimates for the suite of faults on the Nullarbor
and Roe Plains, implementation of the more robust methodology (outlined above), on a more
detailed DEM was deemed worthwhile for the purpose of investigating individual fault
10

displacement parameters and resolving finer displacements on smaller faults, and especially
at fault tips.
3.2.2. Analysis of fault orientations
The orientation of the surface traces were also measured for all of the faults identified on the
Nullarbor and Roe Plains. Multiple trend values were recorded for individual faults where
non-linear fault traces could be clearly subdivided into discrete segments of differing
orientation. The orientation data were then plotted on rose diagrams (10° bin intervals) such
that regional patterns could be identified.
3.2.3 Review of magnetic data
Regional aeromagnetic data was reviewed within Esri ArcGIS for the purpose of further
characterising the Nullarbor and Roe Plains faults. By overlaying the fault traces on the
geophysical data, the faults were able to be classified as potential near surface faults (those
lacking a corresponding gravity or magnetic anomaly) or deeper faults (those represented in
the geophysical data).
4.0 Data
4.1 Field data evidencing marine planation
Observational and quantitative data collected in the field strongly support the marine
planation premise that is central to this study. Inspection of the lithostratigraphic boundaries
across the field study area revealed an insignificant degree of local palaeokarstic variability,
essentially nullifying the notion that karst processes might have significantly impacted contact
horizontality on a local scale. Palaeokarstic irregularities never exceeded ~10 cm along any
given contact (Fig. 6); even where extensive outcrop exposed contacts over relatively long
distances (e.g. the basal Nullarbor Limestone horizon is exposed continuously for over 200
m at the Madura road cut). Data evidencing the horizontality of the planated limestone
surfaces was also collected at the Madura Quarry on the Roe Plain. Here, removal of the
largely unlithified Roe Calcarenite (the Plio-Pleistocene unit that veneers the surface of the
Roe Plain) has exposed the planation surface that developed on the underlying, indurated
Abrakurrie Limestone > 2 million years ago. Elevation data were acquired at 75 points across
11

the quarry floor (i.e., the planation surface) over an area of 130,000 m2. Analysis of the data
revealed a maximum elevation differential of only 57 cm across the quarry (values ranged
from 17.247 m to 17.816 m ASL), exemplifying the effectiveness of marine planation in
generating ‘locally planar’ erosional surfaces (Fig. 7).
4.2 Contact elevation data
Despite the acquisition of a large number of data points representing a broad distribution of
field sites and drill holes, data density issues hampered modelling of the basal Abrakurrie
Limestone and basal Roe Calcarenite horizons (raw data is provided in Appendix 4). The
shortage of data representing these horizons reflects the inaccessibility of the deeper basal
Abrakurrie contact in many caves, and the relative scarcity of exposures of the basal Roe
Calcarenite contact. The basal Nullarbor Limestone horizon, however, could be confidently
modelled over a large area of the platform (Fig. 8). On a regional scale, the modelled horizon
demonstrates a notable degree of tilting- seemingly about a NE-SW axis. Elevations in the
south east are typically less than 30 m ASL (and locally as low as 9 m), whilst the horizon
reaches a peak elevation of 180 m ASL approximately 400 km to the northwest. This
corresponds to a maximum slope of 0.02°. Localised perturbations of the otherwise uniform
slope are evident immediately north of the Roe Plain, and toward the eastern margin of the
Nullarbor Plain.
4.3 Fault data
Profiles generated for the selected faults reveal maximum vertical displacements between
11.9 m and 33.9 m (with a mean value of 18.8 m; Fig. 9). Scarp lengths over which these
displacements accumulated range from 21 km to 203 km. The profiles exhibit a variety of
displacement distribution patterns; including ‘peak type’, ‘bell-shaped’ and ‘plateau’
distributions (Fossen, 2010). Fault trace orientation data for the entire suite of faults (split into
discrete fault segments, defined by orientation and displacement magnitude, as necessary)
are presented in figure 10. The majority of faults trend between 340° and 060°. The fault
trace orientation distribution is bimodal, with modal strike intervals at 340° – 010° (n = 41
faults / fault segments) and 030° – 050° (26 faults / fault segments).
Magnetic data representing the study area shows that the majority of faults selected for the
displacement profile analysis (i.e. those demarcated in black) have a corresponding
magnetic signature (Fig. 11). Interestingly, many of the smaller faults with comparatively
12

insignificant surface expressions (demarcated in red) also track deep magnetic anomalies.
Although the strength and nature of each signature varies, surface expressions of faulting
were not found to be noticeably or consistently offset from their associated geophysical
signatures. A summary of fault characteristics is provided in Table 1.
5.0 Data Interpretation
5.1 Character of the basal Nullarbor Limestone horizon
Over the geographic range of the data set, the present-day expression of the basal Nullarbor
Limestone horizon is strikingly similar to that of the modern Eucla platform surface. The 0.02°
(maximum) palaeo-slope of the horizon, as measured over a SE-NW transect, actually
matches the corresponding slope of the modern platform perfectly. Therefore, assuming
continuity and uniformity of local karstic and erosional processes between the Miocene and
the present, it is proposed that the basal Nullarbor Limestone planation surface has broadly
retained the character of the lower Miocene palaeo-platform (i.e. no large-scale internal
warping or folding of the surface is apparent). The tilting of the horizon about a NE-SW axis,
which is equally evident on the modern platform surface, was likely generated by long-
wavelength E-W deflection of an originally southward-sloping ramp. This sense of deflection
parallels the palaeoshoreline elevation differentials defined by Quigley et al. (2010) and
Sandiford (2007), and as such, it may serve as a useful constraint for further characterisation
of long wavelength dynamic topographic uplift (refer to section 6.1).
The localised perturbations of the otherwise uniformly sloping basal Nullarbor Limestone
horizon, noted in section 4.2, occur immediately adjacent to faults 9 and 16. These
anomalies simply reflect vertical displacements along the faults that have had a
disproportionate influence on the character of the horizon due to the distribution of proximal
data points. To overcome this bias, and to impartially assess the regional impact of localised
faulting, relative displacements across all significant faults were subsequently ‘forced’ into
the basal Nullarbor Limestone model (Fig. 12). This was achieved by incorporating a number
of pseudo-data points into the model (flanking each of the major faults) that imposed surficial
fault offsets onto the subsurface horizon. The net result demonstrates satisfactorily that fault
systems across the platform do not have a perceptible influence on the broad stratigraphic
character of the basin (i.e. the effects of fault offsets are relatively localised). Given the
indication of long-wavelength E-W tilting, and the relative internal homogeneity of the
modelled horizon, it is suggested that the Eucla Platform behaved as a rigid and coherent
body during its most recent emergent phase.
13

5.2 Interpretation of fault data
An examination of the fault displacement profiles facilitates the estimation of fault growth
rates on both the Nullarbor and Roe Plains. For the purpose of Nullarbor Plain fault growth
calculations, it is assumed that the development of the surficial Nullarbor Limestone (and that
of its coeval inboard equivalent) ceased 15 million years ago. Similarly, Roe Plains fault
growth rates are calculated under the assumption that the development of the Roe
Calcarenite halted 2 million years ago. In each case, displacement is taken to have
accumulated post-depositionally. Under these assumptions, the maximum displacement
identified on a Nullarbor Plain fault (33.9 m; fault number 19) corresponds to a vertical
displacement rate of 2.26 m.Ma-1. The Nullarbor fault accommodating the lowest maximum
surficial displacement (fault 18; 12.6 m) yields a vertical displacement rate of 0.84 m.Ma-1. By
contrast, the maximum displacement observed on the surface of the ~2 million year old Roe
Plains is 13.4 m (fault nine), corresponding to a significantly higher displacement rate of 6.7
m.Ma-1. Fault 10, the only other fault cross-cutting the Roe Plains surface, accumulated
displacement at a rate of 5.95 m.Ma-1.
The robustness of the displacement estimates derived for faults on the Nullarbor Plain was
tested through a spatial comparison of surface-apparent fault displacement magnitudes vs.
rainfall isohyets and local (surface) geology. As the magnitude of displacement values
showed no correlation with either parameter, it can be assumed that neither rainfall variability
nor differences in the composition of different lithological units affected the weathering or
erosion susceptibility and the apparent derived displacement estimates. It should be noted,
however, that the standardised methodology used to apply trend lines to the displacement
profiles (Appendix 3) may have produced slightly inflated maximum displacement estimates
for faults on the Roe Plain. This would be anticipated due to the lesser degree of
karstification of the younger plain, and undulations of more recent geomorphological features
such as dunes on the Roe Plains not being relevant to fault displacement magnitudes.
The faults identified across the platform are likely to have developed under a relatively
consistent stress regime, as indicated by the clustering of strike values depicted on the rose
diagram (Fig. 10). Magnetic signatures associated with many of the faults could be taken as
evidence for the penetrative depth of crustal strain across the region, or may even imply that
deeper, pre-existing structures were reactivated during the past 15 million years. Given the
thickness of the pure carbonate succession, these signatures would likely be indicative of
continued displacement at depths greater than 400 m. The lack of offset between surface
ruptures and their corresponding magnetic anomalies implies that fault planes are
14

approximately vertical. In light of this fact, the vertical fault offsets measured at the land
surface can be considered a good approximation of dip slip displacement.
6.0 Discussion
To develop a broader understanding of the Eucla Platform’s tectonic history, data pertaining
to the basal Nullarbor Limestone horizon and the suite of onshore faults will be considered in
the context of a number of pertinent factors. The tilt of the horizon will be discussed in light of
previously established evidence for long-wavelength dynamic topographic uplift, and the
relationship between onshore faulting and the neotectonic stress field will be examined. Fault
kinematics, growth rates and growth models will then be reviewed; focusing on the evidence
available to support different deformation models for the platform. Finally, the influence of the
somewhat significant Mundrabilla Fault on the prevailing stress regime will be assessed.
6.1 The basal Nullarbor Limestone horizon – constraints on tilting
Quigley et al. (2010) and Sandiford (2007) alluded to middle-Miocene palaeoshoreline
elevation differentials in the onshore Eucla Basin as evidence for the E-W component of
continent-scale ‘SW-up, NNE-down’ tilting. A comparison of the degree of tilting apparent in
the ~15 Ma palaeoshoreline with that of the ~16.5 Ma basal Nullarbor Limestone horizon will
therefore provide an additional constraint on the magnitude and timing of this long-
wavelength deformation. Sandiford (2007) noted that the elevation of the middle-Miocene
palaeoshoreline decreased eastward by 150 m over a distance of 760 km. By comparison,
the elevation differential recorded across a 400 km-long parallel transect on the basal
Nullarbor Limestone horizon was approximately 160 m (transect locations are depicted in
figure 13). Given the orientation of the transect relative to the inferred palaeo-slope, a
component of the 160 m elevation differential recorded along this surface will be attributable
to the palaeo-slope itself. The removal of the palaeo-slope component (in this case, 85 m)
from the original 160 m elevation differential yields a 75 m residual; representative of the
eastward decrease in elevation across 400 km of the basal Nullarbor Limestone horizon.
This corresponds to an E-W tilt angle of 0.01° for the horizon, which is indistinguishable from
the tilt defined by the palaeoshoreline data. As such, the tilting exhibited by the basal
Nullarbor Limestone horizon clearly supports the notion of dynamic topographic uplift
described by Quigley et al. (2010) and Sandiford (2007).
15

Interestingly, facies associations across the platform may imply a degree of pre-existing
tilting at the onset of lower- to middle-Miocene carbonate sedimentation. In a comparison of
time-equivalent sections of the upper Nullarbor Limestone, O'Connell (2011) identified
deepwater planktonic foraminiferal facies in the eastern region of the platform and coeval
upper photic zone benthic foraminiferal facies in the west. This significant difference in
interpreted depositional depths across the platform is unlikely to have been generated during
the ~1.5 million year depositional period of the Nullarbor Limestone and, as such, it
advocates an earlier onset of E-W tilting than the 15 Ma value provided elsewhere.
6.2 Localised faulting and the stress field
It has been suggested that ongoing intraplate deformation is largely a function of far-field
stresses associated with plate boundary interactions (Clark et al., 2012; Hillis et al., 2008;
Quigley et al., 2010). The manifestation of these stresses across the Australian continent
gives rise to the neotectonic stress field, which provides a basis for the interpretation of
suspected neotectonic structures. The Eucla Platform faulting will therefore be considered in
the context of the neotectonic stress field (on both a continent scale and a local scale), to
potentially provide a better understanding of the nature of the observed deformation.
6.2.1 The continent-scale neotectonic stress field
The Australian neotectonic stress field, as defined by maximum horizontal stress directions,
is somewhat anomalous. Unlike the prevailing stress field of many other continental regions
(such as Europe and the Americas), the Australian stress field is not simply aligned parallel
to the direction of overall plate motion (Hillis et al., 2008; Quigley et al., 2010). Rather, it is a
latitudinally and longitudinally variable field that has been attributed to a complex and
evolving suite of interactions along the boundary of the Indo-Australian Plate (Hillis et al.,
2008). Figure 14 depicts a broad interpretation of the neotectonic stress field, as defined by
the dominant maximum horizontal stress direction ( Hmax) across the continent (Hillis et al.,
2008). This broad-scale model indicates that Hmax is oriented approximately E-W across the
Eucla Basin which, on the simplest level, would suggest that the ~N-S striking suite of Eucla
Platform faults might share a neotectonic origin under a compressional stress regime. This
notion is also supported by a number of similarities between the local faults and known
neotectonic ruptures to the west; including the lack of an association with historic seismicity
and comparatively small vertical displacements (Clark et al., 2012).
16

Further inferences pertaining to local faulting can be made according to continent-scale
stress field patterns. Much of Australia’s neotectonic activity is concentrated along narrow
zones that are oriented normal to the regional Hmax direction (Hillis et al., 2008). This
relationship predicts relative neotectonic quiescence for the Eucla Basin region, which
parallels the E-W compressive stress. Accordingly, it has been suggested that neotectonic
deformation in areas such as the Eucla Basin would be characterised by the reactivation of
inherited zones of weakness (faults or shears) that are preferentially aligned with the
prevailing stress field (Hillis et al., 2008).
6.2.2 The local neotectonic stress field
Whilst the implied E-W regional orientation of Hmax could plausibly explain the N-S trend of
localised faulting on the Nullarbor, the character of the local stress field should still be
explored. As the majority of data contributing to stress field models are derived from the
study of petroleum wells or seismic events, there is no onshore data representing the Eucla
Platform itself. However, stress data collected at a number of localities surrounding the
Nullarbor region indicate a highly complex local stress regime (Fig. 15). Onshore, E-W to NE-
SW oriented maximum horizontal stresses have been associated with strike slip tectonics
either side of the Eucla Basin (in the Flinders Ranges to the east, and the Yilgarn Craton to
the west; Hillis et al., 2008). Similarly oriented maximum horizontal stress vectors have also
been recorded in extensional and compressional regimes (to the west and the east
respectively). Offshore data in the Great Australian Bight reveals that the maximum
horizontal stress direction crudely parallels the coastline, although the stress regimes
associated with these data points were indeterminate. Two data points due south of the Roe
Plains represent a notable exception to this coastline-parallel pattern, seemingly implying a
coastline-perpendicular (N-S oriented) Hmax direction. These data points broadly align with
the onshore, N-S striking Mundrabilla Fault (Lasseter Shear Zone), which is now known to
have an Antarctic counterpart associated with significant subglacial topography (A Aitken
2013, pers. comm., 11 Sep.). Given the comparatively restricted development of the
Mundrabilla Fault on the southern edge of the Nullarbor Plain (in spite of the extensive
northward continuity of the underlying shear), the perturbation of the stress field south of the
Roe Plains may signify a neotectonic reactivation of the southern section of the Lasseter
Shear Zone. If this has indeed occurred, the absence of the Mundrabilla Fault on the Roe
Plains surface may indicate that the reactivation halted approximately 2 million years ago.
17

6.3 Fault kinematics, growth rates and growth models
6.3.1 Kinematics
As described in section 6.2.1, the orientation of the regional stress field would imply a
dominance of compressional structures on a series of N-S striking faults. However,
unequivocally demonstrating a reverse sense of dip-slip displacement is difficult in light of the
vertical orientation of fault planes and the lack of onshore seismic data. Extensive subaerial
mass wasting and erosion on the surface of the platform has effectively obscured the true
orientation of the high-angle fault planes, instead producing a generic surface expression
that would appear to represent extensional faulting. Consideration of the topographic profiles
across localised fault systems also fails to provide an unambiguous interpretation of fault
kinematics, as the resultant profiles exhibit geometries that could plausibly be generated in
either an extensional or compressional regime. The fault system comprising faults 7, 8, 9 and
11 serves as a good example, wherein the topography generated across the system by the
respective fault offsets could conceivably represent either a ‘horst and half graben’ system,
or a high-angle reverse system bearing a central pop-up block (Fig. 16). According to Hillis et
al. (2008), every Australian case of Quaternary onshore faulting has been characterised by
reverse dip slip, or reverse-dominated oblique-slip displacement. Under this premise, it could
be implied that fault nine is indeed a high angle reverse fault (as per its Quaternary
expression on the Plio-Pleistocene Roe Plain). This hypothetical notion would support the
‘high angle reverse pop-up block’ model for the fault system depicted in figure 16 (d).
Despite the ambiguity surrounding the sense of dip slip displacement, it should also be
acknowledged that evidence exists in support of strike slip deformation on the Eucla
Platform. Neotectonic strike-slip movement could arguably be inferred from the fault growth
patterns (Fig. 17). In a predominately dip slip regime, fault growth dynamics would suggest
that the maximum vertical displacement (dmax) recorded along any fault would increase
proportionally with scarp length (L) (Cowie and Scholz, 1992; Walsh and Watterson, 1988).
This relationship is somewhat apparent in the shorter Eucla Platform faults (i.e., those having
scarp lengths less than ~65 m), however, the longer faults on the platform are characterised
by anomalously low vertical displacement values. A degree of strike slip motion on the longer
faults would be one possible explanation for this phenomenon. Interestingly, no indication of
strike slip movement is apparent where faults 9, 12 and the Mundrabilla Fault intersect the
Hampton Scarp (the 2 Ma palaeo-sea cliff). This may imply that any such displacement has
waned over the last 2 million years, however, the rather low growth rates on these faults
might preclude the identification of correspondingly small strike slip offsets via satellite
imagery.
18

Whilst the anomalous ‘dmax : L’ ratios could feasibly indicate strike slip displacement, they
could also be rationalised in the context of fault reactivation. As discussed in section 6.2.1,
the orientation of the platform with respect to the regional Hmax direction may give rise to a
predisposition to fault reactivation where pre-existing zones of weakness are sympathetically
oriented. In a review of fault growth characteristics, Kim and Sanderson (2005) studied the
‘dmax : L’ ratio for a number of reverse reactivated faults (i.e. faults that were generated under
a particular stress regime and later reactivated under a contrasting regime). It was deemed
that such faults could also exhibit anomalously low ‘dmax : L’ ratios, reflecting the reduction in
net displacement that occurs with increased deformation. Given that the surface of the
Nullarbor Limestone retains a 15 million year record of upper crustal deformation, and the
neotectonic stress regime is believed to have been initiated at approximately 8 Ma, reverse
reactivation could conceivably explain the lower displacement values of the longer faults on
the Eucla Platform. This scenario would imply that an extensional regime prevailed locally
between 15 Ma and 8 Ma, before significant changes in plate boundary interactions sparked
the onset of the neotectonic compressional regime.
6.3.2 Fault growth rates
It has been previously suggested that the Nullarbor Plain faults have not accumulated more
than a few tens of metres of vertical slip over the last 15 million years, most commonly
exhibiting less than 10 m of total vertical displacement (Clark et al., 2011). The displacement
values obtained herein, which were derived in a more comprehensive manner that sought to
neutralise the effects of karst topography, are partially in agreement. Whilst the maximum
accumulated displacements generally didn’t exceed 30 m (with the exception of faults nine
and 19), all 27 faults actually exhibited peak displacements greater than 10 m. These revised
peak displacement values correspond to slightly higher inferred fault growth rates across the
platform.
In the case of fault nine, differential growth rates can be observed between the Nullarbor and
Roe Plains expressions of the fault (2.0 m Ma-1 and 6.7 m Ma-1 respectively). This differential
is also strikingly apparent in a comparison of growth rate statistics for faults manifested on
each plain (Fig. 18). Assuming that the increased displacement rate on the younger Roe
Plains (which is a calcarenite-veneered erosional surface cut ~80 m down into the platform)
is not simply reflecting an increase in fault displacement at depth, this differential implies a
strengthening of the neotectonic stress field since the Plio-Pleistocene.
19

6.3.3 Fault growth models
In the context of documented fault growth patterns around the globe, the Eucla Platform
faults exhibit anomalously low ‘displacement : scarp length’ ratios. The traditional model of
fault growth implies that faults accumulate displacement systematically with increases in
scarp length (Cowie and Scholz, 1992; Walsh et al., 2002). Within this framework,
established growth models would suggest that a 100 km long fault would exhibit a maximum
displacement in the order of 1000 m (Fig. 19). The anomalously low displacement values
recorded for the Eucla Platform faults may support an alternative model of fault growth
described by Walsh et al. (2002), wherein scarp length is established early in the life of the
fault and displacement accumulates thereafter (Fig. 19). Interestingly, this growth model is
thought to be particularly applicable to reactivated fault systems (Walsh et al., 2002). Under
this model, fault scarps developing over pre-existing structures increase in length until
discrete fault segments begin to interact (i.e., fault linkage occurs). Such interaction can be
recognised in the displacement profiles of certain fault sets across the platform, whereby a
perturbation of the typical displacement pattern is evident in overlapping zones (Fig. 20). It
should be noted that that the maximum vertical displacement values (and associated growth
rates) presented herein have been calculated upon the premise that each of the selected
faults is a discrete structure. If fault linkage patterns were to be assessed and accounted for,
fault growth rate estimates would likely increase.
6.4 The Mundrabilla Fault and historic stress field partitioning
Given the scale and tectonic history of the Lasseter Shear Zone (the deep shear underlying
the Mundrabilla Fault), the broader onshore influence of the Mundrabilla Fault on localised
Cenozoic deformation should be re-assessed. The concept of the Lasseter Shear Zone
(LSZ) was first proposed by Braun et al. (1991), as a mechanism by which enigmatic middle-
to late-Palaeozoic stress field differentials could be explained. Stratigraphic evidence
suggests that the centrally-located Eastern Officer, Amadeus, Ngalia and Wiso Basins
underwent N-S compression from the Devonian to the Carboniferous, whilst the Canning and
Bonaparte Basins (to the west) underwent contemporaneous N-S to NE-SW extension
(Braun et al., 1991). This apparent partitioning of the palaeo-stress field between central and
Western Australia was explained by the notion of the N-S trending LSZ, which is supported
by a continent-scale gravity anomaly that divides the aforementioned basins (Fig. 3). The
shear zone is thought to have accommodated sinistral movement in the Palaeozoic, although
it has been acknowledged that a lack of evidence precludes a detailed assessment of its
displacement history (Braun et al., 1991).
20
In the present-day Eucla Basin, the correlative Mundrabilla Fault seemingly coincides with a
change in crustal thickness and geothermal gradient (Fig. 21). This supports the notion that
the LSZ delineates a boundary in the underlying Proterozoic basement, potentially
representing a focal point for the localised release of neotectonic strain (Clark et al., 2011).
Given the central location of the Mundrabilla Fault on the Eucla Platform, its influence on
Miocene to recent onshore deformation should be quantifiable through a comparison of fault
characteristics either side of the structure. Additionally, any such influence should be
manifested in the character of the modelled basal Nullarbor Limestone horizon. Figure 22
displays the fault scarp orientation data, partitioned to reflect the longitudinal position of the
faults relative to the central Mundrabilla Fault. Whilst there are differences in the modal strike
values either side of the Mundrabilla Fault, the total range of observed orientations do not
vary significantly. Fault growth patterns are also indistinguishable either side of the
Mundrabilla Fault (Fig. 23), as defined by an appropriately partitioned ‘scarp length versus
vertical displacement’ graph. Furthermore, this consistency in the fault data is supported by
the east-west continuity of the basal Nullarbor Limestone horizon, which doesn’t exhibit any
significant change in character across the Mundrabilla Fault (Fig. 12). Clearly, the major
Palaeozoic stress field differentials associated with the Lasseter Shear Zone are not
manifested on the present-day Eucla Platform via the Mundrabilla Fault.
7.0 Conclusions
A number of pertinent conclusions can be drawn from the data and analyses presented
above. Whilst the investigation of subsurface horizons in the Cenozoic carbonate
stratigraphy did not yield any significant evidence of intrabasinal folding or warping, it did
highlight the effect that long-wavelength tilting has had on the basin’s architecture. The
degree of tilting measured on the basal Nullarbor Limestone horizon was shown to mirror
that of the inboard Miocene palaeoshoreline, which supports the proposal that dynamic
topography has been an important driver in the uplift of southwestern Australia over the last
15 million years.
With respect to the faults examined across the platform, the orientation of the prevailing
stress field would imply that these structures share a neotectonic origin under a
compressional regime. The inferred reverse dip-slip sense of displacement may well be
complemented by an element of strike slip movement (i.e., oblique slip), as deduced from the
anomalously low maximum vertical displacements exhibited along these faults. Analyses
also revealed that reactivation has likely been an important process in the evolution of the
21
basin (as per the prevalence of deep magnetic signatures coinciding with many of the
smaller faults), and regional fault development does not appear to have been influenced by
the presence of the historically significant Mundrabilla Fault.
Cumulatively, the findings of this study carry broader implications. The lack of any significant
intrabasinal warping of the sedimentary succession and the relatively subdued nature of
documented fault movements clearly aligns with the notion of tectonic quiescence that has
often been assigned to this region. Brittle deformation on the platform has not been an
important landscape modifier at a basin-scale; rather, the extreme flatness of the platform
disproportionately emphasises these features in the landscape. The study also highlights the
apparent effectiveness of planation surfaces as tectonic benchmarks in a stable continental
interior. This has important implications for ongoing sea level research, as the ability to
detect warping on ancient surfaces will enable palaeoshoreline elevations to be further
constrained.
8.0 Acknowledgements
I’d like to express my sincere appreciation to Dr Milo Barham and Dr Michael O’Leary for
their constant guidance throughout the course of this project and the relentless enthusiasm
they’ve shown towards my work. I am also very appreciative of the efforts of Dr Nick Timms,
who provided ongoing counsel with respect to the structural geology components of the
project. Thanks are extended to Assistant Professor Alan Aitken, Dr Mark Tingay, the
Geological Survey of Western Australia (Dr Catherine Spaggiari) and the Geological Survey
of South Australia for their valued assistance and input at various stages of the project.
22

9.0 References
Braun, J., McQueen, H., Etheridge, M., 1991. A fresh look at the late Palaeozoic tectonic
history of western-central Australia. Exploration Geophysics 22, 49-54.
Burnett, S., Webb, J. A., and White, S., 2013. Shallow caves and blowholes on the Nullarbor
Plain, Australia — Flank margin caves on a low gradient limestone platform.
Geomorphology 201, 246-253.
Clark, D., McPherson, A., Collins, C., 2011. Australia's seismogenic neotectonic record : a
case for heterogeneous intraplate deformation. Geoscience Australia, Canberra.
Clark, D., McPherson, A., Van Dissen, R., 2012. Long-term behaviour of Australian stable
continental region (SCR) faults. Tectonophysics 566–567, 1-30.
Clarke, J.D.A., Gammon, P.R., Hou, B., Gallagher, S.J., 2003. Middle to Upper Eocene
stratigraphic nomenclature and deposition in the Eucla Basin. Australian Journal of
Earth Sciences 50, 231-248.
Cowie, P.A., Scholz, C.H., 1992. Displacement-length scaling relationship for faults: data
synthesis and discussion. Journal of Structural Geology 14, 1149-1156.
Craig, R.S., 2002. The palaeobiogeography of Late Cretaceous and Cenozoic brachiopods
from Western Australia. Palaeogeography, Palaeoclimatology, Palaeoecology 179,
267-292.
D'Ercole, C., Lockwood, A.M., 2003. The tectonic history of the Waigen area, western Officer
Basin. Geological Survey of Western Australia, Perth, pp. 71-80.
Fossen, H., 2010. Structural Geology. Cambridge University Press, New York.
Heidbach, O., Tingay, M., Barth, A., Reinecker, J., Kurfeb, D., Muller, B., 2008. The World
Stress Map Database. http://dc-app3-14.gfz-potsdam.de/
pub/casmo/casmo_frame.html (accessed 15 September 2013).
Hillis, R.R., Sandiford, M., Reynolds, S.D., Quigley, M.C., 2008. Present-day stresses,
seismicity and Neogene-to-Recent tectonics of Australia's 'passive' margins:
intraplate deformation controlled by plate boundary forces. Geological Society of
London Special Publication 306, 71-90.
Holgate, F.L., Gerner, E.J., 2008. OZTemp Well Temperature Data. http://www.
ga.gov.au/meta/ANZCW0703013802.html (accessed 10 September 2013).
Hou, B., Frakes, L.A., Sandiford, M., Worrall, L., Keeling, J., Alley, N.F., 2008. Cenozoic
Eucla Basin and associated palaeovalleys, southern Australia — Climatic and
tectonic influences on landscape evolution, sedimentation and heavy mineral
accumulation. Sedimentary Geology 203, 112-130.
James, N.P., Bone, Y., 1991. Origin of a cool-water, Oligo-Miocene deep shelf limestone,
Eucla Platform, southern Australia. Sedimentology 38, 323-341.
23

James, N.P., Bone, Y., 2000. Eocene cool-water carbonate and biosiliceous sedimentation
dynamics, St Vincent Basin, South Australia. Sedimentology 47, 761-786.
James, N.P., Bone, Y., 2007. A late Pliocene–early Pleistocene, inner-shelf, subtropical,
seagrass-dominated carbonate: Roe Calcarenite, Great Australian Bight, Western
Australia. Palaios 22, 343-359.
James, N.P., Bone, Y., Carter, R.M., Murray-Wallace, C.V., 2006. Origin of the Late
Neogene Roe Plains and their calcarenite veneer: Implications for sedimentology and
tectonics in the Great Australian Bight. Australian Journal of Earth Sciences 53, 407-
419.
Johnson, D., 2004. The Geology of Australia. Cambridge University Press, Cambridge.
Kim, Y.-S., Sanderson, D.J., 2005. The relationship between displacement and length of
faults: a review. Earth-Science Reviews 68, 317-334.
Laske, G., Masters, G., Reif, C., 2013. Crust 2.0: A New Global Crustal Model at 2x2
Degrees. http://igppweb.ucsd.edu/~gabi/crust2.html (accessed 10 September 2013).
Li, Q., James, N.P., Bone, Y., McGowran, B., 1996. Foraminiferal biostratigraphy and
depositional environments of the mid-Cenozoic Abrakurrie Limestone, Eucla Basin,
southern Australia. Australian Journal of Earth Sciences 43, 437-450.
Li, Q., James, N.P., McGowran, B., 2003. Middle and Late Eocene Great Australian Bight
lithobiostratigraphy and stepwise evolution of the southern Australian continental
margin. Australian Journal of Earth Sciences 50, 113-128.
Lowry, D.C., 1967. Tertiary stratigraphic units in the Eucla Basin in Western Australia.
Geological Survey of Western Australia (Article), Perth.
Lowry, D.C., 1970. Geology of the Western Australian part of the Eucla Basin. Geological
Survey of Western Australia (Bulletin 122), Perth.
McGowran, B., 1972. Rifting and drift of Australia and the migration of mammals. Science
180, 759-761.
McGowran, B., Li, Q., Cann, J., Padley, D., McKirdy, D.M., Shafik, S., 1997. Biogeographic
impact of the Leeuwin Current in southern Australia since the late middle Eocene.
Palaeogeography, Palaeoclimatology, Palaeoecology 136, 19-40.
O'Connell, L.G., 2011. Sedimentology of the Miocene Nullarbor Limestone, southern
Australia. Geological Survey of Western Australia (Report 111), Perth.
O'Connell, L.G., James, N.P., Bone, Y., 2012. The Miocene Nullarbor Limestone, southern
Australia; deposition on a vast subtropical epeiric platform. Sedimentary Geology
253-254, 1-16.
Quigley, M.C., Clark, D., Sandiford, M., 2010. Tectonic geomorphology of Australia.
Geological Society of London Special Publication 'Australian landscapes' 346, 243-
265.
24

Sandiford, M., 2007. The tilting continent: A new constraint on the dynamic topographic field
from Australia. Earth and Planetary Science Letters 261, 152-163.
Stagg, H.M.J., Willcox, J.B., Symonds, P.A., O'Brien, G.W., Colwell, J.B., Hill, P.J., Lee, C.S.,
Moore, A.M.G., Struckmeyer, H.I.M., 1999. Architecture and evolution of the
Australian continental margin. AGSO Journal of Australian Geology and Geophysics
17, 17-33.
Veevers, J.J., 1984. Phanerozoic Earth History of Australia. Clarendon Press, Oxford.
Veevers, J.J., 2000. Change of tectono-stratigraphic regime in the Australian plate during the
99 Ma (mid-Cretaceous) and 43 Ma (mid-Eocene) swerves of the Pacific. Geology
28, 47-50.
Walsh, J.J., Nicol, A., Childs, C., 2002. An alternative model for the growth of faults. Journal
of Structural Geology 24, 1669-1675.
Walsh, J.J., Watterson, J., 1988. Analysis of the relationship between displacements and
dimensions of faults. Journal of Structural Geology 10, 239-247.
Webb, J.A., James, J.M., 2006. Karst evolution of the Nullarbor Plain, Australia. Geological
Society of America (special paper) 404, 65-78.
25

10.0 Figures
Figure 1: A map depicting the location and extent (both onshore and offshore) of the
Eucla Basin. Taken from Hou et al. (2008).
26

Figure 2: Stratigraphic chart of the Cenozoic Eucla Basin, highlighting the relative
age and stratigraphic position of the ‘Eucla Group’ (Eocene to Miocene carbonate
units) sedimentary succession. Modified from O'Connell et al., (2012).
27

Figure 3: The position of the continent-scale Lasseter Shear Zone (LSZ), as inferred
by Braun et al. (1991). The Mundrabilla Fault directly overlies this shear on the
Nullarbor Plain. Figure adapted from Braun et al. (1991); gravity data sourced from
Geoscience Australia.
28

Figure 4: The locations of the 27 field sites and the 75 additional sites (from which supplementary elevation data was obtained),
overlain on a digital elevation model.
29

Figure 5: Fault traces for the 46 Nullarbor and Roe Plains faults considered in the analysis. Those depicted in black were deemed
significant (with respect to scarp length and/or vertical displacement), whilst those depicted in red were deemed minor. Vertical
displacement profiles were generated for significant faults only, whilst all faults were incorporated into the fault trend analysis.
30
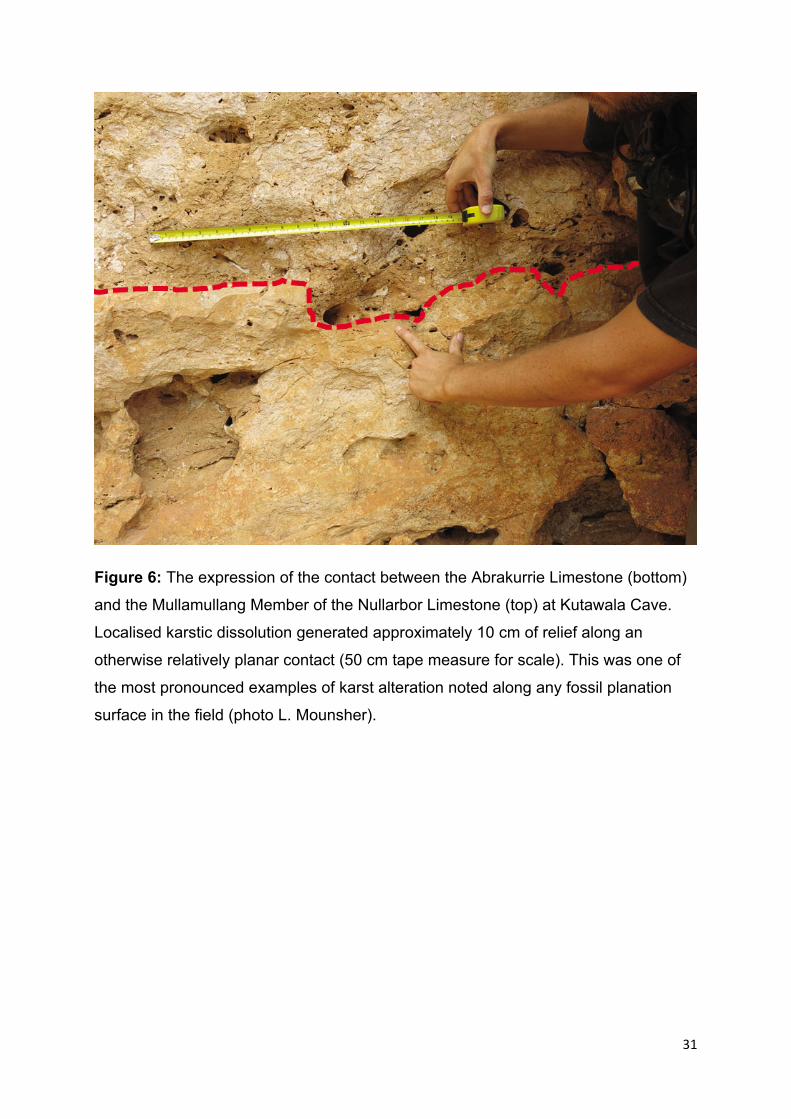
Figure 6: The expression of the contact between the Abrakurrie Limestone (bottom)
and the Mullamullang Member of the Nullarbor Limestone (top) at Kutawala Cave.
Localised karstic dissolution generated approximately 10 cm of relief along an
otherwise relatively planar contact (50 cm tape measure for scale). This was one of
the most pronounced examples of karst alteration noted along any fossil planation
surface in the field (photo L. Mounsher).
31

Figure 7: The location of the Madura Quarry (a), wherein 75 elevation data points
were acquired for the basal Roe Calcarenite planation surface (data points are
shown in red). Modelling of the 2 Ma planation surface over an area of approximately
130,000 m2 revealed a striking degree of horizontality (b).
32

Figure 8: A model depicting the character of the basal Nullarbor Limestone horizon. Red data points represent sites at which the
elevation of this particular horizon was attainable (both field sites and supplementary data sites). The horizon appears to be tilting
about a NE-SW axis.
33

Figure 9 (part 1/3): Vertical displacement profiles for the 27 faults deemed to be
significant (see Figure 5 for fault locations). Note that profiles representing faults that
are situated on the perimeter of the Nullarbor or Roe Plains (i.e. faults 9, 10, 19, 21,
23, 24 and 25) do not depict complete fault closure at one end of the fault. This
reflects the continuation of the structure beyond the study area.
34

Figure 9 continued (part 2/3)
35

Figure 9 continued (part 3/3)
36

Figure 10: A rose diagram depicting the strike orientation of faults (and discretely-
oriented fault segments) across the Nullarbor and Roe Plains. The mean strike value
(016) is denoted by an arrow. Bin intervals are 10° and the highest data frequency in
any one interval is 14. The total data set represents 115 strike measurements.
37
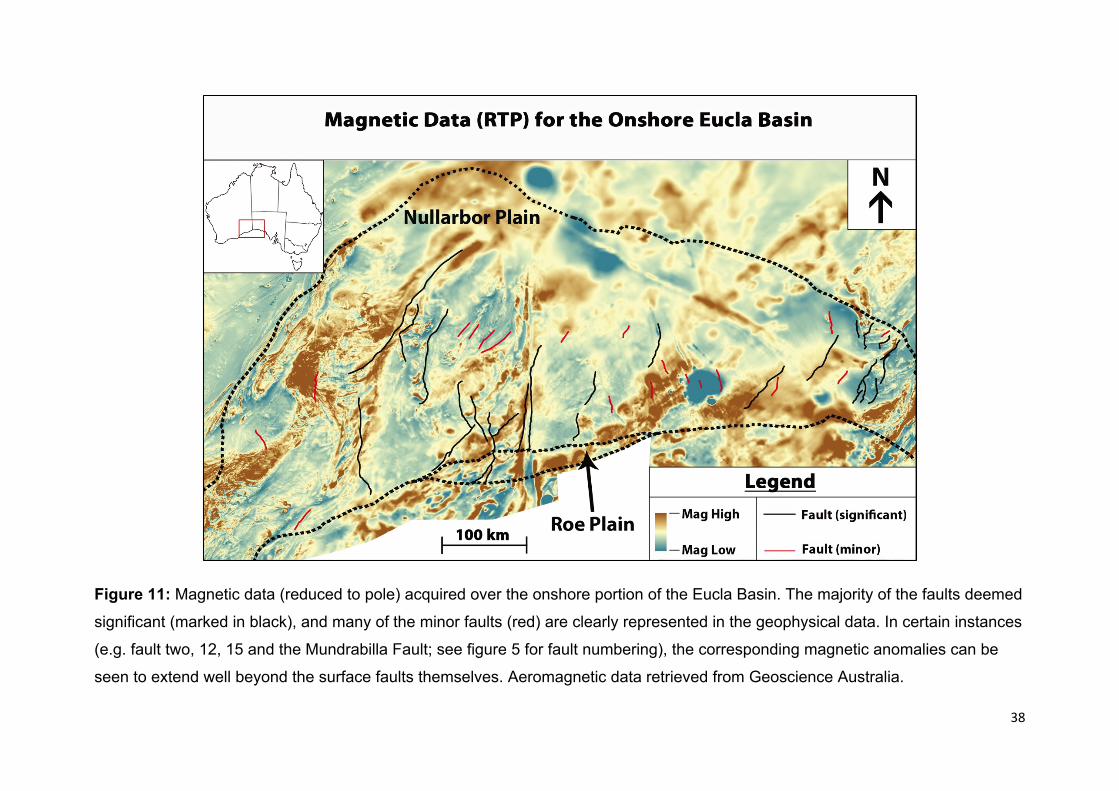
Figure 11: Magnetic data (reduced to pole) acquired over the onshore portion of the Eucla Basin. The majority of the faults deemed
significant (marked in black), and many of the minor faults (red) are clearly represented in the geophysical data. In certain instances
(e.g. fault two, 12, 15 and the Mundrabilla Fault; see figure 5 for fault numbering), the corresponding magnetic anomalies can be
seen to extend well beyond the surface faults themselves. Aeromagnetic data retrieved from Geoscience Australia.
38

Figure 12: The incorporation of fault displacement data into the basal Nullarbor Limestone horizon highlights the negligible
influence of faulting on the basin-scale character of sediments. Red dots represent real horizon elevation data points, whilst blue
dots represent pairs of fault offset data points (straddling each fault) that were ‘forced’ into the model.
39

Figure 13: Locations of the approximately E-W transects across the Miocene palaeoshoreline (red; Sandiford, 2007) and the basal
Nullarbor Limestone horizon (blue; this work).
40

Figure 14: The continent-scale neotectonic stress field, as predicted from plate
boundary force modelling, infers an E-W oriented maximum horizontal stress ( Hmax)
for the onshore Eucla Basin region. Figure from Hillis et al. (2008).
41

Figure 15: Map of the southern margin displaying the limited stress data available for the Eucla Basin surrounds. Stress indicators
represent the Hmax direction; colours correspond to different regimes. The data quality rating (A-D) assigned to each site reflects the
number, accuracy and depth of stress field measurements. Figure from Heidbach et al. (2008).
42

Figure 16: An example of the ambiguity encountered when examining fault system
kinematics on the karstified Eucla Platform. A transect drawn across the fault system
defined by faults 7, 8, 9 and 11 (a) produces the above topographic profile (b). Note
that the fault plane locations in (b) are denoted by vertical blue lines. The surficial
expression of this system could plausibly have been generated under either an
extensional regime (c) or a compressional regime (d).
43

Figure 17: Characterisation of the onshore faults according to their respective ‘scarp
length to displacement’ ratios. Given that fault displacements have been measured in
the vertical plane, dip slip faults would be expected to display a characteristic
increase in displacement with scarp length. This pattern is not evident in the Eucla
Platform faults (especially those with longer fault scarps), and accordingly, strike slip
movement could be inferred.
Note: all faults that have been shown to continue beyond the study area (i.e. those
for which finite maximum displacement values and scarp lengths are not known)
have been eliminated from this analysis.
44

Figure 18: A comparison of growth rates (m Ma-1) for faults occurring on the Nullarbor and Roe Plains. The box plots depict the
minimum, 25th percentile, 50th percentile (median), 75th percentile and maximum growth rates. Note that the statistical significance
of the comparison is limited by the small number of faults manifested on the Roe Plains (n=2).
0
1
2
3
4
5
6
7
8
Nullarbor Plain Roe Plain
Faul
t Gro
wth
Rat
e (m
Ma-1
)
Fault Growth Rates - Nullarbor Plain vs Roe Plain
45
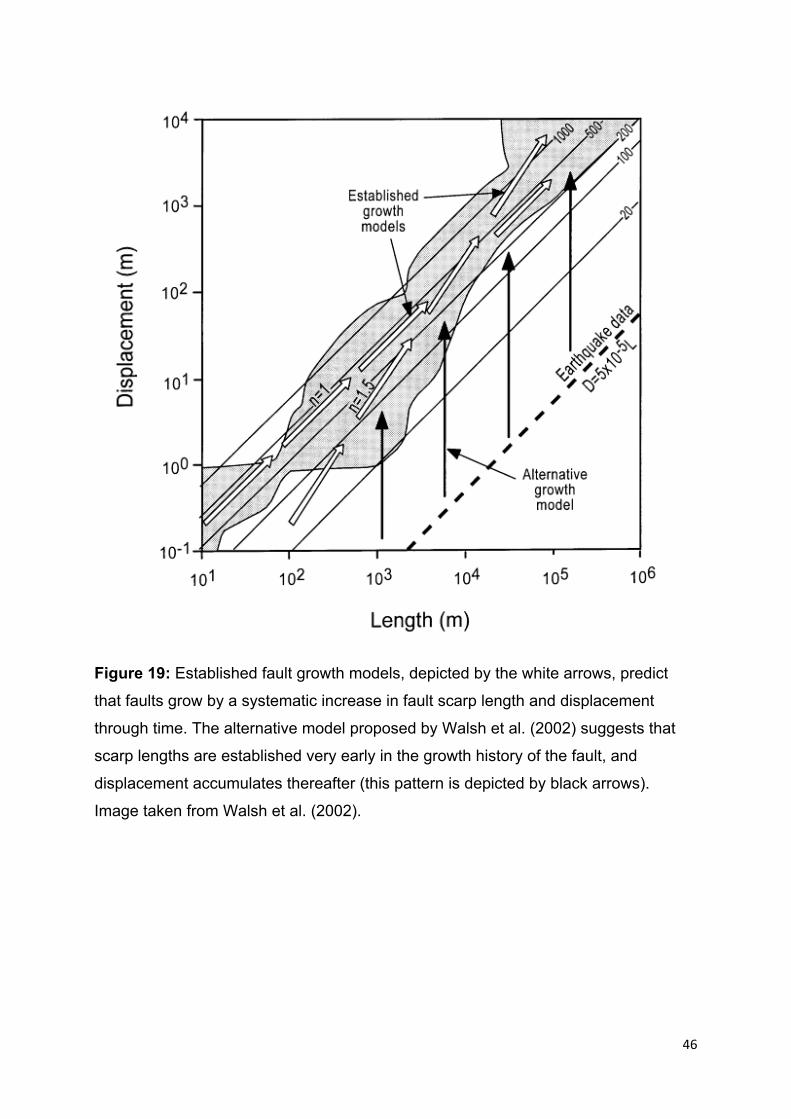
Figure 19: Established fault growth models, depicted by the white arrows, predict
that faults grow by a systematic increase in fault scarp length and displacement
through time. The alternative model proposed by Walsh et al. (2002) suggests that
scarp lengths are established very early in the growth history of the fault, and
displacement accumulates thereafter (this pattern is depicted by black arrows).
Image taken from Walsh et al. (2002).
46

(a)
(b)
Figure 20: Evidence of fault linkage on the Eucla Platform. In cases (a) and (b),
perturbation of the respective displacement profiles can be clearly observed where
adjacent faults interact. Cumulative displacements across these linkages would be
considerably greater than the displacements attributed to individual faults. Note that
the southern tips of faults 24 and 25 (image b) are obscured by coastal sediments.
47

Figure 21: Maps depicting crustal thickness (a) and crustal temperature (b) each
show a distinct boundary in their respective parameter that aligns with the position of
the Mundrabilla Fault (delineated by a red line on each map). Crustal thickness map
taken from Laske et al. (2013); temperature map adapted from Holgate and Gerner
(2008).
48

Figure 22: Rose diagrams depicting strike orientations for faults located to the west
(a) and east (b) of the Mundrabilla Fault. Bin intervals are 10°. Faults to the west
exhibited a mean strike value of 019 (based on 37 measurements of individual faults
and discretely-oriented fault segments). Faults to the east of the Mundrabilla Fault
(76 measurements in total) exhibited a mean strike orientation of 014. Whilst there
appears to be a difference in modal strike intervals, the mean trend and total range of
values recorded either side of the Mundrabilla Fault show little variability.
49

Figure 23: Fault growth patterns, as defined by ‘displacement to scarp length’ ratios
do not appear to differ significantly for faults situated either side of the Mundrabilla
Fault. Note, however, that the four longest fault scarps occur to the west of the
Mundrabilla.
Note: As per figure 17, all faults that have been shown to continue beyond the study
area have been eliminated from this analysis.
50

11.0 Tables
Table 1: Summary statistics for each of the 27 faults examined herein. Growth rates are calculated on the premise that the
Nullarbor Plain faults are 15 million years old, and the Roe Plains faults are 2 million years old.Fault # Location Scarp Length (km) Max. Vertical Displacement (m) Growth Rate (m/Ma) Upthrown Side of Fault1 Nullarbor Plain 133 16.1 1.1 E2 Nullarbor Plain 203 16.3 1.1 E3 Nullarbor Plain 88 13.4 0.9 E4 Nullarbor Plain 142 14.8 1.0 W5 Nullarbor Plain 41 22.2 1.5 W6 Nullarbor Plain 55 26.6 1.8 W7 Nullarbor Plain 67 22.7 1.5 E8 Nullarbor Plain 66 18.5 1.2 W (northern segment); E (southern segment)9 Nullarbor Plain 57 30.7 2.0 W9 Roe Plain 50 13.4 6.7 W10 Roe Plain 23 11.9 5.9 W11 Nullarbor Plain 44 16.0 1.1 W12 Nullarbor Plain 92 18.7 1.2 WMundrabilla Nullarbor Plain 146 20.1 1.3 E13 Nullarbor Plain 41 14.2 0.9 W14 Nullarbor Plain 52 18.0 1.2 W15 Nullarbor Plain 66 12.7 0.8 W16 Nullarbor Plain 80 14.3 1.0 W17 Nullarbor Plain 73 13.4 0.9 W18 Nullarbor Plain 23.5 12.6 0.8 W19 Nullarbor Plain 43 33.9 2.3 W20 Nullarbor Plain 25 19.6 1.3 E21 Nullarbor Plain 37 20.8 1.4 W22 Nullarbor Plain 44 18.9 1.3 E23 Nullarbor Plain 38 20.8 1.4 W24 Nullarbor Plain 66 27.2 1.8 E25 Nullarbor Plain 21.5 24.1 1.6 E26 Nullarbor Plain 21 14.6 1.0 E
51

12.0 Appendices
Appendix 1: Methodology for the acquisition of lithostratigraphic contact elevations
using a differential GPS and a total station:
Where a direct line of sight could be established between the differential GPS, the
total station and the horizon of interest, a simple methodology could be employed.
The differential GPS would be used to calculate the surface elevation at a specific
point (effectively providing a known elevation benchmark). The total station would
then be positioned at an intermediate point between the differential GPS and the
contact of interest, such that the vertical distance to each could be measured by
laser. The subtraction of each of these vertical distances from the known elevation
benchmark would yield the elevation of the limestone horizon. Where the required
line of sight could not be readily established, additional intermediate sighting points
would be utilised as necessary. In extreme cases, where cave passages exhibited a
high degree of tortuosity, the acquisition of accurate elevation data was deemed
impossible.
52

Appendix 2 (part 1 of 6): A table detailing sedimentological data acquired in the field. Observations pertain to individual lithological units and contacts. Site coordinates are in GDA94. Units are
coded as follows: Tmn = Nullarbor Limestone (Upper Member); Tmnm = Nullarbor Limestone (Mullamullang Member); Tma = Abrakurrie Limestone; Tew = Wilson Bluff Limestone; Roe = Roe
Calcarenite.
Site Latitude Longitude Tmn Sedimentology Tmnm Sedimentology Tma Sedimentology Tew Sedimentology Roe Sedimentology Tmn / Tmnm Contact Tmn / Tma Contact Tmnm / Tma Contact Tma / Tew Contact Tma / Roe Contact Other NotesCapstan Cave -32.016169 125.949791 Dominated by mouldic
fossils; specifically bivalves, gastropods (mix of ornamented, squat and turreted varieties), LBF, rare oysters (original shell material preserved), uncommon echinoids and probable corals. Bivalves are present as singular and articulated valves. Fossil horizons define crude bedding planes.
Red rhodolith rudstone to floatstone with isolated gastropod and bivalve fossils.
Contact is defined by a slightly wavy but smooth bedding surface. Rhodoliths of the Mullamullang Member become smaller and less common within 30-50cm of the contact.
Cocklebiddy Cave -31.966592 125.9168498 Dominantly mudstone facies were encountered during the descent into the cave.
Well-sorted, pale, bioclastic bryozoan grainstone with isolated 'cm-scale' intraclasts and shell fragments. Contains coarser rudstone horizons with greater porosity and permeability. Notable pink discolouration in parts.
Chalky, white mudstone with floatstone horizons. Contains brachiopods (many of which are articulated) and ramose bryozoans.
Contact lies beneath a 40cm thick, tabular rhodolith floatstone-rudstone (with isolated gastropods, bivalves and corals) that defines the lowermost Abrakurrie Lst. A 30 cm-thick shelly horizon occurs immediately above the rhodolith floatstone-rudstone (containing gastropods, bivalves, echinoderm spines and bryozoans), which is overlain by more characteristic Abrakurrie Limestone.
Cross-laminations in the Abrakurrie Limestone: 071/14° SE.
Murra-el-elevyn Cave
-32.042777 126.038244 Echinoid horizons occur in Abrakurrie floatstones deeper in the cave. Bioturbation noted. Alternating massive floatstone-mudstone horizons and dense grainstone-rudstone levels.
Contact is defined by a decrease in the size and abundance of rhodoliths upward, followed by the development of a mouldic floatstone-rudstone. Finally, a bivalve-rich mouldic floatstone dominates (characteristic of the Nullarbor Limestone upper member).
Contact is defined by the appearance of bedding in the Abrakurrie Limestone and the disappearance of rhodoliths.
Large, single pecten bivalve noted in the upper Abrakurrie Limestone.
Dingo Cave -31.853395 126.7344839 Not particularly fossiliferous, although the unit bears moulds of gastropods and bivalves.
Not particularly fossiliferous.
Contact is sharp here with rhodoliths disappearing abruptly (without a decrease in size). There is no obvious succession by a mouldic, bioclastic floatstone at the top of the bed (as seen elsewhere).
Void space along the Abrakurrie-Mullamullang Member contact is filled with horizontally laminated flowstones in areas. The Abrakurrie limestone is noticeably fossiliferous near the contact (it is a floatstone with rudstone pockets). Echinoids (mostly irregular) and bivalve fragments are common.
A high degree of weathering was noted during the descent into the cave- rough, vuggy surfaces and flowstones are present.
53

Appendix 2 continued (part 2 of 6)
Site Latitude Longitude Tmn Sedimentology Tmnm Sedimentology Tma Sedimentology Tew Sedimentology Roe Sedimentology Tmn / Tmnm Contact Tmn / Tma Contact Tmnm / Tma Contact Tma / Tew Contact Tma / Roe Contact Other NotesFirestick Cave -31.769927 127.0277598 Contact is difficult to
discern due to travertine-style calcite precipitation.
Contact is difficult to discern due to travertine-style calcite precipitation.
Planar bedding horizon noted in the Mullamullang Member just above the Abrakurrie - Mullamullang Member contact.
Mullamullang Cave
-31.723268 127.2297447 Mouldic bioclastic mudstones-floatstones, dominated by gastropods and bivalves. At the surface, the Nullarbor Limestone displays pronounced karst features.
Rhodolith floatstone-rudstone.
Contains cross-sections of whole echinoids and moulds of gastropods.
Contact is obscured by iron staining (it is dificult to define).
Sharp contact, well-defined across the cave wall (marked by a recessed cleft with a rhodolith rudstone-floatstone overlying an echinoderm-dominated floatstone. Contact is laterally uniform.
Roaches Rest Cave
-31.556136 127.2373339 Notably fossiliferous horizons of mouldic, bioclastic floatstone (approaching rudstone in parts). Large gastropods dominate some horizons (up to 10cm in size and mostly complete) and bivalves dominate others. Many pectens appear to have retained original shell material whilst other bivalves and gastropods haven't. LBF are also present.
Abrakurrie Cave -31.657188 128.4892652 Contains cm-scale mudstone intraclasts, LBF, bivalves and gastropods. Surprisingly, also contains bryozoans and isolated echinoids at higher stratigraphic levels.
Thin unit with basal portions bearing rhodoliths up to a maximum of 3cm in diameter. Rhodoliths decrease in size and abundance upwards.
Bryozoan grainstone with common echinoid bioclasts- some brachiopods and bivalves are also present. Floatstone-rudstone facies. Where developed, bedding is typically tabular and laterally persistent. Bryozoan hash matrix becomes more clearly developed down-section. Large sheets of fenestrate bryozoans identified, reaching approximately 5cm in size.
Chalky and fossiliferous in nature. Echinoids, brachiopods and bryozoans are most common, but pectens and other bivalves are also present. Weakly-defined bedding is present in places (medium-thick). Unit is otherwise massive.
Contact is relatively well-defined by the disappearance of rhodoliths. Weakly developed parting plane at the contact.
Contact appears to be irregular in nature.
Joint face within the cave: 139° (vertical).
Kutawala Cave -31.682286 128.4963439 Thickly (crudely) bedded pink-grey-brown mudstones and floatstones with rudstone intervals. Fossils are mostly mouldic, comprising disarticulated bivalves and gastropods. Fossils are commonly large and complete, although broken fragments are found within the calcisiltite matrix. Complete irregular echinoids found within the basal 2 metres. A 30cm-thick LBF-rich horizon lies approximately 1.15m above the Upper Member -Mullamullang Member contact.
Thin Mullamullang Member at this location identified by a dominance of rhodoliths, however, mouldic solitary corals, bivalves and gastropods were also present. Rhodoliths were relatively small (up to 4cm diameter).
Contact is defined by a distinct bedding plane (mouldic fossil horizon, below which the rhodoliths become smaller and isolated).
Contact is well expressed. Gentley undulating and relatively uniform over several metres. Karstic dissolution features evident on a local scale.
Massive limestone marks the top few metres of the exposure.
54

Appendix 2 continued (part 3 of 6)
Site Latitude Longitude Tmn Sedimentology Tmnm Sedimentology Tma Sedimentology Tew Sedimentology Roe Sedimentology Tmn / Tmnm Contact Tmn / Tma Contact Tmnm / Tma Contact Tma / Tew Contact Tma / Roe Contact Other NotesWeebubbie Cave -31.654338 128.7752821 LBF are particularly large-
up to 5cm in diameter. Unusual concentrations of echinoids also noted.
Contact difficult to identify due to the absence of the Mullamullang member. No defined unconformity is apparent. Contact was picked where fauna changed from a gastropod-bivalve-echinoid-LBF assemblage to an echinoid-brozoan assemblage.
Gastropod shell lags eveident in the Nullarbor Limestone upper member.
Winbirra Cave -31.70618 128.5009956 Mouldic bivalves, gastropods and solitary corals. Small, red ooid/pisoid lime bodies are present on weathering faces.
Abundant echinoids and large, colonial bryozoans.
Contact tentatively identified based on fossil fauna. Brecciation and disturbance of beds is apparent near the contact.
Bedrock is intensely brecciated / fractured, reminiscent of fault breccia. Units are difficult to identify.
Eucla Pass -31.675789 128.8799299 Mouldic bivalves (predominately single valves), gastropods, corals and LBF anre present. Pale pink colouration.
Rudstone dominated by large colonial bryozoans in a matrix of bryozoan-echinoderm hash. Large echinoids and isolated bivalves identified.
Excellent exposure of a sharp contact. Oysters are situated preferentially adjacent and parallel to the contact - possible hardground. Palaeokarstic depressions along the contact are filled with Nullarbor Limestone. Although the contact is sharp, no parting plane is recognisable.
Wilson Bluff -31.67552 129.0420396 Massive mudstones and floatstones of mouldic gastropods, bivalves, corals and LBF.
Chalky, white unit dominated by echinoids and brachiopods (also containing gastropods, bivalves and bryozoans).
Contact is not particularly well-defined. It was picked at the faunal change from a gastropod-bivalve-coral-LBF assemblage to an echinoderm-bryozoan assemblage.
Najada East -31.714362 128.6950007 A floatstone containing echinoid spines, LBF and bivalves (bed is appproximately 40cm thick).
Complete echinoids and colonial bryozoans set in a coarse bryozoan hash. Unusually, bivalves are common towards the top of the Abrakurrie Limestone. Iron-stained or mineralised horizons were noted above a distinct laminated / liesegang-banded section. Sub-horizontal to sub-vertical burrows up to 2cm in width were noted in the upper Abrakurrie Limestone.
The exact position of the contact was ambiguous (constrained to approximately 2m). The chosen contact marker is a sharp, well-defined boundary that is interpreted to be a hardground (bryozoa and echinoids common above and below the contact). Significant local relief along the contact.
Mullamullang rhodolith rudstone found as float atop the section
55

Appendix 2 continued (part 4 of 6)
Site Latitude Longitude Tmn Sedimentology Tmnm Sedimentology Tma Sedimentology Tew Sedimentology Roe Sedimentology Tmn / Tmnm Contact Tmn / Tma Contact Tmnm / Tma Contact Tma / Tew Contact Tma / Roe Contact Other NotesNajada Rockhole -31.734013 128.5906193 Defined boundary
identified approximately 1 m below the proposed Nullarbor - Abrakurrie Limestone contact, but echinoids and bryozoans were found above this hardground / palaeokarst. Contact was defined as the first appearance of Nullarbor Limestone fauna (mouldic gastropods, bivalves, etc.). Small, isolated rhodoliths were identified at the approximate level of the contact. Iron staining/mineralisation was also present around the contact.
Karstification made the confident identification of facies and contacts difficult.
Water Truck Blowhole
-31.690934 128.7865424 A particularly fossiliferous expression of the Nullarbor Limestone, dominated by small gastropods and isolated bivalves, corals and LBF. Wackestone-mudstone facies predominate.
Notably echinoderm-rich in parts, also bearing abundant bryozoans. Orange staining in parts.
Contact was defined by an iron-rich, oxidised horizon. Fossils (inc. mineralised shells) are concentrated within depressions in this horizon - possibly a re-exposed palaeokarst.
Extensively karstified- lithologies were difficult to identify.
Nuneeja Rockhole -31.903092 127.0584842 Mouldic wackestones and mudstones (presumably of the Nullarbor Limestone) were found above the inferred Nullarbor-Mullamullang contact.
Rhodolith floatstones were identified. Rhodoliths decrease in size and abundance towards the upper contact.
The Abrakurrie Limestone was less fossiliferous than usual at this location. Large fenestrate and ramose bryozoans were still present immediately below the inferred Abrakurrie - Mullamullang contact on the eastern side of the gully. Classic echinoderm hash grainstone found lower in the section where rhodoliths drop out completely.
Contact was difficult to define on the eastern side of the gully. It was taken to be the highest occurrence of rhodoliths after scouting a wide area.
Three exposures of this contact were identified here, and found to be at notably different elevations (i.e. one contact in a central stream bed, and the other two on flanking ridges). The spread of contact elevations implied that strata was dipping locally at approximately 20° to the NNE.
Loose shelly fossils of the Roe Calcarenite were found in an old surficial quarry off the Eyre Highway in this location. Mulamullang Member was also abundant in the quarry float. Karstified surfaces and poor outcrop on the gully slopes made lithological identification extremely difficult. A major differential in contact elevations was identified- possible evidence of a fault offset in the gully or dipping strata.
Old Madura Pass -31.895347 127.0262381 Rhodolith floatstone. Bryozoan-rich floatstone-wackestone facies.
Contact placed at the last occurrence of rhodoliths (which get smaller and less abundant towards the top of the unit). A mouldic shelly lag of large bivalves, gastropods and corals marks the boundary.
Contact not visible, but confidently constrained to within 50cm.
Units appear to dip (difficult to measure, but approximately 055/12°NW).
Madura Cave -31.984558 127.039538 No Roe Calcarenite lithified in situ here (only found loose as float).
Apparent Thalassinoides horizon identified approximately 2-3m below the cave surface.
56

Appendix 2 continued (part 5 of 6)
Site Latitude Longitude Tmn Sedimentology Tmnm Sedimentology Tma Sedimentology Tew Sedimentology Roe Sedimentology Tmn / Tmnm Contact Tmn / Tma Contact Tmnm / Tma Contact Tma / Tew Contact Tma / Roe Contact Other NotesMadura Quarry -32.039685 127.0450628 Friable to moderately firm
floatstone with large bioclasts. Diverse fauna- gastropods, bivalves and LBF are dominant. Many shells show evidence of predation.
Floor of the quarry believed to represent the Abrakurrie planation surface. The surface gently undulates across the quarry (but is largely planar). Root grooves cut across the surface in areas, seemingly indicating the extent to which roots could penetrate (through the Roe Calcarenite) before encountering strongly lithified material (Abrakurrie Limestone).
Nurina Cave -32.016297 127.0074954 Typical bryozoan grainstone identified lower in the section.
Abrakurrie Limestone at the contact is chalky-pale grey and largely devoid of macrofossils (somewhat akin to the Wilson Bluff). Portions of Roe Calcarenite are seemingly welded to the unconformable underlying contact. A hard surface boring (filled with Roe Calcarenite) was identified along the contact.
Abundant LBF weathering out of the Roe Calcarenite into the surrounding soil.
Moodini Rockhole -32.115569 127.078692 Roe Calcarenite here is moderately firm and relatively indurated. Karstified surface weathers to a red-light grey colour. Karst not intensively developed. Mudstone to packstone/rudstone facies dominated by gastropod bioclasts (also contains bivalves and echinoids). Dark lithic grains are present in mudstone facies. Gastropods tend to be the turreted form, commonly displaying predatory borings. Most bioclasts are smaller than 1cm. Matrix is a shelly hash in coarser pockets.
Kanidal Beach -32.238585 126.159611 Portions of lithified beach rock are comparable to both the Wilson Bluff Limestone (brachiopods, echinoids) and the Abrakurrie Limestone (bryozoans, induration). However, other units containing abundant gastropods, bivalves and current bedding (cross-laminations up to 30cm and herringbone cross-lamination). Possibly an outcrop of the Toolinna Limestone. Primary preservation of shelly material is indicative of a relatively young geological unit.
Shelly lags and cobbly beach horizons (with rhizoliths and flowstones) identified in cliff and dunes. An inferred planation surface appears to dip dramatically to the west.
57

Appendix 2 continued (part 6 of 6)
…
Site Latitude Longitude Tmn Sedimentology Tmnm Sedimentology Tma Sedimentology Tew Sedimentology Roe Sedimentology Tmn / Tmnm Contact Tmn / Tma Contact Tmnm / Tma Contact Tma / Tew Contact Tma / Roe Contact Other NotesFox Hole Cave -32.034907 126.1875873 The basal Mullamullang
Member here comprises pink rhodolith floatstones (rhodoliths are relatively small and quite sparse).
The uppermost Abrakurrie Limestone is a mottled pink-orange-brown echinoderm wackestone with isolated larger bioclasts (possibly bryozoans). Vuggy weathering pattern noted. In parts, the uppermost Abrakurrie Limestone is a fossiliferous floatstone with large gastropods, echinoids, bryozoans and bivalves. Classic Abrakurrie (bryozoan grainstone) not seen higher in the section, only near the base of the exposure.
Contact is well-defined by a cave overhang, with more massive Mullamullang units above. On a local scale, the contact is planar and approximately horizontal.
Pannikin Plain Cave
-32.031015 126.1835064 Brown rhodolith floatstone with bioclastic echinoderm material.
Orange-brown echinoderm wackestone.
Contact is defined by a decrease in rhodolith abundance in the uppermost Mullamullang Member, followed by a mouldic bioclastic lag prior to a relatively pronounced bedding plane (taken to be the contact).
A seemingly irregular contact (only identifiable on freshly broken surfaces). Rhodoliths immediately above the contact are small, and the lowermost Mullamullang Member appears to be thickly bedded (massive further up).
58

Appendix 3: An example of the manner in which trend lines were applied to the fault displacement profiles, so as to minimise the
effects of karstification on fault offset estimates. Here, the raw displacement data for fault three (blue line) has been fitted with a
trend line.
59

Appendix 4 (part 1 of 2): Table displaying the raw contact elevation data collected in the field. Elevations are referenced to mean sea level (Australian Height Datum). Site coordinates are GDA94.
Lithological units are coded as follows: Tmn = Nullarbor Limestone (Upper Member); Tmnm = Nullarbor Limestone (Mullamullang Member); Tma = Abrakurrie Limestone; Tew = Wilson Bluff
Limestone; Roe = Roe Calcarenite.
Site Name Site Type Latitude Longitude Base Tew Top Tew Tew Thickness Base Tma Top Tma Tma Thickness Base Tmnm Top Tmnm Tmnm Thickness Base Tmn Top Tmn Tmn Thickness Base Roe Tew - Tmn Contact Tew - Tma Contact Tma - Tmnm Contact Tmnm - Tmn Contact Tma - Tmn Contact Tma - Roe ContactCapstan Cave Field -32.01616889 125.949791 65.200 65.200 71.906 6.710 71.906 65.200 71.906Cocklebiddy Cave Field -31.96659171 125.9168498 14.766 14.766 69.767 55.001 69.767 76.300 6.533 76.300 99.245 22.945 14.766 69.767 76.300Murra-el-elevyn Cave Field -32.042777 126.038244 63.305 63.305 73.425 10.120 73.425 63.305 73.425Dingo Cave Field -31.85339489 126.7344839 87.145 87.145 95.912 8.767 95.912 101.120 5.208 87.145 95.912Firestick Cave Field -31.76992681 127.0277598 80.504 80.504 90.985 10.481 90.985 80.504 90.985Madura Pass (Upper) Field -31.898776 127.009008 102.927 102.927 102.927Madura Pass (Lower) Field -31.898089 127.011222 94.241 94.241 94.241Mullamullang Cave Field -31.72326841 127.2297447 93.630 93.630 101.335 7.705 101.335 93.630 101.335Kestral Cavern No. 1 Field -31.65732066 127.2193331 100.500 100.500 106.100 5.600 106.100 121.776 15.676 100.500 106.100Roaches Rest Cave Field -31.55613577 127.2373339 103.300 103.300 107.600 4.300 107.600 133.737 26.137 103.300 107.600Thylacine Hole Field -31.70777654 127.7367214 87.470 87.470 90.895 3.425 90.895 96.695 5.800 87.470 90.895Abrakurrie Cave Field -31.65718833 128.4892652 53.632 53.632 85.954 32.322 85.954 86.469 0.515 86.469 100.492 14.023 53.632 85.954 86.469Kutawala Cave Field -31.68228555 128.4963439 82.264 82.264 83.024 0.760 83.024 99.007 15.983 82.264 83.024Weebubbie Cave Field -31.65433848 128.7752821 45.200 45.200 75.478 30.278 75.478 45.200 75.478Winbirra Cave Field -31.70617999 128.5009956 83.624 83.624 95.821 12.197 83.624Eucla Pass Field -31.6757887 128.8799299 71.901 71.901 71.901Wilson Bluff Field -31.67552005 129.0420396 51.707 51.707 71.565 19.858 71.565 51.707 71.565Najada East Field -31.71436242 128.6950007 80.525 80.525 81.773 1.248 80.525Najada Rockhole Field -31.73401281 128.5906193 78.881 78.881 83.489 4.608 78.881Water Truck Blowhole Field -31.69093409 128.7865424 77.795 77.795 77.795Nuneeja Rockhole Field -31.90309177 127.0584842 83.010 83.010 104.312 21.302 104.312 83.010 104.312Old Madura Pass Field -31.89534692 127.0262381 69.066 69.066 78.767 9.701 78.767 69.066 78.767Madura Cave Field -31.98455774 127.039538 19.450 19.450 19.450Madura Quarry Field -32.03968458 127.0450628 19.862 19.862 19.862Nurina Cave Field -32.01629738 127.0074954 19.015 19.015 19.015Kanidal Beach Field -32.23858463 126.159611 6.168Fox Hole Cave Field -32.03490669 126.1875873 78.971 78.971 87.577 8.606 78.971Pannikin Plain Cave Field -32.03101511 126.1835064 75.516 75.516 84.115 8.599 84.115 88.416 4.301 75.516 84.115Trig Station NMF-228 Supplementary -31.898056 127.04 81.30 81.30 93.80 12.50 93.80 107.50 13.7082NUR001 Supplementary -30.031953 128.611776 175.00 187.50 12.50 187.50 196.00 8.50 187.5082NUR002 Supplementary -30.020842 128.533855 175.00 187.00 12.00 187.00 193.00 6.00 187.0082NUR003 Supplementary -30.009731 128.455936 153.00 174.00 21.00 174.00 178.00 4.00 174.0082NUR004 Supplementary -30.181954 128.481913 159.00 172.00 13.00 193.00 197.00 4.0082NUR005 Supplementary -30.19862 128.546845 165.00 171.00 6.00 171.00 200.00 29.00 171.0082NUR006 Supplementary -30.1764 128.403991 153.00 175.00 22.00 175.00 193.00 18.00 175.0082NUR007 Supplementary -30.331956 128.41698 128.00 162.00 34.00 168.00 175.00 7.0082NUR008 Supplementary -30.40529 128.370226 132.00 168.00 36.00 168.00 174.00 6.00 168.0082NUR009 Supplementary -30.498625 128.326072 120.00 166.00 46.00 168.00 175.00 7.00CD 1 Supplementary -31.199102 129.351516 -44.00CD 2 Supplementary -31.167465 129.478461 -48.30CD 3 Supplementary -30.971402 129.279419 -8.00BN 1 Supplementary -31.1688454 129.1669693 -38.10BN 2 Supplementary -31.1624954 129.1635162 -39.10KN 1 Supplementary -31.3236406 129.7072923 -82.10KN 2 Supplementary -31.2272846 129.6535493 -52.00Yangoonabie Bore (294) Supplementary -31.4673316 130.0721715 -81.73 48.72 130.45 48.72 67.62 18.90 48.72Cook Bore (295) Supplementary -30.6098844 130.4163782 57.00Cook Bore 3 (298) Supplementary -30.6102473 130.4209952 55.00 87.00 32.00 87.00 125.00 38.00 87.0080EP 1 Supplementary -31.314785 130.679198 -46.70 58.30 105.00 58.30 70.30 12.00 58.3080EP 2 Supplementary -30.515604 130.5843815 74.70 90.70 16.00 90.70 120.70 30.00 90.70COOK 1 (370) Supplementary -30.8317518 130.6821251 -12.66 39.46 52.12 39.46 85.18 45.72 39.46Nullarbor Plains 2 (359) Supplementary -31.2621057 130.5869422 -70.87Nullarbor Plains 5 (360) Supplementary -31.1570797 130.8943601 -14.68 40.30 54.98 40.30 85.90 45.60 40.30
60

Appendix 4 continued (part 2 of 2)
Site Name Site Type Latitude Longitude Base Tew Top Tew Tew Thickness Base Tma Top Tma Tma Thickness Base Tmnm Top Tmnm Tmnm Thickness Base Tmn Top Tmn Tmn Thickness Base Roe Tew - Tmn Contact Tew - Tma Contact Tma - Tmnm Contact Tmnm - Tmn Contact Tma - Tmn Contact Tma - Roe ContactNullarbor Plains 6 (436) Supplementary -31.1490595 131.1938164 -26.39 37.62 64.01 37.62 68.10 30.48 37.62Roberts Well Supplementary -31.4446817 130.8858563 -66.49EHBS 25 Supplementary -31.4501453 130.9248751 21.00 21.00 56.00 35.00 21.00EHBS 25B Supplementary -31.444639 130.931078 23.80 23.80 56.80 33.00 23.80EHBS 24A Supplementary -31.372181 131.1811668 19.00 19.00 52.00 33.00 19.00Jubilee White Well Bore Supplementary -31.4322383 131.0042192 -66.87YL 2 Supplementary -30.2676551 131.1006408 78.80 104.80 26.00YL 3 Supplementary -30.5274424 131.1279581 59.70 89.70 30.00 89.70 115.70 26.00 89.70ORP 2 Supplementary -30.4518624 131.5570284 84.30 113.30 29.00Ooldea 1 Supplementary -30.4601313 131.6301077 69.70 96.80 27.10Ooldea 2 Supplementary -30.5857258 131.7597451 103.70 106.20 2.50Ooldea 3 Supplementary -30.6288863 131.9159686 87.10 103.10 16.00PDH 1 Supplementary -30.5196615 131.9744477 111.00 122.00 11.00PDH 2A Supplementary -30.512314 131.7336137 76.90 96.90 20.00PDH 3 Supplementary -30.6035693 131.851903 94.20 98.20 4.00 98.20 110.20 12.00 98.20PIN-R 18 Supplementary -30.616421 131.8825189 93.10 110.60 17.50PIN-R 33 Supplementary -30.6311234 131.9507405 72.30 92.30 20.00PIN-R 20 Supplementary -30.6708206 131.949861 58.50 84.50 26.00PIN-R 34 Supplementary -30.6554481 131.9911155 68.00 90.00 22.00PIN-R 32 Supplementary -30.5528612 132.0210278 90.00 111.00 21.00PIN-R 31 Supplementary -30.6323532 132.0665645 98.70 100.70 2.00367 6 (131231) Supplementary -30.846134 132.1091981 90.00 96.10 6.10365 3 (131253) Supplementary -31.0431866 132.2540746 89.91 97.53 7.62602 4 (130921) Supplementary -31.2846588 132.3731079 41.20 43.20 2.00PIN-R 62 Supplementary -31.3019679 132.5648395 38.00 39.00 1.00602 49 (130944) Supplementary -31.4635352 132.6195883 32.00 38.00 6.00602 2 (130919) Supplementary -31.2466472 132.4109011 43.90 48.90 5.00602 6 (131778) Supplementary -31.2844639 132.4529232 39.50 40.50 1.00602 46 (131266) Supplementary -31.4620895 132.4965224 36.50 41.00 4.50PIN-R 74 Supplementary -31.5877611 132.6069512 41.30 44.30 3.00Tallacootra 2 Supplementary -31.245293 132.3354437 47.10 54.10 7.00602 33 (130939) Supplementary -31.4271546 132.373346 38.50 43.00 4.50NDR 15 Supplementary -31.8684945 132.2685114 16.00 22.00 6.00 22.00 33.00 11.00 22.00FW94 4 Supplementary -31.5212924 132.1659102 32.00 50.00 18.00316-R 8 Supplementary -31.337757 132.597543 38.95 41.39 2.44NDR 14 Supplementary -31.9126831 132.3300335 -5.00 -1.00 4.00ODH 3A Supplementary -31.1828581 131.6247352 18.90 54.90 36.00 54.90 74.90 20.00 54.90ODH 13A Supplementary -30.8727 131.62042 33.00 56.00 23.00 56.00 75.00 19.00 56.00PIN-R 7 Supplementary -30.8793894 131.8987334 47.10 71.30 24.20PIN-R 1 Supplementary -31.0134716 132.051804 60.90 74.60 13.70Colona 1 Supplementary -31.2725641 132.1445568 46.76 60.48 13.72TW 8 Supplementary -31.1075596 131.9141365 36.00 63.00 27.00602 12 Supplementary -31.3194543 132.536023 37.00 43.00 6.00COL 36 Supplementary -31.4718806 131.7492073 7.40 7.40 46.90 39.50 7.40EHBS 12 - Highways Supplementary -31.6129818 131.9994601 -5.90 44.40 50.30NDR 11 Supplementary -31.6439451 132.0771068 -20.00 14.00 34.00 14.00 30.00 16.00 14.00NDR 8 Supplementary -31.7273997 132.1601543 6.00 10.00 4.00 10.00 32.00 22.00 10.00NDR 13 Supplementary -31.6283392 132.0651177 -19.00 20.00 39.00 20.00 33.00 13.00 20.00FOR004 Supplementary -31.28008 128.55396 -64.20 98.60 162.80 98.60 133.10 34.50 98.60FOR011 Supplementary -30.61716 128.17583 102.10 158.10 56.00 158.10 178.10 20.00 158.10MAD014 Supplementary -30.47861 127.08571 129.00 190.50 61.50 190.50 212.00 21.50 190.50
61

EV
OL
UT
ION
AN
D D
EF
OR
MA
TIO
N O
F T
HE
ON
SH
OR
E
EU
CL
A B
AS
IN D
UR
ING
TH
E C
EN
OZ
OIC
RE
CO
RD
2016/1
0M
ou
ns
her
This Record is published in digital format (PDF) and is available as a free
download from the DMP website at
<www.dmp.wa.gov.au/GSWApublications>.
Information Centre
Department of Mines and Petroleum
100 Plain Street
EAST PERTH WESTERN AUSTRALIA 6004
Phone: +61 8 9222 3459 Fax: +61 8 9222 3444
www.dmp.wa.gov.au/GSWApublications
Further details of geological products produced by the
Geological Survey of Western Australia can be obtained by contacting: