
Evidence from Northern Ireland 1920-1972
318
DOCTOR OF PHILOSOPHY The economics of evolution Evidence from Northern Ireland 1920-1972 Jordan, David Award date: 2020 Awarding institution: Queen's University Belfast Link to publication Terms of use All those accessing thesis content in Queen’s University Belfast Research Portal are subject to the following terms and conditions of use • Copyright is subject to the Copyright, Designs and Patent Act 1988, or as modified by any successor legislation • Copyright and moral rights for thesis content are retained by the author and/or other copyright owners • A copy of a thesis may be downloaded for personal non-commercial research/study without the need for permission or charge • Distribution or reproduction of thesis content in any format is not permitted without the permission of the copyright holder • When citing this work, full bibliographic details should be supplied, including the author, title, awarding institution and date of thesis Take down policy A thesis can be removed from the Research Portal if there has been a breach of copyright, or a similarly robust reason. If you believe this document breaches copyright, or there is sufficient cause to take down, please contact us, citing details. Email: [email protected] Supplementary materials Where possible, we endeavour to provide supplementary materials to theses. This may include video, audio and other types of files. We endeavour to capture all content and upload as part of the Pure record for each thesis. Note, it may not be possible in all instances to convert analogue formats to usable digital formats for some supplementary materials. We exercise best efforts on our behalf and, in such instances, encourage the individual to consult the physical thesis for further information. Download date: 12. Feb. 2022
Transcript of Evidence from Northern Ireland 1920-1972

DOCTOR OF PHILOSOPHY
The economics of evolutionEvidence from Northern Ireland 1920-1972
Jordan, David
Award date:2020
Awarding institution:Queen's University Belfast
Link to publication
Terms of useAll those accessing thesis content in Queen’s University Belfast Research Portal are subject to the following terms and conditions of use
• Copyright is subject to the Copyright, Designs and Patent Act 1988, or as modified by any successor legislation • Copyright and moral rights for thesis content are retained by the author and/or other copyright owners • A copy of a thesis may be downloaded for personal non-commercial research/study without the need for permission or charge • Distribution or reproduction of thesis content in any format is not permitted without the permission of the copyright holder • When citing this work, full bibliographic details should be supplied, including the author, title, awarding institution and date of thesis
Take down policyA thesis can be removed from the Research Portal if there has been a breach of copyright, or a similarly robust reason.If you believe this document breaches copyright, or there is sufficient cause to take down, please contact us, citing details. Email:[email protected]
Supplementary materialsWhere possible, we endeavour to provide supplementary materials to theses. This may include video, audio and other types of files. Weendeavour to capture all content and upload as part of the Pure record for each thesis.Note, it may not be possible in all instances to convert analogue formats to usable digital formats for some supplementary materials. Weexercise best efforts on our behalf and, in such instances, encourage the individual to consult the physical thesis for further information.
Download date: 12. Feb. 2022

Page 1 of 317
The Economics of Devolution:
Evidence from Northern Ireland
1920-1972
David Patrick Jordan, BSc, MSc
Thesis submitted for the degree of PhD Economics
Queen’s Management School
Queen’s University Belfast
March 2020
D.P. Jordan
Page 2 of 317
ABSTRACT
This thesis asks whether the devolution of policy-making powers is beneficial for
regional economic performance, by examining the subnational government at
Stormont, between 1920 and 1972. Greater fiscal decentralisation within the UK has
been put forward as a solution to growing regional inequalities in economic
performance, but the historical example of Northern Ireland has been overlooked.
Northern Ireland presents a puzzle, as its economic performance persistently lagged
the UK and its regions, despite the apparent benefit of possessing fiscal
decentralisation. This thesis is divided into three chapters, which examine three
aspects of the subnational government. Chapter 1 examines financial relations
between Stormont and Westminster, showing moral hazard limited the financial
support provided by Westminster to Stormont. This restricted the efficiency of fiscal
decentralisation, creating long-run opportunity costs in industry, infrastructure,
education, and housing. Chapter 2 examines Stormont’s interwar industrial policy,
showing regional institutions created barriers to productivity growth. New, higher
productivity industries failed to establish, helping lock the regional economy into a
low-wage-investment-productivity equilibrium, which persisted post-war. Chapter 3
examines the effect of the Great Depression on Northern Ireland’s trade performance.
Its trade is found to have been more resilient than the existing narrative suggests, with
a recovery driven by the staple industries, and the UK’s protectionist trade policy
benefiting Northern Ireland’s exports to Britain. Northern Ireland’s problems of high
unemployment and slow growth were therefore not simply demand-side problems,
but reflected the supply-side of the regional economy as well. Together, the three
chapters demonstrate the importance of regional institutions and the supply-side to
the economic benefits of devolution being realised, where simply more devolution is
not necessarily beneficial for economic efficiency.

D.P. Jordan
Page 3 of 317
ACKNOWLEDGEMENTS
Thank you to my Supervisors, Dr Graham Brownlow and Dr Alan de Bromhead, for
sharing all their knowledge, insight, and encouragement.
Thank you to the Department for the Economy, formerly Department for Employment
and Learning, who awarded me a Postgraduate Research Studentship to undertake
this PhD.
I have presented parts of this thesis at seminars and conferences held at Queen’s
University Belfast, Trinity College Dublin, University College Dublin, University of
Oxford, and London School of Economics, and I am very grateful for all the feedback
and suggestions which I received from attendees.
Thank you to the all the staff at The Public Record Office of Northern Ireland, The
National Archives, Queen’s University Library, and Queen’s Management School, for
facilitating my research.
To my parents, thank you for all your support throughout this journey, it would not
have been possible without you.
And finally to my fellow PhD students, I could not have wished for a better group of
people with which to share the past four years.

D.P. Jordan
Page 4 of 317
TABLE OF CONTENTS
ABSTRACT 2
ACKNOWLEDGEMENTS 3
TABLE OF CONTENTS 4
LIST OF FIGURES AND TABLES 6
LIST OF ABBREVIATIONS 8
INTRODUCTION 9
CHAPTER 1: The moral hazard of devolution 22
1) Introduction 23
2) Relevant literature 27
(i). Institutions 27
(ii). First generation fiscal federalism 29
(iii). Second generation fiscal federalism 32
(iv). Northern Ireland literature 36
(v). Conclusion 39
3) Method 41
(i). The puzzle 41
(ii). The actors 45
(iii). The analytic component 47
(iv). The narrative component 48
4) Original settlement (1920 Act) 50
5) Initial experience (1921-1925) 60
6) Transition to ongoing support (1925-1938) 78
7) Renegotiation (1938-1945) 97
8) Post-war financial control (1945-1972) 104
9) Conclusion 117
10) Appendix A – Constructing a time-series of
Stormont’s public finances
121
11) Appendix B – Additional Tables and Figures 128
12) Appendix C – Demography 136
CHAPTER 2: Doomed to decline? 138
1) Introduction 139
2) Relevant literature 142
3) Industrial performance and productivity 149
4) Regional institutions 161

D.P. Jordan
Page 5 of 317
5) Survival of old industries 167
(i). Textiles 167
(ii). Shipbuilding 175
(iii). Smaller industries 178
6) Barriers to new industries 180
7) Conclusion 194
8) Appendix 197
CHAPTER 3: Borders of the past 200
1) Introduction 201
2) Relevant literature 204
3) Method and data 213
(i). Method 213
(ii). Main data source 214
(iii). Additional data sources 217
4) Impact of the Great Depression on trade 219
(i). Level of trade 219
(ii). Composition of trade 224
a) Food, drink, tobacco 227
b) Raw materials 232
c) Manufactured goods 235
(iii). Demand versus supply explanations 241
5) Direction of trade and protectionism 250
(i). Direction of trade 252
(ii). Effect of UK’s protectionist trade policy 258
(iii). Northern Ireland’s trade with the Irish
Free State
272
6) Conclusion 279
7) Appendix A – Constructing a time-series of
Northern Ireland’s interwar trade
284
8) Appendix B – Tables and Figures 288
9) Appendix C – Regional multiplier 290
CONCLUSION 293
BIBLIOGRAPHY 307
D.P. Jordan
Page 6 of 317
LIST OF FIGURES AND TABLES Table 1.1: Regional GDP per capita (UK=100) 42
Figure 1.1: Unemployment by UK region 43
Figure 1.2: Bank deposits by UK region 44
Table 1.2: Distribution of government powers 51
Table 1.3: UK regions ranked by unemployment rate of insured population 61
Table 1.4: Stormont’s borrowing 71
Table 1.5: Northern Ireland Unemployment Fund 71
Figure 1.3: Equivalent public expenditure per capita 87
Figure 1.4: Law and Justice per capita expenditure 89
Figure 1.5: Education expenditure per pupil 90
Figure 1.6: Number of local authority houses built 91
Figure 1.7: Industry and infrastructure expenditure per capita 92
Figure 1.8: Total equivalent public expenditure per capita 106
Figure 1.9: Social services expenditure per capita 108
Figure 1.10: Number of local authority houses built 109
Figure 1.11: Total education expenditure per pupil (Central+Local) 110
Figure 1.12: Industry and infrastructure expenditure per capita 111
Figure 1.A.1: National and Subnational public finances 123
Figure 1.A.2: Subnational public finances 127
Table 1.B.1: Share of UK GDP (%) 128
Table 1.B.2: Comparison of wages by industry 129
Figure 1.B.1: Northern Ireland's share of all-island population 130
Figure 1.B.2: Education expenditure per pupil 131
Figure 1.B.3: Stormont agriculture expenditure per capita 132
Figure 1.B.4: Expenditure on Road Fund per capita 132
Figure 1.B.5: Stormont's annual surplus/deficit per capita 133
Figure 1.B.6: Total Westminster (UK) payments to Stormont (NI) 133
Figure 1.B.7: Imperial Contribution 134
Figure 1.B.8: Imperial Services expenditure per capita 134
Figure 1.B.9: Law and justice expenditure per capita 135
Figure 1.C.1: Index of population (1922=100) 137
Table 1.C.1: Demographic structure 137
Table 2.1: Relative GDP per capita 149
Figure 2.1: Average annual unemployment 149
Figure 2.2: Regional average annual unemployment 150
Figure 2.3: Interwar unemployment in manufacturing 151
Figure 2.4: Manufacturing employment by sector 152
Table 2.2: Relative regional productivity performance of manufacturing 153
Table 2.3: Relative manufacturing productivity performance 155
Table 2.4: Manufacturing productivity by sector (NI/UK where UK=100) 157
Table 2.5: Proportion of textile output (sq. yds.) in Northern Ireland by type 159
Table 2.4: Business interests of Stormont Unionist MPs 1921-1945 164
Table 2.5: Comparison of changes in output, capital, and employment, 1912-
1937
168
Figure 2.5: Linen unemployed 171
Figure 2.6: Industrial sector labour market 171
Table 2.6: Relative wages in textiles 171

D.P. Jordan
Page 7 of 317
Figure 2.7: Stormont industrial expenditure 174
Table 2.7: Shipbuilding output and costs, where NI/UK (UK=100) 178
Table 2.8: Successful applicants under the 1932 New Industries Act 183
Table 2.9: The Advisory Committee under 1932 New Industries Act 185
Table 2.10: New Industries Act 1937 distribution by manufacturing sector 192
Table 2.A.1: Percentage of population by occupation 197
Table 2.A.2: Northern Ireland manufacturing productivity 197
Table 2.A.3: Output per person across sectors, 1924-1968 198
Table 2.A.4: Costs as a percentage of gross output by manufacturing sector
(NI/UK where UK=100)
198
Table 2.A.5: Regional characteristics for productivity growth 199
Table 2.A.6: Northern Ireland employment in textiles 199
Table 2.A.7: The Advisory Committee under 1937 New Industries Act 199
Figure 3.1: Total value of foreign imports and exports per person 220
Figure 3.2: Total value of all imports and exports per person 222
Figure 3.3: Northern Ireland’s trade in international context (1928=100) 224
Figure 3.4: Northern Ireland’s trade disaggregated by class 226
Figure 3.5: Total value of trade in food, drink, tobacco 228
Table 3.1: Average annual weighted percentage change in value for imports of
food, drink, tobacco
230
Table 3.2: Average annual weighted percentage change in value for exports of
food, drink, tobacco
230
Figure 3.6: Total value of trade in raw materials 233
Table 3.3: Average annual weighted percentage change in value for imports of
raw materials
234
Table 3.4: Average annual weighted percentage change in value for exports of
raw materials
235
Figure 3.7: Total value of trade in manufactured goods 237
Table 3.5: Average annual weighted change in value for imports of
manufactured goods
239
Table 3.6: Average annual weighted change in value for exports of
manufactured goods
239
Table 3.7: Average annual real growth in GDP and exports 243
Figure 3.8: Index of number unemployed (1928=100) 243
Figure 3.9: Trade balance per capita 245
Figure 3.10: Northern Ireland unemployment by sector 247
Figure 3.11: Total value of Northern Ireland’s trade by origin/destination 253
Table 3.8: Share of imports by origin (%) 256
Table 3.9: Share of exports by destination (%) 257
Table 3.10: PPML gravity estimates of imports by category, 1924-1937 262
Table 3.11: Linear fixed effects estimates of effect of UK tariffs on Northern
Ireland’s exports to Britain, 1924-1937
268
Figure 3.12: Northern Ireland’s trade with the Irish Free State disaggregated by
class
274
Figure 3.13: Total value of Northern Ireland’s trade with the Irish Free State 276
Figure 3.14: Index of exports to the Irish Free State by class 278
Table 3.B.1: Digitised classes and commodities 288
Table 3.B.2: Irish Free State’s share of Northern Ireland’s trade 289
Table 3.B.3: Goods included within each model 289

D.P. Jordan
Page 8 of 317
LIST OF ABBREVIATIONS
Economic War Anglo-Irish Economic War (of 1932 to 1938)
EU European Union
GB Britain
1920 Act Government of Ireland Act, 1920
IFS Irish Free State
JEB Joint Exchequer Board
1932 Act New Industries Act, 1932
1937 Act New Industries Act, 1937
NI Northern Ireland
NITB Northern Ireland Transport Board
ONS Office for National Statistics
PRONI The Public Record Office of Northern Ireland
TNA The National Archive
UIDA Ulster Industries Development Association
UK United Kingdom

D.P. Jordan
Page 9 of 317
INTRODUCTION
Northern Ireland’s economic performance presents a puzzle. Since its inception, its
performance has persistently lagged the rest of the UK and its regions, despite being
the one UK region to possess devolution, from 1920 until 1972. For fifty years, it had
its own Parliament, and a government at Stormont which held key economic policy-
making powers. Literature from fiscal federalism suggests this should be beneficial
for economic performance, as policy can be tailored to the specific needs of the
region. Yet Northern Ireland’s economic performance failed to converge with other
UK regions. This raises the question of what role the subnational government played
in this poor performance, and does this experience demonstrate that the devolution
of economic policy-making powers is beneficial?
Since the 2014 Scottish Independence Referendum, devolution within the UK
has received greater attention. Further fiscal powers have been devolved to the
Scottish Parliament, in a shift towards ‘devomax’, and initiatives intended to rebalance
policy-making powers around the UK have been expanded, such as the Northern
Powerhouse and City Deals. These initiatives can be seen as part of a broader effort
to counter the rise of political populism, a rise embodied by the UK’s Brexit vote of
2016, but also seen across Europe, and further afield. In ‘The revenge of the places
that don’t matter’, Rodríguez-Pose (2018) sets out how differing regional experiences
of economic performance have motivated this populism. Regions experiencing
decline have reacted through the ballot box, “to rebel against the feeling of being left
behind” (Rodríguez-Pose, 2018, p.190). Understanding whether the decentralisation
of economic policy-making powers is beneficial, and why it may fail to promote
convergence, is therefore important, if regional imbalances in economic performance
are to be successfully addressed.
D.P. Jordan
Page 10 of 317
Northern Ireland provides the ideal opportunity to understand the implications
of subnational government for long-run economic performance. It is the unique
combination of its longevity, and the amount of qualitative and quantitative material
this generated, which makes it such an important example of subnational government.
Devolution to Northern Ireland began with the Government of Ireland Act 1920 (1920
Act), and ended with Stormont being prorogued in 1972. This provides what Brownlow
(2017, p.561) describes as a fifty-year “laboratory”, to understand how subnational
government operated in practice. This longevity is underpinned by the detailed data
and archival material which are available for analysis. Stormont collected extensive
statistics across many areas of economic life, and published these in sources such
as the Ulster Year Book, while Government files have been preserved, at the Public
Record Office of Northern Ireland and The National Archive. The combination of
longevity, and the quality of the quantitative and qualitative material available, is
unique within the UK, and is perhaps unsurpassed for a subnational government
outside of the United States. The extent of this archival material means it is yet to be
fully exploited, and this thesis takes advantage of this fact, to explore new aspects of
subnational government in Northern Ireland.
Despite its importance, Northern Ireland has been ignored as the first example
of fiscal federalism within the UK. This is partly due to the Troubles, which has led to
the assumption that Northern Ireland could offer few lessons for devolution elsewhere:
Stormont was “deemed dangerous, flawed and unlikely to produce anything worth
knowing” (Mitchell, 2006, p.58). The failure to consider Northern Ireland also reflects
the wider difficulty of fitting it into discussions of the UK and Irish economies. Data for
Northern Ireland is often separate from that available for the rest of the UK or Ireland,
while its mix of both British and Irish characteristics means it often does not
conveniently sit within the respective national narratives. However, treating Northern
Ireland as a place apart fails to acknowledge the valuable lessons its long-run

D.P. Jordan
Page 11 of 317
experience of devolution can provide. This thesis makes comparisons between the
new historical data collected and digitised for Northern Ireland, with that already
available for the UK and Irish Republic, to place the regional economy within its wider
context. Its experience can inform policymakers on the future direction UK devolution
needs to take to avoid the mistakes of the past.
Where national literature has treated Northern Ireland as a place apart, an
extensive literature has assessed the functioning of Stormont (Lawrence, 1965;
Buckland, 1979; Birrell and Murie, 1980; Wilson, 1989; Gibson, 1996; Mitchell, 2006).
The consequences for the economy has received attention, but this literature focuses
mainly on the post-war period, particularly on the issue of discrimination, and how
political decisions affected the allocation of economic resources within Northern
Ireland. Where this literature is weaker, is analysing the factors which affected the
overall, long-run performance of the Northern Ireland economy, and the relevance of
institutions to this. Regional institutions are often portrayed as irrelevant to Northern
Ireland’s economic performance, with an assumption that what was evident in post-
war Northern Ireland applied equally to the interwar period. Yet since North (1990),
institutions have been increasingly recognised as important to understanding long-
run economic performance. It is only by studying the interaction between regional
institutions and regional economic performance over the long-run, that a complete
picture of devolution can be made. This thesis therefore places a greater emphasis
on the interwar period, as the source of many of the economic problems policymakers
encountered.
A study of devolution also contributes to more recent fiscal federalism
literature. First generation fiscal federalism emphasises the benefits of fiscal
decentralisation (Hayek, 1945; Buchanan, 1950; Olson, 1969; Oates, 1972, 1999),
while second generation theory emphasises that institutions may create barriers to
these benefits being realised (Oates, 2005; Weingast, 2009; Vo, 2010). This fiscal
D.P. Jordan
Page 12 of 317
federalism literature focuses on federal, rather than devolved, institutional structures.
This thesis demonstrates that devolution, as a form of fiscal decentralisation, presents
different challenges. A key difference is the intergovernmental relationship between
national and subnational government, where power flows from the top downwards.
This has the potential to create different incentives, depending on how institutional
structures operate in the real world. Devolution to Northern Ireland provides an
opportunity to test theory from fiscal federalism in this different institutional structure
over the long-run, showing what explanatory power it possesses for the puzzle of
Northern Ireland’s persistent economic underperformance.
A subnational government possesses three economic relationships within a
devolved institutional structure. Firstly, it has a relationship with national government,
which is hierarchical in nature. Secondly, it has intra-regional relationships, which it
possesses with other economic agents within the region. Thirdly, it has external or
international relationships, which it possesses with the global economy. Each of these
relationships is governed by the external economic context, the operation of the
institutions present, and the interaction between these. Existing literature on Northern
Ireland has focused on the political side to institutions, in the context of discrimination
and the Troubles, neglecting the economic context. Where the economic context has
been addressed, it has often been done without much reference to the role of
institutions. There are notable exceptions, such as Crafts (1995), Gibson (1996), and
Brownlow (2007, 2013), which highlight the potential role of institutions in explaining
the performance of the Northern Ireland economy. However, these focus on the post-
war period, and have not demonstrated the importance of institutions over the long-
run.
To understand how subnational government affects regional economic
performance over the long-run, and the role of institutions in this, my thesis is divided
into three chapters. Each of these chapters examines a different aspect of the regional

D.P. Jordan
Page 13 of 317
economy, relating to the three economic relationships a subnational government
possesses within a devolved institutional structure. Each of these relationships affect
a different component of regional income, and so each chapter also addresses a
specific component of the regional economy. The first chapter examines how
subnational public expenditure (G) was affected by the intergovernmental financial
relations between Stormont and Westminster, and the implications for the efficiency
of fiscal decentralisation. The second chapter examines how regional institutions
affected subnational industrial policy during the interwar period, and the implications
for investment and productivity (I). The third chapter examines how national trade
policy affected regional economic performance (X-M), and the context and limits this
created for regional economic policy. Together, these chapters demonstrate the links
between subnational government and economic performance within a regional
setting.
Chapter 1 explores how the financial relations between Stormont (subnational
government) and Westminster (national government) affected the efficiency of fiscal
decentralisation. Existing literature has assumed that the institutional structure, which
governed the financial relations between the two governments, did not change over
time, with analysis based on post-war Stormont (Lawrence, 1965; Green, 1979;
Buckland, 1979; Gibson, 1996; Mitchell, 2006). There has also been very limited
analysis of the implications of these financial relations for the provision of public goods
and services. To address these issues, an analytic narrative approach is adopted.
This combines theory from fiscal federalism (Buchanan, 1950; Olson, 1969; Oates,
1972, 1999, 2005; Weingast, 2009) with archival material and a new dataset
constructed for Stormont’s public finances. Conducting this analysis using the
comparative federalism framework of Weingast (2009), the changing nature of
financial relations between the two governments is shown to have affected the

D.P. Jordan
Page 14 of 317
efficiency of fiscal decentralisation, through the level and composition of public goods
and services.
Stormont’s financial relations with Westminster were defined by the
Government of Ireland Act (1920 Act). The 1920 Act was broadly efficient, but
contained key weaknesses: it did not provide for fiscal transfers to equalise fiscal
pressure, and it did not impose a hard budget constraint, both requirements for
efficiency. A key sequence of events during the initial years of devolution therefore
saw a movement away from the de jure position of the 1920 Act, as Westminster
sought to manage its developing principal-agent relationship with Stormont. Prompted
by an economic downturn, which placed increasing financial pressure on Stormont,
Westminster provided one-off financial support, and guaranteed Stormont’s
borrowing. Westminster also referred Stormont’s financial situation to a body other
than the Joint Exchequer Board (JEB), which under the 1920 Act was intended to
arbitrate over such matters. This weakening of institutionalised authority, combined
with Westminster failure to commit to exercising its veto over subnational legislation,
saw Stormont’s budget constraint soften. This created a moral hazard problem for
Westminster in providing further financial support.
The remainder of the interwar period saw Westminster provide increasing
financial support to Stormont, but with conditions attached to limit total public
expenditure, and thus moral hazard. This further weakened institutionalised authority,
and eroded subnational autonomy. The limited nature of this support failed to equalise
fiscal pressure, leading to opportunity costs in the provision of subnational public
goods and services, particularly education, housing, and industry and infrastructure.
Continued support also further softened Stormont’s budget constraint, leading to
inefficient expenditure. It was one such instance, the Northern Ireland Transport
Board, combined with the outbreak of war, which saw Westminster able to exercise
almost full oversight of Stormont’s expenditure. It was this sequence of events which
D.P. Jordan
Page 15 of 317
almost fully removed asymmetric information from financial relations, and allowed
Westminster to be more financially generous, funding the post-war expansion of the
welfare state in Northern Ireland.
While Westminster became more financially generous, fiscal pressure was not
immediately equalised. Northern Ireland missed out on the ratchet effect of increased
public expenditure post-war, a result of Stormont’s desire to continue paying an
Imperial Contribution, and an institutional structure which saw Westminster able to
control all significant items of expenditure. This continued the earlier opportunity costs
in education, housing, and industry and infrastructure. Westminster’s focus on solely
limiting its total liability also opened the door to discriminatory behaviour in subnational
policy. As long as Stormont’s expenditure was within prescribed limits, it could vary
the composition. It was only when greater transparency was brought to financial
relations, combined with electoral competition, that public expenditure increased to
equalise fiscal pressure, and the efficiency of policy interventions improved.
Chapter 1 demonstrates the importance of institutional structure in financial
relations between national and subnational government. The failure to alter the de
jure institutions, when it became evident these were inadequate, resulted in a
weakening of institutionalised authority, and a softening of the subnational budget
constraint. In response to the moral hazard problem this created, the national
government further weakened institutionalised authority, which eroded subnational
autonomy. This limited Westminster’s financial liability in the short-run, but the
financial restrictions on the subnational government created long-run opportunity
costs. It was only when the national government was able to solve the asymmetric
information problem, and greater transparency introduced, that efficiency began to
improve, and the opportunity costs could begin to be addressed. This has important
implications for how we should view attempts to extend fiscal decentralisation within
the current UK institutional structure.
D.P. Jordan
Page 16 of 317
Chapter 2 examines the role of regional institutions in explaining Northern
Ireland’s long-run productivity gap to the rest of the UK, focusing on Stormont’s
industrial policy during the interwar period. The importance of institutions in creating
barriers to productivity growth has been demonstrated at a national level (Broadberry
and Crafts, 1992; Broadberry, 1997), but application to Northern Ireland is limited.
Existing literature has focused on the post-war period, and the role of institutions in
improving economic performance (Crafts, 1995; Brownlow, 2007). Explanations for
Northern Ireland’s poor interwar performance have not considered the role of
institutions, instead seeing this as a demand-side story, and the inevitable result of
an industrial structure concentrated in linen and shipbuilding, with Stormont’s
industrial policy being irrelevant (Buckland, 1979; Johnson, 1985a). By combining
newly digitised data to measure interwar manufacturing productivity, with new archival
material relating to Stormont’s industrial policy, it demonstrates that overlapping
networks between business and politics created barriers to productivity growth. This
helped lock the regional economy into a low-wage-investment-productivity
equilibrium, the effects of which persisted post-war. The interwar period was therefore
a crucial piece in the development of subnational industrial policy, and demonstrates
that regional institutions pose a limit on the efficient decentralisation of industrial
policy.
Northern Ireland shared many characteristics with other UK regions during the
interwar period, yet its performance was particularly poor. This has been attributed to
Northern Ireland’s industrial structure, and its overreliance on the old, staple industries
(Buckland, 1979; Johnson, 1985a). Collecting data from the Northern Ireland Census
of Production, and comparing this with data for the UK, shows that within-sector
productivity failings were more important than simply industrial structure. This within-
sector productivity gap was a persistent feature of manufacturing throughout
devolution, across all sectors. It reflected the failure of new industries to establish
D.P. Jordan
Page 17 of 317
during the interwar period, such as man-made fibres in textile, and electrical
engineering in the metal trades, when these were growing in Britain.
The failure of these new industries to establish is linked to the regional
institutions present, which created barriers to productivity growth. Strong overlapping
networks existed between the old, staple industries and the ruling Unionist Party. This
gave existing firms the means to alter industrial policy to reflect their preferences.
They also had the motivation to do so, as falling demand raised the relative payoff
from altering institutions for their own benefit. This motivation was reinforced by the
supply-side characteristics faced by existing firms, including the availability of cheap
labour, and satisficing behaviour amongst firms’ management. The two staple
industries, textiles and shipbuilding, were able to use their influence to acquire
government subsidy, while smaller industries received much more limited support.
Stormont’s industrial policy, aimed at attracting new industries to Northern
Ireland, was also flawed. The effect of the New Industries Acts of 1932 and 1937 was
limited, not simply as the result of a lack of funds as the existing narrative suggests
(Buckland, 1979; Johnson, 1985a), but due to the overlapping networks between
business and government. The 1932 Act provided financial support for firms to acquire
a site for their factory, but the limited nature of support reflected Stormont’s desire to
protect existing firms from competition. Existing firms were also able to influence
which applicants received support, through an Advisory Committee, which was given
great discretion over the approval process by Stormont. The Advisory Committee
assessed applications based on their potential to compete with existing firms, rather
than on their merits as new industries, leading to few successful applications. When
Stormont expanded the financial support offered under the 1937 Act, it did so to allow
existing firms to apply, and increased the financial support available, but this
overwhelmingly supported old, low productivity industries and sectors. Stormont’s

D.P. Jordan
Page 18 of 317
industrial policy therefore failed in its objective to promote the growth of new, higher
productivity industries.
Chapter 2 demonstrates the importance of regional institutions to the
successful implementation of regional industrial policy. While first generation fiscal
federalism would suggest providing subnational government with the power to
implement tailored industrial policy is beneficial (Hayek, 1945; Buchanan, 1950;
Olson, 1969; Oates, 1972, 1999), the regional institutions which governed the
interaction between business and politics led to the misallocation of resources. Rather
than aiding the growth of new, higher productivity industries in Northern Ireland,
Stormont’s interwar industrial policy instead created barriers to the growth of these
new industries. The protection of short-run employment in the old industries was
prioritised over long-run development, the effects of which would persist into the post-
war period. This suggests the existing institutional context must be considered before
greater decentralisation of policy-making powers takes place.
Chapter 3 examines Northern Ireland’s interwar trade performance, to
understand how it was affected by the Great Depression and rise in protectionism.
While devolution provides a subnational government with a toolbox of policymaking
powers, there are powers which remain outside its control. The 1920 Act saw
Westminster retain powers over trade, including customs and excise, with Stormont
having no influence over these policies. While there is an extensive literature
examining the effect of the Great Depression and protectionism on national
economies (Aldcroft, 1970; Capie, 1981; Kitson and Solomou, 1990; Eichengreen and
Irwin, 1995; Madsen, 2001; Harley, 2003; Jacks et al., 2011; De Bromhead et al.,
2019), the experience of regions has received relatively little attention. Examining
Northern Ireland’s interwar trade performance, demonstrates that it was not as
severely affected by the Great Depression as the existing narrative, of Buckland
(1979) and Johnson (1985a, 1985b), suggests. Northern Ireland’s trade was more

D.P. Jordan
Page 19 of 317
resilient than either the Irish Free State or Britain, recovering to pre-crash levels by
1937, with tariffs redirecting trade towards Britain.
The reason for the lack of historical studies examining regional trade is the
absence of trade data at a regional level. Northern Ireland presents a unique
opportunity to analyse regional trade, as detailed annual trade statistics were
collected during the interwar period, as a result of the 1920 Act. These statistics
reflected the need to track the movement of dutiable goods between Northern Ireland
and Britain, so that Stormont’s share of customs and excise revenue could be
calculated. These previously unexploited statistics, held in handwritten trade ledgers
and books at the Public Record Office of Northern Ireland (PRONI), provide
disaggregated records of Northern Ireland’s trade with Britain, the Irish Free State,
and directly with foreign countries. Digitising this data allows a systematic analysis of
Northern Ireland’s trade during the Great Depression for the very first time, giving a
new insight into the impact of the Great Depression, and the UK’s protectionist trade
policy, at a regional level.
The existing narrative for Northern Ireland’s interwar trade performance is
provided by Buckland (1981) and Johnson (1985a, 1985b), where the region’s
problems of high unemployment and low economic growth were the result of falling
global demand in the staple industries. This reflects the argument of Thirlwall (1980),
that a region’s growth is determined by demand for its exports. Yet Northern Ireland’s
trade performance, particularly for exports, was more resilient during the Great
Depression, when compared with either the Irish Free State or Britain. The value of
its imports and exports did not fall as far, and recovered more quickly, than either
Britain or particularly the Irish Free State. Northern Ireland’s trade had almost returned
to its pre-crash level by the end of 1936, with this recovery driven by exports of
manufactured goods, primarily in the staple industries of textiles and shipbuilding.
This resilience demonstrates Northern Ireland’s problems of high unemployment and

D.P. Jordan
Page 20 of 317
slow growth were not simply demand determined, as Thirwall’s (1980) model
suggests, but these problems also reflected supply-side characteristics of the regional
economy. This conclusion supports the findings of Chapter 2, that long-run barriers to
growth existed on the supply-side. The failure of the recovery in trade to translate into
wider regional growth can also linked to a weak Keynesian regional multiplier,
reflecting weak linkages between tradable and non-tradeable sectors within the
regional economy.
The contribution of the UK’s protectionist trade policy to Northern Ireland’s
better than expected trade performance is also examined. The UK introduced wide-
ranging tariffs on foreign imports during the interwar period, under legislation such as
the 1932 Import Duties Act. In addition, Northern Ireland was on the frontline of the
Anglo-Irish Economic War, which saw the UK and Irish Free State place tariffs on
each other’s exports between 1932 and 1938. Using a gravity model based on the
method of De Bromhead et al. (2019), the UK’s tariff policy is found to have had a
statistically significant effect on decreasing Northern Ireland’s imports of commodities
subject to tariffs. The UK’s protectionist trade policy is also shown to have benefited
Northern Ireland’s exports to Britain. Using a linear fixed effects model, Northern
Ireland’s exports of commodities subject to UK tariff’s increased their share of Britain’s
exports, particularly for raw materials, and staple manufactured goods. Northern
Ireland is also shown to have been more vulnerable to the Economic War than Britain,
with manufactured goods particularly affected, but that a redirection of trade towards
Britain and direct-foreign trade compensated for this lost market.
Chapter 3 demonstrates that Northern Ireland’s interwar trade performance
was not as poor as the existing narrative of Buckland (1981) and Johnson (1985a,
1985b) suggests. Northern Ireland’s trade returned to its pre-crash levels earlier than
either Britain or the Irish Free State. This result supports the wider view that the
economic recovery following the Great Depression was driven by within-country,

D.P. Jordan
Page 21 of 317
rather than international, trade (Ghosh, 1940; Aldcroft, 1970; Eichengreen and Irwin,
1995). This resilience was driven by the staple industries in Northern Ireland, contrary
to the narrative that these experienced a persistent decline only temporarily halted by
World War II (Ollerenshaw, 2013a). This demonstrates that Northern Irelands interwar
problems of high unemployment and low growth were not simply demand driven, and
emphasises the importance of the supply-side to the regional economy. This can be
linked to the barriers to growth identified in Chapter 2, and a low regional multiplier,
as a result of the lack of integration across the supply-side of the regional economy.
The effect of the UK’s trade policy on regional trade also demonstrates that while
protectionism may have a negative aggregate effect on economic growth, certain
regions may unintentionally benefit, thanks to their particular mix of industries. That
the UK’s tariff policy benefited certain industries is contrary to Kitson, Solomou and
Weale (1991), that UK tariffs had no beneficial effect on individual industries in the
UK. The interwar period can therefore be viewed as the period when Northern
Ireland’s economic links with Britain were strengthened, as a result of the Great
Depression, and associated protectionist trade policy.
Together, these three chapters combine new archival material and new
sources of data, to provide an insight into Northern Ireland’s economic history, and
challenge the existing narratives which surround key aspects of the regional
economy. Often it is the politics, and the subsequent Troubles, which dominates the
discussions of the fifty years of devolution to Stormont. This thesis argues that it is
only by fully understanding Northern Ireland’s economic history, and particularly the
role of institutions, that the region’s current economic problems can be fully
understood. The conclusion provides further discussion of the implications from
Northern Ireland’s experience of devolution, and whether greater decentralisation of
powers is beneficial within a UK and global context.

D.P. Jordan
Page 22 of 317
CHAPTER 1
The moral hazard of devolution
Applying fiscal federalism to the evolution of
Northern Ireland’s public finances, 1920-1972
Abstract
Northern Ireland is the first example of devolution within the UK. Yet despite the
apparent benefit of fiscal decentralisation between 1920 and 1972, its economic
performance continued to lag behind the rest of the UK. Using an analytic narrative,
combining theory from fiscal federalism, new archival material, and a new dataset for
Stormont’s public finances, demonstrates how changes in institutional structure
affected the economic efficiency of fiscal decentralisation. Westminster is shown to
have been primarily concerned with limiting the moral hazard posed by Stormont,
leading to conditions being imposed on fiscal transfers, which restricted the growth of
public expenditure. This affected the level and composition of subnational public
goods and services, with a large opportunity cost identified for industry, housing, and
education. These opportunity costs had significant implications for Northern Ireland’s
long-run economic performance, and implications for inequality and discrimination,
which were issues at the heart of the beginning of the Troubles. This suggests that
the UK lacks the institutional capacity to deal with the financial consequences of
expanded fiscal decentralisation.

D.P. Jordan
Page 23 of 317
1) Introduction
Increasing regional inequalities in economic performance have emerged across the
UK in recent decades, and have been associated with the rise of political populism
(Rodríguez-Pose, 2018). Further decentralisation within the UK of policymaking
powers has been put forward as the solution, such as the Northern Powerhouse, City
Deals, and greater powers to the Scottish Parliament.1 Greater devolution of authority
to local and regional government is also a global trend (Rodríguez-Pose and Gill,
2003). By providing local policymakers with greater powers, it is assumed that local
policy interventions will be more efficient at addressing local problems. Yet the
existing literature on fiscal federalism provides no consistent conclusion on whether
greater decentralisation is beneficial. Devolution to the Stormont Parliament in
Northern Ireland, between 1920 and 1972, therefore provides a fifty-year opportunity
to test whether greater fiscal decentralisation is indeed beneficial. Using an analytic
narrative, combining archival material with a new dataset for Stormont’s public
finances, demonstrates how changes in the institutional structure affected the
economic efficiency of fiscal decentralisation, giving us a better understanding of how
fiscal decentralisation operates within a UK institutional structure.
Northern Ireland was the first instance of fiscal federalism, or fiscal
decentralisation, within the UK. Yet discussions of the economic effects of devolution
within the UK focus primarily on post-1998 devolution, to the Scottish Parliament,
Welsh Assembly, and Northern Irish Assembly (McGregor and Swales, 2005; Bell,
2014, 2016). The earlier experience of Northern Ireland is ignored. This is due to the
Troubles, which has led to the Stormont model of devolution being “deemed
dangerous, flawed and unlikely to produce anything worth knowing” (Mitchell, 2006,
p.58). However, by applying theory from fiscal federalism to this first experience, it
1 See: H.M. Treasury (2016) Northern Powerhouse Strategy; H.M. Government (2011) Unlocking growth in cities; and H.M. Government (2015) Scotland in the United Kingdom: an enduring settlement.

D.P. Jordan
Page 24 of 317
provides lessons for contemporary policymakers on how the institutions can affect the
efficiency of fiscal decentralisation, and thus economic performance. Doing so
highlights the limited capacity of the UK’s institutional structure to deal with expanded
fiscal decentralisation.
First generation fiscal federalism emphasises the benefits of fiscal
decentralisation, while second generation theory emphasises that institutions may
create barriers to these benefits being realised (Oates, 2005; Vo, 2010). The Northern
Ireland experience poses a puzzle for the first generation argument that fiscal
decentralisation improves economic efficiency. Despite the apparent benefit of fiscal
decentralisation, Northern Ireland’s economic performance persistently lagged
behind the rest of the UK and its regions, with the regional economy so weak that it
required ever greater fiscal transfers from Westminster. Devolution to Northern
Ireland therefore provides an opportunity to test theory from both first and second
generation fiscal federalism within a non-federal, UK institutional structure, to see
whether devolution can be beneficial for economic performance in the real world. By
applying theory from both generations, it demonstrates that institutions played a key
role in determining the efficiency of fiscal decentralisation to Northern Ireland.
Understanding how the institutions which governed how fiscal decentralisation
operated is crucial to drawing the link with economic performance. Institutions have
been highlighted as a key determinant of long-run economic growth, with British
institutions held up as being best at promoting this (North and Weingast, 1989; North,
1990; North, Wallis, and Weingast, 2009; Acemoglu and Robinson, 2012; Schlueter,
2014). The de jure institutions of Northern Ireland very closely reflected those in the
rest of the UK and at Westminster (Quekett, 1928), while its economy also closely
reflected other manufacturing regions of the UK (Ollerenshaw, 1985). Yet despite
these similarities, and the apparent advantage of fiscal decentralisation, the Northern
Ireland economy remained the worst performer of any UK region throughout

D.P. Jordan
Page 25 of 317
devolution. Given the failure of this combination to deliver convergence in economic
performance, it is hypothesised that the de facto operation of institutions, and how
this changed over time, is key to explaining Northern Ireland’s persistent
underperformance. Analysing the institutional structure which shaped the interaction
between Stormont and Westminster, and the incentives this created for resource
allocation, demonstrates how institutions can limit regional economic performance.
Existing literature on Stormont’s economic policy provides a mainly historical
account (Lawrence, 1965; Buckland, 1979; Birrell and Murie, 1980; Wilson, 1989;
Bew et al. 2002; Mitchell, 2006), emphasising the politics, but with minimal empirical
analysis. There is a failure to reflect the changes in institutional structure which
occurred over time, and in response to specific events. There is also a heavy reliance
on a narrow base of empirical evidence. Using an analytic narrative approach
addresses these shortcomings, by allowing institutional structure to change over time,
with a focus on the sequencing of events, and their effect on the provision of
subnational public goods and services. This is achieved by creating the first time-
series of Stormont’s’ public finances, and combining this with archival material from
both the Public Record Office of Northern Ireland, and the National Archive. This
provides a more complete answer to the puzzle of the persistent underperformance
of the Northern Ireland economy, by combining new qualitative and quantitative
material, placed within the theoretical framework of fiscal federalism.
The following chapter is structured as follows. Section 2 examines the relevant
literature from institutional economics, fiscal federalism, and the Northern Ireland
literature. This provides the necessary framework to analyse fiscal decentralisation to
Stormont within a non-federal institutional structure, and demonstrates why the
existing Northern Ireland literature fails to provide a satisfactory explanation for
Stormont’s role in the puzzle of Northern Ireland’s poor economic performance.
Section 3 sets out the method and data used to construct the analytic narrative.

D.P. Jordan
Page 26 of 317
Section 4 begins the analytic narrative, by setting out the weaknesses of the original
financial settlement. Sections 5, 6, 7, and 8 continue the chronology of the analytic
narrative. Section 5 examines the initial years of devolution, and the sequence of
events which saw the divergence between the de jure and de facto institutions.
Section 6 considers the remainder of the interwar period, and the consequences for
efficiency of the transition towards ongoing financial support from Westminster to
Stormont, and the moral hazard this created. Section 7 sets out how the financial
relations between the two governments were renegotiated during wartime, reflecting
Westminster’s concern over the moral hazard of providing increased financial support
under the welfare state. Section 8 sets out how institutional structure affected the
expansion of the Welfare State, and the opportunity costs this involved. Section 9
concludes.

D.P. Jordan
Page 27 of 317
2) Relevant literature
To examine the efficiency of fiscal decentralisation to Stormont, it is important to
understand which theories from institutional economics and fiscal federalism are most
relevant. Institutional economics examines how institutions, mainly at a national level,
affect long-run economic growth. Fiscal federalism focuses specifically on how the
decentralisation of fiscal power affects regional economic performance. Northern
Ireland therefore provides the opportunity to combine these two literatures, to
examine the role of subnational government in promoting economic growth, within the
context of British institutions. The UK model of subnational government, called
devolution, and originating from Northern Ireland between 1920 and 1972, is more
accurately described as fiscal decentralisation. This reflects the ‘top-down’ flow of
authority within the UK, rather than the federal structure of countries such as the
United States. Given this important institutional difference, it is necessary to consider
which theories from within institutional economics and fiscal federalism provide a
theoretical framework to examine Northern Ireland’s experience within the UK form of
fiscal federalism.
(i). Institutions
Economic historians have increasingly turned to institutions as an explanation of long-
run differences in economic growth. Institutions are argued by North (1990, p.107) to
be “the underlying determinant of the long-run performance of economies”. They
define the incentive structure of societies and economies, altering resource allocation,
with their long-run significance reflecting their path dependent development (North,
1990). Frameworks have been developed to assess institutions and their effect on
long-run economic growth. North, Wallis and Weingast (2009) introduce their ‘Theory
of Social Orders’, where economic development is the result of movement from limited
access orders to open access orders. Acemoglu and Robinson (2012) similarly

D.P. Jordan
Page 28 of 317
introduce inclusive or extractive institutions. In both cases, limited access orders or
extractive institutions, limit long-run economic growth, through institutions which
reinforce negative decisions; while open access orders or inclusive institutions, see
better resource allocation as a result of institutions which promote more efficient
decisions over resource allocation.2
The idea of differences in institutions has been applied to divergences in
economic growth between countries, and has led to British institutions being seen as
best. North (1990) compares the institutions present in England and Spain, with the
former advancing economic growth, while the latter placed limits upon it. North and
Weingast (1989) demonstrate how the Glorious Revolution in England led to improved
institutions, where the upholding of property rights led to more developed capital
markets, and superior economic growth. Acemoglu and Robinson (2012) and North,
Wallis and Weingast (2009) both see British institutions as being at the forefront of
possessing the characteristics necessary for long-run economic growth. Schlueter
(2014) applies the limited and open access orders from North, Wallis and Weingast
(2009) to New Zealand and Uruguay, and demonstrates that colonies which inherited
British, open access order institutions, outperformed colonies which inherited
Spanish, limited access order institutions.
Institutional economics clearly views British institutions as best at promoting
long-run economic growth. Yet by ignoring Northern Ireland, this literature has not
considered the full set of British institutions, with Northern Ireland’s persistently poor
performance failing to support the conclusion that ‘British is best’. As part of the UK,
2 Limited access order economies display characteristics of: slow growth, with vulnerability to external shocks; rent-seeking; limited access to economic and political organisations; smaller, more centralised government; and an unequal society, with personalised social relationships, and selective laws and rights (North, Wallis and Weingast, 2009, p.12). Open access order economies are the opposite, where: political and economic development is present; periods of negative economic growth are limited; there is a large number of civil organisations; government is bigger and more decentralised; and society displays equality, through impersonal social relationships, and widespread law and rights (North, Wallis and Weingast, 2009, p.11-12).

D.P. Jordan
Page 29 of 317
devolution to Northern Ireland operated under British institutions, yet it suffered from
many of the characteristics of limited access order and extractive institutions,
including slow growth, rent-seeking, and an unequal society. This contradicts the
assertion for open access order economies, that greater decentralisation of
government is beneficial. North (1990, p.101) emphasises that imposing a common
set of rules in differing contexts can result in very different outcomes. Regional
variation in institutions is also increasingly being recognised as important to the
success of fiscal decentralisation (Pike et al., 2012; Brownlow, 2017). It is therefore
important to understand why British institutions failed to lead to better regional
economic performance in the Northern Ireland setting.
(ii). First generation fiscal federalism
To examine how institutions affected the efficiency of fiscal decentralisation to
Northern Ireland, it is necessary to consider how literature has approached the issue
of decentralised government. First generation fiscal federalism was the first to
address this issue, emerging from work such as Hayek (1945), and reflects the greater
emphasis placed on state intervention following World War II. First generation theory
emphasises the benefits fiscal federalism creates, through more efficient provision of
public goods and services, and a benevolent government which always seeks to
maximise social welfare (Oates, 2005; Vo, 2010).
Several models compete to explain how these benefits are achieved, with
Tiebout (1956) portrayed as the foundation of first generation theory (Vo, 2010), and
forming the basis of Hamlin’s (1991) competition thesis. Yet its applicability is limited
to the devolved form of institutional structure experienced by Northern Ireland. Tiebout
(1956) argues that subnational government allows citizens to reveal their preferences
for the provision of public goods and services, by moving to an area that most closely
reflects these preferences. Known as Tiebout sorting, citizens choose where to locate,

D.P. Jordan
Page 30 of 317
based on weighing up the pull factors of different regions, leading to a more efficient
allocation of resources. While attractive for its simplicity, it makes strong assumptions,
such as: the requirement for citizens to be fully mobile; citizens possessing perfect
information; a large number of regions for citizens to choose between; employment
opportunities not affecting movement; and public goods having no economies or
diseconomies of scale. These assumptions are unrealistic for Northern Ireland, as it
was the only UK region to possess fiscal decentralisation, meaning no competition,
and little information available for inter-regional comparisons. Indeed, the central
assumption of mobility is hard to support. Contemporary migration within the UK is
low (Brownlow, 2017, p.563-564), and historically there is evidence it may have been
even lower. For example, it was difficult to find workers willing to move from Northern
Ireland to Britain for employment during World War II,3 and citizens only began to
become aware of disparities in public services during the war.4
The decentralisation theorem of Oates (1972, 1999) outlines an alternative
mechanism for devolution to be efficiency enhancing, and focuses on information
asymmetries. The decentralisation theorem presumes in favour of local public goods
being provided by subnational government, as information asymmetries prevent
national government from implementing tailored regional policies, and heterogeneous
demand for public goods exists between regions (Oates, 1999). This ensures that
subnational provision of local public goods will result in welfare levels being at least
as high as under uniform, national provision, assuming there are no economies of
scale from national provision, and no spillover effects (Oates, 1972, p.54).
Fiscal decentralisation can also improve the efficiency of fiscal
decentralisation by providing a solution to distortions in regional resource allocation,
outlined by Buchanan (1950). Differences arise in the standard of public services,
3 See TNA: HO 45/20268: War Cabinet, Resources of Northern Ireland, 3rd April 1941. 4 See Lawrence (1965), Green (1979), Gibson (1996) and Ollerenshaw (2013a) for discussion.

D.P. Jordan
Page 31 of 317
and/or the burden of taxation on citizens, across regions, as a result of differing fiscal
capacities (Buchanan, 1950, p.584). These differences are measured by the fiscal
balance, which is the difference between the costs and benefits of public services to
a citizen (Buchanan, 1950, p.588). This can lead to citizens migrating to a region with
lower fiscal pressure, with their decision to move determined by the market economic
reward they receive, plus their fiscal balance in each region (Buchanan, 1950, p.589).
If incomes are low in a region, citizens will be subject to greater fiscal pressure than
those living in high income regions, as they must be taxed more heavily to fund a
similar, or potentially lower, level of public services (Buchanan, 1950). This results in
citizens moving to regions where fiscal pressure is lower, creating distortions in
resource allocation. To remove these distortions, fiscal transfers from rich to poor
regions ensure the equal fiscal treatment of otherwise equal citizens, equalising fiscal
pressure, and thus enhancing the efficiency of resource allocation (Buchanan, 1950).
Olson (1969) provides a further justification for fiscal transfers to subnational
government. Spillover effects can result in a subnational government not providing
the Pareto optimal level of subnational expenditure public goods and services, as it
fails to account for the externality effects on neighbouring areas (Olson, 1969). A
similar situation occurs when a public good provided by a unitary government benefits
only a subset of the population, creating an internality (Olson, 1969). Thus, only when
fiscal equivalence is imposed, with a separate layer of government that matches the
unique boundary of each public good, can there be efficient public good provision
(Olson, 1969, p.483).
While first generation theory clearly sees fiscal federalism as improving
efficiency, the evidence is inconclusive. Studies of the effects of fiscal federalism from
a first generation perspective find contradictory results, such as Rodríguez-Pose and
Bwire (2004), Akai et al. (2007), and Borge et al. (2014). Application to the UK is very
limited, with Hughes (1987) providing the only example, focusing on Tiebout sorting

D.P. Jordan
Page 32 of 317
as the mechanism for efficiency. Hughes (1987) concludes that implementing fiscal
federalism in the UK would prove beneficial, as it would reflect existing heterogeneous
fiscal preferences, while introducing market forces to correct regional imbalances.
However, these benefits are qualified by several conditions, relating to the form fiscal
decentralisation takes, and the balance of power between national and subnational
government (Hughes, 1987).
The contradictory evidence of whether fiscal federalism is efficiency
enhancing, results from the differing types of fiscal decentralisation present in each
case, and a failure to tailor the application of theory to reflect this. Rodríguez-Pose
and Gill (2005) see fiscal federalism as taking many forms globally, making the form
taken fundamental to its success. There is also the difficulty of how to measure
efficiency, as Borge et al.’s (2014) method, of assuming greater regional
heterogeneity reflects greater efficiency, appears naive. This highlights the need for
greater understanding of the institutional context, as suggested by North (1990), and
better ways of measuring efficiency, both of which second generation theory seeks to
address.
(iii). Second generation fiscal federalism
Second generation theory introduces public choice, institutional structure and
asymmetric information, while removing the assumption of a benevolent government,
to understand why the apparent benefits of fiscal federalism may fail to be realised
(Oates, 2005). This involves applying the principal-agent problem, with either the
national government or electorate as the principal, and the subnational government
as the agent (Oates, 2005, p.357). Agency theory deals with two potential problems
that arise when different parties co-operate: firstly, the goals of each party may differ,
and it may not be possible for the principal to verify the actions of the agent; secondly,
risk is shared by the two parties, but they have differing risk preferences (Eisenhardt,

D.P. Jordan
Page 33 of 317
1989, p.58). Applying principal-agent theory highlights why the institutional structure
suggested by first generation theory may fail to provide the expected benefits,
therefore providing a criterion against which to judge the efficiency of fiscal
decentralisation (Oates, 2005).
Weingast (2009) extends this by providing a ‘comparative federalism
framework' to examine how the principal agent problem affects the efficiency of fiscal
decentralisation. The framework outlines five conditions for market preserving
federalism, which maximises efficiency under the mechanisms of first generation
theory. The five conditions are: hierarchy, where each level of government has a
delineated scope of authority; subnational autonomy, where subnational government
has primary control of local regulation of the economy;5 a common market, provided
by the national government; hard budget constraints, faced by the subnational
government; and finally institutionalised authority, the “glue for the decentralised
system”, where political authority is allocated through institutions, and not at the
discretion of the national government (Weingast, 2009, p.281). The absence of one
or more of these conditions leads to problems including inefficient public good
provision, rent-seeking, inefficient market intervention, subnational governments
living beyond their means, and/or lack of policy independence (Weingast, 2009,
p.282).
Fiscal transfers are a necessary part of fiscal decentralisation under first
generation theory, as an insurance function to protect subnational governments from
exogenous shocks, but moral hazard can emerge when they are provided (Oates,
2005, p.365). A subnational government may engage in rent-seeking, and exploit the
fiscal commons to increase expenditure beyond revenue, as any deficit will be
5 This condition of subnational autonomy is supported by Buchanan (1950). As it is only the total fiscal pressure faced by citizens which determines efficient resource allocation, fiscal transfers should not be linked to any particular public service (Buchanan, 1950, p.597), and subnational government should instead retain autonomy over the provision of public goods and services, to tailor these to the preferences of local citizens (Buchanan, 1950, p.598).

D.P. Jordan
Page 34 of 317
covered by national government (Oates, 2005; Weingast, 2009). This creates a trade-
off for national government, where fiscal assistance to subnational government
provides protection for the national economy, but softens the budget constraint of the
subnational government (Oates, 2005).
A soft budget constraint is where the strict relationship between expenditure
and earnings is relaxed, due to another institution ultimately being responsible for any
excess expenditure (Kornai, 1986, p.4). Expectations are key to the existence of soft
budget constraints, as the national government needs to credibly commit to a policy
of no-bailouts if a hard budget constraint is to be imposed (Oates, 2005, p.360). Hard
budget constraints can be enforced through a number of mechanisms, including
developed credit markets, and transparency in subnational public expenditure, with
both providing feedback to government; as well as by rules, including balanced
budgets required in law, limits on borrowing, and clearly defined bankruptcy laws
during fiscal crises (Oates, 2005, p.362-363). Oates (2005, p.363) emphasises there
is no universal blueprint for hardening budget constraints, as political, economic and
cultural institutions, combined with historical traditions, will influence the required
institutional structure. Therefore, the existence of a hard budget constraint is
dependent upon the incentives created by the institutional structure (Oates, 2005,
p.361).
Where first generation theory failed to account for the principal-agent problem,
and the problems it creates, including moral hazard, asymmetric information, and soft
budget constraints, Weingast’s (2009) comparative federalism framework can be
used to explain the poor economic performance of developing countries. Weingast
(2009, p.281) finds Mexico, India, and Russia lack the subnational authority condition;
the common market condition is missing for India and Russia; a hard budget
constraint is absent for Argentina and Brazil, during the 1980s and 1990s respectively;
and institutionalised authority is absent in Mexico. Weingast (2009, p.282) notes that

D.P. Jordan
Page 35 of 317
relatively little evidence exists as to what mechanisms are needed to enforce this
institutionalised authority condition, but argues a party system that is balanced
between national and subnational control provides the best scenario. Ardanaz et al.
(2014) find that it is this imbalance in the power between national and subnational
government, which is responsible for short-term policymaking and inefficient public
expenditure in Argentina.
Despite this global application of second generation theory, there is a lack of
application to the UK. McGregor and Swales (2005) apply parts of first and second
generation theory to the UK, but conclude that: principal-agent theory and spillover
effects are irrelevant; regional fiscal deficits are sustainable; and hard budget
constraints are damaging for equity, especially for peripheral UK regions. This positive
view of further UK fiscal devolution is not shared by more critical literature on the
debate surrounding Scottish independence. Discussing greater fiscal decentralisation
for Scotland as an alternative to independence, Bell (2014) is more critical of the UK’s
institutional structure, concluding problems surrounding horizontal fiscal imbalances
in revenue, and vertical imbalances in expenditure and debt accumulation,
demonstrate that efficiency would be restricted under 'devomax'. Harvey and Keating
(2014) also emphasise the importance of institutional structure to the potential
success of an independent Scotland, or other small, open economies.
Both Bell (2014) and Harvey and Keating (2014) agree that current Scottish
institutions would require adaptation if greater fiscal decentralisation were to be
implemented within the UK. Bell (2016) highlights the lack of any intermediary,
between national and subnational government, as a significant restriction on
efficiency under current Scottish devolution. An implication of Oates (2005), that
applying asymmetric information leads to ideal institutional structures which differ
from those implied by first generation theory, is that a role may exist for such an
intermediary. This intermediary would solve the asymmetric information problem

D.P. Jordan
Page 36 of 317
between national and subnational government, in a similar manner to the role of
financial intermediaries in solving the principal-agent problem, as described by
Mishkin and Eakins (2012, p.66). However, Bell (2016) argues the process already
underway in Scotland demonstrates that political imperatives are placed before
economic efficiency, and UK institutional structure is unable to cope with this
adaptation.
(iv). Northern Ireland literature
Most analysis of devolution in Northern Ireland under the Stormont Parliament
approaches it from a political rather than economic perspective, with the fifty-year
experience of devolution viewed as a forerunner to the Troubles. This means there is
very limited analysis of Northern Ireland’s experience from the perspective of fiscal
federalism, despite it being the first such example within the UK. Discussions of
Stormont’s public finances focus on the financial pressure created by the 1920 Act,
and the degree of autonomy Stormont possessed. However, institutional structure is
assumed to be unchanging over time, with the importance of different events receiving
differing emphasis. This leads to varying, and sometimes contradictory, conclusions
on the consequences for economic efficiency of Stormont.
The first area addressed by existing literature is how the design of the 1920
Act affected the public finances of Stormont, with most being critical of the allocation
of powers. Mansergh (1936) criticises the 1920 Act for restricting Stormont's
autonomy, but concludes this was a necessary part of devolution, and did not hamper
its overall success. Lawrence (1965), Buckland (1979), and Wilson (1989) are more
critical, seeing the 1920 Act as financially unfair, and directly responsible for
Stormont’s subsequent financial pressures. Only Birrell and Murie (1980) digress from
this consensus, interpreting the 1920 Act as giving Stormont a degree of financial
independence more akin to a federal system. Gibson (1996) provides the only

D.P. Jordan
Page 37 of 317
discussion of the 1920 Act from the perspective of fiscal federalism, but it is limited to
first generation theory.6 Gibson (1996) concludes the assignment of expenditure
powers was broadly efficient, but the assignment of taxation powers limited
Stormont’s ability to account for regional preferences.
The second area to be addressed is the interwar period, with a consensus that
Westminster began to slowly exert greater control over Stormont, although the
motivation for this is unclear. Buckland (1979) emphasises Westminster's desire to
remain detached from Northern Ireland affairs, gradually making more interventions,
but only enough to ensure that devolution survived. Westminster was reluctant to
increase its financial support (Lawrence, 1965), and preferred ad-hoc agreements, in
order to limit its financial commitment, with the side effect that these allowed it to
supervise Stormont’s finances (Buckland, 1979, p.93). Johnson (1985a) argues that
Westminster was primarily interested in its own objective of limiting public expenditure
to control the national debt, rather than specifically in Northern Ireland. Despite this
increasing supervision, Stormont is seen as continuing to have great freedom
(Lawrence, 1965, Birrell and Murie, 1980). Taken together, this interwar narrative
suggests benign neglect, where Westminster’s involvement was minimal, although
the motivation for the gradual increase in supervision is unclear.
An explanation for this lack of consensus is the different emphasis given to
different events or aspects of the institutional structure, and their implied significance
for the financial relationship. An example is the Colwyn Report of 1925, which is
subject to varying conclusions. Mansergh (1936) describes the Colwyn Report as
being overly favourable to Northern Ireland, with Stormont able to shift the burden of
an economic downturn onto Westminster. In contrast, Green (1979) identifies it as the
moment when inequality in expenditure on public services was formalised,
6 Wilson (1989) also acknowledges the relevance of theory from fiscal federalism theory to Northern Ireland, but provides little application.

D.P. Jordan
Page 38 of 317
guaranteeing these would develop more slowly in Northern Ireland. There is similar
disagreement over the importance of the Joint Exchequer Board (JEB).7 Mansergh
(1936) criticises it for having more power over Stormont's finances than Westminster.
Lawrence (1965) views this as a positive, preventing the Treasury from dictating
demands to Stormont. Green (1979) questions whether the JEB was necessary at all,
as it simply ratified intergovernmental agreements. Gibson (1996) and Mitchell (2006)
are also highly critical, arguing it was side-lined, allowing Westminster's preferences
to override Stormont's.
The third area to be addressed by the existing literature is the post-war period,
with disagreement over which agreement – before, during, or after World War II – was
most important for post-war financial relations between Stormont and Westminster.
Green (1979), Birrell and Murie (1980), and Wilson (1989) all identify the 1938 Simon
Declaration as most significant, which saw Westminster introduce the principle of
parity in public services. This defined all future financial relations (Green, 1979), and
meant Stormont abandoned its financial autonomy (Birrell and Murie, 1980).
Lawrence (1965) alternatively identifies a 1945 announcement as more significant,
with Westminster providing financial assistance to raise the standard of public
services in Northern Ireland, but in the process taking greater control. Finally, Gibson
(1996) views a 1946 statement as most important, as it gave a formal basis for
principles previously agreed, including parity of public services and taxation, but gave
Westminster greater control, limiting the potential adaptation of public services to
reflect local preferences.
Differing views therefore exist over how the efficiency of devolution changed
over time, a result of the differing emphasis placed on particular events. This reflects
7 The Joint Exchequer Board was an independent body setup under the Government of Ireland Act 1920, to assess the value of the annual Imperial Contribution made by Stormont to Westminster, and to arbitrate over any financial disagreements between the two Governments. See Section 4 for further detail.

D.P. Jordan
Page 39 of 317
a failure to see institutional structure as changing over time, leading to two differing
narratives over the level of autonomy Stormont possessed, largely based on the post-
war experience. The first narrative views Stormont as remaining largely autonomous,
with Westminster placing few financial restrictions on Stormont, despite increased
oversight (Lawrence, 1965; Green, 1979; Birrell and Murie, 1980), aided by a
“distinctly laissez-faire” attitude from the Treasury (Birrell and Murie, 1980, p.21). In
contrast, the second narrative sees Westminster as placing extensive restrictions on
Stormont’s finances (Buckland, 1979; Wilson, 1989; Gibson, 1996; Mitchell, 2006).
These contradictory narratives partly result from a broader failure to combine archival
material with empirical measurement of Stormont’s financial position.8 Most do one or
the other well, for example, Lawrence (1965) for empirics, and Mitchell (2006) for
archival material, but there is an absence of studies which do both. Doing both is
necessary if the full consequences of fiscal decentralisation to Stormont are to be
assessed.
(v). Conclusion
Economics literature has increasingly recognised the importance of institutions to
long-run economic growth. However, there is a Northern Ireland shaped hole in our
understanding of British institutions, which must be filled if we are to fully understand
whether British institutions are indeed best. First generation theory from federalism
provides the mechanisms for understanding how fiscal decentralisation within the
devolved setting of the UK can be efficiency enhancing, but second generation theory
demonstrates how institutions can place limitations on these efficiency gains.
However, this second generation theory is at an early stage of development, and
8 Isles and Cuthbert (1957) provide the most detailed, systematic, contemporary analysis of the Northern Ireland economy, but is largely uncritical of the provisions of the 1920 Act, and the subsequent interactions between Stormont and Westminster. This is likely because their report was commissioned by Stormont, placing restrictions on their candour.

D.P. Jordan
Page 40 of 317
requires real world testing. There has been a lack of application of either generation
of fiscal federalism to the UK, despite Northern Ireland being the first such instance
of this. Applying fiscal federalism to Northern Ireland provides an opportunity to
understand how institutional structure changed over a fifty-year time period, a length
of time no previous study of fiscal federalism has achieved. This will not only allow
conclusions to be drawn on the efficiency of fiscal decentralisation to Stormont, which
existing Northern Ireland literature has failed to do, but also allow wider lessons to be
drawn for fiscal federalism theory within non-federal institutional structures.

D.P. Jordan
Page 41 of 317
3) Method
An analytic narrative approach is used to analyse the efficiency of fiscal
decentralisation to Stormont. An analytic narrative combines rational choice theory
with a narrative, to explain particular outcomes of interest (Bates et al., 1998). Using
an analytic narrative allows institutional structure to change over time, which existing
Northern Ireland literature has failed to do. Once constructed, the analytic narrative is
evaluated against several criteria, including the assumptions and conclusions made,
whether the explanation fits with the empirical data, and how well the explanation
stands up against explanations provided by existing literature (Bates et al., 1998).
This section outlines how the analytic narrative is constructed, including the puzzle to
be addressed, the actors involved, the analytic framework used to examine the
efficiency of fiscal decentralisation, and an outline of the narrative, including the
sources of data and archival material used to support the conclusions made.
(i). The puzzle
The outcome of interest, or puzzle, is the failure of fiscal decentralisation to address
Northern Ireland’s persistently poor economic performance. Was this the result of
fiscal decentralisation being inefficient? Instead of seeing its economic performance
converge with the rest of the UK, the gap persisted throughout devolution, with
Northern Ireland receiving increasing fiscal transfers. This poor performance is
evident by comparing Northern Ireland’s GDP per capita (Table 1.1), unemployment
rate (Figure 1.1), and bank deposits (Figure 1.2), with other UK regions.
Northern Ireland had the lowest level of GDP per capita of any UK region in
Table 1.1, a situation which pre-dated partition. Apart from a decline to 62 per cent in
1938, Northern Ireland remained around three-quarters of the UK level throughout

D.P. Jordan
Page 42 of 317
devolution.9 The next poorest UK regions were Wales and the North of England, but
these were a substantial margin ahead of Northern Ireland, particularly during the
post-war period. Lee (1971, p.200) demonstrated a similar story for regional income,
concluding that Northern Ireland was “economically… the most backward of the
regions of the United Kingdom”. However, Northern Ireland’s GDP per capita
remained much higher than the Republic of Ireland, which was only around half the
UK level for much of this period.10
Table 1.1: Regional GDP per capita (UK=100)
1900 1910 1925 1938 1950 1960 1970
Northern Ireland 67 61 74 62 73 73 74
London Counties 141 135 142 149 140 146 144
Rest of South East 101 108 103 117 86 89 92
South West 93 94 93 93 90 90 92
West Midlands 86 87 88 106 105 105 103
East Midlands 94 94 88 86 97 96 90
North 97 98 93 69 100 95 94
Yorkshire & Humberside 90 90 91 82 98 95 96
Wales 82 80 80 84 86 91 88
Scotland 91 88 94 96 90 90 92
Ireland (IFS/Republic of) 59 55 47 48 50 50 57
Source: Constructed from Geary and Stark (2019).
Notes: GDP per capital calculated as GDP divided by total population for each year. For discussion
on the creation of the GDP estimates, see Geary and Stark (2019, p.331-332). Figure for UK GDP
excludes the Irish Republic throughout.
Unemployment in Northern Ireland was also persistently higher than in Britain
or other UK regions throughout devolution. Figure 1.1 compares unemployment in
Northern Ireland amongst the insured population against the equivalent rate in Britain,
and the four worst performing UK regions. During the interwar period, unemployment
9 Northern Ireland experienced a fall in its population between 1922 and 1930, with its population not returning to its initial level until 1935 (see Figure 1.C.1 in Appendix C). As this falling population would raise Northern Ireland’s GDP per capita, Table 1.B.1 in Appendix B calculates each region’s GDP as a share of the UK’s total GDP. This confirms the pattern shown in Table 1.1, that Northern Ireland’s economic performance remained relatively poor throughout devolution, with it failing to experience the necessary growth to see its share increase over time. 10 That the Northern Ireland economy was better off relative to the Republic of Ireland’s is supported by Figure 1.B.1 in Appendix B, which shows that Northern Ireland’s share of the total all-island population continued to increase until the end of the 1960s.

D.P. Jordan
Page 43 of 317
in Northern Ireland was initially higher than Britain, and not dissimilar to other poorly
performing regions. However, Northern Ireland’s relative performance worsened
during the post-war slump of the mid-1920s, and was again higher following the Great
Depression. While unemployment fell in Britain from 1933 onwards, it remained
persistently high in Northern Ireland, and by 1938 had overtaken even the worst
performing region of Wales. Unemployment fell during the war, but post-war it
remained higher in Northern Ireland than any other UK region, with this gap persisting
until the end of devolution.
Source: For all regions, 1923-1939, 1945-1947, and 1949-1972 from Mitchell (1988, p.125-126). For
Northern Ireland, 1940-1944, and 1948, from Isles and Cuthbert (1957, p.566).
Notes: Unemployment data for the insured population unavailable for the regions of Britain between 1940
and 1944 in Mitchell (1988). North-East uses the values for the North-East region from 1923 until 1939,
and the values for the newly created North region from 1945 until 1972.
Bank deposits can act as a further measure of the health of the local economy.
If deposits in a region are relatively higher, it suggests residents are relatively more
wealthy than their counterparts elsewhere. Figure 1.2 compares bank deposits in
Northern Ireland with those in Scotland, and England and Wales. This demonstrates
that pre-partition, bank deposits were lower in what would become Northern Ireland,
and this persisted throughout devolution. This gap widened over time, particularly
0
5
10
15
20
25
30
35
40
192
31
92
41
92
51
92
61
92
71
92
81
92
91
93
01
93
11
93
21
93
31
93
41
93
51
93
61
93
71
93
81
93
91
94
01
94
11
94
21
94
31
94
41
94
51
94
61
94
71
94
81
94
91
95
01
95
11
95
21
95
31
95
41
95
51
95
61
95
71
95
81
95
91
96
01
96
11
96
21
96
31
96
41
96
51
96
61
96
71
96
81
96
91
97
01
97
11
97
21
97
3
Unem
plo
ym
ent (%
)
Figure 1.1: Unemployment by UK region
Great Britain North-East North-West
Wales Scotland Northern Ireland

D.P. Jordan
Page 44 of 317
during the 1930s and 1940s, before beginning to close from the 1950s onwards,
mainly due to deposits falling in both Scotland, and England and Wales. Overall, bank
deposits grew least in Northern Ireland between 1920 and 1966, by 34 per cent,
compared to 37 per cent in Scotland, and 65 per cent in England and Wales.
Source: Bank deposits from Sheppard (1971, p.118-123); population estimates from Mitchell (1988).
Notes: Bank deposits are from end-of-year balance sheet figures for domestic joint-stock banks, 1920-
1966. These are divided by annual population to give per capita figures. Bank deposits for 1920 and
1921 were recorded separately for what would become Northern Ireland; population estimates for these
years were calculated based on Northern Ireland’s share of the island of Ireland’s total population, based
on the ratio in 1922. Bank deposits converted into 1972 prices using ONS (2004, 2020).
Regional GDP, unemployment, and bank deposits, all demonstrate Northern
Ireland’s economic woes persisted throughout devolution, with Northern Ireland
showing no sign of convergence with the UK, despite the apparent benefit of fiscal
decentralisation. While it remained better off than the Republic of Ireland, Northern
Ireland remained the poorest region of the UK. Institutions have been suggested by
Crafts (1995) and Brownlow (2007) as an explanation for Northern Ireland’s poor post-
war performance, with Brownlow (2013) suggesting institutions must be at the heart
of any long-run explanation of Northern Ireland’s persistent poor performance.
Applying theory from fiscal federalism, within an analytic narrative, allows this view of
the importance of institutions for Northern Ireland’s long-run economic performance
to be tested over a fifty-year period.
100
150
200
250
300
350
400
450
192
01
92
11
92
21
92
31
92
41
92
51
92
61
92
71
92
81
92
91
93
01
93
11
93
21
93
31
93
41
93
51
93
61
93
71
93
81
93
91
94
01
94
11
94
21
94
31
94
41
94
51
94
61
94
71
94
81
94
91
95
01
95
11
95
21
95
31
95
41
95
51
95
61
95
71
95
81
95
91
96
01
96
11
96
21
96
31
96
41
96
51
96
6
£ p
er
capita (1972 p
rices)
Figure 1.2: Bank deposits by UK region
Northern Ireland England & Wales Scotland

D.P. Jordan
Page 45 of 317
(ii). The actors
An analytic narrative requires actors. These can be individuals or collective actors
(such as electorates or legislatures), with both primary and secondary material used
to determine actors’ preferences and expectations, and the alternatives and
constraints they faced (Bates et al., 1998, p.11). The two actors in this narrative are
defined as the two legislatures involved: the subnational government of Northern
Ireland, Stormont; and the national government of the UK, Westminster.
Principal-agent theory is central to the financial relations between these two
actors, and following the method of Oates (2005), Westminster is defined as the
principal, and Stormont as the agent. This reflects Westminster’s ultimate
responsibility as the UK’s national government, but having assigned some of its fisca l
powers to the subnational government of Stormont, through the 1920 Act. Both
governments are treated as single entities, despite themselves each being composed
of a number of actors. This simplifying assumption is not unrealistic, given decisions
were made on the basis of collective cabinet responsibility.
The objectives and preferences of both governments are allowed to differ from
each other, reflecting their differing electorates and political motivations. An initial
objective function is defined for both governments, but this is allowed to change over
time. Any further objectives or preferences are left to become apparent as the
narrative develops, where supported by archival material. Westminster’s initial
objective function is the implementation of the 1920 Act, based upon Green (1979)
and Bew et al. (2002). The 1920 Act was the final outcome following three failed Home
Rule Bills (Green, 1979, p.1), with British policy being to hold Irish affairs “at arm’s
length” (Bew et al., 2002, p.2). Thus Westminster needed the implementation of the
1920 Act to succeed, in order to remove the Irish issue from its day-to-day affairs.
Stormont’s initial objective function is based on Buckland (1979) and Bew et
al. (2002), and is Northern Ireland’s continued existence, through the maximisation of
D.P. Jordan
Page 46 of 317
Unionist political support. This meant that Stormont Ministers viewed most questions
from the perspective of the constitutional question, “with scant regard for wider
interests or long-term benefits” (Buckland, 1919, p.12). They were also sensitive to
any criticism, with a defensive political stance (Buckland, 1979, p.14). Ulster Unionism
had solidified into a single bloc in 1913, but at an early stage the Unionist leadership
had been concerned with political competition, particularly from trade unions, viewed
as posing the twin threats of socialism and republicanism (Bew et al., 2002, p.16-17).
Thus with the Unionist Party in control of the newly created Northern Ireland
Parliament, the Stormont government’s actions would be shaped by the priority to
maintain the Union through the electoral dominance of the Unionist Party.
This objective function can be seen in the key players within the Stormont
Government. Many members of Stormont had been involved in the Unionist
opposition to Home Rule (Buckland, 1979, p.12). A key example is the first Northern
Ireland Prime Minister, James Craig, who was closely involved with organising
Unionist resistance to the Third Home Rule Bill (Buckland, 1979, p.15). Members of
Stormont were also closely integrated into their local communities (Buckland, 1979,
p.13), with positions in government viewed as part-time occupations, and Ministers
retaining their business interests while in office (Birrell and Murie, 1980, p.40).11
These close connections would provide ample opportunity for rent-seeking to
take place, with Stormont more receptive to the views of special interest groups. This
was particularly the case given James Craig’s style of government, which saw
Ministers encouraged to be accessible, and a desire to conciliate local interest groups
(Buckland, 1979, p.17). The Unionist Party relied on this “precarious alliance of
sectional interest groups” to keep it in power (Riordan, 2018, p.314). The potential
therefore existed for Stormont to make long-run economic priorities subservient to the
11 See Section 4 of Chapter 2 for further discussion of the extent of business interests amongst the Unionist Party and Stormont Cabinet.

D.P. Jordan
Page 47 of 317
short-term political priorities of groups of individuals in society, in order to maximise
Unionist political support.
(iii). The analytic component
The analytic component applies rational choice theory, to highlight the significance of
the sequence of actions and events, in order to explain the outcome (Bates et al.,
1998, p.14). As the outcome of interest is whether the failure of fiscal decentralisation
to address Northern Ireland’s persistently poor economic performance was the result
of inefficiency, theory from both first and second generation fiscal federalism is used.
The first generation theory to be used includes information asymmetries of Oates
(1972, 1999), fiscal pressure of Buchanan (1950), and fiscal transfers of Olson (1969).
The second generation theory to be used is based on Weingast’s (2009) comparative
federalism framework, and its five conditions of hierarchy, subnational autonomy,
common market, hard budget constraints, and institutionalised authority. Together,
this theory is used to assess the importance of changes in institutional structure over
time, the effect this had on the incentives faced by both governments, and the
consequences for the efficiency of the provision of public goods and services.
Efficiency is measured by comparing the level of provision of public goods and
services against that in Britain, taking into account the potential differing needs of the
regional economy. To achieve this, a new, disaggregated time-series of Stormont’s
revenue and expenditure was constructed, using the Ulster Year Book publication.
This was then compared against existing time-series for Westminster’s public revenue
and expenditure from Mitchell (1988). These time-series were converted into 1972
prices using a long-run, seasonally adjusted, price indicator constructed by the ONS
(2004, 2020), to give the real values adjusted for inflation referred to throughout the

D.P. Jordan
Page 48 of 317
text.12 Rent-seeking can affect the efficient allocation of resources, as highlighted by
second generation theory (Oates, 2005; Weingast, 2009), but is a difficult concept to
measure (Del Rosal, 2011). Thus when comparing the provision of public goods and
services in Northern Ireland relative to Britain, the concept of opportunity cost is used
to assess what was forgone as a result of the institutional structure present.
Key to the principal-agent relationship between both governments is the
presence of asymmetric information (Oates, 2005). Westminster is ultimately liable
for the actions of the agent, Stormont, but is unable to verify the intentions or actions
of Stormont, creating the potential for moral hazard to emerge. As the objectives and
preferences of both governments are allowed to differ from each other, the institutional
structure within which the principal and agent interact will be crucial in determining
their actions, and whether their interests align or diverge. This in-turn will determine
the extent to which the conditions necessary for efficient fiscal decentralisation are
met.
(iv). The narrative component
The narrative component provides the setting, beginning, sequence of scenes, and
ending (Bates et al., 1998, p.14). The narrative must identify the actors involved, the
decision points and choices made, and the resulting paths taken, in order to
demonstrate how actors’ choices generated the outcomes of interest (Bates et al.,
1998, p.14). To achieve this, interactions between the two actors are approached
chronologically, with key events identified using both primary and secondary
evidence. The primary evidence used to construct the analytic narrative comes from
archival material collected from the Public Record Office of Northern Ireland (PRONI)
12 Further discussion of this process and the data is provided in Appendix A. Using the long-run, seasonally adjusted, price indicator constructed by the ONS (2004, 2020), shows that prices increased by 1,229 per cent between 1972 and 2019 (or were 13.29 times greater by 2019). Where real terms valuations are referred to throughout the thesis, these are in 1972 prices, unless otherwise stated.
D.P. Jordan
Page 49 of 317
and the UK National Archive (TNA), with secondary evidence coming from existing
analysis of the fifty years of devolution. Together, this led to five time-periods being
identified, where key events saw institutional structure change. These are:
Original settlement (1920 Act)
Initial experience (1921-1925)
Transition to ongoing support (1925-1938)
Renegotiation (1938-1945)
Post-war financial control (1945-1972)
Each section includes: an analysis of the key event(s), including the importance of
sequencing; how this altered the institutional structure, and the incentives created for
both actors; the actions of each actor; and the consequences of these for the
efficiency of fiscal decentralisation. The following sections deal with each period in
turn.
D.P. Jordan
Page 50 of 317
4) Original settlement (1920 Act)
Before examining how changing institutional structure affected the efficiency of fiscal
decentralisation, it is important to firstly understand how powers were distributed
between Stormont and Westminster. The Government of Ireland Act 1920 (1920 Act)
defined which powers were transferred to the Northern Ireland Parliament (Stormont),
and which were retained under the authority of the UK Parliament (Westminster). The
intention of the 1920 Act was to establish two Parliaments on the island of Ireland,
with both subordinate to Westminster. However, the establishment of the Irish Free
State meant the provisions of the 1920 Act only ever applied to Northern Ireland.
While the 1920 Act in this sense was not implemented in full, it formed the basis in
law of all future interactions between Stormont and Westminster.
Table 1.2 summarises the assignment of powers between Stormont and
Westminster. Westminster retained control of Excepted services, and Reserved
services and taxes. Excepted services were those Westminster deemed to have
Imperial implications (Lawrence, 1965, p.15) and were of national importance, such
as foreign relations, foreign trade, and monetary policy. Reserved services were
identified as those potentially suitable to be given to an all-Ireland Parliament, but
which Westminster retained control of, following devolution to Northern Ireland
(Gibson, 1996, p.15). These included the Post Office, the Supreme Court, and for a
time the police. Westminster did assign limited services to an all-island body, the
Council of Ireland, which covered railways, fisheries, and contagious diseases of
animals, but these were transferred to Stormont following the failure of the Southern
Parliament to be established.13 Reserved taxes were those Westminster retained the
power to levy at a national level, and included customs and excise duties, income tax,
and any tax on profits or capital. Under the 1920 Act, customs and excise duties was
13 See Ulster Year Book (1926, p.132) for an outline of the intended operation of the Council of Ireland, and the subsequent transfer of its powers to Stormont.

D.P. Jordan
Page 51 of 317
the only Reserved tax which might be transferred on the creation of an all-island
Parliament, but remained under Westminster’s control throughout devolution,
following the establishment of the Irish Free State (Gibson, 1996, p.18).
Table 1.2: Distribution of government powers
Westminster
UK national government
Stormont
NI subnational government
Excepted Reserved Transferred
Services Services Tax Services Tax
The Crown.
Making war &
peace.
Defence.
Foreign relations
& treaties.
Foreign trade.
Communications.
Coinage and legal
tender.
Intellectual
property.
Postal services.
Post Office
Savings Bank
and Trustee
Savings Bank.
Registration of
deeds.
Public Record
Office of
Ireland.
Land purchase.
Supreme Court.
Customs &
Excise duties.
Excess profits
duty.
Corporation
profits tax.
Income tax
(including
super-tax).
Any tax on
profits or
general tax on
capital.
All powers not
Excepted or
Reserved.
Death duties.
Stamp duties.
Motor vehicle
duties.
Entertainment
duties.
Non Tax: Land
annuities.
Source: Constructed using Ulster Year Book, 1926, p.53, & p.131-132.
Stormont was given control of Transferred services and revenue. Transferred
services were all remaining legislative powers which were neither Excepted nor
Reserved (Gibson, 1996, p.16). This included areas such as agriculture, industry,
employment, social benefits, health, housing, and education. Transferred revenue
came from two sources. The first was non-tax revenue, which primarily consisted of
land annuities, as well as any government fees. The second was tax revenue, which
was the receipts from any Transferred taxes imposed by Stormont. This included the
existing UK taxes which were not Reserved, namely death duties, motor vehicle
duties, and stamp duty. It could also include any new taxes introduced by Stormont,
as long as they were not demonstrably the same as any existing Reserved tax.
Stormont could also provide relief from income tax to Northern Ireland residents, but
this had to be funded from its revenue. The 1920 Act did not explicitly give Stormont

D.P. Jordan
Page 52 of 317
the right to borrow money through issuing government debt, but there was nothing to
prevent it legislating to do so.
Stormont did not have complete freedom over how it spent its revenue. It was
required to contribute to the cost of Imperial services, by paying an annual
contribution. This Imperial Contribution was the first charge on Stormont’s revenue,
and the 1920 Act set the nominal value of this contribution at £7.9 million for the first
two years.14 After this, a body called the Joint Exchequer Board (JEB) would reassess
this figure, and make adjustments if required with regard to taxable capacity.15 The
JEB had originally been intended to possess five members, but following the
establishment of the Irish Free State, it possessed only three: one appointed by the
UK Treasury, one by Stormont, and an independent chair appointed by The Crown,
through the Home Office at Westminster. The other main function of the JEB was to
arbitrate over financial questions which arose between Stormont and Westminster.
Finally, the 1920 Act explicitly maintained the national, UK Parliament’s
ultimate authority over the Northern Ireland Parliament at Stormont, through four rules
(Lawrence, 1965, p.27-28).16 The most important of these was that the Northern
Ireland Governor would withhold Royal assent of any Bill, if asked to do so by
Westminster. This in effect gave Westminster the right of veto over any bills passed
by Stormont, even if they related to matters transferred to the Northern Ireland
Parliament.17
14 Ulster Year Book, 1926, p.54. £26.8 million in 1972 prices. 15 Ulster Year Book, 1926, p.54. 16 These were that 1.) the supreme authority of the UK Parliament in Northern Ireland was undiminished, 2.) Stormont could not repeal or alter any Act passed by the UK Parliament and which extended to Northern Ireland, 3.) Stormont’s statutes could not contradict and statutes passed by the UK Parliament and which extended to Northern Ireland, 4.) the Governor of Northern Ireland must comply with any instructions by the Crown in respect of any Bill and reserve the Royal assent if so directed (Lawrence, 1965, p.27-28). 17 The importance of the role of the Governor, and their interaction with Stormont, is best described by the Parliamentary Draftsman to the Government of Northern Ireland, Quekett (1928, p.36), who outlines how “All executive and administrative powers as respects matters over which the Parliament of Northern Ireland has jurisdiction remain vested in the Crown,

D.P. Jordan
Page 53 of 317
Theory from both first and second generation fiscal federalism can be used to
examine whether this distribution of powers was efficient, beginning with revenue
raising powers, and followed by expenditure powers. Doing so, confirms that while
the distribution of both revenue and expenditure powers was broadly efficient, as
suggested by Gibson (1996), key institutional weaknesses existed beyond the fiscal
imbalance and lack of fiscal transfers, with the potential to limit the efficiency benefits
of fiscal decentralisation.
Musgrave (1983, cited in Vo, 2010, p.667-668) provides six fundamental
principles of efficient tax assignment, which must be fulfilled to maximise efficiency
and minimise distortions in resource allocation. Principles one to three focus on which
taxes should be retained under national control, while principles four to six focus on
which should be decentralised.
The first principle requires taxes which are suitable for economic stabilisation,
influencing aggregate demand, and aiding national redistribution, to be retained by
national government. The 1920 Act fulfilled this principle, as Westminster retained
control of the relevant taxes on income and corporation profits. The second principle
requires taxes with unevenly distributed bases to remain under national control,
particularly taxes on natural resources. The 1920 Act generally adhered to this
principle, as taxes that might have unevenly distributed bases, such as income and
profit tax, were under national control.18 The third principle requires personal taxes
with mobile tax bases to be retained by national government. The 1920 Act broadly
fulfilled this principle, as Westminster retained the power to set rates of income tax,
as well as corporation and profits taxes. However, Stormont could exercise its right to
provide relief from income tax, or could vary the rate of employee and employer
and are exercised by the Governor through departments which had been established by the Lord Lieutenant on the 7th June 1921”. 18 While Stormont could introduce taxes on natural resources, the lack of substantial extractive industries in Northern Ireland, such as coal, made this irrelevant.

D.P. Jordan
Page 54 of 317
contributions for unemployment insurance, which could harm efficiency, as these
were mobile tax bases.
The fourth principle requires revenues which are cyclically stable to be
assigned to subnational government, as stable revenue flows are more important for
the continuity of public good provision at a subnational level. The existing UK taxes
which Westminster transferred to Stormont included death duties, motor vehicle
duties and entertainment duty, which were all cyclically stable, fulfilling this principle.
The fifth principle is that subnational governments should be assigned taxes with
immobile tax bases. Under the 1920 Act, Stormont was granted immobile taxes such
as land and property taxes, fulfilling this principle. Finally, the sixth principle is that
benefit taxes, users’ fees and charges are relevant to both levels of government,
depending on who benefits from the service. As Stormont was responsible for
charging any fees associated with the public services it provided, and was free to
introduce any further taxes and fees, the 1920 Act fulfilled this principle.
Applying these six principles of tax assignment demonstrates the 1920 Act
was broadly efficient from a first generation perspective. Westminster possessed
power over the key national taxes which were unevenly distributed and more strongly
related to aggregate demand, while Stormont was responsible for more immobile,
inelastic revenues. Weaknesses did exist under the 1920 Act though. Stormont was
responsible for setting the rate of contributions for workers and employers under
unemployment insurance, could provide relief from income tax, and still retained the
ability to introduce new taxes, albeit with the limitation that any new taxes would have
to be different from any existing UK tax.
A further restriction on the efficiency of the 1920 Act was the lack of any
provision for fiscal transfers, required to ensure equal fiscal pressure on citizens under
Buchanan (1950), and account for spillover effects under Olson (1969). Their absence
reflected Westminster’s view that Northern Ireland should be financially self-sufficient

D.P. Jordan
Page 55 of 317
(Green, 1979, p.5). Yet the island of Ireland had been identified as having much lower
taxable capacity than Britain when the 1920 Act was designed (Green, 1979, p.3). If
taxes could not be raised to maintain the same level of public goods and services in
Northern Ireland as Britain, fiscal transfers would be required to equalise fiscal
pressure. Otherwise citizens in Northern Ireland would face a lower level of public
goods and services, creating potential spillover effects for Britain, due to reallocation
of labour and capital. Therefore, the failure of the 1920 Act to provide for fiscal
transfers placed a potentially significant restriction on efficiency.
The efficiency of the assignment of expenditure powers to Stormont can be
assessed from a first generation perspective, using five principles set out by Vo
(2010). The first three principles relate to the boundaries of public goods and services:
that public goods with a national boundary should be provided by national government
(Bird, 2000, cited in Vo, 2010, p.665); that the geographic boundaries of local public
goods must align with the boundaries of the subnational government (Vo, 2010,
p.665-666); and that the boundary of benefits from local impure public goods and
services must align with the boundaries of subnational government (Shah, 2004, cited
in Vo, 2010, p.666). The 1920 Act fulfilled these three principles, as Westminster
retained control of national public goods, such as defence, foreign trade and currency,
while Northern Ireland was assigned expenditure powers relating to public goods for
its own citizens, with the geographic separation created by the Irish Sea aiding this
assignment.
The fourth principle requires transparent assignment of responsibility for public
good provision, agreed upon by both national and subnational government (Vo, 2010,
p.666). The 1920 Act fulfils this principle, as it clearly set out in law the areas of
responsibility for both governments. Finally, the fifth principle requires that economies
of scale and administrative capability should be considered when devolving power to
subnational government (Vo, 2010, p.666). Here the 1920 Act is weaker, as some

D.P. Jordan
Page 56 of 317
areas of expenditure assigned to Stormont would have benefitted from economies of
scale. For example, it would have been beneficial for Stormont to share in the
insurance function of a much larger population for the purposes of health and
unemployment insurance, rather than having to fund this through only local
contributions.
From a first generation perspective, the 1920 Act was therefore broadly
efficient, as it met the majority of conditions required for efficiency. However,
weaknesses existed in the allocation of both revenue and expenditure powers. In
particular, there was no provision for fiscal transfers, and a failure to account for
economies of scale in assigning expenditure.
Applying second generation theory highlights further key weaknesses which
existed within the institutional structure, which could limit efficiency. The comparative
federalism framework of Weingast (2009, p.281) provides five conditions which must
be met if fiscal decentralisation is to be efficient. The first condition simply identifies
whether a decentralised system exists, which fiscal decentralisation to Stormont
clearly meets between 1920 and 1972,19 but the remaining four demonstrate areas of
potential weakness within the 1920 Act.
The second condition is subnational autonomy, where the subnational
government has the ability to adapt policy to reflect its individual circumstances
(Weingast, 2009). Westminster appeared to give Stormont a high degree of
autonomy, by assigning it the responsibility for the majority of public goods and
services. However, this was restricted by the fiscal imbalance, where the majority of
Stormont’s revenue came from taxation controlled by Westminster.20 This imbalance
19 While existing literature disagrees over whether Northern Ireland devolution was a federal or devolved form of government, this hierarchy condition within the comparative federalism framework does not require this differentiation to be made. However, it is clear from the wording of the 1920 Act that Stormont was subordinate to Westminster. 20 See Figure 1.A.2 Panel A in Appendix A.

D.P. Jordan
Page 57 of 317
limited Stormont’s ability to alter the provision of public goods and services to reflect
local demand. It also meant Stormont was heavily reliant on Westminster not reducing
existing taxes, as this would significantly restrict the revenue available to Stormont.
Furthermore, Westminster could block any legislation passed by Stormont through its
veto. Thus Stormont faced potentially both financial and legislative barriers to full
subnational autonomy, making efficiency reliant on Westminster’s subsequent
actions.
The third condition is the presence of a common market, provided by the
national government, which allows the free movement of both factors of production
and end products (Weingast, 2009). This is to prevent the subnational government
protecting its economy from competition, which can lead to inefficiencies, including
rent-seeking, corruption, and costly subnational market intervention. The 1920 Act
was strong in ensuring a common market across the UK, as legislative and fiscal
powers which were nationally bounded were retained by Westminster, such as
customs and excise duties, and Stormont was prevented from legislating in these
areas.
The fourth condition is the requirement for hard budget constraints, where the
subnational government must bear the full financial consequences of its policy
choices, without recourse to bailouts (Weingast, 2009). The efficiency of the 1920 Act
was mixed in this respect, as it failed to meet the requirements set out by Oates (2005)
to enforce a hard budget constraint. There was no restriction preventing Stormont
from legislating to give itself the power to borrow money to fund expenditure, nor did
the 1920 Act set out Stormont as ultimately responsible for this debt. Clear information
on the cost of public expenditure was not provided to citizens, as the proceedings of
the JEB were kept secret. Finally, the 1920 Act failed to set out in law a requirement
for balanced budgets, limitations on borrowing, or rules in the event of bankruptcy.

D.P. Jordan
Page 58 of 317
This meant the only legislative brake on Stormont getting into financial difficulties was
Westminster’s veto.
The fifth and final condition is institutionalised authority, where political
authority is allocated through institutions, and is not at the discretion of the national
government (Weingast, 2009). The 1920 Act clearly set out the roles and
responsibilities of both the national and subnational governments. Westminster could
not legislate in Northern Ireland on powers which were transferred, nor could it dictate
how Stormont spent its revenue. The role of the JEB in this would be pivotal. Despite
the dynamics of the JEB changing as a result of the establishment of the Irish Free
State, it remained the arbitrator over any financial disputes. This gave protection to
Stormont from Westminster’s discretion, while also ensuring Stormont followed the
financial provisions of the 1920 Act.
While the 1920 Act was broadly efficient, it contained key weaknesses. Areas
of inefficiency from a first generation perspective included the failure to provide for
fiscal transfers on the revenue side, or account for economies of scale on the
expenditure side. Together, these could lead to relatively greater fiscal pressure on
citizens in Northern Ireland, harming efficiency. From a second generation
perspective, the fiscal imbalance, lack of fiscal transfers, and Westminster veto, all
limited Stormont’s subnational autonomy. Combined with a lack of fiscal transfers,
limited subnational autonomy would mean Stormont would be unable to address any
relatively greater fiscal pressure on its citizens, harming efficiency. Meanwhile,
Stormont faced no hard budget constraints, other than Westminster’s veto. This could
lead to Stormont pursuing inefficient expenditure, particularly if it borrowed to address
fiscal pressure. Finally, Westminster’s desire was to introduce a decentralised model
where Northern Ireland was financially self-sufficient, but this would rely on the
preservation of institutionalised authority, as both governments faced incentives
which could limit the efficiency of fiscal decentralisation. Thus the efficiency of fiscal

D.P. Jordan
Page 59 of 317
decentralisation would be reliant upon the interactions between the two governments,
and how they responded to the incentives they faced, mediated through the
institutionalised authority of the 1920 Act.

D.P. Jordan
Page 60 of 317
5) Initial experience (1921-1925)
The first few years of devolution were a test of how sustainable the institutional
structure of the 1920 Act would be, both politically and financially. This initial
experience saw the principal-agent relationship develop between the two
governments. Stormont experienced increasing financial pressure, and thus
attempted to exploit a softening budget constraint, while Westminster refused to
provide ongoing financial support, as it faced the problem of moral hazard.
Westminster instead wanted to enforce de jure provisions of the unmodified 1920 Act.
However, a sequence of key events, determined by the political and economic context
of these first few years, created incentives for both governments, which led to the de
facto institutional structure changing. These developments were key in defining the
subsequent path of fiscal decentralisation during the remaining fifty years.
The principle that Stormont would be self-sufficient, with a real terms annual
surplus and making an Imperial Contribution, was tested within the very first year of
devolution. This first year coincided with an economic slump in the UK economy.
Following the post-World War I boom of 1919 and 1920, the fortunes of Northern
Ireland’s staple industries reversed, and an economic depression set in, with high
unemployment (Johnson, 1985a, p.187-188). This economic downturn put immediate
pressure on Stormont’s finances. The rise in UK unemployment of the early 1920s
was particularly severe in Northern Ireland. Table 1.3 ranks the regions of the UK by
their average rate of unemployment, including against Britain, between 1923 and
1925. Northern Ireland had the highest rate of unemployment, and by 1925, was more
than twice the rate for Britain. This led to Stormont’s expenditure on unemployment
insurance rising rapidly, increasing by 85 per cent in real terms between 1923 and
1925.21 Combined with national health insurance and old age pensions, Stormont’s
total expenditure on state insurance was much higher per person than Westminster’s,
21 Calculated from Ulster Year Book, 1926, p.94.

D.P. Jordan
Page 61 of 317
and by 1925, Stormont’s expenditure was £5.47 per person in real terms, while
Westminster’s was only £1.47 per person.
Table 1.3: UK regions ranked by unemployment rate of insured population
1923 1924 1925 Average
1. Northern Ireland 16.4 15.5 22.8 18.2
2. Scotland 13.8 13.3 14.7 13.9
3. North-West 14.2 12.3 10.9 12.5
4. North-East 11.5 10.4 14.6 12.2
5. Wales 6.3 9.0 16.9 10.7
Britain 11.2 9.9 10.7 10.6
6. South-West 10.4 8.7 8.0 9.0
7. Midlands 9.9 8.3 8.5 8.9
8. South-East 9.2 7.1 5.5 7.3
Sources: Constructed from Mitchell (1988, p.125) for Northern Ireland and Britain.
Stormont’s total expenditure rose rapidly during these initial years, increasing
by 10 per cent in real terms between 1923 and 1925. The existing narrative portrays
unemployment insurance as the primary driver of this increase. Yet Stormont’s
expenditure was increasing in areas beyond simply unemployment. Education saw a
19 per cent increase in real terms between 1923 and 1925,22 almost as much as its
total annual expenditure on unemployment insurance. Similarly, law and justice saw
a 36 per cent increase in real terms between 1923 and 1925, largely due to increasing
expenditure on the Royal Ulster Constabulary (RUC).23 Increases also occurred in
other more modest areas of expenditure, including the cost of Parliament, as well as
Surveys, Harbours and Commercial Services. Agriculture experienced the largest
increase of 64 per cent between 1923 and 1925, albeit only to £0.3 million in real
terms.24 Stormont’s expenditure therefore increased across a broad range of public
services, and was not simply the result of the rising cost of unemployment.
22 £1.8 million in nominal terms, £8.3 million in real terms. 23 £0.3 million in nominal terms, £3.8 million in real terms. 24 £59,000 in nominal terms.

D.P. Jordan
Page 62 of 317
This increasing expenditure combined with falling revenue to place even
greater financial pressure on Stormont. Between 1923 and 1925, Stormont’s total
revenue fell by 26 per cent in real terms.25 This was not the result of Stormont cutting
the rates of transferred taxes: transferred revenue actually increased by 19 per cent
in real terms during this period. Instead, the fall was due to reserved tax revenue. This
fell by 27 per cent in real terms between 1923 and 1925.26 This was the result of
Westminster reducing or abolishing a number of reserved taxes (Buckland, 1979,
p.83). Reserved revenue accounted for over two-thirds of Stormont’s total revenue.
Therefore, even if Stormont’s expenditure had remained unchanged, it faced a real
terms deficit of £12 million as a result of falling revenue, rather than the £8.5 million
real terms surplus envisaged by the 1920 Act.
Despite this financial pressure, and the difficulty in balancing its budget,
Stormont continued to commit itself to increased transferred public expenditure. In
addition to the increases in expenditure on education, police, and agriculture,
Stormont announced new policies with significant financial commitments. In 1922,
Stormont announced it would follow a step-by-step policy for social benefits, matching
the rates of benefit set by Westminster in Britain, including unemployment (Lawrence,
1965, p.50). In December 1922, Stormont also passed a Loans Guarantee Act, where
it took on the financial risk of guaranteeing loans for capital projects undertaken by
private firms, replicating a scheme introduced by Westminster in Britain (Buckland,
1979, p.116).
The existing narrative portrays these policies as the result of political
decisions, aimed at maintaining support for the government amongst the working
class (Buckland, 1979; Green, 1979; Bew et al., 2002). New financial commitments
were the result of ‘populists’ overcoming ‘anti-populists’ within the Stormont
25 1923 was the first full year of financial accounts for Stormont. 26 Fall of £20.5 million in real terms.

D.P. Jordan
Page 63 of 317
government, with the strength of personalities determining their introduction (Bew et
al., 2002). That these policies were motivated by politics, and Stormont’s objective of
maximising Unionist support, is clear. In a letter to the UK Treasury, Stormont justified
paying the same unemployment benefits as Westminster, as these were “benefits to
which the workers have been accustomed and which are being paid in Great
Britain”.27 Stormont obviously had the political motivation to introduce these policies,
but given Stormont was already struggling to balance its budget, this does not explain
why Stormont was able to introduce them.
The answer lies in a sequence of four key events, which weakened the
institutionalised authority of the 1920 Act, and softened Stormont’s budget constraint.
These events created the expectation that the 1920 Act was open to modification, and
that Stormont could expect to receive ongoing fiscal transfers from Westminster. This
led Stormont to make unsustainable financial commitments, in the expectation that it
would be bailed out by Westminster.
The first key event was Westminster providing one-off fiscal transfers to
Stormont. As early as November 1921, Stormont made the first of “repeated begging
expeditions” to Westminster, to seek revisions to the financial settlement under the
1920 Act (Buckland, 1979, p.86). This immediately paid off, with Westminster
agreeing to make a one-off grant in December 1921, totalling £1.6 million in real
terms,28 to remove the initial deficit on the Unemployment Fund, inherited from
Northern Ireland’s share of the prior UK deficit.29 This one-off grant was followed by a
series of further grants. The Craig-Collins peace pact, between Northern Ireland and
the Irish Free State, was signed in March 1922, and in return Stormont received
financial benefits from Westminster (Buckland, 1979, p.93). This saw Westminster
27 PRONI: CAB/9C/1/2 Letter from Pollock to Graham, 10th June 1924. 28 £477,000 in nominal terms. 29 PRONI: CAB/9C/1/2 Attached notes labelled ‘Part B: Unemployment fund deficit”, Letter from Andrews to Craig, 6th November 1924.

D.P. Jordan
Page 64 of 317
provide grants totalling £16.7 million in 1923, £10.6 million in 1924, and £8.3 million
in 1925 in real terms.30 This financial support was justified as covering the transitory
costs of establishing the new government in Northern Ireland.31 The effect of this
additional revenue was significant: it boosted Stormont’s revenue by 26 per cent, 19
per cent, and 16 per cent in 1923, 1924 and 1925 respectively.
This first event was a significant moment in the financial relationship between
Stormont and Westminster. This financial assistance was provided outside the
provisions of the 1920 Act, and contravened one of its fundamental principles, that
Stormont was expected to be financially self-sufficient. While the need for this
additional revenue could be justified by the costs of partition, it set a precedent that
Westminster was willing to ignore the de jure provisions of the 1920 Act on financial
matters. This began the weakening of institutionalised authority and the softening of
Stormont’s budget constraint under the 1920 Act.
Stormont’s budget softened further with the second key event, when it
acquired the statutory power to borrow money by issuing public debt. The 1920 Act
did not explicitly mention any provision for the creation of subnational public debt.
However, the 1920 Act created the expectation that the subnational government
would operate along the same financial lines as Westminster. The legislative
procedure of passing bills at Stormont was modelled on Westminster (Quekett, 1928,
p.25), and the operation of the devolved exchequer was based on the replication of
UK laws and governance (Quekett, 1928, p.45). Thus in February 1922, within a year
of its establishment, Stormont informed Westminster that it was beginning the process
30 In nominal terms these amounted to £3.6 million, £2.3 million, and £1.8 million in 1923, 1924, and 1925 respectively. See Ulster Year Book (1926, p.65). 31 The grants covered four areas: the costs of malicious injuries associated with partition, the relief of unemployment associated with violence surrounding partition; funding the Special Constabulary; and additional ‘general’ funding. See Ulster Year Book (1926, p.65).

D.P. Jordan
Page 65 of 317
of passing legislation, to give itself the necessary statutory powers to borrow money
for the funding of specific public services.32
Stormont’s justification to Westminster was twofold. Firstly, it would allow
Stormont to make loans to local authorities, replicating a similar power held by
Westminster in Britain.33 Under the 1920 Act, proceeds raised in Northern Ireland
under National Savings Certificates could no longer be provided as loans from the UK
Local Loans Fund to local authorities in Northern Ireland. The Treasury at
Westminster was unwilling to alter this situation, and so Stormont decided it would
issue its own securities, called Ulster Savings Certificates, to make loans to local
authorities in Northern Ireland.
This was initially the only reason given by Stormont,34 but it quickly became
apparent there was a second. As Stormont was not receiving enough revenue to meet
expenditure on transferred services, it would need to borrow to make advances to the
Unemployment Fund.35 Stormont blamed this situation on the failure of the promised
surplus to materialise under the 1920 Act. It therefore requested that Westminster
guarantee the principal and interest of a loan up to a total value of £3.5 million in
nominal terms, to “afford a long breathing space until the financial outlook is more
clear”.36 The guarantee would cover three purposes: loans to local authorities for
public works, advances to Stormont’s Unemployment Fund, and to cover general
government purposes.37
32 TNA: T 160/110, Letter from Clark to the Treasury, 28th February 1922. See also Ulster Year Book (1926, p.73). 33 TNA: T 160/110, Northern Ireland note on the Issue of Guaranteed Loans, 1922, p.2. 34 TNA: T 160/110, Letter from Blackett to The Secretary, Ministry of Finance, 20th February 1922. 35 TNA: T 160/110, Northern Ireland note on the Issue of Guaranteed Loans, 1922, p.1. 36 TNA: T 160/110, Northern Ireland note on the Issue of Guaranteed Loans, 1922, p.3. 37 TNA: T 160/110, Cabinet Memorandum by the Financial Secretary to the Treasury, 23rd May 1922.

D.P. Jordan
Page 66 of 317
Westminster agreed to provide the guarantee,38 as it felt it had “a considerable
measure of responsibility” for the financial liabilities Stormont faced.39 However, it
imposed conditions on this guarantee, demonstrating it was aware of the potential
moral hazard associated with providing financial support. It reviewed and approved
the contents of Stormont’s proposed bill prior to it being introduced at Stormont,40 with
the term and rate of interest of any securities issued to also be approved by
Westminster in advance.41 Westminster ensured that if its guarantee were called
upon, this would become the first charge on Stormont’s subsequent revenue after the
Imperial Contribution.42 Furthermore, the initial guarantee was limited to £500,000 in
nominal terms, with the total guarantee of the £3.5 million to be provided over
subsequent issues.43
While these new borrowing powers gave Stormont a new source of revenue,
the expectations of two governments diverged over whether further support would be
necessary. In its original case, Stormont highlighted that this borrowing might become
a permanent feature of funding subnational expenditure.44 However, Westminster
viewed this as a temporary arrangement, as a result of the immediate conditions
following World War I, and that, “when the present temporary difficulties have
disappeared, the necessity will cease”.45 The conditions Westminster imposed did not
limit Stormont’s subnational autonomy, as Stormont was able to borrow enough to
cover its immediate financial pressures. They instead demonstrate that Westminster
38 TNA: T 160/110, Cabinet Memorandum by the Financial Secretary to the Treasury, 23rd May 1922. 39 TNA: T 160/110, Notes on Government of Northern Ireland (Loan Guarantee) Bill, 25th May 1922. 40 TNA: T 160/110, Letter from Niemeyer to The Secretary, Northern Ireland Ministry of Finance, 22nd April 1922. 41 TNA: T 160/110, Notes to Sir John Baird, Government of Northern Ireland (Loan Guarantee) Bill, 1922, p.3. 42 TNA: T 160/110 Letter from Blackett to The Secretary, Northern Ireland Ministry of Finance, 24th July 1922. 43 TNA: T 160/110, Letter from Niemeyer to The Secretary, Northern Ireland Ministry of Finance, 18th March 1922. 44 TNA: T 160/110, Northern Ireland note on the Issue of Guaranteed Loans, 1922, p.1. 45 TNA: T 160/110, Notes to Sir John Baird, Government of Northern Ireland (Loan Guarantee) Bill, 1922, p.2.

D.P. Jordan
Page 67 of 317
was beginning to take a more detailed interest in Stormont’s financial affairs, as it
looked to limit the moral hazard and information asymmetries now emerging.
The third key event was Westminster losing its de facto right to veto legislation
introduced by Stormont, even though the de jure right remained. The financial
significance of this incident is overlooked by those who examine it, such as Lawrence
(1965) and Buckland (1979). This veto limited subnational autonomy, but did provide
Westminster with a means to enforce a hard budget constraint. This relied on
Westminster’s credible commitment to using its veto; but on its first test, Westminster
failed to do so.
The Local Government Bill of 1922 saw Stormont seek to alter the 1920 Act,
by abolishing proportional representation for local council elections.46 Initially,
Westminster exercised its veto, and refused Royal assent for the Bill.47 This was after
receiving objections from the government of the Irish Free State,48 who felt it would
prejudice the decision of the Boundary Commission.49 But later the same year,
Westminster acquiesced to pressure from Stormont, and the Bill received Royal
assent.50
By allowing a Bill to pass which changed an important aspect of the 1920 Act,
Westminster had accepted that it would not exercise its veto on transferred matters.
Westminster’s reasoning for withdrawing its veto, was that “to veto a measure clearly
within the powers delegated to the Parliament of Northern Ireland would form a
46 PRONI: CAB/9/B/40/1 Local Government Act (Northern Ireland) 1922, Report on Local Government Bill (Northern Ireland). 47 PRONI: CAB/9/B/40/1 Local Government Act (Northern Ireland) 1922, Letter to Prime Minister of Northern Ireland from Lord Lieutenant of Ireland, 8th July 1922. 48 CAB/9/B/40/1 Local Government Act (Northern Ireland) 1922, Message from Mr Churchill to Sir James Craig, 31st August 1922, and Letter to Churchill from Craig, 1st September 1922. 49 PRONI: CAB/9/B/40/1 Telegram from Curtis to Cope containing message from Churchill to Cosgrave 11th September 1922. 50 CAB/9/B/40/1 Local Government Act (Northern Ireland) 1922, Official notification of Royal assent, 11th September 1922.

D.P. Jordan
Page 68 of 317
dangerous precedent”.51 This had been a very public failure to credibly commit to
exercising its right of veto, and set a precedent for future interaction between the two
governments, which was still being referred to during the late 1960s.52 Westminster
never again exercised its veto during devolution (Lawrence, 1965, p.28).
Being unable to credibly commit to vetoing Stormont’s legislation, Westminster
lost its one means of enforcing a hard budget constraint under the 1920 Act. The
sequencing of this event was important. If it had occurred prior to Westminster
agreeing to provide one-off financial support, and guaranteeing Stormont’s debt, the
principle that Stormont would be financially self-sufficient would have remained intact.
In that scenario, Westminster could still have been able to credibly commit to not
providing any financial support. As it had instead lost its veto after Westminster had
admitted the principle of providing fiscal transfers outside the provisions of the 1920
Act, it had lost the means it required to enforce a hard budget constraint. Westminster
could no longer credibly commit to refusing further financial claims from Stormont. By
1922, Stormont had a strong hand to play. If Westminster blocked Royal assent of the
Local Government Bill, Stormont could threaten to call an election, which it would be
expected to win, leaving Westminster to either acquiesce, or govern Northern Ireland
itself, neither of which it wanted to do (Buckland, 1979, p.273). The Local Government
Bill of 1922 therefore had important financial ramifications. It softened Stormont’s
budget constraint, and weakened the institutionalised authority of the 1920 Act,
although the removal of Westminster’s veto did now provide Stormont with greater
subnational autonomy.
The fourth, and final, key event was the referral of Stormont’s financial
difficulties to a body other than the Joint Exchequer Board (JEB). As Stormont was
struggling to fund its expenditure, it wanted the calculation of the Imperial Contribution
51 PRONI: CAB/9/B/40/1 Telegram from Curtis to Cope containing message from Churchill to Cosgrave 11th September 1922. 52 TNA: T 224/1606 Background notes, Northern Ireland Debate, 25th October 1967, p.2.
D.P. Jordan
Page 69 of 317
to be revised. Under the 1920 Act, the Imperial Contribution was the first charge on
Stormont’s revenue, fixed by the 1920 Act at £7.9 million in nominal terms for both
1923 and 1924 (Lawrence, 1965, p.43).53 Westminster agreed to refer the matter, not
to the JEB, but to a Special Arbitration Committee (the Colwyn Committee) in January
1923. The Colwyn Committee’s final determination would not be published until 1925,
but the first interim report of the Committee was completed in September 1923. This
reduced the size of the Imperial Contribution for 1923 and 1924, and recommended
a grant to Stormont of £400,000 to cover the cost of buildings associated with public
services,54 equivalent to those which had passed into the ownership of the Irish Free
State.55 This further softened Stormont’s budget constraint, as it received more fiscal
transfers outside of the provisions of the 1920 Act.
By bypassing the JEB, Westminster further weakened the institutionalised
authority of the 1920 Act. Without Southern Ireland, now the Irish Free State, the JEB
could not work as originally envisaged, but it was still the de jure body to arbitrate over
financial disputes between Stormont and Westminster. By appointing a separate
committee to examine Stormont’s claims, Westminster was able to exert increasing
discretion over Stormont’s financial matters. The ongoing investigations of the Colwyn
Committee meant Stormont decided not to approach the JEB with any further claims,
until the Colwyn Committee had reported.56 The credibility of the JEB had therefore
been undermined within the very first years of devolution, and raised the prospect of
future alterations to Stormont’s financial position, albeit at Westminster’s discretion.
While this could potentially mean greater financial resources for Stormont, it also left
open the possibility of Westminster curtailing Stormont’s subnational autonomy.
53 £36 million in real terms for both 1923 and 1924. 54 £1.8 million in real terms (Ulster Year Book, 1926, p.72). 55 First Report of the Northern Ireland Special Arbitration Committee, 1924, UK Cmd 2072, and Ulster Year Book, 1926, p.54. 56 PRONI: CAB/9C/1/2 Letter from Pollock, Northern Ireland Minister of Finance, to Spender, First Secretary to the Cabinet and Head of the Northern Ireland Civil Service.

D.P. Jordan
Page 70 of 317
Evidence shows the interim report of the Colwyn Committee did shape
Stormont’s expectations of further financial revisions to the 1920 Act. In a document
produced by Stormont in November 1924,57 it outlined three potential options to
persuade Westminster to share the financial burden of unemployment in Northern
Ireland. The first option would see a full amalgamation of the Northern Ireland fund
with Britain’s, but would “raise questions of control of our policy and administration”.
The second and third options were based on the existing precedents. Either the cost
of the Unemployment Fund should be calculated before the Imperial Contribution,
based on the precedent set by the Colwyn Committee’s interim report; or Westminster
should make ongoing payments to bring down the fund’s deficit, based on the
precedent of previous one-off grants from Westminster. This confirms that Stormont’s
expectations of further financial support were shaped by preceding events. It also
highlights the role of asymmetric information in the developing principle-agent
relationship between Stormont and Westminster, as it was made clear that none of
this information should be shared with Westminster, as it would reveal Stormont’s
bargaining position.58
The softening of Stormont’s budget constraint saw it get into a financially
unsustainable position. As part of its step-by-step policy, Stormont had publicly
committed itself to matching Westminster’s rate of unemployment benefit, and it was
seen as a political imperative to be maintained. With unemployment higher in Northern
Ireland than any other UK region, Stormont immediately used its new power to issue
public debt to borrow to fund unemployment, shown in Table 1.4.59 Stormont’s total
57 PRONI: CAB/9C/1/2 Part B: Unemployment fund deficit, Letter from Andrews to Craig, 6th November 1924. 58 PRONI: CAB/9C/1/2 Letter from Andrews to Craig, 6th November 1924. 59 Stormont’s total public borrowings outstanding included not just public debt, but also grants from revenue, borrowing from capital funds, and borrowings from other sources. These could be used to fund either capital expenditure, for example on housing and barracks reconstruction, or to provide loans and advances to the various funds which Stormont administered. These funds included for housing, public health, local loans, agricultural loans, and unemployment.

D.P. Jordan
Page 71 of 317
public debt more than tripled in real terms between 1923 and 1925, from £3.2 million
in 1923, to £11.7 million in 1925. The Unemployment Fund was the main beneficiary,
as after initially being funded through a grant from revenue of £1.4 million in 1922, it
received the majority of funds raised through public debt.
Table 1.4: Stormont’s borrowing
1922 1923 1924 1925
£ million (1972 prices)
Public debt 0 3.2 5.4 11.7
Total public borrowings outstanding 1.4 6.1 9.5 16.3
Unemployment Fund advances 1.4 5.9 8.0 12.3
Source: Constructed using Ulster Year Book (1926, p.74-75).
Notes: Years are for financial years. Converted into 1972 prices using ONS (2004, 2020).
Table 1.5: Northern Ireland Unemployment Fund
1922 1923 1924 1925
£ million (1972 prices)
Income
Contributions 1,297,334 3,040,664 3,350,538 3,332,601
Other income 464,404 1,092,258 1,205,822 1,236,356
Total income 1,761,738 4,132,922 4,556,361 4,568,958
Expenditure
Benefits 3,714,518 6,819,759 6,073,311 9,699,020
Interest on borrowings 5,095 131,103 262,523 424,151
Cost of administration 198,376 501,395 539,869 512,795
Apportioned share of UK
Fund’s deficit 689,045 0 0 0
Total expenditure 4,607,034 7,452,257 6,875,702 10,635,965
Total deficit -2,845,296 -3,319,335 -2,319,342 -6,067,007
Total borrowing 2,377,775 3,932,118 2,101,032 5,915,452
Sources: Ulster Year Book, 1926, p.76-77.
Notes: Years are for calendar years. Converted into 1972 prices using ONS (2004, 2020).
The need to borrow was due to the inability of contributions to keep pace with
the rising payments out of the Fund, shown in Table 1.5. This inability was the result
of a fundamental flaw in the mechanics of the national fund being applied at a regional

D.P. Jordan
Page 72 of 317
level. Contributions in Britain were designed to balance outgoings of the
Unemployment Fund at a much lower level of unemployment than Northern Ireland
was experiencing. In nominal terms, where contributions in Britain kept the fund
almost balanced in 1925, with around £1.05 paid out for every £1.00 in contributions,
in Northern Ireland around £2.00 was paid out for every £1.00 paid in.60 By 1925,
contributions only covered one-third of the Northern Ireland Fund’s outgoings, and
Stormont borrowed £5.9 million in real terms, equivalent to around one-tenth of its
total revenue that year. The cumulative debt on the Unemployment Fund by this stage
was £14.3 million in real terms, equivalent to around one-quarter of Stormont’s total
revenue that year.
The financial situation meant that by 1924 Stormont was making further
appeals for Westminster to share part of the financial burden of the devolved
Unemployment Fund.61 This reflected Stormont’s recognition that its financial position
was unsustainable. It privately calculated that its Unemployment Fund would never
balance if unemployment was higher than 5 per cent, at a time when unemployment
was currently at 17 per cent.62 In a letter to Westminster, Stormont described how it
had been “compelled to borrow to an abnormal extent” in order to keep paying
unemployment benefits at the same rate as Britain, and that the associated interest
charges would prevent the fund from repaying the deficit, even if unemployment fell.63
Westminster’s response was to reject any calls for further financial support. In a letter
to Stormont in January 1924, Westminster made it clear that taking on any of the
financial burden of unemployment in Northern Ireland “would involve a fundamental
amendment of the Government of Ireland Act, 1920”, and that Stormont already
60 PRONI: CAB/9C/1/2 Letter from Andrews to Craig, 18th February 1925. 61 TNA: HO 45/13743 Letter from Andrews to Home Office, 15th April, 1924. 62 PRONI: CAB/9C/1/2 Attached notes labelled ‘Part B: Unemployment fund deficit”, Letter from Andrews to Craig, 6th November 1924. 63 PRONI: CAB/9C/1/2 Letter from Pollock to Graham, 10th June 1924.

D.P. Jordan
Page 73 of 317
possessed the power under the 1920 Act to resolve the situation, in other words by
cutting unemployment benefit.64
While Westminster’s public position was an objection to modifying the 1920
Act, its private concerns also reflected the problem of moral hazard posed by
providing further financial support. This is evident in a memorandum by Westminster’s
Minister for Labour. The UK Minister for Labour made it clear that giving direct
financial support “may have far reaching consequences”, with complete
amalgamation of the two funds being politically out of the question, as it would reopen
the 1920 Act.65 It was also financially out of the question, as Westminster’s
unemployment fund was already in debt, meaning taking on financial responsibility for
Stormont’s fund would shift the financial burden from citizens in Northern Ireland to
those in Britain, and “deprive Northern Ireland of the incentive to economy and in the
circumstances of the case could not be coupled with any effective system of control”.66
Providing grants to Stormont would similarly see Westminster have no control over
how the money was spent, and would require “a complicated and elaborate system
of checks to be introduced under which this country supervised effectively the
administration in Northern Ireland”.67 If unemployment proved permanently higher in
Northern Ireland, “requests for further assistance would pretty certainly be made at a
later date”.68
This concern over moral hazard was shared by other Ministers within
Westminster. In a memorandum to cabinet in February 1925, the Home Secretary
stated that “any form of subsidy is incompatible with the scheme of self-government
for Northern Ireland”, as “delegation of power is accompanied by corresponding
64 TNA: HO 45/13743 Letter from Chamberlain to Craig, 3rd January 1924. 65 TNA: HO 45/13743 Memorandum by Ministry of Labour, 9th December 1924, p.3. 66 TNA: HO 45/13743 Memorandum by Ministry of Labour, 9th December 1924, p.2-3. 67 TNA: HO 45/13743 Memorandum by Ministry of Labour, 9th December 1924, p.4. 68 TNA: HO 45/13743 Memorandum by Ministry of Labour, 9th December 1924, p.5.
D.P. Jordan
Page 74 of 317
delegation of financial responsibility”.69 Westminster would not be able to exercise
effective control of grants made to Stormont, while Stormont would have no incentive
for “vigilance and economy in administration”.70 Westminster would also be admitting
liability for future claims in other social services, and Stormont would “become
increasingly dependent on the Exchequer of Great Britain for financing services over
which the Imperial Parliament and the Ministers responsible to that Parliament
exercise no control”.71 Instead, given the separate systems and separate
governments, it should be expected that the standard of social services should be
different in Northern Ireland from Britain.72
These memorandums demonstrate Westminster’s concern over the moral
hazard of providing further financial support to Stormont without control. They also
demonstrate a desire to enforce a hard budget constraint on Stormont’s expenditure.
However, the events of the previous years had removed Westminster’s ability to
credibly commit to this. The one-off grants, provision of borrowing powers, loss of
Westminster’s legislative veto, and side-lining of the JEB, had weakened the
institutionalised authority of the 1920 Act, and created the expectation of further fiscal
transfers. This allowed Stormont to pursue policies which would necessitate further
financial assistance, despite Westminster’s protestations.
Despite the weakening of institutionalised authority and a softening of
Stormont’s budget constraint, the initial years did see an improvement in the efficiency
of fiscal decentralisation, specifically with respect to fiscal pressure. This was the
result of the increased fiscal transfers made by Westminster to Stormont, in the form
of one-off grants, and the temporary reduction in the Imperial Contribution. The one-
off grants accounted for a large proportion of Stormont’s total revenue: 21 per cent in
69 TNA: HO 45/13743 Memorandum by Home Secretary, 4th February 1925, p.1. 70 TNA: HO 45/13743 Memorandum by Home Secretary, 4th February 1925, p.2. 71 TNA: HO 45/13743 Memorandum by Home Secretary, 4th February 1925, p.3. 72 TNA: HO 45/13743 Memorandum by Home Secretary, 4th February 1925, p.3.
D.P. Jordan
Page 75 of 317
1923, 16 per cent in 1924, and 14 per cent in 1925. Meanwhile, the reduction in the
Imperial Contribution increased Stormont’s revenue by 7 per cent in 1923, and 23.7
per cent in 1924. It was only thanks to this extra revenue that Stormont’s expenditure
per person on transferred services was able to match Westminster’s equivalent
expenditure in 1923 and 1924.73
Yet Northern Ireland remained a relatively poor region within the UK, with
relatively higher demands on its expenditure. Stormont was still expected to make a
sizeable fiscal transfer to Westminster each year through the Imperial Contribution.
Although this had been reduced, it was still a significant fiscal transfer back to
Westminster, accounting for 25 per cent of Stormont’s total expenditure by 1925. This
was money which could not be spent on local public services. Stormont had warned
of the potential issues which might arise from the current financial relationship. This
included the issue of equal citizens facing equal fiscal pressure, the beneficial
insurance function of a national unemployment fund, and the spillover effects that
might emerge as a result of greater fiscal pressure in Northern Ireland, including the
movement of workers from Northern Ireland to Britain.74
It is notable that despite the great financial pressure Stormont was under,
there was very little discussion by either government of addressing this through
Stormont increasing transferred taxation. Why did Stormont not make greater use of
its tax powers to address its funding gap? The answer is twofold. Firstly, the large
fiscal imbalance present in the 1920 Act saw transferred taxation raise very little
revenue, meaning any increase in transferred tax rates would have little effect. In
1923, transferred revenue accounted for only 11 per cent of total revenue, and even
after reserved revenue fell substantially, transferred revenue still only accounted for
around 20 per cent during the remainder of the interwar period.75 Therefore, even with
73 See Figure 1.3 in Section 6, and Figure1.B.6 in Appendix B. 74 PRONI: CAB/9/C/1/1 Letter from Andrews to Shaw, 15th April 1924. 75 See discussion of Figure 1.A.2 in Appendix A.

D.P. Jordan
Page 76 of 317
a 19 per cent increase in total transferred revenue between 1923 and 1925,
Stormont’s overall revenue still fell by 26 per cent, due to total reserved revenue falling
by 27 per cent. The scale of the fiscal imbalance meant it would be impossible for
increases in transferred taxes to compensate for decreases in reserved revenue,
limiting Stormont’s subnational autonomy.
Secondly, while Stormont had the de jure power to increase transferred taxes,
or indeed introduce a new tax if it didn’t conflict with a reserved tax, it was de facto
not politically possible. This was due to the two constituencies of voters Stormont had
to keep satisfied, in order to fulfil its objective of maximising Unionist political support.
While the Unionist Party possessed a large majority at Stormont, its policy decisions
were shaped by the need to maintain support for the government amongst the working
class (Buckland, 1979; Green, 1979; Bew et al., 2002). Any increases in taxes would
be politically unpopular, and run counter to the Unionist argument that citizens in
Northern Ireland paid the same taxation as those in Britain, and so should receive the
same benefits. The Unionist Party’s strong, overlapping networks with business, also
meant there would be strong opposition to any increase in taxation on businesses,
particularly at a time when firms were seeking increased financial support from
government, such as under the Loans Guarantee Acts from 1922 onwards.76
The opposition Stormont would have faced if it had tried to increase
transferred taxation, is demonstrated by the one occasion when it did try and raise
greater transferred revenue. In 1934, following pressure from Westminster, Stormont
introduced a levy on local authorities, to increase their contributions to education
expenditure (Buckland, 1979, p.100). However, it met with strong opposition, both
from within the Unionist Party, and from local authorities (Buckland, 1979, p.100-101).
This culminated in a legal challenge by the Belfast Corporation, that the education
76 See Section 4 of Chapter 2 for a more detailed discussion of the strength of Stormont’s links with business; and Section 5 of Chapter 2 for further discussion of the financial support businesses sought from Stormont.
D.P. Jordan
Page 77 of 317
levy was not allowable under the 1920 Act, as it was materially the same as income
tax, but this challenge was lost (Buckland, 1979, p.101). Ultimately, the education levy
raised little additional revenue, and lobbying from local authorities saw its effect
diminished, with the Londonderry Corporation receiving unemployment relief grants
as financial compensation to offset the cost of the levy (Buckland, 1979, p.101-102).
Thus, the little revenue generated by any increase in transferred taxation, and the
political opposition it would generate, meant it was rational for Stormont to keep
transferred taxation unchanged. Instead it made sense to focus on gaining greater
fiscal transfers from Westminster, given the sequence of events which had seen
Stormont’s budget constraint soften as early as 1921.
Given the sequence of events which had occurred by 1925, it was unclear
whether the overall efficiency of fiscal decentralisation to Stormont had substantively
changed. Within Weingast’s (2009) comparative federalism framework, there had
been a weakening of institutionalised authority, with the side-lining of the JEB, and
Stormont’s budget constraint had softened, with the provision of one-off financial
support outside the provisions of the 1920 Act. However, Stormont had achieved
greater subnational autonomy, through Westminster losing its veto, and Stormont
gaining the power to issue public debt. The final common market condition remained
unchanged. The clear consequence from the sequence of events was that Stormont’s
financial position was unsustainable without further financial support from
Westminster. If Westminster were to provide ongoing financial support, it would have
to find a means of managing the moral hazard problem it faced, otherwise Stormont
would face a softening budget constraint.
D.P. Jordan
Page 78 of 317
6) Transition to ongoing support (1925-1938)
The whole of the interwar period has been characterised as a series of “ad hoc
arrangements” (Buckland, 1979, p.93). This section instead argues that it was the
publication of the Final Report of the Colwyn Committee (Final Colwyn Report) in
March 1925, which saw a fundamental shift in the financial relationship between
Stormont and Westminster, with a transition from one-off payments to ongoing
financial support. While Westminster wanted to maintain the de jure position of the
1920 Act, this had proven to be financially unsustainable. The Final Colwyn Report
irrevocably changed the de facto institutional structure, altering the incentives faced
by both governments, even though the de jure position of the 1920 Act remained. This
triggered a series of financial agreements between the two governments, with
Westminster providing ongoing financial support to Stormont for specific public
services, but at its discretion. This discretion reflected the moral hazard problem
Westminster increasingly faced as it provided greater financial support. While this
greater financial support had benefits for efficiency, by partially reducing inequalities
in fiscal pressure, the changes to institutional structure further weakened key
conditions of the comparative federalism framework. This led to inefficient allocation
of subnational resources, which restricted the efficiency of fiscal decentralisation
during the remainder of the interwar period.
The Final Colwyn Report recommended the Imperial Contribution should no
longer be the first charge on Stormont’s revenue, and should instead be the surplus
of revenue after necessary expenditure.77 Conditions were imposed, with necessary
expenditure defined as not including services that did not exist in Britain, or were at a
higher standard in Northern Ireland. Per capita expenditure was only allowed to
increase at the same rate as in Britain, while necessary expenditure would take into
77 Final Report of the Northern Ireland Special Arbitration Committee, 1925, UK Cmd 2389.

D.P. Jordan
Page 79 of 317
account the expectation that social standards might be lower in Northern Ireland than
Britain.
The intention was to relieve the financial pressure on Stormont, by allowing it
to retain more revenue, but without altering the de jure position of the 1920 Act.
Westminster did not want to alter the 1920 Act, as it “would raise difficult questions as
to the constitutional relationships between Great Britain, Northern Ireland and the Irish
Free State”, potentially undermining the Anglo Irish Treaty of 1922.78 The re-transfer
of any services back to Westminster was ruled out, as it “would be an admission that
the scheme of devolution provided for in the Act is unworkable”.79 Westminster
therefore wanted to maintain the façade of the 1920 Act, and was willing to alter the
de facto financial provisions to ensure the continuation of subnational government.
This allowed Westminster to provide an ongoing, but not immediately obvious, fiscal
transfer to Stormont, rather than the previous one-off support.
The commitment to ongoing fiscal transfers improved efficiency, as otherwise
fiscal pressure would remain permanently higher in Northern Ireland than Britain.
However, their benefit was restricted by the conditions limiting what could be defined
as ‘necessary expenditure’. This restricted Stormont’s subnational autonomy, as to
receive the maximum fiscal transfer, it had to replicate Westminster’s provision of
public services as closely as possible. Furthermore, per capita expenditure in
Northern Ireland could not rise more quickly than in Britain, which prevented any
possibility of catch-up in public services.
The reason for Westminster imposing these conditions was the moral hazard
problem it faced. Westminster recognised that without any conditions attached,
Stormont could potentially increase its expenditure until it reduced its surplus to zero,
78 TNA HO 45/13743 Report by Sub-Committee on Amalgamation of Social Services, 15th July 1925, p.5. 79 TNA: HO 45/13743 Letter from Anderson to Wilson, 17th December 1924.

D.P. Jordan
Page 80 of 317
pay no Imperial Contribution, and return to Westminster to ask for further support.
Westminster was right to be cautious. Discussing their approach to further financial
negotiations with Westminster, the Northern Ireland Prime Minister made it clear that
“we should try and get at least one or two points put right with each succeeding
Government that comes in”.80 Westminster was aware of the risk of further financial
demands, and therefore wanted to impose a hard budget constraint by imposing
conditions on its support.
This new hard budget constraint relied on Westminster’s ability to credibly
commit to its enforcement, but this had been irrevocably eroded by the Final Colwyn
Report. By side-lining the JEB, Westminster had permanently weakened the
institutionalised authority of the 1920 Act. Westminster had instead demonstrated it
was willing to revise its financial relations with Stormont, and accept liability for claims
for further financial support. By demonstrating the de jure provisions of the 1920 Act
could be substituted with alternative de facto arrangements, it permanently weakened
institutionalised authority. Westminster’s willingness to operate outside of the 1920
Act reinforced the expectation, created by the previous one-off support, that Stormont
would receive further financial assistance. Even by 1933, Stormont continued to see
the Colwyn Report as setting the precedent for further adjustments to the financial
relationship.81 Stormont’s budget constraint had therefore softened irrevocably.
Stormont’s expectation of further bailouts was proven to be correct. In a series
of agreements, Westminster took on an increasing share of the cost of unemployment
in Northern Ireland. Stormont’s accumulation of debt had become unsustainable in its
attempts to fund unemployment benefits. Stormont made it clear to Westminster that
even if unemployment fell, the cost of interest on its borrowing was too high to keep
80 PRONI: CAB/9/C/1/1 Letter from Craig to Andrews, 23rd May 1924. 81 PRONI: MIC559/1, Minutes of discussions between Andrews, Craigavon, and Pollock, 15th December 1933.

D.P. Jordan
Page 81 of 317
the fund afloat.82 By February 1925, Stormont was beginning the Parliamentary
process to authorise an extension of borrowing powers to keep the Unemployment
Fund afloat, due to an expected £2.75 million deficit by the end of the financial year.83
Westminster again bypassed the JEB, continuing the precedent set by the
Colwyn Committee, and referred Stormont’s case to a cabinet committee, further
weakening institutionalised authority.84 This concluded with the Unemployment
Insurance Agreement of 1926, which saw Westminster agree to partially fund
unemployment benefits in Northern Ireland, but with conditions attached. In return for
financial support, Stormont agreed to make an ‘equalisation payment’ into its
Unemployment Fund each year out of current revenue, equal to the payment made
by Westminster into its own Fund.85 In return, Westminster would cover 75 per cent
of the remaining deficit or ‘excess’, on Stormont’s Fund. Westminster could withdraw
from the agreement if its payments exceeded £1 million in nominal terms, while
Stormont promised to exactly follow any regulations adopted by Westminster in
relation to its Unemployment Fund, and would welcome “the fullest possible
investigation” into its Fund’s administration.86 The scheme would apply for five years,
and Stormont would remain responsible for the debt accumulated prior to the
agreement. The consequence was Stormont’s expenditure on state insurance
immediately increased in real terms by 251 per cent between 1925 and 1926, from
£1.9 million to £6.6 million, as it began making the necessary equalisation payments.87
These conditions reflected Westminster’s concerns over the moral hazard of
fully amalgamating the funds, as “the effect would be to make the British Government
82 PRONI: CAB/9/c/1/2 Letter from Pollock to Graham 10th June 1924. 83 £12.7 million in real terms. See PRONI: CAB/9/C/1/2 Unemployment Insurance Fund, Cabinet Conclusions, 25th February 1925. 84 PRONI: CAB/9/C/1/2 Unemployment Insurance Fund, Draft letter from Craig to Churchill, no date. 85 TNA HO 45/13743 Memorandum on Financial Resolution, 12th February 1926; and TNA HO 45/13743 Committee on the Northern Ireland Unemployment Fund, 7th August 1925. 86 TNA HO 45/13743 Letter from Pollock to Churchill, 6th February 1926. 87 £0.4 million and £1.4 million in nominal terms for 1925 and 1926 respectively.
D.P. Jordan
Page 82 of 317
and Parliament ultimately responsible for expenditure over which they exercised no
control”.88 Thus, Westminster focused on attaching conditions which limited its liability,
and ensured Stormont faced part of the cost of higher unemployment, but with the de
jure position of the 1920 Act left unaltered. However, attaching conditions restricted
Stormont’s subnational autonomy. Citizens in Northern Ireland also still faced greater
fiscal pressure, as Stormont still had to meet 25 per cent of the cost of higher
unemployment.
The agreement also had the potential to induce satisficing behaviour from
Stormont in the pursuit of lowering unemployment.89 As the agreement was reciprocal,
Stormont could be called upon to fund Westminster’s deficit, if unemployment was
higher in Britain than Northern Ireland. Thus, while it was in Stormont’s financial
interest to pursue policies which lowered unemployment in Northern Ireland, there
was no incentive to undertake any fundamental reassessment of what would be
necessary to permanently reduce unemployment. While the policy powers available
to Stormont to address the unemployment problem were limited, Chapter 2
demonstrates that the industrial polices it did implement were focused on short-run
employment levels, rather than long-run economic growth. The agreement therefore
encouraged a management of the unemployment problem to a level which was
financially acceptable or affordable, rather than a cure, while shifting part of the cost
onto citizens in Britain.
During the 1920s, unemployment continued to remain higher in Northern
Ireland than in any other UK region, other than Wales. This placed a heavy financial
burden on Stormont’s finances: expenditure on unemployment benefits accounted for
11 per cent of total public expenditure by 1928. Stormont therefore sought the
88 TNA: HO 45/13743 Report Sub-Committee on Amalgamation of Social Services, 15th July 1925, p.4. 89 Satisficing is where firms set themselves a minimum acceptable level of achievement (Simon, 1959).

D.P. Jordan
Page 83 of 317
continuation of its agreement with Westminster beyond its initial fixed term.90
Westminster offered an indefinite extension, but on the provision that the previous
conditions were retained, and that Stormont began to pay off the debt it had amassed
funding unemployment in the initial years.91 Stormont had originally accepted liability
for this debt, but the interest was being charged to the Northern Ireland
Unemployment Fund, resulting in Westminster bearing around two-thirds of the cost.92
Westminster wanted money from Stormont’s Reserve Fund to be used to pay
off this debt, but Stormont objected. Stormont argued this money was needed to cover
the principle on its Ulster Savings Certificates, and other capital commitments already
underway, and that if “any small surplus… were automatically to be used for relieving
the British Government of the Unemployment deficit, there would be no direct local
incentive to economy in administration in Northern Ireland”.93 Such a situation, where
national government benefits financially from subnational policies, is recognised as
harmful for efficiency (Weingast, 2009), and exemplifies Brownlow’s (2017) view of
practice running ahead of theory in Northern Ireland. However, Stormont agreed to
Westminster’s conditions, and the Agreement became permanent.94
However, the Agreement quickly collapsed due to the Great Depression. The
deficit on Westminster’s Unemployment Fund grew faster than Stormont’s, and
Stormont could no longer match the larger equalisation payments from revenue,
leading to payments from Westminster ending in 1933 (Lawrence, 1965, p.55).
Stormont therefore had to cover the full cost of unemployment insurance, and
between 1931 and 1935, the financial pressure increased to unsustainable levels.
Stormont began to run a significant annual deficit which dwarfed anything
90 TNA: HO 45/13743 Letter from Andrews to Anderson, 30th May 1928 91 TNA: HO 45/13743 Draft Agreement, 25th July 1928. 92 TNA: HO 45/13743 Letter from Fisher to Chancellor, 29th September 1928, p.1. 93 TNA: HO 45/13743 Letter from Fisher to Chancellor, 29th September 1928, p.1-2. 94 TNA: HO 45/13743 Memorandum by the Chancellor of the Exchequer, 4th October 1928; and Agreement between Treasury and Ministry of Finance, 18th December 1928.

D.P. Jordan
Page 84 of 317
experienced during the 1920s, financed through accumulating more debt. It reached
over £2 million in real terms in 1934, equivalent to 5.7 per cent of transferred
expenditure.95
While Stormont could reduce unemployment benefits, it faced no incentive to
do so. It would be extremely politically unpopular, contravening its step-by-step policy,
and Westminster had repeatedly failed to enforce a hard budget constraint, creating
the expectation of further bailouts. This expectation proved correct, as a new
Unemployment Insurance Agreement was signed in 1936. This involved a calculation
more favourable to Stormont, based on the size of the insured rather than general
population, which effectively lowered the size of equalisation payments (Lawrence,
1965, p.59). Westminster remained determined to limit its financial liability though, as
its support would be gradually curtailed if unemployment fell under 19 per cent, and
disappear entirely at 8 per cent.96
It should be noted that key players within Stormont at times disagreed over
the best course of action to take. This was particularly the case with the mounting
financial pressure originating from interwar unemployment (Buckland, 1979, p.13).
Bew et al. (2002) portray these disagreements as a battle of personalities, between
‘populist’ and ‘anti-populist’ groups within Stormont. The populist group encompassed
the Northern Ireland Prime Minister, Minister of Labour, and Minister of Home Affairs;
while the anti-populist group included the Minister of Finance, the Minister of
Commerce, and the Head of the Northern Ireland Civil Service (Bew et al., 2002,
p.48). The populists generally supported increased public expenditure, while the anti-
populists supported restraint, often taking the Treasury view (Bew et al., 2002, p.53).
Led by Craig, the populists can be seen as early adopters of Keynesian policies,
disapproved of by the Treasury at Westminster, until they themselves turned
95 See Figure 1.B.5 in Appendix. 96 PRONI: CAB/9/C/1/7 Memorandum by the Minister of Finance, 25th May 1935.

D.P. Jordan
Page 85 of 317
Keynesian (Bew et al., 2002, p.62). Yet even when there was disagreement between
Ministers, the constitutional question remained paramount (Buckland, 1979, p.13),
with the same objective of maximising Unionist support. That Stormont was able to
pursue policies which were politically popular, but financially unsustainable without
further support from Westminster, demonstrates the importance of the softening
budget constraint in allowing the populists to win the argument against greater
restraint.
Stormont’s decision to keep unemployment benefits at the same level as
Westminster could have contributed to a higher natural rate of unemployment in
Northern Ireland than Britain. It has been argued that the high unemployment rate in
interwar Britain was primarily driven by a high ratio of unemployment benefits to
wages (Benjamin and Kochin, 1979, 1982). That the replacement rate was higher in
Northern Ireland is demonstrated by wages being generally lower than in Britain:
wages were lower particularly for unskilled workers, although wages for skilled
workers were sometimes above the UK level, and there was an overall convergence
post-war (Isles and Cuthbert, 1957).97 The long-run role of this higher replacement
rate in Northern Ireland’s unemployment problem has received little attention. It is not
mentioned by Simpson (1971), who instead focuses on the structure of industry, a
rural population, low inter-regional labour mobility, and low inflow or creation of capital
and enterprise. Gibson and Spencer (1981) mention it in passing, but do not see it as
a significant factor in determining the level of unemployment. While Johnson (1985a)
mentions the issue, falling demand in the staple industries is emphasised as the main
driver of high interwar unemployment.
However, the replacement rate has been shown not to have been the primary
driver of increasing unemployment in interwar Britain, and instead played a limited
role (Ormerod and Worswick, 1982; Crafts, 1987; Eichengreen, 1987). In particular,
97 See Table 1.B.2 in Appendix B.
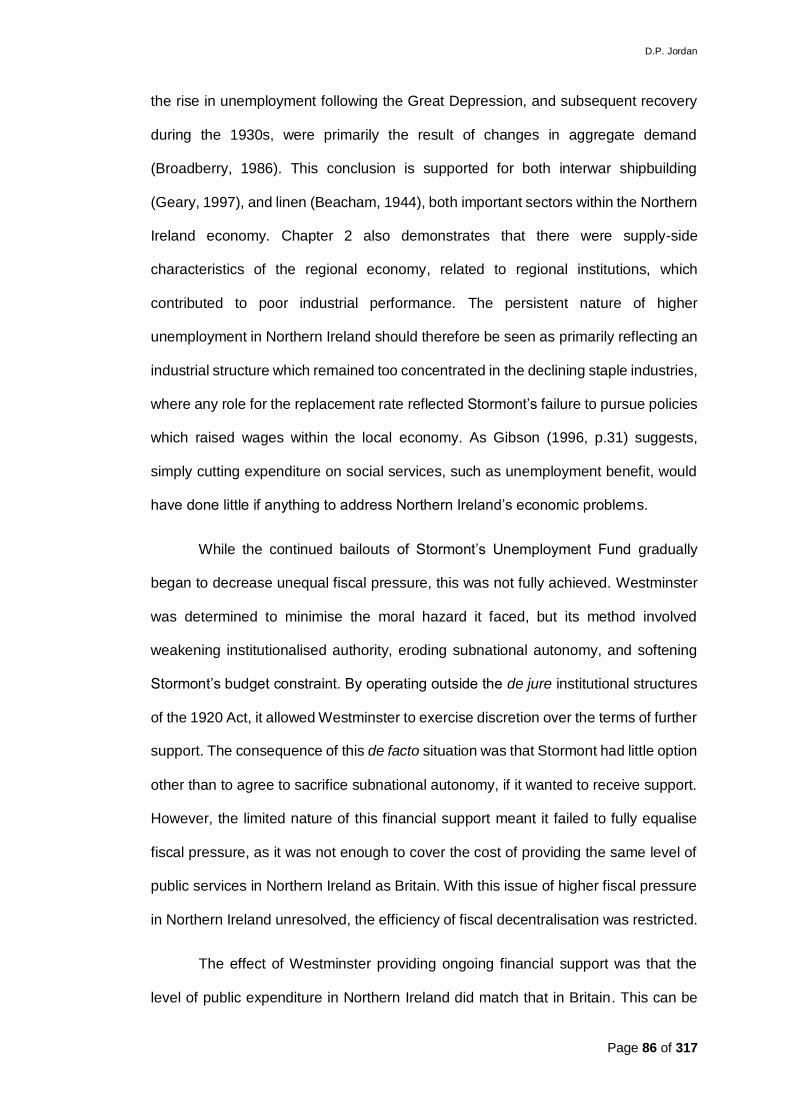
D.P. Jordan
Page 86 of 317
the rise in unemployment following the Great Depression, and subsequent recovery
during the 1930s, were primarily the result of changes in aggregate demand
(Broadberry, 1986). This conclusion is supported for both interwar shipbuilding
(Geary, 1997), and linen (Beacham, 1944), both important sectors within the Northern
Ireland economy. Chapter 2 also demonstrates that there were supply-side
characteristics of the regional economy, related to regional institutions, which
contributed to poor industrial performance. The persistent nature of higher
unemployment in Northern Ireland should therefore be seen as primarily reflecting an
industrial structure which remained too concentrated in the declining staple industries,
where any role for the replacement rate reflected Stormont’s failure to pursue policies
which raised wages within the local economy. As Gibson (1996, p.31) suggests,
simply cutting expenditure on social services, such as unemployment benefit, would
have done little if anything to address Northern Ireland’s economic problems.
While the continued bailouts of Stormont’s Unemployment Fund gradually
began to decrease unequal fiscal pressure, this was not fully achieved. Westminster
was determined to minimise the moral hazard it faced, but its method involved
weakening institutionalised authority, eroding subnational autonomy, and softening
Stormont’s budget constraint. By operating outside the de jure institutional structures
of the 1920 Act, it allowed Westminster to exercise discretion over the terms of further
support. The consequence of this de facto situation was that Stormont had little option
other than to agree to sacrifice subnational autonomy, if it wanted to receive support.
However, the limited nature of this financial support meant it failed to fully equalise
fiscal pressure, as it was not enough to cover the cost of providing the same level of
public services in Northern Ireland as Britain. With this issue of higher fiscal pressure
in Northern Ireland unresolved, the efficiency of fiscal decentralisation was restricted.
The effect of Westminster providing ongoing financial support was that the
level of public expenditure in Northern Ireland did match that in Britain. This can be

D.P. Jordan
Page 87 of 317
seen in Figure 1.3, where the total expenditure per capita on public services in
Northern Ireland tracked Westminster’s expenditure on equivalent services in Britain.
The importance of fiscal transfers from Westminster to Stormont can be seen between
1931 and 1936, when the Unemployment Insurance Agreement broke down. Without
these fiscal transfers, expenditure per capita in Northern Ireland began to fall behind
Britain. It only recovered in 1936, following the new Unemployment Insurance
Agreement between the two governments.
Source: For Northern Ireland, Ulster Year Book (various years). For Britain, Mitchell (1988).
Notes: Years are for financial years. See Appendix A for construction.
Stormont was therefore reliant on fiscal transfers from Britain to ensure public
expenditure matched the equivalent level in Britain, but it could go no higher. The
Colwyn Report had placed limits on Stormont’s expenditure, preventing it increasing
more rapidly than in Britain, with the acceptance of a lower standard of public services
in Northern Ireland as a result. By matching the overall level of public expenditure in
Northern Ireland to Britain, it did not account for areas where greater expenditure was
20
25
30
35
40
45
50
55
60
192
3
192
4
192
5
192
6
192
7
192
8
192
9
193
0
193
1
193
2
193
3
193
4
193
5
193
6
193
7
£ p
er
capita (1972 p
rices)
Figure 1.3: Equivalent public expenditure per capita
Great Britain Northern Ireland

D.P. Jordan
Page 88 of 317
required, such as unemployment. The result was the composition of Stormont’s
expenditure diverged considerably from that in Britain.
An area which required much higher levels of expenditure in Northern Ireland
was Law and Justice, shown in Figure 1.4. This partly reflected how the police was
funded, and also the political environment. In Britain, local authorities contributed to
the cost of the police, but Stormont was almost entirely responsible for funding this
service in Northern Ireland (Buckland, 1979, p.37). While law and order had been
restored by 1925, and the Special Constabulary disbanded (Lawrence, 1965, p.35),
Stormont still felt the need to maintain a large police force, due to anti-partition
activities in the Irish Free State (Buckland, 1979, p.71). Law and Justice therefore
initially accounted for 16 per cent of Stormont’s total expenditure in 1925. At £8.24
per capita, this was considerably higher than Westminster’s expenditure in Britain of
only £1.21 per capita. Stormont’s expenditure did fall from 1927 onwards, but it
remained significantly higher throughout the interwar period.
This was an area of expenditure where ongoing financial support from
Westminster would have been justified, as it faced potential externalities if law and
order broke down, such as increased migration to Britain, or expenditure to restore
order. Yet Westminster made no ongoing financial contribution, leaving the vast
majority of law and justice expenditure to be covered by Stormont.98 This reduced the
money available for other transferred services, contributing to higher fiscal pressure
for citizens in Northern Ireland relative to Britain.
98 Westminster did cover the cost of the Special Constabulary until 1925, and continued with a much smaller contribution until 1927.

D.P. Jordan
Page 89 of 317
Source: For Northern Ireland, Ulster Year Book (various years). For Britain, Mitchell (1988).
Notes: Years are for financial years. See Appendix A for construction.
Stormont has been criticised for neglecting education expenditure, particularly
during the interwar period (Green, 1979; Rowthorn, 1981). This ignores the system
Stormont operated under. As with the police, Stormont’s higher expenditure reflected
the greater responsibility it held for education. Despite a remodelling of the system in
Northern Ireland in 1923, Stormont remained the main source of finance for education,
with local authorities contributing only around one-twentieth of the total cost
(Buckland, 1979, p.37-38). As Figure 1.5 shows, Stormont’s expenditure on education
was higher than Westminster’s. Education was also one of Stormont’s key spending
priorities during the initial years, despite the financial pressure it faced, and was
responsible for a large proportion of increased transferred expenditure between 1921
and 1925. The implication that human capital was lower in Northern Ireland as a result
of underinvestment in education by Stormont can therefore be rejected. Failings in
education were not the result of a lack of funding from Stormont, but due to a lack of
local revenue, and the restrictions on Stormont’s overall level of expenditure, which
prevented it from supplementing local revenue enough.99
99 See Figure 1.B.2 for comparison of total education expenditure.
0
2
4
6
8
10
12
14
192
3
192
4
192
5
192
6
192
7
192
8
192
9
193
0
193
1
193
2
193
3
193
4
193
5
193
6
193
7
£ p
er
capita (1972 p
ices)
Figure 1.4: Law and Justice per capita expenditure
Great Britain Northern Ireland
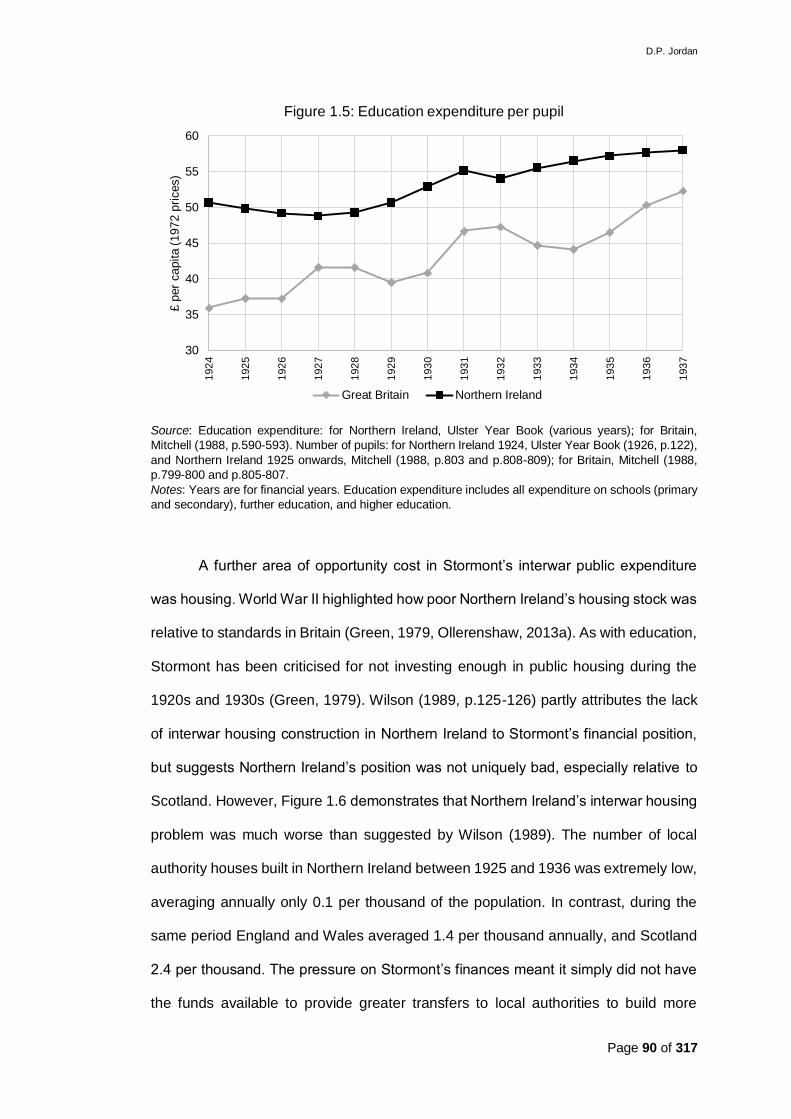
D.P. Jordan
Page 90 of 317
Source: Education expenditure: for Northern Ireland, Ulster Year Book (various years); for Britain,
Mitchell (1988, p.590-593). Number of pupils: for Northern Ireland 1924, Ulster Year Book (1926, p.122),
and Northern Ireland 1925 onwards, Mitchell (1988, p.803 and p.808-809); for Britain, Mitchell (1988,
p.799-800 and p.805-807.
Notes: Years are for financial years. Education expenditure includes all expenditure on schools (primary
and secondary), further education, and higher education.
A further area of opportunity cost in Stormont’s interwar public expenditure
was housing. World War II highlighted how poor Northern Ireland’s housing stock was
relative to standards in Britain (Green, 1979, Ollerenshaw, 2013a). As with education,
Stormont has been criticised for not investing enough in public housing during the
1920s and 1930s (Green, 1979). Wilson (1989, p.125-126) partly attributes the lack
of interwar housing construction in Northern Ireland to Stormont’s financial position,
but suggests Northern Ireland’s position was not uniquely bad, especially relative to
Scotland. However, Figure 1.6 demonstrates that Northern Ireland’s interwar housing
problem was much worse than suggested by Wilson (1989). The number of local
authority houses built in Northern Ireland between 1925 and 1936 was extremely low,
averaging annually only 0.1 per thousand of the population. In contrast, during the
same period England and Wales averaged 1.4 per thousand annually, and Scotland
2.4 per thousand. The pressure on Stormont’s finances meant it simply did not have
the funds available to provide greater transfers to local authorities to build more
30
35
40
45
50
55
60
192
4
192
5
192
6
192
7
192
8
192
9
193
0
193
1
193
2
193
3
193
4
193
5
193
6
193
7
£ p
er
capita (1972 p
rices)
Figure 1.5: Education expenditure per pupil
Great Britain Northern Ireland

D.P. Jordan
Page 91 of 317
housing. When greater numbers of local authority housing did begin to be built post-
war, the issue of discrimination in the access to this public housing became a central
issue associated with the beginning of the Troubles (Rowthorn, 1981; Wilson, 1989).
The interwar period demonstrates the origin of this problem is the interwar period, as
a result of the financial restrictions Stormont faced.
Source: For local authority houses built, Mitchell (1988, p.392). For population, see Appendix C.
Notes: Years are calendar years. Great Britain calculated as the total of England & Wales and Scotland.
An area of transferred expenditure which suffered the greatest opportunity
cost was industry and infrastructure, shown in Figure 1.7. During the early 1920s,
Stormont’s expenditure was almost non-existent relative to Britain, and was only half
Westminster’s level by the end of the 1930s. Most of Stormont’s expenditure went to
agriculture,100 part of the cost of which it had successfully passed onto Westminster
during the 1930s. Westminster had agreed to allow farmers in Northern Ireland to
benefit from its legislation, and while the first scheme, the 1932 Wheat Act, gave no
direct benefit to Northern Ireland farmers, subsequent schemes for cattle, oats, land
fertility, and milk benefited Northern Ireland from 1934 onwards.101 Removing
100 See Figure 1.B.3 in Appendix B for the level of Stormont’s expenditure on agriculture. 101 See Ulster Year Book (1935, p.xxiv; and 1938, p.68-69).
0
0.5
1
1.5
2
2.5
3
3.5
4
192
3
192
4
192
5
192
6
192
7
192
8
192
9
193
0
193
1
193
2
193
3
193
4
193
5
193
6
per
'000 o
f popula
tion
Figure 1.6: Number of local authority houses built
Great Britain Northern Ireland England & Wales Scotland

D.P. Jordan
Page 92 of 317
Stormont’s expenditure on agriculture, partially funded by Westminster, demonstrates
how little it was spending on other industry and infrastructure.102
Source: For Northern Ireland, Ulster Year Book (various years). For Great Britain, Statistical Abstract for
the United Kingdom (various years).
Notes: Years are financial years. ‘Northern Ireland’ includes all expenditure on industry and
infrastructure, including agriculture. ‘Northern Ireland (excl. agriculture)’ excludes Stormont’s expenditure
on agriculture.
This underinvestment in industry and infrastructure had important implications
for Northern Ireland’s long-run economic performance. An example is the supply of
electricity, which became increasingly important for new industries within
manufacturing during the interwar period (Richardson, 1967; Pollard, 1992). The
arrival of World War II demonstrated the inadequacy of electricity infrastructure in
Northern Ireland. Westminster assessed Northern Ireland’s capacity for further war
work, and highlighted Belfast’s reliance on a single electricity generating station as an
obstacle.103 Air raids on Belfast led to the suspension of production of clothing for
Ministry of Supply contracts, due to disruption of the electricity supply (Ollerenshaw,
2013a, p.65). The difficulty in getting an electricity supply at a reasonable cost, relative
102 See Figure 1.B.4 in Appendix B for a comparison of the expenditure by Stormont and Westminster on infrastructure through their respective Road Funds. 103 TNA: HO 45/20268: War Cabinet, Resources of Northern Ireland, 3rd April 1941
0
1
2
3
4
5
6
192
3
192
4
192
5
192
6
192
7
192
8
192
9
193
0
193
1
193
2
193
3
193
4
193
5
193
6
£ p
er
capita (1972 p
rices)
Figure 1.7: Industry and infrastructure expenditure per capita
Great Britain Northern Ireland Northern Ireland (excl. agriculture)

D.P. Jordan
Page 93 of 317
to Britain, almost led to a new munitions factory failing to come to Northern Ireland in
1939 (Ollerenshaw, 2013a, p.70). The lack of expenditure on infrastructure was
therefore limiting Northern Ireland’s growth potential.
The efficiency of fiscal decentralisation was not simply limited by the lack of
financial resources. The softening of Stormont’s budget constraint also led to financial
resources being used inefficiently, as a result of rent-seeking. The accessible style of
government encouraged by Prime Minister Craig, saw a willingness to hand out
government aid following lobbying (Buckland, 1979, p.17). Chapter 2 discusses in
further detail how regional institutions, particularly the strong, overlapping networks
between business and politics, led to inefficient industrial policy interventions by
Stormont, creating barriers to productivity growth. Old, low productivity industries
were able to use their connections with Stormont to influence industrial policy and
capture government subsidy, at the expense of new, higher productivity industries.
An example is Stormont’s replication of Westminster’s Trade Facilities Acts, through
the Loans Guarantee Acts. Where Westminster’s legislation ended in 1927, and
supported a mix of industries, Stormont’s continued until 1938, and almost exclusively
prioritised shipbuilding.104 Stormont also repeatedly increased its borrowing ceiling
under the Loans Guarantee Act, reflecting the soft budget constraint it faced.
Therefore, while Stormont may have replicated Westminster policy, its operation
diverged, and created inefficiencies in resource allocation.
The efficiency of public expenditure was also affected by Stormont’s objective
to maximise Unionist electoral support amongst the working class. This led it to a
focus on prioritising expenditure on public goods and services which could be easily
compared to those in Britain, such as unemployment insurance. While this focus was
successful in gaining fiscal transfers from Westminster, which reduced fiscal pressure
for citizens in specific areas, other areas of public expenditure, such as public
104 See Chapter 2 for further discussion.

D.P. Jordan
Page 94 of 317
housing, were left behind. Gibson (1996, p.45) puts forward the argument that the
pursuit of parity in areas such as unemployment benefit, may not have reflected what
was best for overall economic efficiency, or for citizens in the Nationalist community.
Stormont was therefore able to take advantage of a softening budget constraint to
focus on political priorities and engage in rent-seeking, at the expense of the
economic efficiency of fiscal decentralisation.
A potential way to encourage more efficient policymaking is to give greater
powers of taxation to subnational government. If a subnational government raises a
substantial proportion of its own revenue, it helps ensure subnational autonomy and
hardens budget constraints, as decisions on expenditure are constrained by the ability
to raise revenue, thus improving the efficiency of fiscal decentralisation (Weingast,
2009). Recent debates around increasing the devolution of policymaking powers to
Scotland and Wales, and the devolution of corporation tax to Northern Ireland, have
seen greater devolved tax powers linked to greater financial responsibility (Birnie and
Brownlow, 2017).105 That the most important taxes for generating revenue remained
under Westminster’s control under the 1920 Act, reflected its political priority to ensure
the payment of an Imperial Contribution (Lawrence, 1965, p.15-16). However, even if
Westminster had altered the 1920 Act, it seems unlikely that giving greater
responsibility over taxation to Stormont would have been beneficial for the efficiency
of fiscal decentralisation.
Firstly, as the discussion of Stormont’s failure to increase transferred taxes to
relieve financial pressure showed, it would have been politically impossible for
Stormont to increase taxation, without significant political opposition from the Unionist
Party’s supporters. Secondly, it was widely recognised that taxable capacity in
Northern Ireland was lower than in Britain (Green, 1979, p.3), demonstrated by the
105 See also: H.M. Treasury (2011) Rebalancing the Northern Ireland economy; and H.M. Government (2015) Scotland in the United Kingdom: an enduring settlement.

D.P. Jordan
Page 95 of 317
lower public revenue per capita generated in Northern Ireland relative to the rest of
the UK.106 Transferring greater powers over taxation would have either seen greater
fiscal pressure placed on citizens to fund the same level of public services, or a lower
level of public services. In both scenarios, the efficiency of fiscal decentralisation
would have been harmed from the first generation perspective of Buchanan (1950).
Finally, the key sequence of events which had occurred during the first few years of
Stormont’s existence had softened its budget constraint. This sequence would not
have been altered by the relative distribution of taxation powers. Westminster’s
objective was to ensure the 1920 Act was implemented, and thus needed devolution
to work. Stormont would always have faced significant financial pressure, given
Northern Ireland’s relatively lower taxable capacity and relatively higher need, and it
was in Westminster’s interests to provide fiscal transfers to cover any budget deficit
to ensure Stormont survived. Therefore, greater powers over taxation for Stormont
would not have encouraged more efficient policymaking.
The interwar period, and specifically the Final Colwyn Report, marked a
fundamental shift in the financial relations between Stormont and Westminster. The
1920 Act had become financially unsustainable, but Westminster wanted to maintain
the de jure position. While Westminster agreed to provide ongoing financial support,
allowing total public expenditure per capita in Northern Ireland to match Britain, this
came with conditions attached. These conditions sought to limit its exposure to moral
hazard, capping public expenditure in Northern Ireland to the average level in Britain,
despite greater demands on public expenditure, particularly unemployment. These
conditions led to a lower standard of public services, with clear opportunity costs in
the areas of education, housing, and industry and infrastructure. This was harmful for
the efficiency of fiscal decentralisation, as it placed greater fiscal pressure on citizens
in Northern Ireland. The conditions Westminster imposed, and the continued side-
106 See Figure 1.A.1 Panel A in Appendix A.

D.P. Jordan
Page 96 of 317
lining of the JEB, also weakened institutionalised authority and subnational autonomy.
While this gave Westminster greater discretion, it did not see a hardening of
Stormont’s budget constraint, and thus subnational policy interventions remained
inefficient. As the next section shows, it was one such policy intervention, and its
sizeable financial cost, which would have profound implications for the post-war
financial relationship between Stormont and Westminster, and the expansion of the
welfare state.

D.P. Jordan
Page 97 of 317
7) Renegotiation (1938-1945)
The period surrounding World War II saw the renegotiation of Stormont’s financial
position, which would be important given the post-war expansion of the welfare state.
The 1938 Simon Declaration (1938 Agreement) marked the key moment when
Westminster altered the institutional structure to reflect the de facto position which
had developed during the interwar period. It saw Westminster publicly announce it
would cover any future Stormont deficit, provided that it was not a result of higher
expenditure or lower taxation relative to Britain.107 While previously Westminster had
only made fiscal transfers for a specific purpose, mainly unemployment, the 1938
Agreement was the first acceptance that as a relatively poorer region, Northern
Ireland required an ongoing fiscal transfer across all public services. This was a key
change, and a significant improvement for efficiency in principle, through the
equalisation of fiscal pressure. However, the conditions Westminster imposed, as it
sought to limit moral hazard, would continue to limit efficiency. Institutionalised
authority was further weakened, and subnational autonomy further restricted, in an
attempt to limit moral hazard, and impose a hard budget constraint. The common
market condition also began to be eroded, as Westminster focused solely on financial
matters.
The 1938 Agreement originated from the negotiations to end the Anglo-Irish
Economic War, which had taken place between the UK and the Irish Free State since
1932 (Gibson, 1996, p.38). Westminster wanted Stormont’s public support for any
deal to end the Economic War (Buckland, 1979, p.111). Stormont initially refused to
back the agreement, as it did not want the Irish Free State, now Éire, to have free
access to the UK market, without the UK having reciprocal access to Éire’s market: it
claimed Northern Ireland producers had been particularly harmed by Éire’s
protectionism, and would receive little benefit from the proposed agreement
107 House of Commons Debate 12th May 1938 vol 3335 cc1707-9.
D.P. Jordan
Page 98 of 317
(Buckland, 1979, p.111-112).108 However, Stormont relented, after Westminster
agreed to make new financial concessions outside the provisions of the 1920 Act
(Buckland, 1979, p.115).109
These financial concessions were outlined by the 1938 Agreement, and
covered three areas: Westminster would provide subsidies for agriculture in Northern
Ireland; it would provide the necessary funding to ensure parity in public services, if
Stormont could not afford to do so from its own budget; and it would waive its right to
re-examine its contributions to Stormont under the Unemployment Insurance
Agreement 1936, if the cost surpassed £1 million in nominal terms.110 The first point
was a confirmation of the situation which had developed during the 1930s, where
Westminster had started to extend its agricultural legislation to Northern Ireland. The
agreement confirmed this de facto situation, although it was carefully worded, leaving
the financial implications open to further discussion. The second point would see
Westminster provide the funding necessary to equalise fiscal pressure, by removing
the financial barrier to public services being of the same standard as in Britain. The
third point removed Westminster’s discretion over payments to Stormont to fund
unemployment benefit. These concessions reflected an acknowledgement of the de
facto financial situation which had developed during the interwar period.
Together, these measures had the potential to substantially improve the
efficiency of fiscal decentralisation, primarily through the equalisation of fiscal
pressure. These benefits though were qualified, by Westminster’s parallel
achievement of gaining almost full control over Stormont’s expenditure. It appears
odd that if the 1938 Agreement is read in isolation, as existing literature has done
108 See also TNA: T 160/747 Note by the Government of Northern Ireland on proposed Treaty, March, 1938. 109 See TNA: T 160/747 Letter from Simon to Hoare, 28th March 1938, for concessions Westminster were willing to make; and TNA: T 160/747 Financial Concessions to Northern Ireland, for the agreed concessions. 110 House of Commons Debate 12th May 1938 vol 3335 cc1707-9.

D.P. Jordan
Page 99 of 317
(Lawrence, 1965; Buckland, 1979; Green, 1979; Birrell and Murie, 1980; Wilson,
1989; Gibson, 1996), it shows Westminster making a significant financial commitment
without putting in place any measures of control, despite its prior concerns over moral
hazard. The 1938 Agreement has vague references to financial limits on Stormont,
but nothing specific. Yet Westminster had applied conditions to any previous financial
support to Stormont. The existing narrative is that Westminster’s introduction of
financial controls was a post-war development, and came after the commitment to
parity in public services (Lawrence, 1965; Gibson, 1996; Mitchell, 2006). However, it
was the events surrounding the creation of the Northern Ireland Transport Board
(NITB), culminating in 1938, which would see Westminster able to gain oversight of
Stormont’s expenditure, thus providing the necessary conditions for Westminster to
provide extensive funding for parity in public services.
The creation of the NITB was perhaps the most significant example of
inefficient resource allocation during the interwar period, thanks to the combination of
special interests and a soft budget constraint. It saw Stormont effectively nationalise
the road transport industry within Northern Ireland, which would latterly be described
by Westminster as “an utter failure”,111 and a “sordid” venture.112 During the 1920s
and early 1930s, Northern Ireland’s railway network faced bankruptcy, due to
increasing costs and competition from road transport (Buckland, 1979, p.118). After
several stop-gap measures, and following lobbying from the railway companies,
Stormont agreed to create a public company to run road transport, which would
coordinate services with the railways, and pool receipts (Buckland, 1979, p.121). The
NITB was setup in 1935, to take over all road transport for hire, by buying out existing
road haulage firms.113 This was financed through borrowing by the NITB, covered by
a guarantee from Stormont of £2.5 million in nominal terms.114 However, the new
111 TNA: T 160/1138 Treasury note on Northern Ireland Transport Board, 3rd January 1939. 112 TNA: T 160/1138 Treasury note to Waley, 25th August 1941. 113 TNA: T 160/1138 Memo to Sir F Phillips, 13th January 1939. 114 TNA: T 160/1138 Stormont Memorandum on Transport Board Finance, 1939, p.1.

D.P. Jordan
Page 100 of 317
Northern Ireland Transport Board soon faced great financial difficulties. Firstly, the
NITB overpaid for the assets of existing firms, in one case paying £3,800 for assets
worth £79.115 Secondly, the NITB was operating at a loss, partly the result of a legal
loophole, which saw previously bought-out firms re-entering the market and
competing with the NITB.116 The losses suffered meant the NITB could not repay its
loans, and repeatedly called upon Stormont’s guarantee.117 By 1938, Stormont’s full
guarantee of £2.5 million had been exhausted, and the NITB was seeking further
guarantees for a further £1 million.118
Westminster was particularly concerned about the financial consequences of
the NITB affair. Westminster expected Stormont to cover the continuing losses of the
NITB by issuing more government debt, of up to a thirty year term, the cost of which
would fall on Westminster, through a reduction of the Imperial Contribution.119
Westminster therefore offered Stormont a choice, but which was in fact a thinly veiled
threat. Westminster would acquiesce, and cover the cost of the NITB debt, but only
on two conditions.120 Firstly, Stormont must undertake measures to restore the NITB
to a sound financial basis. Secondly, Stormont should seek Westminster’s approval
before committing “itself to measures which may involve expenditure of a novel
character”.121 If Stormont did not agree to these conditions, Westminster would take
Stormont to the JEB, with all the “political controversy in Northern Ireland” that might
entail.122 Stormont agreed to Westminster’s terms, although it interpreted the
requirement to consult Westminster as relating only to “substantial” expenditure on
115 TNA: T 160/1138 Memo to Sir F Phillips, 13th January 1939. 116 This was achieved by firms purchasing goods at one end, and re-selling them at the other, allowing them to bypass the legal requirement intended to inforce the monopoly of the NITB, by ensuring they were not carrying goods for hire. See TNA: T 160/1138 Memo to Sir F Phillips, 13th January 1939. 117 TNA: T 160/1138 Stormont Memorandum on Transport Board Finance, 1939, p.2. 118 TNA: T 160/1138 Stormont Memorandum on Transport Board Finance, 1939, p.2. 119 TNA: T 160/1138 Minutes of meeting between Duggan, Waley, and Playfair, 29th November 1938. 120 TNA: T 160/1138, Letter from Simon to Andrews, 17th February 1939. 121 TNA: T 160/1138, Letter from Simon to Andrews, 17th February 1939. 122 TNA: T 160/1138, Letter from Simon to Andrews, 17th February 1939.

D.P. Jordan
Page 101 of 317
new schemes, despite Westminster’s assertion that “if the two Ministries worked
together in future it was right that there should be joint responsibility”.123 Westminster
was making it clear that future financial support would be at its discretion, and
Stormont accepted this principle.
The principle that Stormont would seek Westminster’s permission over new
expenditure was implemented, and then expanded, during World War II. This allowed
Westminster to completely remove the problem of asymmetric information in its
financial relations with Stormont, and hence eliminate moral hazard. At the outbreak
of war in 1939, Stormont agreed to make savings “in every possible direction”.124
However, Westminster accepted Stormont would incur additional expenditure for
certain wartime services delegated to it.125 In order to reimburse Stormont, but also
ensure it was effecting “all possible economies”, Westminster would require Stormont
to provide monthly information on all transferred expenditure, and that “no major
additional expenditure be sanctioned” without Westminster’s prior approval.126 In
1942, this agreement was expanded, so that Westminster had to be informed of “all
aspects of expenditure” by Stormont, whether on new or existing services.127 All
estimates regarding existing services had to be submitted by Stormont to Westminster
prior to the Northern Ireland Parliament, while proposals for expenditure exceeding
£50,000 on new services, or expenditure under £50,000 but involved “an important
question of principle”, had to be submitted to Westminster for prior sanction before
being included in estimates.128
These financial controls continued throughout the war, but their true
significance became apparent following the Beveridge Report in 1942. Stormont
123 PRONI: FIN/18/19/417 Extract from notes of meeting with Chancellor, 21st March 1939. 124 TNA: T 160/854 Letter from Petherick to Brooks, 10th October 1939. 125 TNA: T 233/440 Letter from Brooks to Spender, 21st September 1939. See also Lawrence (1965, p.63) 126 TNA: T 233/440 Letter from Hopkins to Ministry of Finance, 25th October 1939. 127 TNA: T 233/440 Letter from Brittain to Ministry of Finance, 13th October 1942. 128 TNA: T 233/440 Letter from Brittain to Ministry of Finance, 13th October 1942.

D.P. Jordan
Page 102 of 317
publicly committed itself to ensuring it followed any resulting developments in social
services in Britain,129 as war had revealed the poor standard of many public services,
leading to pressure for action from within Northern Ireland (Lawrence, 1965; Green
1979; Gibson, 1996; Ollerenshaw, 2013a).130 Westminster realised that implementing
the Beveridge Report in Northern Ireland would be relatively more expensive than in
Britain.131 Westminster did accept that there was ‘leeway’ to be made up in the
standard of public services in Northern Ireland, but did not want to allow Stormont to
use the Imperial Contribution to fund this,132 as this revenue was intended for the war
effort.133 Westminster was also particularly concerned at Stormont announcing
expenditure which had no comparable scheme in Britain, and would see Westminster
bear the cost.134 Therefore, in 1945 Westminster and Stormont looked to continue the
financial procedures which had developed during the war, initially on a temporary
basis.135 Westminster set the conditions: parity of services and taxation would be the
guiding principle; Stormont’s budget would be agreed with Westminster in advance,
with special expenditure having to be justified; in-year supplementary expenditure had
to be forwarded to Westminster for approval; and expenditure exceeding £50,000 in
nominal terms would require advance approval.136 Stormont agreed,137 and both sides
later agreed to extend these measures indefinitely into the post-war period.138
This agreement in effect removed the institutionalised authority of the 1920
Act, even though the 1920 Act would remain the de jure position during the post-war
129 PRONI: CAB/9/C/48/1 Extract of speech by Andrews, 1st December 1942. 130 See also TNA: T 160/1277 Letter from Petherwick to Shillito, 5th April 1944. 131 TNA: T 160/1277 Letter from Epps to Ministry of Labour, 25th November 1943. 132 UK revenue soared during wartime, reflected in Stormont’s total revenue in real terms reaching a high of £188.9 million in 1944, compared to only £82.2 million in 1939. 133 TNA: T 160/1277 Briefing note on Northern Ireland ‘Leeway’, 21st April 1944. 134 TNA: T 160/1327 Letter from Brittain to Wilson, 4th August 1942. 135 TNA: T 233/440 Basis of financial relations between NI and Imperial Exchequer, 30th October 1945. 136 Equating to £163,549 in real terms. See TNA: T 233/440 Letter from Cook to Compton, 18th October, 1945; and Letter from Jones to Cox, 21st January 1956. 137 TNA: T 233/440 Extract of letter from Ministry of Finance, 19th March 1946. 138 TNA: T 233/440 Letter from Scott to The Secretary, H.M. Treasury, 12th April 1947.

D.P. Jordan
Page 103 of 317
period. It also almost entirely eroded subnational autonomy, as it placed Stormont’s
finances at the full discretion of Westminster. The common market condition was also
weakened during the war. Travel permits for entry into the UK had been introduced
across the UK in 1939 (Ó Gráda and Walsh, 2006, p.9), and in 1942, Stormont gained
the power, with Westminster’s agreement, to limit the period of residency of
immigrants who came to Northern Ireland for work, aimed at workers from Éire (Bew
et al., 2002, p.83). This would continue into the post-war period, and reflects
Westminster’s willingness to let Stormont implement its own policies, as long as these
had no direct financial implications.
A key sequence of events had seen a fundamental shift in financial relations
between Stormont and Westminster. Beginning with the Simon Agreement and the
NITB affair, followed by the outbreak of war, and finally the publication of the
Beveridge Report, Westminster found itself with the opportunity to remove the moral
hazard problem from its financial relations with Stormont. This occurred much earlier
than existing literature suggests. While this weakened institutionalised authority, and
eroded subnational autonomy, in return Stormont had achieved an agreement from
Westminster to finance the raising of the standard of public services in Northern
Ireland. The scene was now set for the expansion of the welfare state.

D.P. Jordan
Page 104 of 317
8) Post-war financial control (1945-1972)
The post-war period saw a radical change in the role of government in the UK, with
the expansion of the welfare state. This had important implications for Stormont, given
the war had revealed the poor standard of many public services. The 1938 Simon
Agreement committed Westminster to ensuring public services in Northern Ireland
were on par with those in Britain, but the priorities of war meant the detail of how this
would be achieved had not been worked out. Lawrence (1965, p.77) suggests that in
the immediate post-war period, Westminster “was less anxious about constitutional
niceties and more willing to advance Ulster’s material welfare”. In reality, the war had
seen Westminster gain full financial oversight of Stormont, minimising the moral
hazard problem it had continually faced over Stormont’s total expenditure, and
therefore allowing it to be more financially generous.
The end of the war led to a series of agreements over the funding of social
services, putting the 1938 Agreement into practice. These new financial relations
limited Stormont’s autonomy, and had important implications for efficiency. There was
only a gradual closing of the gap in the standard of public services, which reflected
Westminster’s desire to impose financial limits, and Stormont’s priority to maintain the
politically symbolic Imperial Contribution. The limits imposed by Westminster can be
seen as the introduction of a more systematic approach to financial relations with
Stormont, with rules for determining the scale of fiscal transfers in certain areas of
expenditure. However, it was only with greater transparency during the mid-1950s,
that public expenditure finally began to equalise fiscal pressure, and policy
interventions became more efficient.
In 1945, Westminster made a comprehensive agreement with Stormont, for
Westminster to cover all areas of new social expenditure.139 This led to the new
139 TNA: ACT 1/781 Enclosed note, 13th February 1946, with letter from Parnis to Ayers, 22nd February 1946.

D.P. Jordan
Page 105 of 317
welfare state being introduced in Northern Ireland through the 1946 and 1949 Social
Services Agreements. The 1946 Agreement was an interim measure, covering only
Unemployment Insurance, Unemployment Assistance, and Family Allowances,140 as
not all schemes were ready to be implemented in Britain.141 The 1949 Agreement
therefore saw Westminster’s financial support extended to all areas of social services,
including the National Health Service.142
This support was still based on the principles negotiated under the 1926
Unemployment Insurances Agreement. If the proportionate cost of these new social
services were higher in Northern Ireland than Britain, Westminster would cover 80 per
cent of the excess cost,143 defined as that above Northern Ireland’s share of total UK
costs of the schemes.144 Northern Ireland’s share was referred to as the “parity
proportion”, and was set at 2.2 under the 1946 Agreement, and 2.5 under the 1949
Agreement.145 This was intended to represent the ratio of Northern Ireland’s
population to the whole of the UK, but as Lawrence (1965, p.78) noted, Northern
Ireland’s actual ratio was in fact 2.7. The figure of 2.2, and latterly 2.5, was a deliberate
decision by Westminster to be more financially generous to Stormont, intended as a
mechanism to allow public services in Northern Ireland to catch-up more rapidly with
those in Britain, but in a manner to avoid public scrutiny.146 This parity proportion can
be viewed as an early attempt by Westminster to introduce a standardised measure
against which to assess the scale of fiscal transfers required to fund subnational
140 TNA: T 233/1063 Briefing for Second Reading of Social Services Bill, 19th February 1949. 141 TNA: ACT 1/781 Letter from Parnis to Ayers, 22nd February 1946. 142 TNA: T 233/1063 Briefing for Second Reading of Social Services Bill, 19th February 1949. 143 The agreement was reciprocal, meaning Stormont would have to cover the excess cost in Britain if it arose, but there was no realistic expectation of this ever occurring. 144 Summarised from Lawrence (1965, p.78). 145 TNA: T 233/1063 Briefing for Second Reading of Social Services Bill, 19th February 1949, p.2. 146 TNA: T 233/1063 Briefing for Second Reading of Social Services Bill, 19th February 1949, p.2.

D.P. Jordan
Page 106 of 317
expenditure, several decades before the post-devolution Barnett Formula.147 Crucially
though, it was Westminster’s ability to fully oversee Stormont’s expenditure, thus
removing the problem of moral hazard, which allowed it to be more financially
generous.
The effect of this comprehensive financial support was to begin the process of
equalising fiscal pressure between Northern Ireland and Britain, but this was not
immediately achieved, as Figure 1.8 shows. This was because the Agreements only
allowed Stormont’s expenditure to increase across the new social services introduced
in Britain, but did not include other public services. Compared to Britain, public
expenditure in Northern Ireland did not experience the ratchet effect described by
Peacock and Wiseman (1961), caused by the dramatic increase in public revenue
associated with wartime.148 This meant public expenditure in Northern Ireland
increased more slowly, and only reached the same per capita level as Britain in the
mid-1950s. The catch-up in public services was therefore much slower.
Source: For Northern Ireland, Ulster Year Book (various years). For Great Britain, Mitchell (1988).
Notes: Years are financial years. See Appendix B for method of construction.
147 The Barnett Formula was initially introduced in 1979, as a temporary method for allocating changes in public expenditure in England to the equivalent services in Northern Ireland, Scotland, and Wales. See King and Eiser (2016) for further detail. 148 See Figure 1.A.1 Panel A in Appendix A.
0
50
100
150
200
250
300
194
6
194
7
194
8
194
9
195
0
195
1
195
2
195
3
195
4
195
5
195
6
195
7
195
8
195
9
196
0
196
1
196
2
196
3
196
4
196
5
196
6
196
7
196
8
196
9
197
0
197
1
197
2
£ p
er
capita (1972 p
rices)
Figure 1.8: Total equivalent public expenditure per capita
Great Britain Northern Ireland

D.P. Jordan
Page 107 of 317
Another reason for Northern Ireland missing out on this public expenditure was
Stormont’s continuing commitment to paying the Imperial Contribution.149 In the five
years prior to the outbreak of war, Stormont’s Imperial Contribution per capita was
just 10 per cent of the UK level of per capita expenditure on Imperial Services; yet in
the five years following the war, this had grown to 71 per cent of the UK level, peaking
at 101 per cent in 1949.150 This situation persisted, and the Imperial Contribution
would not fall to its pre-war share of Stormont’s total expenditure until 1960. The
continued payment of an Imperial Contribution by Stormont was seen as desirable by
both governments. Stormont saw the Imperial Contribution as symbolic of its status
and contribution to the UK (Mitchell, 2006, p.65), while Westminster saw its payment
as publicly demonstrating Northern Ireland’s financial commitment to the UK, unlike
Éire, therefore justifying the subsidisation of public services in Northern Ireland.151
A further constraint on the possibility of rapid increases in Stormont’s
expenditure, was the lack of any independent body to oversee its financial relations
with Westminster. Institutionalised authority had been continually weakened by
Westminster throughout devolution, as it sought to limit moral hazard, and this was
reflected in the side-lining of the JEB in the early 1920s. As Mitchell (2006) highlights,
the JEB had little post-war input, and its main role was legitimising the agreements
reached between Stormont and Westminster. This was not only the result of Stormont
acquiescing to Westminster, or a lack of resources, as Mitchell (2006, p.60) suggests.
The de facto institutional structure saw the Treasury appoint the Chairman of the JEB,
even though the de jure position was this appointment was made by the Home Office
on behalf of the Crown.152 Weakened institutionalised authority had eroded
Stormont’s subnational autonomy, and without recourse to an independent body to
149 See Figure 1.A.2 Panel B in Appendix A, and Figure 1.B.7 and 1.B.8 in Appendix B. 150 Calculated for 1935 to 1939, and 1946 to 1950 respectively. See Figure 1.B.8 in Appendix B. 151 TNA: T 233/1063 Briefing for Second Reading of Social Services Bill, 19th February 1949, p.4. 152 TNA: T 341/318 Letter from Rampton to Osmond, 5th August 1964.

D.P. Jordan
Page 108 of 317
arbitrate over financial matters, increases in Stormont’s expenditure were at the
discretion of Westminster. Stormont had to argue its case each year,153 with no
guarantee of an equitable outcome. This prolonged the period it took for fiscal
pressure to be equalised.
The effect of these restrictions on the ability of Stormont’s’ expenditure to
increase, was opportunity costs in several areas. This was even the case for
expenditure on social services, shown in Figure 1.9, the majority of which was now
covered by the 1946 and 1949 Agreements. Stormont’s expenditure briefly fell behind
in 1949 and 1950, as Westminster’s increased rapidly, before they reverted to a
similar level. A further step change was evident at the beginning of the 1960s, with
Westminster’s expenditure once again exceeding Stormont’s, which only caught-up
by the end of the decade.
Source: For Northern Ireland, constructed from Ulster Year Book (various years); for UK, constructed
from Mitchell (1988, p.592-595).
Notes: Years are for financial years. Covers all expenditure on social services, including health, labour,
local government, and housing.
153 TNA: HO 221/178: Memorandum on financial relations with the Government of Northern Ireland, 1970, p.5.
0
20
40
60
80
100
120
140
194
8
194
9
195
0
195
1
195
2
195
3
195
4
195
5
195
6
195
7
195
8
195
9
196
0
196
1
196
2
196
3
196
4
196
5
196
6
196
7
196
8
196
9
197
0
£ p
er
capita (1972 p
rices)
Figure 1.9: Social services expenditure per capita
Great Britain Northern Ireland
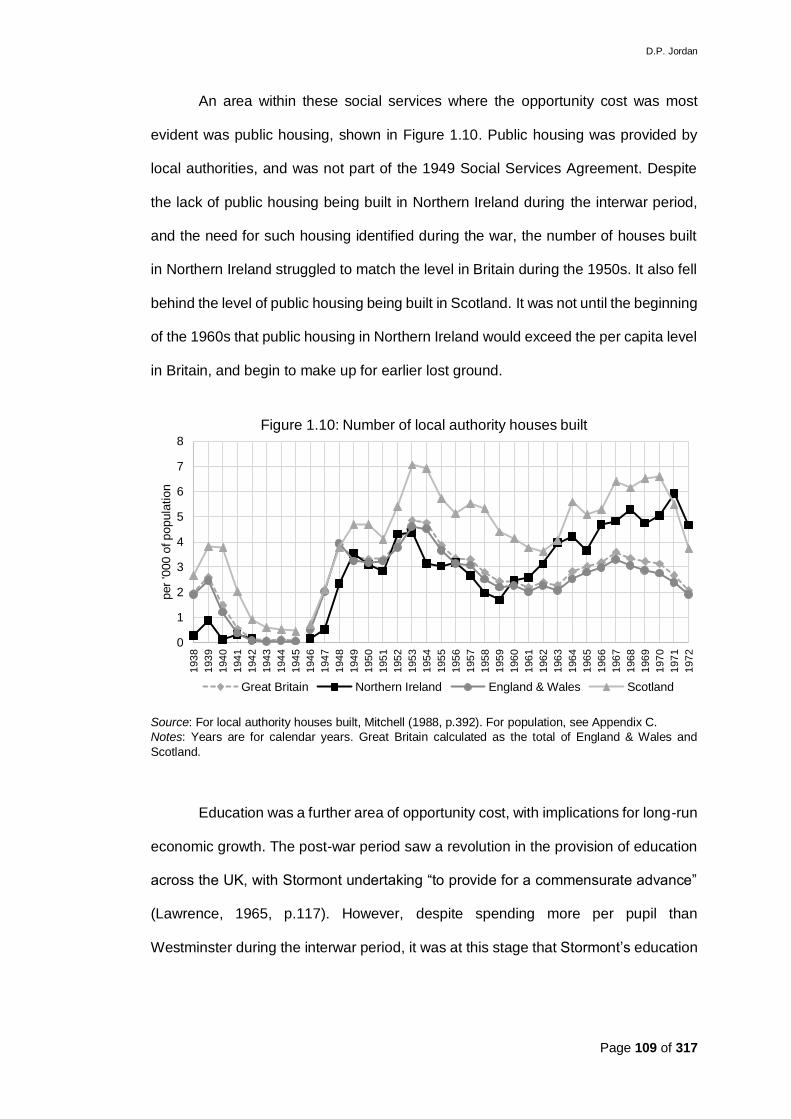
D.P. Jordan
Page 109 of 317
An area within these social services where the opportunity cost was most
evident was public housing, shown in Figure 1.10. Public housing was provided by
local authorities, and was not part of the 1949 Social Services Agreement. Despite
the lack of public housing being built in Northern Ireland during the interwar period,
and the need for such housing identified during the war, the number of houses built
in Northern Ireland struggled to match the level in Britain during the 1950s. It also fell
behind the level of public housing being built in Scotland. It was not until the beginning
of the 1960s that public housing in Northern Ireland would exceed the per capita level
in Britain, and begin to make up for earlier lost ground.
Source: For local authority houses built, Mitchell (1988, p.392). For population, see Appendix C.
Notes: Years are for calendar years. Great Britain calculated as the total of England & Wales and
Scotland.
Education was a further area of opportunity cost, with implications for long-run
economic growth. The post-war period saw a revolution in the provision of education
across the UK, with Stormont undertaking “to provide for a commensurate advance”
(Lawrence, 1965, p.117). However, despite spending more per pupil than
Westminster during the interwar period, it was at this stage that Stormont’s education
0
1
2
3
4
5
6
7
8
193
8
193
9
194
0
194
1
194
2
194
3
194
4
194
5
194
6
194
7
194
8
194
9
195
0
195
1
195
2
195
3
195
4
195
5
195
6
195
7
195
8
195
9
196
0
196
1
196
2
196
3
196
4
196
5
196
6
196
7
196
8
196
9
197
0
197
1
197
2
per
'000 o
f popula
tion
Figure 1.10: Number of local authority houses built
Great Britain Northern Ireland England & Wales Scotland

D.P. Jordan
Page 110 of 317
expenditure per pupil fell behind Westminster’s equivalent expenditure.154 Education
expenditure by local authorities in Northern Ireland remained weak compared to their
counterparts in Britain.155 The relative decrease in Stormont’s expenditure therefore
widened the gap in total expenditure on education per pupil, shown in Figure 1.11. In
1945 Northern Ireland was slightly ahead, but it fell behind from the late 1940s through
until 1958, following a similar pattern but a couple of steps behind. It was only from
the 1960s, when expenditure fell in Britain as a result of a cut in central government
expenditure, that education expenditure in Northern Ireland closed the gap to Britain.
Without education and funding for local authorities being covered by the Social
Services Agreements, it created a significant post-war opportunity cost in human
capital.
Source: See Sources and Notes of Figure 1.B.2, Appendix B.
Notes: Years are for financial years.
The opportunity cost created by the limitations of the Social Services
Agreements is also evident in expenditure on industry and infrastructure, shown in
Figure 1.12. This was significantly lower in Northern Ireland than Britain following the
154 See Figure 1.B.2 Panel B, in Appendix B. 155 See Figure 1.B.2 Panel C, in Appendix B.
0
50
100
150
200
250
300
350
400
450
194
8
194
9
195
0
195
1
195
2
195
3
195
4
195
5
195
6
195
7
195
8
195
9
196
0
196
1
196
2
196
3
196
4
196
5
196
6
196
7
196
8
196
9
197
0
197
1
197
2
£ p
er
pupil (
1972 p
rices)
Figure 1.11: Total education expenditure per pupil (Central+Local)
Great Britain Northern Ireland

D.P. Jordan
Page 111 of 317
war, and only managed to surpass the level in Britain during the mid-1950s. Even
then, this was only making up for the lost ground during the interwar period. A
significant improvement in funding occurred from 1963 onwards, a result of
Westminster providing special payments to Stormont to encourage industrial
development, half of which were charged against the Imperial Contribution
(Lawrence, 1965, p.87-88). However, as the interwar period demonstrated, it was not
simply a lack of money which saw Northern Ireland industry lag behind Britain (See
Chapter 2). If this were the case, Northern Ireland industry should have begun its
convergence with Britain earlier, during the 1950s, when it received its biggest
proportional increases. Yet it was not until the 1960s that industrial performance
improved (Crafts, 1995). This coincided with the introduction of new rules on outside
Ministerial interests by Stormont, which led to more efficient policy interventions
(Brownlow, 2007). It was therefore the combination of adequate funding and more
efficient policy, which allowed convergence to begin to take place.
Source: For Northern Ireland, constructed from Ulster Year Book (various years); for UK, constructed
from Mitchell (1988, p.592-595).
Notes: Years are for financial years. Includes all expenditure on trade, industry, roads and infrastructure.
0
10
20
30
40
50
60
70
194
8
194
9
195
0
195
1
195
2
195
3
195
4
195
5
195
6
195
7
195
8
195
9
196
0
196
1
196
2
196
3
196
4
196
5
196
6
196
7
196
8
196
9
197
0
197
1
197
2
£ p
er
capita (1972 p
rices)
Figure 1.12: Industry and infrastructure expenditure per capita
Great Britain Northern Ireland

D.P. Jordan
Page 112 of 317
While Westminster exercised greater post-war supervision of Stormont’s
expenditure, it was primarily concerned with the total cost of public services. This
allowed Stormont’s budget constraint to soften for how expenditure was allocated
within this hard budget constraint for total expenditure. This allowed divergence to
take place where the financial implications were minimal. In 1947, Westminster
allowed Stormont to bend the fiscal rules of the 1920 Act, by diverting current revenue
to a Capital Purposes Fund, earmarked for industrial development and a wide range
of other projects (Lawrence, 1965, p.81). The willingness of Westminster to accept
some variation also had financial consequences for local government finance.
Stormont was able to reduce industrial rates levied by local authorities by 75 per cent,
where these were only reduced by 50 per cent in England and Wales (Lawrence,
1965, p.98). This de-rating was abolished in England and Wales in 1963, but retained
in Northern Ireland, where no revaluation took place between 1957 and 1975, creating
a substantial shortfall in local authority revenue compared to Britain (Birrell and Murie,
p.162). The fiscal capacity of local authorities had been lower since Northern Ireland’s
inception, but Westminster’s focus on matching Stormont’s level of expenditure to
equivalent services in Britain meant the shortfalls in local government expenditure
were not addressed.
That Westminster’s primary concern was the total cost of Stormont’s
expenditure had implications for the possibility of discrimination in the provision of
public services. In 1955, Westminster increased the rates paid under several social
services, including family allowances, but Stormont wanted to explore whether it
would be possible to introduce variations within schemes, while meeting overall
parity.156 Stormont therefore proposed reducing the amount paid in Family Allowances
for each additional child below the level in Britain,157 intended to reduce the benefits
156 PRONI: CAB/9/C/48/1 Extract from Cabinet Conclusions, 30th November 1955. 157 PRONI: CAB/9/C/48/1 Memorandum by Minister of Labour, 9th May 1956.

D.P. Jordan
Page 113 of 317
accruing to the growing Catholic population, which Stormont perceived as a threat to
Northern Ireland’s future existence.158 Westminster had no objection, as:
they would not regard variations to suit local conditions as a breach of the
parity agreement if they did not exceed the proportionate overall
expenditure limit and did not conflict too markedly with the broad structure
of the Chancellor’s proposals.159
This was a reiteration the principle Westminster had accepted following the 1922
Local Government Bill, that it would not interfere in transferred matters. Stormont
intended to bring forward its modified legislation, but abandoned this following strong
objections from within the Unionist Party,160 instead implementing identical legislation
to that in Britain.161 While Stormont no longer had subnational autonomy over what
legislation it brought forward, or its total cost, it did retain the ability to alter legislation
to reflect its own preferences, within the budget constraint imposed by Westminster.
In this case, disagreement within political Unionism prevented this policy being
enacted, demonstrating the interwar disagreements noted by Bew et al. (2002) were
part of post-war life at Stormont too. Yet Westminster’s focus on the overall cost of
schemes in Northern Ireland, and the greater funds now available for public services,
had opened the door to discriminatory behaviour in their provision.
It was from the mid-1950s onwards that Stormont’s expenditure per capita
exceeded Westminster’s for the first time, coinciding with the Imperial Contribution
beginning to fall as a proportion of total expenditure. This increasing expenditure and
falling Imperial Contribution were the result of transparency being brought to financial
relations. In 1955, the JEB publicly stated for the first time the principles of parity and
158 PRONI: CAB/9/C/48/1 Family Allowance Proposals, attached to letter from Gransden to Rose, 8th June 1956. 159 PRONI: CAB/9/C/48/1 Memorandum by Minister of Labour, 9th May 1956. 160 Including from the Unionist Party’s Westminster MPs, local Unionist Associations, and Protestant Churches. See letters within PRONI: CAB/9/C/48/1. 161 PRONI: CAB/9/C/48/1 Conclusion of Cabinet Meeting, 7th June 1956.

D.P. Jordan
Page 114 of 317
leeway, which governed the financial relationship between Stormont and Westminster
(Birrell and Murie, 1980, p.18),162 and which were contained within the preceding
Agreements of 1945, 1946 and 1949. Westminster had been considering covering
100 per cent of the excess cost of social services in Northern Ireland,163 but it was the
public statement of the JEB which encouraged it to fully adopt an acceptance of
leeway in determining expenditure.164
Greater transparency is a condition necessary for efficiency, as it hardens
budget constraints, and introduces accountability for a subnational government’s
policies (Oates, 2005; Weingast, 2009). The public statement by the JEB of the
principles governing financial relations drew attention to public expenditure in
Northern Ireland. It was shortly followed by the publication of the Isles and Cuthbert
(1957) Report, which was critical of Northern Ireland’s economic performance. This
greater transparency and accountability saw the emergence of greater electoral
competition, with the Northern Ireland Labour Party winning 4 seats in the 1962
Stormont elections. Previously, with little political competition, the ruling Unionist Party
had been able to focus on benchmarking easily compared public goods and services,
such as unemployment benefits, against the level in Britain; but the deficiency in other
public services, where it was more difficult to compare provision, remained hidden.
Now for the first time, the ruling Unionist Party faced electoral competition, introducing
the incentive for Stormont to be more financially accountable to its citizens. The
greater levels of public expenditure, and more efficient industrial policy of the 1960s,
therefore had their origin in the greater transparency surrounding Stormont’s financial
situation from the mid-1950s onwards.
162 This covered the principles of parity in expenditure on standard of social services, as well leeway in expenditure, reflecting the need for additional expenditure to bring social services up to the same standard as in Britain. 163 TNA: T 233/1482 Letter from Thimont to Shillito, 25th August 1954. 164 TNA: HO 221/178 Report on financial relations with the Government of Northern Ireland, 1970, p.4.

D.P. Jordan
Page 115 of 317
While there was an improvement in the efficiency of fiscal decentralisation
towards the end of Stormont’s existence, the issue remained of how to determine the
scale of fiscal transfers from Westminster to Stormont. The parity proportion had been
applied to the introduction of new social service schemes, as part of Westminster’s
more systematic approach to post-war financial relations. Yet which areas of new
expenditure could be justified under the parity concept required regular discussion,
as did other new expenditure not covered by the parity proportion, with Stormont in
both cases having to argue its case each time.165 The use of a single parity proportion
was also a crude means of reflecting greater need in Northern Ireland, as it failed to
reflect differences in need which might exist across different areas of public services.
By the end of the 1960s, there was also concern within Westminster at the
ever increasing cost of financing public expenditure in Northern Ireland.166 The
Treasury in particular wished to see new arrangements be developed, “that avoided
them getting involved in discussions on individual projects” with Stormont.167 This led
to discussions between Westminster and Stormont over possible ways to reform
financial relations.168 This coincided with an investigation into the financial relations
between the two governments, as part of a wider Royal Commission on the
Constitution within the UK.169 However, no reform of Northern Ireland’s public finances
were made until 1973, after the introduction of Direct-rule (Hewitt, 1990, p.366).
The motivation for the introduction of the Barnett Formula in 1979, can be seen
in Westminster’s previous financial relations with Stormont.170 While Westminster had
gained complete oversight of Stormont’s finances post-war, this required time
165 TNA: HO 221/178 Report on financial relations with the Government of Northern Ireland, 1970, p.4-5. 166 TNA: T 224/1606 Letter from Orr to Reid, 17th October 1967. 167 TNA: T 224/1606 Note for the Record, 8th November 1967. 168 TNA: T 224/1606 Financial relations with Northern Ireland, 5th December 1967, p.1. 169 TNA: T 341/66 Evidence to the Royal Commission on the Constitution on financial relations with Northern Ireland. 170 See King and Eiser (2016) for further detail.

D.P. Jordan
Page 116 of 317
consuming discussions covering every area where Westminster would provide
additional funding. Lee (1995, p.161) similarly notes that after 1945, the Scottish
Office was engaged in a process of bargaining with the Treasury over changes in
public expenditure in Scotland. The subsequent Barnett Formula therefore provided
a means to minimise these discussions, applying a standardised rule for changes in
public expenditure, built upon a baseline estimate of need. However, by making
changes in expenditure simply a function of population, the Barnett Formula has been
criticised for failing to take into account changes in relative need (Morgan, 2001; King
and Eiser, 2016). Therefore, while the Barnett Formula was an improvement from
Westminster’s perspective, giving a more systematic basis for regional public finance,
it has been limited in its ability to address the problem of relative need.
D.P. Jordan
Page 117 of 317
9) Conclusion
The Northern Ireland economy underperformed relative to the UK throughout
devolution, despite the apparent benefit of fiscal decentralisation. Using an analytic
narrative approach, and applying theory from both first and second generation fiscal
federalism, the operation of de facto institutions is shown to be at the heart of why
devolved government was unable to address Northern Ireland’s persistently poor
economic performance.
The de jure institutions created by the 1920 Act were not automatically
inefficient, but they contained key flaws, which were immediately tested when
implemented. A key sequence of events saw institutionalised authority weakened,
and Westminster fail to commit to a hard budget constraint. This resulted in a
transition in the financial relations between Stormont and Westminster, defined by the
moral hazard problem faced by Westminster. Stormont sacrificed subnational
autonomy in return for increasing financial support. This financial support was linked
to conditions intended to limit this moral hazard problem, but which prevented fiscal
pressure from being equalised, even as national public expenditure increased post-
war. The consequence was opportunity costs in specific areas of public expenditure,
particularly evident in industry and infrastructure, housing, and education, during both
the interwar and post-war periods. By placing limits on expenditure to deal with the
short-run moral hazard problem, further problems were stored up for long-run
economic growth, which Westminster would ultimately become financially liable for
when Stormont was prorogued in 1972.
An effect of Westminster’s approach to dealing with the moral hazard problem
was the weakening of institutionalised authority. With Stormont being provided with
financial support outside of the de jure provisions of the 1920 Act, its budget constraint
softened. It also did not face any checks from the electorate, due to a lack of political
competition, resulting from the dominance of the constitutional question. This meant

D.P. Jordan
Page 118 of 317
that while Stormont’s total expenditure faced limitations, its policy interventions were
inefficient, and shaped by special interests and rent-seeking. Stormont’s objective
was to maximise electoral support for the Unionist Party, and thus it prioritised areas
of public expenditure which were most easily compared against levels in Britain, such
as unemployment benefits, or in areas of industry which had close links to politics.
Thus short-term political priorities took precedence over policies which might have
addressed Northern Ireland’s long-run economic problems. Even as Westminster took
greater financial control and provided more funding post-war, its focus on the total
cost of Stormont’s expenditure opened the door to discriminatory behaviour within
subnational policy.
The Northern Ireland experience shows that for a devolved, non-federal
institutional structure, the institutionalised authority condition is central to all other
conditions being met. Without institutionalised authority being met first, the remaining
conditions required for efficient fiscal decentralisation, namely subnational autonomy
and hard budget constraints, break down. Even the condition of the common market,
which is less relevant to a devolved, non-federal institutional structure, began to be
eroded with limits on the movement of labour. In this devolved setting, where fiscal
decentralisation occurs in a relatively poorer region, weakening institutionalised
authority results in the national government exercising ever greater control over
subnational expenditure, preventing the first generation benefits of fiscal
decentralisation from being realised.
Considering the Northern Ireland experience of devolution, it is clear that the
institutional structure moved from one assuming Northern Ireland to be a net fiscal
contributor and self-sufficient, to a region which was increasingly reliant on fiscal
transfers from Westminster. The length of time this transition took meant there was a
large opportunity cost from the lack of fiscal transfers. Investment in industry was
particularly low during the interwar period, and if higher, could have helped alleviate

D.P. Jordan
Page 119 of 317
the persistently high unemployment Northern Ireland experienced. It also meant that
when expenditure in such areas did rise, it was only making up for lost ground. It is
therefore perhaps unsurprising that the Northern Ireland economy persistently
underperformed relative to the UK and its regions. Rather than being a benefit, fiscal
decentralisation and the institutional structure imposed by the 1920 Act, acted as a
brake on long-run economic growth.
Westminster’s changing approach to Stormont’s claims for greater fiscal
transfers, by applying the parity proportion to new areas of public expenditure,
highlights the realisation that some form of objective formula to determine fiscal
transfers was required as subnational expenditure increased. Yet with the discretion
Westminster was able to gain through weakened institutionalised authority, Stormont
still had to argue its case for areas of expenditure outside of the agreed social
services. If the Barnett Formula were to be replaced with a more needs-based
approach, this earlier experience gives an insight into the level of ongoing discussion
which might be generated between national and subnational government.
Applying fiscal federalism to the Northern Ireland has lessons for how current
fiscal decentralisation should proceed. Testing theory against a real life narrative
spanning fifty years, something which current literature lacks, demonstrates the need
to combine first and second generation theory to understand institutional structure. It
proves the relevance of fiscal federalism theory to a non-federal system, and also
emphasises its path dependent nature. British institutions have been held up as the
template to achieve long-run economic growth, yet Northern Ireland’s experience
shows that British institutions are not invulnerable to manipulation and inefficiencies
developing over time. Institutionalised authority is therefore central to whether fiscal
decentralisation can operate efficiently within a UK non-federal system of
government. This supports Bell’s (2014, 2016) view that an independent arbitrator
between the national and subnational government is required to ensure

D.P. Jordan
Page 120 of 317
institutionalised authority. The failure of the JEB demonstrated the need for such an
arbitrator to enforce the rules of the game. This is particularly relevant if a new system
of determining fiscal transfers within the UK were introduced to replace the Barnett
Formula, to prevent fiscal transfers being solely at the discretion of Westminster. If
‘devomax’ is to be implemented in Scotland, or further devolution granted to Northern
Ireland as the result of Brexit, it will be the careful design, implementation and
conservation of institutional structure which will define whether fiscal decentralisation
enhances or places limits on economic efficiency.

D.P. Jordan
Page 121 of 317
10) Appendix A – Constructing a time-series of Stormont’s public
finances
To explore how the financial relations between Stormont and Westminster developed
over time, it is necessary to construct a time-series of public revenue and expenditure
for Northern Ireland under devolution. No such time-series currently exists, and so the
data source used to construct this is the Ulster Year Book. This was an official
Stormont publication, which brought together numerical and statistical data for
Northern Ireland. Its publication spans the complete life of fiscal decentralisation to
Stormont, with 20 issues between 1926 and 1975. The resulting disaggregated time-
series constructed for Stormont’s public finances allows the analytic narrative to be
tested against empirical evidence.
The data digitised for Stormont’s public revenue from the Ulster Year Book is
in nominal prices. A long-run, seasonally adjusted price indicator, published by the
ONS (2004, 2020), was therefore used to control for inflation, with all values converted
into 1972 prices. A limitation of this method is that this series is based on UK-wide
prices, and does not reflect any regional variation in price levels. However, as there
is currently no regional time-series of prices, this is the next best solution to control
for inflation.
Figure 1.A.1 combines the public finance time-series for Northern Ireland, with
the annual population estimates of Mitchell (1988),171 to create a per capita time-
series of total public revenue per capita (Panel A), total expenditure per capita (Panel
B), and total equivalent public expenditure per capita (Panel C). These are plotted
against the equivalent data for the UK and Britain from Mitchell (1988). The final
comparison, of total equivalent public expenditure per capita in Panel C, is made
between Northern Ireland and Britain, as UK-wide expenditure figures include
171 A discussion of the population estimates is provided in Appendix C.

D.P. Jordan
Page 122 of 317
defence and the servicing of national debt. By only considering this civil expenditure
which occurred in Britain, it allows a more accurate comparison to be made with the
equivalent expenditure in Northern Ireland. To make the Northern Ireland time-series
comparable with that for Britain, Stormont’s expenditure on the Imperial Contribution
has been removed.
The Ulster Year Book provides disaggregated public finance data for Northern
Ireland, and this is presented in Figure 1.A.2 for Stormont’s revenue (Panel A) and
expenditure (Panel B). Stormont’s revenue per capita is disaggregated into six
categories: Transferred tax revenue, Transferred non-tax revenue, Reserved tax
revenue, Reserved non-tax revenue, UK special payments, and Other. Transferred
sources of revenue were those revenue raising powers transferred from Westminster
to Stormont, including: taxes, for example death duties, stamp duties and motor
vehicle duties; and non-tax sources, including land annuities, fees and miscellaneous
revenue. Reserved revenue were revenue sources which Westminster retained
control over, including: taxes, such as customs and excise duties, income tax, and
profits tax; and non-tax sources, such as the Post Office. UK special payments
reflected fiscal transfers from Westminster to Stormont, while one-off or
uncategorised revenue were included under the category of Other.

D.P. Jordan
Page 123 of 317
Figure 1.A.1: National and Subnational public finances
Source: See text.
0
50
100
150
200
250
300
350
192
31
92
41
92
51
92
61
92
71
92
81
92
91
93
01
93
11
93
21
93
31
93
41
93
51
93
61
93
71
93
81
93
91
94
01
94
11
94
21
94
31
94
41
94
51
94
61
94
71
94
81
94
91
95
01
95
11
95
21
95
31
95
41
95
51
95
61
95
71
95
81
95
91
96
01
96
11
96
21
96
31
96
41
96
51
96
61
96
71
96
81
96
91
97
01
97
11
97
2
£ p
er
capita (1972 p
rices)
Panel A: Total public revenue per capita
UK Northern Ireland
0
50
100
150
200
250
300
350
400
450
192
31
92
41
92
51
92
61
92
71
92
81
92
91
93
01
93
11
93
21
93
31
93
41
93
51
93
61
93
71
93
81
93
91
94
01
94
11
94
21
94
31
94
41
94
51
94
61
94
71
94
81
94
91
95
01
95
11
95
21
95
31
95
41
95
51
95
61
95
71
95
81
95
91
96
01
96
11
96
21
96
31
96
41
96
51
96
61
96
71
96
81
96
91
97
01
97
11
97
2
£ p
er
capita (1972 p
rices)
Panel B: Total public expenditure per capita
UK Northern Ireland
0
50
100
150
200
250
300
192
31
92
41
92
51
92
61
92
71
92
81
92
91
93
01
93
11
93
21
93
31
93
41
93
51
93
61
93
71
93
81
93
91
94
01
94
11
94
21
94
31
94
41
94
51
94
61
94
71
94
81
94
91
95
01
95
11
95
21
95
31
95
41
95
51
95
61
95
71
95
81
95
91
96
01
96
11
96
21
96
31
96
41
96
51
96
61
96
71
96
81
96
91
97
01
97
11
97
2
£ p
er
capita (1972 p
rices)
Panel C: Total equivalent public expenditure per capita
Great Britain Northern Ireland

D.P. Jordan
Page 124 of 317
Figure 1.A.2 Panel A demonstrates how different sources of revenue varied in
importance over time. Total revenue per capita started at £63 in 1923, composed of
approximately 11 per cent transferred revenue, 68 per cent reserved revenue, and 21
per cent UK special payments. However, total revenue fell in the following years, to a
low of £40 per capita in 1928. Between 1923 and 1928, the sources of revenue
changed in relative importance: the level of transferred revenue increased by around
30 per cent, and accounted for a larger share of total revenue at 22 per cent; but the
level of reserved revenue fell by around 30 per cent, albeit accounting for a larger
share of total revenue at 74 per cent, a consequence of fiscal transfers under UK
special payments almost disappearing. The slight growth of total revenue into the
early 1930s was a result of increasing reserved revenue, while UK special payments
reached zero in 1932. However, from 1935 to the outbreak of World War Two, total
revenue increased from £50 to £63 per capita, with the relative proportions of
transferred and reserved revenue remaining at around 20 per cent and 70 per cent
respectively, and UK special payments and other one-off revenue providing the
remaining 10 per cent.
World War II marked a radical change in the composition of Stormont’s
revenue, as tax rises by Westminster to fund the war effort saw Stormont’s total
revenue rise steeply: reserved revenue increased from 71 per cent to 88 per cent of
total revenue; transferred revenue fell from 18 per cent to 7 per cent of total revenue;
and UK special payments also fell, from 10 per cent to 4 per cent of total revenue.
While total revenue plateaued post-war, and then gently rose through the 1950s and
into the 1960s, the proportions of the different sources of revenue remained static
until 1967. From this year onwards transferred revenue increased to over 20 per cent
of total revenue, with UK special payments increasing from 5 per cent to 16 per cent
of total revenue by 1972, and reserved revenue falling to 63 per cent of total revenue,
before Stormont was prorogued in 1972.

D.P. Jordan
Page 125 of 317
Figure 1.A.2 Panel B gives Stormont’s expenditure per capita over time,
disaggregated into five categories: Transferred services consolidated fund,
Transferred services supply fund, Reserved services, the Imperial Contribution, and
Other. Transferred services were those Stormont was responsible for: the
consolidated fund included expenditure which related to legislation, such as interest
on borrowings and the road fund; supply services included expenditure which had to
be authorised annually by the Stormont Parliament, covering departmental spending
and areas such as social services and agriculture. Reserved services were those
Westminster retained responsibility for, while the Imperial Contribution was a charge
laid out by the 1920 Act, and levied on Stormont to pay its share of the cost of Imperial
Services. Finally, one-off expenditure, including the expenditure related to the
foundation of Northern Ireland, is included in the category of Other.
The level of Stormont’s expenditure per capita follows that of revenue very
closely, with a small surplus in most years, and the only prolonged deficit being
between 1931 and 1935. However, the composition of Stormont’s expenditure varies
substantially over time. In the first three complete financial years of devolution, from
1923 to 1925, transferred expenditure accounted for less than half of total public
expenditure in Northern Ireland, a proportion not matched again until World War II.
The level of transferred expenditure rose from 1926 onwards, with its relative share
of total expenditure increasing to between 67 per cent and 84 per cent during the
interwar period. Reserved expenditure remained relatively constant throughout this
period, remaining between 11 per cent and 17 per cent of total expenditure. Thus it
was the Imperial Contribution which saw the greatest fall in level and share, from 38
per cent in 1923, to less than 1 per cent in 1933 and 1934. This allowed transferred
expenditure to increase, before recovering to around 8 per cent by 1939. Other
expenditure was most important between 1923 and 1925, accounting for between 21

D.P. Jordan
Page 126 of 317
per cent and 16 per cent of total expenditure, which reflected the costs associated
with establishing Northern Ireland.
Stormont’s expenditure during World War II rose dramatically, made possible
by an increase in revenues from reserved taxation. However, this was illusionary, as
Stormont’s new expenditure was not spent on Northern Ireland, but instead returned
to Westminster as part of an increased Imperial Contribution. The level of transferred
expenditure therefore remained static throughout the war, falling fractionally below its
pre-war level by 1946. Growth in transferred expenditure only began in 1947,
increasing by 30 per cent in absolute terms that year, and continuing this growth until
1950, as the Imperial Contribution began to fall in size. Growth in transferred
expenditure paused briefly between 1950 and 1952, after which it grew at a relatively
constant rate through until 1963, with the share of transferred expenditure increasing
from 68 per cent to 92 per cent of total expenditure. Since the 1920s reserved
expenditure had remained relatively static in absolute terms, leading to it diminishing
as a proportion of total expenditure, before a sharp fall in 1962 to around 1 per cent,
at which it remained until 1972. However, it was the Imperial Contribution which
displayed the greatest variation in both its level and share of total expenditure,
increasing to more than 50 per cent of total expenditure during World War II. It
remained high in the immediate post-war period, and only gradually returned to its
interwar-war level by the end of the 1950s, after which it fell rapidly to under 1 per
cent of total expenditure by 1972.

D.P. Jordan
Page 127 of 317
Figure 1.A.2: Subnational public finances
0
25
50
75
100
125
150
175
200
225
250
275
300
19
23
19
24
19
25
19
26
19
27
19
28
19
29
19
30
19
31
19
32
19
33
19
34
19
35
19
36
19
37
19
38
19
39
19
40
19
41
19
42
19
43
19
44
19
45
19
46
19
47
19
48
19
49
19
50
19
51
19
52
19
53
19
54
19
55
19
56
19
57
19
58
19
59
19
60
19
61
19
62
19
63
19
64
19
65
19
66
19
67
19
68
19
69
19
70
19
71
19
72
£ p
er
capita (1972 p
rices)
Panel A: Stormont revenue per capita
Transferred Revenue Tax Transferred Revenue Non-Tax Reserved Revenue Tax
Reserved Revenue Non-Tax UK special payment Other
0
25
50
75
100
125
150
175
200
225
250
275
300
19
23
19
24
19
25
19
26
19
27
19
28
19
29
19
30
19
31
19
32
19
33
19
34
19
35
19
36
19
37
19
38
19
39
19
40
19
41
19
42
19
43
19
44
19
45
19
46
19
47
19
48
19
49
19
50
19
51
19
52
19
53
19
54
19
55
19
56
19
57
19
58
19
59
19
60
19
61
19
62
19
63
19
64
19
65
19
66
19
67
19
68
19
69
19
70
19
71
19
72
£ p
er
capita (
1972 p
rices)
Panel B: Stormont expenditure per capita
Transferred Services consolidated fund Transferred Services supply
Reserved Services Imperial Contribution
Other

D.P. Jordan
Page 128 of 317
11) Appendix B – Additional Tables and Figures
Table 1.B.1: Share of UK GDP (%)
1900 1910 1925 1938 1950 1960 1970
Northern Ireland 2.2 1.8 2.1 1.7 2.0 2.0 2.0 London Counties 22.0 20.8 21.8 23.9 20.1 19.9 19.4
Rest of South East 14.8 16.3 16.2 19.3 15.7 17.4 18.8 South West 6.3 6.1 5.8 5.7 5.9 6.0 6.4
West Midlands 6.7 6.8 7.1 8.8 9.2 9.4 9.5 East Midlands 5.6 5.6 5.3 5.2 6.1 6.2 5.9
North 19.6 19.9 18.8 13.6 18.9 17.6 16.9 Yorkshire & Humberside 7.9 8.0 8.1 7.6 8.5 8.1 8.1
Wales 4.3 4.6 4.7 4.5 4.4 4.6 4.4 Scotland 10.6 10.0 10.2 9.7 9.1 8.8 8.7
Ireland (IFS/Republic of) 5.0 4.2 3.3 3.0 2.9 2.7 3.1
Source: Constructed using Geary and Stark (2019).
Notes: For discussion on the creation of these GDP estimates, see Geary and Stark (2019,
p.331-332). Figure for UK GDP excludes the Republic of Ireland throughout.

D.P. Jordan
Page 129 of 317
Table 1.B.2: Comparison of wages by industry
1923 1936 1946 1949 1954
(NI/UK where UK=100)
Voluntary negotiation
Engineering Fitters and turners 112 104 102 100 100
Labourers 94 95 91 97 98
Shipbuilding
Shipwrights 104 100 100 100 100
Joiners 105 100 100 100 100
Labourers 100 100 100 100 100
Building
Bricklayers 101 108 107 105 104
Carpenters and joiners 101 108 107 105 104
Plumbers 103 112 107 105 104
Plasterers 101 107 107 105 104
Painters 102 108 107 105 104
Labourers 85 93 98 99 96
1925 1936 1946 1949 1954
(NI/UK where GB=100)
Wage councils
Aerated waters male 99 94 94 98 100
female 97 97 102 100 100
Boot and shoe repairing male 95 93 103 95 100
female 94 90 87 87 97
Brush and broom male 104 109 108 100 100
female 107 112 103 100 100
Dressmaking and women’s light clothing
male 92 92 100 100 102
female 94 92 97 96 98
Hat, cap, and millinery male 91 94 95 87 -
female 92 92 99 87 -
Laundry male - - 92 100 100
female 96 96 98 97 93
Linen and cotton handkerchief
male 79 83 73 84 93
female 96 96 82 94 91
Paper box male 77 80 94 88 97
female 85 88 94 88 93
Readymade and wholesale bespoke tailoring
male 87 93 95 96 96
female 82 82 92 93 94
Rope, twine, and net male 10 98 109 90 90
female 68 70 79 86 90
Shirt-making male 83 85 90 98 98
female 86 86 93 94 95
Sugar confectionery and food preserving
male 84 90 100 100 100
female 93 93 87 88 95
Wholesale mantle and costume
male 91 91 95 96 96
female 86 86 92 93 94
Sources: For wages set by voluntary negotiation, Isles and Cuthbert (1957, p.218). For wages set by wage councils, Isles and Cuthbert (1957, p.225). Notes: For wages set by voluntary negotiation, these are average time rates, relative to the UK, mainly for men, covering around 60 per cent of manufacturing in Northern Ireland (see Isles and Cuthbert, 1957, p.216-217). For wages set by wage councils, these are average minimum time rates, relative to GB, for both men and women (see Isles and Cuthbert, 1957, p.221-227).

D.P. Jordan
Page 130 of 317
Source: Calculated from Mitchell (1988, p.13-14). See Appendix C for discussion of population
estimates.
Notes: Population of Northern Ireland plus population of the Republic of Ireland equals 100 per cent.
29
30
31
32
33
34
35
192
31
92
41
92
51
92
61
92
71
92
81
92
91
93
01
93
11
93
21
93
31
93
41
93
51
93
61
93
71
93
81
93
91
94
01
94
11
94
21
94
31
94
41
94
51
94
61
94
71
94
81
94
91
95
01
95
11
95
21
95
31
95
41
95
51
95
61
95
71
95
81
95
91
96
01
96
11
96
21
96
31
96
41
96
51
96
61
96
71
96
81
96
91
97
01
97
11
97
2
%
Figure 1.B.1: Northern Ireland's share of all-island population

D.P. Jordan
Page 131 of 317
Figure 1.B.2: Education expenditure per pupil
Source: Northern Ireland education expenditure: for Central Government (Stormont) expenditure, Ulster
Year Book (various years); for Local Authority expenditure, Mitchell (1988, p.638-644). For Great Britain
education expenditure: for Central Government (Westminster) expenditure, Mitchell (1988, p.587-595);
for Local Authority expenditure, England and Wales, and Scotland, Mitchell (1988, p.612-622 & p.626-
633). Number of pupils: for Northern Ireland 1924, Ulster Year Book (1926, p.122), and Northern Ireland
1925 onwards, Mitchell (1988, p.803 and p.808-809); for Britain, Mitchell (1988, p.799-800 and p.805-
807.
Notes: Total education expenditure calculated as including all central and local government expenditure
on education. Includes all expenditure on schools (primary and secondary), further education, higher
education, and science. Total number of pupils calculated as primary plus secondary.
0
50
100
150
200
250
300
350
400
450
192
31
92
41
92
51
92
61
92
71
92
81
92
91
93
01
93
11
93
21
93
31
93
41
93
51
93
61
93
71
93
81
93
91
94
01
94
11
94
21
94
31
94
41
94
51
94
61
94
71
94
81
94
91
95
01
95
11
95
21
95
31
95
41
95
51
95
61
95
71
95
81
95
91
96
01
96
11
96
21
96
31
96
41
96
51
96
61
96
71
96
81
96
91
97
01
97
11
97
2
£ p
er
pupil (
1972 p
rices)
Panel A: Total education expenditure per pupil (Central & Local)
Great Britain Northern Ireland
0
50
100
150
200
250
192
31
92
41
92
51
92
61
92
71
92
81
92
91
93
01
93
11
93
21
93
31
93
41
93
51
93
61
93
71
93
81
93
91
94
01
94
11
94
21
94
31
94
41
94
51
94
61
94
71
94
81
94
91
95
01
95
11
95
21
95
31
95
41
95
51
95
61
95
71
95
81
95
91
96
01
96
11
96
21
96
31
96
41
96
51
96
61
96
71
96
81
96
91
97
01
97
11
97
2
£ p
er
pupil (
1972 p
rices)
Panel B: Central government education expenditure per pupil
Great Britain Northern Ireland
0
50
100
150
200
250
300
350
400
192
31
92
41
92
51
92
61
92
71
92
81
92
91
93
01
93
11
93
21
93
31
93
41
93
51
93
61
93
71
93
81
93
91
94
01
94
11
94
21
94
31
94
41
94
51
94
61
94
71
94
81
94
91
95
01
95
11
95
21
95
31
95
41
95
51
95
61
95
71
95
81
95
91
96
01
96
11
96
21
96
31
96
41
96
51
96
61
96
71
96
81
96
91
97
01
97
11
97
2
£ p
er
pupil (
1972 p
rices)
Panel C: Local authority education expenditure per pupil
Great Britain Northern Ireland

D.P. Jordan
Page 132 of 317
Source: Ulster Year Book (various years).
Notes: Includes all Stormont expenditure on Agriculture Development Fund, Milk Fund, Agricultural
Loans Fund, Agricultural Services, and Agriculture Department.
Source: For Northern Ireland, Ulster Year Book (various years). For Great Britain, Statistical Abstract for
the United Kingdom (various years).
0
0.2
0.4
0.6
0.8
1
1.2
1.4
192
3
192
4
192
5
192
6
192
7
192
8
192
9
193
0
193
1
193
2
193
3
193
4
193
5
193
6
193
7
£ p
er
capita (1972 p
rices)
Figure 1.B.3: Stormont agriculture expenditure per capita
Northern Ireland
0
0.5
1
1.5
2
2.5
3
3.5
192
3
192
4
192
5
192
6
192
7
192
8
192
9
193
0
193
1
193
2
193
3
193
4
193
5
193
6
£ p
er
capita (1972 p
rices)
Figure 1.B.4: Expenditure on Road Fund per capita
Great Britain Northern Ireland

D.P. Jordan
Page 133 of 317
Source: Calculated from Ulster Year Book (various years).
Source: Constructed from Ulster Year Book (various years).
Notes: Total UK payments to NI includes all funds transferred to Stormont from Westminster, including
Stormont’s share of Reserved Revenue, and all UK Special Payments. Retained UK payments to NI =
Total UK payments – (Imperial Contribution + Reserved services expenditure).
-4
-2
0
2
4
6
8
19
23
19
24
19
25
19
26
19
27
19
28
19
29
19
30
19
31
19
32
19
33
19
34
19
35
19
36
19
37
19
38
19
39
19
40
19
41
19
42
19
43
19
44
19
45
19
46
19
47
19
48
19
49
19
50
19
51
19
52
19
53
19
54
19
55
19
56
19
57
19
58
19
59
19
60
19
61
19
62
19
63
19
64
19
65
19
66
19
67
19
68
19
69
19
70
19
71
19
72
£ p
er
capita (1972 p
rices)
Figure 1.B.5: Stormont's annual surplus/deficit per capita
Surplus/deficit
0
50
100
150
200
250
300
350
400
192
31
92
41
92
51
92
61
92
71
92
81
92
91
93
01
93
11
93
21
93
31
93
41
93
51
93
61
93
71
93
81
93
91
94
01
94
11
94
21
94
31
94
41
94
51
94
61
94
71
94
81
94
91
95
01
95
11
95
21
95
31
95
41
95
51
95
61
95
71
95
81
95
91
96
01
96
11
96
21
96
31
96
41
96
51
96
61
96
71
96
81
96
91
97
01
97
11
97
2
£ m
illio
n (1972 p
rices)
Figure 1.B.6: Total Westminster (UK) payments to Stormont (NI)
Total UK payments to NI Retained UK payments to NI

D.P. Jordan
Page 134 of 317
Source: Constructed from Ulster Year Book (various years).
Source: For Northern Ireland Imperial Contribution, constructed from Ulster Year Book (various years);
for UK Imperial Expenditure, constructed from Mitchell (1988).
Notes: UK Imperial Expenditure calculated as the total of all UK expenditure on Imperial Services,
Defence, and National debt.
0
20
40
60
80
100
120
140
19
23
19
24
19
25
19
26
19
27
19
28
19
29
19
30
19
31
19
32
19
33
19
34
19
35
19
36
19
37
19
38
19
39
19
40
19
41
19
42
19
43
19
44
19
45
19
46
19
47
19
48
19
49
19
50
19
51
19
52
19
53
19
54
19
55
19
56
19
57
19
58
19
59
19
60
19
61
19
62
19
63
19
64
19
65
19
66
19
67
19
68
19
69
19
70
19
71
19
72
£ m
illio
n (1972 p
rices)
Figure 1.B.7: Imperial Contribution
0
50
100
150
200
250
300
350
400
192
31
92
41
92
51
92
61
92
71
92
81
92
91
93
01
93
11
93
21
93
31
93
41
93
51
93
61
93
71
93
81
93
91
94
01
94
11
94
21
94
31
94
41
94
51
94
61
94
71
94
81
94
91
95
01
95
11
95
21
95
31
95
41
95
51
95
61
95
71
95
81
95
91
96
01
96
11
96
21
96
31
96
41
96
51
96
61
96
71
96
81
96
91
97
01
97
11
97
2
£ p
er
capita (1972 p
rices)
Figure 1.B.8: Imperial Services expenditure per capita
UK Imperial expenditure NI Imperial contribution

D.P. Jordan
Page 135 of 317
Source: For Northern Ireland, Ulster Year Book (various years). For Britain, Mitchell (1988)
0
2
4
6
8
10
12
14
16
194
8
194
9
195
0
195
1
195
2
195
3
195
4
195
5
195
6
195
7
195
8
195
9
196
0
196
1
196
2
196
3
196
4
196
5
196
6
196
7
196
8
196
9
197
0
197
1
197
2
£ p
er
caoita (1972 p
rices)
Figure 1.B.9: Law and justice expenditure per capita
Great Britain Northern Ireland

D.P. Jordan
Page 136 of 317
12) Appendix C – Demography
To account for how population changes may affect our understanding of Stormont’s
public finances over time, the time-series of the subnational public finances described
in Appendix A, involves annual population estimates for Northern Ireland, to create
per capita measures of Stormont’s revenue and expenditure. These annual
population estimates given by Mitchell (1988) cover the whole of the UK, and are
disaggregated for England and Wales, Scotland and Northern Ireland, between 1922
and 1980. These annual estimates give the mid-year population, and are constructed
using official government statistics.
Figure 1.C.1 compares the total population of Northern Ireland with Britain,
indexed to the year 1922, with the annual estimates taking into account births, deaths,
migration external to the UK and Europe, and some labour related migration between
Britain and Northern Ireland.172 It shows that following a fall in its population between
1922 and 1930, Northern Ireland followed a similar pattern of growth to Britain through
to 1972, closing the gap slightly during the 1960s.173
The demographic structure of Northern Ireland can also be compared against
Britain using census data compiled by Mitchell (1988). This is used to create the ratio
of Northern Ireland to Britain population in each age category, shown in Table 1.C.1.
Northern Ireland’s population was significantly younger, with a 25 per cent larger
population in the under fifteen years of age category by 1971, and the population in
the seventy plus category much smaller. The size of Northern Ireland’s dependant
population was therefore much larger than in Britain, leaving Northern Ireland with
approximately a 5 per cent smaller working population. To account for this younger
population when considering areas of expenditure which would fall mainly on this
172 The estimates of Northern Ireland population from Mitchell (1988) match those provided in editions of the Ulster Year Book, which provide greater detail (see Ulster Year Book, 1938, p.13). 173 The sudden rise in Northern Ireland’s population and subsequent fall between 1942 and 1946 likely reflect Allied forces (mainly American) stationed there.

D.P. Jordan
Page 137 of 317
population, such as education, expenditure was calculated at a per pupil rather than
per capita rate.
Table 1.C.1: Demographic structure
Age 1921/26* 1931/37* 1951 1961 1971
0-14 NI:GB 1.04 1.12 1.23 1.25 1.24 15-69 NI:GB 0.96 0.94 0.93 0.93 0.94 70+ NI:GB 1.47 1.29 0.94 0.85 0.83
Source: Adapted from Mitchell (1988). *Population censuses were undertaken in Britain during 1921 and 1931, but in Northern Ireland they occurred during 1926 and 1937.
95
100
105
110
115
120
125
130
192
21
92
31
92
41
92
51
92
61
92
71
92
81
92
91
93
01
93
11
93
21
93
31
93
41
93
51
93
61
93
71
93
81
93
91
94
01
94
11
94
21
94
31
94
41
94
51
94
61
94
71
94
81
94
91
95
01
95
11
95
21
95
31
95
41
95
51
95
61
95
71
95
81
95
91
96
01
96
11
96
21
96
31
96
41
96
51
96
61
96
71
96
81
96
91
97
01
97
11
97
2
Figure 1.C.1: Index of population (1922=100)
GB Index NI Index

D.P. Jordan
Page 138 of 317
CHAPTER 2
Doomed to decline?
Interwar industrial performance and policy in
Northern Ireland
Abstract
Throughout devolution, Northern Ireland possessed a persistent productivity gap to
the rest of the UK. This was despite the apparent benefit of being able to tailor
industrial policy to its own needs. The interwar performance of Northern Ireland
manufacturing was particularly poor, relative to both the UK and its regions.
Unemployment was high, and new industries failed to establish. Existing literature
sees Northern Ireland’s poor performance as inevitable, blaming it on falling global
demand in the staple industries, and a subnational government without the funds to
intervene. However, the interwar period provides the opportunity to examine
Stormont’s early industrial policy in detail, and understand whether regional
institutions contributed to the creation of barriers to productivity growth. Using new
archival evidence, the interaction between regional institutions and the supply-side of
the regional economy is shown to be key. Strong, overlapping networks between
business and politics created barriers to productivity growth. Old, low productivity
industries were able to capture subsidies through Stormont’s industrial policy. This
was at the expense of new, higher productivity industries, which were growing in
Britain at this time. The failure of Stormont’s interwar industrial policy had long-run
effects, as it shaped the design of post-war policy interventions, while the failure of
new industries to develop limited post-war growth. Regional institutions therefore
pose a limit on the efficient decentralisation of industrial policy.
D.P. Jordan
Page 139 of 317
1) Introduction
The UK’s recent poor productivity performance has increasingly concerned
policymakers (Bank of England, 2014; Pessoa and Van Reenen, 2014; Harris and
Moffat, 2017a), with regional inequalities in productivity highlighted across the UK
(Rizov and Walsh, 2011; Harris and Moffat, 2017b). Northern Ireland possesses a
longstanding productivity gap to the UK (Hitchens and Birnie, 1989a; Mac Flynn,
2016), which has been connected to the broader discussion around how to rebalance
the regional economy (H.M. Treasury, 2011). However, why this gap has persisted
for so long, despite numerous policy interventions, is not fully understood.
This chapter asks whether regional institutions can explain Northern Ireland’s
longstanding productivity gap, by examining Stormont’s interwar industrial policy, and
its impact on the performance of Northern Ireland manufacturing. Using new archival
evidence, regional institutions are shown to have placed a limit on the efficient
decentralisation of industrial policy. Old, low productivity industries were able to use
their strong overlapping networks with Stormont to receive financial support, aiding
their survival, but creating barriers to productivity growth. This helped lock the regional
economy into a low-wage-investment-productivity equilibrium, which persisted post-
war. This has important policy implications for the view that further devolution within
the UK is desirable, as it highlights the important role of regional institutions in
determining the success of policy interventions.
Regional institutions are increasingly being recognised as important for
regional economic performance (Pike et al., 2012; Brownlow, 2017; Ganau and
Rodriguez-Pose, 2019), but they have not been applied to interwar Northern Ireland
as an explanation for its poor performance. An extensive literature exists on the
interwar performance of UK manufacturing (Richardson, 1967; Aldcroft, 1970; Pollard,
1992; Broadberry, 1997), but little reference is made to Northern Ireland, beyond an
acknowledgement of the importance of linen and shipbuilding to the regional
economy. Institutions in Britain have been identified as limiting interwar productivity

D.P. Jordan
Page 140 of 317
growth (Broadberry and Crafts, 1992; Broadberry, 1997), yet the role of institutions at
the regional level of the Northern Ireland economy has not been examined. Existing
explanations instead see Northern Ireland’s poor performance as a demand-side
story: an inevitable result of an industrial structure over reliant on the staple industries
which were experiencing falling global demand, and a subnational government at
Stormont powerless to intervene due to a lack of funds (Buckland, 1979; Johnson,
1985a).
Analysing the poor interwar performance of Northern Ireland manufacturing
demonstrates it was not simply a demand-side story. Instead, the supply-side was
crucial. Using data digitised from the UK and Northern Ireland Census of Production,
manufacturing productivity in Northern Ireland is shown to have been at its worst
relative to the UK during the interwar period. This is found not simply to be the result
of industrial structure, with an overreliance on the staple industries, but also the
consequence of within-sector productivity failings. This is linked to the failure of new,
high productivity industries to develop in Northern Ireland at the same time as they
were growing in Britain, such as man-made fibres within textiles, and electrical
engineering within metal trades. The failure of these sectors continued to limit
productivity growth within Northern Ireland into the post-war period, as these sectors
provided the foundation for post-war growth in UK manufacturing.
Regional institutions are found to have played a key role in contributing to this
productivity failure. The expected payoff for firms from investing in skills and
knowledge was reduced during the interwar period, both by falling demand, but also
by the supply-side conditions they faced. This increased the relative expected payoff
to firms from changing institutions to receive benefits. This was facilitated by regional
institutions, which saw strong overlapping networks between business and the ruling
Unionist Party at Stormont. This led to the influential, old industries receiving
subsidies, as Stormont focused on preserving employment. Existing firms were also
able to influence the composition and destination of Stormont’s industrial expenditure.
D.P. Jordan
Page 141 of 317
Support superficially intended to promote the growth of new industries, was instead
captured by old industries and existing firms. This created barriers to structural
change and productivity growth, restricting the establishment of new, higher
productivity industries. This helped lock the regional economy into a low productivity
equilibrium, which persisted post-war. Regional institutions, and their role in altering
the allocation of resources within the regional economy through devolved industrial
policy, therefore contributed to Northern Ireland’s persistent productivity gap.
The rest of the chapter is structured as follows. Section 2 summarises the
relevant literature, and the failure to consider the role of regional institutions in
explaining Northern Ireland’s poor interwar performance. Section 3 compares
Northern Ireland’s industrial performance against the UK, showing that the
productivity gap was not simply a structural problem, but within-sector productivity
failures were important. Section 4 discusses the role of regional institutions in
Northern Ireland, demonstrating the strong overlapping networks between business
and politics, and the means and motive for firms to engage in rent-seeking behaviour.
Section 5 examines why existing firms within old industries failed to move into higher
productivity areas, due to the supply-side characteristics of the regional economy
lowering the expected payoff from investment, and regional institutions raising the
expected payoff from changing institutions to receive benefits. Section 6 examines
the industrial policy Stormont adopted to promote new industries, and why its failure
was the result of regional institutions which favoured existing industries, and not
simply a lack of funds. Section 7 provides the conclusion.

D.P. Jordan
Page 142 of 317
2) Relevant literature
Literature from fiscal federalism provides the framework for understanding how
Stormont’s interwar industrial policy operated. The Government of Ireland Act 1920
(1920 Act) saw the devolved government at Stormont responsible for industrial policy,
with Westminster’s subsequent industrial policy only applying to Britain. Fiscal
federalism examines the consequences of decentralised policy powers for regional
economic performance. While first generation theory emphasises the potential
benefits, second generation theory emphasises the importance of institutions in
explaining why these apparent benefits may fail to be realised (Oates, 2005;
Weingast, 2009). In particular, the institutions associated with fiscal decentralisation
will affect the incentives faced by a devolved government, which can potentially lead
to inefficient industrial policy interventions, such as bailing out failing enterprises
(Weingast, 2009). Stormont faced a softening budget constraint during the interwar
period, as a result of its financial relationship with Westminster, discussed in Chapter
1. Regional institutions therefore had an important role to play in shaping Stormont’s
industrial policy interventions.
Institutions have been recognised as key to explaining long-run trends in
economic growth (North, 1990; North, Wallis and Weingast, 2009; Acemoglu and
Robinson, 2012). However, the importance of regional institutions to economic
performance has only been emphasised more recently. Culture and informal
institutions have been shown to be important for explaining differences in long-run
economic performance across regions (Tabellini, 2010). Regional productivity
performance has been linked to the quality of regional institutions. Lamoreaux et al.
(2006), demonstrate that the regional institutions of Cleveland, USA, drove
productivity growth during the second industrial revolution, as they successfully linked
business and finance, allowing new technologies to be commercialised. Ganau and
Rodriguez-Pose (2019) demonstrate that high quality, regional institutions are linked
to high manufacturing labour productivity in modern-day Europe. Government

D.P. Jordan
Page 143 of 317
effectiveness is found to be the main driver of higher productivity, with those most
affected being small firms, less capital intensive firms, and high-tech firms (Ganau
and Rodriguez-Pose, 2019, p.1654). Devolved government therefore has the
potential to affect long-run regional economic performance through industrial policy,
but few studies exist which test this theory against real world examples of fiscal
decentralisation. While regional institutions have been recognised as being important
within a UK context (Pike et al., 2012; Brownlow, 2017), their impact on industrial
policy interventions has not been examined in detail.
While industrial policy in Northern Ireland has been the subject of much
examination, the interwar period has received little attention. Existing literature has
mainly focused on post-war industrial policy, and why attempts to promote regional
growth failed to see Northern Ireland manufacturing converge with the rest of the UK,
whether under Stormont or Direct-rule (Lee, 1971; Harrison, 1990; Harris, 1991;
Crafts, 1995; Birnie and Hitchens, 2001; Brownlow, 2013). While the role of
institutions has been emphasised in the failings of Stormont’s post-war industrial
policy (Crafts, 1995; Brownlow, 2007, 2013), evidence of how firms used regional
institutions to influence industrial policy, and the importance of regional institutions to
earlier periods, has not been examined. The interwar period therefore provides an
opportunity to understand how regional institutions contributed to Northern Ireland’s
persistent underperformance, and whether their importance stretches back to before
World War II.
An extensive literature exists on the interwar performance of UK
manufacturing, yet little reference is made to Northern Ireland. It is simply not
mentioned in many discussions of the interwar period, such as Richardson (1967),
Aldcroft (1970), Pollard (1992), and Crafts (2018). Where Northern Ireland is
mentioned, such as Broadberry (1997), it is only briefly in relation to shipbuilding and
linen. Discussions of the Irish interwar economy mention Northern Ireland more
consistently (Johnson, 1974, 1985b; Kennedy, Giblin, McHugh, 1988; Ó Gráda,

D.P. Jordan
Page 144 of 317
1997), but mainly in comparison with the fortunes of the Irish Free State. This leaves
detailed analysis of Northern Ireland’s interwar experience to only a few select
authors. This analysis often concentrates on the experiences of the staple industries,
such as Beacham (1944) for linen, and Geary and Johnson (1989) for shipbuilding.
However, an overarching narrative for Northern Ireland’s industrial performance is
provided by Buckland (1979, 1981) and Johnson (1985a).
Johnson (1985a) provides the most complete narrative of the interwar period,
attributing Northern Ireland’s poor performance to the decline of the export-orientated,
staple industries it was concentrated in. Falling global demand is blamed for the poor
performance of linen and shipbuilding, and in the case of linen, supply-side factors
are specifically rejected as an explanation for this decline. The failure of new
industries to establish is attributed to a mixture of misfortune and a lack of government
incentives. With southern Britain already containing the new industries which would
see interwar expansion, only financial inducements beyond those Stormont was able
to give would have brought these industries to Northern Ireland (Johnson, 1985a,
p.200-201). The decline of the staple industries, and the failure of new industries to
develop, was therefore inevitable, and not the fault of Stormont’s industrial policy.
Buckland (1979, 1981) similarly identifies falling global demand, and a lack of
government funds to attract new industries, as responsible for the decline in industrial
performance. Geographic disadvantages relating to costs are also suggested,
including distance from raw materials and markets (Buckland, 1979, p.128), while
Stormont is criticised for inaction over industrial policy (Buckland, 1979, p.126).
Together Johnson (1985a) and Buckland (1979) view Northern Ireland’s poor interwar
economic performance as demand driven, unrelated to the supply-side. The existing
narrative is therefore that industrial decline was the inevitable result of falling global
demand, combined with the misfortune not to already possess new industries which
would expand during the 1930s, with this situation one which Stormont could not
influence due to a lack of funds.

D.P. Jordan
Page 145 of 317
This interwar narrative contrasts starkly with the post-war explanation of
Northern Ireland economic failings. While Northern Ireland’s growth was limited by
shared UK problems, Crafts (1995) finds factors specific to Northern Ireland also
existed, which led to its poor post-war performance relative to other less favoured UK
regions. This was primarily the result of an industrial structure focused on low
productivity industries immediately post-war, and a gap in labour productivity (Crafts,
1995, p.19). Institutions are suggested as the main source of these problems, as
government policy interventions failed to increase industrial efficiency (Crafts, 1995,
p.24).
An institutions centred explanation for Northern Ireland’s poor performance
post-war is supported by Brownlow (2007, 2013). Productivity growth only occurred
when Stormont’s industrial policy of the 1960s favoured newer, efficient industries,
which replaced older, less efficient industries (Brownlow, 2007, p.92), with this period
seeing the greatest convergence in GDP per capita between Northern Ireland and the
UK average (Birnie and Hitchens, 2001, p.3). In An Economic Survey of Northern
Ireland, Isles and Cuthbert (1957) hint at the role of regional institutions in Northern
Ireland’s interwar economic performance. They suggest that an “attitude of restriction”
developed within Northern Ireland business during the 1930s, which may have helped
restrict business development (Isles and Cuthbert, 1957, p.349). As their report was
commissioned by Stormont, this theme was left undeveloped.174 However, it
reinforces the role of institutions in affecting regional economic performance, as
demonstrated discussed by Crafts (1995) and Brownlow (2007) for the post-war
period. Brownlow (2013, p.306) concludes that institutions, and their influence on
supply-side competitiveness, are central to explaining the long-run gap in economic
performance between Northern Ireland and Britain.
174 Isles and Cuthbert (1957) was published two years after originally being written, which Bew, Gibbon, and Patterson (2002, p.116) suggest was the result of it being critical of the Stormont government.

D.P. Jordan
Page 146 of 317
While there has been a failure to examine the role of institutions in Northern
Ireland’s interwar economic performance, this is not the case for the UK as a whole.
Broadberry (1997) provides an institutions based explanation for the relative
performance of UK manufacturing. Comparing the long-run productivity performance
of UK manufacturing against Germany and the USA, Broadberry (1997) demonstrates
the UK was not a productivity leader during the interwar period. UK productivity was
superior to Southern Europe (France and Italy), and matched Northern European
countries (Germany, Netherlands, Norway, Sweden, and Denmark), but lagged
behind Australia and Canada, and was half that of the USA (Broadberry, 1997, p.53-
54).
The explanation for the UK’s relatively poor interwar productivity performance
is centred on the role of institutions, with a failure to remain competitive being the
result of barriers to productivity growth (Broadberry, 1997). These can arise when the
owners of human and physical capital, which are associated with inferior production
techniques, use their bargaining power to delay the transition to higher productivity
methods (Broadberry, 1997, p.129). This can involve lobbying for protection, and
subsidies from government. Whether this delaying strategy is successful depends on
the institutions present, as these determine the competitive environment, and thus the
incentives firms face to improve their productivity performance (Broadberry, 1997).
Broadberry (1997, p.210) shows institutions were responsible for the UK’s productivity
gap widening to the USA between 1914 and 1950. Barriers to competition became
institutionalised, weakening the pressure for firms to adjust and compete against new
innovations, which stored up problems for post-war readjustment (Broadberry, 1997).
Broadberry and Crafts (1992) similarly identify institutional factors as
responsible for Britain’s poor manufacturing performance relative to the USA during
the interwar period. This included restrictive working practices, a lack of human
capital, and collusive agreements between firms (Broadberry and Crafts, 1992). The
inheritance of institutions developed during the nineteenth century, which were
D.P. Jordan
Page 147 of 317
unsuitable and unable to adapt to the context of the interwar British economy, has
also been blamed for the UK’s relatively poor economic growth (Elbaum and Lazonick,
1984). The UK is not the only country where institutions have been suggested as
creating barriers to interwar productivity growth. Giordano and Giugliano (2015)
examine Italy’s labour productivity during the first half of the twentieth century, and
show that more interventionist industrial policy under the Fascist government resulted
in slower productivity growth.175
The only long-run analysis of manufacturing productivity in Northern Ireland is
provided by Hitchens and Birnie (1989a). Productivity was not only lower in Northern
Ireland than Britain, but failed to converge over time (Hitchens and Birnie, 1989a,
p.449). They suggest institutions may have been responsible for this long-run
productivity gap to the UK, but do not provide evidence of whether this was the case.
The analysis of sectoral productivity is also limited to after devolution ended, and the
contribution of industrial structure to the interwar productivity gap is only provided for
the single year of 1935, from estimates by Isles and Cuthbert (1957). This means it is
unclear where Northern Ireland’s productivity gap originated from during the interwar
period, and what caused it.
Northern Ireland manufacturing possesses a long-run productivity gap to the
UK. However, the existing narrative for Northern Ireland’s poor interwar performance
focuses on the demand-side, with institutions having little role, due to Stormont’s
apparent lack of funds for industrial policy interventions. This contrasts with analysis
of the UK’s interwar performance, and Northern Ireland’s post-war experience, which
focus on the supply-side, and the role of institutions in creating barriers to productivity
growth. However, the post-war narrative for Northern Ireland does not provide
evidence to prove how existing firms were able to alter regional institutions for their
175 In a recent working paper by Akcigit, Baslandez, and Lotti (2018), which considers modern-day Italy, they demonstrate that firms with greater political connections have a higher rate of survival and growth of employment and revenue, but are less likely to innovate, harming productivity growth.

D.P. Jordan
Page 148 of 317
own benefit. Therefore, by combining new archival material with data measuring
manufacturing productivity, the interwar period gives an opportunity to test whether
industrial decline was solely a demand-side story, and if regional institutions affected
economic performance.
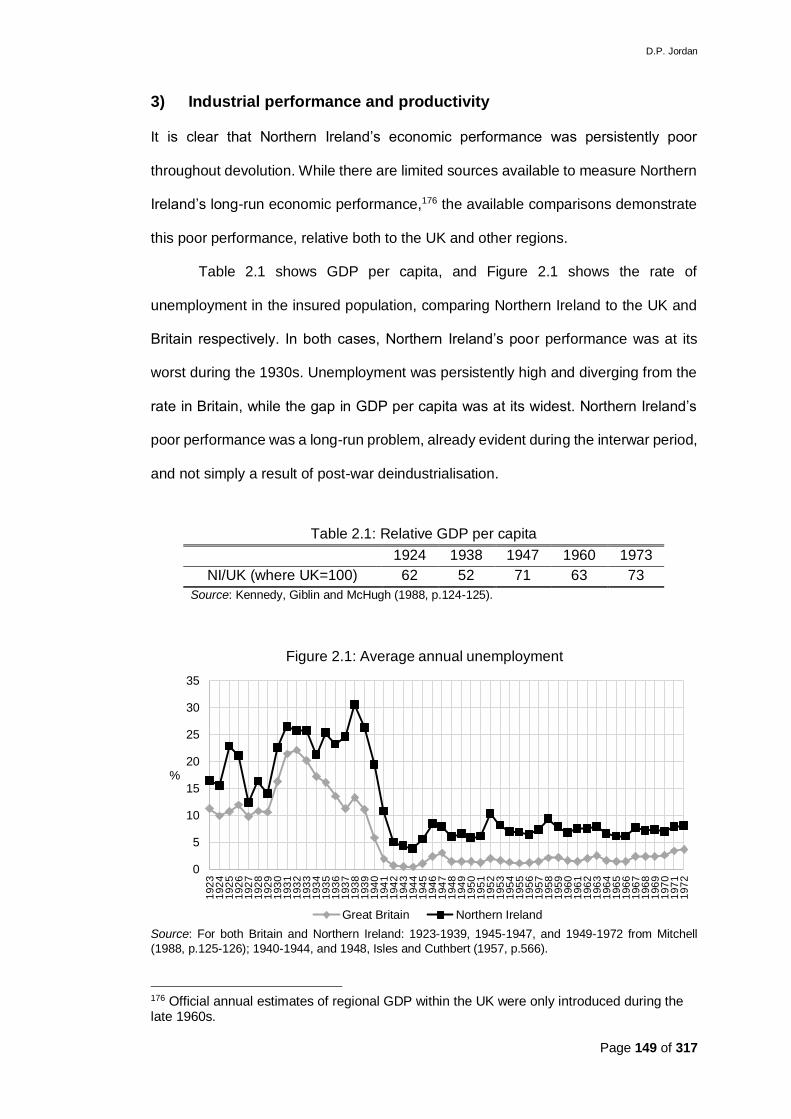
D.P. Jordan
Page 149 of 317
3) Industrial performance and productivity
It is clear that Northern Ireland’s economic performance was persistently poor
throughout devolution. While there are limited sources available to measure Northern
Ireland’s long-run economic performance,176 the available comparisons demonstrate
this poor performance, relative both to the UK and other regions.
Table 2.1 shows GDP per capita, and Figure 2.1 shows the rate of
unemployment in the insured population, comparing Northern Ireland to the UK and
Britain respectively. In both cases, Northern Ireland’s poor performance was at its
worst during the 1930s. Unemployment was persistently high and diverging from the
rate in Britain, while the gap in GDP per capita was at its widest. Northern Ireland’s
poor performance was a long-run problem, already evident during the interwar period,
and not simply a result of post-war deindustrialisation.
Source: For both Britain and Northern Ireland: 1923-1939, 1945-1947, and 1949-1972 from Mitchell
(1988, p.125-126); 1940-1944, and 1948, Isles and Cuthbert (1957, p.566).
176 Official annual estimates of regional GDP within the UK were only introduced during the late 1960s.
0
5
10
15
20
25
30
35
192
31
92
41
92
51
92
61
92
71
92
81
92
91
93
01
93
11
93
21
93
31
93
41
93
51
93
61
93
71
93
81
93
91
94
01
94
11
94
21
94
31
94
41
94
51
94
61
94
71
94
81
94
91
95
01
95
11
95
21
95
31
95
41
95
51
95
61
95
71
95
81
95
91
96
01
96
11
96
21
96
31
96
41
96
51
96
61
96
71
96
81
96
91
97
01
97
11
97
2
%
Figure 2.1: Average annual unemployment
Great Britain Northern Ireland
Table 2.1: Relative GDP per capita
1924 1938 1947 1960 1973
NI/UK (where UK=100) 62 52 71 63 73
Source: Kennedy, Giblin and McHugh (1988, p.124-125).

D.P. Jordan
Page 150 of 317
Given Northern Ireland was a region within the UK, its economic performance
might be expected to more closely reflect that of its peers. Nineteenth century
industrialisation meant Northern Ireland shared similar characteristics with other
industrialised UK regions (Ollerenshaw, 1985, p.62). Yet even comparing
unemployment in Northern Ireland against the four worst performing regions in Britain
(North-East England, North-West England, Scotland, and Wales), there is a
divergence in performance which is evident during the 1930s, shown in Figure 2.2.
From the mid-1930s, Northern Ireland did not experience the fall in unemployment
seen in the other regions, and by 1938, Northern Ireland had the highest level of
unemployment. This was higher than at the height of the Great Depression in Northern
Ireland, and saw it surpass Wales, the UK’s previous worst performer. This
unemployment gap, relative to other regions and the UK, persisted post-war.
Source: Mitchell (1988, p.125-126).
Notes: Unemployment data for the insured population unavailable for the regions of Britain between 1940
and 1944 in Mitchell (1988). North-East uses the values for the North-East region from 1923 until 1939,
and the values for the newly created North region from 1945 until 1972.
Manufacturing was the largest source of employment in interwar Northern
Ireland, accounting for over one-third of the working population, and over one-fifth of
0
5
10
15
20
25
30
35
192
31
92
41
92
51
92
61
92
71
92
81
92
91
93
01
93
11
93
21
93
31
93
41
93
51
93
61
93
71
93
81
93
91
94
01
94
11
94
21
94
31
94
41
94
51
94
61
94
71
94
81
94
91
95
01
95
11
95
21
95
31
95
41
95
51
95
61
95
71
95
81
95
91
96
01
96
11
96
21
96
31
96
41
96
51
96
61
96
71
96
81
96
91
97
01
97
11
97
2
%
Figure 2.2: Regional average annual unemployment
North-East North-West Wales Scotland Northern Ireland

D.P. Jordan
Page 151 of 317
the adult population.177 Its performance was therefore important to the overall health
of the regional economy. Unemployment in manufacturing, compared to the overall
insured occupations, was even higher for Northern Ireland relative to Britain, shown
in Figure 2.3. A divergence was again evident post-1934, with manufacturing
unemployment reaching 38 per cent in Northern Ireland in 1938, compared to only 14
per cent in Britain. The poor performance of manufacturing was therefore central to
the regional economy’s poor interwar performance.
Source: For Northern Ireland, Isles and Cuthbert (1957, p.578 and p.586). For the UK, HMSO (1971, p.210-211 & 312-313). Notes: The rate of unemployment in the insured population of Britain was calculated by subtracting the numbers insured and unemployed in Northern Ireland from the UK figures.
Existing literature blames the poor performance of Northern Ireland
manufacturing on an overreliance on the staple industries of textiles and shipbuilding
(Buckland, 1979, Johnson, 1985a). To examine their importance to the structure of
Northern Ireland manufacturing, Figure 2.4 uses data from the Census of Production,
to give each manufacturing sector’s employment as a percentage of total
manufacturing employment. The Census of Production was a survey of manufacturing
firms published at intervals for the whole of the UK, and containing data on areas
177 See Table 2.A.1 in the Appendix.
0
5
10
15
20
25
30
35
40
45
1926
1927
1928
1929
1930
1931
1932
1933
1934
1935
1936
1937
1938
1939
%
Figure 2.3: Interwar unemployment in manufacturing
Great Britain Northern Ireland
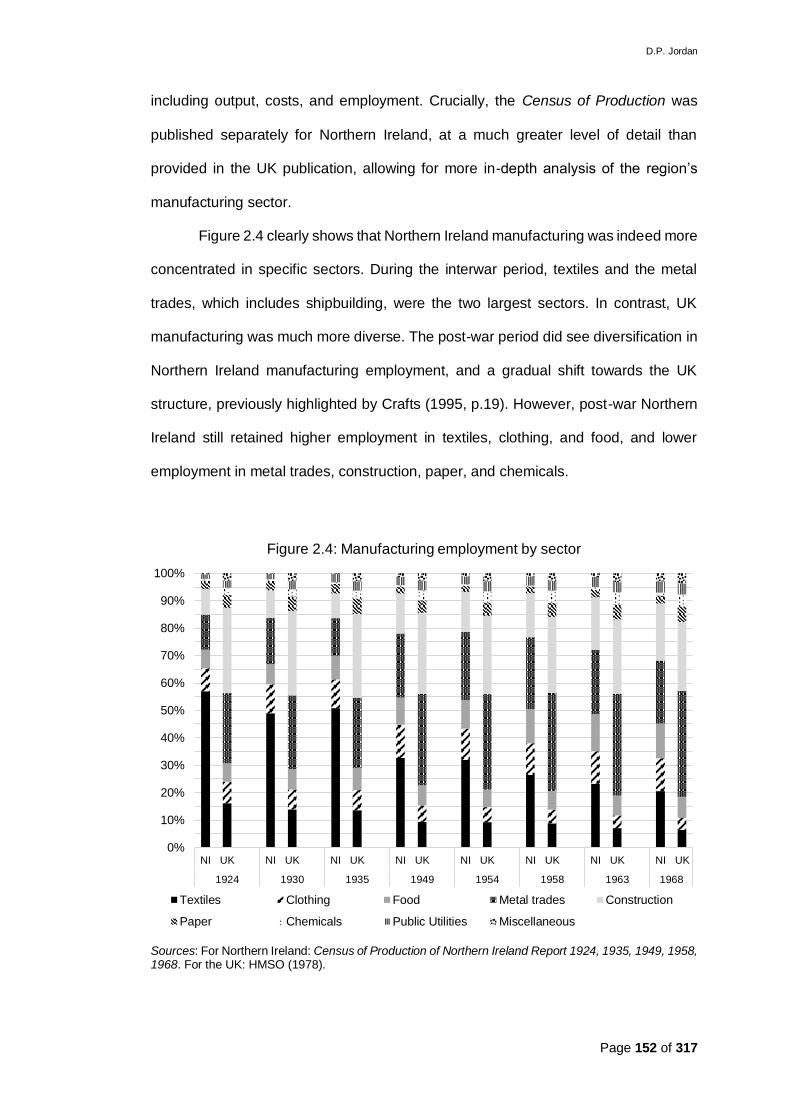
D.P. Jordan
Page 152 of 317
including output, costs, and employment. Crucially, the Census of Production was
published separately for Northern Ireland, at a much greater level of detail than
provided in the UK publication, allowing for more in-depth analysis of the region’s
manufacturing sector.
Figure 2.4 clearly shows that Northern Ireland manufacturing was indeed more
concentrated in specific sectors. During the interwar period, textiles and the metal
trades, which includes shipbuilding, were the two largest sectors. In contrast, UK
manufacturing was much more diverse. The post-war period did see diversification in
Northern Ireland manufacturing employment, and a gradual shift towards the UK
structure, previously highlighted by Crafts (1995, p.19). However, post-war Northern
Ireland still retained higher employment in textiles, clothing, and food, and lower
employment in metal trades, construction, paper, and chemicals.
Sources: For Northern Ireland: Census of Production of Northern Ireland Report 1924, 1935, 1949, 1958, 1968. For the UK: HMSO (1978).
0%
10%
20%
30%
40%
50%
60%
70%
80%
90%
100%
NI UK NI UK NI UK NI UK NI UK NI UK NI UK NI UK
1924 1930 1935 1949 1954 1958 1963 1968
Figure 2.4: Manufacturing employment by sector
Textiles Clothing Food Metal trades Construction
Paper Chemicals Public Utilities Miscellaneous

D.P. Jordan
Page 153 of 317
Table 2.2 compares the overall productivity performance of manufacturing
across the UK. Northern Ireland possessed a persistent productivity gap over time,
averaging only 72 per cent of the UK level for the majority of devolution. In
comparison, England and Wales were around the UK level, with Wales being above
this level post-war, while Scotland was only slightly below the UK level. Northern
Ireland’s productivity gap worsened during the interwar period, being at its greatest
during the 1930s. This reflects the pattern seen for GDP per capita in Table 2.1, and
demonstrates that manufacturing’s performance closely reflected the wider regional
economy. With unemployment in manufacturing significantly higher in Northern
Ireland than the UK, it also suggests this productivity gap was not simply a case of
labour hoarding.
Table 2.2: Relative regional productivity performance of manufacturing
Year Relative net output per person employed (UK=100)
England Wales Scotland Northern Ireland
1924 101 - 97 71
1930 101 - 95 65
1935 101 - 95 66
1954 103 118 93 69
1958 100 118 97 71
1963 100 113 98 76
1968 101 106 95 85
Sources: Census of Production UK Report, 1935, for England and Wales, and Scotland
1924, 1930, and 1935; and HMSO (1978) for England, Wales, and Scotland, 1954, 1958,
1963, 1968. Census of Production of Northern Ireland Report, 1924, 1935, 1949, 1958, 1968,
for Northern Ireland, all years.
Notes: Manufacturing productivity is calculated as net output divided by total persons
employed. England includes Wales for 1924, 1930, and 1935. England and Wales, and
Scotland exclude Construction sector and Government Departments for 1924, 1930, and
1935.
To examine whether Northern Ireland’s persistent productivity gap was simply
a structural story, as argued by the existing literature, Table 2.3 measures the relative
contributions of structure and within-sector productivity to the productivity gap. This is
calculated using the shift-share method described by Hitchens and Birnie (1989a,
p.452). An overall value for manufacturing productivity is calculated by giving each

D.P. Jordan
Page 154 of 317
sector in Northern Ireland the UK level of productivity, but retaining the Northern
Ireland structure of manufacturing. The proportion of the productivity gap which this
closes, reflects the share attributable to within-sector productivity differences. The
remaining productivity gap therefore only reflects what is due to a differing industrial
structure.178
An alternative approach, used by Isles and Cuthbert (1957) and Hitchens and
Birnie (1989a), is to calculate the contribution of structure first. This approach is
attractive for showing what Northern Ireland’s performance would be if it possessed
the UK manufacturing structure. However, the method chosen here, of calculating the
contribution of within-sector differences first, is preferred as it is a counterfactual that
demonstrates the potential for the productivity gap to be closed within sectors, without
requiring a complete change in industrial structure.
The results in Table 2.3 show that, despite variation over time, differences in
within-sector productivity accounted for the majority of the productivity gap, with an
average value of 72.9 per cent, while structure accounted for 27.1 per cent. In 1935,
within-sector productivity is shown to account for 65.6 per cent of the productivity gap,
which is higher than the 45 per cent calculated by Isles and Cuthbert (1957, p.273).
To test if this difference is the result of calculating the contribution of within-sector
productivity first, the calculation is repeated using the alternative approach of Isles
and Cuthbert (1957). While this lowers the contribution of within-sector productivity to
178 This method involves splitting the data contained within the Census of Production into nine sectors, for both the UK and Northern Ireland. This was the lowest level of disaggregation that allows the maximum number of consistently defined sectors, to allow consistent comparisons over time, given the data available. These were: 1.) Textiles, 2.) Clothing, 3.) Food, drink and tobacco, 4.) Metal trades, engineering and shipbuilding, 5.) Construction and extractive industries, 6.) Paper and printing, 7.) Chemicals, 8.) Public utilities, 9.) Miscellaneous. UK sectoral output per person was then weighted by the proportion of total manufacturing employment in that sector in Northern Ireland. These sectoral values were added together to give an overall synthetic value for productivity in Northern Ireland. The difference between this synthetic figure and the actual Northern Ireland figure is then expressed as a percentage of the total gap between overall Northern Ireland and UK productivity. This provides the proportion of the productivity gap due to a within-sector productivity gap, labelled Productivity in Table 2.3. The remaining gap is a result of structural differences between manufacturing in Northern Ireland and the UK, labelled Structure in Table 2.3.

D.P. Jordan
Page 155 of 317
51.5 per cent in 1935, and lowers the within-sector figure in other years, the overall
conclusion still holds: within-sector productivity accounted for the majority of the gap,
with an average of 69.2 per cent.179
Another possible reason for the difference in results compared to Isles and
Cuthbert (1957) may be the differing degree of disaggregation used. Isles and
Cuthbert (1957) use 37 sectors, compared to only 9 sectors in Table 2.3. Having
greater disaggregation may increase the role of structure, as more accurate matching
of industries within sectors will reduce the effect of a higher concentration of low
productivity industries within a sector. However, in order be able to make consistent
comparisons over time, 9 sectors is the lowest possible disaggregation that gives the
maximum number of consistently defined sectors, due to the relatively lower level of
detail published in the interwar editions of the Census of Production.180 While it would
be possible to re-run the calculation in Table 2.3 with a different number of sectors for
179 See Column (2), Table 2.A.2 in the Appendix for the results for individual years using this alternative method. 180 Isles and Cuthbert (1957, p.266 & p.274) note this difficulty in comparing the Census of Production across years due to changes in the classification and grouping of individual industries.
Table 2.3: Relative manufacturing productivity performance
Year
Net output per person
employed, (£, 1972 prices)
Relative output per
person employed
Contribution to the
productivity gap (%)
NI UK NI/UK (UK=100) Within-sector Structure
1924 707.94 992.11 71 76.3 23.7
1930 691.08 1,062.70 65 62.4 37.6
1935 798.65 1,217.94 66 65.6 34.4
1949 1,075.44 1,434.94 75 95.4 4.6
1954 1,125.61 1,624.38 69 80.8 19.2
1958 1,236.75 1,732.33 71 70.1 29.9
1963 1,631.94 2,139.87 76 74.6 25.4
1968 2,197.37 2,597.88 85 58.2 41.8
Sources: For Northern Ireland: Census of Production of Northern Ireland Report, 1924, 1935, 1949,
1958, 1968. For the UK: HMSO (1978).
Notes: Net output converted into 1972 prices using ONS (2004, 2020). For description of method to
calculate within-sector and structural productivity, see text.
D.P. Jordan
Page 156 of 317
each year, the differing degree of aggregation would make it unclear whether any
changes over time were due to the relative contribution of structure and within-sector
productivity, or simply the result of higher or lower disaggregation.
The structural part of the productivity gap in Table 2.3 averaged 27.1 per cent,
and reflected Northern Ireland’s relatively higher concentration in low productivity
sectors, such as clothing, textiles, and construction, and a relatively lower
concentration in high productivity sectors, such as chemicals, paper and printing, and
metal trades.181 The persistence of the productivity gap therefore did partly reflect
industrial structure, as low productivity sectors maintained their share of
manufacturing into the post-war period, and higher productivity sectors failed to grow.
However, Northern Ireland’s productivity gap was not simply the result of this industrial
structure.
This conclusion does need to be treated with care, given the choices made
around method and disaggregation of sectors, as well as the Census of Production
not covering all those employed in manufacturing. For example, the 1935 Census of
Production covered 80 per cent of manufacturing employment in Northern Ireland, but
only 44 per cent of manufacturing employment in Britain (Hitchens, Wagner and
Birnie, 1990, p.288). Yet even with the limitations in how the productivity gap is
measured and attributed, the within-sector productivity gap was at least, if not more,
important than industrial structure.
The within-sector productivity gap was a persistent feature of Northern Ireland
manufacturing throughout devolution. Table 2.4 calculates each sector’s productivity
relative to the UK. It shows that textiles, the largest sector in Northern Ireland
manufacturing, had the greatest productivity gap to the UK, but all sectors possessed
a persistent productivity gap over time. The only significant convergence in within-
sector productivity took place during the 1960s, specifically in the sectors of textiles,
181 See Table 2.B.3 in Appendix.

D.P. Jordan
Page 157 of 317
food, and chemicals. In textiles, this coincides with the arrival of multinational firms,
and the closure of many smaller, family owned firms (Ollerenshaw, 1991). These
productivity improvements also coincide with the introduction of the improved
industrial policy identified by Brownlow (2007).
A reason suggested for Northern Ireland’s productivity gap is the transport
costs associated with peripherality. Buckland (1979) suggests transport costs were
the reason for Northern Ireland manufacturing’s inability to compete with those in
Britain during the interwar period. However, the evidence does not support the
productivity gap being driven by transport costs. Isles and Cuthbert (1957) highlight
the role of transport costs in potentially limiting Northern Ireland’s regional
competiveness, but emphasise other factors as more important. Hitchens and Birnie
(1989b) reject peripherality as an explanation for the post-war productivity gap, using
transport cost data from the post-war Censuses of Production, to demonstrate that
transport costs were not higher. Considering long-run performance, Brownlow (2013,
p.293) argues the “hard peripherality argument does not seem plausible” as an
Table 2.4: Manufacturing productivity by sector (NI/UK where UK=100)
1924 1930 1935 1949 1954 1958 1963 1968
Textiles 74 71 70 72 64 76 78 105
Clothing 73 67 65 72 70 72 71 71
Food, drink & tobacco 79 66 88 83 86 88 93 111
Metal trades, engineering
& shipbuilding 80 87 75 72 76 74 78 76
Construction & extractive
industries 90 91 86 79 76 78 83 85
Paper & printing 78 79 76 69 71 75 70 83
Chemicals 59 76 76 84 78 98 140 164
Public utilities 73 59 61 98 82 85 72 74
Sources: For Northern Ireland: Census of Production of Northern Ireland Report, 1924, 1935, 1949,
1958, 1968; For the UK: HMSO (1978).
Notes: Manufacturing firms categorised under ‘Miscellaneous’ were excluded, as the variation in
firms included, both over time and between Northern Ireland and the UK, made meaningful
comparison impossible.
D.P. Jordan
Page 158 of 317
explanation for Northern Ireland’s poor long-run performance, as Ulster’s prior
industrialisation of the late nineteenth and early twentieth century demonstrated.
To support this conclusion for the interwar period, costs for Northern Ireland
manufacturing are shown to be no higher than those for the rest of the UK. Using data
from the Census of Production, costs can be measured as a percentage of gross
output. While these costs do not reflect the cost of shipping finished goods to their
final destination, they do include the transport costs of raw materials used in the
production of goods, which would lower productivity. These costs were not uniformly
higher in Northern Ireland relative to the UK, whether at the aggregate or
disaggregated level.182 This supports the argument that the direct costs of
peripherality were not to blame for Northern Ireland’s lower productivity.
An explanation of Northern Ireland’s within-sector productivity gap can be
linked to the failure to begin the transition from old, low productivity industries, to new,
high productivity industries. The interwar period was a crucial period, as it saw the
growth of new, high productivity industries in Britain (Richardson, 1961; Aldcroft,
1970). These included man-made fibres in textiles, and electrical engineering in the
metal trades, but Northern Ireland failed to see similar growth within its two largest
manufacturing sectors.
In textiles, the interwar period saw the expansion of high productivity rayon
(man-made fibres) in Britain (Aldcroft, 1970). This expansion began during the 1920s,
with output almost nine times greater in 1929 than 1920, and tripling again between
1929 and 1939, being largely unaffected by the Great Depression (Aldcroft, 1970,
p.188). Man-made fibres were complimentary to the production of other textiles,
allowing otherwise idle mills to mix production with existing fabrics (Aldcroft, 1970,
182 See Table 2.A.4 in the Appendix.

D.P. Jordan
Page 159 of 317
p.188). Man-made fibres was also a much higher productivity industry, with output per
person in 1935 of £928.72, compared to £523.87 in linen.183
Yet the man-made fibres industry failed to develop on any notable scale in
Northern Ireland during the interwar period. By 1935, man-made fibres accounted for
8 per cent of total UK textile employment, employing 81,825 people in Britain.184 This
was larger than linen’s employment of 55,621 in Northern Ireland, where man-made
fibres remained so small that it was only included within the ‘Other textile’ category,
which in total accounted for just 4 per cent of textile employment.185
Table 2.5 shows that the production of man-made fibres remained almost non-
existent in Northern Ireland until after World War Two. This was despite rayon yarn
being able to be spun on existing flax machinery during the war (Beacham, 1944,
p.207). It was the late 1950s and into the 1960s before a fundamental shift towards
man-made fibres occurred, as a result of the arrival and investment of large
multinationals (Ollerenshaw, 1991, p.76). It was this shift which saw productivity in
Northern Ireland textiles surpass the UK level by the end of the 1960s in Table 2.4.
Table 2.5: Proportion of textile output (sq. yds.) in Northern
Ireland by type
Year Linen
(%)
Cotton &
cotton/rayon
mix (%)
Rayon
(%)
Other
materials (%)
1912 100.0 0.0 0.0 0.0
1924 98.5 1.5 0.0 0.0
1937 96.8 3.1 0.0 0.1
1949 54.5 13.0 31.2 1.2
1951 52.9 9.3 36.8 1.0
1954 57.8 11.9 28.3 2.1
1958 53.9 12.7 27.0 6.4
1960 51.8 17.3 23.9 7.0
1961 45.4 20.2 26.8 7.5
Source: Ulster Year Book, 1960-62, p.113
183 For the UK, calculated from UK Report on the Census of Production, 1935. For Northern Ireland, calculated from Census of Production of Northern Ireland Report, 1935. Both converted into 1972 prices using ONS (2004, 2020). 184 Calculated from UK Report on the Census of Production, 1935. 185 Calculated from the Census of Production of Northern Ireland Report, 1935.

D.P. Jordan
Page 160 of 317
Metal trades in Northern Ireland was another sector to miss out on the interwar
growth of new, high productivity industries within the UK, specifically electrical
engineering. By 1935, electrical engineering accounted for 3.2 per cent of total
manufacturing employment in the UK, but accounted for only 0.7 per cent in Northern
Ireland.186 Shipbuilding continued to dominate the metal trades sector in Northern
Ireland, increasing both its level and share of manufacturing employment, from 7,546
workers in 1924 (5.0 per cent), to 12,031 workers in 1935 (9.1 per cent).187 Northern
Ireland also accounted for 14.7 per cent of all UK workers in shipbuilding in 1935,
significantly above its share of UK manufacturing employment of 1.7 per cent.188
Output per person in Northern Ireland shipbuilding was £835.98 in 1935, but output
per person in UK electrical engineering was much higher at £1,246.55.189
This inability to shift away from low productivity industries towards new, high
productivity areas, ensured Northern Ireland’s productivity gap to the UK persisted.
The interwar period laid the foundations for the growth of these new industries post-
war, but Northern Ireland missed out on this crucial phase, despite having a high
concentration in the industrial sectors which would successfully transition in Britain.
The existing narrative for Northern Ireland focuses on falling global demand in the
staple industries as explaining Northern Ireland’s poor interwar performance.
However, this explanation ignores crucial aspects of the supply-side of the regional
economy. Northern Ireland’s productivity gap was not simply structural: there were
significant within-sector productivity failings too. Examining the role of regional
institutions demonstrates their contribution to these failings.
186 Calculated from UK Report on the Census of Production, 1935, and the Census of Production of Northern Ireland Report, 1935. 187 Calculated from the Census of Production of Northern Ireland Report, 1935. 188 Calculated from the Census of Production of Northern Ireland Report, 1935. 189 For the UK, calculated from UK Report on the Census of Production, 1935. For Northern Ireland, calculated from Census of Production of Northern Ireland Report, 1935. Both converted into 1972 prices using ONS (2004, 2020).
D.P. Jordan
Page 161 of 317
4) Regional institutions
The interwar period provides an opportunity to examine how regional institutions
affected the operation of industrial policy in Northern Ireland. Institutions are key to
explaining trends in long-run economic growth (North, 1990), and explain the UK’s
relatively poor interwar productivity performance (Broadberry and Crafts, 1992;
Broadberry, 1997). Regional institutions have been suggested as a possible
explanation of Northern Ireland’s long run productivity gap (Hitchens and Birnie,
1989a; Crafts, 1995; Brownlow, 2007, 2013), but how business interests were able to
affect Stormont’s industrial policy has not been demonstrated. The interwar period
allows this to be examined, showing how existing firms had both the means and
motive to influence regional industrial policy for their own benefit, and create barriers
to productivity growth. This highlights the potential restrictions on the successful
implantation of efficient regional industrial policy.
The 1920 Government of Ireland Act partitioned the island of Ireland, creating
a subnational government for Northern Ireland at Stormont. Responsibility for
industrial policy was amongst the powers transferred to Stormont.190 Although after
1939, and following the Northern Ireland Transport Board affair, Westminster did
begin to gain control over Stormont’s expenditure,191 prior to this it was unable to
impose any direct constraints on Stormont’s industrial policy.
The Unionist Party dominated the subnational institutions at Stormont, with no
realistic expectation of an alternative government being formed (Brownlow, 2007,
p.74). A potential negative consequence of fiscal decentralisation is that the feedback
loop between the electorate and the subnational government is weakened (Weingast,
2014, p.17). With no electoral competition, the incentive for the Unionist government
at Stormont to align industrial policy with the electorate’s preferences, rather than its
own, or those of special interest groups, was weakened. The interwar period was also
190 For a full overview of the distribution of fiscal powers, see Chapter 1. 191 See Section 7 of Chapter 1.

D.P. Jordan
Page 162 of 317
characterised by a softening of the budget constraint faced by Stormont, discussed in
Chapter 1. This situation can lead to rent seeking, subsidies for uncompetitive
enterprises, and benefits conferred upon special interest groups (Weingast, 2009).
While second generation fiscal federalism emphasises how the benefits of
fiscal decentralisation may fail to be realised (Oates, 2005, Weingast, 2009), regional
institutions are not always harmful for productivity growth. Interwar Northern Ireland
can be compared against the successful regional institutions described by Lamoreaux
et al. (2006), of Cleveland, USA, during the second industrial revolution.192 They
shared strong similarities: they were regions situated a significant distance from
capital markets, with strong industrial histories, and characterised by relatively small
enterprises. However, Cleveland’s institutions promoted transition into higher
productivity areas of manufacturing, through the application of new technology
(Lamoreaux et al., 2006). High rates of formation of new firms provided technological
leadership, with nodal firms spawning clusters of innovative enterprises (Lamoreaux
et al., 2006). This was a result of local enterprises serving as hubs of overlapping
networks between business and finance, allowing new technologies to be financed
and commercialised, often facilitated by family connections (Lamoreaux et al., 2006).
The characteristics of these overlapping networks provides the key difference
between Cleveland and Northern Ireland. In Cleveland, these were virtuous in nature
for productivity growth, as the strongest connections were between business and
sources of finance, with these promoting the growth of new, higher productivity
industries. Institutions in Northern Ireland were instead vicious in nature for
productivity growth, with strong overlapping networks between business and politics,
giving firms the means to influence subnational policy in order to receive benefits,
creating barriers to productivity growth.
192 Table 2.A.5 in the Appendix provides this comparison as a table.
D.P. Jordan
Page 163 of 317
The vicious nature of these institutions for productivity growth was the result
of two key differences between Stormont and Westminster. The first difference was
the electoral dominance of the Unionist Party. The lack of electoral competition
weakened the incentive to align industrial policy with the preferences of voters more
widely. The primary political motivation of the Unionist government was the
maintenance of the Union, (Buckland, 1979, p.12), with Ministers sensitive to any form
of criticism, particularly from within Unionism (Buckland, 1979, p.14). Thus Stormont’s
economic policies prioritised the political objective of maintaining the Unionist Party’s
electoral support, rather than society’s total welfare or long-run economic growth. The
fiscal structure of subnational government also ensured Stormont was not rewarded
for policies which promoted long-run economic growth.193 Instead, Stormont faced the
incentive to focus purely on preserving short-run employment, as by lowering
expenditure on unemployment benefits, it would maximise the politically symbolic
Imperial Contribution, but without any consideration of the economic value or
productivity of this employment.194 This desire to use policy interventions to maximise
electoral support by prioritising employment, aligned with the preferences of the old,
staple industries, which provided the majority of this employment.
The second difference was the strength of the links between the ruling Unionist
Party and the business community, particularly the old, staple industries. Table 2.4
outlines the business interests held by Unionist MPs and members of the government
between 1921 and 1945. Being a Stormont Minister was viewed as a part-time
occupation, and Ministers did not have to give up their business interests on entering
office (Birrell and Murie, 1980, p. 40). This meant that over one-third of both MPs and
193 This is not a situation unique to Northern Ireland, and is highlighted by Weingast (2009) as a possible downside of subnational government. 194 Stormont’s revenue and expenditure were dependent on the number of people in employment, not the value of their employment. Thus greater employment meant less expenditure on unemployment benefits, and more revenue to pay the Imperial Contribution, a charge on Northern Ireland to cover the cost of Excepted and Reserved expenditure by Westminster. This was a politically symbolic payment for Unionism. Therefore, it was more important to maximise the number of people in employment, rather than consider how valuable this work was to the regional economy.

D.P. Jordan
Page 164 of 317
Cabinet members recorded a direct business interest. Of MPs with direct business
interests, over one-third of these were in textiles. This reflected the concentration of
linen’s interests in Northern Ireland society’s elite, and most obviously manifested
itself in Stormont’s Minister of Commerce between 1925 and 1941, John Barbour,
who was in charge of industrial policy, but also the managing director of several textile
firms.195 The Northern Ireland system of devolved government was also renowned for
providing easy access to government Ministers (Brownlow, 2012, p.294), with the
accessibility of Ministers making them responsive to the lobbying of special interest
groups (Buckland, 1979, p.17). Together with the electoral dominance of the Unionist
Party, the strong connections between politics and local business gave existing firms
the means to influence Stormont’s industrial policy.
Table 2.4: Business interests of Stormont Unionist MPs 1921-1945
%
Unionist MPs as a proportion of all Stormont MPs (average) 70.8
Unionist MPs holding company directorships or ownership 38.5
Members of Cabinet holding company directorships or ownership 40.0
Unionist MPs with interests in textiles as a proportion of all those
with business interests
37.1
Sources: Constructed using Harbinson (1974) and Birrell and Murie (1980).
Notes: Methodology based on Brownlow (2007).
The electoral dominance of the Unionist Party, and strong links with the
business community, also had implications for the quality of decision-makers at
Stormont. With the Unionist Party in power throughout the interwar period, there was
little turnover in government Ministers, with only 12 individuals serving in the Stormont
Cabinet between 1921 and 1939 (Buckland, 1979, p.10). The Northern Ireland Prime
Minister, James Craig, was in office from 1921 until his death in 1940; the Minister of
Commerce, John Barbour, was in office from 1925 until 1940; the Minister of Labour,
John Andrews, was in office from 1921 until 1940; and the Minister of Finance, Hugh
195 See Harbinson (1974) for a detailed list of MPs business interests.

D.P. Jordan
Page 165 of 317
Pollock, was in office from 1921 until 1935.196 With a high average age, and a strong
background in Ulster Unionist resistance to Home Rule, Ministers had “limited vision
and a defensive political stance” (Buckland, 1979, p.12). This “dearth of political talent
and unwillingness to take a broad view”, saw leaders “slow to subordinate personal
and local interests in order to devise well-considered policies” (Buckland, 1981, p.24-
25). A lack of turnover in Ministers therefore saw these views and preferences
ingrained into subnational policymaking, with short-term political motivations, rather
than long-run economic considerations, being prioritised in Stormont’s decision
making.
Not only did existing firms have the means to influence Stormont’s industrial
policy for their own benefit, they also had the motivation to do so. Stigler (1971) and
North (1990) discuss how existing firms may create barriers to productivity growth.
Firms make a decision on whether to invest in skills and knowledge, or devote
resources to changing the institutional constraints they face (North, 1990, p.79). If the
expected payoff from changing institutions is greater than investing in skills and
knowledge, and if firms have sufficient influence, they will use the polity to change
institutions (North, 1990, p.79). This leads to industry acquiring regulation designed
and operated primarily for its own benefit (Stigler, 1971, p.3). In the case of Northern
Ireland, the staple industries were facing falling global demand for their products
during the interwar period. Falling demand reduced the expected payoff from
investing in skills and knowledge, increasing the relative expected payoff from
changing institutions to acquire benefits. It was therefore in their interest to engage in
rent seeking behaviour to try and acquire financial benefits, which would keep them
in business.
This context provides the institutional framework to understand how barriers
to productivity growth were created on the supply-side of the Northern Ireland
196 See Harbinson (1974) for a detailed list of Stormont MPs and their positions in government.

D.P. Jordan
Page 166 of 317
economy. The strong overlapping networks between politics and business gave firms
the means to acquire benefits from Stormont, while the external market conditions of
falling demand provided the motivation to do so. The politically well-connected firms
were from the old, staple industries, where falling global demand was most acute
during the interwar period. They were also the largest employers within
manufacturing, making it in Stormont’s interest to preserve the employment they
provided, given the large financial burden unemployment placed on the subnational
government’s finances. Existing firms therefore had both the means and motive to
engage in rent seeking behaviour: they now just required the opportunity.
D.P. Jordan
Page 167 of 317
5) Survival of old industries
Northern Ireland was heavily reliant on the old, staple industries of textiles and
shipbuilding for employment during the interwar period. Existing literature blames their
poor performance on falling global demand. However, firms within textiles and
shipbuilding failed to move into new, higher, productivity areas. This failure to improve
within-sector productivity was not simply the result of poor trading conditions. This
section describes how in textiles, shipbuilding, and smaller industries, regional
institutions allowed existing firms to influence devolved industrial policy, and receive
government subsidy. This aided their short and medium-run survival, but helped lock
the Northern Ireland economy into a low wage-investment-productivity equilibrium.
(i). Textiles
Textiles was the largest manufacturing sector in interwar Northern Ireland, accounting
for around half of manufacturing employment, and around two-thirds was female.197
This made the fortunes of the textile industry important for many households. Linen
accounted for the vast majority of textile employment, at over 80 per cent during the
interwar period.198 Linen was also the most geographically dispersed manufacturing
industry in Northern Ireland (Isles and Cuthbert, 1957, p.114). No other manufacturing
industry could match linen on either scale or geographic dispersion. The second
largest sector of metal trades, which included shipbuilding and engineering, was
almost exclusively found in and around Belfast.199 Even by the 1950s and 1960s, linen
still retained firms from at least one stage of production in every county of Northern
Ireland (Steed, 1971).200
197 Female employment calculated as an interwar average, equalling 67%, from the Census of Production of Northern Ireland Report, 1924, 1930 and 1935. 198 Calculated from the Census of Production of Northern Ireland Report, 1924, 1930 and 1935. See Table 2.A.6 in the Appendix. 199 See Ulster Year Book, 1938, p.81-82 200 This was post-war, when rationalisation saw the disappearance of a number of smaller linen firms (Ollerenshaw, 1991), meaning the interwar geographic dispersion would have been at least as great.

D.P. Jordan
Page 168 of 317
The linen industry in Northern Ireland shared similar characteristics with both
the cotton and wool industries in Britain. Linen exported the majority of its output
(Beacham, 1944, p.201), as did cotton and wool (Bowden and Higgins, 2003). Small
firms dominated cotton and wool (Bowden and Higgins, 2015, p.226), as well as linen
(Beacham, 1944; Ollerenshaw, 1991). Firms in cotton were publicly owned, but the
majority were privately owned in both wool (Bowden and Higgins, 2003) and linen
(Ollerenshaw, 1991).
Wool performed well during the interwar period, as a result of specialising in
high quality, niche products, allowing it to retain and develop markets (Bowden and
Higgins, 2003, p.381-382). However, cotton saw exports suffer (Bowden and Higgins,
2015), with linen more closely reflecting this experience. Linen shifted towards
coarser yarns and cheaper piece goods, as a direct consequence of tough trading
conditions (Beacham, 1944, p.202). Both cotton and linen saw their output fall
substantially between 1912 and 1937, as shown in Table 2.5, although the exogenous
demand shock was much greater for cotton, which saw output fall much further than
for linen.
Table 2.5: Comparison of changes in output, capital, and employment, 1912-1937
Linen
Northern Ireland
Cotton
Britain
1912 1937 Change
(%) 1912 1937
Chang
e (%)
Output
(million sq. yards) 204 161.5 -20.8 8,453 3,806 -55.0
Spindles 926,000 870,000 -6.0 563,000,000 386,000,000 -31.4
Looms 34,000 28,000 -17.6 786,000 485,000 -38.3
Employment 77,375 61,900 -20.0 621,500 359,700 -42.1
Spindles per
person 12.0 14.1 +17.4 90.6 107.3 +18.5
Looms per person 0.44 0.45 +2.9 1.26 1.35 +6.6
Sources: Constructed using Beacham (1944) for linen in Northern Ireland, Singleton (1986) for
cotton in Britain.
Cotton suffered from prolonged levels of excess capacity during the interwar
period (Bowden and Higgins, 2015, p.229). Linen shared this problem, with an

D.P. Jordan
Page 169 of 317
average of 44 per cent of spindles, and 43 per cent of looms, idle between 1921 and
1928 (Ollerenshaw, 1991, p.66). The spinning and weaving sections were 17 per cent
and 20 per cent below maximum employment respectively during the mid-1930s
(Beacham, 1944, p.200). Unlike cotton, where the Lancashire Cotton Corporation
(LCC) was established in 1929 to reduce excess capacity, (Bowden and Higgins,
2003, p.392), linen did not benefit from similar measures. Therefore, while both cotton
and linen saw capital and employment levels fall between 1912 and 1937 in Table
2.5, capital per worker in cotton improved relative to linen. Linen firms failed to
increase their relative capital intensity, retaining much higher levels of labour input.
This failure of linen firms to become more capital intensive in the face of falling
demand, reflects their ability to pursue a successful survival strategy reliant on varying
labour inputs. This survival strategy was facilitated by high sunk costs and abundant
cheap labour, reinforced by satisficing behaviour.
In cotton, firms focused on short-run survival rather than long-run change, as
a response to uncertainty over when conditions would improve (Bowden and Higgins,
2003, p.397). Cotton firms had incurred high levels of debt following the 1919-20 re-
floatation boom (Bowden and Higgins, 2015). This high level of sunk costs meant the
exit process did not operate effectively, as exit would require owners to forgo any
opportunity to recoup their investment, should the trading environment improve
(Bowden and Higgins, 2003, p.397). Firms were able to survive, but the sector was
locked into low productivity.
Linen firms faced similar sunk costs in machinery, but were able to pursue this
survival strategy more effectively, as they were privately owned, without the debt
problems of cotton. Linen firms relied on cheap, unskilled labour (Isles and Cuthbert,
1957), meaning in the face of uncertainty, linen firms could adopt a short-run survival
strategy of varying labour inputs. Evidence for this is shown in Figure 2.5. Throughout
D.P. Jordan
Page 170 of 317
the interwar period, unemployment in linen follows a clear cyclical pattern.201 The
importance of this to the linen industry has not been previously identified by either
Beacham (1944) or Steed (1971). It suggests firms were not labour hoarding, but
instead hiring and firing as required, thanks to a large, cheap, unskilled labour source.
This suggests that linen firms faced an almost perfectly elastic labour supply
curve, which can be formally modelled using the Lewis Model, shown in Figure 2.6.
This is based on Lewis (1954), Ranis and Fei (1961) and Stafford (1981). In this
model, workers transfer from a labour intensive sector, in this case agriculture, to a
more capital intensive industrial sector, in this case linen. Employment in agriculture
was much higher in Northern Ireland than Britain,202 and farms in Northern Ireland
tended to be smaller and family owned.203 This supports the assumption that
agriculture provided an unlimited supply of labour for the industrial sector. Linen firms
therefore initially faced a perfectly elastic labour supply curve (S), shown in Figure 2.6
by S, allowing expansion until L1 without driving-up wages (W). Beyond L1, agricultural
surplus is declining, as further reductions in labour affect output. This causes prices
to rise, and thus the labour supply curve steepens.
Linen’s demand curve for labour (D1) is the marginal product of labour, with
the profit maximising level of employment being where D1 intersects S. As firms make
profits, they invest in capital, raising the marginal product of labour, and causing the
demand curve to move outwards, with the process continuing until D2. At this
equilibrium, the reserve of surplus labour in agriculture is exhausted, and labour
employed in linen has reached L2, with wages in both sectors equal to their marginal
products. Capital accumulation is therefore key to shifting the demand curve outwards
and improving productivity.
201 The number of insured workers in linen fell by 11 per cent between 1924 and 1939, but only gradually. This means the changes in unemployment were not the result of dramatic fluctuations in the total number of insured employees. 202 See Table 2.A.1 in the Appendix. 203 Ulster Year Book, 1938, p.39.

D.P. Jordan
Page 171 of 317
Source: Calculated using Isles and Cuthbert, 1957, p.578 and p.583.
Notes: The per cent unemployed is for insured workers in linen for July each year. While the number of
unemployed amongst insured workers is available on a monthly basis, the total number of insured
workers is only available for July.
Figure 2.6: Industrial sector labour market
Table 2.6: Relative wages in textiles
Year Average annual wage per operative (£) Relative wage per operative
NI UK NI/UK (UK=100)
1930 340.01 457.27 74
1935 347.61 482.56 72
Source: For Northern Ireland: Census of Production of Northern Ireland Report 1930, 1935; For
the UK: Report on the Census of Production of the UK 1930, 1935.
0
10
20
30
40
50
60
192
3
192
4
192
5
192
6
192
7
192
8
192
9
193
0
193
1
193
2
193
3
193
4
193
5
193
6
193
7
193
8
193
9
194
0
194
1
194
2
194
3
194
4
194
5
194
6
194
7
194
8
194
9
195
0
195
1
195
2
195
3
%
Figure 2.5: Linen unemployed

D.P. Jordan
Page 172 of 317
Wages in textiles were lower, and grew more slowly, in Northern Ireland than
in the UK, as shown in Table 2.6.204 This supports the demand curve for labour being
on the more elastic part of S for linen firms in Northern Ireland. This is demonstrated
by DNI relative to DGB in Figure 2.6. With the profits of textiles in Northern Ireland being
squeezed by falling demand, this left less money available for investment. This is
reflected by interwar productivity for textiles, which was much lower in Northern
Ireland than Britain. Without money available to invest in capital, DNI would not shift
outwards, and the capital investment necessary to transition into higher productivity
man-made fibres would not occur. Instead, DNI would remain on the elastic portion of
S, with no upward pressure on wages, thanks to a surplus of unskilled labour. Firms
could survive without investment in capital, thanks to excess capacity in textiles
allowing cannibalisation of spare machinery, a common occurrence in textiles during
the interwar period (Sandberg, 1974, p.130).205 Therefore, with falling demand, an
elastic labour supply curve, and with little profits for capital investment linen, firms
were able to survive by competing on costs, and varying labour inputs to reduce these
costs in the short-run.
The incentives created by the supply-side conditions linen firms faced were
reinforced by their own satisficing behaviour. Satisficing is where firms set themselves
a minimum acceptable level of achievement (Simon, 1959). Owner-controlled firms
are more likely to display satisficing behaviour (Hornby, 1995), and family owned firms
dominated the linen industry in Northern Ireland (Ollerenshaw, 1991, p.65).206
Qualitative evidence from Beacham (1944) and Ollerenshaw (1991) supports the view
that linen firms displayed satisficing, rather than profit maximising, behaviour, and this
204 Wages for unskilled workers in Northern Ireland were lower than those in Britain (Isles and Cuthbert, 1957, p.219). 205 Even where firms did close, remaining firms would have been able to buy their machinery at potentially low cost, as occurred during the 1950s when the textile industry rationalised. See Bew, Gibbon, and Patterson (2001, p.108). 206 The ratio of paid-up capital in private to public firms was two-to-one even by the 1950s (Ollerenshaw, 1991, p.65).
D.P. Jordan
Page 173 of 317
aided their ability to persevere in the face of falling demand. Beacham (1944, p.205)
describes how small linen firms had been “handed down from father to son, and their
present owners are content to work with a very small return to their labour and capital
rather than abandon a business which is their sole and only likely source of income”.
They survived adverse market conditions by paying lower wages, producing inferior
goods, and selling below the costs of production (Beacham, 1944, p.205).
Ollerenshaw (1991, p.65) describes how with few alternatives, “the temptation to plod
on regardless was one to which most firms succumbed”. Owners cared little about
long-run performance, lacked interest in technological innovations which would
improve productivity, had little knowledge about costs, and were content to follow the
status-quo (Ollerenshaw, 1991). The characteristics of the owners of linen firms, who
were also their managers, therefore facilitated their survival.
The importance of management to firm performance is a contemporary issue
for Northern Ireland’s economy. Bloom and Van Reenen (2010) demonstrate a
management gap exists in firms today in Northern Ireland relative to Britain, negatively
affecting productivity and firm performance, and that owner-controlled firms are on
average more badly managed than other ownership forms. The evidence from linen
firms during the interwar period therefore suggests this is a long-run problem within
the Northern Ireland economy.
With linen firms adopting a survival strategy reliant on cost competition and
cheap labour, without investment in capital, it became locked in a low-wage-
investment-productivity equilibrium. The incentives created by the supply-side and
firm characteristics were reinforced by Stormont’s industrial policy. First generation
fiscal federalism suggests a subnational government should be best placed to solve
a regional market failure (Weingast, 2009; Vo, 2010). However, with little expected
payoff from investment in skills and knowledge, it increased the relative return to firms
of changing institutions for their own benefit. This was facilitated by linen’s strong
overlapping networks with Stormont. With over a third of Unionist MPs having

D.P. Jordan
Page 174 of 317
business interests connected to textiles, including the Minister of Commerce, who was
in charge of industrial expenditure, it ensured government was more receptive to
providing financial assistance.
The ability of linen firms to change institutions for their own benefit is
demonstrated by their receiving most of Stormont’s direct industrial expenditure
during the interwar period, as shown in Figure 2.7. Although this expenditure was
intended to promote research and development through the Linen Industry Research
Association (LIRA),207 the vast majority went on advertising for the industry, of no
benefit to productivity. Advertising accounted for the majority of expenditure on linen
every year from 1926 to 1931, reaching 84 per cent of total expenditure in 1931, and
only halting temporarily between 1932 and 1936, before continuing until 1941. Linen
thus exploited its strong overlapping networks with Stormont to receive government
subsidy, at a time when the industry was in decline. The opportunity cost of this
expenditure is evident in Figure 2.7. Expenditure on linen dwarfed that under the New
Industries Acts of the 1930s (discussed further in Section 6). Diverting Stormont’s
limited financial resources towards advertising for the linen industry, meant less
money available for supporting new, higher productivity industries.
Source: Northern Ireland House of Commons Papers, Appropriation Accounts.
Notes: Expenditure converted to 1972 prices using ONS (2004, 2020).
207 LIRA was formed in 1919 to promote co-operative research in industries where individual firms were perceived to lack necessary facilities (Ollerenshaw, 1991, p.68-69).
0
20
40
60
80
100
120
192
2
192
3
192
4
192
5
192
6
192
7
192
8
192
9
193
0
193
1
193
2
193
3
193
4
193
5
193
6
193
7
193
8
193
9
194
0
194
1
194
2
194
3
194
4
194
5
£'0
00s (
1972 p
rices)
Figure 2.7: Stormont industrial expenditure
Linen Ulster Industries Development Association New Industries Acts

D.P. Jordan
Page 175 of 317
(ii). Shipbuilding
While linen received the majority of Stormont’s direct industrial expenditure, Northern
Ireland’s other main staple industry, shipbuilding, received even greater indirect
financial support. In Britain, Westminster introduced a series of Trades Facilities Acts
from 1921 until 1927. These were to assist export industries during a period of
relatively high interest rates, with £35 million of the £74.3 million in guarantees going
to shipbuilding (Aldcroft, 1970, p.347). Under the Acts, Westminster guaranteed loans
taken out by private firms, lowering their cost of borrowing, and encouraging the
placement of orders with firms, particularly shipbuilding. While there was no legal
barrier to Northern Ireland firms applying to the Westminster scheme,208 industrial
policy was a transferred matter, and Stormont adopted very similar legislation in 1922
with the Loans Guarantee Acts. These saw Stormont become the guarantor for loans
made in Northern Ireland, particularly for shipbuilding (Buckland, 1979, p.116). The
justification given by Stormont for introducing its own guarantees for loans to firms,
despite the Trades Facilities Acts applying to the whole of the UK, was the view that
applicants from Britain might receive preferential treatment by Westminster over those
from Northern Ireland.209 While Westminster’s primary motivation was to reduce the
cost of borrowing for firms, Stormont’s was employment: “the intention of the Loans
Guarantee Acts was to cover works of new construction involving the creation of
employment in Northern Ireland”.210
Stormont extended the Loans Guarantee Acts annually until 1938, eleven
years after the similar legislation ended in Britain. It almost exclusively prioritised
shipbuilding during this time. Of the 37 guarantees made by Stormont, 26 were for
shipbuilding, which received £21.9 million, or 98 per cent of the total value of
208 See TNA: T 190/26, Letter from Spender to Upcott, 16th February 1926. 209 TNA: T 190/26, Letter from Spender to Upcott, 16th February 1926. 210 PRONI: FIN/18/17/371: Unemployment Inter-Departmental Committee, Legislative proposals arising out of Committee’s Report amending New Industries (Development) Bill No.2, Minutes to Minister, 17th August 1937.

D.P. Jordan
Page 176 of 317
guarantees.211 Given average interwar employment in Northern Ireland shipbuilding
was 9,820, compared to 109,293 for Britain, Stormont’s guarantee per worker was
significantly more generous, at £2,230, compared to Westminster’s £320 per
worker.212
Shipbuilding in Northern Ireland was able to receive this significant financial
support as a result of its overlapping networks with Stormont. Stigler (1971) predicts
that the distribution of benefits from government to industry is not proportional to an
industry’s size, but to its political influence, and whether the number of beneficiaries
is limited. Shipbuilding did not employ as many workers as linen, but compared to
linen’s multitude of small, family owned firms, where it was more difficult to restrict the
number of beneficiaries, shipbuilding had strong political connections concentrated in
just two firms: Harland & Wolff, and Workman, Clark & Co. In the face of falling
demand, shipbuilding was able to leverage its overlapping networks to receive
subsidy, helping it survive, while aligning with Stormont’s priority to preserve
employment.
The idea of Stormont replicating Westminster’s legislation was proposed by a
businessman with strong political connections: Viscount Pirrie, Chairman of Harland
& Wolff, Northern Ireland’s largest shipbuilder.213 Viscount Pirrie was even given the
opportunity to vet the ministerial speech which introduced the legislation (Buckland,
1979, p.116). Under the Loans Guarantee Acts, the Minister of Finance nominated an
Advisory Committee, composed of “prominent business men”, who recommended the
terms of any guarantee.214 These overlapping networks gave industry the opportunity
to influence the destination of government support, distorting the allocation of
211 The total guaranteed by Stormont under the Loans Guarantee Acts (Northern Ireland) 1922-1938 was £22,455,521. See Loans Guarantee Acts (Northern Ireland) 1922-1938, H.C. 654, 1945 212 Calculated as an average of employment for both the UK and Northern Ireland, taken from the Report on the Census of Production, 1924, 1930, and 1935. 213 PRONI: FIN/30/D/72: Notes on the administration of the Loans Guarantee Acts (Northern Ireland), 1922-1933. See also Buckland, 1979, p.116. 214 PRONI: FIN/30/D/72: Notes on the administration of the Loans Guarantee Acts (Northern Ireland), 1922-1933.

D.P. Jordan
Page 177 of 317
resources in the regional economy, and creating barriers to productivity growth by
restricting the opportunity for structural change.
The priorities of industry were therefore able to influence the allocation of
financial resources. This was harmful for economic efficiency in two ways. Firstly, the
opportunity cost of Stormont’s expenditure on shipbuilding was the redirection of
limited financial resources away from employment in other industries. Over the life of
the Loans Guarantee Acts, Stormont had to pay a total of £4.6 million, to cover loans
it had guaranteed, as a result of either orders for ships falling through, or firms going
bust.215 Policymakers were aware of this opportunity cost. In 1937, the Northern
Ireland Civil Service noted that a guarantee to a non-shipbuilding firm for £16,000 had
“probably by now operated to relieve the [Stormont] Exchequer to an extent greater
than the relief from unemployment benefit obtained from the construction of a of a
£1,000,000 liner”.216 While Stormont’s priority during the interwar period was to
preserve and increase employment levels, the guarantees made to shipbuilding were
an inefficient policy intervention to achieve this goal. Instead, they reflected a well-
connected industry’s ability to capture government subsidy.
Secondly, the extended implementation of the Loans Guarantee Acts in
Northern Ireland coincided with a decline of productivity in shipbuilding. Table 2.7
compares the interwar levels of gross output, costs, and net output in shipbuilding in
Northern Ireland and the UK. In 1924, costs were equal, and net output per person in
Northern Ireland was higher than the UK. However, by 1930, despite a relative rise in
gross output for Northern Ireland, costs had risen further, reducing net output per
person to 20 per cent below the UK level, a situation repeated in 1935. While subsidy
from Stormont helped prevent unemployment in shipbuilding being higher than it
215 This broke down into £3.4 million to cover the loan capital, and £1.2 million to cover interest charges. See Loans Guarantee Acts (Northern Ireland) 1922-1938, H.C. 654, 1945. 216 PRONI: FIN/18/17/371: Unemployment Inter-Departmental Committee, Legislative proposals arising out of Committee’s Report amending New Industries (Development) Bill No.2, Minutes to Minister, 17th August 1937.

D.P. Jordan
Page 178 of 317
might otherwise have been, it had reduced the competitive pressure to cut costs,
harming productivity.
Table 2.7: Shipbuilding output and costs, where NI/UK (UK=100)
Year Gross output per
person employed
Costs as a per cent of
gross output
Net output per
person employed
1924 113 100 113
1930 117 125 80
1935 109 121 80
Source: For Northern Ireland: Census of Production of Northern Ireland Report 1924, 1930, 1935.
For the UK: Report on the Census of Production of the UK 1924, 1930, 1935.
(iii). Smaller industries
Outside of linen and shipbuilding, smaller industries received much more limited
financial support. This reflected their industry characteristics, as suggested by Stigler
(1971), given their relatively small size, and absence of ability to restrict the number
of beneficiaries from support. However, in their own more modest way, they
maintained and strengthened their overlapping networks with Stormont, changing
institutions for their own benefit where possible, but remaining of secondary
importance to the big two staple industries.
In 1929, Stormont helped fund the establishment of the Ulster Industries
Development Association (UIDA), an arm’s length body intended to promote domestic
consumption of Northern Ireland manufactured goods, particularly for smaller
sectors.217 Its creation was a response to increasing pressure for Stormont to respond
to the high unemployment of the late 1920s, particularly from local chambers of
commerce.218 Stormont did not want to give local chambers of commerce these new
responsibilities, believing they would oppose firms which competed against their
217 See Ulster Year Book, 1938, p.87 218 PRONI: COM/63/1/232: Attraction of New Industries to Northern Ireland, Ulster Industries Development Association, letter from the Association of Northern Ireland Chambers of Commerce, 6th February 1929.

D.P. Jordan
Page 179 of 317
own.219 However, a single body in the form of the UIDA maximised Stormont’s control
and oversight. Stormont funded the UIDA, as shown in Figure 2.7, but this was on a
much smaller scale than for linen, reflecting the more limited influence of smaller
industries.
Part of the UIDA’s remit was to attract new industrial undertakings to Northern
Ireland, but there is no evidence the UIDA was successful in this. Although it raised
the idea of growing the man-made fibre industry in Northern Ireland, this was rejected
by the Ministry of Commerce, which felt it was more important to keep “existing
factories going full time rather than developing new ones”.220 In reality the UIDA
focused its activities on “the practical interpretation of the slogan, ‘Push Ulster
Goods’”, allocating its funding to advertising and publicity.221 This reflected an attempt
to engage in the kind of restrictive practices which were occurring in Britain during the
interwar period, but on a much smaller scale, but its success appears to have been
limited.
The main benefit of the UIDA to smaller industries was non-financial, giving
them direct access to Stormont Minsters. The President of the UIDA was appointed
to the Advisory Committee for Stormont’s New Industries Act of 1932, giving it
influence over which applicants would receive financial support, or perhaps more
importantly, blocking financial support being given, as discussed in Section 6.
Ultimately the limited extent of smaller industries’ influence over Stormont’s policy was
clear, and reflected their size. The UIDA’s President blamed the organisation’s lack
of success on the Ministry of Commerce, who favoured linen and shipbuilding, and
showed a disinterest towards Northern Ireland’s smaller industries.222
219 PRONI:COM/63/1/232: Attraction of new industries to NI, Ulster Industries Development Association, Letter to the Prime Minister’s Secretary, 17th April 1929. 220 PRONI:COM/63/1/232: Attraction of new industries to NI, Ulster Industries Development Association, Meeting of the new industries committee, Ulster Industries Development Association, 2nd December 1929. 221 Ulster Year Book, 1935, p.74 222 PRONI: CAB/9F/126/1: Attraction of New Industries to NI, Letter sent to the Minister of Commerce by J. Cleland, President of the UIDA, 26th November, 1937.

D.P. Jordan
Page 180 of 317
6) Barriers to new industries
The existing explanation for the failure of Stormont’s interwar industrial policy is that
there was simply a lack of funds (Buckland, 1979, Johnson, 1985a). However, this
ignores how regional institutions affected the design and operation of Stormont’s
interwar industrial policy, and how this laid the foundation for Stormont’s post-war
industrial policy interventions. Ultimately, it was the overlapping networks between
business and government which ensured flaws existed within Stormont’s industrial
policy, limiting its effectiveness, and creating barriers to productivity growth,
reinforcing a low-wage-investment-productivity equilibrium.
Stormont’s industrial policy is notable for being the first example of industrial
policy being implemented at a regional level within the UK. It was 1934 before
Westminster introduced specific legislation to promote the creation of new industries,
through the Special Areas Acts, and even then it was 1936 before commercial
enterprises were supported through these Acts. Prior to this, Westminster had
focused on trying to reduce unemployment through public works, and the movement
of labour from poor to prosperous areas (Lee, 1971; Jones, 1985). Of these, only
public works were adopted by Stormont.223 The Nuffield Trust also promoted new
industrial development in Britain, but no evidence exists to demonstrate any of its
funds were spent in Northern Ireland. This was despite attempts by Stormont to
convince the Trust to operate in Northern Ireland.224
During the 1920s, Stormont’s attitude towards promoting new industries can
be inferred from a private response by the Secretary to the Ministry of Commerce, to
a letter suggesting the creation of new industries with government support:
I really do not see how a government department can initiate new
industries short of putting public money into them. If the capital is
223 Ulster Year Book, 1926, p.113. 224 PRONI: FIN/18/17/371, Letter from Northern Ireland Prime Minister Craig, to Lord Nuffield, 3rd November 1937.

D.P. Jordan
Page 181 of 317
forthcoming, as Mr Liddy apparently believes, it is up to the people of
Enniskillen to get one or more of the suggested industries going. 225
This demonstrates an aversion to public expenditure on new, smaller private firms,
which might provide new employment. Instead, Stormont was focusing on preserving
existing employment in the staple industries, which provided the majority of
employment.
This changed with the Great Depression of the 1930s, and the associated rise
in unemployment, which forced Stormont to act. However, Stormont’s policy was
motivated by political rather than economic priorities. At an election rally in West
Belfast in October 1931, the Northern Ireland Prime Minister announced that free sites
would be provided for new factories, to “rebut charges of apathy in the face of rising
unemployment” (Buckland, 1979, p.126). This political prioritisation of the level of
employment, over employment value or productivity, was a theme evident throughout
Stormont’s interwar industrial policy, which aligned with the preferences of the
influential old industries’ desire for survival, rather than the growth of new industries.
In June 1932, the first New Industries Act (1932 Act) was introduced. To be
eligible, applicants had to be a new industrial undertaking which did not already exist
in Northern Ireland as of October 1931, and provide “employment within Northern
Ireland to a substantial extent”.226 Firms could receive a grant to cover the cost of
acquiring a site, paid for a maximum of twenty years, and could be exempted from
paying rates at the discretion of local authorities. An Advisory Committee was
appointed by the Minister of Commerce, which was intended to give a non-binding
recommendation on whether an application should be accepted, along with any
225 PRONI: COM/62/1/176A: Suggested development of new industries near Enniskillen – Memo by Secretary to Ministry of Commerce, 11th May 1928. 226 New Industries (Development) Act (Northern Ireland) 1932.

D.P. Jordan
Page 182 of 317
conditions to be imposed, such as the amount of working capital to be raised by the
applicants.227
The 1932 Act was a failure. During its five-year lifespan, only eleven
applications were received, of which eight were approved and received financial
support. This led to public ridicule, with an independent unionist at Stormont enquiring,
“whether if the Government set up a few new chip shops they would not give more
employment” (Buckland, 1979, p.126). This quip reflected the failure of the 1932 Act
to meet the government’s own aim of providing substantial employment.
Table 2.8 ranks successful applications by size of site grant under the 1932
Act. Four of these were approved in 1937, at the very end of the 1932 Act’s life,
including the largest site grant, which was awarded to Short & Harland to produce
aircraft. The arrival of this new aircraft industry is not a success which can be
attributed to the 1932 Act, as both Buckland (1979, 1981) and Johnson (1985a)
conclude the new factory would still have been established without financial
assistance from Stormont. The Short and Harland factory was “the end result of a
series of decisions and events which were only tenuously related”; where the
combination of reclaimed land in Belfast harbour, the subsequent establishment of a
city airport adjacent to Harland and Wolff, and finally Shorts Bros.’s Kent factory being
without the capacity to fulfil an RAF order in 1936, led to the new Belfast factory being
opened (Johnson, 1985a, p.201).228 The remaining grants under the 1932 Act were
much smaller, with only two grants going to firms outside Belfast, and only one going
to a new, higher productivity industry producing chemicals. The small number of
applications, their concentration in Belfast, and the relatively small amounts involved,
227 PRONI: COM 63/1/222: New Industries (Development) Bill – Appointment of Advisory Committee. 228 The minutes from the 1932 Act’s Advisory Committee provide little evidence of much involvement of Stormont or its industrial policy in the establishment of the factory. Compared to other applications, the Short & Harland application was only mentioned in passing at the final meeting of the Advisory Committee, and there is no record of the Committee ever discussing the application in detail. See PRONI: COM 63/1/228: New Industries Advisory Committee, 6th meeting, 1st March 1937.

D.P. Jordan
Page 183 of 317
demonstrate the failure of the 1932 Act to promote the growth of either new industries
or employment to any significant extent.
Existing literature attributes this failure solely to a lack of funds. While
Stormont’s financial resources were under pressure at the time of the 1932 Act’s
design, in reality the Act put no pressure on the government finances. Stormont was
unable to spend all the funds it allocated each year. On average only 48 per cent of
the amount budgeted annually for the 1932 Act was spent between 1935 and 1937.229
A lack of funds was therefore not the primary reason for its failure. Even if more funds
had been available, two reasons, linked to how regional institutions influenced the
1932 Act’s design and operation, are more significant in explaining its failure.
229 Calculated from Northern Ireland House of Commons Papers, Appropriation Accounts, various years.
Table 2.8: Successful applicants under the 1932 New Industries Act
Applicant Location Product Manufacturing
sector
Year
approved
Site
grant Initiated
Short & Harland Belfast Aeroplanes Metal trades 1937 £2,410 Yes
Messrs. Richard
Atkinson & Co. Belfast Poplin Clothing 1932 £95 Yes
Lyness Bros. Belfast Chrome
plating Metal trades 1933 £52 Yes
Alister Kirk & Co.
Ltd.* Belfast
Fruit
spraying
machinery
Metal trades 1933 £50 Yes
Collin Glen
Canners Ltd. Dunmurry
Vegetable
canning Food 1932 £37.50 No
James Mackie &
Sons, Ltd. Belfast Jute yarn Textiles 1937 £32 Yes
Damolly Spinning
Co. Ltd. Newry
Woollen
carpet yarns Textiles 1937 £20 Yes
Nicobrand Co. Ltd Belfast Insecticides Chemicals 1937 £15 Yes
Source: FIN/18/19/245 and COM/63/1/223-228.
Notes: Site grant given in nominal terms.
*Original application was by Messrs. Swinson’s Engineering Works Ltd., but this firm was wound-up
in 1936, and the assets were bought by a new firm.

D.P. Jordan
Page 184 of 317
Firstly, the design of the 1932 Act was flawed. The financial support being
offered was shaped by Stormont’s desire not to be too generous towards new firms,
at the expense of existing firms, who might feel aggrieved or unfairly treated.230 This
meant the financial support available was too restrictive, and unsuitable for firms
establishing in new industries. Grants were only awarded to cover the cost of
acquiring a site. Yet, particularly for a new firm, this was only a small part of the total
capital costs, compared to the costs of constructing a suitable factory and acquiring
machinery. New industries would also struggle to meet the requirement to provide
substantial employment in order to receive financial support, as they would be growing
from a small size, and not immediately provide significant employment. This simply
placed a further barrier to new industries receiving financial support under the 1932
Act.
Secondly, the operation of the 1932 Act was flawed. The decision making
process of an Advisory Committee gave figures from existing industries a say over
which applicants were successful. This emphasised applicants having the right
connections. The Advisory Committee for the 1932 Act consisted of eight members,
shown in Table 2.9.231 While officially Stormont’s Ministers of Commerce and Finance
together had the final say on decisions, in practice their decisions were a rubber
stamping exercise for the view of the Advisory Committee.232 Writing to the Advisory
Committee on the expiry of the 1932 Act, the Minister of Commerce emphasised that
every recommendation made by the Committee had been accepted by both himself
and the Minister of Finance.233
230 PRONI: CAB/9F/126/1: Attraction of new industries to Northern Ireland. 231 PRONI: COM 63/1/222: New Industries (Development) Bill – Appointment of Advisory Committee. 232 Applications were vetted by the Ministry of Commerce before being passed to the Advisory Committee, to ensure applications were of substance and not speculative. There is no archival evidence to suggest the Ministry exercised discretion over which applications reached the committee. Indeed, applications put before the committee were sometimes of such speculative nature that it suggests the vetting process was not particularly rigorous. 233 PRONI: COM 63/1/222: New Industries (Development) Bill – Appointment of Advisory Committee: Letter to Advisory Committee from Minster of Commerce, 6th October 1937.

D.P. Jordan
Page 185 of 317
Table 2.9: The Advisory Committee under 1932 New Industries Act
Name External responsibilities Address
Senator D.
McCorkell
(Chairman)
Stormont Senator; Mayor of Londonderry; Wholesale
general merchant
Londonderry
A. Agar Sirocco Engineering Works Belfast
Sir R. Baird Belfast Telegraph Belfast
J.A. Cleland UIDA Chairman; Printer & paper merchant Belfast
V.A. Devoto Deputy Lieutenant, City of Belfast; Flour & grain
importer; Director of bakery; Director of Irish News
Belfast
H. Turtle Building contractor Belfast
M.J. Watkins General Manager & Secretary, Belfast Harbour
Commissioners
Belfast
W.H. Webb Linen firm owner Randalstown
Source: Constructed using information contained within COM/63/1/222: New Industries
(Development) Bill – Appointment of Advisory Committee.
The members of the Advisory Committee strongly reflected the interests of
existing firms. They were drawn from the business community in Northern Ireland,
and chaired by a Stormont Senator from the ruling Unionist Party.234 The staple
industries were well represented, and the majority of the membership was from
Belfast. Members were not simply chosen for their apparent business experience, but
also for the networks they possessed. A representative from the Belfast Harbour
Commissioners was identified as desirable, because it “would bring into the picture
the public body having available large tracts of land for new factories”.235 A
representative of Sirocco Engineering Works was suggested, as Sirocco had
overseas interests which might allow them to persuade overseas industrialists to
locate in Northern Ireland.236 Two members were directly linked with two of the main
newspapers in Northern Ireland,237 and their appointment appears to have been
234 Prime Minister Craig initially recommended potential members, for a committee of between 3 and 5 members. However, the Minister of Commerce, Barbour, chose a committee of 8 members, with only two of Craig’s four recommendations included. PRONI: COM 63/1/222: New Industries (Development) Bill – Appointment of Advisory Committee. 235 PRONI: COM 63/1/222: New Industries (Development) Bill – Appointment of Advisory Committee, 23rd Feb 1932. 236 PRONI: COM 63/1/222: New Industries (Development) Bill – Appointment of Advisory Committee, 23rd Feb 1932. 237 Prime Minister James Craig’s desire to see Sir R. Baird of the Belfast Telegraph made Chairman of the committee was also not implemented, due to the request coming after

D.P. Jordan
Page 186 of 317
motivated by a desire to garner a favourable hearing in the press for Stormont’s
efforts. Members were therefore not chosen simply to fulfil the role of independent
adjudicators on the merits of an application, but also chosen on the basis of their
networks. This gave members the opportunity to act in the interests of their respective
businesses and industries when making decisions. They were unlikely to support the
arrival of competitors, and would instead reinforce existing connections between
firms.
Six meetings of the Advisory Committee took place between 1932 and 1937.
The minutes record a significant level of detail on their discussions. This provides a
rich resource and level of detail which does not exist in later instances of Advisory
Committees under Stormont’s industrial policy. The minutes record how the
Committee arrived at its decisions, what influenced these, and how this compared to
the priorities laid out in the legislation. They show how existing firms were given the
opportunity to advance their own priorities and special interests.
The first meeting saw the Committee consult with the Minister of Commerce
on guidelines for accepting an application.238 The 1932 Act set out two criteria: that
applications should be for a new industrial undertaking, and they should provide
substantial employment. Crucially, the Committee, in agreement with the Minister,
was given discretion on how to implement these criteria. On whether an application
was for a new industrial undertaking, no “hard and fast rule of rigid application” was
to be used. On the issue of substantial employment, the Committee was also given
discretion if they believed an application possessed potential for growth.
This discretion gave the Committee the opportunity to implement its own
preferences, and led to the Committee making decisions based on two of its own
letters had been sent out to potential members requesting their presence on the Advisory Committee by the Ministry of Commerce. PRONI: COM 63/1/222: New Industries (Development) Bill – Appointment of Advisory Committee. 238 PRONI: COM/63/1/223 New Industries Advisory Committee: First meeting proceedings, 21st June 1932.

D.P. Jordan
Page 187 of 317
criteria. The first was whether the new firm would compete against existing firms.
Superficially intended to ensure applications were for new industries, this allowed the
Committee to reject applications when any potential for competition existed, no matter
how small. This even led to the Committee in some cases only recommending a grant
for part of the applicant’s site, as the rest of the site was deemed not part of the new
industry. The Committee’s second priority was whether the applicant would be a
commercial success, with detailed financial analysis undertaken before an opinion
was given, allowing the Committee to reject applications when desired.
Evidence of this is provided by rejected applications made to the Committee,
two of which were from within the high productivity paper sector. At the Committee’s
second meeting, it considered an application by Cartons Ltd, who had started a
factory in Larne producing cardboard milk cartons.239 Despite this being a new
product, already successfully manufactured in Britain, the application was rejected by
the Committee, as it did not believe it would be a commercial success. The second
rejected application in the paper sector was by the Lurgan Boxmaking Company in
1933. The owner had purchased a factory to produce corrugated cardboard egg
containers, and had even successfully patented the machinery used to produce the
corrugated cardboard.240 Despite this being a new product not already manufactured
in Northern Ireland, the application was again rejected.
In both these cases, overlapping networks influenced the Committee’s
decision. Mr Cleland was present for both decisions, and was both the President of
the UIDA, and the owner of a firm manufacturing paper and cardboard. In the minutes
regarding the application of the Lurgan Boxmaking Company, he is the only member
specifically recorded as giving their personal view on the firm’s products. With
discretion given to the Committee over how they assessed applications, and particular
239 PRONI: COM/63/1/224: New Industries Advisory Committee: Second meeting proceedings – Minutes of meeting, 20th October 1932. 240 PRONI: COM/63/1/225: New Industries Advisory Committee: Third meeting proceedings – Application by the Lurgan Boxmaking Co.

D.P. Jordan
Page 188 of 317
weight given to the views of members in the same industry as applicants, applications
could be easily rejected if they might compete against existing firms.
Even where applications were approved, there was an unwillingness to give
approval until it was proven that no competition with existing firms would take place.
In applications from two textile firms,241 the Committee considered in great detail the
potential for competition, and evidence collected included interviews with owners of
existing firms producing similar products.242 The applications were only approved
once enough evidence had been gathered to finally satisfy members there was no
remote possibility of any future competition with existing firms.
Overlapping networks likely affected whether firms applied at all under the
1932 Act. The Loans Guarantee Acts also used an Advisory Committee, and in an
internal Ministry of Commerce minute in 1937, the reason given by the owner of a
County Armagh textile firm, John Compton Ltd, of now wishing to apply for financial
support, but having not previously done so, was that “he was not prepared to give
detailed information concerning his factory and processes to an Advisory Committee
the chairman of which was a potential competitor”.243 The use of an Advisory
Committee, with well-connected members, meant self-selection in applicants was
likely commonplace, as it was only worthwhile applying if a firm had the right
connections. Indeed, given the reasoning behind the selection of members for the
1932 Act’s Advisory Committee, Stormont willingly promoted overlapping networks as
part of its industrial policy.
The 1932 Act expired in 1937, and coincided with the expansion of
Westminster’s industrial policy. The 1934 Special Areas Act focused on relieving high
levels of regional unemployment, with four development areas designated in Britain
241 These were Messrs Mackie & Sons, and the Damolly Spinning Company 242 PRONI: COM/63/1/228: New Industries Advisory Committee: Sixth meeting proceedings, 1st March 1937. 243 PRONI: FIN/18/17/371: Unemployment Inter-Departmental Committee, 4th August 1937 – New Industries Development Act.

D.P. Jordan
Page 189 of 317
(Lee, 1971, p.153). This was followed by the 1936 and 1937 Special Areas Acts,
which extended the financial support on offer beyond non-profit endeavours, with
loans, grants, and relief from rates and income tax available for firms creating new
employment (Lee, 1971, p.153-154). While the Special Areas were not particularly
effective at reducing unemployment (Lee, 1971; Jones, 1985), innovations such as
the creation of trading estates promoted the growth of new industries in these
depressed areas (Lee, 1971, p.154).
After initial disagreement amongst the Stormont Cabinet over whether the
1932 Act should be replaced,244 two pieces of legislation were passed as part of the
New Industries Acts of 1937, both increasingly generous in their financial support.
Crucially, eligibility would be extended to existing firms, which had been the previous
constraint to providing greater financial support. Eligible firms now only had to
establish an undertaking which would be “likely to provide and maintain additional
employment”, and the criterion of the industry being new to Northern Ireland was
scrapped.245 This reflected Stormont’s continued prioritisation of employment quantity
over quality, and the amount of financial support being linked to its availability to
existing firms.
In July 1937, the first part of new legislation saw financial support extended to
grants covering the cost of acquiring or renting a site, and loans up to £200,000,
interest free for the first five years, to cover the costs of purchasing, building, or
adapting premises. The second part of new legislation in December was even more
generous. Applicants could now receive support if they were only extending an
existing factory, the maximum size of interest bearing loans was increased to
£750,000, which could now cover capital costs such as machinery, and firms could
244 PRONI: FIN/30/AA/97: New Industries Legislation. Memorandum by the Minister of Commerce, 26th February 1937. 245 New Industries (Development) Act (Northern Ireland), 1937.

D.P. Jordan
Page 190 of 317
also be exempt from income tax for the first five years of operation, subject to the
recommendation of the Advisory Committee.
It was the overlapping networks between business and Stormont which led to
the second part of the 1937 Act being even more financially generous than initially
planned. This was the direct result of lobbying by two local textile firms: a carpet
weaving factory near Ballymena, and a textile firm in County Armagh.246 These firms
wished to avail of both a guaranteed loan under the Loans Guarantee Act, to cover
the cost of machinery, and a loan under the New Industries Act, to cover the cost of
the factory premises. However, the first 1937 Act contained a clause which prevented
applicants from simultaneously receiving support from both. After discussion within
the Ministry of Commerce, the Minister agreed that the second 1937 Act would
remove this clause.247 The Minister of Commerce also decided the initial maximum
loan should be raised from £200,000 to £750,000, and firms only expanding their
existing premises would now be eligible,248 with these alterations accepted in full by
the Cabinet.249 Firms from old industries were therefore able to directly influence
Stormont’s industrial policy, and increase the financial benefits they received.
The 1937 New Industries Act ran until 1945, extended beyond its original five-
year life due to World War II. An Advisory Committee continued to recommend
whether applications should be approved, and with what conditions. The Committee
shrank to only three members, but its members remained well-connected in Northern
Ireland business.250 One member, Mr H. Boyd, was the accountant to some of the
applicants, vouching for their suitability when their application was being
considered.251 This Committee’s minutes omit the detail of the 1932 Act, preventing a
246 PRONI: FIN/18/17/371: Unemployment Inter-Departmental Committee, 4th August 1937– New Industries Development Act. 247 PRONI: FIN/18/17/371: Unemployment Inter-Departmental Committee, 20th August 1937. 248 PRONI: FIN/18/17/371: Unemployment Inter-Departmental Committee, 26th November 1937. 249 PRONI: FIN/18/17/371: Unemployment Inter-Departmental Committee, Extract from draft cabinet conclusions, 29th November 1937. 250 See Table 2.A.7 in the Appendix for names and occupation. 251 PRONI: COM/63/1/28-30: New Industries Advisory Committee.

D.P. Jordan
Page 191 of 317
similar depth of insight into their reasoning.252 However, using surviving Ministry of
Commerce files, it has been possible to construct a database of all the applications
made under the 1937 Act. 253
A total of 146 applications were made between 1937 and 1945.254 Table 2.10
uses this information to compare the distribution of support under the 1937 Act to the
existing structure of manufacturing in Northern Ireland. This demonstrates that
Stormont’s industrial policy was ineffective at promoting new, higher productivity
industries, and was weighted towards low productivity sectors. Clothing had the
lowest productivity, but its share of applications made and accepted was much higher
than its share of employment in 1935. Similarly, for the second lowest productivity
sector of textiles, its share of applications accepted was also higher than its share of
applications made. In contrast, the high productivity sectors of chemicals and paper
saw their share of applications accepted be lower than their share of applications
made. Even when measured by share of financial support received, low productivity
sectors received the most support, and high productivity sectors the least.
252 The 1937 Act’s Advisory Committee minutes in most cases only recorded whether an application was discussed, if it was accepted, and if so, the extent of support recommended. Detail of the reason for the committee’s decision not to recommend an application was rarely given. 253 No single record of all the applications made under the 1937 Act was kept, nor for the number accepted by the Advisory Committee. To construct the database, each application’s unique identifying number was used. These were assigned once an application passed the initial vetting by the Ministry of Commerce. By analysing the minutes of every meeting of the Advisory Committee, with the addition of incomplete summary records kept by the Ministry of Commerce, the attributes of the applicant associated with each unique number were recorded. This created a database listing each applicant’s name, location, industry, whether their application was approved by the Advisory Committee, the year in which it was approved, the support offered by the Advisory Committee, and whether it became operational. 254 Of the 146 applications made, 42 have incomplete details, due to their location or industry being unrecorded. Of these, 4 applications exist where only the unique identifying number was allocated and no further details were recorded, and 11 only record the name and nothing further.

D.P. Jordan
Page 192 of 317
There was also an absence of applications from firms in high productivity
areas within sectors. In textiles, 21 applications were accepted, but only 5 of these
were for man-made fibres, with only 3 of these actually operational by the end of 1945.
Similarly, within the metal trades sector, 12 applications were accepted, but only 3 of
these were for electrical engineering firms, and only 2 of these became operational.
Despite the apparent benefits of being able to tailor industrial policy to Northern
Ireland’s own circumstances, Stormont’s industrial policy, which was superficially
intended to promote new industries, instead favoured existing, low productivity
industries.
A further problem with the 1937 Act was its focus on Belfast. The 1932 Act
saw nearly all the firms receiving support established in Belfast. Of the 146
Table 2.10: New Industries Act 1937 distribution by manufacturing sector
Manufacturing sector
Existing
industrial
structure in
1935 (%)
Share of
applications
made
(%)
Share of
applications
accepted
(%)
Share of
applications
operational
by 1945 (%)
Operational
firms’ share
of financial
support (%)
Textiles 50.8 15.8 20.4 17.0 23.7
Food, drink & tobacco 8.6 11.6 7.8 15.1 21.8
Clothing 10.4 30.1 35.9 39.6 23.1
Metal trades, engineering
& shipbuilding 13.7 9.6 11.7 7.6 10.9
Construction & extractive
industries 9.0 7.5 6.8 3.8 1.2
Paper and printing 3.5 3.4 2.9 3.8 6.4
Chemicals 0.6 1.4 1.0 0 6.7
Public utilities 3.1 0 0 0 0
Miscellaneous 0.2 10.3 9.7 11.3 4.6
Unrecorded - 10.3 3.9 1.9 1.6
Totals 146
applications
103
approved
34
operational
£975,525 in
loans
Sources: Existing structure of manufacturing taken from the Census of Production of Northern Ireland
Report 1935. Information on applications under the 1937 Act constructed from: PRONI:
FIN/18/19/245: New Industries (Development) – Monthly statements of loans authorised and
employment returns, 1939-1945; PRONI: COM/63/1/75: Position of the New Industries assisted under
the New Industries (Development) Acts (NI) 1932 and 1937, Schedules; PRONI: COM/63/1/28-30:
New Industries Advisory Committee.
D.P. Jordan
Page 193 of 317
applications made under the 1937 Act, 36 were for firms located in Belfast, equal to
25 per cent.255 Of these 36 applications, 31 were accepted, equal to 30 per cent of
the total accepted. Crucially, 19 of these became operational, equal to 56 per cent of
those operational. This only further reinforced the concentration of manufacturing
around Belfast, despite high unemployment throughout Northern Ireland.
By October 1943, the 1937 Act had only provided employment for 2,639
people.256 The employment related to firms which received loans totalled only 1,605
people. Despite this low figure, it was a more efficient means of creating employment
than Stormont’s support under the Loans Guarantee Acts. The average cost per job
under the 1937 Act was £120.98.257 This compares to a cost per job under the Loans
Guarantee Acts for shipbuilding of £455.91.258 While neither cost per job takes into
account whether employment may have occurred anyway in the absence of
government subsidy, it does give an insight into the efficiency of Stormont’s
expenditure on industrial policy. It suggests that if Stormont’s expenditure had been
better targeted at higher productivity industries, and the legislation had been better
designed and implemented to achieve this, the potential was there for Stormont’s
limited financial resources to have been spent more effectively in the creation of
employment in new, high productivity industries.
255 The location of 39 firms were left unrecorded. 256 PRONI: FIN/18/19/245: New Industries (Development) – Monthly statements of loans authorised and employment returns, 1939-1945. No record of employment levels in firms supported is available beyond this date. 257 Calculated by dividing the total amount of loans by the total employment of firms receiving loans in October 1943, using PRONI: FIN/18/19/245 New Industries (Development) – Monthly statements of loans authorised and employment returns, 1939-1945. 258 Calculated using the total number employed in shipbuilding, from the Census of Production Northern Ireland Report 1935, and the total amount of loans Stormont became liable for under the Loans Guarantee Acts (Northern Ireland) 1922-1938, H.C. 654, 1945.

D.P. Jordan
Page 194 of 317
7) Conclusion
This chapter has examined whether regional institutions can provide an explanation
for Northern Ireland’s longstanding productivity gap to the UK. This was at its worst
during the interwar period, when Northern Ireland performed poorly relative to the UK
and other regions. Despite having the apparent benefit of being able to tailor industrial
policy to its own specific needs, Stormont’s industrial policy failed to improve
productivity performance. This chapter rejects the existing narrative, that Stormont’s
industrial policy was irrelevant, and that the poor performance of Northern Ireland
manufacturing was simply the result of an industrial structure over reliant on the staple
industries amidst falling global demand. Instead, regional institutions were crucial in
creating barriers to productivity growth, and determining the supply-side
competitiveness of the regional economy.
Institutions have been placed at the heart of explanations for Britain’s poor
interwar performance, and suggested as a long-run explanation of Northern Ireland’s
productivity gap. The interwar period demonstrates that regional institutions provided
an additional avenue to those identified nationally for firms to create barriers to
productivity growth, and that regional institutions play a key role in explaining the long-
run productivity gap. The supply-side characteristics of the regional economy,
including satisficing and the availability of cheap labour, combined with the fall in
global demand, reduced the expected payoff from investing in skills and knowledge.
This created the motivation for existing firms to alter institutions for their own benefit
and to aid their survival. The means to do so were provided by the strong overlapping
networks between business and Stormont. Old, low productivity industries were able
to use this influence to acquire financial support at the expense of new industries.
Stormont’s industrial policy to promote the growth of new industries was poorly
designed, and ineffective at rebalancing the regional economy away from old, low
productivity industries. This reflected not only Stormont’s desire to maintain existing
employment, but also its willingness to facilitate the protection of existing f irms from

D.P. Jordan
Page 195 of 317
competition. These existing firms were able to exert influence over the design,
implementation, and recipients of Stormont’s industrial policy, with each industry’s
influence reflecting its relative size and barriers to entry. These weaknesses in
Stormont’s industrial policy came with the opportunity cost of the failure of new, high
productivity industries to establish during the interwar period, which would have
provided the foundation for a more diversified and stronger post-war economy.
Instead, the rent-seeking behaviour of existing firms, facilitated by Stormont’s
industrial policy, created barriers to productivity growth, and helped lock the Northern
Ireland economy into a low wage-investment-productivity equilibrium.
Regional institutions are receiving increasing attention for their role in
determining regional long-run economic performance. Northern Ireland’s experience
demonstrates that regional institutions pose a limit on the efficient decentralisation of
economic policy making powers. While a policy of more fiscal decentralisation might
be viewed as politically desirable, the regional institutions within which decentralised
policy operates will determine its economic success. This is particularly relevant to
circumstances where institutional rules to prevent conflicts of interest may be
weakened, as suggested by Crafts (2017) post-Brexit, or where transparency and/or
the feedback loop of electoral competition is partially absent, such as in contemporary
Northern Ireland. The opportunity cost of investment in skills and knowledge can
compound the problems already faced by a region suffering from low productivity,
restricting its ability to experience convergence.
The interwar period demonstrates how industry and individual firms were able
to use their political influence to capture government subsidy. While their interests
may align with those of the subnational government in the short to medium-run, they
can create barriers to productivity growth in the long-run. Further research is required
to understand the extent regional institutions influenced the efficiency of industrial
policy in Northern Ireland during the remainder of the twentieth century. After 1939,
Westminster had an increased role in controlling Stormont’s expenditure. Further

D.P. Jordan
Page 196 of 317
research could explore how this increased role affected expenditure under Stormont’s
industrial policy, including how it may have changed Stormont’s interactions with the
business community, and whether this new triangular relationship was beneficial for
the efficiency of industrial policy. The transitions from a subnational government at
Stormont, to Direct-rule from Westminster, and finally to post-Belfast Agreement
devolution, also provide opportunities to examine how changes in regional institutions
affected the efficiency of regional industrial policy.

D.P. Jordan
Page 197 of 317
8) Appendix
Table 2.A.2: Northern Ireland manufacturing productivity
Year
Contribution to the productivity gap (%)
(1) Original (2) Alternative (3) Existing estimates
Within-
sector Structure
Within-
sector Structure
Within-
sector Structure
1924 76.3 23.7 72.9 27.1
1930 62.4 37.6 49.6 50.4
1935 65.6 34.4 51.5 48.5 45 55
1949 95.4 4.6 90.6 9.4
1954 80.8 19.2 78.6 21.4
1958 70.1 29.9 74.9 25.1
1963 74.6 25.4 69.7 30.3
1968 58.2 41.8 65.5 34.5 73 27
Sources: Columns (1) and (2): for Northern Ireland: Census of Production of Northern
Ireland Report, 1924, 1935, 1949, 1958, 1968; for the UK: HMSO (1978). Column (3): for
1935, Isles and Cuthbert (1957, p.273); for 1968, Hitchens and Birnie (1989a, p.450).
Notes: Column (1) shows results from Table 2.3, where contribution of within-sector
productivity is calculated before structure. Column (2) calculates contribution of structure
before within-sector productivity. Column (3) provides existing estimates from other
authors, where the contribution of structure is calculated before within-sector productivity,
and which can be compared with Columns (1) and (2).
Table 2.A.1: Percentage of population by occupation
1926 1951 1971
Agriculture & Fishing Northern Ireland 15.7 10.5 4.7
Britain 4.3 3.3 1.7
Manufacturing Northern Ireland 22.0 19.3 17.8
Britain 20.8 19.9 17.0
Services Northern Ireland 18.7 22.9 29.7
Britain 27.9 29.7 35.5
Other Northern Ireland 2.6 6.3 4.5
Britain 6.3 6.1 4.5
No occupation/Retired Northern Ireland 41.0 41.0 43.3
Britain 40.8 41.0 41.3
Source: Constructed from Mitchell, 1988, p.105-107 & p.109
Notes: Excludes defence. Population figures for Britain in 1926 were estimated as an average of
the values from the 1921 and 1931 population censuses in Britain. Working population defined
as: for 1921, those aged twelve and over; for 1926 and 1931, those aged 14 and over; for 1951
onwards, those aged 15 and over. The ‘no occupation’ category (the majority of which were
female) includes all those who listed no occupation in the census, and all those who were retired.

D.P. Jordan
Page 198 of 317
Table 2.A.3: Output per person across sectors, 1924-1968
Rank Sector
Avg. UK
output per
person, (£)
Avg. UK
output per
person as
% of rank 1
Avg. size
of UK
sector
(%)
Avg. size
of NI
sector
(%)
1 Chemicals 2,713 100 3.6 0.7
2 Food, drink & tobacco 2,176 80 7.2 10.2
3 Paper and printing 1,801 66 5.2 2.8
4 Metal trades, engineering
& shipbuilding
1,589 59 32.2 20.5
5 Construction and
extractive industries
1,352 50 28.8 14.2
6 Textiles 1,244 46 10.6 36.5
7 Clothing 1,000 37 6.0 11.0
Sources: For Northern Ireland: Census of Production of Northern Ireland Report, 1924, 1935,
1949, 1958, 1968; For the UK: Historical Record of the Census of Production 1907 to 1970; all
values converted into 1972 prices using ONS (2004, 2020).
Notes: Public utilities were excluded, as they were part of the public sector. The Miscellaneous
sector was excluded, as the variation in firms included, both over time and between Northern
Ireland and the UK, made meaningful comparison impossible. Output per person employed was
converted into 1972 prices, and averaged across all eight censuses of production between 1924
and 1968. Averaging separately across the interwar years did not affect the ranking.
Table 2.A.4: Costs as a percentage of gross output by manufacturing sector
(NI/UK where UK=100)
1924 1930 1935 1949 1954 1958 1963 1968
Textiles 99 93 104 106 103 102 101 93
Food, drink & tobacco 108 116 112 105 107 111 115 112
Clothing 102 99 98 105 103 102 108 106
Metal trades, engineering
& shipbuilding 93 108 111 95 88 79 81 78
Construction & extractive
industries 136 125 123 130 119 122 113 111
Paper & printing 100 96 93 98 90 93 96 93
Chemicals 100 92 96 91 86 110 98 95
Public utilities 114 111 85 108 102 98 104 108
Source: Census of Production (various years).

D.P. Jordan
Page 199 of 317
Table 2.A.6: Northern Ireland employment in textiles
1912 1924 1930 1935 1949 1954 1958 1963 1968
Total textiles 87,427 85,497 67,079 67,328 64,960 65,856 51,531 45,141 41,532
Linen 77,333 74,777 55,460 55,621 52,542 50,142 43,106 33,884 25,157
Proportion of
all textiles in
linen (%)
88.5 87.5 82.7 82.6 80.9 76.1 83.7 75.1 60.6
Source: Census of Production of Northern Ireland Report 1924, 1935, 1949, 1958, 1968.
Table 2.A.7: The Advisory Committee under 1937 New Industries Act
Name External responsibilities Address
H. Boyd Accountant, Messrs Atkinson and Boyd Belfast
J.G. Michaels Tobacco, Messrs Gallaher Ltd. Belfast
W.F. Scott Banker, Northern Bank Ltd Belfast
Source: Constructed using information contained within PRONI: COM/63/1/28: New
Industries Advisory Committee.
Table 2.A.5: Regional characteristics for productivity growth
Characteristic Cleveland Northern Ireland
1 A region situated a significant distance from nation’s main capital markets
Yes Yes
2 Strong industrial history Yes Yes
3 Local economy characterised by relatively small enterprises Yes Yes
4 High rates of formation of new firms Yes No
5 New firms formed for the exploitation of inventions Yes No
6 Creation of new firms provided technological leadership Yes No
7 Local enterprises trained and cultivated young inventors Yes No
8 Nodal firms helped spawn clusters of innovative enterprises Yes No
9 Local enterprises served as a hub of overlapping networks Yes (business &
finance)
Yes (business & politicians)
Notes: Based on Lamoreaux et al. (2006), see text.

D.P. Jordan
Page 200 of 317
CHAPTER 3
Borders of the past
The effect of the Great Depression on Northern
Ireland’s interwar trade performance
Abstract
The Great Depression saw a fall in international trade and a rise in protectionism.
Existing literature focuses on the national experiences of the UK and the Irish Free
State, but Northern Ireland’s experience is not examined. Using a new archival
source, a dataset for Northern Ireland’s external trade is constructed for 1924 to 1937.
This allows the collapse of international trade to be analysed at a regional level within
the UK for the first time. Northern Ireland’s trade performance is found to have been
more resilient than either Britain or the Irish Free State. Both imports and exports
recovered to their pre-crash level by 1937, a result of increasing trade with Britain,
and strong growth in direct-foreign trade. Northern Ireland’s problems of slow growth
and high unemployment are shown not simply to be demand-driven problems as
regional theory suggests. The effect of UK protectionist trade policy on Northern
Ireland is examined, with a redirection of trade towards Britain substituting for falling
cross-border trade with the Irish Free State. The interwar Northern Ireland economy
was therefore more resilient, and less severely affected by the Great Depression, than
the existing narrative suggests, emphasising the relative importance of the post-war
period to Northern Ireland’s economic decline.

D.P. Jordan
Page 201 of 317
1) Introduction
An important aspect of any economy’s performance is its external trade. Not only is it
an important component of national income, it also reflects an economy’s overall
health. This is equally true for a region, where regional problems of slow growth and
high unemployment have been linked to a weak trade sector (Thirlwall, 1980).
Understanding regional trade within the context of a global economy is of particular
relevance, as the recent rise in populism has been linked to disparities in regional
experiences of global economic growth (Rodríguez-Pose, 2018). Contemporary
events such as Trump’s trade war with China, and the potential for increased trade
barriers following a UK exit from the European Union (EU), means trade policy is of
increasing relevance to regional economies and policy-makers.
One of the most notable trade events in trade history is the Great Depression.
Its effects at a national and international level have generated much research
(Aldcroft, 1970; Kitson and Solomou, 1990; Eichengreen and Irwin, 1995; Klasing and
Milionis, 2014; De Bromhead et al., 2019), but its effects at a regional level have
received little attention. This reflects the lack of availability of regional trade statistics
for this period. This Chapter addresses this shortcoming, by using new archival
material to construct a database of Northern Ireland’s interwar trade, to understand
the effect of the Great Depression on the regional economy. This demonstrates that
Northern Ireland’s trade was more resilient than the existing narrative for the regional
economy suggests, provided by Buckland (1979, 1981) and Johnson (1985a, 1985b).
Despite suffering a sharp decline in trade, Northern Ireland recovered to its pre-crash
level by 1937, before either Britain or the Irish Free State. This recovery was driven
by manufactured goods, primarily linen and shipbuilding. While cross-border trade
with the Irish Free State fell, there was a redirection of Northern Ireland’s trade
towards Britain, and strong growth in direct-foreign trade. Northern Ireland’s poor
economic performance was therefore not simply a demand-driven problem, as the

D.P. Jordan
Page 202 of 317
existing regional theory of Thirlwall (1980) might suggest, but the supply-side was
also important.
Northern Ireland provides this unique opportunity to examine interwar regional
trade due to the Government of Ireland Act 1920 (1920 Act). This partitioned the island
of Ireland, creating Northern Ireland, with powers distributed between Westminster
(the national UK Government) and Stormont (the subnational Northern Ireland
Government).259 Crucially, matters of foreign trade, including Customs and Excise,
were retained by Westminster, and outside of the control of Stormont. However, under
the 1920 Act, Stormont was to receive its share of Reserved revenue, which included
Customs and Excise. In order to calculate Stormont share, statistics had to be
collected, not only for Northern Ireland’s external trade directly with foreign countries,
but also for its cross-channel trade in dutiable goods with Britain. These trade
statistics were recorded at a disaggregated level between 1924 and 1937, but they
have not previously been exploited. Digitising these trade statistics provides the
opportunity to examine regional trade within the UK during the Great Depression for
the first time.
This Chapter addresses two main research questions. Firstly, how was
Northern Ireland’s trade performance affected by the Great Depression? Answering
this question focuses on the level and composition of Northern Ireland’s trade, making
comparisons with Britain and the Irish Free State. Existing literature on Northern
Ireland’s experience of the Great Depression, particularly from the perspective of
trade, is very limited. The existing narrative is provided by Buckland (1981) and
Johnson (1985a, 1985b), and focuses on the experiences of the staple industries,
particularly linen and shipbuilding. However, there has been no systematic analysis
of the overall trade performance of the regional economy. Doing so contributes to the
259 See Table 1.2 in Chapter 1 for a full outline of the distribution of powers under the 1920 Act.

D.P. Jordan
Page 203 of 317
existing Northern Ireland literature, by providing a more complete picture of interwar
trade, and placing Northern Ireland’s regional experience within the broader UK and
international context.
The second research question is, what effect did the rise in protectionism,
specifically the UK’s protectionist trade policies, have on Northern Ireland’s trade?
Answering this question focuses on the direction of Northern Ireland’s trade. The
1930s saw a rise in protectionism, as countries sought to address both the economic
and political effects of the Great Depression. The UK introduced a number of
protectionist trade policies during the interwar period, but particularly from 1932
onwards. These included the Import Duties Act of 1932, the Ottawa Agreements Act
of 1932, and the Irish Free State (Special Duties) Act, which were in addition to
existing Acts, such as Safeguarding of Industries (NIESR, 1943). This introduction of
UK protectionist trade policy provides the opportunity to examine how a region is
affected by national trade policy.
The remainder of the chapter is structured as follows. Section 2 surveys the
relevant literature, covering the Great Depression and Northern Ireland. Section 3
sets out the method and data used for analysis. Section 4 analyses Northern Ireland’s
overall trade performance, demonstrating it was not as severely affected as either
Britain or the Irish Free State, with the staple industries central to this recovery, but
the failure of this to be reflected in the wider performance of the regional economy
being linked to the Keynesian regional multiplier. Section 5 examines the role of UK
protectionism in Northern Ireland’s interwar trade performance, demonstrating that
Northern Ireland’s trade became more home biased, and that the UK’s protectionist
trade policies benefited Northern Ireland’s exports to Britain, particularly in the staple
industries. Section 6 concludes, summarising the implications for our understanding
of the Northern Ireland economy.

D.P. Jordan
Page 204 of 317
2) Relevant literature
The interwar period has generated a large volume of literature, examining the global
rise in protectionism and collapse in trade following the Great Depression. However,
this has focused on the levels of trade between countries, or the performance of
specific industries within countries. The impact on regional trade is left unexplored,
with regional experiences contained within wider national or industry specific
discussions. This hides the potentially differing geographic impacts of the Great
Depression on regional trade. Northern Ireland therefore provides an opportunity to
address this question with new trade data, while also furthering our limited
understanding of the interwar Northern Ireland economy.
The effect of the Great Depression on world trade was substantial. Madsen
(2001, p.848) describes it as the “strongest adverse shock to international trade in
modern history”. This collapse was the result of governments seeking to protect
domestic firms and jobs, and insulate their monetary system, in the face of spreading
depression and monetary instability (Harley, 2003, p.162). The value of world trade
fell 30 per cent in constant prices between 1929 and 1932 (Eichengreen and Irwin,
1995, p.2), and world trade volume fell 16 per cent between the third quarters of 1931
and 1932 (Eichengreen and Irwin, 2010, p.877), with global exports of manufactured
goods hardest hit (Harley, 2003, p.162). Even by 1938, global trade volume was only
around 90 per cent of its 1929 level, despite global production having already
recovered (Eichengreen and Irwin, 1995, p.2).
The global fall in trade following the Great Depression is seen to be the result
of a combination of factors. Madsen (2001) presents the decline as a combination of
changes in income, tariff barriers, and non-tariff barriers. Discretionary tariff barriers
accounted for 41 per cent of the world trade collapse between 1929 and 1932, while
59 per cent was the result of falling nominal income (Madsen, 2001, p.865). The
subsequent recovery in world trade by 1937, was almost entirely driven by income,
as trade barriers persisted (Madsen, 2001, p.863). Estevadeordal, Frantz and Taylor

D.P. Jordan
Page 205 of 317
(2003) attribute the fall in trade from 1929 onwards to both high transport costs, and
the collapse of the gold standard. Jacks et al. (2011) use a gravity model to explore
the long-run role of bilateral trade costs, finding these fully explain the trade bust of
1929 to 1932. Trade costs increased least within Europe, within Asia/Oceania, and
between Europe and Asia/Oceania, but the Americas saw the greatest increases
(Jacks et al., 2011, p.191). Eichengreen and Irwin (2010) argue that it was a country’s
choice to introduce protectionist policy which contributed to rising trade costs, with
policy shaped by the decision of whether to remain on the gold standard, which led to
more protectionist trade policy, in order to protect the country’s balance of payments.
Economies in Europe were amongst some of those hardest hit following the
Great Depression, but the UK was not as badly affected. The European core
economies experienced the greatest implosion of trade, as measured by total trade
as a share of GDP (Klasing and Milionis, 2014, p.193).260 In comparison, the UK’s
slump in GDP per capita following the Great Depression was mild relative to other
European countries (Eichengreen, 2003, p.316). The UK’s GDP growth was over
double the weighted growth rate of the world economy during the 1930s, and
outperformed other major industrial countries, such as the USA and France (Kitson
and Solomou, 1990, p.1).
While the UK’s GDP recovered, its trade did not regain its pre-1929 level by
1937. The level of UK exports declined much further than world trade between 1929
and 1937, falling 20.3 per cent, while world trade fell only 11 per cent (Aldcroft, 1970,
p.246). The recovery in the UK economy meant trade had declined in relative
importance: the UK’s exports declined from a 17.6 per cent share of net national
income, to only 9.8 per cent in 1938 (Aldcroft, 1970, p.55), with the influence of
fluctuations in exports on output diminishing during the 1930s (Aldcroft, 1970, p.56).
260 The European core includes: Austria, Belgium, Denmark, Finland, France, Germany, the Netherlands, Norway, Sweden, Switzerland, and the UK (Klasing and Milionis, 2014, p.195-196).
D.P. Jordan
Page 206 of 317
Imports as a share of net national income also declined, from 26.7 per cent in 1929,
to 17.6 per cent in 1938 (Aldcroft, 1970, p.245). This reflected the wider international
experience of economic recovery in production but not trade, identified by
(Eichengreen and Irwin, 1995).
Aldcroft (1970, p.255) attributes the fall between 1931 and 1933 in the UK’s
imports of manufactured goods to tariffs, rather than prices or domestic incomes. After
1929, countries had raised their tariff levels, such as the United States introducing the
Smoot-Hawley Tariff in 1930 (Eichengreen and Irwin, 1995, p.2). However, the UK
was the last major trader to adopt protectionist policies (Capie, 1981, p.155). The UK
had adopted a limited amount of protection during the 1920s, with tariffs primarily
aimed to protect key industries or generate revenue (NIESR, 1943, p.2-4). Relative to
other countries, the UK’s average ad valorem tariff on manufactured goods in 1925
was low, at only 5 per cent, while the average for Continental Europe was around 25
per cent, and 37 per cent in the US (Kitson and Solomou, 1990, p.4). However, this
situation changed rapidly, and by 1932, “the United Kingdom had become a fully
protectionist country”, with the introduction of the Import Duties Act of 1932, Ottawa
Agreements Act of 1932, and the Irish Free State (Special Duties) Act of 1932, all of
which levied tariffs and enforced quotas on foreign imports (NIESR, 1943, p.5-7).
Three factors influenced the UK’s tariff structure: political influence of interest
groups; large regional differences within the economy; and protection for industries
under severe import pressure (Capie, 1981, p.155). Those industries with least need
for protection had greatest political clout, but they were unable to affect tariff policy,
and there is no evidence that industries were protected by tariffs as a result of import
competition (Capie, 1981, p.172-173). However, regional concerns did receive a
sympathetic hearing, with regional differences influencing the structure of tariffs
(Capie, 1981, p.162).
Protectionist policies therefore did affect the level of trade, but the effect of
preferential trading agreements, such as the Ottawa Agreement, on the direction of
D.P. Jordan
Page 207 of 317
trade is viewed as limited. Using a gravity model, Eichengreen and Irwin (1995)
conclude that protectionist policies did contribute to falling trade, as they helped
prevent trade to recover in-line with output and incomes. However, the formation of
trading blocs was ineffective at redirecting trade, and instead it was existing
commercial and financial linkages which determined the level of trade between
countries (Eichengreen and Irwin, 1995, p.21). Focusing on the Canadian experience,
Jacks (2014) uses a gravity model approach to similarly emphasise the role of existing
linkages, with the preferential protectionism embodied by the Ottawa Agreement
being ineffective at redirecting trade.
Other literature has found that tariffs did alter the geographic direction of trade.
Kitson and Solomou (1990, p.63-65) find that UK tariffs were associated with a
changing pattern of import shares from different countries, particularly for
manufactured goods. De Bromhead et al. (2019) examine the UK’s preferential
protectionist policy in greater detail, using a gravity model and disaggregated import
data across all commodities for the UK. The UK’s protectionist policies of the 1930s
are found to explain increased Imperial imports into the UK, but these only accounted
for around one-quarter of the decline in UK imports between 1929 and 1933 (De
Bromhead et al., 2019, p.348). While the UK’s protectionist trade policy affected the
direction and partly the level of trade, Kitson, Solomou and Weale (1991) conclude
that it had no effect on the recovery of sectors within the UK economy.
While the effect of the Great Depression and protectionist trade policies has
been explored extensively at a national level, there is little analysis of their impact at
the regional level. Writing shortly after the Great Depression, Ghosh (1940, p.497)
stated there had been “a shift in the relative importance of foreign trade and internal
trade”, citing the recovery in world industrial activity between 1929 and 1936, and the
failure of world trade to keep pace. The later findings of Aldcroft (1970) for the UK,
and Eichengreen and Irwin (1995) for the global economy, support this. However, the
lack of trade data has meant the effect of the Great Depression on regional trade has

D.P. Jordan
Page 208 of 317
received little attention. The decline in world trade between 1929 and 1937 affected
the UK’s staple industries, which were geographically concentrated, causing high
regional unemployment (Harley, 2003, p.162). Within the UK, Scotland was already
experiencing de-globalisation during this interwar period (Tomlinson, 2014). Modern
studies have been able to exploit more widely available regional trade data. This is
demonstrated by McCallum’s (1995) seminal paper, which uses a gravity model to
find that trade between Canadian provinces was much greater than trade across the
Canada-US border, relative to what would be predicted given their relative economic
size and distance. This has been labelled as ‘home bias’ in trade (Yi, 2010, p.365).
However, it has not been possible to measure regional trade within the UK for the
interwar period.
While the trade performance of both the UK and Irish Free State during the
Great Depression has received attention, there is little detailed discussion of Northern
Ireland. Instead, Northern Ireland’s trade performance is left to be indirectly inferred
from the perspective of one of its main staple industries: such as Beacham (1944)
and Ollerenshaw (1991) for linen; or Johnson (1985a) and Geary and Johnson (1989)
for shipbuilding. The earliest study of Northern Ireland’s trade is from Fitzsimons,
Hogan and Neary (1999), for 1970 to 1992, which examines it in the context of the
Irish Republic’s trade connections. Thus, there is a failure to empirically measure
Northern Ireland’s trade performance during the interwar period, leaving the impact of
the Great Depression and associated protectionism unknown.
The existing interwar narrative for Northern Ireland’s trade performance is
provided by Buckland (1979, 1981) and Johnson (1985a, 1985b). The region’s
interwar economic problems, of high unemployment and low economic growth, were
the result of the decline of the staple industries, caused by falling global demand.
Johnson (1985a, p.216) goes as far as stating that in an international perspective,
“essentially the province’s economy between the wars was in a hopeless position”.

D.P. Jordan
Page 209 of 317
Northern Ireland’s economic performance is viewed as being determined
exogenously, and inextricably linked to the poor performance of the staple industries.
This argument is encapsulated by Johnson’s (1985a) description of the
interwar fortunes of the staple industries. Despite a short boom for the staple
industries at the beginning of the 1920s, they fared poorly throughout the remainder
of the interwar period, with high levels of unemployment (Johnson, 1985a).
Shipbuilding faced falling global demand, combined with global overcapacity, and a
competitive international market (Johnson, 1985a, p.191-192). The linen industry
similarly experienced a global decline in demand for its products (Johnson, 1985a,
p.196). Agriculture also faced difficult economic conditions, driven by global
oversupply, and sluggish growth in demand (Johnson, 1985a, p.197). While supply-
side challenges are identified by Johnson (1985a), the central argument is that falling
demand was the fundamental reason for the weak performance of these industries,
and thus slow economic growth relative to Britain. This has led to claims from McCann
(2014, p.48), although unsupported by empirical evidence, that it was Northern
Ireland’s reliance on exports to Britain which was to blame for Northern Ireland’s poor
interwar performance.
Johnson (1985b) places Northern Ireland’s experience in the context of the
wider interwar economy of the island of Ireland, comparing it to the Irish Free State,
particularly in relation to agriculture. The economic effects of partition are not viewed
as that great, as while Belfast and Londonderry possessed trading links pre-partition
with northern and western parts of the island, north-south trade links were not that
strong (Johnson, 1985b, p.6). McCann (2014, p.48) presents the contrary view, that
partition had a significant, negative long-run impact on commercial activity near the
Irish border. Johnson (1985b, p.6-7) accepts the Land Boundary may have inflicted
some limited damage to cross border trade, but Northern Ireland benefited from
access to Westminster subsidies for unemployment and agriculture, and tariff free
access to the UK market. Ó Gráda and Walsh (2006) perhaps present a compromise

D.P. Jordan
Page 210 of 317
viewpoint, concluding that while the effect of partition on the border area may have
been negative, the overall effect was relatively small.
A significant event in interwar trade, of which Northern Ireland was part, was
the Anglo-Irish Economic War (Economic War). This exemplifies the rise of
protectionism during the interwar period, but has been studied primarily from the
perspective of the Irish Free State. The Economic War saw tariffs and quotas imposed
by both the UK and Irish Free State on each other’s exports, triggered by a dispute
over the payment of land annuities.261 The arrival of a new Fianna Fáil government,
saw payment of these land annuities to the UK Government withheld, beginning in
July 1932 (Kennedy, Giblin and McHugh, 1988, p.41-42). Westminster immediately
responded by imposing duties on imports from the Irish Free State, to recoup the
revenue through other means (Ó Gráda, 1997, p.5-6), and the Irish Free State
retaliated with similar trade restrictions, including duties imposed on around one-third
of goods imported from the UK (Kennedy, Giblin and McHugh, 1988, p.42).
The Economic War ended in 1938, with existing literature viewing the
Economic War as having ended on favourable terms for the Irish Free State. Against
an estimated £100 million liability in land annuity payments, the Irish Free State only
made a £10 million payment to settle the dispute, while it only experienced an overall
reduction in GNP of around an £31.5 million (O’Rourke, 1991, p.366). Neary and Ó
Gráda (1991) similarly conclude that the combination of a debt write-off with lump-
sum payment, was a beneficial outcome for the Irish Free State. While overall the
Irish Free State is viewed as having ‘won the war’, the impact of trade restrictions on
particular sectors demonstrates the Economic War was not without economic damage
for the Irish Free State. Johnson (1985b, p.17) emphasises that farming, particularly
cattle producers, bore the brunt of the Economic War, and did not regain their
261 These land annuities arose from various Acts, which saw tenants able to purchase their holdings from landlords, and following partition, repay the money lent to them through the Irish Free State Exchequer to the UK Government at Westminster (Kennedy, Giblin, and McHugh, 1988, p.41).

D.P. Jordan
Page 211 of 317
privileged position in the UK market. However, it is recognised by Johnson (1985b),
O’Rourke (1991) and Ó Gráda (1997) that it was not simply the Economic War, but
the wider shift towards protectionist policy, which harmed the Irish Free State’s
economy, creating long-run issues that were not fully resolved until well into the post-
war period.
Smuggling was an important side effect of the Economic War, and Johnson
(1979) explores the issue of cattle smuggling in greater detail. Cattle were the Irish
Free State’s most important export, and following partition, many farmers continued
to ship their produce via Northern Ireland ports (Johnson, 1979, p.43-44). Following
the imposition of protectionist measures by the UK government, including duties and
tariffs, there was a divergence in the price of cattle north and south, with prices falling
more in the Irish Free State than in Northern Ireland (Johnson, 1979, p.44-46).
However, the movement in price in the Irish Free State, and Northern Ireland’s
continued high exports of cattle, suggest cross-border smuggling was relatively
effective, with the true value of cattle exported to Northern Ireland being up to 20 per
cent higher than official records (Johnson, 1979, p.57).
Apart from smuggling, mention of Northern Ireland’s experience of the Anglo-
Irish Economic War is very limited. Discussing the two economies on the island,
Johnson (1985b) suggests that British protectionism of the 1930s was beneficial for
the Northern Ireland economy, but exclusively focuses on agriculture. Until the
introduction of protectionism during the 1930s, agricultural goods were traded
between the Irish Free State and the UK as a part of a free-trade area for foodstuffs
(Johnson, 1985b, p.10). Agriculture in both the Irish Free State and Northern Ireland
faced similar problems of remaining competitive, but both performed well during the
1920s (Johnson, 1985b, p.12-13). From 1932 onwards, falling agricultural prices, due
to world oversupply and slowing population growth, affected both parts of the island,
with Johnson (1985b, p.13) arguing that Northern Ireland benefited from
Westminster’s protectionist trade policies and subsidies for agriculture, while the Irish

D.P. Jordan
Page 212 of 317
Free State was harmed by both measures. Johnson (1985a, p.189-190) suggests that
the aggregate increase in Northern Ireland’s exports to Britain between 1931 and
1935, was a result of the fall in agricultural products being imported from the Irish Free
State to Britain, but does not provide evidence for this assertion. Buckland (1979,
p.46) similarly views the UK’s protectionist trade policy as having benefited
agricultural products, but also manufactured exports from Northern Ireland to Britain.
The degree to which the UK’s protectionist policies aided this good performance in
agriculture is therefore unclear.
The Great Depression saw a collapse in global trade, which was the result of
both falling incomes and increased protectionism. Relative to other countries, the UK
was not as severely affected by the Great Depression, but it did become less open,
with its protectionist trade policies changing who it traded with. However, throughout
these national and international accounts, the effect on regional economies is
unknown. We do not know whether regional trade was as severely affected, or if it
followed the same pattern. The interwar period was also an important time for Anglo-
Irish relations, with the Economic War one of its major features. Yet accounts of the
Anglo-Irish Economic War focus almost exclusively on the economic relations
between the Irish Free State and Britain, with little attention given to Northern Ireland.
The main reason for this has been the lack of regional trade statistics for this interwar
period. New trade data for Northern Ireland therefore provides the opportunity to
understand how Northern Ireland’s trade was affected by the Great Depression and
rise of protectionism. This adds to the existing national and international literature,
and tests the existing narrative of Northern Ireland’s interwar economic performance
against a new data source.

D.P. Jordan
Page 213 of 317
3) Method and data
A shortcoming of previous literature examining Northern Ireland’s interwar economy
is the failure to analyse the region’s trade performance. The focus has been on the
trade performance of specific industries, rather than the overall level of trade, or how
the composition and direction of trade changed over time. The reason for this failure
is the absence of a database for Northern Ireland’s interwar trade. This section begins
by outlining the method used to analyse Northern Ireland’s trade performance. This
is followed by a discussion of the data used to construct a disaggregated time-series
for Northern Ireland’s interwar trade, collected from a new archival source, and the
additional data required for analysis.
(i). Method
In order to systematically analyse Northern Ireland’s interwar trade for the first time,
this Chapter uses a newly constructed database, discussed below, to compare the
overall level of Northern Ireland’s trade with Britain and the Irish Free State. This will
demonstrate how the overall level of Northern Ireland’s imports and exports changed
over time, placing it in the context of the national UK economy, and Northern Ireland’s
closest neighbour, the Irish Free State. This will allow comparisons of the timing and
extent of the impact on regional trade from the collapse in world trade, and how and
when the regional economy recovered.
This will be followed by a discussion of the composition of Northern Ireland’s
trade. When discussing Northern Ireland’s interwar economy, previous literature has
focused on the experiences of linen and shipbuilding, to the exclusion of other
industries. Being able to disaggregate Northern Ireland’s imports and exports, it will
integrate other sectors into the analysis of the regional economy, and demonstrate
the relative importance of the staple industries to Northern Ireland’s experience of the
Great Depression. This will include a discussion of how Northern Ireland’s trade

D.P. Jordan
Page 214 of 317
performance was linked with the wider regional economy, and whether Northern
Ireland’s problems of high unemployment and slow regional growth, as predicted by
Thirlwall’s (1980) regional model.
Finally, this Chapter will discuss how the direction of Northern Ireland’s overall
trade changed over time, making use of the disaggregated information contained
within the database. This will show how integrated the Northern Ireland economy was
with both Britain and the Irish Free State, and the extent of home bias in Northern
Ireland’s trade. Finally, the effect of the rise in protectionism on Northern Ireland’s
trade is explored. This includes the estimation of econometric models for both
Northern Ireland’s imports and exports, based on the methods of De Bromhead et al.
(2019) and Fukao, Okubo and Stern (2003) respectively. Finally, there is an analysis
of the impact of the Anglo-Irish Economic War on Northern Ireland’s trade with the
Irish Free State, relative to that of Britain.
(ii). Main data source
Under the Government of Ireland Act 1920, the UK government at Westminster was
responsible for determining trade policy, and administering all matters in relation to
Customs and Excise.262 Therefore, throughout the interwar period, H.M. Customs and
Excise were responsible for collecting trade statistics for the UK, which were
published in the Annual Statement of Trade of the United Kingdom. This included
Northern Ireland’s foreign trade recorded by H.M. Customs and Excise, at Northern
Ireland’s ports and at the Land Boundary with the Irish Free State. However, this
publication did not include Northern Ireland’s domestic (or cross-channel) trade with
Britain.
262 See Ulster Year Book, 1926, p.59.

D.P. Jordan
Page 215 of 317
While H.M. Customs and Excise did not collect statistics for this cross-channel
trade, as this was internal to the UK,263 Stormont’s Ministry of Commerce did collect
these cross-channel statistics. This was because Stormont received its share of
Customs and Excise revenue as part of its Reserved revenue from Westminster, with
the calculation of Stormont’s share of this revenue based on the level of consumption
of dutiable goods in Northern Ireland.264 Therefore, to know Northern Ireland’s
consumption of dutiable goods, and calculate Stormont’s share of revenue, it was
necessary to track cross-channel trade.265 Stormont collected these statistics from
port authorities, using the declarations made by shippers of goods between Northern
Ireland and Britain, to keep track of the movement of all goods, not just those which
were dutiable.266 Stormont combined these statistics with those collected by H.M.
Customs and Excise, to publish its own Summary of the Trade of Northern Ireland,
but these provided only aggregated trade statistics, and did not differentiate between
cross-channel and direct-foreign trade.267
However, two previously unexploited sources of statistics for Northern
Ireland’s trade exist. These are the original, disaggregated, handwritten, trade
statistics for Northern Ireland, from which the Ministry of Commerce published the
Summary of the Trade of Northern Ireland. There are two sources: a series of ledgers
for cross-channel and direct-foreign trade at Northern Ireland’s ports (port ledgers),
and a series of trade books for trade across the Irish Land Boundary (Land Boundary
books), both held at the Public Record Office of Northern Ireland (PRONI).
263 H.M. Customs and Excise did not collect these statistics, because “for fiscal purposes Great Britain and Northern Ireland form a single unit and Customs “entries” are therefore not required in respect of goods passing between the two areas” (Ulster Year Book, 1935, p.76). 264 See Ulster Year Book (1926, p.59). 265 Stormont’s share of dutiable revenue = the net duty collected in Northern Ireland from goods imported directly from outside the UK (direct-foreign trade) + the amount of duty attributable to goods originating from outside the UK imported into Northern Ireland through Britain – the duty attributable to goods originating from outside the UK exported through Northern Ireland into Britain. 266 See Ulster Year Book (1926, p.60). 267 Summaries were also published in the Ulster Year Book.

D.P. Jordan
Page 216 of 317
The statistics contained within these two sources are disaggregated by
commodity and location. The first source is the port ledgers, which cover Northern
Ireland’s trade via its ports, and includes both annual direct-foreign and cross-channel
trade, disaggregating imports and exports to the level of around 500 commodities,
recorded by port of arrival or departure.268 These trade statistics were based on the
recording of weight of goods traded, with values assigned by the Ministry of
Commerce. While this process is not ideal, there is no reason to believe these
assigned values do not reflect true values any more or less than the statistics collected
by H.M. Customs and Excise.269 The second source is the Land Boundary books,
which provide disaggregated statistics for imports, exports, and re-exports of around
1,500 commodities across the Irish Land Boundary. The advantage of combining
these sources over the published trade statistics, is the ability to differentiate between
cross-channel and direct-foreign trade, and greater disaggregation across
commodities over time.270
Digitising and combining these two sources presented several challenges.
This included the categorisation of commodities, combining the port ledgers with the
Land Boundary books, missing values, and the inability to differentiate trade with the
Irish Free State via the sea from other direct-foreign trade. How these were overcome,
and the limitations they place on analysis, are discussed in greater detail in Appendix
A. None of these issues pose a fundamental barrier to an analysis of Northern
Ireland’s interwar trade. While it would be desirable to have the statistics for trade with
the Irish Free State via the sea separated from other foreign trade for the 1930s, it
does not fundamentally change the conclusions drawn from the analysis, as Appendix
268 PRONI: COM/38/2/2 to COM/38/2/17. These ledgers’ existence appears to be the result of the aggregation of monthly trade statistics, but for which only records relating to 1941 survive (see folders within PRONI: COM/38/3). 269 Appendix A discusses the limitations of these statistics in more detail. 270 For example, statistics for tobacco were not published separately in the Summary of the Trade of Northern Ireland, but are recorded separately in the port ledgers and Land Boundary books.

D.P. Jordan
Page 217 of 317
A discusses. Digitising and combining these two sources of statistics provides a new
time-series for Northern Ireland’s trade, starting in 1924, the first full year following
the introduction of the Land Boundary,271 and ending in 1937, the last full year of the
Anglo-Irish Economic War. This time-series is disaggregated across 39 main groups
of commodities, 4 main classes of commodity (food, drink, tobacco; raw materials;
manufactured goods; and livestock), plus the totals for these classes, and an overall
total. The format of this is shown in Table 3.B.1 in Appendix B. Due to how the trade
statistics were recorded across the two sources, and with limited time and resources,
it was only possible to digitise the total value of commodities.272
(iii). Additional data sources
To make relevant comparisons with the trade of Britain and the Irish Free State,
additional data is required. The main source of trade statistics used for comparisons
with the UK and Irish Free State is Mitchell (1988), which is disaggregated into three
classes of commodity: food, drink, tobacco (including livestock); raw materials; and
manufactured goods. Given the relative differences in the sizes of the three
economies, and hence their trade, annual population estimates from Mitchell (1988)
were used to compare the level of trade per capita for both imports and exports over
time.273
An important contribution of collecting trade statistics for Northern Ireland, is
the ability to use these to calculate Britain’s trade within the UK for the first time. This
is possible because the new trade data for Northern Ireland differentiates between
cross-channel, direct-foreign, and Land Boundary trade. To calculate Britain’s trade
271Border controls were imposed between the Irish Free State and Northern Ireland from 1st April 1923, after the Irish Free State took responsibility for Customs and Excise. See Denton and Fahy (1993) for a detailed timeline of events. 272 To record the quantity and value of every single commodity recorded would have required 434,000 observations to be digitised from the handwritten records. 273 These annual population estimates are the same as those used and discussed in Chapter 1.

D.P. Jordan
Page 218 of 317
this firstly involved digitising the necessary classes and subclasses of UK trade from
Annual Statement of Trade of the United Kingdom, to correspond with the 39
commodities digitised for Northern Ireland. Britain’s imports (exports) of a particular
class were then calculated as: the total UK value, plus the value of Northern Ireland’
cross-channel exports (imports), minus the value of Land Boundary imports (exports),
and minus the value of Northern Ireland’s direct-foreign imports (exports).
To undertake econometric analysis of the impact of the UK’s protectionist
trade policies on Northern Ireland’s trade, measures of trade barriers were required.
This involved collecting from the Annual Statement of Trade of the United Kingdom,
the total value of imports for each of the digitised classes and subclasses of
commodities from the new Northern Ireland trade data. The equivalent total UK
revenue data for each of these classes and subclasses was also collected from the
same source, to calculate an ad valorem tariff rate for each category of good, to be
used as the tariff variable in the models estimated. Revenue generated from trade
with the Irish Free State was also published separately in Annual Statement of Trade
of the United Kingdom, and this allowed ad valorem rates for commodities specific to
the Irish Free State to be calculated. This is discussed in further detail in Section 5(ii).
Finally, throughout the analysis, the values of imports and exports were
adjusted to control for inflation, using a seasonally adjusted price indicator, published
by the ONS (2004, 2020), with all values converted to 1972 prices. Ideally this would
be done individually for each commodity, using the prices at which they were traded,
but this is complicated by the data remaining aggregated to some degree, the
incompatibility of some of the port and Land Boundary volume statistics, and no ready
access to the equivalent data already digitised for the UK and the Irish Free State.
Given the primary aim is to measure the performance of Northern Ireland’s trade
relative to Britain and the Irish Free State, rather than simply its absolute level, using
a general price deflator was the best available method.

D.P. Jordan
Page 219 of 317
4) Impact of the Great Depression on trade
This section discusses the level and composition of Northern Ireland’s trade, making
direct comparisons with equivalent data for Britain and the Irish Free State. This
demonstrates that Northern Ireland’s trade performance was more resilient than either
Britain or the Irish Free State following the Great Depression. This resilience was
driven by trade with Britain, and the recovery in exports is shown to be the result of
the staple industries, particularly textiles and shipbuilding.
(i). Level of trade
The first area of analysis is the total value of Northern Ireland’s direct-foreign trade,
compared with Britain and the Irish Free State, and shown in Figure 3.1. This foreign
trade is all direct trade with foreign countries, split between imports and exports.274
Panel A and Panel B show that Northern Ireland had the lowest level of foreign imports
and exports per capita respectively, while Britain had the highest. This lower level of
trade per capita reflects part of Northern Ireland’s foreign trade was through goods
being sold to firms in Britain, which were subsequently exported abroad, as well as
foreign imports arriving in Northern Ireland through Britain (Isles and Cuthbert, 1957,
p.90). Unfortunately, this indirect-foreign trade can not be differentiated from domestic
trade with Britain. Thus Northern Ireland’s foreign trade appears relatively lower than
the true figure would be. However, if it is assumed that foreign trade is a reasonable
proxy for Northern Ireland’s unobservable foreign trade, then it provides a way of
measuring its performance relative to Britain and the Irish Free State following the
Great Depression.
274 For Northern Ireland, foreign trade was all trade external to the UK (direct-foreign trade via sea plus trade across the Irish Land Boundary), which does not include cross-channel trade with Britain. For Britain, foreign trade was calculated as total UK foreign trade, minus Northern Ireland’s direct-foreign trade, and not including cross-channel trade between Britain and Northern Ireland. Foreign trade for the Irish Free State remained unmodified.

D.P. Jordan
Page 220 of 317
Figure 3.1: Total value of foreign imports and exports per person
Sources: see text.
0
50
100
150
192
4
192
5
192
6
192
7
192
8
192
9
193
0
193
1
193
2
193
3
193
4
193
5
193
6
193
7
£ (
1972 p
rices)
Panel A: Total value of foreign imports per person
GB IFS NI
0
50
100
150
192
4
192
5
192
6
192
7
192
8
192
9
193
0
193
1
193
2
193
3
193
4
193
5
193
6
193
7
£ (
1972 p
rices)
Panel B: Total value of foreign exports per person
GB IFS NI
40
60
80
100
120
140
192
4
192
5
192
6
192
7
192
8
192
9
193
0
193
1
193
2
193
3
193
4
193
5
193
6
193
7
Panel C: Index of total foreign imports (1928=100)
GB IFS NI
40
60
80
100
120
140
160
192
4
192
5
192
6
192
7
192
8
192
9
193
0
193
1
193
2
193
3
193
4
193
5
193
6
193
7
Panel D: Index of total foreign exports (1928=100)
GB IFS NI

D.P. Jordan
Page 221 of 317
While Northern Ireland’s level of foreign trade per capita was lower for both
imports and exports, the performance of its imports and exports was good relative to
Britain and the Irish Free State. Panel C and Panel D respectively show the level of
direct-foreign imports and exports per capita as an index, with a base year of 1928.
The base year was chosen as 1928, because this was the final year before the onset
of the Great Depression. This shows that Northern Ireland’s direct-foreign imports
experienced a similar decline to Britain and the Irish Free State, albeit with a lower
trough in 1933, at 42 per cent below its 1928 level, compared to lows of 37 per cent
below for Britain, and 31 per cent below for the Irish Free State in the same year. This
was followed by a recovery in Northern Ireland’s direct-foreign imports, which saw it
almost match the level of Britain in 1937, and be slightly ahead of the Irish Free State.
However, this was still 14 per cent below its 1928 level by 1937.
Panel D in Figure 3.1 suggests a slightly different conclusion for Northern
Ireland’s direct-foreign exports. Northern Ireland’s direct-foreign exports had been
declining rapidly since 1924, but where Britain’s foreign exports declined rapidly after
1929, both Northern Ireland and the Irish Free State saw a more gradual decline. Both
then saw their foreign exports fall further than Britain’s, to around 60 per cent below
their 1928 level by 1933. While the Irish Free State remained at this level, Northern
Ireland’s foreign exports recovered rapidly, almost reaching their pre-crash level by
1936. This was a much more rapid recovery than that experienced by Britain.
This direct-foreign trade does not tell the whole story for Northern Ireland, as
it excludes its trade with Britain. Figure 3.2 therefore compares the total value of
Northern Ireland’s imports and exports, including cross-channel trade with Britain,
against the total trade of Britain and the Irish Free State. Panel A and Panel B in
Figure 3.2 show that imports and exports per capita were much higher for Northern
Ireland than either Britain or the Irish Free State, when cross-channel trade is
included. This is consistent with regional economies having a relatively larger trade
sector in comparison to national economies (Thirlwall, 1980, p.419).

D.P. Jordan
Page 222 of 317
Figure 3.2: Total value of all imports and exports per person
Sources: see text.
0
50
100
150
200
250
300
192
4
192
5
192
6
192
7
192
8
192
9
193
0
193
1
193
2
193
3
193
4
193
5
193
6
193
7
£ p
er
capita (
1972 p
rices)
Panel A: Total value of imports per capita
GB IFS NI
0
50
100
150
200
250
300
192
4
192
5
192
6
192
7
192
8
192
9
193
0
193
1
193
2
193
3
193
4
193
5
193
6
193
7
£ p
er
capita (
1972 p
rices)
Panel B: Total value of exports per capita
GB IFS NI
40
60
80
100
120
192
4
192
5
192
6
192
7
192
8
192
9
193
0
193
1
193
2
193
3
193
4
193
5
193
6
193
7Panel C: Index of total imports (1928=100)
GB all imports IFS all imports NI all imports
40
60
80
100
120
192
4
192
5
192
6
192
7
192
8
192
9
193
0
193
1
193
2
193
3
193
4
193
5
193
6
193
7
Panel D: Index of total exports (1928=100)
GB all exports IFS all exports NI all exports

D.P. Jordan
Page 223 of 317
Panel C and Panel D in Figure 3.2 present indexes for the total value of all
imports and exports respectively. From this it is clear that both Northern Ireland’s
imports and exports were not as severely affected as either Britain or the Irish Free
State. Imports into Northern Ireland had returned to their pre-crash level by 1936, at
a time when the foreign imports of Britain and the Irish Free State were still around
20 per cent down. Similarly, Northern Ireland’s exports had returned to almost its pre-
crash level by 1936, and this strong recovery saw it reach 6 per cent above its pre-
crash level, when Britain was still 20 per cent below, and the Irish Free State was 48
per cent below.
These results demonstrate that Northern Ireland’s trade performance was
much more resilient than that of either Britain or the Irish Free State following the
Great Depression. This was primarily driven by cross-channel trade with Britain, as
well as a strong recovery in direct-foreign exports. This presents a very different
picture from the existing narrative for Northern Ireland during the interwar period. This
narrative views Northern Ireland’s export industries being hit hard by falling demand
following the Great Depression, with a relatively weak economy which experiences
little rebound (Buckland, 1979, 1981; Johnson, 1985a, 1985b). Yet what emerges
from this new trade data is that the trade sector of the Northern Ireland economy was
more resilient than previously thought. This evidence for Northern Ireland instead
supports the wider international narrative (Ghosh, 1940; Eichengreen and Irwin,
1995), that the recovery in the world economy was driven by economic activity within,
rather than between, countries.
This is supported by placing Northern Ireland’s regional trade performance in
the context of the foreign trade performance of other countries, shown in Figure 3.3.
For both imports in Panel A, and exports in Panel B, Northern Ireland’s regional trade
performance equates to the national trade performance of countries which were least
negatively affected following the Great Depression.

D.P. Jordan
Page 224 of 317
(ii). Composition of trade
Northern Ireland’s trade performed well relative to Britain and the Irish Free State
during the Great Depression. Was this the result of trade remaining high across all
commodities, or was this driven by specific commodities? The new dataset for
Northern Ireland allows this question to be answered, as imports and exports are
disaggregated by class, across: food, drink, tobacco; raw materials; manufactured
Figure 3.3: Northern Ireland’s trade in international context (1928=100)
Source: Constructed from Mitchell (2013) for all countries except Northern Ireland.
0
20
40
60
80
100
120
140
160
180
1928 1929 1930 1931 1932 1933 1934 1935 1936 1937
Panel A: Import index
NI US Denmark France
Germany Australia New Zealand Japan
0
20
40
60
80
100
120
140
160
180
1928 1929 1930 1931 1932 1933 1934 1935 1936 1937
Panel B: Export index
NI US Denmark France
Germany Australia New Zealand Japan

D.P. Jordan
Page 225 of 317
goods; and livestock. For comparisons with Britain and the Irish Free State, the fourth
category of livestock is included within food for Northern Ireland, reflecting this
categorisation within the trade statistics of Britain and the Irish Free State sourced
from Mitchell (1988).
Figure 3.4 shows the composition of Northern Ireland’s trade, with Panel A
showing this for imports, Panel B showing this for exports, and Panel C showing the
balance of trade for each of the four classes of commodities. Manufactured goods
accounted for the largest share of Northern Ireland’s trade, followed by food, drink,
tobacco, and then the much smaller classes of raw materials and livestock. Panel C
shows that Northern Ireland was a net importer or food, drink, tobacco, and raw
materials, and a net exporter of manufactured goods and livestock. The deficit in food,
drink, tobacco and surplus in manufactured goods both vanished immediately
following the Great Depression, but returned by 1933. Livestock maintained a surplus
throughout, with this growing after 1932.
Northern Ireland’s surplus in manufactured goods can be seen as reflecting
the importance of manufacturing to the regional economy. Since the nineteenth
century, Northern Ireland was renowned as the industrial region on the island of
Ireland (Ollerenshaw, 1985, p.62). Raw materials were needed to provide the inputs
for these manufactured goods, hence the persistent and sizeable trade deficit for this
category. The trade deficit in food, drink, tobacco would be expected to reflect
Northern Ireland agriculture specialising in certain goods, and that Northern Ireland
was not producing all of its requirements. The surplus in livestock reflected the re-
export of imports of livestock from the Irish Free State. The increase in the surplus for
livestock after 1932 reflects the widespread smuggling taking place during the Anglo-
Irish Economic War, identified by Johnson (1979), following the tariffs imposed by the
UK on imports of livestock from the Irish Free State. This would explain the artificial
increase in Northern Ireland’s surplus in livestock during the mid-1930s.

D.P. Jordan
Page 226 of 317
The changing balances of trade evident in Panel C suggests the Great
Depression did have an effect across all classes of commodities, but that Northern
Ireland’s trade was broadly reverting to its pre-crash pattern by 1937. The
performance of each class can be analysed, and compared against the equivalent
classes for Britain and the Irish Free State, to see which contributed most to the
resilience of Northern Ireland’s trade, and whether Northern Ireland experienced
similar trends.
Figure 3.4: Northern Ireland’s trade disaggregated by class
Source: See text.
0
50
100
150
200
250
300
350
192
4
192
5
192
6
192
7
192
8
192
9
193
0
193
1
193
2
193
3
193
4
193
5
193
6
193
7£ m
illions (1972 p
rices)
Panel A: Imports by class
Food Raw materials Manufactures Livestock
0
50
100
150
200
250
300
350
192
4
192
5
192
6
192
7
192
8
192
9
193
0
193
1
193
2
193
3
193
4
193
5
193
6
193
7£ m
illions (1972 p
rices)
Panel B: Exports by class
Food Raw materials Manufactures Livestock
-40
-20
0
20
40
£ m
illions (1972 p
rices)
Panel C: Trade balance by class
Food Raw materials Manufactures Livestock

D.P. Jordan
Page 227 of 317
a) Food, drink, tobacco
Figure 3.5 compares the total value of Northern Ireland’s imports and exports of food,
drink, tobacco per capita against those of Britain and the Irish Free State. Food, drink,
tobacco includes all agricultural produce, such as grain, meat, and processed food,
as well as drink, tobacco, and livestock. Northern Ireland’s imports and exports per
capita are shown in Panel A and Panel B respectively. Northern Ireland had the
highest imports of food, drink, tobacco per capita, followed by Britain and the Irish
Free State, with all three following a similar pattern. Exports of food, drink, tobacco
display a slightly different story, with Northern Ireland having much higher trade per
capita than Britain, and being slightly above the Irish Free State’s level as well.
That Northern Ireland’s exports of food, drink, tobacco per capita matched
those of the Irish Free State is contrary to what might be expected.275 On the island
of Ireland, the Irish Free State is characterised as the highly agricultural economy at
this time, while Northern Ireland is characterised as the industrial centre of the island.
However, in terms of exports, Northern Ireland was matching the level of the Irish
Free State. This made Northern Ireland potentially as vulnerable to falling demand for
agricultural goods as the Irish Free State. However, changes in Northern Ireland’s
trade in food, drink, tobacco more closely reflected Britain than the Irish Free State.
Part of Northern Ireland’s overall recovery in trade was the ability of food exports to
return more quickly to being closer to their pre-crash level. In contrast, the poor
performance of the Irish Free State’s food exports stands out, with their failure to
recover coinciding with the Anglo-Irish Economic War.
275 Even if re-exports were able to be differentiated for trade with Britain, to take account of Irish Free State exporting food through Northern Ireland to Britain, this would be expected to bring Northern Ireland’s exports down to around the same level as the Irish Free State.

D.P. Jordan
Page 228 of 317
Panel C and Panel D in Figure 3.5 present an index of Northern Ireland’s
imports and exports of food, drink, tobacco, with a base year of 1928, to compare the
Figure 3.5: Total value of trade in food, drink, tobacco
Source: See text.
Source: see text.
0
20
40
60
80
100
192
4
192
5
192
6
192
7
192
8
192
9
193
0
193
1
193
2
193
3
193
4
193
5
193
6
193
7
£ p
er
capita (
1972 p
rices)
Panel A: Imports per capita
GB IFS NI
0
20
40
60
80
100
192
4
192
5
192
6
192
7
192
8
192
9
193
0
193
1
193
2
193
3
193
4
193
5
193
6
193
7
£ p
er
capita (
1972 p
rices)
Panel B: Exports per capita
GB IFS NI
40
60
80
100
120
140
160
192
4
192
5
192
6
192
7
192
8
192
9
193
0
193
1
193
2
193
3
193
4
193
5
193
6
193
7Panel C: Imports (1928=100)
GB IFS NI
40
60
80
100
120
140
160
192
4
192
5
192
6
192
7
192
8
192
9
193
0
193
1
193
2
193
3
193
4
193
5
193
6
193
7
Panel D: Exports (1928=100)
GB IFS NI

D.P. Jordan
Page 229 of 317
pattern of trade against Britain and the Irish Free State. For imports in Panel C, the
overall trend experienced by Britain and Northern Ireland is very similar, apart from a
sharp decline for Northern Ireland between 1924 and 1925. Both saw imports per
capita fall by around 30 per cent between 1928 and 1933, followed by a recovery,
although neither regained their pre-crash level by 1937, remaining 15 per cent below.
However, the Irish Free State had a very different experience, with imports falling
faster and further after 1928, to around 50 per cent by 1933, and failing to recover by
1937.
For exports in Panel D of Figure 3.5, all three saw a similar pattern prior to
1930. However, while Britain and the Irish Free State then experienced declines,
Northern Ireland saw its exports increase by around 20 per cent between 1930 and
1932. This was followed by a sharp fall to the same level as Britain in 1933, before
Northern Ireland experienced a much stronger recovery, to just 4 per cent below its
pre-crash level by 1937, while Britain remained 19 per cent below. The Irish Free
State had also initially experienced a less rapid decline after 1929, but by 1934 its
exports had fallen to 66 per cent below their 1928 level, and these again failed to
recover significantly, remaining 48 per cent below their pre-crash level by 1937.
To understand which commodities within food were driving Northern Ireland’s
relatively strong recovery, Table 3.1 and Table 3.2 give the average annual weighted
percentage change of each commodity within the food, drink, tobacco class of goods.
This measures the contribution of each commodity to the class’s overall change in
total value, for imports and exports respectively, across three time periods.276 The
three time periods reflect before the Great Depression (1925-1928), during the Great
Depression (1929-1932), and the period of recovery (1933-1937).
276 This was constructed by calculating the annual growth rate in per cent of the value of each commodity imported and exported, weighted by its share of the overall total value of food, drink, tobacco imported or exported that year. This was averaged for each time period, to show each commodity’s relative contribution.

D.P. Jordan
Page 230 of 317
Table 3.1: Average annual weighted percentage change in
value for imports of food, drink, tobacco
Commodity 1925-1928 1929-1932 1933-1937
Alcoholic beverages -0.3 -0.1 +0.5
Fish -0.2 0 +0.1
Fruit +0.1 +0.1 -0.1
Milk and cream 0 0 0
Butter -0.2 +0.2 +0.2
Cheese 0 0 0
Cocoa -0.2 -0.1 0
Coffee 0 0 0
Eggs +0.1 -0.4 -0.2
Feeding stuffs +0.2 -0.2 +1.7
Grain and flour -0.8 -2.6 +3.5
Meat -0.2 -0.8 -0.5
Other vegetables 0 0 +0.3
Potatoes +0.1 +0.5 +0.4
Preserved fruit 0 0 0
Other food -1.0 +0.7 +0.7
Tea -0.2 0 +0.1
Tobacco +0.3 +2.6 -0.5
Livestock -7.8 -4.6 -1.6
Source: See text.
Table 3.2: Average annual weighted percentage change in
value for exports of food, drink, tobacco
Commodity 1925-1928 1929-1932 1933-1937
Alcoholic beverages -2.5 -0.7 +1.1
Fish +0.1 +0.1 +0.3
Fruit +0.1 +0.2 +0.3
Milk and cream 0 0 +2.9
Butter 0 -0.1 -0.1
Cheese 0 0 0
Cocoa 0 0 +0.9
Coffee 0 0 0
Eggs -1.0 +0.6 +0.8
Feeding stuffs 0 -0.1 -0.2
Grain and flour -0.3 -1.0 +0.1
Meat +1.2 -0.9 +3.9
Other vegetables 0 0 +0.7
Potatoes +0.9 +3.1 +1.8
Preserved fruit 0 0 0
Other food -0.4 -0.6 -0.2
Tea 0 0 +1.3
Tobacco +0.3 +16.3 -3.8
Livestock -5.6 -3.4 +10.5
Source: See text.

D.P. Jordan
Page 231 of 317
In Table 3.1, the commodities which contributed most to imports of food, drink,
tobacco, with a positive weighted growth of over 1 per cent during the period of
recovery, were grain and flour (+3.5 per cent), and feeding stuffs (+1.7 per cent).
However, nearly all commodities saw positive growth, the only exceptions being
livestock (-1.6 per cent), tobacco (-0.5 per cent), meat (-0.5 per cent), eggs (-0.2 per
cent), and fruit (-0.1 per cent). For tobacco, this reflected the contraction following a
sizeable increase between 1930 and 1932, while meat and livestock were both
continuing a decline which had been taking place since the 1920s.
In Table 3.2, the commodities which contributed most to exports of food, drink,
tobacco, with a positive weighted growth of over 1 per cent during the period of
recovery, were meat (+3.9 per cent), milk and cream (+2.9 per cent), potatoes (+1.8
per cent), tea (+1.3 per cent), and alcoholic beverages (+1.1 per cent). Growth in
exports of food, drink, tobacco was therefore spread across a number of different
commodities, with nearly all remaining commodities experiencing positive growth,
with the only exceptions being tobacco (-3.8 per cent), feeding stuffs (-0.2 per cent),
other food (-0.2 per cent), and butter (-0.1 per cent). This decline for tobacco again
reflected it being the commodity driving the strong growth in exports of the food, drink,
tobacco category between 1930 and 1932, before seeing saw a sizeable decline.
Table 3.1 and Table 3.2 show that Northern Ireland’s more resilient trade in
food, drink, tobacco was not driven by one single commodity, but across several. In
imports, only grain and flour, and feeding stuffs stand out, with growth otherwise
evenly spread. In exports, stronger growth was experienced across a number of
commodities, but again there were few commodities which experienced negative
growth. The only commodity which stands out for affecting the class’s overall total in
earlier periods is tobacco, the strong growth of which affected the overall class at the
beginning of the 1930s, but reverted to its previous level within a few years.

D.P. Jordan
Page 232 of 317
b) Raw materials
Figure 3.6 compares the total value of Northern Ireland’s imports and exports of raw
materials per capita, against Britain and the Irish Free State. Raw materials include
those from mining and quarrying, coal, raw textile materials, and wood and timber.
Northern Ireland’s imports and exports per capita are shown in Panel A and Panel B
respectively. During the 1920s, Northern Ireland’s imports of raw materials were
between those of the very low level of the Irish Free State, and the much higher level
of Britain. The onset of the Great Depression saw this change, as Britain’s imports fell
rapidly, and from 1930 onwards, Northern Ireland’s level of imports was similar to
Britain’s. In exports, Northern Ireland was again lower than Britain during the 1920s,
but much higher than the Irish Free State. Again, following the onset of the Great
Depression, the gap between Britain and Northern Ireland closed, remaining at a
similar level for the rest of the 1930s.
Panel C and Panel D in Figure 3.6 respectively present an index of the imports
and exports of raw materials, with a base year of 1928. For imports in Panel C, apart
from substantial increases in 1929 and 1930, Northern Ireland followed a similar
pattern to the Irish Free State. Neither experienced Britain’s steep decline after 1929.
Indeed, by 1933 Northern Ireland’s imports had almost returned to their 1928 level,
and by 1937 were 44 per cent above. This was almost matched by the Irish Free
State, which was 34 per cent above its 1928 level by 1937, while Britain was only just
returning to its 1928 level.
For exports in Panel D of Figure 3.6, all three experienced a similar pattern
during the 1920s. This pattern continued, with all three experiencing a similar decline
following the onset of the Great Depression, although it was most severe for the Irish
Free State, which fell to 58 per cent below its 1928 level by 1932. Northern Ireland
and Britain did not fall below 60 per cent of their 1928 level, and by 1937 had
recovered to their 1928 level, with the Irish Free State still 10 per cent below following
a strong recovery after 1934.

D.P. Jordan
Page 233 of 317
Figure 3.6: Total value of trade in raw materials
Source: see text.
0
10
20
30
40
50
192
4
192
5
192
6
192
7
192
8
192
9
193
0
193
1
193
2
193
3
193
4
193
5
193
6
193
7
£ p
er
capita (
1972 p
rices)
Panel A: Imports per capita
GB IFS NI
0
2
4
6
8
10
12
192
4
192
5
192
6
192
7
192
8
192
9
193
0
193
1
193
2
193
3
193
4
193
5
193
6
193
7
£ p
er
capita (
1972 p
rices)
Panel B: Exports per capita
GB IFS NI
40
60
80
100
120
140
160
192
4
192
5
192
6
192
7
192
8
192
9
193
0
193
1
193
2
193
3
193
4
193
5
193
6
193
7
Panel C: Imports (1928=100)
GB IFS NI
40
60
80
100
120
140
160
192
4
192
5
192
6
192
7
192
8
192
9
193
0
193
1
193
2
193
3
193
4
193
5
193
6
193
7
Panel D: Exports (1928=100)
GB IFS NI
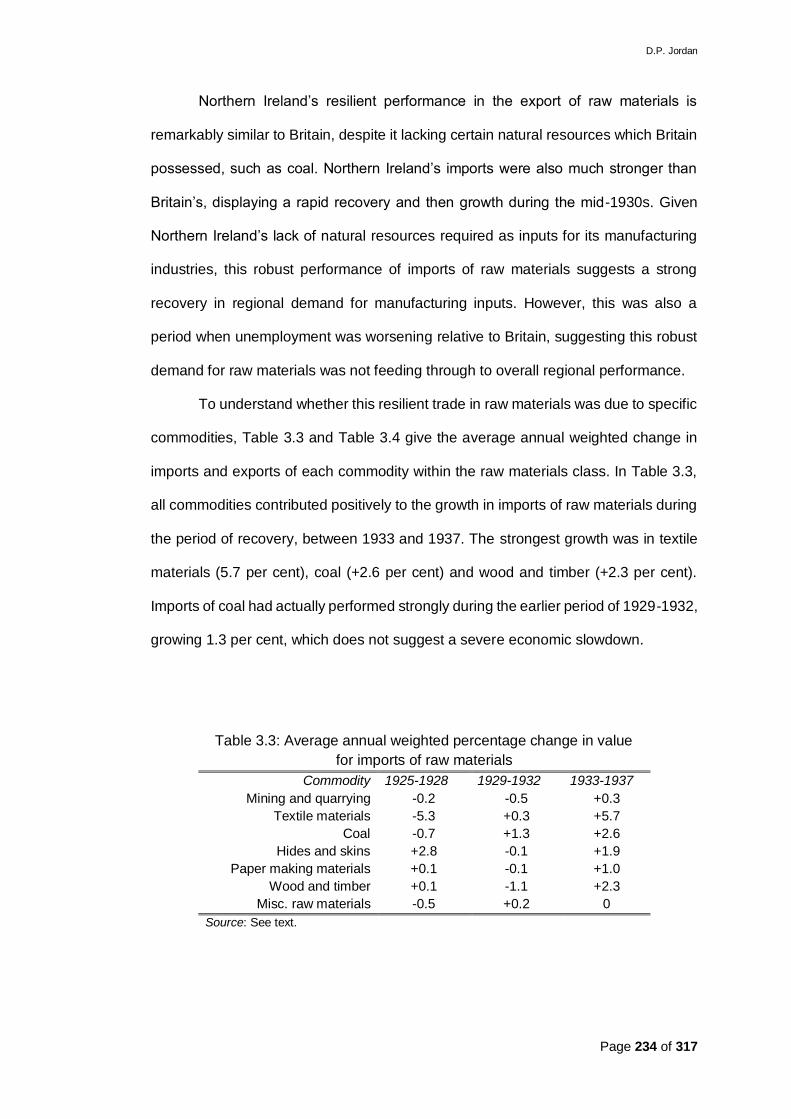
D.P. Jordan
Page 234 of 317
Northern Ireland’s resilient performance in the export of raw materials is
remarkably similar to Britain, despite it lacking certain natural resources which Britain
possessed, such as coal. Northern Ireland’s imports were also much stronger than
Britain’s, displaying a rapid recovery and then growth during the mid-1930s. Given
Northern Ireland’s lack of natural resources required as inputs for its manufacturing
industries, this robust performance of imports of raw materials suggests a strong
recovery in regional demand for manufacturing inputs. However, this was also a
period when unemployment was worsening relative to Britain, suggesting this robust
demand for raw materials was not feeding through to overall regional performance.
To understand whether this resilient trade in raw materials was due to specific
commodities, Table 3.3 and Table 3.4 give the average annual weighted change in
imports and exports of each commodity within the raw materials class. In Table 3.3,
all commodities contributed positively to the growth in imports of raw materials during
the period of recovery, between 1933 and 1937. The strongest growth was in textile
materials (5.7 per cent), coal (+2.6 per cent) and wood and timber (+2.3 per cent).
Imports of coal had actually performed strongly during the earlier period of 1929-1932,
growing 1.3 per cent, which does not suggest a severe economic slowdown.
Table 3.3: Average annual weighted percentage change in value
for imports of raw materials
Commodity 1925-1928 1929-1932 1933-1937
Mining and quarrying -0.2 -0.5 +0.3
Textile materials -5.3 +0.3 +5.7
Coal -0.7 +1.3 +2.6
Hides and skins +2.8 -0.1 +1.9
Paper making materials +0.1 -0.1 +1.0
Wood and timber +0.1 -1.1 +2.3
Misc. raw materials -0.5 +0.2 0
Source: See text.

D.P. Jordan
Page 235 of 317
Table 3.4: Average annual weighted percentage change in value
for exports of raw materials
Commodity 1925-1928 1929-1932 1933-1937
Mining and quarrying +1.5 -1.2 +2.9
Textile materials -0.6 -3.0 +12.5
Coal -0.3 0 -0.8
Hides and skins +2.8 +2.6 +2.7
Paper making materials -0.4 -2.2 +2.1
Wood and timber -0.1 -0.4 -0.2
Misc. raw materials +0.4 -2.9 +2.2
Source: See text.
Table 3.4 gives the contribution of each commodity to the overall change in
the total value of exports of raw material. Nearly all commodities experienced strong
positive growth during the period of recovery. The biggest increase was for textiles
(+12.5 per cent), followed by mining and quarrying (+2.9 per cent), and hides and
skins (+2.7 per cent). The strong growth of textile materials suggests this sector’s
trade was recovering more strongly than the existing narrative for the interwar period
suggest for Northern Ireland. The only exceptions to this positive growth were wood
and timber (-0.2 per cent) and coal (-0.8 per cent). Given Northern Ireland did not
possess its own coal deposits, the fall in coal appears to be linked to the Anglo-Irish
Economic War, and the contraction in coal re-exports through Northern Ireland from
Britain to the Irish Free State.
c) Manufactured goods
The final class of commodities is manufactured goods, shown in Figure 3.7, which
compares the total value of Northern Ireland’s imports and exports of manufactured
goods per capita against those of Britain and the Irish Free State. Panel A and Panel
B show imports per capita and exports per capita respectively. Northern Ireland had
much higher levels of both imports and exports of manufactured goods. It imported
three times as many manufactured goods per capita as the Irish Free State or Britain,
with the Irish Free State importing slightly more than Britain, particularly during the

D.P. Jordan
Page 236 of 317
early 1930s. Northern Ireland’s exports of manufactured goods were again three
times higher than those of Britain, while the Irish Free State’s exports were close to
zero throughout.
Panel C and Panel D in Figure 3.7 present an index of Northern Ireland’s
imports and exports of manufactured goods, with a base year of 1928. For imports in
Panel C, there was a slight upward trend prior to the Great Depression for all three.
This ended in 1929, after which a decline occurred, with Britain seeing the sharpest
fall, to just 45 per cent of its 1928 level by 1933. Northern Ireland and the Irish Free
State also experienced declines, but these were not as far, to only 11 per cent and 19
per cent respectively below their 1928 level by 1933. Thereafter, Northern Ireland
experienced a strong recovery, with imports almost regaining their 1928 level by 1934,
and reaching 14 per cent above their pre-crash level by 1937. Britain’s imports also
experienced strong growth, and by 1937 were just 8 per cent below their 1928. This
saw them overtake the Irish Free State, which did not experience the same recovery,
and saw imports remain 12 per cent below their 1928 level by 1937.
For exports in Panel D, Northern Ireland and Britain had again performed
similarly during the 1920s. The Irish Free State had experienced a decline, followed
by strong growth, but this sizeable variation reflects the relatively low level of
manufactured exports. After 1930, the Irish Free State saw a substantial decline in
exports, falling to 73 per cent below their pre-crash level by 1933, and with no
recovery by 1937. Northern Ireland and Britain saw their manufactured exports fall
from 1930 onwards, but the decline was more severe for Britain, falling to 46 per cent
below their 1928 level in 1932, and only recovering to 26 per cent below by 1937.
Northern Ireland had seen manufactured exports grow by 12 per cent in 1929, and
the subsequent fall was to only 29 per cent below their 1928 level. A rapid recovery
followed, and by 1934 they had almost regained their 1928 level, and by 1937 they
were 12 per cent above.
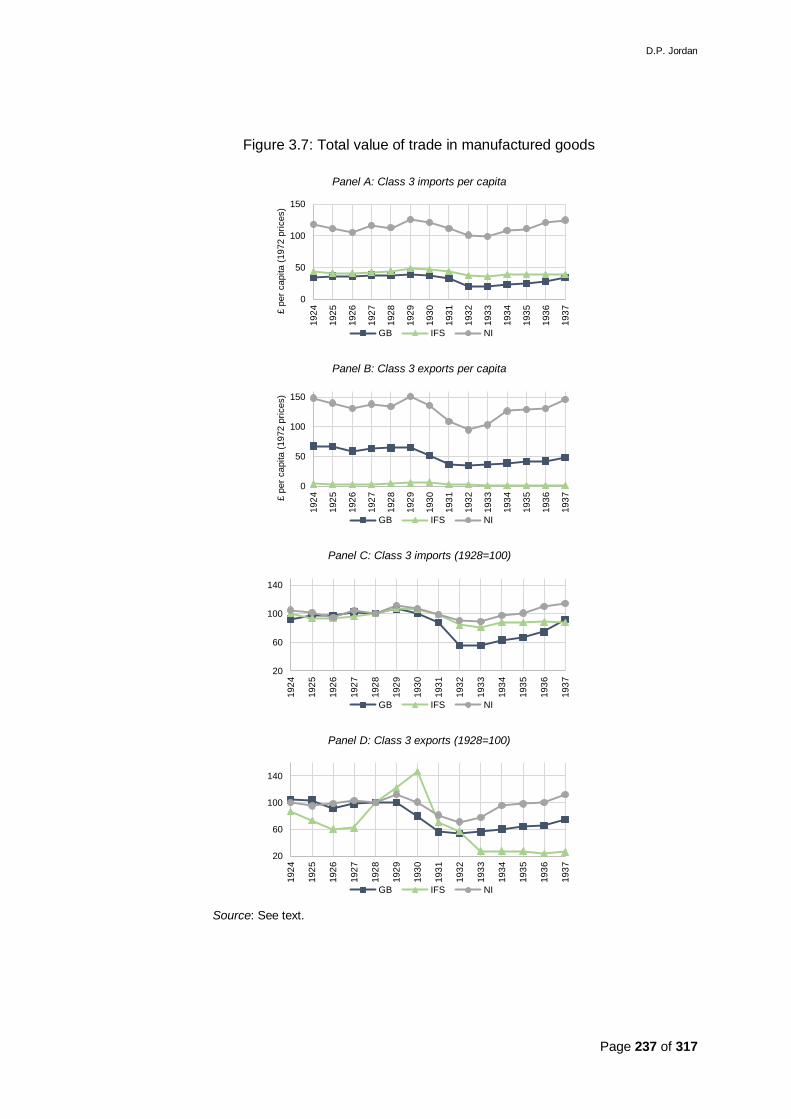
D.P. Jordan
Page 237 of 317
Figure 3.7: Total value of trade in manufactured goods
Source: See text.
0
50
100
150
192
4
192
5
192
6
192
7
192
8
192
9
193
0
193
1
193
2
193
3
193
4
193
5
193
6
193
7£ p
er
capita (
1972 p
rices)
Panel A: Class 3 imports per capita
GB IFS NI
0
50
100
150
192
4
192
5
192
6
192
7
192
8
192
9
193
0
193
1
193
2
193
3
193
4
193
5
193
6
193
7£ p
er
capita (
1972 p
rices)
Panel B: Class 3 exports per capita
GB IFS NI
20
60
100
140
192
4
192
5
192
6
192
7
192
8
192
9
193
0
193
1
193
2
193
3
193
4
193
5
193
6
193
7Panel C: Class 3 imports (1928=100)
GB IFS NI
20
60
100
140
192
4
192
5
192
6
192
7
192
8
192
9
193
0
193
1
193
2
193
3
193
4
193
5
193
6
193
7
Panel D: Class 3 exports (1928=100)
GB IFS NI

D.P. Jordan
Page 238 of 317
Figure 3.7 shows that the resilience of Northern Ireland’s trade performance
was driven by manufactured goods. By 1937, exports of both food, drink, tobacco and
raw materials had almost recovered to their pre-crash level, but it was exports of
manufactured goods which explains Northern Ireland’s overall exports surpassing
their pre-crash level by 1937. Manufactured goods is also the class of commodities
where Northern Ireland differs most from either Britain or the Irish Free State. Northern
Ireland had much higher levels of trade per capita in these, and was not as severely
affected by the Great Depression, compared to Britain or the Irish Free State. The
conclusion from this is that the performance of the manufacturing sector in Northern
Ireland was relatively strong during the 1930s. This is supported by the similarly strong
performance of raw material imports, needed to supply inputs for the manufacturing
sector. This is contrary to the existing narrative for the regional economy, which sees
this period as one of decline rather than recovery.
To understand which commodities within manufactured goods were driving
this resilient trade performance, Table 3.5 and Table 3.6 give the average annual
weighted change for imports and exports for each commodity within manufactured
goods. In Table 3.5, the commodities which contributed most to imports of
manufactured goods during the period of recovery were metal manufactures (+1.1 per
cent), textile manufactures (+1.0 per cent), and machinery (+0.9 per cent). The
remaining commodities all experienced either positive or zero weighted growth, and
none saw negative growth.277
In Table 3.5, the commodities which contributed most to the recovery in
exports of manufactured goods were vehicles, locomotives and ships (+15.6 per
cent), textile manufactures (+6.1 per cent), and machinery (+0.8 per cent). This was
277 An outlier in the earlier, pre-Great Depression period is imports of coke and manufactured fuel, with growth of +2.8 per cent. This was due to an over 1,500 per cent increase in imports in 1926, almost exclusively by sea from foreign countries. This reflects the period when coal imports from Britain were severely affected by the General Strike, and thus coke and manufactured fuel were imported to replace this.

D.P. Jordan
Page 239 of 317
a particular reversal of fortunes for textile manufactures, which had experienced
declines in the previous periods, before and during the Great Depression. In the
remaining categories there was either positive or zero weighted growth, except for
miscellaneous manufactures, which saw a small decrease (-0.1 per cent).
Table 3.5: Average annual weighted change in value for imports of
manufactured goods
Commodity 1925-1928 1929-1932 1933-1937
Chemical manufactures +0.1 0 +0.1
Metal manufactures +0.5 -0.7 +1.1
Textile manufactures -0.7 -1.1 +1.0
Apparel -0.1 -0.2 +0.3
Coke and manufactured fuel +2.8 0 0
Earthenware 0 -0.1 +0.5
India rubber goods 0 0 +0.1
Machinery -0.4 0 +0.9
Wood and timber manufactures 0 +0.1 +0.1
Oils and fats -0.1 0 0
Paper and cardboard +0.1 +0.2 +0.6
Miscellaneous manufactures +0.1 +0.4 +0.1
Vehicles, locomotives and ships 0 +0.2 +0.6
Source: See text.
Table 3.6: Average annual weighted change in value for exports of
manufactured goods
Commodity 1925-1928 1929-1932 1933-1937
Chemical manufactures +0.2 -0.1 +0.1
Metal manufactures 0 -0.1 +0.1
Textile manufactures -2.3 -4.1 +6.1
Apparel +0.2 -0.1 0
Coke and manufactured fuel 0 0 0
Earthenware +0.1 0 0
India rubber goods 0 0 0
Machinery +0.2 -0.4 +0.8
Wood and timber manufactures 0 0 0
Oils and fats -0.1 0 0
Paper and cardboard +0.3 0 +0.4
Miscellaneous manufactures 0 +0.4 -0.1
Vehicles, locomotives and ships +0.1 +1.7 +15.6
Source: See text.

D.P. Jordan
Page 240 of 317
The evidence from individual commodities within manufactured goods
demonstrates that it was the staple industries, of textiles and shipbuilding, which drove
Northern Ireland’s recovery in exports following the Great Depression. These staple
industries also played a role in the recovery of imports of manufactured goods, along
with metal manufactures and machinery. Together with the strong performance of
imports of raw materials, this presents a picture of a regional economy recovering
quickly from the Great Depression, thanks to more resilient trade than either Britain
or particularly the Irish Free State.
Yet this picture of strong manufacturing exports does not fit with the existing
narrative for the Northern Ireland economy, provided by Buckland (1979, 1981) and
Johnson (1985a, 1985b). This existing narrative suggests that manufacturing
performed poorly relative to Britain, as a result of falling demand, with a weak recovery
during the 1930s, due to the poor performance of the staple industries. Northern
Ireland’s trade performance in manufactured goods does not support this narrative.
The results also emphasise the importance of the agricultural sector to
Northern Ireland’s economy. It demonstrates that the characterisation of the Irish Free
State as the agricultural economy, and Northern Ireland as the industrial economy on
the island of Ireland, is perhaps overly simplistic. While Northern Ireland was more
reliant on trade in manufactured goods than the Irish Free State, and imported more
food, drink, tobacco, both economies displayed very similar levels of exports of food,
drink, tobacco. This supports the view that Northern Ireland was an amalgamation of
the manufacturing economy of Britain, and the agricultural economy of the Irish Free
State, and that’s its economic problems are a mixture of those experienced on both
sides of the Irish Sea.

D.P. Jordan
Page 241 of 317
(iii). Demand versus supply explanations
The existing narrative for Northern Ireland’s economy is that it performed poorly during
the interwar period, due to falling global demand in its staple industries, resulting in
high unemployment and low regional growth (Buckland, 1981, Johnson, 1985a,
1985b). This reflects a similar argument for the poorly performing, northern industrial
regions in Britain during the interwar period, where a key reason for their decline was
negative exogenous demand shocks (Gardiner et al., 2013, p.893). Regional growth
theory, as outlined by Thirlwall (1980), supports this demand-centred explanation,
where problems of slow economic growth and high unemployment are the direct result
of a balance-of-payments problem, stemming from a weak trading sector.
In Thirlwall’s model, regional growth is not determined by the supply side, as
factors of production, such as labour and capital, are assumed to be freely mobile
between regions (Thirlwall, 1980, p.90). Instead, Thirlwall (1980, p.91-92) argues that
a lack of demand is to blame, as a change in exports will adjust income enough to
change imports to match the new level of exports: income therefore adjusts to
preserve the trade balance. The inclusion of investment, government expenditure,
saving and taxation, provide the necessary income transfers to compensate for any
trade deficit, ensuring a balance-of-payments equilibrium in the regional model
(Thirlwall, 1980, p.92). The view that unemployment and regional income were
primarily determined by regional exports, is the view of Isles and Cuthbert (1957) for
Northern Ireland’s economy.
Yet the performance of Northern Ireland’s interwar trade, especially its
exports, does not align with this existing narrative. Northern Ireland’s trade following
the Great Depression was more resilient than either the Irish Free State’s or Britain’s,
and even when excluding cross-channel trade with Britain, Northern Ireland’s direct-
foreign exports performed more strongly. It was manufacturing, specifically the staple
industries of textiles and shipbuilding, which saw Northern Ireland’s trade
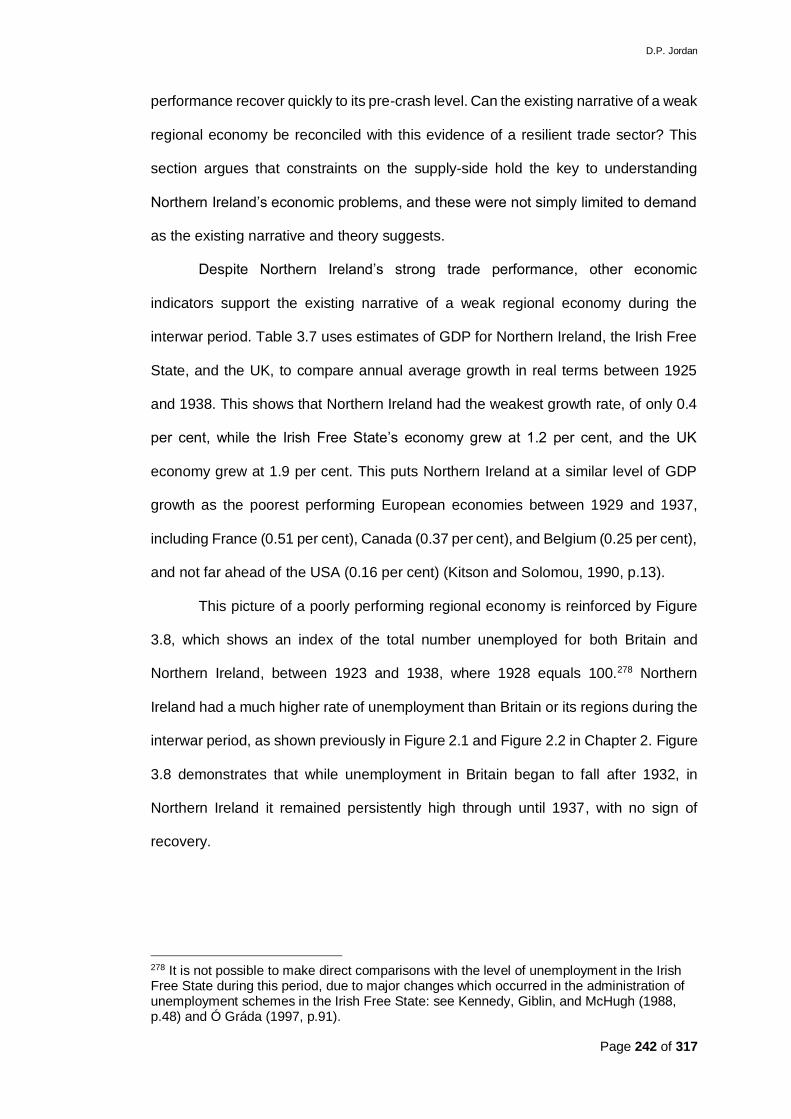
D.P. Jordan
Page 242 of 317
performance recover quickly to its pre-crash level. Can the existing narrative of a weak
regional economy be reconciled with this evidence of a resilient trade sector? This
section argues that constraints on the supply-side hold the key to understanding
Northern Ireland’s economic problems, and these were not simply limited to demand
as the existing narrative and theory suggests.
Despite Northern Ireland’s strong trade performance, other economic
indicators support the existing narrative of a weak regional economy during the
interwar period. Table 3.7 uses estimates of GDP for Northern Ireland, the Irish Free
State, and the UK, to compare annual average growth in real terms between 1925
and 1938. This shows that Northern Ireland had the weakest growth rate, of only 0.4
per cent, while the Irish Free State’s economy grew at 1.2 per cent, and the UK
economy grew at 1.9 per cent. This puts Northern Ireland at a similar level of GDP
growth as the poorest performing European economies between 1929 and 1937,
including France (0.51 per cent), Canada (0.37 per cent), and Belgium (0.25 per cent),
and not far ahead of the USA (0.16 per cent) (Kitson and Solomou, 1990, p.13).
This picture of a poorly performing regional economy is reinforced by Figure
3.8, which shows an index of the total number unemployed for both Britain and
Northern Ireland, between 1923 and 1938, where 1928 equals 100.278 Northern
Ireland had a much higher rate of unemployment than Britain or its regions during the
interwar period, as shown previously in Figure 2.1 and Figure 2.2 in Chapter 2. Figure
3.8 demonstrates that while unemployment in Britain began to fall after 1932, in
Northern Ireland it remained persistently high through until 1937, with no sign of
recovery.
278 It is not possible to make direct comparisons with the level of unemployment in the Irish Free State during this period, due to major changes which occurred in the administration of unemployment schemes in the Irish Free State: see Kennedy, Giblin, and McHugh (1988, p.48) and Ó Gráda (1997, p.91).

D.P. Jordan
Page 243 of 317
Table 3.7: Average annual real growth in GDP and exports
1925-1938
GDP (%) Exports (%)
Northern Ireland 0.4 -0.53
UK 1.9 -3.82
IFS 1.2 -3.54
Sources: For GDP, Northern Ireland and Irish Free State from Geary and Stark
(2019); UK from Maddison (2010). For exports, Northern Ireland see text, Irish
Free State and UK from Mitchell (1988).
Notes: Calculated in 1990 prices, conversion for Northern Ireland and the Irish
Free State using ONS (2004, 2020).
Source: For Britain and Northern Ireland, Mitchell (1988, p.125-126).
Notes:
Together, the relatively low growth rate of GDP and the persistently high rate
of unemployment support the existing narrative. Yet, Northern Ireland’s trade
performance was resilient during this period, and exports of manufactured goods had
nearly returned to their pre-crash level as early as 1934. This relatively more resilient
trade performance is supported by Northern Ireland experiencing an annual average
decrease in the real value of exports of only 0.53 per cent between 1925 and 1938,
shown in Table 3.7, compared to a 3.82 per cent decrease for the UK, and a 3.54 per
0
50
100
150
200
250
1924
1925
1926
1927
1928
1929
1930
1931
1932
1933
1934
1935
1936
1937
Index
Figure 3.8: Index of number unemployed (1928=100)
GB NI
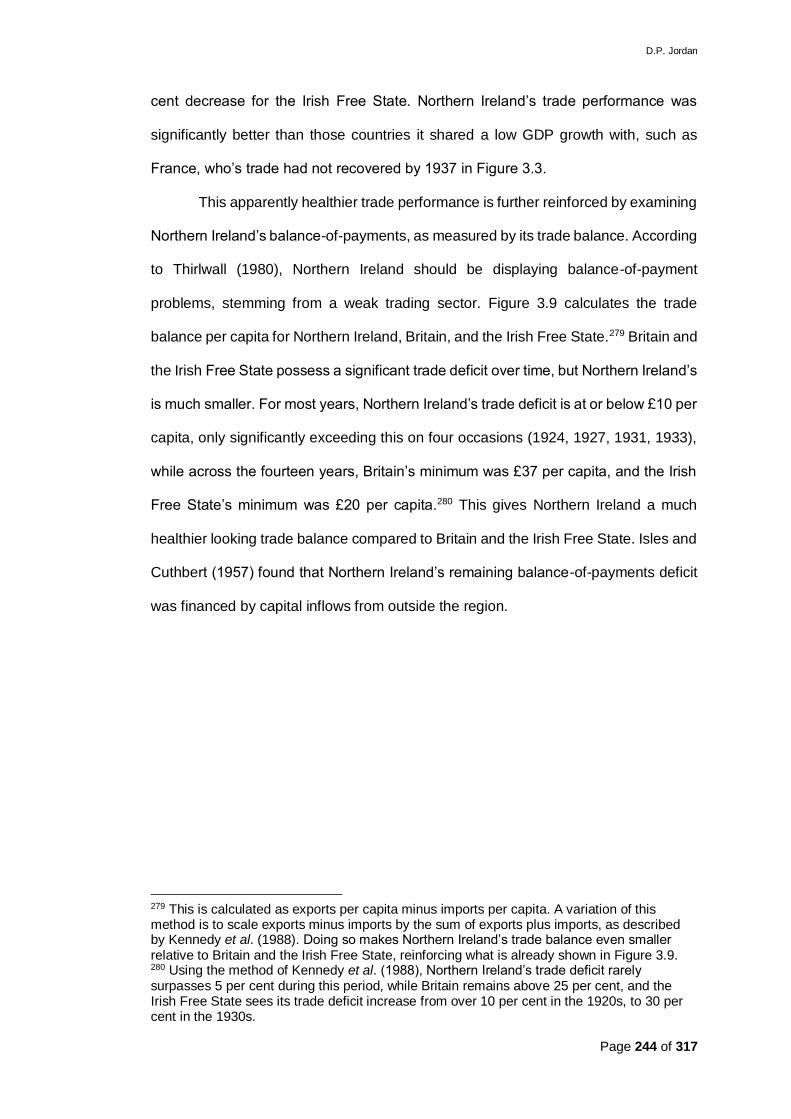
D.P. Jordan
Page 244 of 317
cent decrease for the Irish Free State. Northern Ireland’s trade performance was
significantly better than those countries it shared a low GDP growth with, such as
France, who’s trade had not recovered by 1937 in Figure 3.3.
This apparently healthier trade performance is further reinforced by examining
Northern Ireland’s balance-of-payments, as measured by its trade balance. According
to Thirlwall (1980), Northern Ireland should be displaying balance-of-payment
problems, stemming from a weak trading sector. Figure 3.9 calculates the trade
balance per capita for Northern Ireland, Britain, and the Irish Free State.279 Britain and
the Irish Free State possess a significant trade deficit over time, but Northern Ireland’s
is much smaller. For most years, Northern Ireland’s trade deficit is at or below £10 per
capita, only significantly exceeding this on four occasions (1924, 1927, 1931, 1933),
while across the fourteen years, Britain’s minimum was £37 per capita, and the Irish
Free State’s minimum was £20 per capita.280 This gives Northern Ireland a much
healthier looking trade balance compared to Britain and the Irish Free State. Isles and
Cuthbert (1957) found that Northern Ireland’s remaining balance-of-payments deficit
was financed by capital inflows from outside the region.
279 This is calculated as exports per capita minus imports per capita. A variation of this method is to scale exports minus imports by the sum of exports plus imports, as described by Kennedy et al. (1988). Doing so makes Northern Ireland’s trade balance even smaller relative to Britain and the Irish Free State, reinforcing what is already shown in Figure 3.9. 280 Using the method of Kennedy et al. (1988), Northern Ireland’s trade deficit rarely surpasses 5 per cent during this period, while Britain remains above 25 per cent, and the Irish Free State sees its trade deficit increase from over 10 per cent in the 1920s, to 30 per cent in the 1930s.

D.P. Jordan
Page 245 of 317
Sources: For Northern Ireland, see text. For Britain and the Irish Free State, Mitchell (1988).
Notes: Trade balance per capita calculated as total exports per capita minus total imports per capita.
Northern Ireland’s slow growth and high unemployment relative to Britain fit
Thirlwall’s (1980) model, yet its resilient trade sector and balance-of-payments do not.
Northern Ireland’s exports experienced a recovery in demand, which saw exports
regain their pre-crash relatively quickly, especially compared to the Irish Free State,
which experienced higher economic growth, but no recovery in exports. Northern
Ireland’s balance-of-payments from it trading sector were also stronger than either
Britain or the Irish Free State. An explanation for this contradiction can be attributed
to two reasons, both linked to the supply-side of the regional economy.
The first reason relates to Thirlwall’s (1980) assumption, that factors of
production are perfectly mobile between regions. If they are, then as external demand
falls for a region’s exports, capital and labour will be reallocated within the regional
economy, to whatever areas offer relatively higher returns on these factors of
production. However, as Chapter 2 showed, there were clear barriers to mobility of
capital and labour within the Northern Ireland economy. Existing firms were able to
create these barriers through the regional institutions, including Stormont’s devolved
industrial policy. If we view the staple industries of textiles and shipbuilding as
experiencing a long-run decline, which pre-existed the Great Depression, and barriers
to the reallocation of capital and labour were present throughout, then their swift
-70
-60
-50
-40
-30
-20
-10
0
1924 1925 1926 1927 1928 1929 1930 1931 1932 1933 1934 1935 1936 1937
£ p
er
capita
Figure 3.9: Trade balance per capita
GB IFS NI

D.P. Jordan
Page 246 of 317
recovery in exports was simply a return to their prior low-wage-investment-productivity
equilibrium. With satisficing behaviour evident amongst existing firms, and the barriers
to entry for firms which might compete for capital and labour, the recovery in demand
for exports simply gave existing low productivity firms a short to medium-run reprieve,
increasing the incentive to persist rather than adapt. Given the relative size of the
staple industries within the regional economy, it continued the existing low level of
economic growth.
The second reason relates to the regional multiplier, and the links between the
tradable (basic) and non-tradable (non-basic) sectors within the regional economy.
While the tradable sectors experienced a recovery in demand for their exports, their
improved performance failed to filter through to the rest of the regional economy,
particularly the non-tradable sector, containing firms with little or no exports. This was
reflected by the divergent experiences of unemployment between the tradable and
non-tradable sectors, shown in Figure 3.10. As Panel A shows, the overall rate of
unemployment remained high amongst the insured population in Northern Ireland
throughout the 1930s, despite the recovery in regional exports. In the tradable sector,
exports of manufactured goods had quickly returned to their pre-crash level, and by
1937 were 12 per cent higher. As has been shown, this recovery was primarily driven
by textiles, vehicles, locomotives and ships, machinery, and metal manufactures. This
was reflected by unemployment falling in these sectors: in linen (Panel B),
shipbuilding (Panel C), and engineering (Panel D). In food, drink, tobacco, where
exports were just regaining their pre-crash level by 1937, unemployment was
beginning to return to its pre-crash level (Panel E). However, unemployment remained
persistently high in the non-tradable sectors, including: construction (Panel F),
clothing (Panel G),281 and the distributive trades (Panel H). The recovery of the
281 Clothing included shirt-making for exports, but mainly covered the non-tradable sectors of tailoring and dress making.

D.P. Jordan
Page 247 of 317
tradable sector was failing to be seen in a comparable recovery by the non-tradable
sector within the regional economy.
Figure 3.10: Northern Ireland unemployment by sector
Sources: For Panel A: Mitchell (1988, p.125-126); For Panels B-G: constructed from Isles and Cuthbert (1957, p.578-587). For Panel H: constructed from Ulster Year Book (various years). Notes: For Panels B-G: unemployment at July each year, calculated as total insured workers unemployed divided by total number of workers insured.
0
5
10
15
20
25
30
192
6
192
7
192
8
192
9
193
0
193
1
193
2
193
3
193
4
193
5
193
6
193
7
%
Panel A: Northern Ireland unemployment
0
10
20
30
40
50
60
192
6
192
7
192
8
192
9
193
0
193
1
193
2
193
3
193
4
193
5
193
6
193
7
%
Panel B: Linen unemployment
0
20
40
60
80
100
192
6
192
7
192
8
192
9
193
0
193
1
193
2
193
3
193
4
193
5
193
6
193
7
%
Panel C: Shipbuilding unemployment
0
10
20
30
40
50
192
6
192
7
192
8
192
9
193
0
193
1
193
2
193
3
193
4
193
5
193
6
193
7
%
Panel D: Engineering unemployment
0
5
10
15
20
192
6
192
7
192
8
192
9
193
0
193
1
193
2
193
3
193
4
193
5
193
6
193
7
%
Panel E: Food, drink, tobacco unemployment
0
10
20
30
40
50
192
6
192
7
192
8
192
9
193
0
193
1
193
2
193
3
193
4
193
5
193
6
193
7
%
Panel F: Construction unemployment
0
10
20
30
40
192
6
192
7
192
8
192
9
193
0
193
1
193
2
193
3
193
4
193
5
193
6
193
7
%
Panel G: Clothing unemployment
0
5
10
15
20
25
192
6
192
7
192
8
192
9
193
0
193
1
193
2
193
3
193
4
193
5
193
6
193
7
%
Panel H: Distributive trades unemployment

D.P. Jordan
Page 248 of 317
The failure to see a recovery in exports be translated into wider improved
regional performance can be linked to the supply-side of the regional economy. This
is based on the role of the Keynesian regional multiplier, kr, within the economic base
multiplier model outlined by McCann (2013), and further detailed in Appendix C. In a
regional economy with two sectors, a tradable (basic) sector, and non-tradable (non-
basic) sector, total employment will be a function of the employment generated by
both. Employment in the non-tradable sector will be determined by its sensitivity to
employment growth in the tradable sector, reflecting the strength of demand for local
inputs (McCann, 2013, p.157). This employment linkage within the base multiplier
model, can be shown to be equivalent to the expenditure linkage parameter within the
Keynesian regional multiplier model (McCann, 2013, p.158). This expenditure linkage
parameter is the Keynesian regional multiplier, kr, which is determined by both the
marginal propensity to consume locally produced goods (McCann, 2013, p.169), and
the marginal propensity to invest in the domestic economy (McCann, 2013, p.171). If
the marginal propensity to consume locally produced goods is low relative to the
marginal propensity to import, then the regional multiplier will be low, and any increase
in exports for the tradable sector will not lead to growth, and therefore employment,
in the non-tradable sector.
Evidence for the Northern Ireland economy supports there being weak
linkages between the tradable and non-tradable sectors. As Figure 3.2 showed,
Northern Ireland had much higher imports per capita than either Britain or the Irish
Free State, reflecting a higher propensity to import. The staple industries relied on
imports of raw materials to produce finished goods for export, rather than purchasing
these from within the regional economy. In textiles, linen was heavily dependent on
imports of flax required to produce linen (Beacham, 1944; Ollerenshaw, 1991). In
shipbuilding, there was a reliance on the importation of raw materials such as steel
(Johnson, 1985b). Even when demand increased for goods outside the staple
industries, such as munitions during World War II, this involved work confined to only

D.P. Jordan
Page 249 of 317
a few engineering firms, which imported the necessary raw materials, and exported
the finished goods to Britain, with limited mobilisation of smaller firms in this process
(Ollerenshaw, 2013). Examining the post-war integration of manufacturing in Northern
Ireland, Law (1964) found that newly established, national firms were not well
integrated into the supply-side of the regional economy, with purchases made outside
the region. With raw materials being imported from abroad, any increase in demand
was not going to lead to a strong, direct increase in demand for local inputs.
The failure of exports to generate wider economic growth within the region
was therefore the result of a low regional multiplier. This reflected weak connections
between the tradable and non-tradable sectors, thanks to a high marginal propensity
to import from outside the region. Thus even as the staple industries experienced a
recovery following the Great Depression, this was not more reflected in the wider
health of the Northern Ireland economy. Northern Ireland’s problems of low growth
and high employment should therefore not be simply seen as a result of falling
demand during the interwar period. While this part of the explanation for the long-run
performance of the staple industries, it was not the only constraint. Supply-side
problems also existed, which meant that even with more a resilient export
performance, the regional economy would remain locked in a low-growth equilibrium.

D.P. Jordan
Page 250 of 317
5) Direction of trade and protectionism
The level and composition of Northern Ireland’s trade demonstrates it was more
resilient than either Britain or the Irish Free State to the effects of the Great
Depression. The 1930s saw a rise in protectionism globally, associated with the Great
Depression, and which included the UK. This raises the question of whether Northern
Ireland’s trade benefited from the UK’s protectionist trade policy. Was the resilience
of Northern Ireland’s trade in the face of falling global demand due to the tariffs
imposed on imports by Westminster? This section examines how Northern Ireland’s
imports and exports were affected by the UK’s protectionist trade policy of the 1930s.
The UK’s main protectionist trade policies were introduced in 1932, with the
Import Duties Act, Ottawa Agreements Act, and Irish Free State Special Duties Act
(NIESR, 1943). The Import Duties Act of 1932 applied a general 10 per cent ad
valorem tariff on all foreign imports, with the application of additional duties also
possible (NIESR, 1943, p.5). Other protectionist legislation included the Ottawa
Agreements Act of 1932, which saw increased tariffs on agricultural imports, but with
preferential treatment for Empire countries, and the Irish Free State (Special Duties)
Act of 1932, which levied higher tariffs on imports from the Irish Free State (NIESR,
1943, p.6-7).
Powers over Customs and Excise were Reserved matters under the
Government of Ireland Act 1920 (1920 Act), and so Stormont had no formal say over
the protectionist policies Westminster introduced. Evidence for the interwar period
demonstrates that Stormont also had no informal influence over the UK’s trade policy.
During the 1920s, Stormont failed in its attempts to aid the linen industry gain
protection under the Safeguarding of Industries Acts (Buckland, 1979, p.108).282
Stormont managed to persuade Westminster to let it send some of its own Ministers
to attend the Ottawa Conference in 1932, but this delegation had no formal input, as
282 See Report of the Committee on Handkerchiefs and Household Linen Goods, Cmd. 3096.
D.P. Jordan
Page 251 of 317
Northern Ireland was represented by the UK delegation,283 and there is no evidence
the Northern Ireland delegation had any influence.284 Finally, towards the end of the
1930s, when Westminster was negotiating the end of the Economic War with the Irish
Free State, it did consult Stormont, but only to garner its seal of approval, and
Stormont was unable to alter any trade aspects of the Anglo-Éire Agreements of 1938
(Buckland, 1979, p.110).285 Thus the UK’s protectionist trade policies were
determined exogenously from Stormont’s interests, and any potential positive effect
on Northern Ireland’s trade was not the result of lobbying from Stormont.
The effect of these trade policies has been examined mainly at the
international level, with the effect on regional trade unknown. The existing literature
on Northern Ireland’s interwar economy also devotes little space to the effect of the
UK’s trade policy on the region’s trade performance. Using the newly digitised trade
data for Northern Ireland, it is possible to differentiate between three different
destinations for its imports and exports: Britain (cross-channel), the Irish Land
Boundary, and direct-foreign sea trade. This allows an analysis of the direction of
Northern Ireland’s trade, and what effect protectionist trade policy had on this. The
following sections consider first the direction of Northern Ireland’s trade, before
applying econometric models to establish the importance of the UK’s protectionist
trade policy for this direction of trade. Finally, a closer look is taken at the effect of the
Anglo-Irish Economic War on Northern Ireland’s trade with the Irish Free State,
relative that of Britain.
283 PRONI: CAB/4/302 Memoranda on Imperial Economic Conference, 16th June 1932. 284 See PRONI: CAB/4/304 Cabinet Minutes, 31st August 1932. 285 See also TNA: CAB 27/527 Memoranda of Cabinet Committee on the Irish Situation, Memos 101-140.

D.P. Jordan
Page 252 of 317
(i). Direction of trade
To understand how Northern Ireland’s trade was affected by the UK’s protectionist
trade policies, it is important to firstly examine whether the direction of Northern
Ireland’s trade changed. The direction of trade reflects who Northern Ireland was
trading with. Figure 3.11 shows how Northern Ireland’s trade was distributed across
each of three origins and destinations: Britain (GB), direct-foreign (FOR), and the Irish
Free State (IFS). Panel A and Panel B in Figure 3.11 respectively show how the total
value of Northern Ireland’s imports and exports were shared across each destination.
Britain was the main market for Northern Ireland’s trade between 1924 and 1937, with
an average of 72 per cent of Northern Ireland’s imports, and 88 per cent of its exports
being with Britain. Direct-foreign trade averaged 18 per cent of Northern Ireland’s
imports, and only 3 per cent of its exports, between 1924 and 1937. Finally, trade
across the Land Boundary with the Irish Free State averaged 10 per cent of Northern
Ireland’s imports, and 8 per cent of its exports, between 1924 and 1937.
Panel C and Panel D in Figure 3.11, show the relative performance of Northern
Ireland’s imports and exports by destination over time, where 1928 equals 100.
Northern Ireland’s imports from all destinations behaved similarly prior to the Great
Depression in Panel C. After 1928, direct-foreign imports declined first from 1929
onwards, while those from the Irish Free State did so from a year later in 1930, and
Britain from a further year later in 1931. By 1933, direct-foreign imports were 27 per
cent below their 1928 level, and imports from the Irish Free State were 61 per cent
below, but imports from Britain only 8 per cent below. After 1933, both Northern
Ireland’s direct-foreign imports and imports from Britain experienced strong growth,
and by 1937 were 22 per cent above and 15 per cent above their 1928 level
respectively. In contrast, imports from the Irish Free State remained 56 per cent below
their 1928 level by 1937.

D.P. Jordan
Page 253 of 317
Figure 3.11: Total value of Northern Ireland’s trade by origin/destination
Source: See text Notes: As Northern Ireland’s direct-foreign imports were low relative to those from Britain and the Irish Free State, the relative change in these direct-foreign imports do not fit within the axes of Figure 10 Panel D. The missing values are: 251 for 1924; 201 for 1925; 274 for 1935; 439 for 1936; and 395 for 1937.
0
50
100
150
200
250
300
350
192
4
192
5
192
6
192
7
192
8
192
9
193
0
193
1
193
2
193
3
193
4
193
5
193
6
193
7
£ m
illions (1972 p
rices)
Panel A: Total imports by destination
GB FOR IFS
0
50
100
150
200
250
300
350
192
4
192
5
192
6
192
7
192
8
192
9
193
0
193
1
193
2
193
3
193
4
193
5
193
6
193
7
£ m
illions (1972 p
rices)
Panel B: Total exports by destination
GB FOR IFS
0
25
50
75
100
125
150
192
4
192
5
192
6
192
7
192
8
192
9
193
0
193
1
193
2
193
3
193
4
193
5
193
6
193
7
Panel C: Total imports by destination (1928=100)
GB FOR IFS
0
25
50
75
100
125
150
192
4
192
5
192
6
192
7
192
8
192
9
193
0
193
1
193
2
193
3
193
4
193
5
193
6
193
7
Panel D: Total exports by destination (1928=100)
GB FOR IFS
D.P. Jordan
Page 254 of 317
Panel D of Figure 3.11 presents a similar story for the destination of Northern
Ireland’s exports. Direct-foreign exports had experienced a decline during the 1920s,
which continued into the 1930s, with a lowest point of 62 per cent below their 1928
level in 1932. This was followed by rapid growth, and by 1937 they were 295 per cent
above their 1928 level, and 144 per cent above their 1924 level. These large
percentage changes reflect the relatively small size of Northern Ireland’s direct-
foreign trade, hence a small change in absolute terms led to a significant relative
change in its index level. Exports to the Irish Free State had also been declining during
the 1920s, but the greatest decline was after 1929, and by 1933 they were 62 per
cent below their 1928 level, and remained at this level until 1937. As with imports,
exports to Britain were not as severely affected, falling to only 22 per cent below their
1928 level by 1933, and by 1937 they had risen to 8 per cent above their 1928 level.
A limitation of the data for Northern Ireland’s trade, and shown in Figure 3.11,
is that it does not represent the final destination of goods being transported or shipped
to and from Northern Ireland, only the initial destination. Goods manufactured in
Northern Ireland were often sold to firms in Britain, before being sold on and shipped
abroad (Isles and Cuthbert, 1957, p.90). Therefore, part of Northern Ireland’s cross-
channel trade with Britain included goods subsequently exported to foreign
destinations. Unfortunately, there is no way to accurately quantify how large a
proportion this indirect-foreign trade was of cross-channel trade with Britain. Isles and
Cuthbert (1957, p.90) used confidential information supplied by firms, to conclude that
firms in Northern Ireland exported proportionately more abroad than their counterparts
in Britain, but it was not possible to accurately estimate the scale of this. However,
while it is not possible to accurately estimate the true level of Northern Ireland’s trade
with foreign countries, direct-foreign trade does provide a reasonable proxy.
Assuming that Northern Ireland’s indirect-foreign exports saw declines similar to those

D.P. Jordan
Page 255 of 317
of direct-foreign exports, it suggests that domestic exports to Britain declined relatively
little, and experienced a lesser fall in demand.
The relatively strong performance of trade with Britain and direct-foreign
locations is reflected in these destinations’ respective shares of Northern Ireland’s
trade. Table 3.8 and Table 3.9 measure the average share of imports and exports
respectively by destination, for each of the four classes of goods: (1) food, drink,
tobacco (2) raw materials, (3) manufactured goods, and (4) livestock. This measure
is compared across two periods, 1924-1931 and 1932-1937, which reflect before and
after the introduction of the UK’s protectionist trade policy, and corresponds to the
wider introduction of protectionist trade policy by other countries. Doing so
demonstrates the shift which took place in the destination of Northern Ireland’s
imports and exports.
In Table 3.8, between 1924 and 1931, slightly over half of Northern Ireland’s
food imports came from Britain, just over one-quarter came from foreign countries,
and just under one-fifth came from the Irish Free State. By 1932-1937, this had
changed, with the share of imports of food, drink, tobacco from Britain increasing, and
those from other destinations falling, particularly the Irish Free State, which saw its
share almost half. In raw materials, direct-foreign imports and those from Britain were
almost equally important during 1924-1931, but during 1932-1937, direct-foreign
locations increased their share to just over half. Both Britain and the Irish Free State
saw their share fall, albeit by proportionally more for the Irish Free State, although
these cross-border imports of raw materials were relatively insignificant. For
manufactured goods, Britain was the source of nearly all of Northern Ireland’s imports,
at just over 90 per cent for 1924 to 1931, with this share increasing for 1932 to 1937.
Both direct-foreign and Irish Free State saw their share of manufactured imports
decline for 1932 to 1937, again by proportionally more for the Irish Free State.

D.P. Jordan
Page 256 of 317
Livestock was nearly exclusively imported from the Irish Free State, but even this saw
a decline in its share for 1932 to 1937.
Table 3.8: Share of imports by origin (%)
Class Period GB FOR IFS
1. Food 1924-1931 53.7 27.3 19.0
1932-1937 60.1 29.7 10.2
2. Raw materials 1924-1931 47.9 48.4 3.7
1932-1937 46.1 51.5 2.4
3. Manufactured goods
1924-1931 90.6 6.9 2.5
1932-1937 94.7 4.2 1.2
4. Livestock 1924-1931 0.9 0.0 99.1
1932-1937 2.7 0.1 97.2
Total 1924-1931 68.9 18.1 13.0
1932-1937 75.5 17.8 6.6
Source: See text.
The destination of Northern Ireland’s exports by class, shown in Table 3.9,
reflects a similar pattern to imports. In food, drink, tobacco, Britain was the main
destination, and saw its share across the two periods rise from 81.5 per cent to 92.6
per cent. Direct-foreign exports also saw its share double, although remain small in
absolute terms, while the Irish Free State’s share more than halved, from 17.9 per
cent to 6.4 per cent. For raw materials, Britain was the primary destination, with both
it and direct-foreign exports seeing their share increase, again at the expense of the
Irish Free State’s share, which fell from 23.4 per cent to 14.0 per cent. In
manufactured goods, the Irish Free State’s share of exports again declined. This was
almost exactly mirrored by an increase in direct-foreign’s share, although this was
relatively small in absolute terms. Britain’s share of Northern Ireland’s manufactured
exports remains almost identical. Finally, nearly all of Northern Ireland’s exports of
livestock went to Britain, with its share increasing, due to a fall for exports of livestock
to the Irish Free State.

D.P. Jordan
Page 257 of 317
Table 3.9: Share of exports by destination (%)
Class Period GB FOR IFS
1. Food 1924-1931 81.5 0.5 17.9
1932-1937 92.6 1.1 6.4
2. Raw materials 1924-1931 62.9 13.7 23.4
1932-1937 66.2 19.8 14.0
3. Manufactured goods
1924-1931 90.6 2.9 6.5
1932-1937 90.4 5.7 3.9
4. Livestock 1924-1931 93.0 0.0 7.0
1932-1937 97.9 0.0 2.1
Total 1924-1931 87.3 2.4 10.3
1932-1937 90.9 4.5 4.6
Source: See text.
Overall, Britain’s share of Northern Ireland’s trade increased between the two
periods. This was reflected across all the classes of goods, where Britain’s share
either increased, or at least remained the same, except for a small decline for raw
materials. This supports the conclusion that there was an increase in the home bias
in Northern Ireland’s trade during the 1930s. The other standout feature is the strength
of direct-foreign trade, increasing its share of exports across all classes of goods, as
well as for imports of food, drink, tobacco and raw materials. In contrast, the Irish Free
State’s share of both imports and exports fell across every single class of good.
Perhaps most interestingly, the Irish Free State’s decline in the share of Northern
Ireland’s exports of manufactured goods was almost mirrored by an increase in direct-
foreign’s share, while Britain’s share remained static. This suggests that while
Northern Ireland’s overall trade was increasingly home biased, other foreign
destinations were able to substitute for declining trade with the Irish Free State,
particularly in manufactured goods.
D.P. Jordan
Page 258 of 317
(ii). Effect of UK’s protectionist trade policy
The potential explanation for these changes in the direction of Northern Ireland’s trade
is the UK’s protectionist trade policy of the 1930s. To formally test this, two different
econometric techniques are adopted to examine the effect on Northern Ireland’s
imports and exports respectively. The first technique focuses on imports, and involves
testing whether UK tariffs had a statistically significant effect on where Northern
Ireland imported from. The second technique focuses on exports, and involves testing
whether Northern Ireland’s exports to Britain benefited from UK tariffs.
Since McCallum’s (1995) investigation of the US-Canada border using a
gravity model, their application to trade between countries has become
commonplace, including for interwar trade (Jacks et al., 2011; Estevadeordal, Frantz
and Taylor, 2003; De Bromhead et al., 2019). The most relevant example for
examining Northern Ireland’s imports is De Bromhead et al. (2019), who demonstrate
that the UK’s interwar trade policy affected where the UK’s imports came from. De
Bromhead et al. (2019) use disaggregated data for 847 individual commodities
imported into the UK during the interwar period, from 49 countries and sub-regions,
to examine the effect of UK tariffs. De Bromhead et al. (2019) find that the UK’s
protectionist trade policy increased the share of imports from within the British Empire.
Given the absence of annual estimates of GDP for Northern Ireland, it is difficult to
implement many of the gravity methods in the literature. While the trade data for
Northern Ireland trade is less detailed, covering only 39 commodities across three
destinations, it is still possible though to apply a similar method to De Bromhead et al.
(2019) to this data, to test whether UK trade policy affected Northern Ireland’s imports.
Equation (1) provides the equation to be estimated using a gravity model. The
dependent variable is the log of the value of imports into Northern Ireland, for good g,
from country c, in year t. The dependent variables are: the log of one plus the UK tariff
rate of each class of imported good g, from country c, at time t (which is equivalent to

D.P. Jordan
Page 259 of 317
the trade elasticity); the log of GDP for each country c, at time t; good g times year t,
and good g times country c, fixed effects; and the error term, given by Ɛ for good g,
from country c, in year t. Equation (1) is estimated for the period t equals 1924 to
1937. A Poisson pseudo maximum likelihood (PPML) estimator is used, following the
method of De Bromhead et al. (2019), as under heteroscedasticity, parameters of log-
linearised models estimated by OLS leads to biased estimates of trade elasticities
Equation (1)
ln(NI imports)g,c,t = ln(1 + tariff rateUK)g,c,t + ln(GDP)c,t + dgt + dgc + Ɛg,c,t
The data for Northern Ireland’s imports is limited to three geographical
locations, represented by c. They are: Britain, the Irish Free State, and direct-foreign
trade. The 39 commodities are spread across the four main classes of goods, g, these
being: food, drink, tobacco (18 commodities); raw materials (7 commodities);
manufactured goods (13 commodities); and the remaining class of livestock (1
commodity), which is included within food, drink, tobacco in the model estimation. The
values for Northern Ireland’s imports are nominal values, as are the values used for
the GDP of the UK and Irish Free State, taken from Maddison (2010). As the Irish
Free State was effectively in a currency union with the UK, the exchange rate is not
relevant.
Data on UK tariffs was collected from the Annual Statement of Trade of the
United Kingdom. Tariffs were calculated as ad valorem rates for each commodity, by
dividing the total revenue of each relevant subclass or commodity, by the total value
of foreign imports for that subclass or commodity. As it is the change in UK
protectionist trade policy from 1932 onwards which is of primary interest, these ad
valorem tariffs were collected for all commodities levied under the Import Duties Act
1932 and the Ottawa Agreements Act 1932. Tariffs prior to 1932, and for commodities
not covered by these Acts, were therefore set equal to zero.
D.P. Jordan
Page 260 of 317
The trade statistics for Northern Ireland only indicate whether commodities
were coming from Britain, the Irish Free State, or direct-foreign. Under the UK’s
protectionist trade policy from 1932 onwards, some commodities were subject to
Imperial Preference, where commodities from the Empire could be exempted from
tariffs (De Bromhead et al., 2019, p.332). Within Northern Ireland’s direct-foreign
trade, there is no way of knowing which countries imports were coming from.
Therefore, to calculate the effective ad valorem tariff rates, the total duty collected for
each commodity was divided by the total foreign UK trade in that commodity.
Calculating the ad valorem tariff rate in this way assumes that Northern Ireland’s
pattern of trade with Empire and non-Empire countries was the same for each
commodity, but without knowledge of the exact distribution across countries of
Northern Ireland’s imports, this is the next best method.
As the Economic War saw extra tariffs applied to imports from the Irish Free
State, under the Irish Free State (Special Duties) Act 1932, these were calculated as
the effective ad valorem tariffs from the amount of duty recorded separately in the
Annual Statement of Trade of the United Kingdom under this Special Duties Act, using
the same method as for foreign imports. As with direct-foreign imports, the tariff rate
was set to zero prior to 1932. Finally, for Northern Ireland’s imports from Britain, the
tariff rate is set to zero throughout, as Northern Ireland and Britain were part of a
single customs union, reflecting this being a Reserved power under the 1920 Act.
Table 3.10 gives the results of estimating Equation (1), across six variations
of commodity groupings. Column 1a, Column 2a, and Column 3a estimate the gravity
model across the three categories of food, drink, tobacco (excluding livestock), raw
materials, and manufactured goods. The coefficient for GDP is only statistically
significant in relation to manufactured goods, at the 1 per cent level, while those for
both food and raw materials are both statistically insignificant. The elasticities of trade
with respect to tariffs are negative and statistically significant for both food and

D.P. Jordan
Page 261 of 317
manufactures, at the 5 per cent and 1 per cent levels of significance respectively,
while it is not statistically significant for raw materials.
These results suggest that only Northern Ireland’s imports of manufactured
goods were positively and significantly related to the overall level of macroeconomic
activity. The positive coefficient for manufactured goods in Column 3a, means that a
1 per cent decline in GDP of the originating country was associated with a 0.23 per
cent decline in Northern Ireland’s imports of manufactured goods. The coefficient
being less than one means the demand for imports of manufactured goods was
inelastic in relation to GDP.
The statistically significant, negative coefficients in relation to tariffs for food,
drink, tobacco and manufactured goods, demonstrate that the UK’s protectionist trade
policies did reduce Northern Ireland’s imports from countries subject to tariffs. For
food, drink, tobacco in Column 1a, a 1 per cent increase in the tariff led to a 0.27 per
cent decrease in the value of food imported, while for manufactured goods in column
3a, a 1 per cent increase in the tariff led to a 0.71 per cent decrease in the value of
manufactured goods imported. That the tariff coefficient is larger than the income
coefficient for manufactured goods, suggests that trade costs in the form of tariffs
were more responsible for falls in the value of trade than contractions in income.
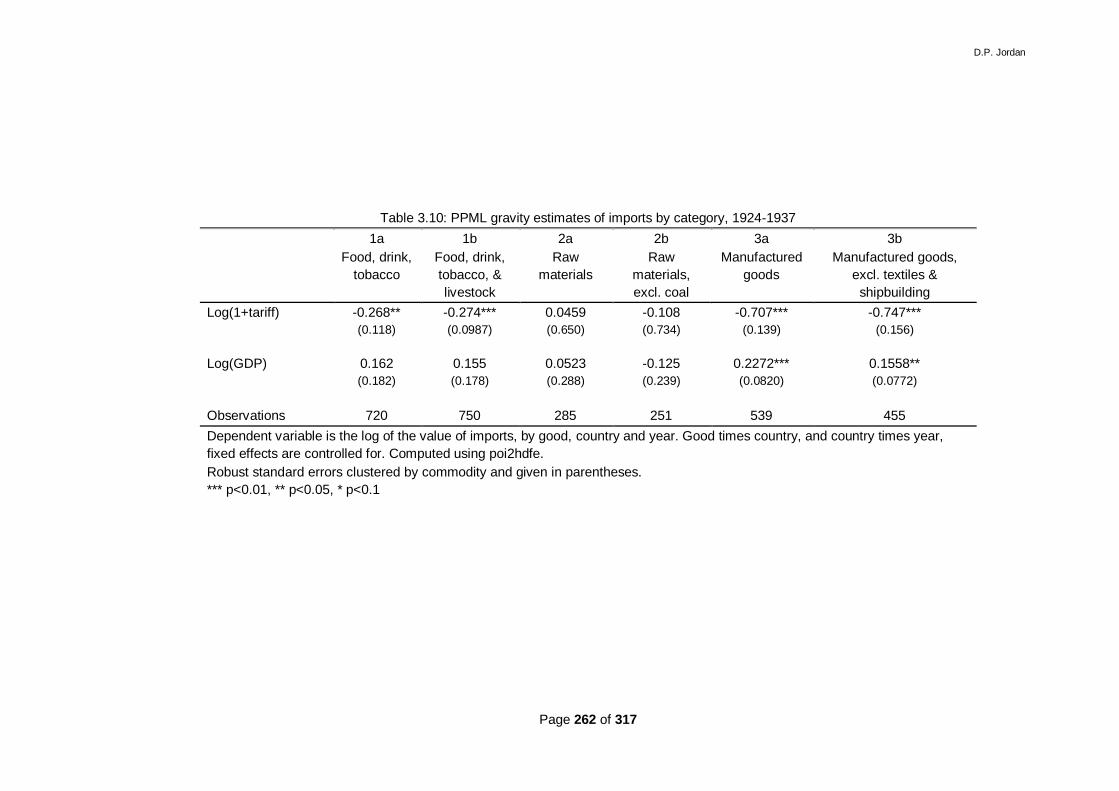
D.P. Jordan
Page 262 of 317
Table 3.10: PPML gravity estimates of imports by category, 1924-1937
1a 1b 2a 2b 3a 3b
Food, drink,
tobacco
Food, drink,
tobacco, &
livestock
Raw
materials
Raw
materials,
excl. coal
Manufactured
goods
Manufactured goods,
excl. textiles &
shipbuilding
Log(1+tariff) -0.268** -0.274*** 0.0459 -0.108 -0.707*** -0.747***
(0.118) (0.0987) (0.650) (0.734) (0.139) (0.156)
Log(GDP) 0.162 0.155 0.0523 -0.125 0.2272*** 0.1558**
(0.182) (0.178) (0.288) (0.239) (0.0820) (0.0772)
Observations 720 750 285 251 539 455
Dependent variable is the log of the value of imports, by good, country and year. Good times country, and country times year,
fixed effects are controlled for. Computed using poi2hdfe.
Robust standard errors clustered by commodity and given in parentheses.
*** p<0.01, ** p<0.05, * p<0.1

D.P. Jordan
Page 263 of 317
The tariff coefficients being less than one for both food, drink, tobacco and
manufactured goods, suggests that the demand for imports of these commodities was
inelastic with respect to tariffs, and relatively more so for food than manufactured
goods. This inelasticity is contrary to the findings of De Bromhead et al. (2019, p.343),
where the coefficient for tariffs was negative, significant, but greater than one,
meaning elastic demand. This differing result for Northern Ireland’s imports may
reflect two characteristics. Firstly, as part of Northern Ireland’s foreign imports came
through Britain indirectly, imports from Britain will contain a mixture of both domestic
and foreign imports. This will bias the coefficient for the tariff variable downwards, as
it will not be able to pick up this effect for the composition of trade with Britain.
Secondly, the demand inelasticity with respect to increased tariffs may reflect that
commodities imported directly into Northern Ireland from foreign countries were of a
type which were relatively price inelastic, meaning they were not as adversely affected
by an increase in their price.
Column 1b, Column 2b, and Column 3b in Table 3.10 repeat the same
estimation of Equation 1, but with differences in the commodities included. In Column
1b, livestock is now included with food, drink, tobacco, to see whether the inclusion of
this commodity, which saw the most severe UK tariffs on imports from the Irish Free
State, affects the tariff coefficient. Including livestock increases the significance to the
1 per cent level of the negative effect of tariffs on food, drink, tobacco imports, but the
coefficient remains relatively unchanged. Column 2b excludes coal from raw
materials, as this was almost exclusively imported from Britain. While this changes
both coefficients from positive to negative, they do not reach even the 10 per cent
level of significance. Column 3b excludes Northern Ireland’s largest staple industries,
textiles and shipbuilding, as these were primarily export driven industries. Doing so
sees both coefficients remaining significant at the 1 per cent level, with a slight fall for
GDP, and a slight rise for tariffs. This suggests that the effect of tariffs on the staple

D.P. Jordan
Page 264 of 317
industries was weaker than for other manufactured goods, but imports of these was
slightly more strongly linked to macroeconomic activity.
The results in Table 3.10 demonstrate that the UK’s protectionist trade policy
of the 1930s did have a statistically significant effect of reducing Northern Ireland’s
imports of those goods within food, drink, tobacco and manufactured goods. However,
UK tariffs had no statistically significant effect on imports of raw materials.
The second area of analysis is the effect of UK tariffs on Northern Ireland’s
exports, specifically its exports to Britain. The hypothesis being tested is that the UK’s
protectionist trade policy benefited those in Northern Ireland exporting to Britain. For
purchasers in Britain, UK tariffs would have made imports from foreign countries more
expensive relative to goods imported from Northern Ireland. This should have resulted
in a redirection of trade, with a shift towards importing goods from Northern Ireland
rather than from abroad, benefiting Northern Ireland exporters to Britain. This would
be evident by Northern Ireland having an increasing share of Britain’s imports.
To test this hypothesis, the method from Fukao, Okubo and Stern (2003) is
adapted, to test whether Northern Ireland’s exports to Britain, of commodities subject
to UK tariffs, grew more quickly relative to Britain’s imports of these commodities from
foreign countries. The equation to be estimated is given by Equation (2), and is a
linear fixed effects model. The dependant variable is the log growth of Northern
Ireland exports to Britain, for good g, in year t. This is calculated as the difference
between the annual log growth of Northern Ireland’s exports to Britain, and the annual
log growth of Britain’s imports from abroad, calculated for each good g in year t. The
dependent variables are: a constant, α; the annual log growth of one plus the UK tariff
rate for each good g, in year t; the annual log growth of UK GDP in year t; good g
times year t fixed effects; and the error term given by Ɛ for good g, in year t.

D.P. Jordan
Page 265 of 317
Equation (2)
∆Relative growth NIexportsGB g,t = α + ∆TariffUK g,t + ∆GDPUK t + dgt + Ɛg,t
Where:
∆Relative growth NI exportsGB g,t = (ln NIexportsGB g,t - ln NIexportsGB g,t-1) - (ln
GBimportsFOR g,t – ln GBimportsFOR g,t-1)
∆TariffUK g,t = ln(1 + tariff rateUK)g,t - ln(1 + tariff rateUK)g,t-1
∆GDPUK t = ln(GDPUK t) – ln(GDPUK t-1)
The data required to estimate Equation (2) comes from the same sources as
for Equation (1). The difference in the estimation of Equation (2) is that it is not a
gravity model, as is instead focusing on the specific relationship between Northern
Ireland’s exports to Britain and the UK’s tariff policy, and excludes trade with the Irish
Free State and direct-foreign trade.
For constructing the dependent variable, the first step involved calculating
Britain’s foreign imports for each commodity, which were calculated as their total UK
value minus the value imported through Northern Ireland. The annual log change in
imports of each good into Britain was then calculated, and subtracted from the annual
log change in Northern Ireland’s exports of each commodity in Britain, to give the
relative growth of Northern Ireland’s exports of each good into Britain. A positive value
for this indicates that Northern Ireland was increasing its share of Britain’s imports for
the good; a negative value indicates that Northern Ireland’s share of Britain’s imports
was decreasing.
For the tariff variable, this was constructed using the effective ad valorem
tariffs calculated for direct-foreign imports from the Annual Statement of Trade of the
United Kingdom, with the modification that tariffs from all of the UK’s protectionist

D.P. Jordan
Page 266 of 317
trade policies were included, covering 1924 to 1937. This covered the Safeguarding
Industries Acts, Import Duties Act 1932, Ottawa Agreements Act 1932, Irish Free
State (Special Duties) Act 1932, and all Other Enactments listed in the Annual
Statement of Trade of the United Kingdom. The total duty raised annually across all
the Acts for each commodity was divided by the total annual value of imports for that
commodity, to give the effective ad valorem tariff rate. The annual log change in the
tariff rate was then calculated. If the hypothesis is true that the UK’s tariff policy
benefited Northern Ireland, with an increase in UK tariffs resulting in an increase in
imports from Northern Ireland, then the coefficient on tariffs should be positive and
statistically significant. No lags of the tariff variable were found to be statistically
significant during estimation, and so none were included in the results reported for
estimation of Equation (2).
The inclusion of the variable for GDP is to measure whether increasing
economic activity in Britain was associated with a greater share of imports from
Northern Ireland. If this were the case, then the coefficient would be positive and
statistically significant. No lags of the UK’s GDP were found to be statistically
significant, and so none were included in the results reported for estimation of
Equation (2). Finally, good times year fixed effects are included. A linear fixed effects
model was chosen, rather than a random effects model, on the basis of the results of
a Hausman test, which showed that the individual errors were correlated with the
regressors.
The results from estimating Equation (2) are presented in Table 3.11. The
model is estimated across different selections of goods in Columns 1 to 9. Column 1
estimates the model across all goods, while Columns 2 to 9 estimate the model across
different combinations of goods, the combinations of which are given in Table 3.B.3
in Appendix B. In Column 1, the coefficient on the UK’s foreign tariff is positive, and
statistically significant at the 1 per cent level of significance. This means that a 1 per
cent increase in the effective ad valorem tariff rate saw a 0.8 per cent increase in

D.P. Jordan
Page 267 of 317
Northern Ireland’s share of Britain’s imports of all goods. The constant was significant
at the 5 per cent level, while the coefficient for GDP did not reach the 10 per cent level
of significance. This initial result supports the hypothesis, that the UK’s tariff policy
benefited Northern Ireland exports to Britain, albeit the effect was inelastic.
To test whether this initial conclusion holds across other goods, Column 2
estimates Equation (2) across all goods within the food, drink, tobacco category. The
coefficient on the UK’s foreign tariff is again positive, and statistically significant at the
1 per cent level. Its coefficient is very similar to that for all goods, and means that a 1
per cent increase in the effective ad valorem tariff rate saw a 0.7 per cent increase in
Northern Ireland’s share of Britain’s imports of food, drink, tobacco.
To test whether this holds across different goods, Column 3 re-estimates the
model for food, drink, tobacco, but excludes ‘exotic’ goods, while Column 4 reverses
this selection, estimating the model only for exotic goods. These exotic goods include
cocoa, coffee, preserved and dried fruit, tea, and tobacco, which are goods Northern
Ireland did not produce, although it did produce manufactured food items within these
groupings.286 Across these two estimations, only the coefficient for UK tariffs in
Column 4 for exotic goods is statistically significant, at the 5 per cent level, with a
similarly sized economic effect as for the overall category of food, drink, tobacco in
Column 2. This suggests that the UK’s foreign tariff was benefitting trade of exotic
goods through Northern Ireland into Britain, rather than more traditional agricultural
goods produced in Northern Ireland.
286 The selection of exotic goods also loosely reflects the colonial goods identified by De Bromhead et al. (2019).

D.P. Jordan
Page 268 of 317
Table 3.11: Linear fixed effects estimates of effect of UK tariffs on Northern Ireland’s exports to Britain, 1924-1937
1 2 3 4 5 6 7 8 9
All goods Food, drink,
tobacco
Food, drink,
excluding
exotic
Exotic food,
drink,
tobacco
Staple
food, incl.
livestock
Staple
food,
excl.
livestock
Raw
materials
Manufactured
goods
Staple
manufactured
goods
GDP UK 0.0120 -0.4942 -0.3516 -0.6698 0.0952 0.0231 0.8045 0.5718 1.318*
(0.3704) (0.5452) (0.5121) (1.562) (0.5714) (0.6273) (1.118) (0.6374) (0.5507)
Foreign tariff rate 0.8031*** 0.7381*** 2.001 0.6993** 2.053 2.036 10.867*** 1.290* 3.152***
(0.2281) (0.1984) (1.1950) (0.1882) (1.1609) (1.1542) (2.1508) (0.6456) (0.5859)
Constant 0.0138** 0.0142* -0.0028 0.0437 -0.0030 -0.0081 -0.0429* 0.0205 -0.0101
(0.0063) (0.0078) (0.0069) (0.0224) (0.0070) (0.0076) (0.0171) (0.0165) (0.0050)
Observations 478 228 169 59 143 130 78 159 78
Dependent variable is the annual log change in the relative growth of Northern Ireland exports to Britain, by good and year. Good times year
fixed effects are controlled for. Computed using a linear fixed effects model.
Robust standard errors clustered by commodity and given in parentheses.
*** p<0.01, ** p<0.05, * p<0.1

D.P. Jordan
Page 269 of 317
That the UK’s tariffs on agricultural products were not benefiting Northern
Ireland’s exports to Britain is not what might be expected. The UK’s trade protectionist
policy targeted a wide variety of agricultural products, and the Economic War saw the
Irish Free State’s agricultural exports specifically targeted. It might therefore be
expected that Northern Ireland would have benefited, by being able to substitute its
own agricultural products for those Britain had been importing from the Irish Free
State.
To further test the effect of UK tariffs on Northern Ireland’s agricultural exports
to Britain, Column 5 and Column 6 focus on the goods which were Northern Ireland’s
staple exports of food, namely: grain and flour, meat, butter, eggs, milk and cream,
fish, potatoes, alcoholic beverages, and livestock. Column 6 repeats this selection,
but excludes livestock. None of the coefficients in either estimation are statistically
significant. This suggests that the UK’s tariffs did not benefit Northern Ireland’s
exports of food to Britain, only its exports of exotic goods.
Column 7 estimates Equation (2) for raw materials. The coefficient on GDP
and the constant are not statistically significant, but the coefficient on the UK’s foreign
tariff is positive and statistically significant at the 1 per cent level of significance. This
means that a 1 per cent increase in the UK’s effective ad valorem tariff rate saw a
10.9 per cent increase in Northern Ireland’s share of Britain’s imports of raw materials.
This is a much larger effect than for food, drink, tobacco, or all goods, and suggests
Northern Ireland’s exports to Britain benefited sizeably from the UK’s protectionist
trade policy.
Column 8 and 9 estimate Equation (2) for different combinations of
manufactured goods. Column 8 includes all manufactured goods, with the coefficients
for GDP and the constant failing to reach any level of statistical significance. The
coefficient on the UK’s foreign tariff is positive, and means a 1 per cent increase in
the UK’s effective ad valorem tariff rate saw a 1.3 per cent increase in Northern

D.P. Jordan
Page 270 of 317
Ireland’s share of Britain’s imports of manufactured goods. However, it only reaches
the 10 per cent level of significance, and so the effect is very weak.
Column 9 changes which goods are included within manufactured goods,
focusing on the staple industries in Northern Ireland, of textiles, engineering,
shipbuilding, and tobacco. This includes the categories of: metal manufactures,
machinery, textile manufactures and vehicles, locomotives and ships, from
manufactured goods; textile manufactures, from raw materials; and tobacco, from
food, drink, tobacco. In Column 9, the coefficient on the UK’s foreign tariff is positive,
and statistically significant at the 1 per cent level. This means a 1 per cent increase
in the UK’s effective ad valorem tariff rate saw a 3.2 per cent increase in Northern
Ireland’s share of Britain’s imports of these staple manufactured goods. The
coefficient on GDP in Column 9 is also positive, although only statistically significant
at the 10 per cent level of significance. This suggests a weak effect for increases in
the UK’s GDP increasing Northern Ireland’s share of Britain’s imports of staple
manufactured goods. The constant in Column 9 is not significantly different from zero.
The results from estimating Equation (2) in Table 3.11 demonstrate that the
UK’s protectionist trade policy did benefit Northern Ireland’s exports to Britain, but
only for specific goods and sectors. While the coefficient for UK tariffs was positive
and statistically significant when the model was estimated across all goods, the
strength and size of this effect varied across groups of commodities. Overall in food,
drink, tobacco, tariffs had a positive and statistically significant effect on Northern
Ireland’s exports to Britain, but this was divided between staple goods and exotic
goods, where it was only exotic goods where the statistically significant result
remained. However, this may reflect that tariffs were placed on exotic goods over a
greater period of time, leading to more precise estimation and thus a statistically
significant result. If food, drink, tobacco were further disaggregated, the coefficient for
UK tariffs may be shown to be statistically significant, as it was not far away from this
in Table 3.11. Northern Ireland’s recovery in exports of food, drink, tobacco in Figure

D.P. Jordan
Page 271 of 317
3.5 Panel D, was therefore partially aided by the UK’s protectionist trade policy, but
also reflected a wider recovery in demand.
The largest effect of the UK’s protectionist trade policy can be seen for raw
materials in Column 7 of Table 3.11. Northern Ireland’s exports to Britain of raw
materials benefited substantially from UK tariffs, with the largest coefficient of any
group of commodities. Therefore, the UK’s protectionist policy contributed to Northern
Ireland’s exports of raw materials returning to their pre-crash level by 1937 in Figure
3.6 Panel D.
Finally, in manufactured goods, not all commodities benefited equally from the
UK’s protectionist policies. Across the category as a whole, there was only a very
weak, positive effect of UK tariffs on Northern Ireland’s exports to Britain. However,
this result changes when Equation (2) is estimated for the staple industries of textiles,
engineering, shipbuilding, and tobacco. Taken together, these commodities in
Column 9 of Table 3.11, had a large, positive, and statistically significant coefficient
for UK tariffs. Therefore, the UK’s protectionist policy contributed to Northern Ireland’s
exports of staple manufactures to Britain increasing. Apart from tobacco, these staple
manufactures were also the commodities which drove the recovery of their respective
trade groups. In raw materials, it was textile materials which experienced the largest
increase in exports between 1933 and 1937 in Table 3.4. In manufactured goods, it
was textile manufactures, vehicles, locomotives and shipbuilding, and machinery,
which contributed most to the recovery and growth in exports between 1933 and 1937.
Therefore, Northern Ireland did benefit from the UK’s protectionist trade
policies, with the resilience of Northern Ireland’s exports of raw materials and
manufactured goods, driven by the staple industries, the direct beneficiaries. This
emphasises the importance national trade policy to regional economic performance.
Although it is beyond the control of a devolved government, these results show
national trade policy can have differing geographic effects within a country, and in the
case of interwar Northern Ireland, it had a positive and economically significant effect.

D.P. Jordan
Page 272 of 317
(iii). Northern Ireland’s trade with the Irish Free State
It is evident that the UK’s protectionist trade policy affected both Northern Ireland’s
imports and exports. An area where this can be most clearly seen is Northern Ireland’s
trade with the Irish Free State. The decline in the Irish Free State’s share of Northern
Ireland’s trade corresponds with the Anglo-Irish Economic War (Economic War).
Despite the Economic War having received great attention in its effects on the Irish
Free State, there has been little examination of the impact on Northern Ireland. This
section therefore examines the impact of the Economic War on Northern Ireland’s
trade across the Land Boundary with the Irish Free State. This demonstrates the
greater vulnerability of Northern Ireland, relative to Britain, from the UK’s trade policy
in relation to the Irish Free State.
The Economic War lasted from 1932 until 1938, and saw significant trade
barriers erected between the two countries. The UK imposed an ad valorem duty of
20 per cent on the Irish Free State’s main agricultural exports, increased by a further
10 per cent in November 1932, with the Irish Free State’s exemption from the UK’s
Import Duties Act 1932 also revoked (Kennedy, Giblin and McHugh, 1988, p.42). In
1933, specific duties were imposed on cattle, while quotas were imposed from 1934
onwards (Kennedy, Giblin and McHugh, 1988, p.42). The Irish Free State’s
responded with the imposition of duties on around one-third of goods imported from
the UK (Kennedy, Giblin and McHugh, 1988, p.42). The Irish Free State continued to
become increasingly protectionist throughout the 1930s: from 68 articles subject to
tariffs in 1931, to 1,947 articles by 1937 (O’Rourke, 1991, p.358), making it one of the
most protected countries in the world (Johnson, 1985b, p.28). An aspect which
mitigated some of the effects of the Economic War was the coal-cattle pacts, which
from 1935 saw UK coal exchanged for cattle from the Irish Free State on a pound-for-
pound basis, and UK duties on cattle reduced from 1936 onwards (Johnson, 1985b,

D.P. Jordan
Page 273 of 317
p.17). The Economic War lasted until 1938, when the Anglo-Irish Trade Agreement
saw the disputed annuity payments ended, in return for a one-off payment of £10
million by the Irish Free State to the UK (Ó Gráda, 1997, p.6).
During the 1920s, trade across the Irish Land Boundary was a significant part
of Northern Ireland’s trade. Between 1924 and 1931, the Irish Free State accounted
for 11.7 per cent of Northern Ireland’s total trade.287 Outside of Britain, the Irish Free
State was Northern Ireland’s single largest trading partner throughout the interwar
period. However, the 1930s saw a marked decline, to only 5.8 per cent of Northern
Ireland’s total trade, and it would be a number of decades before it would return to its
1920s share.288
Figure 3.12 shows how Northern Ireland’s interwar trade with the Irish Free
State was disaggregated across the four main categories of food, drink, tobacco, raw
materials, manufactured goods, and livestock. Panel A of Figure 3.12 shows imports
into Northern Ireland, with food, drink, tobacco and livestock the two main classes of
goods imported from the Irish Free State, with imports of raw materials and
manufactured goods relatively low in comparison. Panel B shows exports from
Northern Ireland, with manufactured goods joining food, drink, tobacco as the main
exports, while raw materials and livestock were relatively low in comparison. Panel C
uses this information to present Northern Ireland’s balance of trade with the Irish Free
State by class of good. Northern Ireland was a clear net importer of food, drink,
tobacco and livestock from the Irish Free State, and a clear net exporter of
manufactured goods, with almost balanced trade in raw materials.
287 See Table 3.B.2 in Appendix B. 288 See Table 3.B.2 in Appendix B.

D.P. Jordan
Page 274 of 317
A feature of both Northern Ireland’s imports and exports in Figure 3.12, is a
distinct change occurring in 1932 after the beginning of the Economic War. In Panel
A, imports into Northern Ireland from the Irish Free State begin to fall in 1931, with
this continuing into 1932, before levelling out at around half their prior level from 1933
onwards. In Panel B, this pattern is repeated, with exports falling in both 1932 and
Figure 3.12: Northern Ireland’s trade with the Irish Free State
disaggregated by class
Sources: See text.
0
10
20
30
40
50
192
4
192
5
192
6
192
7
192
8
192
9
193
0
193
1
193
2
193
3
193
4
193
5
193
6
193
7
£ M
illions (
1972 p
rices)
Panel A: Value of imports from the Irish Free State
Food Raw materials Manufactures Livestock
0
5
10
15
20
25
30
35
40
192
4
192
5
192
6
192
7
192
8
192
9
193
0
193
1
193
2
193
3
193
4
193
5
193
6
193
7
£ m
illions (1972 p
rices)
Panel B: Value of exports to the Irish Free State
Food Raw materials Manufactures Livestock
-20
-15
-10
-5
0
5
10
192
4
192
5
192
6
192
7
192
8
192
9
193
0
193
1
193
2
193
3
193
4
193
5
193
6
193
7
£ m
illions (1972 p
rices)
Panel C: Northern Ireland's trade balance with the Irish Free State
Food Raw materials Manufactures Livestock
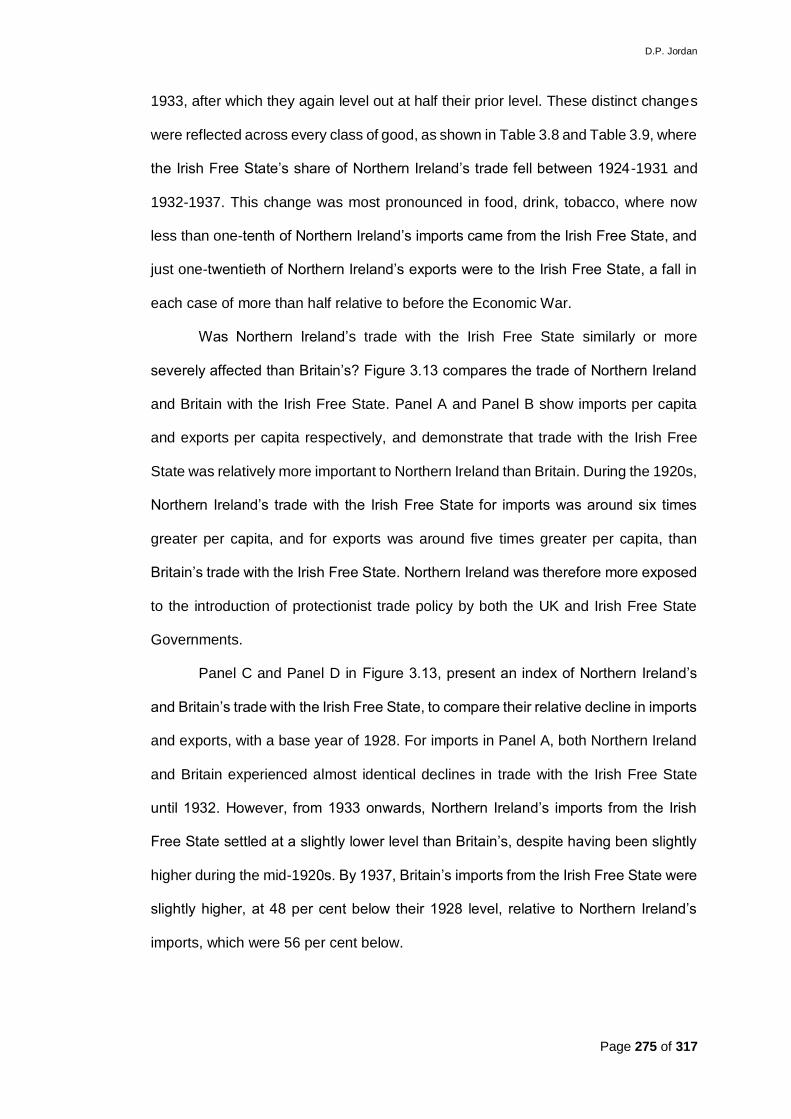
D.P. Jordan
Page 275 of 317
1933, after which they again level out at half their prior level. These distinct changes
were reflected across every class of good, as shown in Table 3.8 and Table 3.9, where
the Irish Free State’s share of Northern Ireland’s trade fell between 1924-1931 and
1932-1937. This change was most pronounced in food, drink, tobacco, where now
less than one-tenth of Northern Ireland’s imports came from the Irish Free State, and
just one-twentieth of Northern Ireland’s exports were to the Irish Free State, a fall in
each case of more than half relative to before the Economic War.
Was Northern Ireland’s trade with the Irish Free State similarly or more
severely affected than Britain’s? Figure 3.13 compares the trade of Northern Ireland
and Britain with the Irish Free State. Panel A and Panel B show imports per capita
and exports per capita respectively, and demonstrate that trade with the Irish Free
State was relatively more important to Northern Ireland than Britain. During the 1920s,
Northern Ireland’s trade with the Irish Free State for imports was around six times
greater per capita, and for exports was around five times greater per capita, than
Britain’s trade with the Irish Free State. Northern Ireland was therefore more exposed
to the introduction of protectionist trade policy by both the UK and Irish Free State
Governments.
Panel C and Panel D in Figure 3.13, present an index of Northern Ireland’s
and Britain’s trade with the Irish Free State, to compare their relative decline in imports
and exports, with a base year of 1928. For imports in Panel A, both Northern Ireland
and Britain experienced almost identical declines in trade with the Irish Free State
until 1932. However, from 1933 onwards, Northern Ireland’s imports from the Irish
Free State settled at a slightly lower level than Britain’s, despite having been slightly
higher during the mid-1920s. By 1937, Britain’s imports from the Irish Free State were
slightly higher, at 48 per cent below their 1928 level, relative to Northern Ireland’s
imports, which were 56 per cent below.
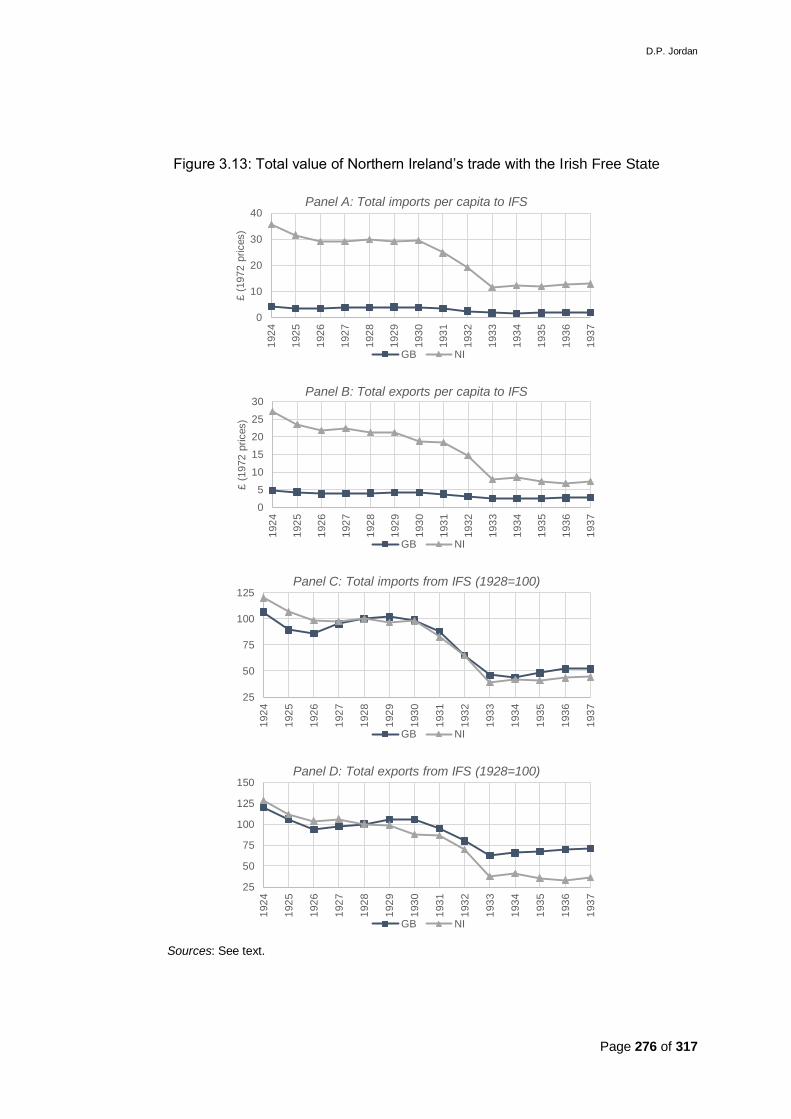
D.P. Jordan
Page 276 of 317
Figure 3.13: Total value of Northern Ireland’s trade with the Irish Free State
Sources: See text.
0
10
20
30
40
192
4
192
5
192
6
192
7
192
8
192
9
193
0
193
1
193
2
193
3
193
4
193
5
193
6
193
7
£ (
1972 p
rices)
Panel A: Total imports per capita to IFS
GB NI
0
5
10
15
20
25
30
192
4
192
5
192
6
192
7
192
8
192
9
193
0
193
1
193
2
193
3
193
4
193
5
193
6
193
7
£ (
1972 p
rices)
Panel B: Total exports per capita to IFS
GB NI
25
50
75
100
125
192
4
192
5
192
6
192
7
192
8
192
9
193
0
193
1
193
2
193
3
193
4
193
5
193
6
193
7Panel C: Total imports from IFS (1928=100)
GB NI
25
50
75
100
125
150
192
4
192
5
192
6
192
7
192
8
192
9
193
0
193
1
193
2
193
3
193
4
193
5
193
6
193
7
Panel D: Total exports from IFS (1928=100)
GB NI

D.P. Jordan
Page 277 of 317
This pattern was repeated more strongly for exports in Panel D of Figure 3.13.
Northern Ireland had seen its exports to the Irish Free State decline more quickly after
1928 than Britain, although again this was a continuation of a decline already present
during the 1920s. A much steeper decline occurred following the beginning of the
Anglo-Irish Economic War, with Northern Ireland’s exports falling to 62 per cent below
their 1928 level in 1933, while Britain’s exports, while also experiencing a steep
decline, fell to only 37 per cent below. By 1937, Britain’s exports had recovered
slightly, to 29 per cent below their 1928 level, but Northern Ireland’s had changed
little, now 64 per cent below.
Northern Ireland’s trade with the Irish Free State was therefore more severely
affected than Britain’s post-1932, particularly for exports. To understand what was
driving this decline in exports, Figure 3.14 compares Northern Ireland’s and Britain’s
exports to the Irish Free State, across the three main classes of goods. This shows
that Northern Ireland’s exports were hit harder than Britain’s across all three classes.
Food, drink, tobacco exports suffered most, with Britain’s falling to just 35 per cent of
their 1928 level from 1933 onwards, but Northern Ireland’s falling even further, to just
20 per cent of their 1928 level. In raw materials, both saw similar declines, until the
coal-cattle pacts saw Britain’s exports recover, reaching to 26 per cent above their
1928 level by 1937, while Northern Ireland’s remained 66 per cent below by 1937.289
In manufactured goods, Northern Ireland’s exports also fell more severely, to 52 per
cent below their 1928 level by 1937, while Britain’s only fell to 19 per cent below.
Thus Northern Ireland’s exports to the Irish Free State were particularly
harmed by the fall in manufactured goods, but the relative decline in food also
contributed. The overall picture was accentuated by the effect of the coal-cattle pacts,
which benefited Britain’s exports of raw materials.
289 The decrease for Britain in 1926 for exports of raw materials to the Irish Free State reflects the General Strike that year in the UK, and its effect on coal.
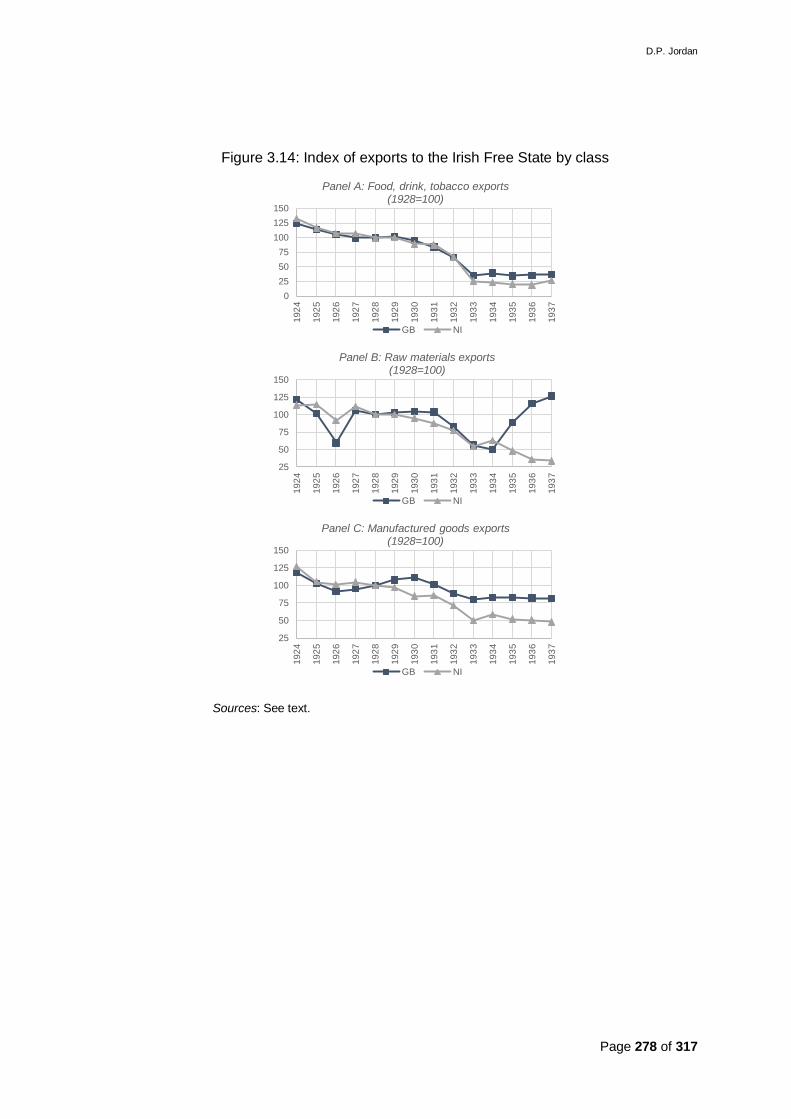
D.P. Jordan
Page 278 of 317
Figure 3.14: Index of exports to the Irish Free State by class
Sources: See text.
0
25
50
75
100
125
150
192
4
192
5
192
6
192
7
192
8
192
9
193
0
193
1
193
2
193
3
193
4
193
5
193
6
193
7
Panel A: Food, drink, tobacco exports (1928=100)
GB NI
25
50
75
100
125
150
192
4
192
5
192
6
192
7
192
8
192
9
193
0
193
1
193
2
193
3
193
4
193
5
193
6
193
7
Panel B: Raw materials exports(1928=100)
GB NI
25
50
75
100
125
150
192
4
192
5
192
6
192
7
192
8
192
9
193
0
193
1
193
2
193
3
193
4
193
5
193
6
193
7
Panel C: Manufactured goods exports (1928=100)
GB NI

D.P. Jordan
Page 279 of 317
6) Conclusion
The existing narrative for the Northern Ireland economy during the interwar period is
that it performed poorly, where falling global demand was responsible for the decline
of the staple industries and high regional unemployment (Buckland, 1981; Johnson,
1985a, 1985b). By utilising a new archival source for Northern Ireland’s trade
performance, it has been demonstrated that this existing narrative is incorrect.
Northern Ireland’s trade was more resilient and not as severely affected by the Great
Depression as the existing narrative suggests. This recovery in exports was driven by
the staple industries, and by 1936 Northern Ireland’s trade had returned to its pre-
Great Depression level, in advance of Britain, and far ahead of the Irish Free State.
Despite Northern Ireland’s relatively stronger recovery in exports, this did not
feed through to the performance of the wider regional economy. Northern Ireland was
experiencing higher unemployment and lower economic growth than either Britain or
the Irish Free State during the interwar period. Existing regional theory from Thirlwall
(1980) suggests these problems of slow growth and high unemployment are a
demand-side problem, caused by a weak trade sector. However, Northern Ireland’s
stronger recovery of exports relative to Britain, demonstrates that the weaknesses in
the regional economy were not simply demand-side problems. Instead, the supply-
side played an important role in the regional economy’s economic performance, linked
to the Keynesian regional multiplier. The weakness of links between the tradable and
non-tradable sectors, meant Northern Ireland’s resilient exports in the staple
industries did not feed through to employment in the non-tradable sector or wider
economic growth. Combined with the existing supply-side weaknesses of the staple
industries prior to the Great Depression, particularly the lack of investment in new,
higher productivity areas discussed in Chapter 2, meant this low regional multiplier
created a barrier to growth within the regional economy.
D.P. Jordan
Page 280 of 317
The 1930s also saw a change in the direction of Northern Ireland’s trade, at a
time when protectionist trade policy was being introduced globally, including by the
UK. There was an associated increase in the home bias of Northern Ireland’s trade,
as Britain accounted for an increasing proportion of Northern Ireland’s trade. In
contrast, the Irish Free State saw its share of Northern Ireland’s trade decline steeply,
with direct-foreign trade and trade with Britain substituting for this. Examining the
effect of the UK’s protectionist trade policy, this is shown to have had a statistically
significant and negative effect on Northern Ireland’s imports of food, drink, tobacco
and manufactured goods. Unlike for the UK as a whole, as estimated by De Bromhead
et al. (2019), the trade elasticities on the UK’s tariffs for imports into Northern Ireland
were less than one. Demand for imports of goods subject to tariffs was therefore
inelastic relative to demand for the UK as a whole.
The redirection of Northern Ireland’s trade was not limited to imports. The UK’s
protectionist trade policy of the interwar period is shown to have benefited Northern
Ireland’s exports, by redirecting these towards Britain. The tariffs imposed on foreign
imports by the UK government, are shown to have had a positive and statistically
significant effect on increasing Northern Ireland’s share of Britain’s imports. This effect
was present across all main commodity groups, but was strongest for raw materials
and manufactured goods from the staple industries. The staple manufactured goods
which saw the strongest recovery following the Great Depression, were also the
commodities which benefited most from the UK’s tariffs. However, there is not enough
evidence to suggest that Northern Ireland’s exports of agricultural products to Britain
also benefited from the UK’s protectionist policy. This is contrary to previous literature
on Northern Ireland (Buckland, 1979, 1981; Johnson, 1985a, 1985b), which viewed
Northern Ireland’s agricultural sector as having benefited from UK protectionist policy.
Finally, Northern Ireland is shown to have been more exposed to the effects
of the Anglo-Irish Economic War than Britain, thanks to much higher trade per capita

D.P. Jordan
Page 281 of 317
with the Irish Free State. While the imports of Britain and Northern Ireland from the
Irish Free State were affected similarly, Northern Ireland’s exports to the Irish Free
State were more severely affected. This was particularly for manufactured goods,
which fell by around half. However, an increase in Northern Ireland’s direct-foreign
exports of manufactured goods were able to compensate for this loss.
This Chapter presents a revised and more positive view of Northern Ireland’s
trade performance during the interwar period. However, there is an apparent
dissonance between this Chapter, where exports of manufactured goods helped drive
Northern Ireland’s more resilient trade recovery, and the findings of Chapter 2, where
manufacturing is shown to have performed relatively poorly. That the recovery in
exports was driven by the staple industries, should be seen as their returning to the
pre-Great Depression level of poor performance, as opposed to any improvement.
This recovery took place before, rather than because of, World War II, which means
the Great Depression was not the hammer blow for these sectors which existing
literature suggests. Instead, the failure of this recovery in demand to translate into
improved economic performance can be linked to the supply-side of the regional
economy, and the Keynesian regional multiplier. This finding aligns with Chapter 2,
which emphasised that it was the characteristics of the supply-side, including regional
institutions, which created barriers to improved economic performance. This also
places the emphasis onto the post-war period for the final decline of the staple
industries. This suggests the recovery in trade prior to the outbreak of war, may have
reduced the incentive for the staple industries to undertake more radical changes to
improve post-war competitiveness, which is supported by Beacham’s (1945) overview
of the limited changes contemplated within textiles to improve post-war
competitiveness.
In the context of the wider literature examining the effect of the Great
Depression on trade, this Chapter presents the first analysis of this at a regional level

D.P. Jordan
Page 282 of 317
within the UK. Given the unique circumstances of Northern Ireland leading to the
collection of these trade statistics, this is potentially the only opportunity to do so. The
findings confirm the wider international conclusions, that within-country economic
activity was the source of the global economy’s recovery following the Great
Depression (Ghosh, 1940; Aldcroft, 1973; Eichengreen and Irwin, 1995). It also
confirms that UK tariffs affected the UK’s trade in manufactured goods (Kitson and
Solomou, 1990), with Northern Ireland’s staple industries increasing their share of
Britain’s imports. That the UK’s tariffs were important for the direction of trade also
supports the similar conclusions of De Bromhead et al. (2019), only this Chapter
demonstrates it for within-country trade.
A limitation of the analysis of Northern Ireland’s trade in this Chapter has been
the restrictions on the number of commodities available for analysis, and the lack of
measures of weight. With more time and resources, it would be possible to digitise
the full trade statistics for the period 1924 to 1937, with the addition of further
commodities improving the accuracy of the models estimated. This would provide
greater detail on the effect of the UK’s trade policy at a more disaggregated level.
Extensions of this analysis could include not just further comparisons with the UK, but
a more detailed comparison between Northern Ireland and the Irish Free State. In
particular, if agricultural prices were digitised for both sides of the border, a more
detailed analysis of the extent of cross-border smuggling during the Economic War
could be undertaken.
This Chapter has also highlighted the apparent weak regional multiplier within
the Northern Ireland economy. Future research should explore whether this is a long-
run feature of the Northern Ireland economy, and the extent to which this has limited
its growth. Links between firms also has a potentially significant role in understanding
the effect of the UK and the Irish Republic joining the European Economic Community,

D.P. Jordan
Page 283 of 317
and how this greater economic integration affected the development and growth of
the two economies on the island.

D.P. Jordan
Page 284 of 317
7) Appendix A – Constructing a time-series of Northern Ireland’s
interwar trade
This Appendix discusses in greater detail the sources and issues arising out of the
construction of a time-series for Northern Ireland’s interwar trade, including the
limitations of the data.
The method used for collecting and compiling the trade statistics for the first
source of trade statistics for Northern Ireland is outlined in a briefing written to the
Minister of State in July 1975, suggesting the scrapping of the collection of these
statistics for Northern Ireland.290 For direct-foreign trade, the quantity and value of
commodities traded was compiled from information supplied by H.M. Customs and
Excise. For cross-channel trade, only the volume of commodities traded was able to
be collected from ships’ manifests. Their total value was estimated by the Ministry of
Commerce, by using prices from local sources where possible, or using prices taken
from those recorded for the UK’s imports or exports. There is evidence to suggest
efforts were made to be as accurate as possible when estimating the prices of
commodities. For example, quarterly prices of butter are recorded in one trade ledger,
showing that annual estimates of prices were not simply being used.
There are obvious limitations to this data, with the July 1975 briefing identifying
three main weaknesses.291 Firstly, as only weights were collected for cross-channel
trade, the estimated value may not accurately represent the actual value of goods.
Secondly, the description of goods given to harbour authorities may not accurately
reflect what was being shipped, specifically when commodities are being carried in
‘unit load carriers’. Thirdly, inconsistencies can exist in the valuation of unfinished
goods.
290 PRONI: COM/62/1/1426 Collection of Cross Channel Trade Statistics. 291 PRONI: COM/62/1/1426 Collection of Cross Channel Trade Statistics.

D.P. Jordan
Page 285 of 317
Addressing the first issue, it is not ideal that the value of cross-channel trade
was calculated from a combination of local prices and UK trade values. If the quality
of Northern Ireland goods were of a different quality, the use of UK prices could bias
the value up or down relative to its true value. However, the use of UK prices is the
second best option, as it at least ensures consistency with the published UK trade
figures, making both based on similar valuation assumptions. The second concern
over the use of ‘unit load carriers’ is not relevant to the interwar period, as container
traffic did not exist until the post-war period.292 Finally, the inconsistencies which can
exist in the valuation of unfinished goods are the same issue H.M. Revenue and
Excise would have faced for international trade, and so there is no reason to believe
that cross-channel records should be biased any differently from direct-foreign trade.
The second source are a series of handwritten trade books for the Irish Land
Boundary, covering Northern Ireland’s with the Irish Free State for 1924 to 1937.293
The establishment of a customs land frontier on the island of Ireland was the result of
the Irish Free State taking responsibility for Customs and Excise, and from 1st April
1923, border controls were imposed between the Irish Free State and Northern
Ireland.294 H.M. Customs and Excise were responsible for collecting these cross-
border trade statistics, and each year it sent Stormont handwritten copies of these
detailed trade statistics, used to construct those published in the Annual Statement of
Trade of the United Kingdom. These annual trade books recorded the quantity and
value of around 1,500 individual commodities traded across the Land Boundary each
year, across imports, exports, and re-exports.
Digitising and combining these two sources of Northern Ireland’s trade
statistics provides several challenges. The first is the categorisation of commodities:
292 Container traffic in Northern Ireland ports did not exist until investment to facilitate its introduction at Larne from 1957 onwards. See Ulster Year Book (1963-1965, p.115). 293 PRONI: COM/38/1/1A to COM/38/1/14A inclusive. 294 See Denton and Fahy (1993) for a detailed timeline of events leading up to the imposition of the land boundary.
D.P. Jordan
Page 286 of 317
how individual commodities were allocated across trade classes was neither
consistent over time, nor consistent across both sources. The Land Boundary books,
being compiled by H.M. Customs and Excise, recorded approximately 1,500
commodities annually, although this varied over time; while the port trade ledgers
recorded approximately 500 commodities annually, but not always following the same
class structure as H.M. Revenue and Excise. To address these issues, up to 80
subclasses and classes of commodities were digitised from the port trade ledgers and
trade books for each year, to create a consistent series of 39 commodities, plus totals
for the 4 main classes of commodity: food, raw materials, manufactured goods, and
livestock; and an overall total.295
Secondly, the information for the Land Boundary distinguished between
imports, export, and re-exports, while the port trade ledgers only distinguished
between imports and exports, disaggregating this by information by port, but without
providing a total value of trade for many years. To address this, exports and re-exports
were aggregated, to give total exports across the Irish Land Boundary, while the
disaggregated information by port was summed where necessary, to give the total
value of both cross-channel and direct-foreign trade.296 This was then combined with
the data for the Land Boundary, to give Northern Ireland’s total trade.
Thirdly, occasionally values were missing for the value of goods, even when
a quantity was recorded. To address this, where a value was missing from the total
value of goods column, but the total quantity of goods was present, the missing value
295 It was not practical to digitise every individual commodity from both sources, given the limitations of time and resources. To digitise the quantity and value of every single commodity recorded in the trade ledgers for sea trade would have required approximately 22,000 observations per year to be digitised from the handwritten records. For the land boundary books, it would have required 9,000 observations to be digitised per year, again from handwritten records. Together this would have totalled 434,000 observations. 296 For direct-foreign trade by sea, information for 4 ports was recorded from 1924 to 1935: Belfast, Londonderry, Coleraine, and Newry. For 1936 and 1937, only total foreign trade was recorded. For cross-channel trade, information was recorded for 6 ports: Belfast, Londonderry, Coleraine, Newry, Larne, and remaining ports under the term ‘Other’. Foreign and cross-channel trade were calculated by summing across the relevant columns.

D.P. Jordan
Page 287 of 317
was calculated using either the equivalent cross-channel or foreign price information
available from other ports’ trade, or if this was unavailable, from an average price
calculated across all ports’ trade. In all cases, if the sum of subclasses did not add up
to the class totals as originally recorded, the sum of the subclasses was preferred.
Fourthly, the port trade ledgers and Land Boundary books used a combination
of different measures (weight, sizes, and number) to record quantity. Unfortunately, it
was not possible to address this issue fully, as there is no way to convert goods being
measured by size and number to an equivalent weight. For this reason, my analysis
of trade is limited to values.
Finally, a component of Northern Ireland’s trade which can not be easily
isolated within these sources, is its trade with the Irish Free State via the sea,
contained within the direct-foreign trade of the port ledgers. Separate figures for the
total amount of sea trade with the Irish Free State are recorded for 1936, 1937 and
1938 in Summary of the Trade of Northern Ireland. Across these three years, this
trade accounted for a maximum of 1.0 per cent of the total value of foreign imports to
Northern Ireland, and a maximum of 6.8 per cent of the total value of foreign exports
from Northern Ireland. As a share of Northern Ireland’s total trade with the Irish Free
State, it accounted for a maximum of 3.8 per cent of the total value of imports from
the Irish Free State, and a maximum of 18.2 per cent of the total value of exports to
the Irish Free State. The vast majority of Northern Ireland’s imports from the Irish Free
State did not come via the sea, and over 80 per cent of exports from Northern Ireland
to the Irish Free State went via the Land Boundary. While it would be desirable to
have these trade figures for trade with the Irish Free State via the sea separated from
other foreign trade for the 1930s, it does not fundamentally change the conclusions
drawn from the analysis.
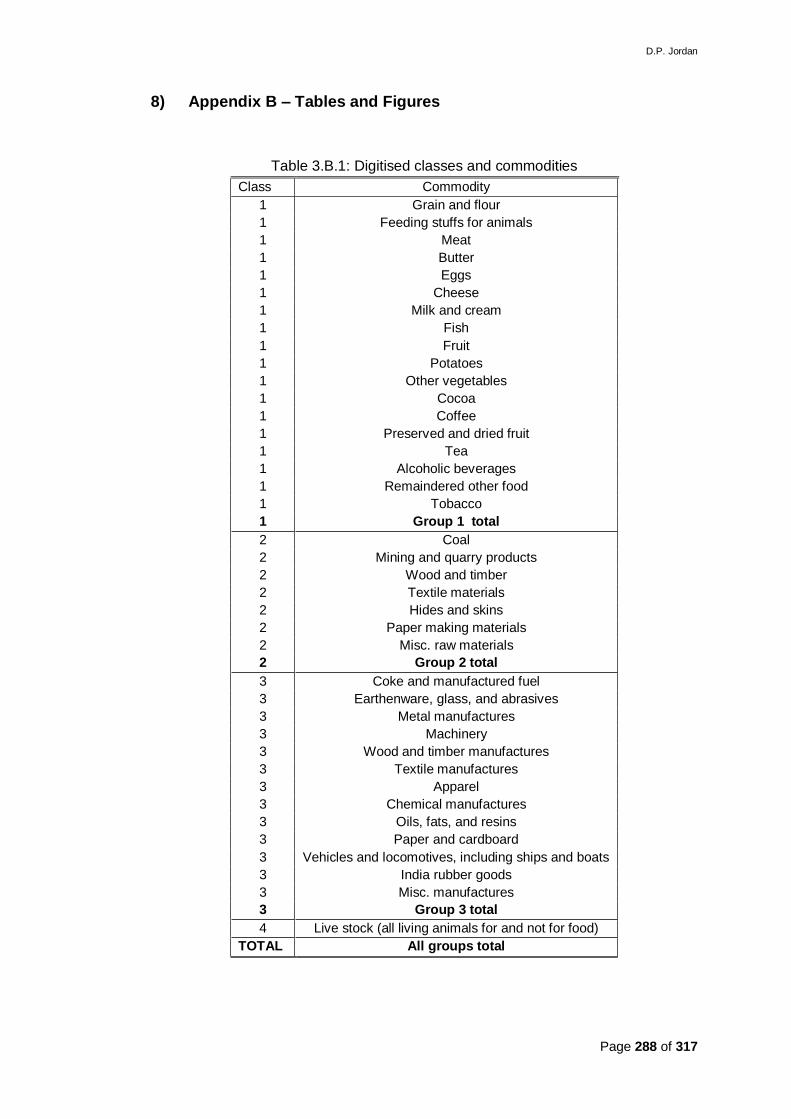
D.P. Jordan
Page 288 of 317
8) Appendix B – Tables and Figures
Table 3.B.1: Digitised classes and commodities
Class Commodity
1 Grain and flour
1 Feeding stuffs for animals
1 Meat
1 Butter
1 Eggs
1 Cheese
1 Milk and cream
1 Fish
1 Fruit
1 Potatoes
1 Other vegetables
1 Cocoa
1 Coffee
1 Preserved and dried fruit
1 Tea
1 Alcoholic beverages
1 Remaindered other food
1 Tobacco
1 Group 1 total
2 Coal
2 Mining and quarry products
2 Wood and timber
2 Textile materials
2 Hides and skins
2 Paper making materials
2 Misc. raw materials
2 Group 2 total
3 Coke and manufactured fuel
3 Earthenware, glass, and abrasives
3 Metal manufactures
3 Machinery
3 Wood and timber manufactures
3 Textile manufactures
3 Apparel
3 Chemical manufactures
3 Oils, fats, and resins
3 Paper and cardboard
3 Vehicles and locomotives, including ships and boats
3 India rubber goods
3 Misc. manufactures
3 Group 3 total
4 Live stock (all living animals for and not for food)
TOTAL All groups total

D.P. Jordan
Page 289 of 317
Table 3.B.2: Irish Free State’s share of Northern Ireland’s trade
1924-1931
1932-1938
1943-1949
1950-1954
1955-1959
1960-1964
1965-1969
1970-1972
Imports 13.0 6.9 7.2 6.6 7.1 7.7 8.6 11.4 Exports 10.3 4.7 2.5 2.9 3.9 5.7 6.7 9.0
Total trade 11.7 5.8 4.8 4.8 5.8 6.8 7.7 10.2
Sources: PRONI; Northern Ireland Trade Summary; Ulster Year Book (1956, 1957-1959)
Table 3.B.3: Goods included within each model
2 3 4 5 6 7 8 9
Food, drink,
tobacco
Food, drink,
excl. exotic
Exotic
food, drink,
tobacco
Staple
food, incl.
livestock
Staple
food, excl.
livestock
Raw
materials
Manufactured
goods
Staple
manufactured
goods
Grain and
flour
Grain and
flour Cocoa
Grain and
flour
Grain and
flour Coal
Coke and
manufactured
fuel
Tobacco
Feeding stuffs
for animals
Feeding stuffs
for animals Coffee Meat Meat
Mining and
quarry
products
Earthenware,
glass, and
abrasives
Textile
materials
Meat Meat
Preserved
and dried
fruit
Butter Butter Wood and
timber
Metal
manufactures
Metal
manufactures
Butter Butter Tea Eggs Eggs Textile
materials Machinery Machinery
Eggs Eggs Cocoa Milk and
cream
Milk and
cream
Hides and
skins
Wood and
timber
manufactures
Textile
manufactures
Cheese Cheese Coffee Fish Fish
Paper
making
materials
Textile
manufactures
Vehicles and
locomotives,
including ships
and boats
Milk and
cream
Milk and
cream
Preserved
and dried
fruit
Potatoes Potatoes Misc. raw
materials Apparel
Fish Fish Tea Alcoholic
beverages
Alcoholic
beverages
Chemical
manufactures
Fruit Fruit Tobacco
Live stock
(all living
animals for
and not for
food)
Oils, fats, and
resins
Potatoes Potatoes Paper and
cardboard
Other
vegetables
Other
vegetables
Vehicles and
locomotives,
including
ships and
boats
Cocoa Alcoholic
beverages
India rubber
goods
Coffee Remaindered
other food
Misc.
manufactures
Preserved and
dried fruit
Tea
Alcoholic
beverages
Remaindered
other food
Tobacco
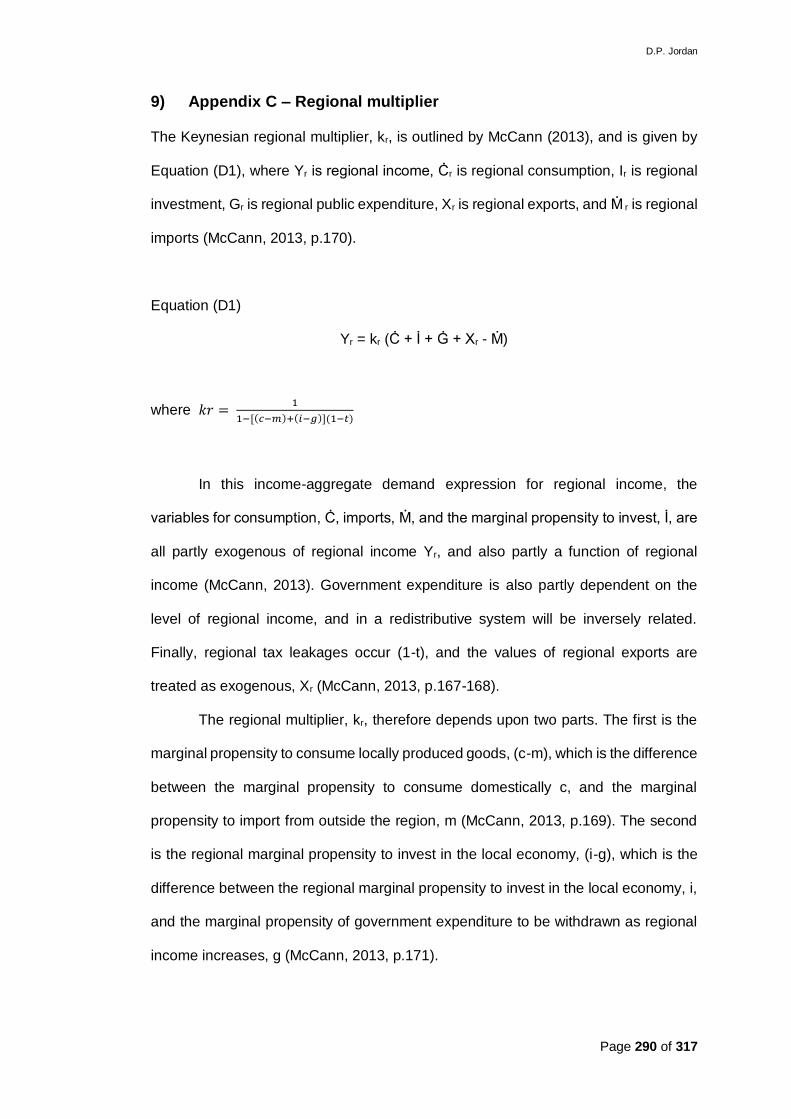
D.P. Jordan
Page 290 of 317
9) Appendix C – Regional multiplier
The Keynesian regional multiplier, kr, is outlined by McCann (2013), and is given by
Equation (D1), where Yr is regional income, Ċr is regional consumption, Ir is regional
investment, Gr is regional public expenditure, Xr is regional exports, and Ṁ r is regional
imports (McCann, 2013, p.170).
Equation (D1)
Yr = kr (Ċ + İ + Ġ + Xr - Ṁ)
where 𝑘𝑟 = 1
1−[(𝑐−𝑚)+(𝑖−𝑔)](1−𝑡)
In this income-aggregate demand expression for regional income, the
variables for consumption, Ċ, imports, Ṁ, and the marginal propensity to invest, İ, are
all partly exogenous of regional income Yr, and also partly a function of regional
income (McCann, 2013). Government expenditure is also partly dependent on the
level of regional income, and in a redistributive system will be inversely related.
Finally, regional tax leakages occur (1-t), and the values of regional exports are
treated as exogenous, Xr (McCann, 2013, p.167-168).
The regional multiplier, kr, therefore depends upon two parts. The first is the
marginal propensity to consume locally produced goods, (c-m), which is the difference
between the marginal propensity to consume domestically c, and the marginal
propensity to import from outside the region, m (McCann, 2013, p.169). The second
is the regional marginal propensity to invest in the local economy, (i-g), which is the
difference between the regional marginal propensity to invest in the local economy, i,
and the marginal propensity of government expenditure to be withdrawn as regional
income increases, g (McCann, 2013, p.171).

D.P. Jordan
Page 291 of 317
The regional Keynesian multiplier model in Equation (D1), can be related to
the effect of growth on employment, through the economic base multiplier model
(McCann, 2013, p.172), given in Equation (D2).
Equation (D2)
∆𝑇 = 1
1 − 𝑛∆𝐵
Equation (D2) shows how total employment (T) in a regional economy, is a
function of employment in the basic sector (B), and employment in the non-basic
sector (N). The basic sector is the sector whose performance is primarily determined
by economic conditions external to the local economy, while the non-basic sector’s
performance is primarily determined by economic conditions internal to the local
economy (McCann, 2013, p.156). Employment generated in the non-basic sector will
be related to total employment generated in the regional economy, written as N=nT,
where n reflects the sensitivity of employment in the non-basic sector to overall
regional employment (McCann, 2013, p.157). Thus in Equation (D2), total regional
employment is a function of employment in the basic sector, where n is an
expenditure-linkage parameter, showing the strength of demand for local non-basic
inputs by the basic sector, which generates employment within the non-basic sector
(McCann, 2013, p.158). A certain level of employment in the non-basic sector may
occur irrespective of activity in the basic sector, given by No (McCann, 2013, p.158),
and so Equation (D2) is re-written as Equation (D3) to reflect this:
Equation (D3)
∆𝑇 = 𝑁𝑜
1 − 𝑛+
1
1 − 𝑛∆𝐵

D.P. Jordan
Page 292 of 317
Equation (D3) can be directly related to the regional Keynesian multiplier model, when
Equation (D1) is rewritten as in Equation (D4):
Equation (D4)
∆𝑌𝑟 = Ċ + İ + Ġ − Ṁ
1 − [(𝑐 − 𝑚) + (𝑖 − 𝑔)](1 − 𝑡)+
∆𝑋𝑟
1 − [(𝑐 − 𝑚) + (𝑖 − 𝑔)](1 − 𝑡)
The left-hand side of Equation (D4) is equivalent to the left-hand side of
Equation (D3), which reflects local economic activity’s effect on regional income, while
the right-hand side of (D4) is equivalent to the right-hand side of Equation (D3), and
reflects external economic activity’s effect on regional income (McCann, 2013, p.172-
173). Thus the employment linkages between basic and non-basic sectors, 1-n, are
connected via the expenditure linkages between the two sectors, given by the regional
multiplier kr, and affected either through direct expenditure on local inputs, given by
(c-m), or through increases in local investment, given by (i-g) (McCann, 2013, p.173).

D.P. Jordan
Page 293 of 317
CONCLUSION
This thesis has examined the puzzle of Northern Ireland’s poor economic
performance under devolution, asking whether the devolution of economic policy-
making powers is beneficial. A policy of further fiscal decentralisation is being pursued
within the UK, including initiatives such as the Northern Powerhouse, City Deals, and
further devolution of policy-making powers to Scotland. Growing political populism in
the UK, Europe, and further afield, has been linked to regional inequalities in
economic performance, highlighting the need for better, place-sensitive policies
(Rodríguez-Pose, 2018). Although there is a political willingness to embrace further
devolution within the UK as the answer to these problems, little empirical evidence
has existed to support this policy prescription. Northern Ireland, between 1920 and
1972, therefore provides an overlooked opportunity to examine the effects of
subnational government on regional economic performance within the UK. The
evidence presented in this thesis supports the arguments of second generation fiscal
federalism (Oates, 2005; Weingast, 2009), that limitations exist on the realisation of
the economic benefits of fiscal decentralisation. These limitations provide an
explanation for Northern Ireland’s poor, long-run, economic performance, and support
the argument that institutions, and their interaction with the supply-side of the regional
economy, are at the heart of this underperformance. Thus, simply a policy of more
devolution can not solve regional economic problems alone, if it does not take into
account the institutions present.
To understand the role of subnational government in Northern Ireland’s
persistent economic underperformance, three aspects of fiscal decentralisation to
Stormont are examined in detail. The first is the relationship between Stormont and
Westminster, which is shown to have affected the level, composition, and efficiency
of public expenditure, creating opportunity costs in the provision of public goods and

D.P. Jordan
Page 294 of 317
services. The second is the relationship between Stormont and existing firms within
the region, which is shown to have led to inefficient subnational industrial policy, which
created barriers to productivity growth. The third is the relationship between the
regional economy and the international economy, which demonstrates how national
policy combines with regional supply-side characteristics to affect regional
performance. Together, these three relationships had an important role in determining
Northern Ireland’s regional income, through public expenditure, investment, and the
region’s trade balance. They emphasise the long-run importance of the supply-side
of the regional economy, which existing literature on Northern Ireland has not
emphasised.
Chapter 1 used an analytic narrative approach to examine the financial
relations between Stormont and Westminster, and understand how this affected the
efficiency of public expenditure. Existing literature assumes that institutional structure
did not change over time, and reaches no consensus on the importance of these
financial relations for the efficiency of devolution (Mansergh, 1936; Lawrence, 1965;
Buckland, 1979; Green, 1979; Birrell and Murie, 1980; Wilson, 1989; Gibson, 1996;
Mitchell, 2006). This reflects the emphasis given to the post-war period, and a focus
on the politics rather than the economics, seeing devolution to Stormont as a prelude
to the Troubles. Only Gibson (1996) applies theory from fiscal federalism to Northern
Ireland, but this is limited to first generation theory. By combining new data on
Stormont’s public expenditure with new archival material, this chapter demonstrates
how institutions limited the efficiency of fiscal decentralisation. Second generation
theory, from Oates (2005) and Weingast (2009), is shown to be key to this
explanation. The principal-agent relationship between Stormont and Westminster
resulted in moral hazard, affecting the level and composition of public expenditure,
and creating opportunity costs in the provision of subnational public goods and
services.

D.P. Jordan
Page 295 of 317
Devolution to Stormont was characterised by a sequence of key events, which
led to the problem of moral hazard developing in the financial relations between
Stormont and Westminster. The Government of Ireland Act 1920 (1920 Act) reflected
political rather than economic priorities, and its economic weaknesses quickly
became apparent. Rather than address these weaknesses with new legislation,
Westminster sought to manage the situation and maintain the de jure institutional
structure. However, these attempts weakened the institutionalised authority of the
1920 Act, and softened Stormont’s budget constraint, creating the expectation of
further financial support. This problem of moral hazard defined the interactions
between the two governments, with Westminster seeking to limit is financial liability,
by exerting increasing control over subnational public expenditure.
Westminster’s desire to limit moral hazard came at a cost for efficiency.
Despite Stormont’s initial public deficit being plugged by one-off payments from
Westminster, and subsequently followed by financial support for unemployment, this
was not enough to equalise fiscal pressure during the interwar period. The Northern
Ireland economy remained relatively weaker than the UK average, meaning it
required above average public expenditure, but this did not take place. Westminster’s
concern over moral hazard meant a lack of fiscal transfers to Stormont, creating
opportunity costs in areas of public expenditure. These included a lack of expenditure
in housing, education, and industry and infrastructure, areas of investment which are
crucial for long-run growth, but where Stormont’s expenditure lagged behind that in
Britain. The softening budget constraint also led to inefficient policy interventions,
such as in industrial policy, and the failure of the Northern Ireland Transport Board,
as Stormont focused on maximising political support, and engaged in rent-seeking.
Political priorities therefore took precedence over policies which might improve long-
run economic performance.

D.P. Jordan
Page 296 of 317
These opportunity costs persisted into the post-war period, with Stormont
sacrificing subnational autonomy to receive greater financial support. Despite
Westminster gaining greater oversight over Stormont’s expenditure, Northern Ireland
did not experience the same ratchet effect in post-war expenditure as Britain. This
was the result of the structure of financial relations which had developed. Westminster
had gained greater oversight of Stormont’s finances during the war, but this created
a barrier to rapid expansion of public expenditure. Meanwhile, Stormont remained
concerned with the political symbolism of making the Imperial Contribution, while
Westminster’s focus on the total value, rather composition, of public expenditure,
opened the door to discriminatory subnational policies. It was only when greater
transparency was brought to Stormont’s finances, during the mid-1950s, that public
expenditure became more efficient. However, by this stage increased public
expenditure was simply making up for the lost ground of the interwar period.
Applying an analytic narrative demonstrates the shortcomings of existing
literature in its understanding of devolution to Stormont. Institutional structure did
change over time, reflecting changes in the de facto, rather than the de jure, position.
It was not simply the case that Westminster pursued a policy of benign neglect during
the interwar period, as suggested by Buckland (1979) and Johnson (1985a), or that
post-war it was willing to set aside constitutional niceties to provide extra support, as
suggested by Lawrence (1965). Westminster had been managing its financial
relations with Stormont in response to the de facto institutional structure which had
evolved, and it was the tension between subnational autonomy, but ultimate national
responsibility, which placed constraints on subnational public expenditure. The key
events of the first few years set the path for the remainder of devolution, with
agreements between Stormont and Westminster playing catch-up to the realities
which developed. The failure to address the flaws of the 1920 Act, and the desire on

D.P. Jordan
Page 297 of 317
Westminster’s part to limit its interventions to the financial, ensured the efficiency of
devolution was always going to be limited.
The limitations on efficiency can be most clearly seen in the opportunity costs
for housing, education, industry, and infrastructure, which were harder for the
electorate to benchmark against equivalent services in Britain. Stormont’s
commitment to benchmarking easily comparable social services with those in Britain,
mainly unemployment benefit, limited the resources available for other public
services. The lack of electoral competition, and the dominance of the constitutional
question, meant there was no regional check from the local electorate on this policy.
However, greater electoral competition would not have solved this problem, as
fundamental problems associated with the institutional structure would still have been
present. Ultimately, it was the political priorities of both governments which shaped
how devolution developed, with economic considerations a secondary concern. The
opportunity costs in housing, education, industry and infrastructure, meant little
chance of regional convergence, storing-up problems for the post-war period. It is not
a coincidence that issues which defined the lead up to the Troubles, were those which
had experienced underinvestment until the 1950s. Scarcity, followed by an expansion
of public expenditure, provided the opportunity for inequalities to arise, with
Westminster’s focus on total expenditure, rather than its composition, opening the
door to discriminatory subnational policies.
Theory from fiscal federalism, particularly more recent second generation
theory such as Oates (2005) and Weingast (2009), has seen little testing in the real
world. The fifty years of devolution to Stormont demonstrate this theory is applicable
to a non-federal institutional structure, in the form of UK devolution. Weingast’s (2009)
comparative federalism framework provides an important method to assess the
efficiency of fiscal decentralisation. A fundamental issue that arose in the financial
relations between Stormont and Westminster was the weakening of institutionalised

D.P. Jordan
Page 298 of 317
authority. Weingast (2009, p.281) describes this as the “glue” which holds the
subnational system of government together. Northern Ireland’s experience
demonstrates that in the context of devolution, institutionalised authority is the central
condition required for the remaining efficiency conditions to be fulfilled. Without
institutionalised authority, the further conditions of subnational autonomy, hard budget
constraints, and common markets, are eroded irreversibly.
Chapter 2 examined the efficiency of Stormont’s industrial policy during the
interwar period, and demonstrated the importance of regional institutions in limiting
the efficiency of subnational policy interventions. Northern Ireland possesses a long-
run productivity gap to the rest of the UK (Hitchens and Birnie, 1989a; Mac Flynn,
2016), but the causes of this gap have not been fully understood. By focusing on the
interwar period, this chapter provides long-run evidence to support the view of Crafts
(1995) and Brownlow (2013), that institutions provide an explanation for the persistent
nature of Northern Ireland’s productivity gap. New data for interwar manufacturing
productivity shows Northern Ireland’s productivity failings were not simply the result
of industrial structure, as the existing narrative of Buckland (1979) and Johnson
(1985a) suggests. Instead, within-sector productivity failings explain the majority of
the productivity gap, with Northern Ireland missing out on the development of new,
higher productivity industries. These within-sector productivity failings are linked to
regional institutions, which created barriers to productivity growth, and helped lock the
regional economy into a low-wage-investment-productivity equilibrium.
Strong, overlapping networks existed between business and politics in
Northern Ireland. These gave existing firms influence over the design and
implementation of Stormont’s interwar industrial policy. This allowed existing firms to
create created barriers to productivity growth, with old, low productivity industries able
to capture government subsidies at the expense of new, higher productivity industries.
Combined with satisficing behaviour amongst the management of existing firms, this

D.P. Jordan
Page 299 of 317
financial subsidy aided the survival of the old industries, particularly shipbuilding and
linen. Stormont’s industrial policy interventions, intended to promote the growth of
new industries, failed as a result of these regional institutions. Stormont’s New
Industries Act of 1932 (1932 Act) was poorly designed, reflecting a desire not to be
more generous to new firms than existing firms. Its implementation also gave existing
firms influence over which applicants received financial support, through an Advisory
Committee. The 1932 Act failed to support the establishment of new industries, and
its replacement, the New Industries Act of 1937, did no better. Instead, it provided
financial support to existing firms, the scale of which increased following lobbying from
these existing firms. It was therefore low productivity sectors which benefited most
from Stormont’s industrial policy, aiding their survival, but locking the regional
economy into a low-wage-investment-productivity equilibrium.
This chapter is a rejection of the existing, demand centred narrative for the
interwar period of Buckland (1979) and Johnson (1985a). The poor performance of
Northern Ireland manufacturing was not the inevitable result of falling global demand
in the staple industries, and a subnational government without funds to intervene. This
chapter also adds to the existing post-war literature on industrial policy in Northern
Ireland (Hitchens and Birnie, 1989a; Crafts, 1995; Brownlow, 2007), by linking these
post-war findings to the earlier interwar period, and its importance in shaping post-
war interventions. This chapter also introduces Northern Ireland to the wider UK
narrative on interwar manufacturing productivity, where it has otherwise been broadly
ignored (Richardson, 1967; Aldcroft, 1970; Pollard, 1992; Broadberry, 1997; Crafts,
2018). Northern Ireland shared the same external environment as Britain, but its
regional institutions exacerbated the UK’s supply-side problems. When Lee (1971,
p.201) noted that despite all the public expenditure on industrial policy in Northern
Ireland, it had little effect on the regional economy, the reasons for this can be seen
D.P. Jordan
Page 300 of 317
in the interwar period. Regional institutions therefore pose a limit on the efficient
decentralisation of industrial policy.
Chapter 3 examined how Northern Ireland’s trade was affected by the Great
Depression. It found that Northern Ireland’s trade was not as severely affected as the
existing narrative of Buckland (1979, 1981) and Johnson (1985a, 1985b) suggests.
The focus of literature examining the effect of the Great Depression on trade, and the
associated rise in protectionism, has focused on the national, rather than the regional,
experience (Aldcroft, 1973; Kitson and Solomou, 1990; Eichengreen and Irwin, 1995;
Klasing and Milionis, 2014; De Bromhead et al., 2019). Trade policy and Customs and
Excise were not devolved powers, and Stormont had no influence over the UK’s trade
policy. However, the provisions of the 1920 Act led to trade statistics for Northern
Ireland being collected. These provide a previously unexploited archival source to
construct a new, disaggregated dataset for Northern Ireland’s trade between 1924
and 1937. This provides not just new insights into Northern Ireland’s interwar trade,
but fills in a missing piece of the regional effect of the Great Depression on trade.
Comparing Northern Ireland’s trade per capita with Britain and the Irish Free
State, shows that Northern Ireland’s trade was not as severely affected by the Great
Depression. The overall value of both Northern Ireland’s imports and exports did no t
fall as far as Britain’s or the Irish Free State’s. This resilience was not simply limited
to cross-channel trade with Britain, but was also thanks to a significant recovery in
direct-foreign exports during the mid-1930s. Northern Ireland’s trade had therefore
recovered to its pre-crash level by 1936, earlier than nationally for Britain, and far
ahead of the Irish Free State. This evidence for a UK region therefore supports the
existing view, that recovery from the Great Depression was driven by within-country,
rather than international, trade (Ghosh, 1940; Aldcroft, 1973; Eichengreen and Irwin,
1995). However, contrary to the existing narrative for interwar Northern Ireland

D.P. Jordan
Page 301 of 317
(Buckland, 1979, 1981; Johnson, 1985a, 1985b), it was the staple industries of textiles
and shipbuilding which drove this recovery.
The resilience of Northern Ireland’s trade demonstrates the limited
applicability of Thirlwall’s (1980) model to the regional economy, and instead
emphasises the importance of the supply-side. Despite a recovery in demand for its
exports, and relatively lower balance of payments pressures stemming from its
tradable sector, Northern Ireland continued to experience slow economic growth and
persistently high unemployment. This failure to see the resilience in trade be
translated into the wider regional economy, can be linked to the region’s supply-side
characteristics, and a weak Keynesian regional multiplier. Weak linkages between the
tradable and non-tradable sectors, with a high marginal propensity to import, meant
the overall level of unemployment remained persistently high, despite increases in
employment in the sectors which saw the strongest recovery in exports.
Examining the role of the UK’s protectionist trade policy, demonstrates it did
affect Northern Ireland’s interwar trade performance. UK tariffs are found to have had
a statistically significant effect for both Northern Ireland’s imports and exports. UK
tariffs on imports had a negative effect, reducing Northern Ireland’s foreign imports,
and explaining the increasing home bias in imports from Britain, and fall in trade with
the Irish Free State. UK tariffs are also shown to have had a positive and statistically
significant effect on Northern Ireland’s share of Britain’s imports, for those
commodities subject to external UK tariffs. This effect was greatest for raw materials,
and for manufactured goods from the staple industries. The recovery in exports of
Northern Ireland’s staple industries can therefore be linked to the UK’s interwar
protectionist trade policy, contrary to existing literature’s view that tariffs did not
contribute to the recovery of specific industries (Kitson, Solomou and Weale, 1991).
This also extends the previous literature of Kitson and Solomou (1990) and De
Bromhead et al. (2019), which found that tariffs only had an effect at redirecting trade,

D.P. Jordan
Page 302 of 317
instead showing that a regional level, national trade policy could benefit the level of a
region’s trade.
While Chapter 3 demonstrates the limits on a subnational government’s
powers, it also shows that Northern Ireland’s economy was not as badly affected by
the Great Depression as the existing narrative suggests. This has implications for how
we view the importance of institutions in Chapter 1 and Chapter 2 for the region’s
overall economic performance. That external demand did not fall as far as the existing
narrative suggests, means the economic cards Stormont was dealt were not as poor
as they have often been viewed. The Great Depression was not the hammer blow for
industry as has been previously suggested (Buckland, 1979; Johnson, 1985a), and it
instead emphasises that Stormont played its cards particularly poorly. The regional
economy was experiencing decline, but it was not doomed. Instead, institutions and
their interaction with the supply-side of the regional economy, led to inefficiencies in
resource allocation, creating barriers to long-run growth. That Northern Ireland’s
interwar trade performance was recovering prior to World War II, places greater
emphasis on post-war policy failings for industry’s decline. This was when an
expansion in public expenditure took place, but the efficiency of these post-war policy
interventions was constrained by the path taken in the development of institutions
during the interwar period, and the inefficiencies this had created.
The Northern Ireland experience of devolution demonstrates the limits which
exist for efficient fiscal decentralisation as a result of institutions. While British
institutions are viewed as the best template for long-run economic growth (North,
1990; North, Wallis and Weingast, 2009; Acemoglu and Robinson, 2012), Northern
Ireland reinforces that the context to these institutions is key. This supports the
argument of Rodríguez-Pose and Gill (2005), that fiscal decentralisation can take
many forms, and the form it takes is fundamental to its success. For Stormont, it was
institutional failings associated with UK institutions which led to inefficiencies,

D.P. Jordan
Page 303 of 317
reinforced by the focus on political rather than economic priorities. This can be clearly
seen in Chapter 1 and Chapter 2. This suggests the UK has limited institutional
capacity to cope with further devolution. Without clearly defined institutional
structures, which fulfil the comparative federalism framework of Weingast (2009),
further devolution will fail in its attempts to address the issues of rising populism and
growing regional inequality.
This provides implications for today’s policymakers, if they are to avoid the
pitfalls of past devolution to Northern Ireland. The need to maintain institutionalised
authority within Weingast’s (2009) comparative federalism framework, can be seen
as supporting Bell’s (2016) suggestion for an independent body to arbitrate between
national and subnational government. The Joint Exchequer Board (JEB) failed to fulfil
this role, as the de facto institutions meant its operation was at the discretion of
Westminster. A body which is independent of both levels of government is therefore
required, and could be modelled on the current Office for Budget Responsibility, which
provides independent analysis of the UK’s public finances. Such a body would provide
balance to the financial relations between national and subnational government, by
helping remove moral hazard, providing transparency, and removing the discretion
which a national government has within a devolved institutional structure. This would
be particularly relevant for the introduction of any needs-based replacement for the
Barnett Formula.
As powers are devolved to lower levels of government, the policy-making
process becomes ever more local. This is evident for Northern Ireland, demonstrated
particularly for Stormont’s interwar industrial policy in Chapter 2, where strong
overlapping networks between business and politics created barriers to productivity
growth. From a policy perspective, this emphasises the relatively greater need to
manage conflicts of interest at a subnational level, and as Chapter 1 highlights,
greater transparency is an important ingredient for efficient policy interventions.
D.P. Jordan
Page 304 of 317
Electoral competition can be seen as a way to provide transparency, and provide a
check on subnational policy. However, greater electoral competition in Northern
Ireland would not have solved all the problems relating to institutions. Thus electoral
competition alone can not be relied upon to solve the weaknesses of the institutional
structure present.
Using an historical case such as devolution to Northern Ireland to apply
economic theory, also shows the value of economic history to current literature when
trying to solve contemporary policy problems. By combining newly digitised data with
extensive archival material, it demonstrates the complexity of the issues at work, but
that theory can provide explanations for these issues. Today’s policy-makers should
therefore ensure they take a long-run perspective when addressing economic
problems, as economic history can often provide greater opportunities to test theory
than is possible with contemporary material.
There are a number of areas where future research could expand on the areas
examined in this thesis. Chapter 1 has emphasised that institutions, and how the form
these take changes over time, has important implications for the regional economy.
The analysis of this Chapter ends with Stormont being prorogued in 1972, but the
Direct-Rule which followed provides a further area of study. Under Direct-Rule,
Ministers were appointed from Westminster to run subnational government in
Northern Ireland, and was in effect another form of fiscal decentralisation. This
provides an opportunity to examine how regional policy implemented by a national
government compares with full fiscal decentralisation. Was this new institutional
structure able to solve the issues which had previously hampered efficient fiscal
decentralisation, or did these issues persist?
Chapter 2 highlighted the importance of regional institutions to the
implementation of Stormont’s industrial policy. Future research should continue to
examine the role of regional institutions in industrial policy, as Advisory Committees
D.P. Jordan
Page 305 of 317
continued to be a feature of regional industrial policy in Northern Ireland throughout
the twentieth century. It could also consider how Westminster’s increasing influence
over Stormont after 1939 shaped industrial policy interventions. Institutions also
played an important role in Ireland during the nineteenth century (Ollerenshaw, 1985).
Future research should therefore consider what role institutions have in linking
together the long-run economic performance of Northern Ireland and pre-partition
Ulster, as well as for the wider island. Further research could also undertake a
comparative study between the industrial policy implemented in Northern and the Irish
Free State. Both governments introduced industrial policy modelled on Westminster’s,
and comparing the outcomes of this would provide an insight into the different
experiences of devolution versus independence.
Chapter 3 examined Northern Ireland’s interwar trade, and further research
could look at this in greater detail. With more time and resources, the trade data for
Northern Ireland could be digitised to a much lower level of disaggregation, allowing
the performance of individual commodities to be more accurately tracked, relative to
both the rest of the UK, but also the Irish Free State. A comparative study could further
explore how the introduction of a customs border on the island affected the prices of
commodities in the two jurisdictions, particularly those within the agricultural sector.
Further research could also investigate more closely the linkages within the regional
economy, including the effect of the border on links between firms, and the barriers
this may have created to greater economic growth. Finally, a constraint in the analysis
undertaken in this Chapter, and across the wider thesis, has been the lack of
estimates of regional GDP for Northern Ireland before the late-1960s. Constructing
annual estimates of GDP for Northern Ireland would provide greater insight into the
performance of the regional economy, particularly relative to the UK and Irish
Republic, and facilitate more accurate analysis of areas such as trade.

D.P. Jordan
Page 306 of 317
In closing, this thesis has aimed to explore the period of Stormont devolution
by focusing on the economics of this experience. While the political narrative for this
period is important, and has received the greatest attention, this has left the economic
narrative underdeveloped. Northern Ireland’s history is complex, and often
contentious, but if it is to be fully understood, it needs to take into account its economic
history. The region’s persistent economic weaknesses clearly predate the Troubles,
and were the result of complex interactions within the regional economy. By gaining
a greater understanding of these interactions, it not only provides an insight into the
long-run performance of the Northern Ireland economy, but also the policies needed
to improve this performance for the future.

D.P. Jordan
Page 307 of 317
BIBLIOGRAPHY
Archives
The Public Record Office of Northern Ireland (PRONI).
The National Archive (TNA).
References
Acemoglu, D. and Robinson, J.A. (2012) Why nations fail: the origins of power,
prosperity and poverty, New York: Crown Business.
Akai, N., Nishimura, Y. and Sakata, M. (2007) 'Complementarity, fiscal
decentralization and economic growth', Economics of governance, 8(4), pp.
339-36.
Akcigit, U., Baslandez, S., and Lotti, F. (2018) 'Connecting to power: political
connections, innovation, and firm dynamics', NBER Working Paper
Series, Working Paper 25136, pp. 1-71.
Aldcroft, D.H. (1970) The inter-war economy: Britain, 1919-1939, London: Batsford.
Ardanaz, M., Leiras, M. and Tommasi, M. (2014) 'The politics of federalism in
Argentina and its implications for governance and accountability', World
Development, 53, pp. 26-45.
Bank of England (2014) 'The UK productivity puzzle', Bank of England Quarterly
Bulletin, Q2, pp. 114-128.
Bates, R.H., Greif, A., Levi, M., Rosenthal, J. and Weingast, B.R. (1998) Analytic
narratives, Chichester, UK: Princeton University Press.
Beacham, A. (1944) 'The Ulster linen industry', Economica, 11(44), pp. 199-209.
Beacham, A. (1945) 'Post-war planning in the Ulster Linen Industry', The Economic
Journal, 55(217), pp. 114-121.
Bell, D.N.F. (2014) 'Scotland and small country independence: the assessment',
Oxford Review of Economic Policy, 30(2), pp. 189-207.
Bell, D. (2016) 'The aftermath of the Scottish referendum: a new fiscal settlement for
the United Kingdom?', in Bailey, D. and Budd, L. (ed.) Devolution and the UK
economy. London, UK: Rowman & Littlefield International Ltd, pp. 37-56.
Benjamin, D.K. and Kochin, L.A. (1979) 'Searching for an explanation of
unemployment in interwar Britain', Journal of Political Economy, 87(3), pp. 441-
478.
Benjamin, D.K. and Kochin, L.A. (1982) 'Unemployment and unemployment benefits
in twentieth-century Britain: a reply to our critics', Journal of Political
Economy, 90(2), pp. 441-478.
Bew, P., Gibbon, P. and Patterson, H. (2002) Northern Ireland, 1921-2001: Political
forces and social classes, London: Serif.

D.P. Jordan
Page 308 of 317
Birnie, E. and Hitchens, D. (2001) 'Chasing the wind? Half a century of economic
strategy documents in Northern Ireland', Irish Political Studies, 16(1), pp. 1-27.
Birnie, E. and Brownlow, G. (2017) 'Should the fiscal powers of the Northern Ireland
Assembly be enhanced?', Regional Studies, 51(9), pp. 1429-1439.
Birrell, D. and Murie, A. (1980) Policy and government in Northern Ireland: lessons of
devolution, Dublin: Gill and MacMillan.
Bloom, N. and Van Reenen, J. (2010) 'Why do management practices differ across
firms and countries?', Journal of Economic Perspectives, 24(1), pp. 203-224.
Borge, L., Brueckner, J.K. and Rattso, J. (2014) 'Partial fiscal decentralization and
demand responsiveness of the local public sector: theory and evidence from
Norway', Journal of Urban Economics, 80, pp. 153-163.
Bowden, S. and Higgins, D.M. (2003) 'British industry in the interwar years', in Floud,
R. and Johnson, P. (ed.) The Cambridge economic history of modern Britain,
Volume II: economic maturity, 1860-1939. Cambridge, United Kingdom:
Cambridge University Press, pp. 374-402.
Bowden, S. and Higgins, D.M. (2015) 'Investment decision-making and industrial
performance: the British wool industry during the interwar years', Business
History, 57(2), pp. 224-240.
Broadberry, S.N. (1986) 'Aggregate supply in interwar Britain', The Economic
Journal, 96(382), pp. 467-481.
Broadberry, S.N. and Crafts, N.F.R. (1992) 'Britain's productivity gap in the 1930s:
some neglected factors', The Journal of Economic History, 52(3), pp. 531-558.
Broadberry, S.N. (1997) The productivity race: British manufacturing in international
perspective, 1850-1990, Cambridge, United Kingdom: Cambridge University
Press.
Brownlow, G. (2007) 'The causes and consequences of rent-seeking in Northern
Ireland, 1945–72', Economic History Review, 60(1), pp. 70-96.
Brownlow, G. (2013) Ulster since 1600: politics, economy, and society - Chapter 18,
Business and labour since 1945, Oxford, United Kingdom: Oxford University
Press.
Brownlow, G. (2015) 'Back to the failure: an analytic narrative of the De Lorean
debacle', Business History, 57(1), pp. 156-181.
Brownlow, G. (2017) 'Practice running ahead of theory? Political economy and the
economic lessons of UK devolution', Cambridge Journal of Regions, Economy
and Society, 10(3), pp. 559-573.
Buchanan, J.M. (1950) 'Federalism and fiscal equity', The American Economic
Review, 40(4), pp. 583-599.
Buckland, P. (1979) The factory of grievances: devolved government in Northern
Ireland 1921-39, Dublin, Ireland: Gill and Macmillan Ltd.

D.P. Jordan
Page 309 of 317
Buckland, P. (1981) A history of Northern Ireland, Dublin, Ireland: Gill and Macmillan
Ltd.
Capie, F. (1981) 'Shaping the British tariff structure in the 1930s', Explorations in
Economic History, 18(2), pp. 155-173.
Crafts, N.F.R. (1987) 'Long-term unemployment in Britain in the 1930s', The
Economic History Review, 40(3), pp. 418-432.
Crafts, N. (1995) 'The Golden Age of economic growth in postwar Europe: why did
Northern Ireland miss out?', Irish Economic and Social History, 22, pp. 5-25.
Crafts, N. (2017) 'Brexit and state aid', Oxford Review of Economic Policy, 33(S1), pp.
S105–S112.
Crafts, N. (2018) Forging ahead, falling behind and fighting back: British economic
growth from the Industrial Revolution to the Financial Crisis, Cambridge, UK:
Cambridge University Press.
De Bromhead, A., Fernihough, A., Lampe, M., and O'Rourke, K.H. (2019) 'When
Britain turned inward: the impact of interwar British protection', American
Economic Review, 109(2), pp. 325-352.
Del Rosal, I. (2011) 'The empirical measurement of rent-seeking costs', Journal of
Economic Surveys, 25(2), pp. 298-325.
Denton, G. and Fahy, T. (1993) The Northern Ireland Land Boundary 1923-1992,
Belfast: H.M. Customs and Excise.
Eichengreen, B. (1987) 'Unemployment in interwar Britain: Dole or doldrums?', Oxford
Economic Papers, 39(4), pp. 597-623.
Eichengreen, B. and Irwin, D.A. (1995) 'Trade blocs, currency blocs and the
reorientation of world trade in the 1930s', Journal of International
Economics, 38(1-2), pp. 1-24.
Eichengreen, B. (2003) 'The British economy between the wars', in Floud, R. and
Johnson, P. (ed.) The Cambridge economic history of modern
Britain. Cambridge, UK: Cambridge University Press, pp. 314-343.
Eisenhardt, K.M. (1989) 'Agency theory: an assessment and review', Academy of
Management Review, 14(1), pp. 57-74.
Elbaum, B. and Lazonick, W. (1984) 'The decline of the British Economy: an
institutional perspective', Journal of Economic History, 44(2), pp. 567-583.
Estevadeordal, A., Frantz, B. and Taylor, A.M. (2003) 'The rise and fall of world trade,
1870-1939', The Quarterly Journal of Economics, CXVIII(2), pp. 359-407.
Fitzsimons, E., Hogan, V. and Neary, J.P. (1999) 'Explaining the volume of North-
South trade in Ireland: a gravity model approach', The Economic and Social
Review, 30(4), pp. 381-401.
Fukao, K., Okubo, T. and Stern, R.M. (2003) 'An econometric analysis of trade
diversion under NAFTA', North American Journal of Economics and
Finance, 14(1), pp. 3-24.

D.P. Jordan
Page 310 of 317
Ganau, R. and Rodriguez-Pose, A. (2019) 'Do high-quality local institutions shape
labour productivity in Western European manufacturing firms?', Papers in
Regional Science, 98(4), pp. 1633-1666.
Gardiner, B., Martin, R., Sunley, P. and Tyler, P. (2013) 'Spatially unbalanced growth
in the British economy', Journal of Economic Geography, 13(6), pp. 889–
928.
Geary, F. (1997) 'The emergence of mass unemployment: wages and employment in
shipbuilding between the wars', Cambridge Journal of Economics, 21(3), pp.
303-321.
Geary, F. and Johnson, W. (1989) 'Shipbuilding in Belfast, 1861-1986', Irish
Economic and Social History, 16(1), pp. 42-64.
Geary, F. and Stark, T. (2019) '150 years of regional GDP: United Kingdom and
Ireland', in Rosés, J.R. and Wolf, N. (ed.) The economic development of
Europe's regions: a quantitative history since 1900. Abingdon, UK: Routledge,
pp. 330-362.
Ghosh, D.C. (1940) 'The statistical estimate of internal trade', The Indian Journal of
Statistics, 4(4), pp. 497-500.
Gibson, N. (1996), ‘Northern Ireland and Westminster: Fiscal Decentralisation. A
Public Economics Perspective’, in NIEC, Decentralised Government and
Economic Performance in Northern Ireland (Belfast, NIEC), pp.10-90.
Gibson, N.J. and Spencer, J.E. (1981) 'Unemployment and wages in Northern
Ireland', The Political Quarterly, 52(1), pp. 100-114.
Giordano, C. and Giugliano, F. (2015) 'A tale of two Fascisms: labour productivity
growth and competition policy in Italy, 1911-1951.', Explorations in Economic
History, 55(), pp. 25-38.
Greaves, J.I. (2002) 'Competition, collusion, and confusion: the state and the
reorganization of the British cotton industry, 1931-1939', Enterprise and
Society, 3(1), pp. 48-79.
Green, A.J. (1979) 'Devolution and public finance: Stormont from 1921 to 1972',
Studies in Public Policy, 48(1), pp. i-20.
Hamlin, A.P. (1991) 'Decentralization, competition and the efficiency of federalism',
The Economic Record, 67(3), pp. 193-204.
Harbinson, J.F. (1974) The Ulster Unionist Party, 1882-1973, 2nd edn., Belfast, UK:
Blackstaff Press Limited.
Harley, C.K. (2003) 'Trade, 1870-1939: from globalisation to fragmentation', in Floud,
R. and Johnson, P. (ed.) The Cambridge economic history of modern
Britain. Cambridge, UK: Cambridge University Press, pp. 161-189.
Harrison, R.T. (1990) 'Industrial development policy', in Harris, R., Jefferson, C., and
Spencer, J. (ed.) The Northern Ireland economy: a comparative study in the
economic development of a peripheral region. Harlow, UK: Longman Group UK
Limited, pp. 86-121.

D.P. Jordan
Page 311 of 317
Harris, R. (1991) Regional economic policy in Northern Ireland 1945-1988, Aldershot,
UK: Avebury.
Harris, R. and Moffat, J. (2017a) 'The UK productivity puzzle, 2008-2012: evidence
using plant-level estimates of total factor productivity', Oxford Economic
Papers, 69(3), pp. 529-549.
Harris, R. and Moffat, J. (2017b) 'The sources of the Scotland-Rest of the UK
productivity gap: implications for policy', Regional Studies, 51(9), pp. 1297-
1311.
Harvey, M. and Keating, M. (2014) 'The political economy of small European states:
and lessons for Scotland', National Institute Economic Review, 227(1), pp. R54-
R66.
Hayek, F.A. (1945) 'The use of knowledge in society', American Economic Review,
35(4), pp. 519-530.
Hewitt, V.N. (1990) 'The public sector', in Harris, R.I.D., Jefferson, C.W. and Spencer,
J.E. (ed.) The Northern Ireland economy: a comparative study in the economic
development of a peripheral region. Harlow, UK: Longman Group UK Limited,
pp. 353-377.
Hitchens and Birnie (1989a) 'Productivity levels in Northern Ireland manufacturing
industry: a comparison with Great Britain', Regional Studies, 23(5), pp. 447-
454.
Hitchens, D.M.W.N. and Birnie, J.E. (1989b) Manufacturing productivity in Northern
Ireland: a comparison with Great Britain, Belfast: Northern Ireland Economic
Research Centre.
Hitchens, D.M.W.N., Wagner, K. and Birnie, J.E. (1990) Closing the productivity gap:
a comparison of Northern Ireland, the Republic of Ireland, Britain and West
Germany, Aldershot, UK: Avebury.
Hitchens, D.M.W.N. and Birnie, J.E. (1994) The competitiveness of industry in Ireland,
Aldershot, UK: Avebury.
H.M. Government (2011) Unlocking growth in cities, London, UK: Cabinet Office, H.M.
Government.
H.M. Government (2015) Scotland in the United Kingdom: an enduring settlement,
London, UK: Cabinet Office, H.M. Government.
H.M. Stationery Office (various years) House of Commons Papers, London, UK:
H.M.S.O..
H.M. Stationery Office (various years) House of Commons Papers of Northern
Ireland, Belfast, UK: H.M.S.O..
H.M. Stationery Office (various years) Report on the census of production of Northern
Ireland, Belfast, UK: H.M.S.O..
H.M. Stationery Office (various years) Report on the census of production, London,
UK: H.M.S.O..

D.P. Jordan
Page 312 of 317
H.M. Stationery Office (HMSO) (1971) British labour statistics: historical abstract
1886-1968, London, UK: Department of Employment.
H.M. Stationery Office (HMSO) (1978) Historical record of the census of production,
1907 to 1970, London, UK: Government Statistical Service.
H.M. Treasury (2011) Rebalancing the Northern Ireland economy, London, UK: H.M.
Treasury.
H.M. Treasury (2016) Northern Powerhouse Strategy, London, UK: H.M. Treasury.
Hornby, W.B. (1995) 'Economics and business, the theory of the firm revisited: a
Scottish perspective', Management Decision, 33(1), pp. 33-41.
Hughes, G.A. (1987) 'Fiscal federalism in the UK', Oxford Economic Review of
Economic Policy, 3(2), pp. 1-23.
Isles, K.N. and Cuthbert, N. (1957) An economic survey of Northern Ireland, Belfast:
H.M. Stationery Office.
Jacks, D.S., Meissner, C.M., and Novy, D. (2011) 'Trade booms, trade busts, and
trade costs', Journal of International Economics, 83(2), pp. 185-201.
Jacks, D.S. (2014) 'Defying gravity: The Imperial Economic Conference and the
reorientation of Canadian trade', Explorations in Economic History, 53, pp.
19-39.
Johnson, D.S. (1974) 'The economic history of Ireland between the Wars', Irish
Economic and Social History, 1, pp. 49-61.
Johnson, D.S. (1979) 'Cattle smuggling on the Irish Border 1932-38', Irish Economic
and Social History, 6, pp. 41-63.
Johnson, D.S. (1985a) 'The Northern Ireland Economy, 1914-39', in Kennedy, L. and
Ollerenshaw, P. (eds.) An economic history of Ulster, 1820-1940. Manchester:
Manchester University Press, pp. 184-223.
Johnson, D. (1985b) The interwar economy in Ireland, Dublin: Economic and Social
History Society of Ireland.
Jones, M.E.F. (1985) 'Regional employment multipliers, regional policy, and structural
change in interwar Britain', Explorations in economic history, 22(4), pp. 417-
439.
Kennedy, K.A., Giblin, T. and McHugh, D. (1988) The economic development of
Ireland in the twentieth century, London: Routledge.
King, D. and Eiser, D. (2016) 'Reform of the Barnett Formula with needs assessment:
can the challenges be overcome?', Regional Studies, 50(5), pp. 790-804.
Kitson, M. and Solomou, S. (1990) Protectionism and economic revival: the British
interwar economy, Cambridge, UK: Cambridge University Press.
Kitson, M., Solomou, S. and Weale, M. (1991) 'Effective protection and economic
recovery in the United Kingdom during the 1930s', The Economic History
Review, 44(2), pp. 328-338.

D.P. Jordan
Page 313 of 317
Klasing, M.J. and Milionis, P. (2014) 'Quantifying the evolution of world trade, 1870-
1949', Journal of International Economics, 92(1), pp. 185-197.
Kornai, J. (1986) 'The soft budget constraint', Kyklos, 39(1), pp. 3-30.
Lamoreaux, N.R., Levenstein, M. and Sokoloff, K.L. (2006) 'Mobilizing venture capital
during the second industrial revolution: Cleveland, Ohio, 1870-1920', Capitalism
and Society, 1(3), pp. 1-60.
Law, David (1964) 'Industrial movement and locational advantage', The Manchester
School, 32(2), pp. 131-154.
Lawrence, R.J. (1965) The government of Northern Ireland: public finances and public
services, Oxford: Oxford University Press.
Lee, C.H. (1971) Regional economic growth in the United Kingdom since the 1880s,
Maidenhead, UK: McGraw-Hill.
Lee, C.H. (1995) Scotland and the United Kingdom: the economy and the Union in
the twentieth century, Manchester, UK: Manchester University Press.
Lewis, W.A. (1954) 'Economic development with unlimited supplies of labor', The
Manchester School of Economic and Social Studies, 22, pp. 139-191.
Mac Flynn, P. (2016) Productivity and the Northern Ireland economy, Belfast: Nevin
Economic Research Institute.
Maddison, A. (2010) Statistics on World Population, GDP and Per Capita GDP, 1-
2008 AD, Available at: http://www.ggdc.net/maddison/oriindex.htm
(Accessed: 4th February 2019).
Madsen, J.B. (2001) 'Trade barriers and the collapse of world trade during the Great
Depression', Southern Economic Journal, 67(4), pp. 848-868.
Mansergh, N. (1936) The government of Northern Ireland: a study in devolution,
London: G. Allen & Unwin.
McCallum, J. (1995) 'National borders matter: Canada-U.S. regional trade
patterns', American Economic Review, 85(3), pp. 615-623.
McCann, G. (2013) 'Protectionism and the "Economic War" in interwar
Ireland', Journal of European Economic History, 43(3), pp. 39-68.
McGregor, P.G. and Swales, K. (2005) 'Economics of devolution/decentralization in
the UK: some questions and answers', Regional Studies, 39(4), pp. 477-494.
Mishkin, F.S. and Eakins, S.G. (2012) Financial markets and institutions, UK: Pearson
Education Limited.
Mitchell, B.R. (1988) British historical statistics, Cambridge, UK: Cambridge
University Press.
Mitchell, B.R. (2013) International historical statistics; 1750-2010, Basingstoke,
Hampshire, UK: Palgrave Macmillan.
Mitchell, J. (2006) 'Undignified and inefficient: financial relations between London and
Stormont', Contemporary British History, 20(1), pp. 55-71.
D.P. Jordan
Page 314 of 317
Morgan, K. (2001) 'The new territorial politics: rivalry and justice in post-devolution
Britain', Regional Studies, 35(4), pp. 343-348.
National Institute of Economic and Social Research (NIESR) (1943) Trade regulations
and commercial policy of the United Kingdom, Cambridge, UK: Cambridge
University Press.
Neary, J.P. and Ó Gráda, C. (1991) 'Protection, economic war and structural changes:
The 1930s in Ireland', Irish Historical Studies, 27(107), pp. 250-266.
North, D.C. (1990) Institutions, institutional change and economic performance,
Cambridge, UK: Cambridge University Press.
North, D.C. (1994) 'Economic performance through time', American Economic
Review, 84(3), pp. 359-368.
North, D.C. and Weingast, B.R. (1989) 'Constitutions and commitment: the evolution
of institutions governing public choice in seventeenth-century England', Journal
of Economic History, 49(4), pp. 803-832.
North, D.C., Wallis, J.J., and Weingast, B.R. (2009) Violence and social orders: a
conceptual framework for interpreting recorded human history, New York:
Cambridge University Press.
Oates, W.E. (1972) Fiscal federalism, USA: Harcourt Brace Jovanovich Inc.
Oates, W.E. (1999) 'An essay on fiscal federalism', Journal of Economic
Literature, 37(3), pp. 1120-1149.
Oates, W.E. (2005) 'Towards a second-generation theory of fiscal federalism',
International Tax and Public Finance, 12(4), pp. 349-373.
Ó Gráda, C. (1997) A rocky road: The Irish economy since the 1920s, Manchester,
UK: Manchester University Press.
Ó Gráda, C. and Walsh, B.M. (2006) 'Did (and does) the Irish Border
matter?', Mapping Frontiers, Plotting Pathways: routes to North-South
cooperation in a divided island, Working Paper No. 10
Ollerenshaw, P. (1985) ‘Industry, 1820-1914', in Kennedy, L. and Ollerenshaw, P.
(eds.) An economic history of Ulster, 1820-1940. Manchester: Manchester
University Press, pp. 62-108.
Ollerenshaw, P. (1991) 'Textiles and regional economic decline: Northern Ireland
1914-70', in Holmes, C. and Booth, A. (ed.) Economy and society: European
industrialisation and its social consequences. Leicester, UK: Leicester
University Press, pp. 58-83.
Ollerenshaw, P. (2013a) Northern Ireland in the Second World War: politics,
economic mobilisation and society, 1939-45, Manchester, UK: Manchester
University Press.
Ollerenshaw, P. (2013b) 'Business and finance, 1780-1945', in Kennedy, L. and
Ollerenshaw, P. (ed.) Ulster since 1600: politics, economy and society. Oxford,
United Kingdom: Oxford University Press, pp. 177-194.

D.P. Jordan
Page 315 of 317
Olson, M. (1969) 'The principle of "fiscal equivalence": the division of responsibilities
among different levels of government', The American Economic Review, 59(2),
pp. 479-487.
ONS (2004) 'Consumer price inflation since 1750', Economic Trends, 604, pp. 38-46.
ONS (2020) Retail prices index: Long run series: 1947 to 2019, Available
at: https://www.ons.gov.uk/economy/inflationandpriceindices/timeseries/cdko/
mm23 (Accessed: 10th February 2020).
Ormerod, P.A. and Worswick, G.D.N. (1982) 'Unemployment in interwar
Britain', Journal of Political Economy, 90(2), pp. 400-409.
O'Rourke, K. (1991) 'Burn everything British but their coal: The Anglo-Irish Economic
War of the 1930s', Journal of Economic History, 51(2), pp. 357-366.
Peltzman, S. (1976) 'Toward a more general theory of regulation', The Journal of Law
and Economics, 19(2), pp. 211-240.
Pessoa, J.P. and Van Reenen, J. (2014) 'The UK productivity and jobs puzzle: does
the answer lie in wage flexibility?', The Economic Journal, 124(576), pp. 433-
452.
Pike, A., Rodriguez-Pose, A., Tomaney, J., Gianpiero, T., and Tselios, V. (2012) 'In
search of the 'economic dividend' of devolution: spatial disparities, spatial
economic policy, and decentralisation in the UK', Environment and Planning C:
Government and Policy, 30(1), pp. 10-28.
Pollard, S. (1992) The development of the British economy, 1914-1990, 4th edn.,
Great Britain: Edward Arnold.
Qian, Y. and Weingast, B.R. (1997) 'Federalism as a commitment to preserving
market incentives', Journal of Economic Perspectives, 11(4), pp. 83-92.
Quekett, A.S. (1928) The Constitution of Northern Ireland, Belfast, UK: H.M.
Stationery Office.
Ranis, G. and Fei, J. (1961) 'A theory of economic development', American Economic
Review, 51, pp. 533-565.
Richardson, H.W. (1961) 'The new industries between the wars', Oxford Economic
Papers, 13(3), pp. 360-384.
Richardson, H.W. (1967) Economic recovery in Britain, 1932-9, London: Weidenfeld
and Nicolson.
Riordan, S. (2018) 'Politics, economy, society: Northern Ireland, 1920-1939', in
Bartlett, T. (ed.) The Cambridge History of Ireland: Volume 4, 1880 to the
present. Cambridge, UK: Cambridge University Press, pp. 296-322.
Rizov, M. and Walsh, P.P. (2011) 'Is there a rural-urban divide? Location and
productivity of UK manufacturing', Regional Studies, 45(5), pp. 641-656.
Rodríguez -Pose, A. and Bwire, A. (2004) 'The economic (in)efficiency of devolution',
Environment and Planning A, 36(11), pp. 1907-1928.

D.P. Jordan
Page 316 of 317
Rodríguez-Pose, A. and Gill, N. (2003) 'The global trend towards devolution and its
implications', Environment and Planning C: Government and Policy, 21(3), pp.
333-351.
Rodríguez -Pose, A. and Gill, N. (2005) 'On the 'economic dividend' of devolution',
Regional Studies, 39(4), pp. 405-420.
Rodríguez-Pose, A. (2018) 'The revenge of places that don't matter (and what to do
about it)', Cambridge Journal of Regions, Economy and Society, 11(1), pp. 189-
209.
Rowthorn, B. (1981) 'Northern Ireland: an economy in crisis', Cambridge Journal of
Economics, 5(1), pp. 1-31.
Sandberg, L.G. (1974) Lancashire in decline: a study in entrepreneurship, technology,
and international trade, Columbus: Ohio State University Press.
Schlueter, A. (2014) Institutions and small settler economies: a comparative study of
New Zealand and Uruguay, 1870-2008, New York: Palgrave Macmillan.
Sheppard, D.K. (1971) The growth and role of UK Financial Institutions 1880-1962,
London, UK: Methuen & Co Ltd.
Simon, H.A. (1959) 'Theories of decision-making in economics and behavioural
science', The American Economic Review, 49(3), pp. 253-283.
Simpson, J.V. (1971) 'Regional analysis - the Northern Ireland experience', Economic
and Social Research Institute, Economic and Social Review, 2(4), pp. 507-529.
Singleton, J. (1986) 'Lancashire's last stand: declining employment in the British
cotton industry, 1950-70', Economic History Review, XXXIX(I), pp. 92-107.
Stafford, G.B. (1981) The end of economic growth? Growth and decline in the UK
since 1945, Oxford, UK: Robertson.
Steed, G.P.F. (1971) 'Internal organization, firm integration, and locational change:
the Northern Ireland linen complex, 1954-1964', Economic Geography, 47(3),
pp. 371-383.
Stigler, G.J. (1971) 'The theory of economic regulation', The Bell Journal of
Economics and Management Science, 2(1), pp. 3-21.
Tabellini, G. (2010) 'Culture and institutions: economic development in the regions of
Europe', Journal of the European Economic Association, 8(4), pp. 677-716.
Thirlwall, A.P. (1980) 'Regional problems are "balance-of-payments"
problems', Regional Studies, 14(5), pp. 419-425.
Tiebout, C.M. (1956) 'A pure theory of local expenditures', Journal of Political
Economy, 64(5), pp. 416-424.
Tomlinson, J. (2014) 'Imagining the economic nation: The Scottish case', The Political
Quarterly, 85(2), pp. 170-177.
Ulster Year Book (various years) Ulster Year Book, Belfast, UK: H.M.S.O..

D.P. Jordan
Page 317 of 317
Vo, D.H. (2010) 'The economics of fiscal decentralization', Journal of Economic
Surveys, 24(4), pp. 657-679.
Weingast, B.R. (2009) 'Second generation fiscal federalism: the implications of fiscal
incentives', Journal of Urban Economics, 65(3), pp. 279-293.
Weingast, B.R. (2014) 'Second generation fiscal federalism: political aspects of
decentralization and economic development', World Development, 53, pp. 14-
25.
Wilson, T. (1989) Ulster: conflict and consent, Oxford: Basil Blackwell.
Yi, K. (2010) 'Can multistage production explain the home bias in trade?', The
American Economic Review, 100(1), pp. 364-393.


![Jambalaya [yearbook] 1920 plus Medical yearbook 1920](https://static.fdocuments.us/doc/165x107/586cd4c31a28ab0b6b8bf18e/jambalaya-yearbook-1920-plus-medical-yearbook-1920.jpg)