- Evidence from Kwale, Kenya - gov.uk · 4.4% of the African population (44.4 million) were covered...
20
Insuring Against Rural Water Risk - Evidence from Kwale, Kenya August, 2015
Transcript of - Evidence from Kwale, Kenya - gov.uk · 4.4% of the African population (44.4 million) were covered...

08 Fall
Insuring Against Rural Water Risk
- Evidence from Kwale, Kenya
August, 2015
Water Programme, Working Paper 3 – August 2015 2
Smith School Water Programme
The Smith School Water Programme aims to understand and address water-related risks to economic growth, human development and environmental management. A problem-based and interdisciplinary approach focuses on designing, testing and implementing new tools, technologies and models. Current projects are making science, policy and practice advances in the areas of urban utility finance, rural water institutions, groundwater risk management, smart river management, and mobile-enabled water technologies. Two themes guide the programme: (1) Water Security, Growth and Development and (2) Smart Water Systems. The Water Programme works in partnership with the School of Geography and the Environment, Department of Engineering Science, Skoll Centre for Social Entrepreneurship and the wider Oxford Water Network with over 100 faculty and researchers working globally on water science and policy challenges across climate systems, economics, ecosystems, energy, engineering, food systems, hydrology, law, politics, policy and public health. The programme is currently funded with over £17 million of competitive grants won from UK research councils (ESRC, NERC), DFID, UNICEF, John Fell Fund and the Skoll Centre for Social Entrepreneurship. Past donors include OECD, World Bank and the Gates Foundation. Enterprise partners in the programme include global leaders in the extractives industry, beverages/food sector, insurance, mobile network operators, and wireless technology and semi-conductor industries. For more information: http://www.smithschool.ox.ac.uk/research-programmes/water.php
Water Programme, Working Paper 3 – August 2015 3
Executive Summary
This working paper assesses the case for insurance to address rural water sustainability challenges in Africa.
Community-based management of handpumps has been the dominant approach to rural water supplies in sub-
Saharan Africa for the last three decades, however the financing of operation and maintenance remains a chronic
and widespread problem. In response, insurance models and concepts have been proposed to identify and
reduce financial risk for community handpumps.
We assess the potential for handpump insurance to reduce financial risks in Kwale, Kenya, by drawing on data
collected from over 3,000 households and 552 handpumps. Findings suggests that the unpredictable magnitude
and timing of financial risk associated with handpump operation and maintenance presents a major challenge
for communities. Pooling finances across multiple communities could reduce a community‟s exposure to high
cost, low probability events. However, uptake and awareness of insurance products is low amongst rural water
users, and a standalone handpump insurance product is unlikely to offer a viable business model.
Instead, a more workable alternative would be high quality, supra-community maintenance services
underpinned by an insurance-style financing mechanism that pools funds and spreads risk. Results from a
choice experiment indicate households are open to alternative maintenance models, and would be willing to pay
between USD 0.59-1.16 per month for a service that repaired handpumps within two days. Low-income
households appear least likely to participate, which needs careful policy consideration. Field trials of these
concepts are needed to demonstrate whether they offer feasible and scalable solutions.
Water Programme, Working Paper 3 – August 2015 4
Table of Contents
1 INTRODUCTION .......................................................................................................................................5
2 BACKGROUND ..........................................................................................................................................5
2.1 THE RISE OF MICROINSURANCE .............................................................................................................5
2.2 RURAL WATER SUSTAINABILITY AND COMMUNITY-BASED FINANCING OF O&M.............................6
2.3 WHY INSURANCE THINKING IS RELEVANT TO RURAL WATER SERVICES ............................................6
3 EVIDENCE FROM KWALE, KENYA ......................................................................................................8
3.1 AWARENESS AND UPTAKE OF INSURANCE ...........................................................................................9
3.2 FINANCIAL RISK AND HANDPUMP SUSTAINABILITY ............................................................................9
3.3 POOLING FUNDS AND FINANCIAL RISK REDUCTION ..........................................................................11
3.4 SUMMARY .............................................................................................................................................12
4 IS THERE CONSUMER DEMAND FOR NEW APPROACHES? ....................................................12
4.1 SERVICE LEVEL .....................................................................................................................................14
4.2 PAYMENT LEVELS AND MODALITIES ...................................................................................................16
4.3 ROLE OF PRIVATE SECTOR ...................................................................................................................16
4.4 CONSUMER PROFILE AND POVERTY ...................................................................................................16
4.5 ARE PEOPLE MAKING INFORMED CHOICES? .......................................................................................16
4.6 SUMMARY .............................................................................................................................................17
5. CONCLUSION ...............................................................................................................................................17
6 ACKNOWLEDGEMENTS .............................................................................................................................18
7 KEY REFERENCES ..........................................................................................................................................18

Water Programme, Working Paper 3 – August 2015 5
1 Introduction Community-based management of handpumps has been the dominant approach to rural water supplies in sub-
Saharan Africa for the last three decades. However, with one in three handpumps non-functional at any one
time (RWSN 2009), the evidence suggests significant deficiencies in this management model. Yet the paradigm
continues to underpin hundreds of millions of US dollars spent by donors and governments on rural water
supplies every year. A shift in approach is needed if these investments are to result in more sustainable water
services and yield optimal human development dividends.
A major weakness of community-based management is the financing of operation and maintenance (O&M)
activities (Carter et al. 1999, Harvey 2007, Foster 2013). As a solution, some have flagged the potential for
insurance models and concepts to alleviate financial risk inherent to community-based management (Carter et
al. 2010, Hope et al. 2012, Fonseca et al. 2013). In particular, pooling of funds across multiple water supply
systems could spread risk and prevent individual communities from being exposed to financial shocks
associated with high cost, low probability events.
This working paper provides a preliminary assessment of the case for handpump insurance to reduce financial
risks, through a desk review of the micro-insurance and rural water supply literature. We assess the
applicability of insurance concepts to rural water supply services in Kwale, Kenya, drawing on data collected
from over 3,000 households using 552 handpumps.
2 Background
2.1 The rise of microinsurance The rise of microinsurance in sub-Saharan African over the last decade has been well documented. Between
2008 and 2011, the number of people covered by microinsurance increased by over 200% (McCord et al. 2013).
Poverty and vulnerability to risk go hand-in-hand (Churchill 2007), and there is a widely held belief that
insurance can have poverty reduction benefits if microinsurers are able to expand their customer base among
low-income populations. For example, a systematic review of 159 studies by Spaan et al. (2012) found that
community-based health insurance in Africa and Asia has led to improvements in health service utilization and
reduced out-of-pocket expenditure for those insured.
Despite the positive trend, the level of microinsurance uptake remains modest. In 2011 it was estimated that
4.4% of the African population (44.4 million) were covered by some form of microinsurance, with the majority
coming from South Africa (McCord et al. 2013). When South Africa is excluded, microinsurance coverage drops
to 1.7% of the population. Life microinsurance is the most purchased product, accounting for 33.9 million
people. While the potential of health microinsurance has received significant attention, it reaches just 2.4 million
people. Numerous factors have hindered industry growth, including moral hazard, adverse selection, correlated
risks, high transaction costs and lack of robust data (Biener & Eling 2012). A lack of trust and understanding are
further barriers, and few schemes have been able to achieve an uptake exceeding 25% (De Bock & Gelade 2012).
Nonetheless, it is anticipated that the market will expand considerably in the coming years, particularly if
mobile technology can be harnessed to reduce distribution and transaction costs.
Water Programme, Working Paper 3 – August 2015 6
2.2 Rural water sustainability and community-based financing of O&M Juxtaposing the positive trajectory of microinsurance is the stagnation of water supply performance in rural
areas of sub-Saharan Africa. Low levels of handpump sustainability – the most common mode of rural water
supply – pose a threat to rural development across the continent. There are an estimated 823,000 waterpoints
fitted with handpumps intended to serve 184 million people (MacArthur 2015), yet approximately one third are
non-functional at any one time (RWSN 2009). The wasted investment is estimated to be in excess of one billion
USD (Baumann 2009). With more than 60,000 handpumps installed every year (Sansom & Koestler 2009), a
business-as-usual approach will mean these investments will generate sub-optimal development impacts.
The community handpump management model emerged as a response to limited capacity of newly
independent African nations and has been the default approach for rural water projects since the 1980s
(Arlosoroff et al. 1987, Briscoe & De Ferranti 1988). While governments may not be best placed to manage rural
handpumps, the evidential base that low-income, often isolated and poorly educated communities can
overcome complex common pool resource management responsibilities is far from convincing. Growing
evidence of poor performance has led to increasing criticism of this dominant paradigm (Mansuri & Rao 2004;
Harvey & Reed 2007).
A major weakness of community management is the expectation that communities are able and willing to cover
operation and maintenance (O&M) costs. Though around 70% of African countries are now adopting policies
promoting O&M cost recovery in the rural water sector (Bannerjee & Morella 2011, AfDB 2010), data from
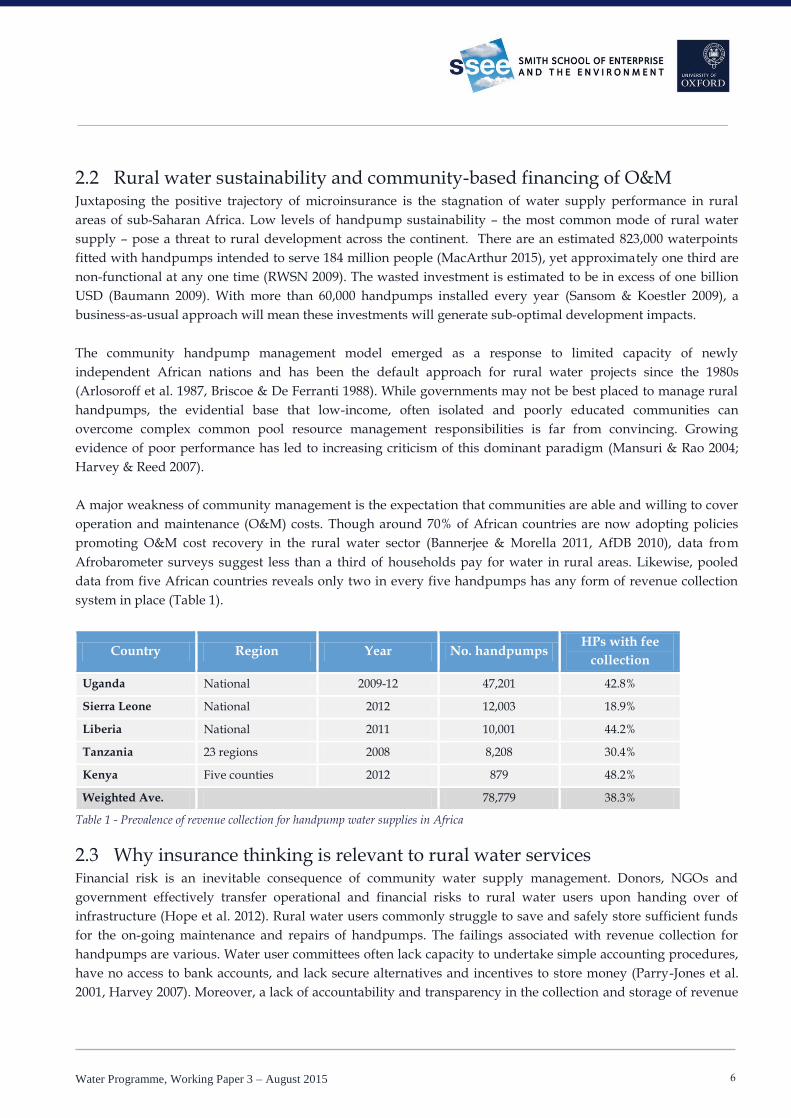
Afrobarometer surveys suggest less than a third of households pay for water in rural areas. Likewise, pooled
data from five African countries reveals only two in every five handpumps has any form of revenue collection
system in place (Table 1).
Country Region Year No. handpumps HPs with fee
collection
Uganda National 2009-12 47,201 42.8%
Sierra Leone National 2012 12,003 18.9%
Liberia National 2011 10,001 44.2%
Tanzania 23 regions 2008 8,208 30.4%
Kenya Five counties 2012 879 48.2%
Weighted Ave. 78,779 38.3%
Table 1 - Prevalence of revenue collection for handpump water supplies in Africa
2.3 Why insurance thinking is relevant to rural water services Financial risk is an inevitable consequence of community water supply management. Donors, NGOs and
government effectively transfer operational and financial risks to rural water users upon handing over of
infrastructure (Hope et al. 2012). Rural water users commonly struggle to save and safely store sufficient funds
for the on-going maintenance and repairs of handpumps. The failings associated with revenue collection for
handpumps are various. Water user committees often lack capacity to undertake simple accounting procedures,
have no access to bank accounts, and lack secure alternatives and incentives to store money (Parry-Jones et al.
2001, Harvey 2007). Moreover, a lack of accountability and transparency in the collection and storage of revenue

Water Programme, Working Paper 3 – August 2015 7
by water committees, and the attendant risk of misappropriation, undermines users‟ willingness-to-pay (Harvey
2007).
Even where fees are paid consistently, they are rarely determined in accordance with the expected life-cycle cost
of a handpump (Parry-Jones et al. 2001, Harvey 2007, Carter et al. 2010). Thus in many cases, the amount
collected will be insufficient to cover the real cost of the eventual repairs. In Ghana, for example, Whittington et
al. (2009) found only half of water user committees studied collected enough money to cover operating costs,
and less than a third collected enough to cover major repairs. While the WASHCost initiative has provided
valuable yardsticks for the cost of rural water services (WASHCost 2012), they are necessarily presented as
annualised average costs. However, in reality individual communities do not incur average costs each year –
rather maintenance costs occur as lumpy expenses at unpredictable points-in-time. So even if average life-cycle
cost tariffs are known and levied, they may well be inadequate for the sizable proportion of communities who
invariably incur repair costs greater than this average (Hope et al. 2012). Communities then should not only
concern themselves with the average cost, but also the range of possible costs and the level of financial risk they
should plan for.
In response to these challenges, there is a growing interest in insurance products as a possible approach for
pooling funds and sharing risk across many water supply systems and communities (Carter 2009, Harvey &
Reed 2007, Hope et al. 2012, Fonseca et al. 2013). In theory, such a solution could prevent individual
communities from facing unmanageably high repair costs at particular points in time, and boost users‟
willingness-to-pay with the offer of safe and secure storage of funds. Encouragingly, handpump insurance in
particular has some prima facie advantages over existing products offered by microinsurers. For example, the
likelihood and costs associated with handpump breakdowns can be calculated and modelled from existing data,
making risk and premium calculations simple, compared to the more complex array of losses associated with ill
health. Likewise, in contrast to index-based crop or livestock insurance where individual risks are likely to be
closely correlated, handpump insurance is unlikely to present covariant risk or shocks so long as coverage is
limited to pump failures, which are likely to be independent of each other, and not water resource failure, which
are not. Yet, despite its potential, handpump insurance has received only cursory references in the literature,
and a more detailed examination is warranted.
In response to these developments, this paper aims to carry out a preliminary appraisal of the potential for
insurance products and/or concepts to improve the sustainability of handpump water supplies, with a
particular focus on Kwale County, Kenya. Based on waterpoint and household-level data, the paper explores
the current level of awareness and uptake of insurance among handpump users; the nature of the financial risk
that handpump users face; and the potential for pooling funds across multiple handpumps to reduce this risk. It
then assesses whether there is consumer demand for handpump insurance amongst rural water users and the
possible modalities of operationalizing an insurance-based system.
Water Programme, Working Paper 3 – August 2015 8
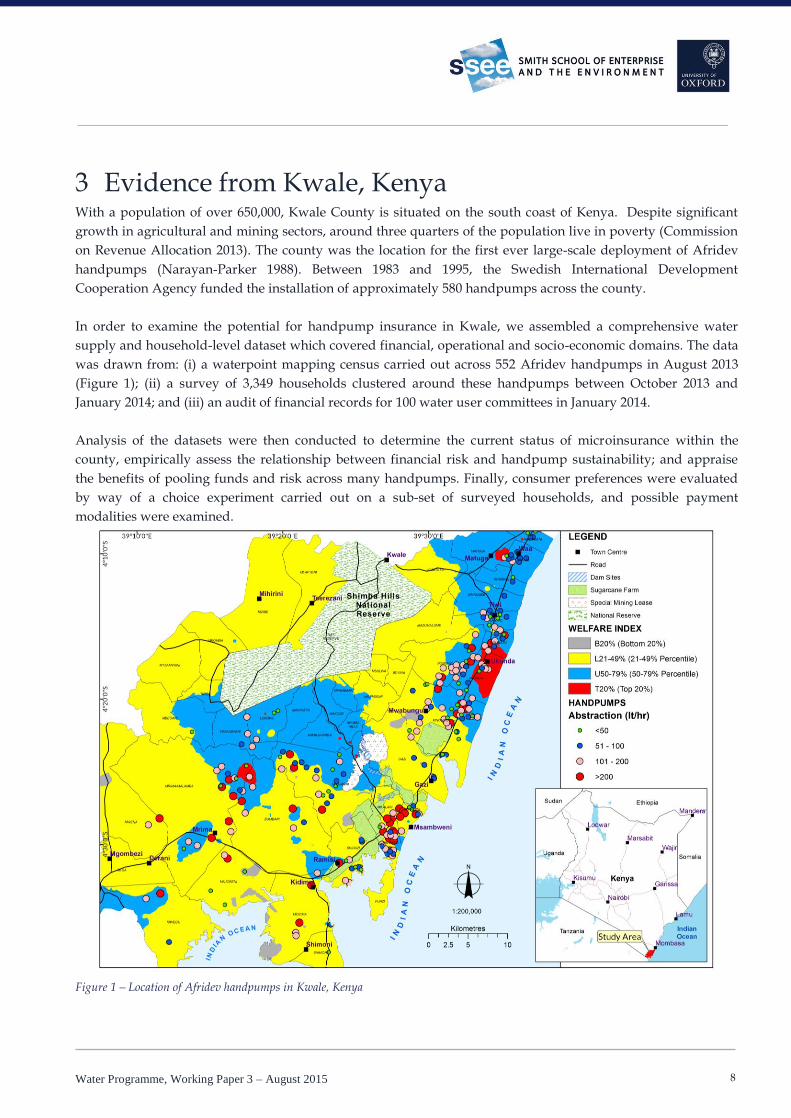
3 Evidence from Kwale, Kenya With a population of over 650,000, Kwale County is situated on the south coast of Kenya. Despite significant
growth in agricultural and mining sectors, around three quarters of the population live in poverty (Commission
on Revenue Allocation 2013). The county was the location for the first ever large-scale deployment of Afridev
handpumps (Narayan-Parker 1988). Between 1983 and 1995, the Swedish International Development
Cooperation Agency funded the installation of approximately 580 handpumps across the county.
In order to examine the potential for handpump insurance in Kwale, we assembled a comprehensive water
supply and household-level dataset which covered financial, operational and socio-economic domains. The data
was drawn from: (i) a waterpoint mapping census carried out across 552 Afridev handpumps in August 2013
(Figure 1); (ii) a survey of 3,349 households clustered around these handpumps between October 2013 and
January 2014; and (iii) an audit of financial records for 100 water user committees in January 2014.
Analysis of the datasets were then conducted to determine the current status of microinsurance within the
county, empirically assess the relationship between financial risk and handpump sustainability; and appraise
the benefits of pooling funds and risk across many handpumps. Finally, consumer preferences were evaluated
by way of a choice experiment carried out on a sub-set of surveyed households, and possible payment
modalities were examined.
Figure 1 – Location of Afridev handpumps in Kwale, Kenya

Water Programme, Working Paper 3 – August 2015 9
3.1 Awareness and uptake of insurance Results from the household survey indicate handpump users in Kwale have a low level of awareness of
insurance products and very few households purchase them. Only 2.2% of the surveyed households in Kwale
had purchased an insurance product in the last 12 months, compared to 3.2% of the wider Kenyan population
(McCord et al. 2013). Seven out of eight respondents were not even aware of insurance as a way of managing
risk. Health insurance was the most commonly known and purchased insurance product. There was a strong
association between socio-economic status and insurance awareness and purchasing history, a finding which is
consistent with the conclusions of Chankova et al (2008) and Gine et al. (2008). The reasons provided by
respondents suggest the major barriers to wider uptake are cost, perceived value, understanding and trust;
results which mirror findings from other parts of sub-Saharan Africa (Akotey et al. 2011).
Figure 2 - Household awareness and purchasing of insurance products in last 12 months (n=3,349)
Figure 3 - Reason(s) why insurance products not purchased in last 12 months among those who are aware of insurance products (n=329)
3.2 Financial risk and handpump sustainability The operational performance of handpump water supplies is broadly in line with findings from elsewhere in
sub-Saharan Africa. Of the 552 Afridev handpump sites located during the mapping exercise, 42% were non-
functional – 6.4% for less than one year, 30% for more than one year, and 5.6% for an unknown duration. Of the
handpumps that had been functional at some time within the previous 12 months, the mean downtime was 40
days based on responses from water users. On average, each breakdown lasted 23 days, with 2.3 breakdown
events per year (σ = 1.5). Accounting records suggested a slightly higher frequency of 3.2 repairs per year.
Waterpoint survey responses indicate the mean cost per repair is USD 49.63 (σ = 117.0) compared to USD 35.28
0.5%
0.4%
0.3%
0.3%
0.5%
0.8%
2.2%
2.7%
4.2%
5.5%
5.9%
7.7%
8.2%
12%
Employment
School
Life
Property
Vehicle
Health
Any
Awareness of insurance product Purchase of insurance product in last 12 months
13%
29%
42%
49%
Don't trust insurance companies
Don't understand insurance
Insurance not needed
Too expensive
Water Programme, Working Paper 3 – August 2015 10
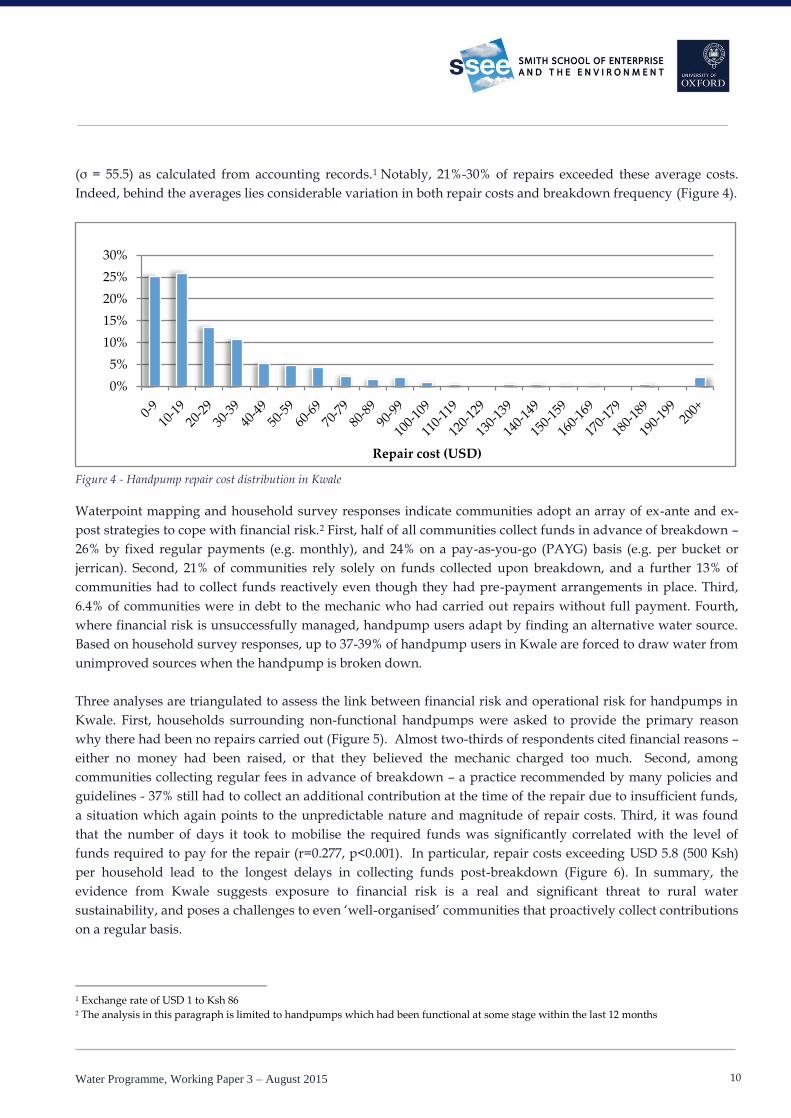
(σ = 55.5) as calculated from accounting records.1 Notably, 21%-30% of repairs exceeded these average costs.
Indeed, behind the averages lies considerable variation in both repair costs and breakdown frequency (Figure 4).
Figure 4 - Handpump repair cost distribution in Kwale
Waterpoint mapping and household survey responses indicate communities adopt an array of ex-ante and ex-
post strategies to cope with financial risk.2 First, half of all communities collect funds in advance of breakdown –
26% by fixed regular payments (e.g. monthly), and 24% on a pay-as-you-go (PAYG) basis (e.g. per bucket or
jerrican). Second, 21% of communities rely solely on funds collected upon breakdown, and a further 13% of
communities had to collect funds reactively even though they had pre-payment arrangements in place. Third,
6.4% of communities were in debt to the mechanic who had carried out repairs without full payment. Fourth,
where financial risk is unsuccessfully managed, handpump users adapt by finding an alternative water source.
Based on household survey responses, up to 37-39% of handpump users in Kwale are forced to draw water from
unimproved sources when the handpump is broken down.
Three analyses are triangulated to assess the link between financial risk and operational risk for handpumps in
Kwale. First, households surrounding non-functional handpumps were asked to provide the primary reason
why there had been no repairs carried out (Figure 5). Almost two-thirds of respondents cited financial reasons –
either no money had been raised, or that they believed the mechanic charged too much. Second, among
communities collecting regular fees in advance of breakdown – a practice recommended by many policies and
guidelines - 37% still had to collect an additional contribution at the time of the repair due to insufficient funds,
a situation which again points to the unpredictable nature and magnitude of repair costs. Third, it was found
that the number of days it took to mobilise the required funds was significantly correlated with the level of
funds required to pay for the repair (r=0.277, p<0.001). In particular, repair costs exceeding USD 5.8 (500 Ksh)
per household lead to the longest delays in collecting funds post-breakdown (Figure 6). In summary, the
evidence from Kwale suggests exposure to financial risk is a real and significant threat to rural water
sustainability, and poses a challenges to even „well-organised‟ communities that proactively collect contributions
on a regular basis.
1 Exchange rate of USD 1 to Ksh 86 2 The analysis in this paragraph is limited to handpumps which had been functional at some stage within the last 12 months
0%
5%
10%
15%
20%
25%
30%
Repair cost (USD)

Water Programme, Working Paper 3 – August 2015 11
Figure 5 - Primary reasons given by households why non-functional community-managed handpump had not been not repaired (n=1098)
Figure 6 - Average time to collect repair funds for community-managed handpumps (excluding sponsored repairs)
3.3 Pooling funds and financial risk reduction One of the most compelling arguments for handpump insurance is that maintenance expenses can vary
substantially. Even with an efficient revenue collection system in place, repairs costs can be unpredictable both
in terms of magnitude and timing. Hence if a community is to ensure sufficient funds are saved for a range of
possible scenarios, a considerable risk loading needs to be added to a savings level based on the average repair
cost. However, if funds could be pooled across many communities, the magnitude of such a risk loading could
in theory be reduced. This notion draws on a central tenet actuarial insurability, that the greater the number of
mutually independent risks in a risk pool, the lower the variance of mean losses (Biener & Eling 2012).
To illustrate the potential benefit of pooling maintenance funds across many handpumps, we adapted an
actuarial modelling technique used by Dror & Armstrong (2006), and applied it to maintenance data from
multiple sources. Results of the modelling illustrate the significant impact pooling risk could have on the
financial risk faced by rural water users. Under the current community-based management model, the default
handpump pool size is one. With this arrangement, in order to cater for the 95th percentile expected annual cost
in any given year, each community would need to add a risk loading to saved funds (or additional reactive
contribution) equivalent to 230% of the mean maintenance cost. However if funding was pooled across 100
handpumps, the requisite risk loading would drop to around 20% of the mean maintenance cost, showing that
pooling funds has the potential to significantly reduce the risk of a community facing maintenance expenses far
in excess of the average.
2.4%
3.8%
5.0%
5.2%
9.8%
31%
32%
Use a rope and bucket instead
Water quality is poor
Not possible to repair
There is an acceptable alternative water source
The water committee is inactive
Mechanic charges too much
No money raised
0
10
20
30
40
<49 Ksh
(USD 0.57)
50 - 99 Ksh
(USD 0.58-1.15)
100 - 199 Ksh
(USD 1.16-2.31)
200 - 499 Ksh
(USD 2.32-5.80)
500+ Ksh
(USD 5.81+)Day
s to
co
llec
t fu
nd
s
Repair cost per household

Water Programme, Working Paper 3 – August 2015 12
3.4 Summary The data and analysis from Kwale leads to several conclusions. The first is that the unpredictable magnitude and
timing of financial risk associated with handpump operation and maintenance is a major challenge for
communities to overcome in isolation. The second is that pooling finances across a relatively modest number of
handpumps (tens rather than hundreds or thousands) would allow for spreading of these risks, and would
meaningfully reduce a community‟s exposure to high cost, low probability events.
That said, uptake and awareness of insurance products is low amongst rural water users (12% were aware of
insurance and only 2% had bought an insurance product in the last 12 months). Therefore, while it would seem
that insurance may well have a useful role to play in helping rural water users finance handpump repairs, it
would be extremely challenging to successfully promote an insurance product to generate a critical mass of
customers. Given that the value of the insurance product would be quite low per household, it would unlikely
be economical to spend significant sums on marketing. Moreover, key challenges associated with mainstream
microinsurance products – such as cost effective claims assessment, adverse selection, moral hazard and fraud –
would also be likely to afflict handpump insurance.
Coupling the insurance and claims assessment with the actual repair of the handpumps may address some of
these challenges, as well as reducing transactions costs and the time taken to effect repairs. Such a bundling
would also mean that rather than offering insurance per-se, a maintenance service which would use insurance
thinking in its design, could be offered, which might be more tangible and understandable and thus generate
larger uptake. In the same way that a motor vehicle breakdown service fixes your car, rather than leaving you at
the side of the road with the promise of an insurance payment a month later, such a service would also deliver
what users want: reliable water supplies. Financial risk would be assumed by the maintenance service provider
who can then spread it across multiple exposures. Scale combined with actuarial thinking would facilitate the
formulation of charges or premiums that would either enable a sustainable business in the case of a private
sector model, or permit a government or non-profit organisation undertaking or subsidising the work to
understand and manage the risk that they are now exposed to. In other words, a more viable prospect to a
standalone handpump insurance product is a high quality supra-community maintenance service underpinned
by an insurance-style financing mechanism that pools funds and spreads risk.
4 Is there consumer demand for new approaches? To see whether such an “insurance-backed” maintenance service would have consumer acceptance and
potential uptake, this section examines evidence of consumer demand to evaluate a) the level of service delivery
required, b) payment levels and modalities, c) the role of the private sector and d) the consumer profile of the
market, particularly in relation to lower income and vulnerable groups. The evidence to inform this analysis is
based on a stratified random sample of 1,570 households using 410 handpumps in the study area with an
average of 3.8 respondents per handpump (range: 1-8 households). A choice experiment was used to test
consumer preferences against competing alternatives and model social heterogeneity. We briefly explain the
method before reviewing results.
Choice experiments are a stated preference method widely applied to evaluate future but uncertain scenarios in
transport, consumer goods, healthcare or the environment. The method identifies key attributes of interest and
associated attribute levels to generate „choice cards‟ of different options. Respondents choose the option they
Water Programme, Working Paper 3 – August 2015 13
prefer from the choice card. Pictorial cards were used to reduce comprehension difficulties and so as not to
exclude those with low literacy or education levels. Piloting activities over three days refined the experimental
design and trained local enumerators in effective delivery and support to respondents. After data cleaning, 1,570
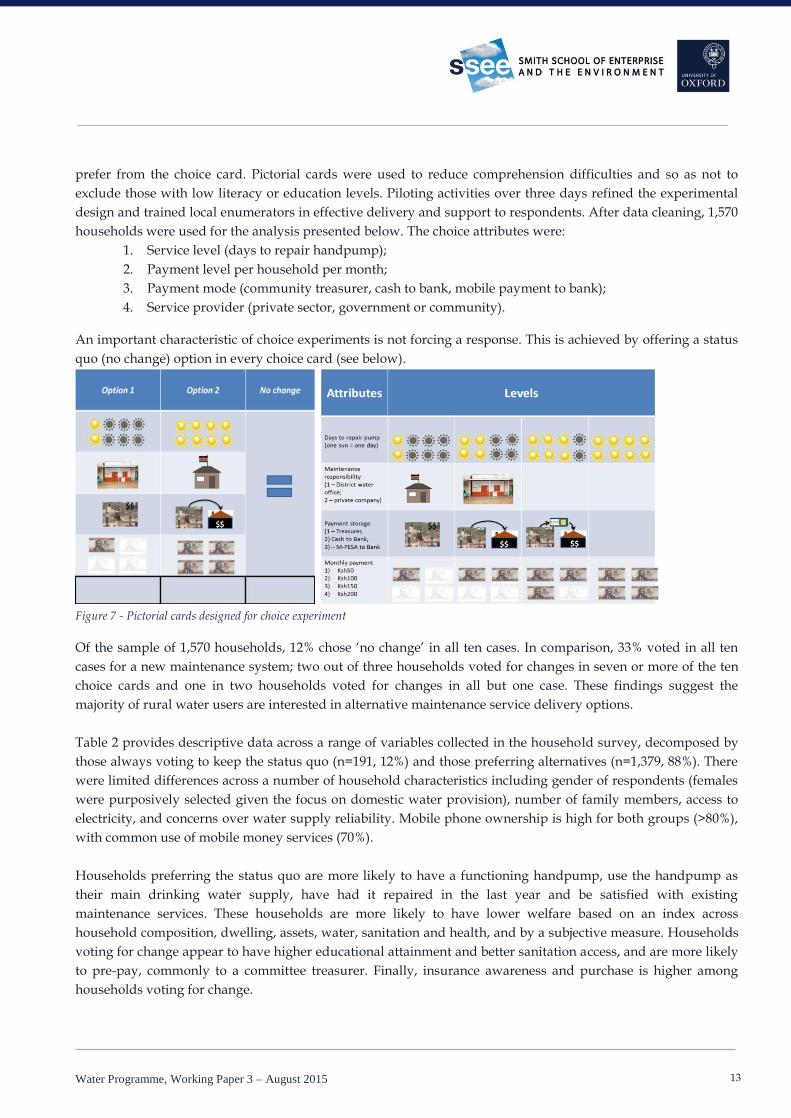
households were used for the analysis presented below. The choice attributes were:
1. Service level (days to repair handpump);
2. Payment level per household per month;
3. Payment mode (community treasurer, cash to bank, mobile payment to bank);
4. Service provider (private sector, government or community).
An important characteristic of choice experiments is not forcing a response. This is achieved by offering a status
quo (no change) option in every choice card (see below).
Figure 7 - Pictorial cards designed for choice experiment
Of the sample of 1,570 households, 12% chose „no change‟ in all ten cases. In comparison, 33% voted in all ten
cases for a new maintenance system; two out of three households voted for changes in seven or more of the ten
choice cards and one in two households voted for changes in all but one case. These findings suggest the
majority of rural water users are interested in alternative maintenance service delivery options.
Table 2 provides descriptive data across a range of variables collected in the household survey, decomposed by
those always voting to keep the status quo (n=191, 12%) and those preferring alternatives (n=1,379, 88%). There
were limited differences across a number of household characteristics including gender of respondents (females
were purposively selected given the focus on domestic water provision), number of family members, access to
electricity, and concerns over water supply reliability. Mobile phone ownership is high for both groups (>80%),
with common use of mobile money services (70%).
Households preferring the status quo are more likely to have a functioning handpump, use the handpump as
their main drinking water supply, have had it repaired in the last year and be satisfied with existing
maintenance services. These households are more likely to have lower welfare based on an index across
household composition, dwelling, assets, water, sanitation and health, and by a subjective measure. Households
voting for change appear to have higher educational attainment and better sanitation access, and are more likely
to pre-pay, commonly to a committee treasurer. Finally, insurance awareness and purchase is higher among
households voting for change.

Water Programme, Working Paper 3 – August 2015 14
Table 2 - Household characteristics, handpump use and payment behaviour decomposed by those voting for and against choice scenarios
for handpump maintenance service changes (n=1,570)
Variable Vote for Status Quo
(n=191; 12%) Vote for Change (n=1,379; 88%)
Ho
use
ho
ld
cha
ract
eri
stic
s
Female respondent 63.4% 70.2%
Highest level of completed education
Primary 57.6% 54.0%
Secondary 25.7% 33.6%
Household size – mean (SD) 5.2 (2.6) 4.6 (2.1)
Electricity access 9.9% 7.3%
Uses wood to cook 95.8% 95.1%
No sanitation facility (bush) 56.5% 41.7%
Water supply reliability is major concern 34.6% 31.3%
Own mobile phone 82.7% 85.3%
Use mobile money 69.6% 71.2%
Ha
nd
pu
mp
wa
ter
serv
ice
s
Reference handpump is main drinking water supply in dry season
78.0% 71.6%
Handpump functionality
Functioning 94.2% 83.5%
Non-functioning for less than a year
3.7% 7.6%
Non-functioning for more than a year
2.1% 8.9%
Household wants handpump repaired 4.2% 15.4%
Handpump repaired in last year 75.9% 68.4%
Satisfied or very satisfied with existing maintenance services
83.3% 63.7%
We
lfa
re a
nd
pa
ym
en
t b
eh
av
iou
r Household welfare index (quintile %) and subjective assessment
Bottom 20% 32.5% 16.4%
Top 20% 12.6% 21.7%
„Average‟ 20.9% 42.9%
„Not well-off‟ 78.5% 56.3%
Insurance knowledge and behaviour
Awareness 4.2% 13.1%
Purchase 1.6% 2.8%
Pre-pay for handpump usage 47.6% 59.4%
Treasurer collects water fees 50.3% 56.1%
4.1 Service level Table 3 reports on three models generated to analyse the choice experiment data. Model 1 is a multinomial
regression model which is significant but with low model fit (pseudo-R2=0.087). Model 2 interacts a selection of
socio-economic (dummy) variables which improves the model fit. Model 3 is a latent class specification which
models two significant voting clusters (Class 1 and 2) with the associated probability of group membership. The
model fit improves considerably for this specification (pseudo-R2=0.213) indicating preference heterogeneity.
Key insights from the modelling work indicate fixing handpumps in two days is a consistent and significant
preference. Four days may provide an upper limit but a lower service level would be rejected by consumers. We
explore consumer profiles further below.

Water Programme, Working Paper 3 – August 2015 15
47,100 Observations Model 1 Model 2 Model 3 Class 1
Model 3 Class 2
Probability of Class Membership N/A N/A 29%* 71%*
Attributes coeff. std.error coeff. std.error coeff. std.error coeff. std.error
Pay
men
t le
vel
Household payment per month 0.000 0.000 0.000 0.000 0.000 0.000 0.001* 0.000
Pay - Ksh50 ($0.58) per month -0.050 0.097 0.003 0.099 -0.793* 0.124 0.410* 0.113
Pay - Ksh100 ($1.16) per month -0.101 0.104 -0.108 0.107 -1.128* 0.138 0.281** 0.123
Pay - Ksh150 ($1.74) per month -0.572* 0.098 -0.571* 0.101 -2.026* 0.127 0.134 0.117
Pay - Ksh200 ($2.32) per month -0.489* 0.090 -0.522* 0.092 -0.903* 0.088 -0.941* 0.111
Mod
e Community treasurer -1.236* 0.079 -1.168* 0.081 -1.020* 0.130 -1.201* 0.090
Cash to bank -0.878* 0.085 -0.843* 0.087 -0.317** 0.148 -1.335* 0.089
MPesa to bank -1.211* 0.076 -1.170* 0.078 -0.897* 0.132 -1.689* 0.080
Ser
vic
e le
vel
Days to repair handpump -0.002* 0.000 -0.001* 0.000 -0.002* 0.000 -0.001* 0.000
2 days to repair 0.180* 0.057 0.202* 0.058 0.026 0.073 0.313* 0.063
4 days to repair 0.133** 0.061 0.148** 0.062 0.058 0.086 -0.040 0.065
6 days to repair -0.163** 0.078 -0.160** 0.079 0.027 0.112 -0.098 0.086
8 days to repair -0.900* 0.100 -0.932* 0.102 -0.121 0.149 -1.571* 0.109
Private sector maintenance provider -0.095** 0.048 -0.08*** 0.049 0.361* 0.088 -0.239* 0.049
Constants
C1
Female respondent 0.099** 0.044 0.471* 0.072 -0.09*** 0.049
Secondary education (highest level) 0.080*** 0.046 0.149** 0.069 0.147* 0.049
Own mobile phone 0.218* 0.077 0.071 0.136 0.326* 0.078
Use mobile money -0.312* 0.062 -0.032 0.102 -0.083 0.066
Not well-off' (self-assessment) -0.778* 0.046 -0.153** 0.077 -0.386* 0.048
Bottom 20% (welfare index) -0.241* 0.058 -0.680* 0.096 0.063 0.063
Top 20% (welfare index) -0.204* 0.058 0.089 0.091 -0.268* 0.062
Functioning handpump -0.520* 0.081 -1.084* 0.100 -0.381* 0.089
Handpump main drinking water supply in dry season 0.117** 0.057 0.759* 0.096 0.256* 0.059
Pre-pay for handpump water services 0.171* 0.042 0.285* 0.067 0.085*** 0.045
Satisfied with current maintenance services -0.441* 0.049 -0.467* 0.074 -0.344* 0.054
Aware of insurance products 0.106 0.067 0.533* 0.097 0.012 0.070
Constant 0.675* 0.093 1.806* 0.146 -0.680 0.210 2.492 0.156
C2
Female respondent 0.021 0.050 0.249* 0.066 -0.177* 0.048
Secondary education (highest level) 0.126** 0.052 0.111*** 0.066 0.208* 0.050
Own mobile phone 0.261* 0.089 0.182 0.118 0.393* 0.084
Use mobile money -0.239* 0.070 -0.505* 0.090 0.037 0.067
Not well-off' (self-assessment) -0.221* 0.053 -0.419* 0.067 0.242* 0.048
Bottom 20% (welfare index) -0.429* 0.068 -0.960* 0.103 -0.055 0.065
Top 20% (welfare index) 0.045 0.065 0.208* 0.080 -0.029 0.061
Functioning handpump -0.536* 0.089 -0.707* 0.107 -0.423* 0.087
Handpump main drinking water supply in dry season 0.037 0.064 0.351* 0.091 0.202* 0.060
Pre-pay for handpump water services 0.047 0.048 0.322* 0.064 -0.097** 0.046
Satisfied with current maintenance services -0.276* 0.057 -0.281* 0.071 -0.194* 0.055
Aware of insurance products 0.121 0.076 0.151 0.095 0.069 0.069
Constant -0.069 0.098 0.722* 0.157 -0.587 0.200 1.488 0.160
Table 3 - Choice model results
Note: * significant at 1% (*), 5% (**) and 10% (***) levels
Water Programme, Working Paper 3 – August 2015 16
4.2 Payment levels and modalities Increasing payment levels predictably result in declining consumer preferences. The relationship is not linear
with a provisional threshold price of USD 0.86 (Ksh100) per household per month emerging. Of particular note
is the positive and significant utility of paying Ksh100 in Model 3, Class 2. Whilst all other attributes remain
broadly constant (compared to other model specifications) a service level of two days records a high coefficient
value with all lower service levels negative. Given 71 per cent of the sample are likely to belong to Class 2 this
suggests current low levels of service delivery are driving low payment levels. The implication supported by a
sister study site is that payments are contingent on service delivery (Oxford/RFL, 2014).
Payment modalities are examined by a) committee treasurer, b) cash to bank, and c) M-Pesa to bank. Seven in
ten households have used a mobile money platform in the last year; the vast majority (>90%) Safaricom‟s M-
Pesa platform. The challenging finding is that none of these modalities is preferred by users. Cash to bank
appears the most favoured of the three options particularly in Model 3, Class 1 (coeff.= -0.317).
4.3 Role of Private Sector The final model specifications included service delivery by the private sector. The private sector is positive and
significant preference for Model 3, Class 2, only (0.361). While care must be taken in over-interpreting these
findings given the rather general presentation of the private sector as an alternative to government or
community management, there is evidence that the private sector has a role in providing handpump
maintenance services.
4.4 Consumer Profile and Poverty The poorest wealth quintile was three times more likely to vote for „no change‟ compared to the wealthiest
quintile. The trend is internally consistently and significant (Chi-square=32.6; df=3; p<0.001). A subjective
measure of household welfare by „average‟ or „not well-off‟ draws a similar conclusion with twice as many „not
well-off‟ households (16%) rejecting all choice alternatives compared to „average‟ households (6.3%). The
association is again significant (Chi-square=34.1; df=1; p<0.001). Care must be taken in over-interpreting these
results but the implication is that the poorest households will not necessarily be willing or able to grasp
opportunities for improved maintenance services independently.
Unsurprisingly, households with functioning handpumps are twice as likely to vote for „no change‟ in all choice
cards compared to a handpump broken for less than a year (14% vs. 6%); this proportion doubles if the
handpump has been broken for more than a year (3%). The association is significant (Chi-square=15.6; df=2;
p<0.001). Handpump functionality status is also related to welfare. Comparing the bottom quintile with the top
quintile of households there are significant differences by handpump functionality (Chi-square = 13.1; df=6;
p<0.05) by a) access to a functioning handpumps (80% vs. 90%), b) a handpump non-functioning in the last year
(9% vs. 6%) and, c) a handpump non-functioning for more than a year (12% vs. 5%). This suggests the poor do
not reject improved maintenance services based on an existing high level of maintenance provision.
4.5 Are people making informed choices? A non-trivial concern of exploring social preferences is confidence in the understanding and commitment of the
participants to any proposed changes. One way to judge this was using a subjective measure of respondent‟s
comprehension and answer accuracy taken by the enumerator directly following the interview. Households
with „fair‟ comprehension were five times more likely to vote for „no change‟ compared to households with

Water Programme, Working Paper 3 – August 2015 17
„good‟ comprehension (26% vs. 4.4%). Separately, enumerators who „strongly agreed‟ with household response
accuracy are found to be ten times less likely of systematically voting „no change‟ than those with whom they
„agreed‟ (20% vs. 1.9%).
Testing welfare measures against these three groups reveals that low-comprehension, low-accuracy „gamma‟
households are three times more likely to be in the bottom quintile than high-comprehension, high-accuracy
„alpha‟ households (60% vs. 18%). Conversely „alpha‟ households are three times more likely to be in the top
quintile compared to „gamma‟ households (63% vs. 21%). The association is significant (Chi-square=176.5; df=6;
p<0.001).
4.6 Summary This section reviews experimental data on consumer demand for an “insurance plus” maintenance service based
on survey data from 1,570 households using 410 handpumps. Findings provide provisional evidence that
households are willing to pay USD 0.58 to USD 1.16 per household per month for a maintenance repair service
that fixed handpumps within two days from handpump failure. Over four in five households appear interested
in the service based on active engagement in the choice experiment.
The poorest households disproportionately reject alternative maintenance models though do not enjoy higher
levels of services. The analysis also shows that comprehension of alternatives to the status quo and perhaps
willingness to consider them is lower in lower welfare households. This suggests that for any proposed
intervention to universally improve service levels will struggle to cater across the welfare spectrum and avoid
self-selection by the well-educated, well-off and well-motivated households. A system covering a large enough
number of handpumps, supported by subsidy, could include a pro-poor implementation, but this would have to
be carefully designed.
5. Conclusion This working paper has provided a preliminary examination of the potential for microinsurance to address rural
water sustainability challenges in Kwale, Kenya. There is strong evidence that financial risk undermines the
operation and maintenance of handpumps. Actuarial modelling suggests this risk would be significantly
reduced if funds could be pooled across multiple handpumps. Handpumps also possess attributes that are
considered favourable for a viable insurance product or business. However there are some clear stumbling
blocks that would need to be navigated if insurance concepts are to gain traction within the rural water sector.
Awareness of, and demand for, insurance remains low, especially among low-income households. Moral
hazard, adverse selections and fraud would require careful consideration. Identifying low cost distribution
channels would be critical to minimising transaction costs and keeping premiums affordable.
Regardless of whether or not handpump insurance could be a viable business model, the concept of pooling
funds and spreading risk could prove crucial to strengthening the community-based management model. As
well as reducing the vulnerability of individual communities, risk pooling and support at a supra-community
level could also provide an efficient and transparent vehicle for donors and governments to invest in the long
term sustainability of rural water supplies by providing matching funds to provide an incentive for
communities to contribute fees and ensure premiums are affordable. Field trials of these concepts are now
needed to shed light on whether they offer feasible and scalable solutions.

Water Programme, Working Paper 3 – August 2015 18
6 Acknowledgements
We gratefully acknowledge the time, support and guidance from Government of Kenya Ministry of Water and
Irrigation, Water Services Regulatory Board (WASREB), Kwale County Government, Msambweni Sub-Country
Water Office and the handpump users in Kwale. The conceptual basis and potential application of insurance
methodologies benefited significantly from the advice of Julian Roberts and Claire Wilkinson at Willis Insurance
(London).
The research links to a portfolio of research in Kwale with some of the data and work benefitting from the
support of Johanna Koehler, Jacob Katuva and Susanna Goodall at Oxford University and Mike Thomas of RFL
Ltd., Kenya. Finally we thank a team of 19 local enumerators in Kwale who led the household data collection.
This report is an output for the New Mobile Citizens for Waterpoint Sustainability and Development Frontiers
projects funded by UK DFID and ESRC (ES/J018120/1 and ES/K012150/1). This research has also been
supported by the Skoll Centre for Social Entrepreneurship at the Saïd Business School.
Usual caveats apply with the authors taking full responsibility for any errors.
Suggested citation
Foster, T., Hope, R., Thomson, P. (2015) Insuring against rural water risks. Evidence from Kwale, Kenya. Water
Programme, Working Paper 3, Smith School of Enterprise and the Environment, Oxford University, UK.
Photo credits
Tim Foster, Rob Hope, Johanna Koehler and Patrick Thomson.
7 Key References
Afrobarometer. (2013). "Afrobarometer online data analysis." Retrieved 1 May, 2013, from http://www.afrobarometer-online-analysis.com/aj/AJBrowserAB.jsp.
Akotey, O. J., Osei, K. A., & Gemegah, A. (2011). The demand for micro insurance in Ghana. Journal of Risk Finance, The, 12(3), 182-194.
Arlosoroff, S., G. Tschannerl, D. Grey, W. Journey, A. Karp, O. Langeneffer and R. Roche (1987). Community Water Supply: The Handpump Option. Washington D.C., World Bank.
Banerjee, S. G. and E. Morella (2011). Africa's Water and Sanitation Infrastructure: Access, Affordability, and Alternatives. Washington D.C.
Biener, C., & Eling, M. (2012). Insurability in microinsurance markets: An analysis of problems and potential solutions. The Geneva Papers on Risk and Insurance-Issues and Practice, 37(1), 77-107.
Briscoe, J. and D. de Ferranti (1988). Water for Rural Communities: Helping People Help Themselves. Washington D.C., World Bank.

Water Programme, Working Paper 3 – August 2015 19
Carter, R., E. Harvey and V. Casey (2010). User financing of rural handpump water services. IRC Symposium 2010: Pumps, Pipes and Promises. The Hague, IRC International Water and Sanitation Centre.
Carter, R. C. (2009). Operation and maintenance of rural water supplies. St Gallen, Rural Water Supply Network.
Churchill, C. (2007). Insuring the low-income market: Challenges and solutions for commercial insurers. The Geneva Papers on Risk and Insurance-Issues and Practice, 32(3), 401-412.
De Bock, O., & Gelade, W. (2012). The demand for microinsurance: A literature review. ILO Microinsurance Innovation Facility Research Paper, (26).
Dror, D. M., & Armstrong, J. (2006). Do Micro Health Insurance Units Need Capital or Reinsurance? A Simulated Exercise to Examine Different Alternatives*. The Geneva Papers on Risk and Insurance-Issues and Practice, 31(4), 739-761.
Fonseca, C., Smits, S., Nyarko, K., Naafs, A., & Franceys, R. (2013).Financing capital maintenance of rural water supply systems: current practices and future options (No. 9). WASHCost Working Paper.
Foster, T. (2013) „Predictors of Sustainability for Community-managed Handpumps in Sub-Saharan Africa: Evidence from Liberia, Sierra Leone and Uganda‟, Environmental Science & Technology. 47 (21) 12037-12046
Giné, Xavier, Robert Townsend, and James Vickery. "Patterns of rainfall insurance participation in rural India." The World Bank Economic Review22.3 (2008): 539-566.
Harvey, P. A. (2007). Cost determination and sustainable financing for rural water services in sub-Saharan Africa. Water policy 9(4): 373-391.
Hope, R., T. Foster and P. Thomson (2012). Reducing Risks to Rural Water Security in Africa. AMBIO: A Journal of the Human Environment 41: 773-776.
McCord, M. and M. Ingram (2013). The Landscape of Microinsurance in Africa 2012.
Oxford/RFL (2014) From Rights to Results in Rural Water Services – Evidence from Kyuso, Kenya. Smith School of Enterprise and the Environment, Water Programme, Working Paper 1. Oxford University, UK
Parry-Jones, S., R. A. Reed and B. H. Skinner (2001). Sustainable Handpump Projects in Africa: A literature review. Loughborough, WEDC, Loughborough University.
RWSN. (2009). Handpump Data, Selected Countries in Sub-Saharan Africa. Retrieved 1 May, 2013, from http://www.rwsn.ch/documentation/skatdocumentation.2009-03-09.7304634330/file.
Spaan, E., Mathijssen, J., Tromp, N., McBain, F., Have, A. T., & Baltussen, R. (2012). The impact of health insurance in Africa and Asia: a systematic review. Bulletin of the World Health Organization, 90(9), 685-692.
WASHCost, 2012. Providing a Basic Level of Water and Sanitation Services that Last: Cost Benchmarks. WASHCost Infosheet 1. The Hague: IRC International Water and Sanitation Centre
Whittington, D., J. Davis, L. Prokopy, K. Komives, R. Thorsten, H. Lukacs, A. Bakalian and W. Wakeman (2009). How well is the demand-driven, community management model for rural water supply systems doing? Evidence from Bolivia, Peru and Ghana. Water Policy 11(6): 696-718.