PBIS one step more… December 2014 Jeremy Geschwind Amy Ruona PPS.
Evidence from intrinsic activity that asymmetry of thehuman brain is controlled by multiple factorsHesheng Liua, Steven M. Stufflebeama,b, Jorge Sepulcrea,c,d, Trey Heddena,c, and Randy L. Bucknera,c,d,e,1
aAthinoula A. Martinos Center for Biomedical Imaging, Department of Radiology, Massachusetts General Hospital, Charlestown, MA 02129;bHarvard-Massachusetts Institute of Technology Division of Health Sciences and Technology, Cambridge, MA 02139; cHarvard University Department ofPsychology, Center for Brain Science, Cambridge, MA 02138; dHoward Hughes Medical Institute, Cambridge, MA 02138; and eDepartment of Psychiatry,Massachusetts General Hospital, Charlestown, MA 02129
Edited by Marcus E. Raichle, Washington University School of Medicine, St. Louis, MO, and approved October 12, 2009 (received for review July 18, 2009)
Cerebral lateralization is a fundamental property of the humanbrain and a marker of successful development. Here we provideevidence that multiple mechanisms control asymmetry for distinctbrain systems. Using intrinsic activity to measure asymmetry in 300adults, we mapped the most strongly lateralized brain regions.Both men and women showed strong asymmetries with a signif-icant, but small, group difference. Factor analysis on the asymmet-ric regions revealed 4 separate factors that each accounted forsignificant variation across subjects. The factors were associatedwith brain systems involved in vision, internal thought (the defaultnetwork), attention, and language. An independent sample ofright- and left-handed individuals showed that hand dominanceaffects brain asymmetry but differentially across the 4 factorssupporting their independence. These findings show the feasibilityof measuring brain asymmetry using intrinsic activity fluctuationsand suggest that multiple genetic or environmental mechanismscontrol cerebral lateralization.
fMRI � functional connectivity � laterality
A fundamental property of brain organization is the presenceof structural and functional asymmetries between the hemi-
spheres (1–4). Lateralization of function is thought to contributeto the evolution of human language and reasoning by providingan axis for specialization of cortical systems. Estimates based onsodium amobarbital injection (5), task-based functional MRI(fMRI) (6), and perfusion (7) suggest considerable variabilityamong people in the degree of brain asymmetry with languagepredominantly left-lateralized in most healthy right-handedadults; 2%–8% show reversed right-lateralized dominance (7).Left-handed individuals show a shift with a greater percentagedemonstrating a dominance reversal (5). At the population level,atypical lateralization is present in neuropsychiatric disorders,including autism (8, 9) and schizophrenia (10, 11), presumably asa reflection of aberrant development (12).
Suggesting that lateralization is partly controlled by geneticfactors, prominent structural asymmetries are present at birth (13,14) and show high heritability estimates in twin studies (15). Mostleading theories of lateralization emphasize a single factor thatcontrols brain lateralization, often with the additional assumptionthat the factor also gives rise to hand dominance. For example, theprominent ‘‘right-shift theory’’ of cerebral dominance by Annett(16) suggests the existence of a single gene with 2 alleles, one ofwhich influences the distribution of asymmetries. Though recog-nizing that multiple factors contribute to the development oflateralization, the influential Geschwind-Galaburda hypothesisproposed that brain asymmetries are dependent upon circulatingtestosterone levels in the intrauterine environment (3, 17). Debatepersists as to whether sex is a factor contributing to cerebrallateralization (18). Men with lateralized brain lesions are moreprone to language impairment than women (19), but later studieshave qualified this observation (20). Similarly, imaging studies haveobserved sex differences in language lateralization, but these effectshave not been uniformly observed (21, 22).
Here we show strong evidence that multiple factors associatewith asymmetry of distinct brain systems and provide a methodto measure the degree of lateralization of each of these factorsin individual subjects. We first developed an approach to quan-tify functional laterality based on intrinsic activity f luctuationsusing fMRI (23, 24). Factor analysis was then performed toexplore whether all lateralized brain systems arise from acommon factor or through multiple, distinct factors. Clearevidence was obtained that showed separate factors influencethe lateralization of distinct brain systems.
ResultsWe found that the brain’s intrinsic activity at rest is sufficient tomeasure functional asymmetry. Our analyses began by selecting 400equally spaced spherical seed regions (7 mm in radius, 200 in eachhemisphere) covering the entire cerebral cortex but excluding thewhite matter and cerebellum (Fig. S1). For each pair of seed regionswithin one hemisphere, the homologous regions in the oppositehemisphere were identified and used to derive a laterality indexbased on the relative functional correlation strengths among the 4regions (see Fig. 1A, Fig. S2, and Materials and Methods). We referto this measure as the intrinsic laterality index (iLI). iLI estimatesfor all 200 � 199 possible seed pairs were computed in anexploratory sample of 100 subjects (50 men, 50 women). Thoseregions revealing the highest level of asymmetry (iLI � 0.3 or iLI ��0.3) were combined into one metric for the most left-lateralizedregions (37 regions) and another for the most right-lateralizedregions (47 regions; see Fig. 1B and Materials and Methods). Themost left-lateralized regions included certain traditional languageregions as well as distributed regions along the cortical midline. Themost strongly right-lateralized regions were localized in the visualcortex, the occipital-parietal junction, the angular gyrus, and theinsula (Fig. 1B).
To explore the distribution of laterality across people in anunbiased manner, the regions identified in the initial sample of100 subjects were examined in an independent sample of 200subjects (Fig. 1 C and D). Dominance for both left- andright-lateralized regions was found to be on a continuum ratherthan a dichotomy (7). A significant correlation was also foundbetween the iLI and a language laterality index determined usinglanguage task performance (see SI Text, Fig. S3, and Fig. S4).
Sex was found to be associated with functional asymmetry,though the effect was small. Previous imaging studies have
Author contributions: H.L. and R.L.B. designed research; H.L. performed research; S.M.S.,J.S., and T.H. contributed new reagents/analytic tools; H.L. and R.L.B. analyzed data; andH.L. and R.L.B. wrote the paper.
The authors declare no conflict of interest.
This article is a PNAS Direct Submission.
Freely available online through the PNAS open access option.
1To whom correspondence should be addressed at: Harvard University, 52 Oxford Street,Room 280, Cambridge, MA 02138. E-mail: [email protected].
This article contains supporting information online at www.pnas.org/cgi/content/full/0908073106/DCSupplemental.
www.pnas.org�cgi�doi�10.1073�pnas.0908073106 PNAS � December 1, 2009 � vol. 106 � no. 48 � 20499–20503
NEU
ROSC
IEN
CE
Dow
nloa
ded
by g
uest
on
Apr
il 23
, 202
0

reported that language is more strongly lateralized in men thanwomen, though some other studies have not detected sex dif-ferences (21, 22). Here we asked if cerebral lateralization differsbetween right-handed men and women using intrinsic laterality.We calculated iLI for all 300 subjects as described above andcompared the distributions for the men (n � 131) and women(n � 169) (Fig. 2). Significant sex differences were found for bothleft-lateralized and right-lateralized systems, with stronger lat-erality in men than women [left, P � 0.01 (Fig. 2); right, P �0.05]. Though statistically reliable, the effects were small, withboth sexes showing strong functional asymmetry.
Intrinsic laterality provides a means to ask directly howcerebral lateralization is organized by examining variance acrosssubjects and asking whether the laterality of all systems tracktogether as a single factor or whether multiple factors emerge(3). We found evidence that multiple factors control functionallateralization. To perform this analysis, the 84 regions from Fig.1 were subjected to a factor analysis in the initial sample of 100subjects (see Materials and Methods). The number of extractedfactors was determined by principal component with the crite-rion that eigenvalues equal or exceed 1. The cortical topogra-phies of the 3 major factors that each explained �5% of thevariance and a 4th factor linked to frontal and temporal regionsassociated with language (which explained 4.3% of the variance)are illustrated in Fig. 3.
To determine whether these 4 factors were reliable, wereplicated the data-driven analysis in an independent sample of
100 subjects consisting of 50 men and 50 women. The factors thatemerged contained almost identical cortical topographies to thefirst sample. The factors were also found to yield stable within-subject estimates over multiple scanning sessions. A controlgroup (n � 22) was imaged on a second occasion within 3 months
Left Seed Right Seed
Left Target Right Target
LL
LR
RL
RR
A
�0.8 �0.4 0 0.4 0.8
2
4
6
8
10
12
Laterality Index
Cou
nt (
perc
ent)
CLEFTRIGHT
14
16
DLEFTRIGHT
0
2
4
6
8
10
12
14
16
0
Cou
nt (
perc
ent)
�0.8 �0.4 0 0.4 0.8Laterality Index
B
Fig. 1. Intrinsic activity identifies lateralized brain regions. (A) Functional laterality was computed using intrinsic (spontaneous) activity by examining relativecorrelation strengths between seed and target regions in the 2 hemispheres. LL is the strength of correlation between the left hemisphere target region andthe left hemisphere seed; LR represents the strength of correlation between the left seed and the right target; and RR and RL represent the contralateralhomologues. The intrinsic laterality index (iLI), defined in Eq. 1 (see Materials and Methods), represents the relative correlation strength difference between theleft and right hemispheres. (B) Using resting-state fMRI data from 100 right-handed subjects, the iLI of 39,800 pairwise correlations were computed and ranked.The 37 most left-lateralized regions (iLI � 0.3, top row) and 47 most right-lateralized regions (iLI � �0.3, bottom row) are projected onto a surface representationof the brain. (C) The laterality distribution for left-lateralized regions is displayed for an independent sample of 200 right-handed subjects and fit by a Gaussian.The iLI was defined as the mean laterality index of the 37 left-lateralized regions shown in (B). Positive iLI reflects left dominance. (D) The laterality distributionbased on the 47 right-lateralized regions is displayed.
12
8
4
0-0.2 0 0.2 0.4 0.6 0.8
Laterality Index
Cou
nt (
perc
ent)
MaleFemale
Fig. 2. Sex differences are present but small. Sex differences of the lateralityindex distribution for left-lateralized regions (blue regions in Fig. 1) areshown. The distribution for left-lateralized regions is displayed split by men(blue bars) and women (red bars). Overlap is shown in dark blue. The distri-butions are fit by Gaussian curves revealing that women show more symmetricfunctional organization than men (Kolmogorov-Smirnov test, P � 0.01). Asimilar effect is present for the right-lateralized regions.
20500 � www.pnas.org�cgi�doi�10.1073�pnas.0908073106 Liu et al.
Dow
nloa
ded
by g
uest
on
Apr
il 23
, 202
0
of the initial session. Between-session correlations (Pearson’s r)for the 4 factors were 0.79, 0.55, 0.58, and 0.59.
The distributed anatomy of each factor roughly corresponded toa well-studied brain system, although more detailed analysis of thefactors in relation to task-based studies will be required to verifycorrespondence. The first factor included regions within the visualsystem. The second largest factor was associated with a networklinked to internal thought often referred to as the ‘‘default network’’(25, 26). The third factor was a right-lateralized network includingthe angular gyrus and the insula that has previously been associatedwith an attentional system important for detecting unattendedevents (27). The last left-lateralized factor included frontal andtemporal regions associated with language—in particular, con-trolled semantic processing.
Expanding the analysis to include factors that capture smallerproportions of the variance showed that 69% and 71% of thevariance can be explained by 20 factors in the first and seconddatasets, respectively. The 4 factors illustrated in Fig. 3 capturesignificant, reproducible contributions to functional asymmetry,so we conservatively conclude that there are at least 4 majorfactors that determine cerebral lateralization in the human brain.
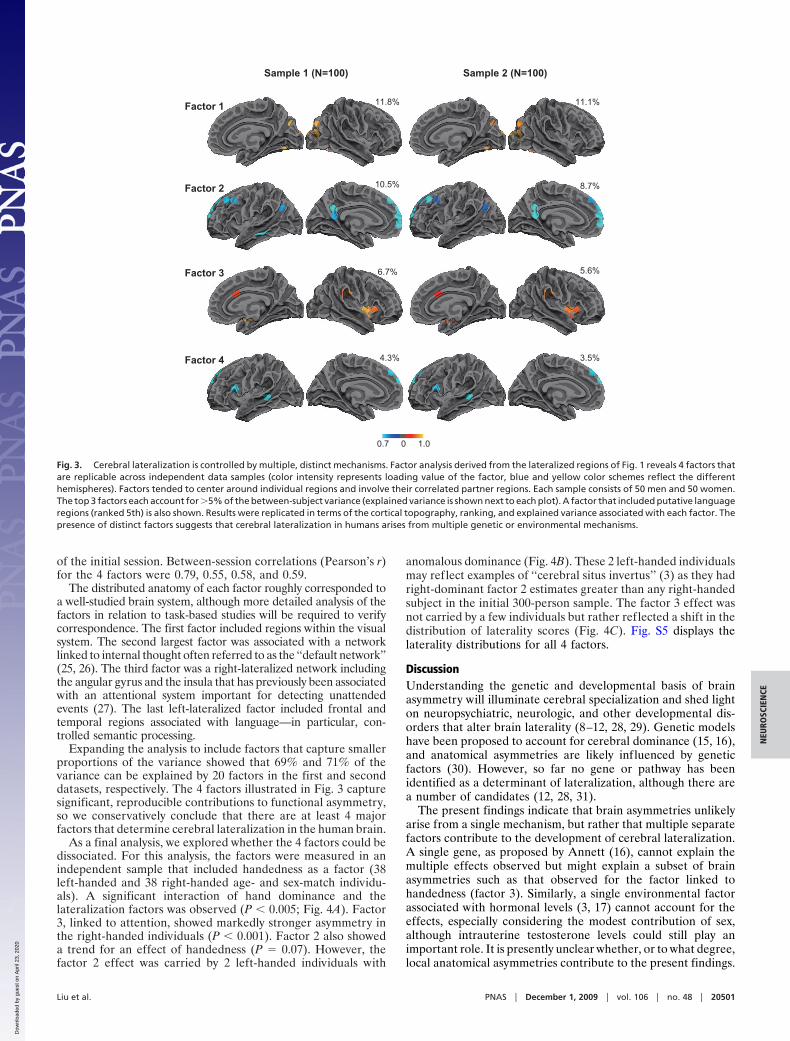
As a final analysis, we explored whether the 4 factors could bedissociated. For this analysis, the factors were measured in anindependent sample that included handedness as a factor (38left-handed and 38 right-handed age- and sex-match individu-als). A significant interaction of hand dominance and thelateralization factors was observed (P � 0.005; Fig. 4A). Factor3, linked to attention, showed markedly stronger asymmetry inthe right-handed individuals (P � 0.001). Factor 2 also showeda trend for an effect of handedness (P � 0.07). However, thefactor 2 effect was carried by 2 left-handed individuals with
anomalous dominance (Fig. 4B). These 2 left-handed individualsmay reflect examples of ‘‘cerebral situs invertus’’ (3) as they hadright-dominant factor 2 estimates greater than any right-handedsubject in the initial 300-person sample. The factor 3 effect wasnot carried by a few individuals but rather reflected a shift in thedistribution of laterality scores (Fig. 4C). Fig. S5 displays thelaterality distributions for all 4 factors.
DiscussionUnderstanding the genetic and developmental basis of brainasymmetry will illuminate cerebral specialization and shed lighton neuropsychiatric, neurologic, and other developmental dis-orders that alter brain laterality (8–12, 28, 29). Genetic modelshave been proposed to account for cerebral dominance (15, 16),and anatomical asymmetries are likely influenced by geneticfactors (30). However, so far no gene or pathway has beenidentified as a determinant of lateralization, although there area number of candidates (12, 28, 31).
The present findings indicate that brain asymmetries unlikelyarise from a single mechanism, but rather that multiple separatefactors contribute to the development of cerebral lateralization.A single gene, as proposed by Annett (16), cannot explain themultiple effects observed but might explain a subset of brainasymmetries such as that observed for the factor linked tohandedness (factor 3). Similarly, a single environmental factorassociated with hormonal levels (3, 17) cannot account for theeffects, especially considering the modest contribution of sex,although intrauterine testosterone levels could still play animportant role. It is presently unclear whether, or to what degree,local anatomical asymmetries contribute to the present findings.
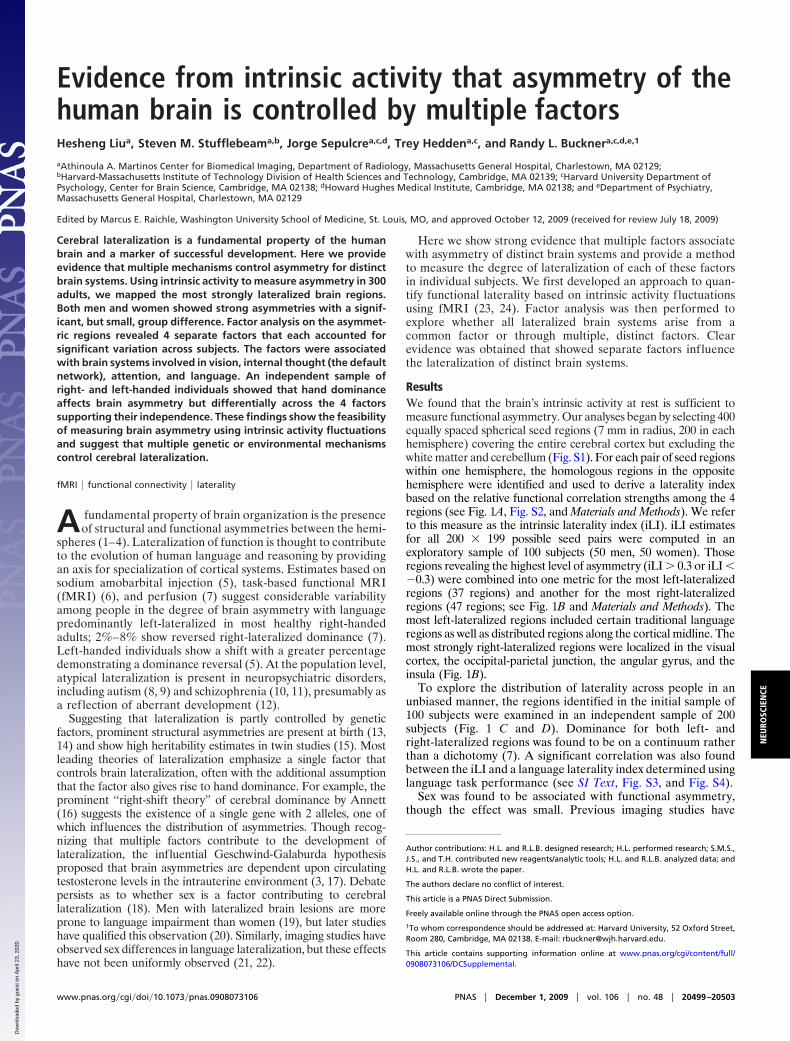
Factor 1
Factor 3
Factor 2
)001=N(2elpmaS)001=N(1elpmaS
11.8%
10.5%
6.7%
11.1%
8.7%
5.6%
0.7 0 1.0
%5.3%3.4Factor 4
Fig. 3. Cerebral lateralization is controlled by multiple, distinct mechanisms. Factor analysis derived from the lateralized regions of Fig. 1 reveals 4 factors thatare replicable across independent data samples (color intensity represents loading value of the factor, blue and yellow color schemes reflect the differenthemispheres). Factors tended to center around individual regions and involve their correlated partner regions. Each sample consists of 50 men and 50 women.The top 3 factors each account for �5% of the between-subject variance (explained variance is shown next to each plot). A factor that included putative languageregions (ranked 5th) is also shown. Results were replicated in terms of the cortical topography, ranking, and explained variance associated with each factor. Thepresence of distinct factors suggests that cerebral lateralization in humans arises from multiple genetic or environmental mechanisms.
Liu et al. PNAS � December 1, 2009 � vol. 106 � no. 48 � 20501
NEU
ROSC
IEN
CE
Dow
nloa
ded
by g
uest
on
Apr
il 23
, 202
0
Our findings suggest that models of brain asymmetry shouldseek to identify multiple, distinct factors that lead to individualdifferences in cortical lateralization perhaps through their in-f luence on early developmental events that promote corticalspecialization. Providing insight into mechanisms that may giverise to functional lateralization, molecular studies of transcrip-tion have revealed an array of asymmetric gene expressionpatterns in multiple forebrain structures during early humanfetal development (12, 28).
The present observations also show the feasibility and effi-ciency of estimating functional brain asymmetries using intrinsicactivity f luctuations. Rest-state laterality indices were computedwithin individual subjects from rapidly acquired MRI data (�10min). Within-subject estimates showed moderate test-retest re-liability. Thus, the present methods provide an approach toexplore determinants of lateralization in large human samples,such as required for genetic explorations, as well as in patientswhere determination of functional dominance is clinically rele-vant (e.g., neurosurgical planning).
Materials and MethodsParticipants. Three hundred healthy right-handed adults participated for pay-ment in the main MRI study (131 men, age 22.3 � 3.2) and 38 right- and 38left-handed adults participated in the second study that examined effects ofhandedness (17 men in each group, age 20.8 � 1.7). Handedness was assessed bythe Edinburgh handedness inventory (32). All participants performed between 1and 4 rest runs to estimate intrinsic functional lateralization. Thirty-five partici-pants additionally performed 3 runs of a language task. All participants werenative English speakers and had normal or corrected-to-normal vision. Partici-pants were screened to exclude individuals with a history of neurologic orpsychiatric conditions as well as those using psychoactive medications.
MRI Acquisition Procedures. Scanning was performed on 3 Tesla TimTriosystems (Siemens) using the 12-channel phased-array head coil supplied by thevendor. Structural images were acquired using a sagittal MP-RAGE three-dimensional T1-weighted sequence (TR � 2,530 ms, TE � 3.44 ms, FA � 7o, 1.0mm isotropic voxels; FOV 256 � 256).
For the main group of 300 subjects, the fixation (rest) runs were 390 s (156time points) or 370 s (148 time points) in duration, and a black visual crosshair(plus sign) was centered on a white screen during the entire run. Subjects wereinstructed to stay awake and look at the crosshair; no other task instructionwas provided. Subjects were also instructed to minimize head movement.Images were acquired using the gradient-echo echo-planar pulse sequence(TR � 2,500 ms, TE � 30 ms, flip angle � 90o, 3-mm isotropic voxels). For the76 subjects that contributed to the analysis of the effect of handedness, 2 restruns were acquired (each 372 s, 120 TP, TR � 3,000 ms). For these runs, subjectsrested with their eyes open.
Thirty-five subjects within the main subject cohort also performed 3 runs ofa language task involving semantic classification of words previously used todetermine language dominance (6, 33). Images were acquired using an echoplanar imaging (EPI) gradient-echo sequence sensitive to blood oxygenationlevel-dependent (BOLD) contrast (TR � 2,000 ms, TE � 30 ms, FA � 90o, slicenumber � 33, 3-mm isotropic voxels). Each run consisted of three 36-s block ofthe task, four 28-s blocks of fixation. During the task blocks, 12 words (6concrete and 6 abstract words in random order) were presented for 2 s eachwith a 1-s interstimulus interval. In total, 108 stimuli were presented. Thevisual stimuli were generated on an Apple PowerBook G4 computer (Apple,Inc. ) using Matlab (Mathworks, Inc.) and the Psychophysics Toolbox exten-sions (34). Stimuli were projected onto a screen positioned at the head of themagnet bore. Participants were asked to indicate if the word was concrete orabstract. They were instructed to respond quickly and accurately, and indicatetheir response by key press (left-hand key press for abstract words, right-handkey press for concrete words).
MRI Preprocessing. Both the resting-state data and the task data were pre-processed using the following steps: (1) slice timing correction (SPM2, Well-come Department of Cognitive Neurology, London), (2) rigid body correctionfor head motion, (3) normalization for global mean signal intensity acrossruns, and (4) transformation of the data into a standard atlas space. Thesecond step provided a record of head position that was later used as anuisance regressor for correlation analysis. Atlas registration was achieved bycomputing affine transforms connecting the first image volume of the firstfunctional run with the T2*-weighted functional image target (RIB, Univ ofOxford, Oxford, U.K.). The atlas representative template conformed to theMontreal Neurological Institute (MNI) atlas (MNI152). Motion correction andatlas transformation were combined into a single step to yield a motion-corrected time series resampled to 2 mm isotropic voxels.
The resting-state data were analyzed using region-based correlation analysis,often referred to as functional connectivity MRI (fcMRI) analysis. The presentmethods extend from Biswal et al. (23) and are described in detail in Vincent et al.(35) and Buckner et al. (36). Task data were analyzed using the general linearmodel as implemented in SPM2 (Wellcome Department of Cognitive Neurology,London). Regressors of no interest included motion correction parameters andlow-frequency drift. The task blocks used a gamma function convolved with aboxcar function to model the hemodynamic response function.
The Quantitative Intrinsic Laterality Index (iLI). The present exploration re-quired the development of a quantitative measure of a region’s intrinsiclaterality. Functional mapping studies based on intrinsic activity have ob-served lateralization within the attention system in normal subjects (37) andthe memory system in patients (38). Building from these earlier observations,we developed a generic approach to explore lateralization across all regionsof cortex simultaneously. To compute an intrinsic laterality index (iLI), therelative strengths of correlations between seed and target region pairs were
-0.6 -0.4 -0.2 0 0.2 0.4
20
15
10
5
0
-0.3 -0.1 0.1 0.3 0.5
20
15
10
5
0
25 Factor 2
Factor 3
Cou
nt (
perc
ent)
Cou
nt (
perc
ent)
Factor 1 Factor 2 Factor 3 Factor 4
Mea
n La
tera
lity
Inde
x
-0.4
-0.3
-0.2
-0.1
0
0.1
0.2
0.3 Left-handedRight-handed
***
Laterality Index
Laterality Index
A
B
C
Fig. 4. Handedness differentially affects asymmetry across distinct brainsystems. Mean laterality estimates for each of the 4 factors in Fig. 3 are plottedfor independent data samples of right-handed (n � 38) and left-handed (n �38) individuals. (A) A significant interaction between hand dominance andfactor is observed (P � 0.005) with an effect of handedness observed for factor3 (***, P � 0.001). Bars represent standard error of the mean. (B) The lateralityindex distribution for factor 2 is plotted split by handedness. Though thedistributions overlap, there are 2 left-handed individuals with complete re-versal of asymmetry. (C) The distributions for factor 3 show a marked effect ofhandedness with right-handed individuals demonstrating greater asymmetry.
20502 � www.pnas.org�cgi�doi�10.1073�pnas.0908073106 Liu et al.
Dow
nloa
ded
by g
uest
on
Apr
il 23
, 202
0

measured between the hemispheres (see Fig. 1). Two hundred sphericalregions were defined in each hemisphere, covering the gray matter of thecerebral cortex (Fig. S1). All possible estimates were computed (e.g., 200 � 199pairwise combinations). From these, the regions with the strongest lateral-ization were identified (iLI � 0.3 or � �0.3).
For illustration purposes, an example of asymmetric correlations is shownin Fig. S2. Functional correlation maps are displayed for a seed region in theleft hemisphere and its homologous region in the right hemisphere (see top2 rows in Fig. S2; circles in the frontal region indicate the seed regions). Themap associated with the right hemisphere seed is subtracted from the mapassociated with the left hemisphere seed to derive a difference map (third rowin Fig. S2). In this example, the left temporal region (marked by the circles inthe third row), among other regions, is more strongly correlated with the leftfrontal seed region than the mirroring correlations in the right hemisphere.This asymmetry is easily appreciated in the difference map; the laterality indexin Eq. 1 below quantifies this asymmetry.
Specifically, for each seed region, the iLI was defined based on the relativecorrelation differences between the seed and target regions across the 2 hemi-spheres. Fig.1A illustrates thecorrelationvaluesused in this calculation,whereLLis the strength of the correlation between the left hemisphere seed and the lefthemispheretargetregions;LRrepresents thestrengthofthecorrelationbetweenthe left hemisphere seed and right hemisphere target regions; and RR and RLrepresent the contralateral homologues. From these 4 seed-target correlations,iLI is then calculated according to the following equation:
Laterality Index �(LL � RL) � (RR � LR)�LL� � �LR� � �RR� � �RL� [1]
Note that LL–RL corresponds to the left target region on the difference map(see the temporal region in Fig. S2 as an example), and RR–LR corresponds tothe right target region on the difference map. When the denominator fellbelow 0.2, iLI was set to zero. iLI was computed for all 200 seed regions in eachhemisphere against the 199 possible target regions, yielding 39,800 pairwisecorrelations for each subject.
For each one of these pairwise correlations, we averaged the correspond-ing iLI values across the exploratory dataset of 100 individuals. The resulting39,800 mean iLIs were then sorted to determine those regions showing thestrongest levels of lateralization. The most left-lateralized correlations (iLI �0.3, 37 regions) and most right-lateralized correlations (iLI � �0.3, 47 regions)were combined together into a single iLI metric (Fig. 1B). The threshold issomewhat arbitrary but was selected to reduce the number of regions to anumber appropriate to factor analysis. A level of 0.3 ensured no �100 regionswould be selected for further factor analysis. Alternative threshold values donot change the results for these strongly lateralized regions but may lead todifferences for weakly lateralized regions. The iLIs values for the left- andright-lateralized regions were then calculated on an independent sample of200 subjects to derive an unbiased estimate of the distribution of lateraliza-tion (Fig. 2). Note also that the data sample used to derive regions for analysisincluded an equal number of men and women, allowing unbiased analysis ofsex differences.
Factor Analysis. Principal axis factoring was used for the factor analysis (39). TheiLIs of the 84 regions were used as the observed variables. The number ofextracted factors was determined by principal component with the criterion thateigenvalues equal or exceed 1. The resulting factor loading values were rotatedusing normalized varimax rotation. Factor analysis was performed on the firstsample of 100 subjects and repeated on an independent sample of 100 subjects.The factor loading values for the top 3 factors are shown in Fig. S6. The results on2 independent data samples show similar clusters of regions corresponding toeach factor, indicating that these factors are highly reproducible across datasamples. Local anatomic asymmetries may contribute to the factors.
ACKNOWLEDGMENTS. We thank Abraham Snyder, Jessica Andrews-Hanna,Itamar Kahn, Ting Ren, and Tanveer Talukdar for assistance with functionalconnectivity; Marisa Hollinshead and Betsy Hemphill for data collection; TimothyO’Keefe and Gabriele Fariello for neuroinformatics; and the Harvard Center forBrain Science and the Athinoula A. Martinos Center for Biomedical Imaging forimagingsupport.ThisworkwassupportedbyNational InstitutesofHealthGrantsR01AG021910, R01AG034556, P41RR14074, and K08MH067966; the SimonsFoundation; and the Howard Hughes Medical Institute.
1. Geschwind N, Levitsky W (1968) Human brain: Left-right asymmetries in temporalspeech region. Science 161(3837):186–187.
2. Milner B (1971) Interhemispheric differences in the localization of psychologicalprocesses in man. Br Med Bull 27(3):272–277.
3. Geschwind N, Galaburda AM (1985) Cerebral lateralization. Biological mechanisms,associations, and pathology: I. A hypothesis and a program for research. Arch Neurol42(7):428–459.
4. Toga AW, Thompson PM (2003) Mapping brain asymmetry. Nat Rev Neurosci 4(1):37–48.5. Rasmussen T, Milner B (1977) The role of early left-brain injury in determining later-
alization of cerebral speech functions. Ann N Y Acad Sci 299:355–369.6. Desmond JE, et al. (1995) Functional MRI measurement of language lateralization in
Wada-tested patients. Brain 118:1411–1419.7. Knecht S, et al. (2000) Language lateralization in healthy right-handers. Brain 123:74–
81.8. Herbert MR, et al. (2002) Abnormal asymmetry in language association cortex in
autism. Ann Neurol 52(5):588–596.9. Kleinhans NM, Muller RA, Cohen DN, Courchesne E (2008) Atypical functional lateral-
ization of language in autism spectrum disorders. Brain Res 1221:115–125.10. Crow TJ, et al. (1989) Schizophrenia as an anomaly of development of cerebral
asymmetry: A postmortem study and a proposal concerning the genetic basis of thedisease. Arch Gen Psychiatry 46(12):1145–1150.
11. Sommer IEC, Ramsey NF, Kahn RS (2001) Language lateralization in schizophrenia, anfMRI study. Schizophr Res 52:57–67.
12. Sun T, et al. (2005) Early asymmetry of gene transcription in embryonic human left andright cerebral cortex. Science 308(5729):1794–1798.
13. Witelson SF, Pallie W (1973) Left hemisphere specialization for language in thenewborn: Neuroanatomical evidence of asymmetry. Brain 96(3):641–646.
14. Gilmore JH, et al. (2004) 3 Tesla magnetic resonance imaging of the brain in newborns.Psychiatry Res 132(1):81–85.
15. Geschwind DH, Miller BL, DeCarli C, Carmelli D (2002) Heritability of lobar brainvolumes in twins supports genetic models of cerebral laterality and handedness. ProcNatl Acad Sci USA 99(5):3176–3181.
16. Annett M (1964) A model of the inheritance of handedness and cerebral dominance.Nature 204:59–60.
17. Geschwind N, Galaburda AM (1985) Cerebral lateralization. Biological mechanisms,associations, and pathology: III. A hypothesis and a program for research. Arch Neurol42(7):634–654.
18. Kimura D (2000) Sex and Cognition (MIT Press, Cambridge, MA).19. McGlone J (1980) Sex differences in human brain asymmetry: A critical survey. Behav
Brain Sci 3:215–227.20. Damasio H, Tranel D, Spradling J, Alliger R (1989) Aphasia in men and women. From
Reading to Neurons, Galaburda AM, ed (MIT Press, Cambridge, MA), pp 307–325.
21. Shaywitz BA, et al. (1995) Sex differences in the functional organization of the brainfor language. Nature 373(6515):607–609.
22. Sommer IEC, Aleman A, Bouma A, Kahn RS (2004) Do women really have more bilaterallanguage representation than men? A meta-analysis of functional imaging studies.Brain 127(8):1845–1852.
23. Biswal B, Yetkin FZ, Haughton VM, Hyde JS (1995) Functional connectivity in themotor cortex of resting human brain using echo-planar MRI. Magn Reson Med34(4):537–541.
24. Fox MD, Raichle ME (2007) Spontaneous fluctuations in brain activity observed withfunctional magnetic resonance imaging. Nat Rev Neurosci 8(9):700–711.
25. Gusnard DA, Raichle ME (2001) Searching for a baseline: Functional imaging and theresting human brain. Nat Rev Neurosci 2(10):685–694.
26. Buckner RL, Andrews-Hanna JR, Schacter DL (2008) The brain’s default network:Anatomy, function, and relevance to disease. Ann N Y Acad Sci 1124:1–38.
27. Corbetta M, Shulman GL (2002) Control of goal-directed and stimulus-driven attentionin the brain. Nat Rev Neurosci 3(3):201–215.
28. Sun T, Walsh CA (2006) Molecular approaches to brain asymmetry and handedness. NatRev Neurosci 7(8):655–662.
29. Escalante-Mead PR, Minshew NJ, Sweeney JA (2003) Abnormal brain lateralization inhigh-functioning autism. J Autism Dev Disord 33(5):539–543.
30. Thompson PM, et al. (2001) Genetic influences on brain structure. Nat Neurosci4(12):1253–1258.
31. Lai CSL, Fisher SE, Hurst JA, Vargha-Khadem F, Monaco AP (2001) A forkhead-domaingene is mutated in a severe speech and language disorder. Nature 413(6855):519–523.
32. Oldfield RC (1971) The assessment and analysis of handedness: The Edinburgh inven-tory. Neuropsychologia 9(1):97–113.
33. Demb JB, et al. (1995) Semantic encoding and retrieval in the left inferior prefrontalcortex: A functional MRI study of task difficulty and process specificity. J Neurosci15(9):5870–5878.
34. Brainard DH (1997) The Psychophysics Toolbox. Spat Vis 10(4):433–436.35. Vincent JL, et al. (2006) Coherent spontaneous activity identifies a hippocampal-
parietal memory network. J Neurophysiol 96(6):3517–3531.36. Buckner RL, et al. (2009) Cortical hubs revealed by intrinsic functional connectivity:
Mapping, assessment of stability, and relation to Alzheimer’s disease. J Neurosci29(6):1860–1873.
37. Fox MD, Corbetta M, Snyder AZ, Vincent JL, Raichle ME (2006) Spontaneous neuronalactivity distinguishes human dorsal and ventral attention systems. Proc Natl Acad SciUSA 103(26):10046–10051.
38. Wang Z, Mechanic-Hamilton D, Pluta J, Glynn S, Detre JA (2009) Function lateralizationvia measuring coherence laterality. Neuroimage 47(1):281–288.
39. Harman HH (1976) Modern Factor Analysis (Univ of Chicago Press, Chicago).
Liu et al. PNAS � December 1, 2009 � vol. 106 � no. 48 � 20503
NEU
ROSC
IEN
CE
Dow
nloa
ded
by g
uest
on
Apr
il 23
, 202
0