Evidence for Evolution. Fossil Record Evidence: Horse evolution four toes on ground (#2-5), short...
47
Evidence for Evolution
-
Upload
edwin-hodge -
Category
Documents
-
view
220 -
download
0
Transcript of Evidence for Evolution. Fossil Record Evidence: Horse evolution four toes on ground (#2-5), short...

Evidence for Evolution

Fossil Record Evidence:
Horse evolution
four toes on ground (#2-5), short teeth good for eating soft leaves on shrubs & trees
one toe on ground (#3), long teeth good for eating tough blades of grass


Whale Evolution

Fossil Record of Whale Evolution
Pelvis andhind limb
Rhodocetus (predominantly aquatic)
Pakicetus (terrestrial)
Dorudon (fully aquatic)
Balaena (recent whale ancestor)
Pelvis andhind limb


A lesson in Biogeography

The Wallace Line
http://evolution.berkeley.edu/evolibrary/article/history_16
http://theglyptodon.wordpress.com/2011/05/25/the-wallace-line/
Read this interesting article by Jared Diamond (author of Guns, Germs, and Steel) about “Mr. Wallace’s Line”:http://discovermagazine.com/1997/aug/mrwallacesline1198

Wegener’s contributions to Biogeography
Alfred Wegener found that the distributions of fossils of several organisms supported his theory that the continents were once joined together.
http://evolution.berkeley.edu/evolibrary/article/history_16
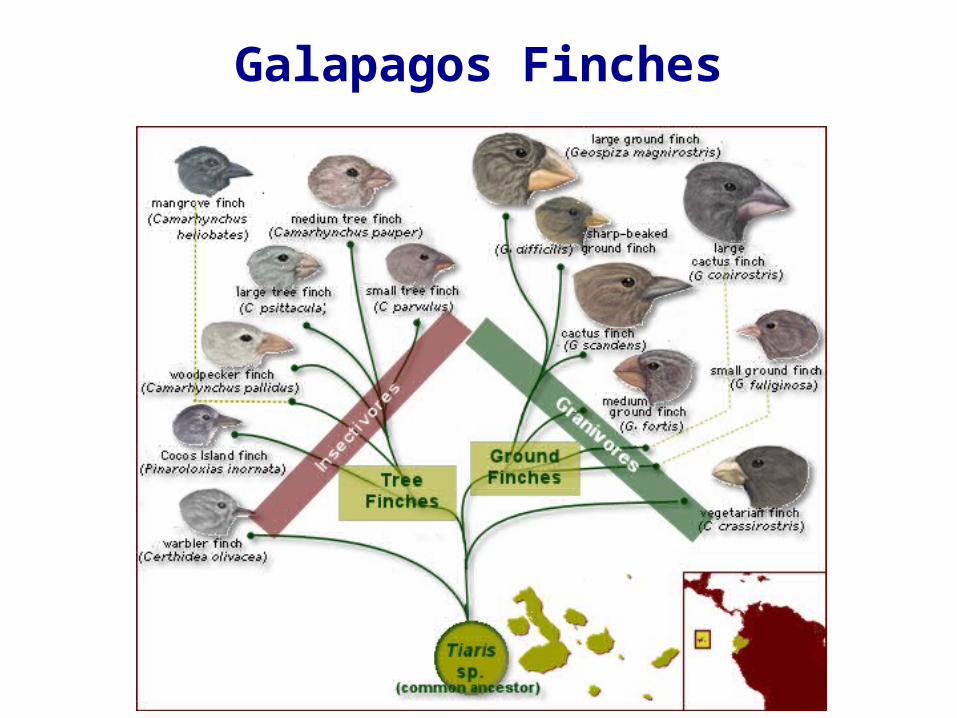
Galapagos Finches
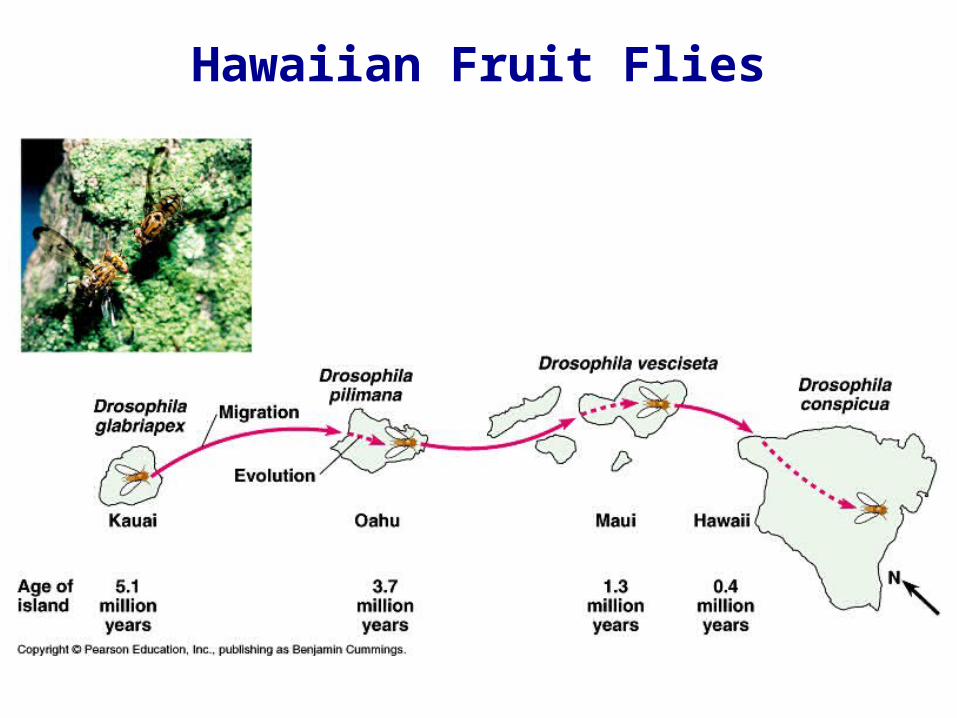
Hawaiian Fruit Flies

Humerus
Radius
Ulna
Carpals
MetacarpalsPhalanges
Human Cat Whale Bat
Comparative Anatomy Evidence:Homologous Structures

Comparative Anatomy Evidence:Vestigial Structures
Boa pelvic region
Human Coccyx (tailbone)

Comparative Embryology Evidence

Pharyngealpouches
Post-analtail
Chick embryo Human embryo
Comparative Embryology Evidence
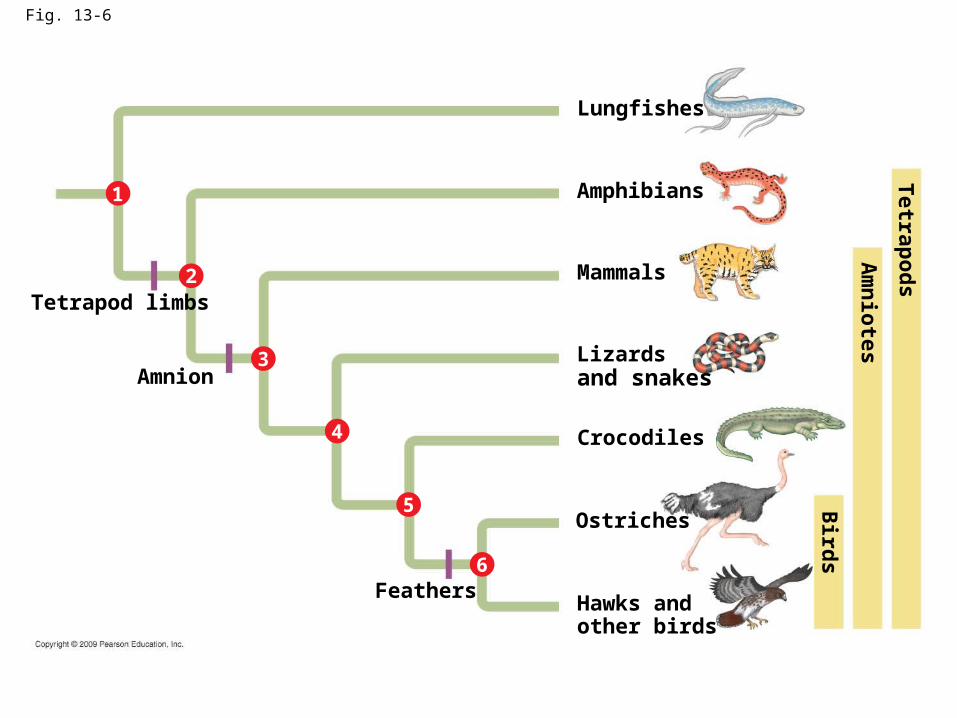
Fig. 13-6
Tetrapod limbs
Amnion
Lungfishes
Feathers
Amphibians
Mammals
Lizardsand snakes
2
Hawks andother birds
Ostriches
Crocodiles
1
3
4
5
6
Am
nio
tes
Tetrapo
ds
Bird
s

Biochemical Evidence: amino acid
sequence of hemoglobin

Biochemical Evidence: amino acid sequence of cytochrome c


Biochemical Evidence: DNA sequence

Microevolution: a change in a population’s
alleles over timeHow do we detect this change? Need to look at a population’s collection of alleles, or its gene pool.
Darwin’s Finches video:
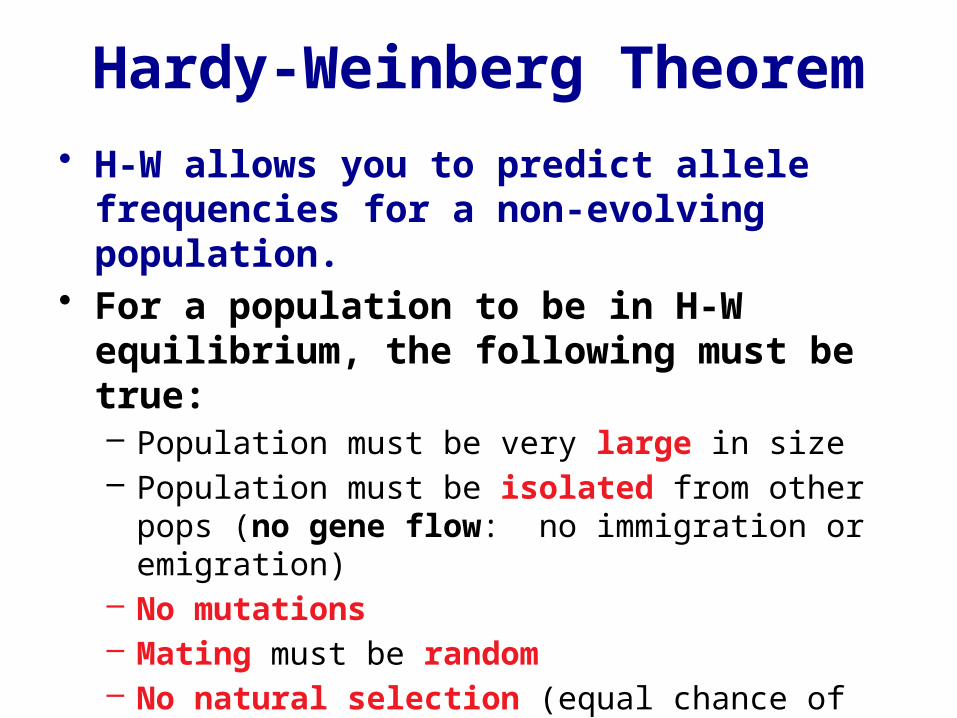
Hardy-Weinberg Theorem
• H-W allows you to predict allele frequencies for a non-evolving population.
• For a population to be in H-W equilibrium, the following must be true:– Population must be very large in size– Population must be isolated from other pops (no
gene flow: no immigration or emigration)– No mutations– Mating must be random– No natural selection (equal chance of survival &
reproductive success)

Any changes to expected allele frequencies over time may indicate that micro-evolution is occurring in the population.
Allele frequencies
Genotype frequencies
Dominanthomozygotes
Heterozygotes Recessivehomozygotes
p + q = 1
p2 + 2pq + q2 = 1
Hardy-Weinberg Theorem
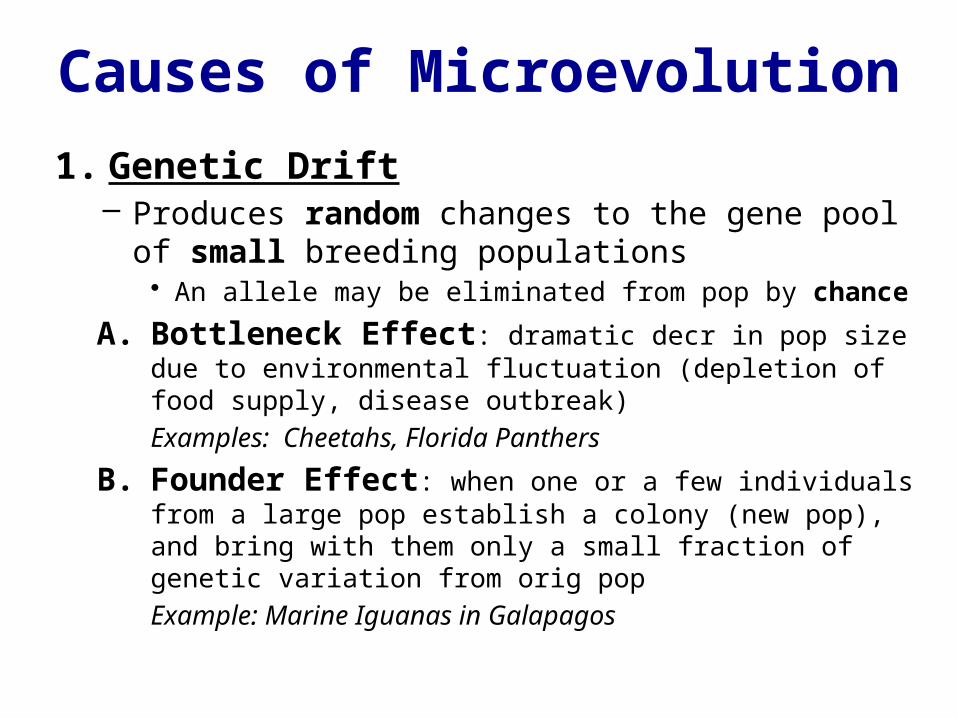
Causes of Microevolution
1. Genetic Drift– Produces random changes to the gene pool of small
breeding populations• An allele may be eliminated from pop by chance
A. Bottleneck Effect: dramatic decr in pop size due to environmental fluctuation (depletion of food supply, disease outbreak)
Examples: Cheetahs, Florida Panthers
B. Founder Effect: when one or a few individuals from a large pop establish a colony (new pop), and bring with them only a small fraction of genetic variation from orig pop
Example: Marine Iguanas in Galapagos

Fig. 13-11a-3
Originalpopulation
Bottleneckingevent
Survivingpopulation

“By 1990s, the endangered Florida panther – a flagship species and one of the last remaining symbols of wilderness in Florida - was in serious trouble. There were fewer than 30 panthers remaining in the wild. The population suffered from several biomedical and morphological abnormalities, including low genetic diversity, heart defects, reproductive dysfunctions and kinked tails. Many of these problems were thought to be indicative of inbreeding, and conservation biologists recommended genetic restoration. This recommendation was controversial but was ultimately implemented after careful planning…”
http://research.ifas.ufl.edu/featured-discoveries/genetic-restoration-saves-endangered-florida-panther#

Causes of Microevolution2. Gene Flow
– movement of alleles by migration of individuals to a new population• Generally increases variation within a population
3. Mutation– Unpredictable change in DNA, a source of new alleles
• Introduces variation in pop• Only inheritable if occurs in gametes• Can be harmful, beneficial, or neutral
4. Natural Selection– Leads to adaptive evol change, as “fittest” indiv survive
to reproduce
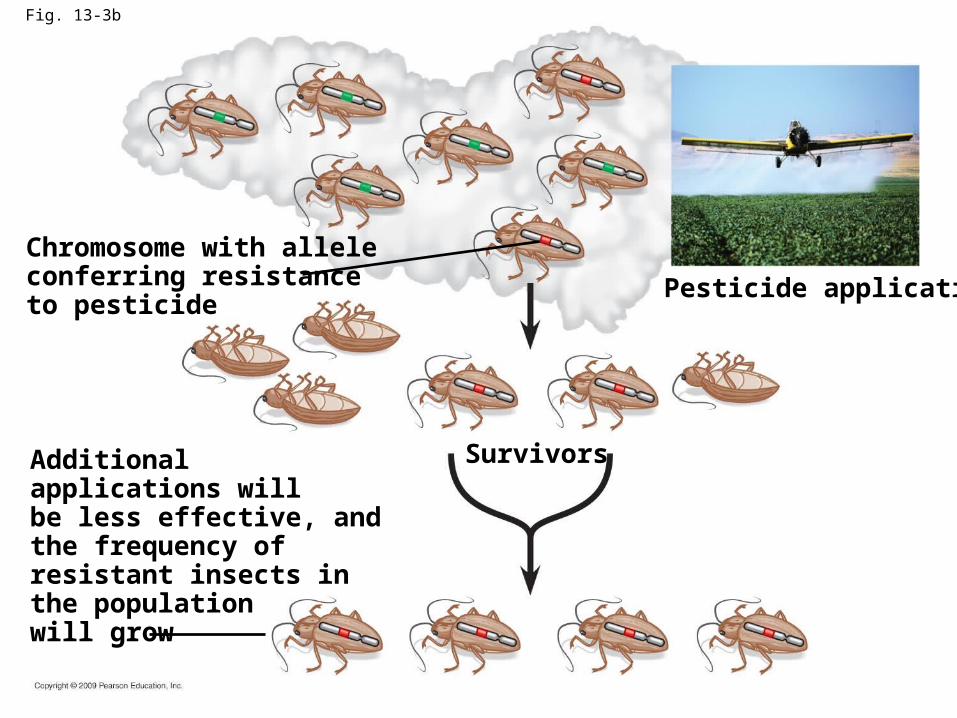
Fig. 13-3b
Chromosome with alleleconferring resistanceto pesticide
Additionalapplications willbe less effective, andthe frequency ofresistant insects inthe populationwill grow
Survivors
Pesticide application
Causes of Microevolution
5. Non-random MatingA. Inbreeding: Individuals mate more freq with closely
related individuals• Common in plants in the form of self-fertilization• Not always harmful but sometimes leads to inbreeding
depression (lower fitness: sterility, higher juvenile mortality)
Examples: Cheetahs, Florida Panthers
B. Sexual selection (mate selection): individuals select mates by their phenotype
• Can change genotype frequencies
Examples: Peacocks, Mallards, Humans, etc.
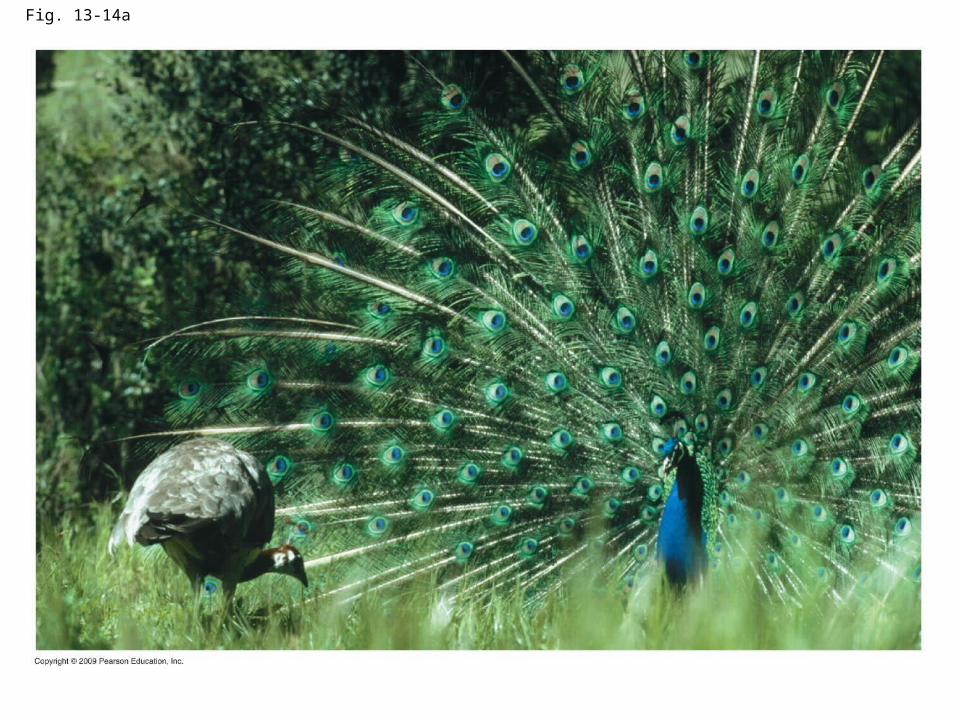
Fig. 13-14a

Fig. 13-UN4
Microevolution
(a)
may result fromchange in allelefrequencies in a
population
is the
(g)
(c)(b)
(d)
(e) (f)
individualsor gametes
best adaptedto environment
adaptiveevolution
random fluctuationsmore likely in a
due tomovement of
may be result of
leads todue to
of individuals
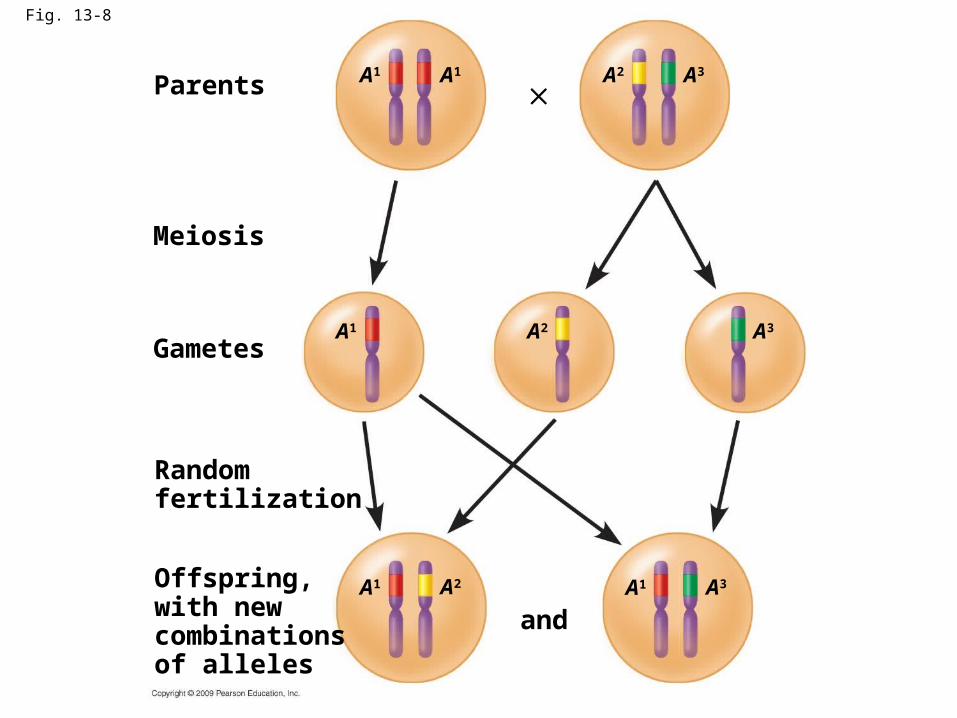
Fig. 13-8
Parents
Offspring,with newcombinationsof alleles
Gametes
Meiosis
´
and
A1
Randomfertilization
A1 A2 A3
A1 A2 A3
A3A1A2A1
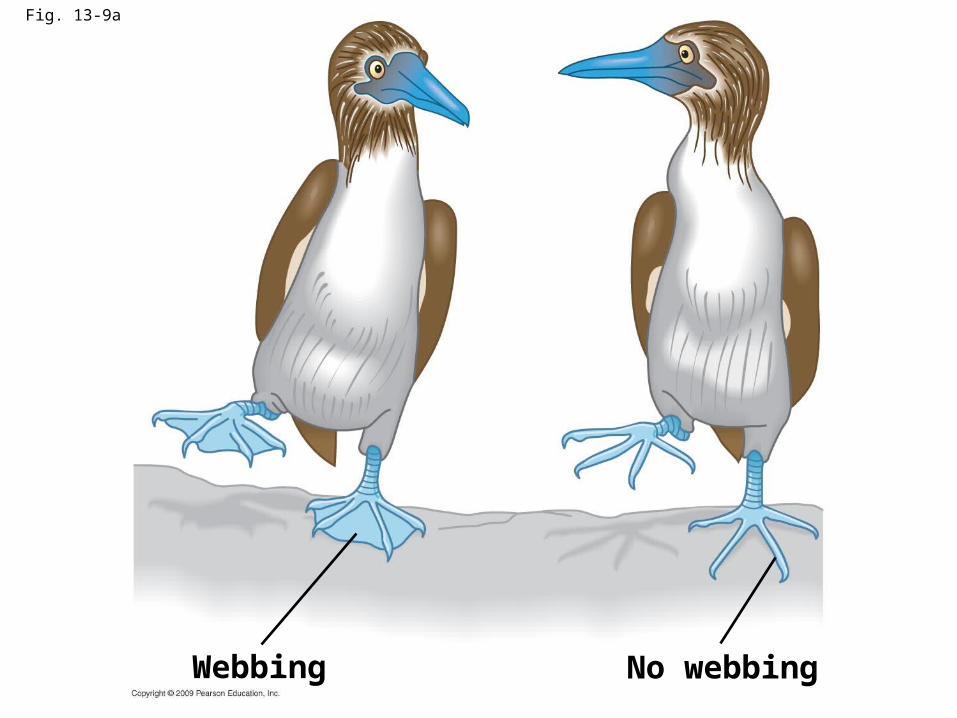
Fig. 13-9a
Webbing No webbing

Fig. 13-9b
Phenotypes
320–––500
Genotypes
Number of animals(total = 500)
Genotype frequencies
Number of allelesin gene pool(total = 1,000)
Allele frequencies
WW Ww ww
320 160 20
= 0.64 160–––500 = 0.32 20–––
500 = 0.04
40 w160 W + 160 w640 W
8001,000 = 0.8 W 200
1,000 = 0.2 w

Fig. 13-9c
Gametes reflectallele frequenciesof parental gene pool
W eggp = 0.8
Sperm
w eggq = 0.2
W spermp = 0.8
Eggs
Allele frequencies
Genotype frequencies
Next generation:
w spermq = 0.8
WWp2 = 0.64
wwq2 = 0.04
wWqp = 0.16
Wwpq = 0.16
0.64 WW 0.32 Ww 0.04 ww
0.8 W 0.2 w

Fig. 13-11a-1
Originalpopulation
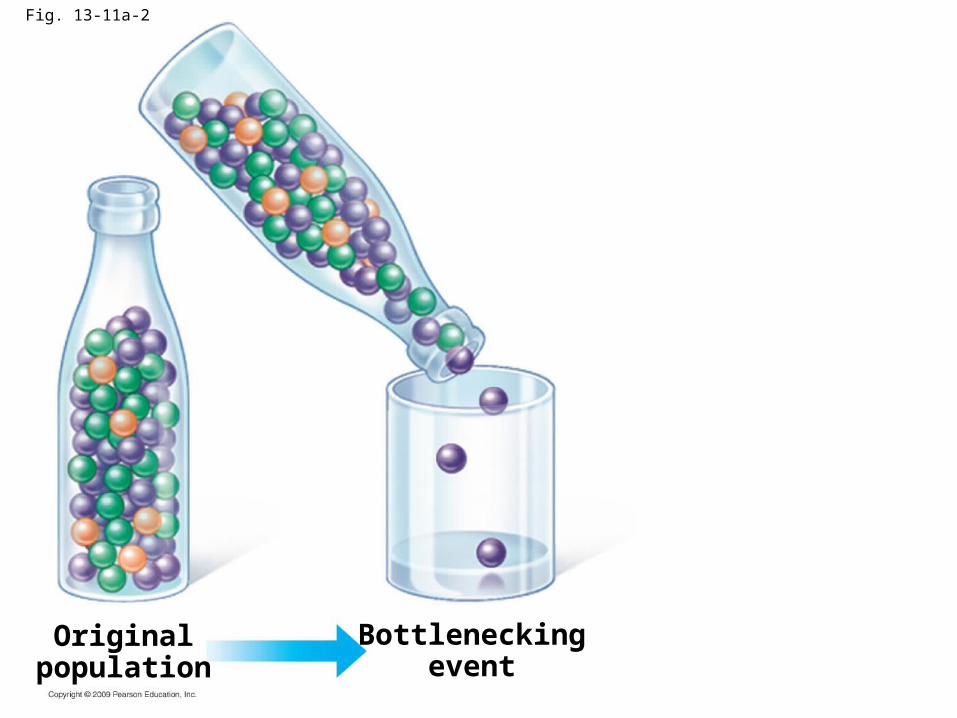
Fig. 13-11a-2
Originalpopulation
Bottleneckingevent

Fig. 13-11b

Fig. 13-14b

Fig. 13-14c

Fig. 13-16
“Right-mouthed”
“Left-mouthed”
1.0
0.5
01981’82 ’83 ’84 ’85 ’86 ’87 ’88 ’89 ’90
Sample year
Fre
qu
ency
of
“lef
t-m
ou
thed
” in
div
idu
als

Fig. 13-UN1
Observations
Heritable variationsin individuals
Overproductionof offspring
Over time, favorable traitsaccumulate in the population
Individuals well-suited to theenvironment tend to leavemore offspring
Inferences

Fig. 13-13
Originalpopulation
Fre
qu
ency
of
ind
ivid
ual
sOriginalpopulation
Evolvedpopulation
Phenotypes (fur color)
Stabilizing selection Directional selection Disruptive selection

Fig. 13-UN3
Originalpopulation
Pressure ofnatural selection
Evolvedpopulation
Stabilizing selection Directional selection Disruptive selection

Fig. 13-UN5