Evidence Based Protocol: Improving Nutrition Monitoring in ...
72
Grand Valley State University ScholarWorks@GVSU Master's Projects Kirkhof College of Nursing 12-12-2017 Evidence Based Protocol: Improving Nutrition Monitoring in Hospitalized Adults Philip W. Jackson Grand Valley State University, [email protected] Follow this and additional works at: hps://scholarworks.gvsu.edu/kcon_projects Part of the Nursing Commons is Project is brought to you for free and open access by the Kirkhof College of Nursing at ScholarWorks@GVSU. It has been accepted for inclusion in Master's Projects by an authorized administrator of ScholarWorks@GVSU. For more information, please contact [email protected]. Recommended Citation Jackson, Philip W., "Evidence Based Protocol: Improving Nutrition Monitoring in Hospitalized Adults" (2017). Master's Projects. 14. hps://scholarworks.gvsu.edu/kcon_projects/14
Transcript of Evidence Based Protocol: Improving Nutrition Monitoring in ...

Grand Valley State UniversityScholarWorks@GVSU
Master's Projects Kirkhof College of Nursing
12-12-2017
Evidence Based Protocol: Improving NutritionMonitoring in Hospitalized AdultsPhilip W. JacksonGrand Valley State University, [email protected]
Follow this and additional works at: https://scholarworks.gvsu.edu/kcon_projects
Part of the Nursing Commons
This Project is brought to you for free and open access by the Kirkhof College of Nursing at ScholarWorks@GVSU. It has been accepted for inclusion inMaster's Projects by an authorized administrator of ScholarWorks@GVSU. For more information, please contact [email protected].
Recommended CitationJackson, Philip W., "Evidence Based Protocol: Improving Nutrition Monitoring in Hospitalized Adults" (2017). Master's Projects. 14.https://scholarworks.gvsu.edu/kcon_projects/14

Running head: IMPROVING NUTRITION MONITORING 1
Evidence Based Protocol: Improving Nutrition Monitoring in Hospitalized Adults
Philip W. Jackson
Kirkhof College of Nursing
Grand Valley State University
Advisor: Rebecca Davis
Project Team Member: Sylvia Simons
Date of Submission: December 12, 2017

Running head: IMPROVING NUTRITION MONITORING 2
Table of Contents
CHAPTER 1: INTRODUCTION AND BACKGROUND ........................................................................ 5
Gap in Target Microsystem ........................................................................................................................ 5
Description of Protocol ............................................................................................................................... 7
The Clinical Microsystem ........................................................................................................................... 8
Need for Change ......................................................................................................................................... 8
Rationale ..................................................................................................................................................... 9
Key Stakeholders ........................................................................................................................................ 9
Feasibility ................................................................................................................................................. 10
Anticipated Barriers .................................................................................................................................. 11
Nature of the Project ................................................................................................................................. 11
CHAPTER 2: LITERATURE REVIEW ................................................................................................. 12
Method ...................................................................................................................................................... 12
Impact of Malnutrition .............................................................................................................................. 13
Monitoring Patients’ Intake ...................................................................................................................... 14
Weighted food method ................................................................................................................... 15
Food intake charts and plate diagrams ........................................................................................... 16
Direct visualization ........................................................................................................................ 16
Summary of Evidence............................................................................................................................... 18
Literature Critique .................................................................................................................................... 19
CHAPTER 3: CONCEPTUAL MODELS ............................................................................................... 20
Historical Perspective of Conceptual Models ........................................................................................... 21
Define ....................................................................................................................................................... 22
Measure .................................................................................................................................................... 23
Analyze ..................................................................................................................................................... 24
Improve ..................................................................................................................................................... 25
Control ...................................................................................................................................................... 26
Conclusion ................................................................................................................................................ 27
CHAPTER 4: CLINICAL PROTOCOL .................................................................................................. 29
Purpose of the Project with Objectives ..................................................................................................... 29
Define ............................................................................................................................................. 30
Measure .......................................................................................................................................... 30
Analyze .......................................................................................................................................... 30
Improve .......................................................................................................................................... 30
Control............................................................................................................................................ 30
Needed Resources ..................................................................................................................................... 31
Cost Benefit Analysis ............................................................................................................................... 32
Measurement: Sources of Data and Tools ................................................................................................ 34
CHAPTER 5: PROJECT EVALUATION ............................................................................................... 37
Project Overview, Strengths, and Weaknesses ......................................................................................... 37
Define ............................................................................................................................................. 37
Measure .......................................................................................................................................... 38
Analyze .......................................................................................................................................... 39
Improve .......................................................................................................................................... 40
Control............................................................................................................................................ 42
Project Outcomes ...................................................................................................................................... 44

Running head: IMPROVING NUTRITION MONITORING 3
Implications for Practice ........................................................................................................................... 45
Project Limitations ................................................................................................................................... 46
Enactment of MSN Essentials .................................................................................................................. 47
Conclusion ................................................................................................................................................ 49
REFERENCES ........................................................................................................................................... 50
APPENDICES ............................................................................................................................................. 57
Appendix A: Diagram of DMAIC Framework ......................................................................................... 57
Appendix B: Line Chart of Meal Documentation Rate ............................................................................ 58
Appendix C: Pre-intervention Meal Tray Delivery Process Flowchart .................................................... 59
Appendix D: Root Cause Analysis ........................................................................................................... 60
Appendix E: Post-intervention Meal Tray Delivery Process Flowchart ................................................... 61
Appendix F: Standard Process Document ................................................................................................ 62
Appendix G: Gantt Chart of the Project Timeline .................................................................................... 69

IMPROVING NUTRITION MONITORING
4
Abstract
Malnutrition affects a large number of adult inpatients. For these patients, the
implications of the high rate of malnutrition include impaired wound healing, higher rates of
infection, and an increased risk of death. These complications contribute to increased healthcare
costs and longer lengths of stay. The level of monitoring and documentation of patients’ meal
consumption was acknowledged to be below expectations in an acuity-adaptable neurosciences
unit situated in a downtown hospital located in the Midwestern United States. The define-
measure-analyze-improve-control (DMAIC) quality improvement framework guided the quality
improvement team to develop a standard process for meal related activities. The rate of meal
intake documentation improved after adoption of the standard process.
Keywords: monitoring nutritional intake, meal tray delivery, DMAIC, electronic health
record, documentation standards, malnutrition

IMPROVING NUTRITION MONITORING
5
Chapter 1: Introduction to the Clinical Microsystem
Nutrition status is frequently compromised in the acute inpatient adult population.
Patients who are admitted with existing nutrition issues can experience significant decline during
their hospital stay (Sura, Madhavan, Carnaby, & Crary, 2012). Additionally, patients who
initially present with adequate protein-energy nutrition may regress to a malnourished state
during an acute hospitalization (Corrigan, Escuro, Celestin, & Kirby, 2011; Deuz et al., 2016).
Chronic illness and malnutrition frequently coincide (Corrigan et al., 2011). Malnutrition
intensifies the morbidity and mortality of hospitalized adults, leading to reduced functional
capacity and an increased hospital cost and length of stay (Wirth et al., 2013). In hospitalized
patients, 30% – 70% are malnourished and up to half do not have their malnutrition detected by
their health care providers (Somanchi, Tau, & Mullin, 2011). Older adults above the age of 65
are the most vulnerable to malnutrition (Deuz et al., 2016). Known risk factors for malnutrition
include having surgery, unintentional weight loss, wounds or pressure ulcers, and infection
(Somanchi et al., 2011). Despite the documented deleterious effects of malnutrition on patients’
well-being, malnutrition remains a significant problem in hospitalized adults.
Gap in Target Microsystem
For the purposes of this project the Master of Science in Nursing (MSN) student is based
on a clinical microsystem. Nelson, Batalden, Godfrey & Lazar (2011) define a microsystem as a
“group of people who work together in a defined setting on a regular basis to create care for
discrete subpopulations of patients” (p. 3-4). The MSN student identified that the process used
by the microsystem to monitor nutritional intake is problematic. Upon admission patients are
screened for malnutrition by registered nurses (RNs) using the malnutrition screening tool

IMPROVING NUTRITION MONITORING
6
(MST). The MST is a valid and evidence-based tool to screen for malnutrition (Tappenden, et
al., 2013). Affirmative responses to certain questions or a score of 2 or higher on the MST will
trigger an automatic referral to the registered dietitian (RD), who then performs a formal
nutrition assessment and develops a nutrition plan of care. Patients who “pass” the MST are not
referred to the RD. However, institutional policies require RDs to evaluate patients who “pass”
the MST 7 to 10-days after admission for their nutritional needs. Patients can be referred to the
nutrition department sooner than 7 to 10-days if health care providers suspect the patient is not
meeting his or her nutritional needs. On the targeted microsystem, the referral typically occurs
during multi-disciplinary rounds, where the RN notifies the RD of a nutrition concern. However,
given the state of poor meal intake documentation and the relatively low priority of nutrition, the
RN may lack the evidence that a patient has had several consecutive days of inadequate meal
intake. Therefore, a nutrition referral may not occur due to deficient monitoring and
documentation.
The meal tray delivery process is another exemplar of how breakdowns in nutrition care
processes lead to gaps in practice. Many aspects of the nutrition department’s processes,
including the coordination of meal tray delivery, are aided by specialized software, called
CBORD. The meal tray delivery process uses a room service model. During mealtimes patients
call operators in the nutrition department to place their meal orders, which are entered into the
CBORD application. A printed meal ticket listing all the food items is included on the meal tray.
The software notifies nutrition technicians, “tray runners”, once meal trays are assembled and
ready for delivery. Tray runners (TRs) pick meal trays up in the kitchen and deliver them to
patient’s rooms. The software tracks the location of each meal tray and alerts tray runners to

IMPROVING NUTRITION MONITORING
7
collect the tray 60-minutes after it was delivered. During mealtimes RNs and patient care
assistants (PCAs) may be occupied with many other tasks. For example, nurses are admitting or
discharging patients, performing focused neurological assessments, preparing patients for tests
and procedures, and communicating with other providers. PCAs are assisting patients who need
help with feedings, getting vital signs and point of care blood sugar checks, toileting patients,
helping patients reposition, and performing hygiene tasks. Clinicians state that these activities are
time sensitive and take priority over assessing meal intake. Moreover, the limited window of
time after a patient is done eating and before the tray is cleared by the tray runner makes
documenting meal intake very difficult. The unit is not adequately following the hospital’s
policies on documentation. Due to numerous complicating factors, the rate of meal intake
documentation falls short of the requirement, which states that monitoring of all patients’
nutritional intake is required. The gap between the current state and the desired state diminishes
the ability for clinicians to track a patient’s progress ward meeting the goals of their nutritional
care.
Description of Protocol
A protocol will be described that is designed to improve monitoring and documentation
of meal intake by ameliorating the problems that exist in the current process. The protocol must
satisfy the following criteria: uses a reliable method for assessing patients’ meal intake, does not
require significant investment of resources (i.e., time, money, training) to implement, and does
not add significant burden to the workload of bedside clinicians. Desired outcomes of the
protocol will be to have increased documentation of patient meal intake.

IMPROVING NUTRITION MONITORING
8
The Clinical Microsystem
The microsystem of interest is a 34-bed acuity-adaptable neurosciences unit situated
within a downtown hospital. The hospital, located in the Midwestern United States, has 344
inpatient beds and is part of a much larger hospital organization. The microsystem is designed
for the care of patients with neurological disorders. The most common reasons for admission
include cerebrovascular accident (CVA), transient ischemic attack (TIA), seizure, subdural
hematoma, spinal stenosis (requiring surgery), brain tumor, neuralgia, and alcohol withdrawal.
The unit often admits general medical/surgical patients as well.
To care for the patients the microsystem employs 46 Registered Nurses (RNs) and 37
patient care assistants (PCAs). The unit leadership consists of one clinical nurse leader (CNL),
one nurse manager, one clinical nurse specialist (CNS), one nurse educator, a night shift nurse
supervisor, and one director. There are four neuro-hospitalists, seven neurologists, three neuro-
psychologists are available for consult, and a variable number of internal medicine and family
medicine residents. Other clinicians, who are vital to the functioning of this unit, serve
designated geographic areas in the hospital and they are often spread between several
microsystems. The neurosciences unit has one full time equivalent (FTE) social worker, two RN
case managers, three transitions coordinators, one stroke program coordinator, one FTE
pharmacist, one FTE dietician, and a 0.5 FTE Chaplin.
Need for Change
Monitoring patients’ nutritional status and documenting his or her intake is a basic
nursing function (Blair & Smith, 2012; Kalisch, 2006). It is an expectation of the organization
that RNs and PCAs will document intake and output for all patients including the proportion of

IMPROVING NUTRITION MONITORING
9
meals consumed. The process for assessing and documenting on meal intake is part of the
orientation and onboarding process of new employees. However, the current state is that
documentation of meal intake occurs on approximately half of all meals.
Rationale
The population being served by the target microsystem experiences increased prevalence
and severity of malnutrition (Corrigan et al., 2011; Deuz et al., 2016). Moreover, patients often
need therapy services after discharge from the microsystem. According to Wirth et al. (2013)
malnourished stroke patients are discharged to a higher acuity setting and/or have less functional
capacity than stroke patients who are not malnourished. Prevalence of swallowing difficulties
and the need for a modified consistency diet also predispose stroke patients for malnutrition
(Wirth et al., 2013). On the target microsystem, due to neurological and functional impairment,
many patients have a limited ability to self-feed, lack motivation to eat meals, and have difficulty
communicating food choice preferences. The CNL has identified that this is a major problem in
the unit, causing a delay in referrals to the RD and a delay in meeting patients’ nutritional needs.
Therefore, a valid screening tool is not enough; there also needs to be an evidence-based protocol
in place to closely monitor patients’ meal intake to mitigate the likelihood of patients becoming
malnourished while hospitalized.
Key Stakeholders
The major stakeholders of the project include the patient care assistants, registered
nurses, registered dietitians, tray runners, patients, and providers. RNs and PCAs do most of the
documentation of patients’ consumption of nutritional supplements and meal intake. RNs and
PCAs are also responsible for a considerable amount of patient education and they provide

IMPROVING NUTRITION MONITORING
10
support to patients with regards to maintaining adequate nutritional intake. The RDs contribute
by providing the initial patient education and closely monitoring patients who have been
identified as malnourished or at-risk for malnutrition. Registered dietitians play an important role
because they diagnose and treat malnourished patients. However, their impact on the nutritional
wellbeing of the patients admitted to the target microsystem may be limited if there is a high rate
of undiagnosed malnutrition. Their role on the microsystem is also to support a culture which
places a high value on maintaining and improving patients’ nutritional status. Part of the problem
stems from the view that nutrition is not a priority. RDs encourage a positive nutrition culture by
prompting nurses to discuss any nutritional concerns they may have during multi-disciplinary
rounds. The tray runners are another major stakeholder in reforming nutrition related processes
because they will have a different perspective on how hospital processes affect patients’ ability
to access nutrition. Patients are the primary drivers for the quality improvement process. A
significant driver of the healthcare system is to improve the quality of care while reducing the
cost incurred to maintain the system (White et al., 2012). The patient perspective is crucial to
create a system that meets their needs. Improving patient outcomes will be impossible without
mutual cooperation from all stakeholders.
Feasibility
The proposed intervention is a realistic request to make of bedside clinicians. The current
rate of nutrition documentation and statements made by unit staff suggest that extensive tutorials
about how to use the electronic health record (EHR) or where to document intake is unnecessary.
However, education about the importance of nutrition monitoring is likely needed. The
intervention does not require any capital investment or a change to the EHR.

IMPROVING NUTRITION MONITORING
11
Anticipated Barriers
The provision and documentation of nutrition care is not regarded as an essential unit
process. I anticipate struggling against a unit culture that does not highly prioritize nutrition. The
heavy workload and competing priorities will continue to be challenging. Moreover, if the
intervention is excessively burdensome and gains in patient wellbeing cannot be shown, then the
staff will no longer be engaged in more rigorous monitoring of meal intake. Furthermore,
changes to the meal tray delivery process highly depend upon the willingness of the tray runners
to be flexible and participate as team members.
Nature of the Project
The goal of the intervention is to improve the percentage of time that patients’ meal
consumption is documented in the electronic health record (EHR) from the current rate of 54%
to a target of 80%. To improve the meal documentation rate, the MSN student will lead a quality
improvement team to modify the workflow with respect to the meal tray delivery and removal
process. The intention behind changing the meal tray process is to reduce the hurdle that prevents
unit personnel from assessing and documenting meal intake. Consequently, producing a more
thorough electronic health record will result in greater monitoring of patients’ nutritional status.
Involvement from microsystem staff is crucial to the success of the project. Opportunities exist
for collaboration during the measurement, analysis, improvement, and control phases of the
project.

IMPROVING NUTRITION MONITORING
12
Chapter 2: Literature Review
The goal of this project is to increase the rate of meal intake documentation thereby
improving the capacity for nurses to monitor patients’ nutritional status while they are in the
hospital. To implement an evidenced based project, a literature review was undertaken to
determine how to best monitor food intake. Hospitalized adults frequently have an altered
nutritional status (Bounoure et al., 2016). Patients who are malnourished at the time they are
admitted can suffer from substantial decline during their inpatient stay (Sura et al., 2012).
Additionally, patients who initially present to the hospital with adequate protein-energy nutrition
may regress to a malnourished state (Corrigan et al., 2011; Deuz et al., 2016). Chronic illness
and malnutrition frequently coincide (Corrigan et al., 2011). Malnutrition intensifies the
morbidity and mortality of hospitalized patients, causing a reduced functional capacity and
increasing the cost and length of stay (Wirth et al., 2013). Up to half of malnourished patients are
undetected by clinicians (Somanchi et al., 2011). With regards to poor nutrition status, older
adults above the age of 65 are among the most vulnerable populations (Deuz et al., 2016). The
purpose of this literature review is to highlight the impact of malnutrition on patient outcomes
and determine evidence-based interventions to help nurses monitor and identify patients at risk
of and suffering from malnutrition. The research question used to guide the literature search is;
“What is the most appropriate method to assess meal consumption to detect early signs of
malnutrition in hospitalized adult patients with neurological disorders.”
Method
The literature review was conducted via electronically searching CINAHL, the Cochrane
Library, Michigan eLibrary’s Nursing Resource Center, AHRQ’s National Guideline

IMPROVING NUTRITION MONITORING
13
Clearinghouse, PubMed, ProQuest, and Sage Complete with the following search terms:
nutrition, malnutrition, calorie count, inpatient, hospitalized, acute care, adult patients, altered
nutrition, nutritional status, meal delivery process, nutrition protocol, meal preparation, nurse’s
role, neurological, stroke, CVA, TIA, encephalopathy, TBI, seizure, epilepsy, spinal surgery,
neurosurgery, lumbar laminectomy, craniotomy, nutritional supplement, nutrition support,
mealtime environment, dietary intake, mealtime assistance, models of care, energy intake, food
intake, meal consumption, food service, visual estimate, plate waste, validity, food intake chart.
Preference was given to articles published within the past decade (i.e., 2007 – 2017). However,
earlier articles were included if they appeared to be especially pertinent to the clinical problem or
the population of the microsystem. The results of the literature search yielded many studies that
were written about patients with disease related malnutrition, such as, gastrointestinal surgery,
care of the elderly, oncology, orthopedic trauma, cardiothoracic, renal, long-term care, the
community dwelling elderly, and obstetric patients. The majority of these articles were related to
specific dietary recommendations rather than the ongoing assessment of nutritional status; thus,
they did not pertain to the current project. The paucity of relevant research about altered nutrition
in patients with neurological disorders necessitated expanding the search to the general adult
inpatient population.
Impact of Malnutrition
The prevalence of malnutrition in hospitalized adults is between 11% and 70% (Baldwin,
Kimber, Gibbs, & Weekes, 2016; Bounoure et al., 2016; Hafsteinsdóttir et al., 2010; Kruizenga
et al. 2003). According to Dupertius et al. (2003), 69% of hospitalized patients failed to consume
the necessary amount of energy and nutrients even when provided with ample food. Moreover,
IMPROVING NUTRITION MONITORING
14
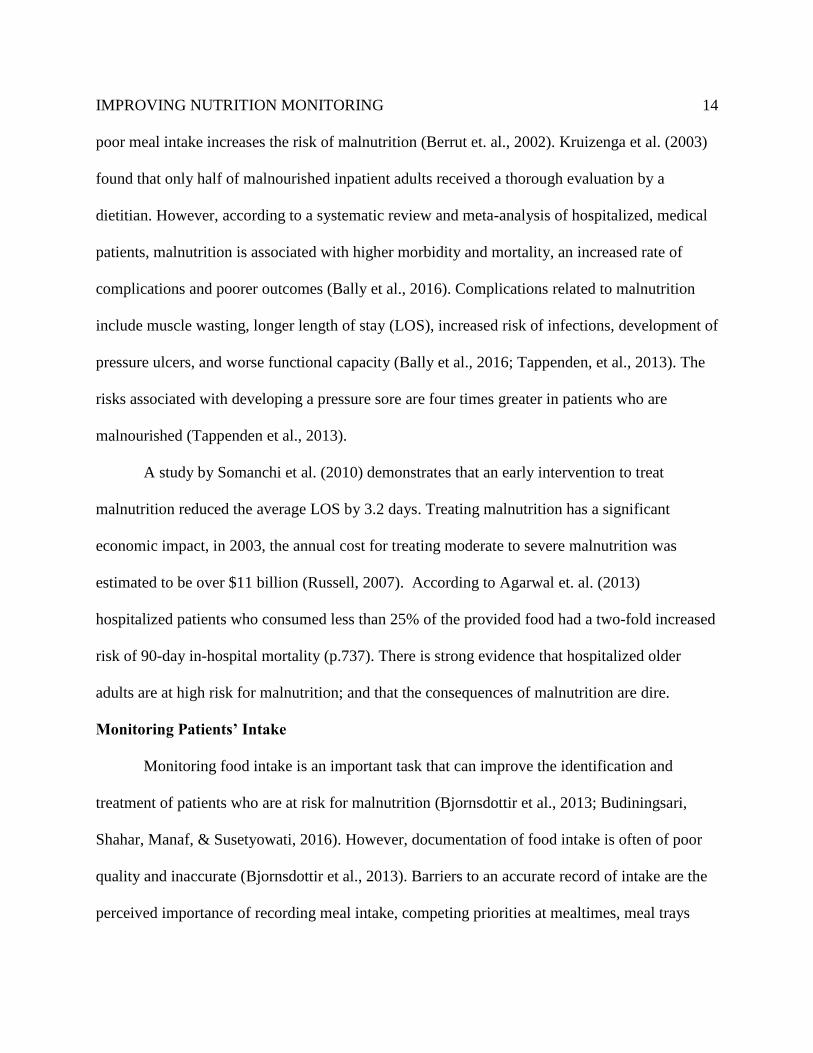
poor meal intake increases the risk of malnutrition (Berrut et. al., 2002). Kruizenga et al. (2003)
found that only half of malnourished inpatient adults received a thorough evaluation by a
dietitian. However, according to a systematic review and meta-analysis of hospitalized, medical
patients, malnutrition is associated with higher morbidity and mortality, an increased rate of
complications and poorer outcomes (Bally et al., 2016). Complications related to malnutrition
include muscle wasting, longer length of stay (LOS), increased risk of infections, development of
pressure ulcers, and worse functional capacity (Bally et al., 2016; Tappenden, et al., 2013). The
risks associated with developing a pressure sore are four times greater in patients who are
malnourished (Tappenden et al., 2013).
A study by Somanchi et al. (2010) demonstrates that an early intervention to treat
malnutrition reduced the average LOS by 3.2 days. Treating malnutrition has a significant
economic impact, in 2003, the annual cost for treating moderate to severe malnutrition was
estimated to be over $11 billion (Russell, 2007). According to Agarwal et. al. (2013)
hospitalized patients who consumed less than 25% of the provided food had a two-fold increased
risk of 90-day in-hospital mortality (p.737). There is strong evidence that hospitalized older
adults are at high risk for malnutrition; and that the consequences of malnutrition are dire.
Monitoring Patients’ Intake
Monitoring food intake is an important task that can improve the identification and
treatment of patients who are at risk for malnutrition (Bjornsdottir et al., 2013; Budiningsari,
Shahar, Manaf, & Susetyowati, 2016). However, documentation of food intake is often of poor
quality and inaccurate (Bjornsdottir et al., 2013). Barriers to an accurate record of intake are the
perceived importance of recording meal intake, competing priorities at mealtimes, meal trays

IMPROVING NUTRITION MONITORING
15
being removed prior to documentation of intake, and the accuracy of the measurement method
(Bjornsdottir et al., 2013; Tappenden, et al., 2013). Monitoring nutrition intake is an essential
nursing task; however, nutrition related tasks are often overlooked partially due to the lack of
established institutional processes for the provision of nutrition care (Perry, Hamilton, Williams,
& Jones, 2013; Wang et al., 2016). Therefore, any intervention to promote the monitoring and
documenting of nutrition intake must be easily adopted into institutional processes, provide
accurate measurements, and able to be performed quickly (Bjornsdottir et al., 2013). Monitoring
of patients’ meal intake is achieved through several methods, such as, the weighted food method,
food intake charts and plate diagrams, and by direct visualization (Berrut et. al., 2002;
Bjornsdottir et al., 2013; Budiningsari et al., 2016; Førli, Oppedal, Skjelle, & Vatn, 1998;
Husted, Fournaise, Matzen, & Scheller, 2017; Kawasaki et al., 2016; Palmer, Miller, & Noble,
2015).
Weighted food method. The weighted food method is considered the gold standard for
accurately calculating meal consumption; however, it is highly labor intensive (Agarwal, et al.,
2013; Kawasaki et al., 2016). In the weighted food method, each item of leftover food is
weighed individually (Budiningsari et al., 2016). The weight of each food item is subtracted
from the weight of a standard reference meal (Palmer et al., 2015). The weight of the leftover
food is converted into nutrients using information provided by the food manufacturer or by using
nutritional databases (Palmer et al., 2015). The weighted food method is the most accurate
dietary assessment method available, hence researchers use the weighted food method to the test
validity novel nutrient assessment scales (Agarwal, et al., 2013; Budiningsari et al., 2016;
Kawasaki et. al., 2016; Palmer et al, 2015).

IMPROVING NUTRITION MONITORING
16
Food intake charts and plate diagrams. Food intake charts are written logs of meal
intake (Førli et al., 1998; Palmer et al, 2015). Food intake charts use the meal portions method,
where the proportion of each food item that is consumed is recorded independently and
aggregated to quantify the intake for each meal (Førli et al., 1998; Palmer et al., 2015; Perry et
al., 2013). Plate diagrams use pictorial representations of meal portions to improve the accuracy
of quantifying meal intake (Bjornsdottir et al., 2013; Budiningsari et al., 2016). Plate diagrams
use partially shaded meal portions that correspond to the scale for documentation (Budiningsari
et al., 2016). Shaded diagrams are used as a reference to aid in estimating the remaining food
proportions (Budiningsari et al., 2016). When calculating energy and nutrient consumption, food
intake charts and plate diagrams are more accurate than using the plate method (Berrut et. al.,
2002; Bjornsdottir et al., 2013; Budiningsari et al., 2016; Førli et al., 1998). Some studies have
shown significant agreement comparing food intake charts with the weighed food method
(Berrut et. al., 2002; Budiningsari et al., 2016; Husted et al., 2017). However, other studies using
these methods to estimate calorie counts failed to achieve significant agreement, when compared
to the weighted food method (Bjornsdottir et al., 2013; Palmer et al., 2015). When using food
intake charts and plate diagrams, a possible rationale for inaccurate calorie count estimations is
due to clerical errors, like omitting entire meal portions (Budiningsari et al., 2016; Palmer et al.,
2015). Thus, the literature is inconclusive regarding the accuracy of food intake charts and plate
diagrams as methods to assess patients’ meal consumption when compared to the weighted food
method.
Direct visualization. In direct visualization, clinicians estimate the proportion of the
meal that is consumed by looking at the plate before and after the meal was consumed (Berrut et.

IMPROVING NUTRITION MONITORING
17
al., 2002; Husted et al., 2017; Kandiah, Stinnett, & Lutton, 2006). The direct visualization
method has two weaknesses. A drawback with the method’s reliability is that all groups tasked to
evaluate meal intake tend to overestimate the amount of food the patient consumed (Berrut et al.,
2002; Kawasaki et al., 2016). Moreover, in direct visualization clinicians only document one
measurement for the meal, rather than documenting each food group separately (Husted et al.,
2017). Because the direct visualization method takes an aggregate measurement of the meal,
instead of distinguishing between each food portion, it is difficult for dietitians to know the
amount of protein a patient consumes. Accurate measurement of protein intake for patients who
are at-risk for malnutrition is highly important because adequate protein consumption mitigates
the loss of lean body mass and can improve patients’ outcomes (Tappenden et al., 2013).
Therefore, direct visualization is not nearly as accurate as the weighted food method in terms of
calculating caloric intake (Husted et al., 2017; Kawasaki et al., 2016).
Despite the disadvantages of the method, many studies find direct visualization to be a
fairly accurate method to estimate meal intake and considered it to be a valid measurement to
detect inadequate meal consumption in hospitalized patients (Berrut et al., 2002; Husted et al.,
2017; Kawasaki et. al., 2016). Berrut et al. (2002) and Husted et al. (2017) find that direct
visualization is useful for tracking meal intake over the course of a patients stay and will help to
identify insufficient meal intake at an early stage. Moreover, when comparing interrater
reliability among clinicians of different job categories using direct visualization to estimate meal
intake, there is significant agreement in terms of correlation (Berrut et al., 2002; Kawasaki et al.,
2016). That is, meal intake estimates made by patient care assistants, dietitians, and physicians
have a small amount of variability from each other using this method.

IMPROVING NUTRITION MONITORING
18
Summary of Evidence
Using the meal portions method, with either food intake charts or plate diagrams, is more
accurate than the plate method (Bjornsdottir et al., 2013; Budiningsari et al., 2016; Kawasaki et
al., 2016). However, few studies show significant agreement between the meal portions method
and the weighted food method (Berrut et al., 2002, Budiningsari et al., 2016; Palmer et al., 2015).
Several studies suggest that food intake charts, meal plate diagrams, and direct visualization are
all appropriate methods for monitoring patient intake (Berrut et al., 2002, Budiningsari et al.,
2016; Husted et al., 2017; Kawasaki et al., 2016). However, short of the weighted food method,
which is the gold standard, there is a lack of consensus about which method is superior.
In the context of this project, the method selected must promote the goal of increasing the
rate of meal documentation among the unit personnel and be adequately sensitive to detect
patients who may be at-risk for developing malnutrition. Using the EHR to calculate a patient’s
exact energy intake isn’t necessary, however, it is important for RNs and RDs to monitor the
EHR and quickly be able to identify which patients need additional nutritional resources (e.g.,
nutritional evaluation, oral supplements, calorie count). In support of the direct visualization
method, the method is straightforward and has a high degree of interrater reliability (Kawasaki et
al., 2016). Moreover, it is appropriately sensitive for nurses and dietitians to monitor meal intake
over the duration of several days, such as a hospital admission (Berrut et al., 2002; Husted et al.,
2017; Kawasaki et al., 2016). The goal of this project is to increase documentation and
monitoring of meal consumption; therefore, the protocol that is developed will have clinicians
use direct visualization as the method for meal intake assessment and documentation.

IMPROVING NUTRITION MONITORING
19
Literature Critique
There are few studies of nutritional interventions in the neurological patient population.
Therefore, studies across the adult acute care populations were included, with an emphasis on
patients 65 and older. Additionally, there is a paucity of published literature about the accuracy
of measuring meal intake. The quality of the evidence is further diminished because studies used
different scales to quantify meal intake, for example some studies used quartiles or deciles, yet
others used scales with unusual spacing, such as, 0%, 25%, 50%, 75%, 80%, and 100% or “all”,
“half”, or “nothing” (Berrut et al., 2002, Budiningsari et al., 2016; Kawasaki et al., 2016). Absent
from the literature were methods to help clinical personnel be more consistent in documenting
nutritional intake. However, the literature search provided evidence that the direct visualization
method that is currently used is an adequate method for evaluating nutritional intake in
hospitalized adult patients.

IMPROVING NUTRITION MONITORING
20
Chapter 3: Conceptual Model
Detection, prevention and treatment of malnutrition in the acute inpatient adult
population is a complex process which requires coordination of hospital resources (Tappenden et
al., 2013). In the target microsystem, there are opportunities to optimize the processes involved
with meal tray delivery, and assessment of meal intake, as well as documentation and monitoring
of patients’ nutritional status. The current method is entirely dependent on the actions of
individual nurses and lacks the necessary systemic structure. This creates staff frustration and the
potential for poor nutrition related outcomes due to under identification of patients at risk for
malnutrition and omission of the necessary treatment. The CNL on the microsystem has
identified that the poor documentation of food intake is problematic and leads to inadequate
recognition of those who require a referral to registered dietitians. An evidence-based project
will be undertaken to implement a standardized process for meal documentation, uniform
placement of meal trays, and scheduled rounding times for removal of used trays.
To successfully administer this evidence-based project, it will be necessary to include
quality improvement models as a benchmark for comparison. The define-measure-analyze-
improve-control (DMAIC) method of quality improvement is a conceptual model which will be
used to study the clinical problem and determine possible solutions. Once the intervention is
identified the MSN student and relevant stakeholders will guide the implementation of the
process changes with the goal of reducing patients’ nutritional risk by increasing meal intake
documentation. In this chapter, the components of the conceptual model will be discussed and
there will be an explanation of how the conceptual model will be applied to the clinical problem.
IMPROVING NUTRITION MONITORING
21
Historical Perspective of Conceptual Models
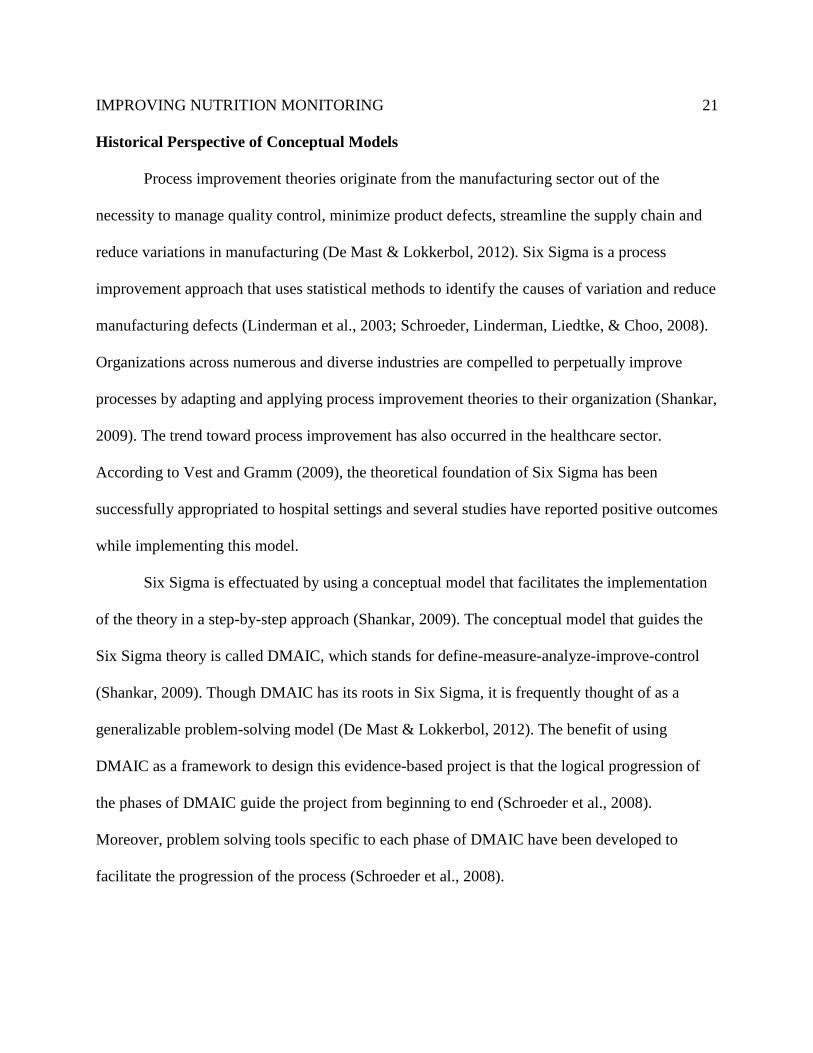
Process improvement theories originate from the manufacturing sector out of the
necessity to manage quality control, minimize product defects, streamline the supply chain and
reduce variations in manufacturing (De Mast & Lokkerbol, 2012). Six Sigma is a process
improvement approach that uses statistical methods to identify the causes of variation and reduce
manufacturing defects (Linderman et al., 2003; Schroeder, Linderman, Liedtke, & Choo, 2008).
Organizations across numerous and diverse industries are compelled to perpetually improve
processes by adapting and applying process improvement theories to their organization (Shankar,
2009). The trend toward process improvement has also occurred in the healthcare sector.
According to Vest and Gramm (2009), the theoretical foundation of Six Sigma has been
successfully appropriated to hospital settings and several studies have reported positive outcomes
while implementing this model.
Six Sigma is effectuated by using a conceptual model that facilitates the implementation
of the theory in a step-by-step approach (Shankar, 2009). The conceptual model that guides the
Six Sigma theory is called DMAIC, which stands for define-measure-analyze-improve-control
(Shankar, 2009). Though DMAIC has its roots in Six Sigma, it is frequently thought of as a
generalizable problem-solving model (De Mast & Lokkerbol, 2012). The benefit of using
DMAIC as a framework to design this evidence-based project is that the logical progression of
the phases of DMAIC guide the project from beginning to end (Schroeder et al., 2008).
Moreover, problem solving tools specific to each phase of DMAIC have been developed to
facilitate the progression of the process (Schroeder et al., 2008).

IMPROVING NUTRITION MONITORING
22
In this evidence-based project, the stages of DMAIC will be applied independently of Six
Sigma as a logical step-by-step problem-solving process. This will help identify the root causes
contributing to poor documentation of meal intake, as well as provide possible solutions to
ameliorate the problem (De Mast & Lokkerbol, 2012). For a visual diagram of the DMAIC
framework in the context of this project, refer to Appendix A. Applying DMAIC to the
phenomenon of interest is appropriate because, “the DMAIC methodology takes a problem that
has been identified by the organization and utilizes a set of tools and techniques in a logical
fashion to arrive at a sustainable solution. The resultant solution will minimize or eliminate the
problem” (Shankar, 2009, p. xvi). DMAIC will be used as the theoretical underpinning to this
project as the step-by-step structure will provide guidance for correcting the clinical problem and
because it has been used effectively in healthcare settings (Vest & Gamm, 2009).
Define
Defining the purpose of the project and the extent of the problem is the initial step in the
DMAIC model (Schroeder et al., 2008). Clearly identifying the problem and the limits of the
proposed intervention is important, as the problem being addressed should be aligned with the
goals of the organization (Langley, 2009). The problem on the target microsystem is the gap that
exists between the organizational policy for monitoring patients’ meal intake and the existing
practice. The expectation is that RNs and PCAs are accountable to monitor and document the
nutrition and meal intake of their patients. In the existing practice, monitoring of patients’
nutritional status is hindered by poor documentation of meal intake. Having support from
leadership will be useful when attempting to obtain the resources necessary to achieve the
mission (Warner et al., 2013). This project is supported by the nurse manager, the CNL, and the

IMPROVING NUTRITION MONITORING
23
nutrition services manager. Setting project boundaries ensures that the team is comprised of the
right stakeholders and will prevent the team from expanding the scope beyond the primary
objectives (Warner et al., 2013). The scope of this project is limited to the documentation of
meal intake, because a process currently exists for initial assessment of nutrition status upon
admission.
Measure
After the problem has been detected it must be quantified (Schroeder et al., 2008). This
step in the DMAIC model serves two purposes. The first objective of measurement is to
scrutinize the entire process under examination (i.e., consider the interaction that occurs across
microsystems) (Schroeder et al., 2008). Being knowledgeable of the whole process will be useful
in the subsequent steps of DMAIC (De Mast & Lokkerbol, 2012). The point at which the
problem appears may be distant from the point at which the problem is generated and knowing
how the system works may provide valuable insight (Langley, 2009). To measure the entire
nutrition process, the MSN student will conduct structured interviews with staff members who
take part in the meal tray delivery, meal tray removal, and meal documentation process. This will
include RNs, PCAs, the registered dietitian, and tray runners. The MSN student will also
visualize the flow of the meal tray from the beginning of the process, which starts in the kitchen,
up to the patients’ room, and then how the meal tray is removed from the room and returned to
the kitchen.
Secondly, measuring the problem involves the collection of baseline data, which will be
used to evaluate the effectiveness of the intervention (Schroeder et al., 2008). It is crucial to
establish baseline data because the effectiveness of the intervention is gauged on the comparison

IMPROVING NUTRITION MONITORING
24
between the pre- and post-data (Schroeder et al., 2008). Pre- and post-intervention data will be
collected by auditing the electronic health record (EHR) for meal documentation. A pre-
intervention audit of the EHR for meal documentation of inpatient rooms on the clinical
microsystem illustrates the range of meal documentation is between 42%-54%. See Appendix B
for the line chart detailing the rate of meal intake documentation.
Analyze
In the analysis phase of DMAIC, variables are examined to determine antecedents to the
problem (Langley, 2009). To improve the nutrition process the information gathered from chart
audits and staff interviews will be examined to identify precipitating factors of the clinical
problem. Two problem solving techniques of DMAIC will be applied to analyze the problem.
The two techniques that will be used are (a) process flowcharting and (b) root cause analysis (see
Appendix C for the flowchart of the pre-intervention meal tray delivery process and Appendix D
for the root cause analysis). According to Warner et al. (2013) each step of a process can be
analyzed by mapping out the sequence of events in a process flowchart. Variations in the process
will be visualized on a flowchart and will be categorized for further examination. To identify the
sources of variation seen within the flowchart, the process improvement team will also conduct a
root cause analysis (RCA). Root cause analysis is a type of structured brainstorming activity
(Harris, Roussel, Thomas, 2014; Langley, 2009). RCAs typically have five main categories:
technology, policies, people, procedures, and environment (Toussaint, & Berry, 2013). Causes
for variation are attributed to one of the five categories. RCAs are useful for clarifying and
prioritizing the root causes of error (Harris et al., 2014; Langley, 2009).

IMPROVING NUTRITION MONITORING
25
Collaboration with key stakeholders will drive this stage of DMAIC. The variations in the
pre-intervention process identified in the process flowchart will be analyzed using an RCA.
Several “root causes” will be identified by the team and original ideas will be sought to address
the findings from the RCA. Subsequently, the quality improvement team will develop
interventions targeted at ameliorating the root cause or the group of root causes that contribute to
the clinical problem. Then the team will determine which interventions to include in the process
change.
Improve
The overarching theme of process improvement theory is to standardize or eliminate
activities that are unorganized or that may lead to errors (Schroeder et al., 2008). In DMAIC, the
goal of the improve stage is to evaluate and implement interventions which will enhance the
functioning of the process (Linderman et al., 2003). On the target microsystem, there is no
standard process for meal tray delivery, meal tray removal, or documentation of intake.
Standardizing the workflow will be central to the process improvement activities.
Potential solutions that were proposed in the analysis phase will be considered for
inclusion into the new standard process. During the improvement phase stakeholders will trial
the proposed interventions and report back to the team on how the changes impacted their
workflow. The provisional activities that improved compliance with documentation standards
will be included in the intervention. Activities that caused work to be duplicated or tasks to be
omitted altogether will be eliminated. The resulting series of steps will be aggregated to
formulate the new standard process (see Appendix E for post-intervention meal tray delivery
process flowchart). The MSN student will formalize the set of interventions by creating a

IMPROVING NUTRITION MONITORING
26
standard process document (see Appendix F for the standard process document). The standard
process document will include the project overview, as well as, step-by-step instructions for each
group of employees who will be affected by the change in workflow. The materials will be
presented to micro- and meso-system leadership to attain approval for implementing the process
changes, they will also be used to educate staff members about the impending changes. The
standard process document will be sent to unit staff members electronically with their weekly
staff email, which is how information is normally promulgated. The document will also be
posted on the unit for reference. After receiving the approval to implement the process change
and the staff education has taken place, the standard process will go into effect.
Control
The control phase of DMAIC consists of the period immediately following
implementation of the process change and continues over time (Shankar, 2009). In the final stage
of DMAIC, the goal is to control and sustain the improvements to avoid lapsing back to the
former process (Warner et al., 2013). A sustainability plan is an essential part of the clinical
protocol and will be developed for the target microsystem (Harris et al., 2014). To fully integrate
the standard work into the microsystem’s processes, the sustainability plan will have three parts;
staff member education, modification to the physical environment, and automation of processes.
Leading up to the implementation start date, the process change will be presented to unit
personnel using several communication media. Staff members will have access to the standard
process document which will be sent to them in the weekly email, copies of the document will be
posted on the unit. Following the email, the MSN student will speak individually with RNs and
PCAs on both day- and night- shift to educate them about the process change. Starting two-

IMPROVING NUTRITION MONITORING
27
weeks before the standard process takes effect, the MSN student will perform brief presentations
regarding the process change during the daily pre-shift huddle. The student will be available
throughout their shift to address staff questions and concerns. Those who wish to give
anonymous feedback about the intervention can submit comment cards to an envelope posted on
the unit and their concerns will be addressed in during the pre-shift huddle. After familiarizing
themselves with the new workflow, staff members will be expected to certify their competence
by signing their name on a unit roster. Individuals who have not signed their names on the
competency sheet will be followed-up with to address any remaining concerns. According to
Langley (2009), ingraining the standard process into the microsystem’s new employee
orientation program would benefit the sustainability of the project.
Shankar (2009) suggests that modifying the physical environment and automating
operations, whenever feasible, also supports the project’s sustainability. Therefore, small signs
will be added to all patient rooms to designate the standard location of tray placement and
remind staff of the change in workflow. Furthermore, and automated EHR auditing report will be
designed to improve the CNL’s ability to audit for compliance with meal intake documentation.
The CNL can use the results of the audit to motivate employees by providing feedback about
their performance and fostering ownership of outcomes.
Conclusion
It is expedient to apply the DMAIC model to address this clinical problem. Using the
define-measure-analyze-improve-control sequence will result in a greater understanding of the
nature of the phenomenon (Langley, 2009). Patients on the target microsystem are at an
increased risk for adverse nutrition related outcomes, because the level of monitoring and

IMPROVING NUTRITION MONITORING
28
documentation of meal intake falls short of the expectation. At the core of this phenomenon is a
defective process that makes it difficult for clinicians to assess, monitor, and document each
patient’s meal intake. DMAIC is a quality improvement framework designed to isolate and
eliminate the root causes of variation (Schroeder et al., 2008). Eliminating the variation that
occurs on this microsystem will create a more reliable process and will result in better
monitoring of patient intake and potentially better patient outcomes.
IMPROVING NUTRITION MONITORING
29
Chapter 4: Clinical Protocol
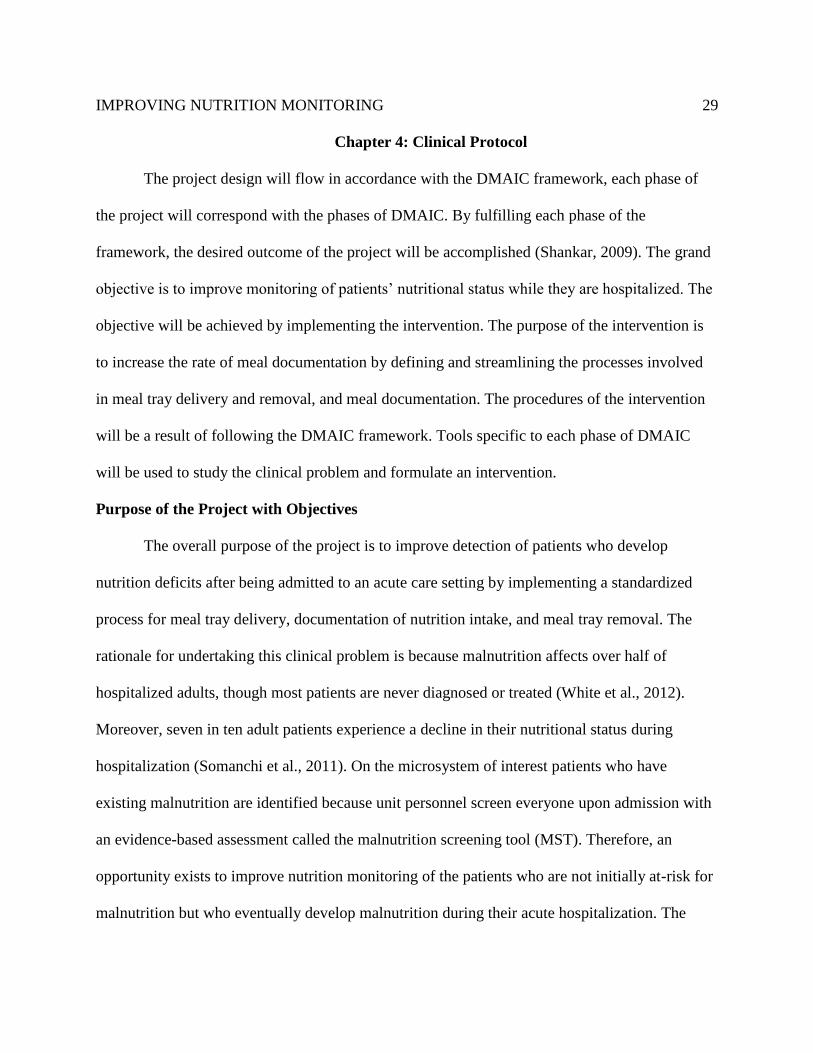
The project design will flow in accordance with the DMAIC framework, each phase of
the project will correspond with the phases of DMAIC. By fulfilling each phase of the
framework, the desired outcome of the project will be accomplished (Shankar, 2009). The grand
objective is to improve monitoring of patients’ nutritional status while they are hospitalized. The
objective will be achieved by implementing the intervention. The purpose of the intervention is
to increase the rate of meal documentation by defining and streamlining the processes involved
in meal tray delivery and removal, and meal documentation. The procedures of the intervention
will be a result of following the DMAIC framework. Tools specific to each phase of DMAIC
will be used to study the clinical problem and formulate an intervention.
Purpose of the Project with Objectives
The overall purpose of the project is to improve detection of patients who develop
nutrition deficits after being admitted to an acute care setting by implementing a standardized
process for meal tray delivery, documentation of nutrition intake, and meal tray removal. The
rationale for undertaking this clinical problem is because malnutrition affects over half of
hospitalized adults, though most patients are never diagnosed or treated (White et al., 2012).
Moreover, seven in ten adult patients experience a decline in their nutritional status during
hospitalization (Somanchi et al., 2011). On the microsystem of interest patients who have
existing malnutrition are identified because unit personnel screen everyone upon admission with
an evidence-based assessment called the malnutrition screening tool (MST). Therefore, an
opportunity exists to improve nutrition monitoring of the patients who are not initially at-risk for
malnutrition but who eventually develop malnutrition during their acute hospitalization. The

IMPROVING NUTRITION MONITORING
30
objectives will be to improve nutrition monitoring and standardize the meal tray delivery and
removal process. The desired outcome is to more easily identify patients who develop
malnutrition by increasing the rate of meal intake documentation which promotes more vigilant
monitoring. Each phase of DMAIC has a subordinate objective that serves to advance the
development of the protocol. See Appendix G for a Gantt chart of the project timeline.
Define. In the define phase, the goal is to determine what the clinical problem is and the
scope of the planned intervention. This phase will be complete when a clear problem statement
can be articulated. Approval to conduct the quality improvement activity will need to be obtained
from the hospital leadership.
Measure. In the measure phase, the goal is to define the variables of interest, specify the
parameters of the variables, and collect baseline data. An electronic monitoring tool will need to
be developed to reduce the burden of collecting data.
Analyze. In the analyze phase, the goal is to establish which antecedent factors lead to
the clinical problem and to develop potential solutions to counteract the antecedents. Once the
group of measures is decided upon the goal will be to design and synchronize each aspect of the
intervention.
Improve. In the improve phase, the goal is to implement the intervention on the clinical
microsystem. This will include developing and disseminating the materials that specify the
intervention. Staff members will be educated about how the intervention affects their workflow.
Control. In the control phase, the goal will be to compare pre- and post- intervention
measurements to evaluate the impact of the intervention. A mechanism to ensure sustainability of
the process change will also need to be developed.

IMPROVING NUTRITION MONITORING
31
Needed Resources
It was evident from the microsystem assessment that there would be minimal capital and
technological resources available to address the clinical problem. This challenge shaped the
decision to pursue a clinical problem that would be susceptible to an intervention principally
focused on modifying the workflow of unit personnel. Therefore, staff members from the
relevant microsystems are the central resource for this project. Employees would not be
permitted to meet outside of their assigned schedule to work on this project. Instead of
establishing a regular meeting time, the MSN student plans to meet with staff, one on one, during
their work hours to solicit ideas and ask for feedback.
The quality improvement team incorporates personnel from three job categories present
on the microsystem: registered nurses, patient care assistants, and tray runners. RNs are
responsible for the wellbeing of their patients and an essential nursing responsibility is to
monitor patients’ nutritional status. The intervention needs to be supportive of the nursing duty
to adequately monitor patients, so the RN perspective is important when creating the
intervention. RNs often delegate meal related tasks to the PCAs. Therefore, PCAs do the
majority of meal intake documentation and will experience the most significant change to their
workflow as a result of the intervention. As key stakeholders, a great effort will be made to
design the intervention according to the responses of PCAs. Another core constituent of the
process change is the nutrition tray runner who delivers meal trays to patients on the target
microsystem. Representatives of the three key stakeholder groups will comprise the quality
improvement team. The preferences of the quality improvement team will be synthesized to
generate a consensus design for the project intervention. Although, the viewpoints of all staff

IMPROVING NUTRITION MONITORING
32
members will be considered. Input from all key stakeholder groups will be crucial in the
improvement phase of the project. Once the standard process is established, the success of the
intervention ultimately relies on participation of the unit personnel.
Another challenge that needs to be addressed is how to quantify the rate of meal
documentation. To establish the existence of this clinical problem, the MSN student initially
audited the EHR for meal intake documentation. However, manually auditing patient charts
became an insurmountable burden and it would not be an appropriate method to evaluate the
results of the intervention. An electronic measurement tool will need to be created to consistently
capture the data and eliminate the labor involved in calculating the documentation rate of meal
intake. Due to lack of resources, it is not feasible to introduce novel technology to solve the
problem. Thus, the MSN student will use underlying features in the existing EHR to achieve the
same results. The MSN student will attempt to create an automated report that displays only the
desired information about patients’ meal intake. The implications of the report, if it can
successfully be created, will be that the microsystem could reliably track day-to-day compliance
of documentation, which supports the project’s sustainability.
Cost Benefit Analysis
Since the primary resource needed to complete this project is the contribution from
microsystem personnel who will not be paid to spend additional time participating in the project
and there are no other quantifiable financial or technological expenditures required, there is no
cost associated to implement the project. Several studies have associated more aggressive
nutrition management policies with favorable cost outcomes, in terms of cost avoidance or
increased reimbursement rates (Kruizenga et al 2003; Ockenga, Freudenreich, Zakonsky,

IMPROVING NUTRITION MONITORING
33
Norman, Pirlich, & Lochs, 2005; Meehan, Loose, Bell, Partridge, Nelson, & Goates, 2016;
Somanchi et al., 2010; White et al., 2012). However, extrapolating the results from other studies
to perform a cost benefit analysis on the intervention proposed in this project may be misleading.
This is primarily due to the difference between the nature of the interventions and desired
outcomes described in other studies and the proposed scope of this project. Many of the
interventions described in other studies go beyond the scope of this project. Several studies have
examined the effectiveness of protocols targeted at early detection and treatment of malnutrition.
The MSN student is unaware of any studies with the objective to improve the detection of
malnutrition by improving staff compliance with documentation and standardize the meal tray
delivery and removal process. However, better documentation of meal intake may lead to an
increase in malnutrition diagnoses on the microsystem. Additionally, higher rates of diagnosed
malnutrition can increase the hospital’s reimbursement.
Documentation of poor nutritional intake, among other criteria, can help support the
diagnoses of malnutrition (White et al., 2012). According to White et al., (2012) the actual
prevalence of malnutrition in hospitalized adults is between 15%-60%, yet its diagnosed merely
3% of the time. The diagnoses of malnutrition is important because the diagnoses is linked to the
payment system established by the Centers for Medicare and Medicaid Services (CMS) (White
et al., 2012). The Medicare Severity-Diagnostic-Related Groups (MS-DRGs) are used to assign
the amount of money a hospital receives for treating patients who meet certain criteria, however,
in the absence of documented criteria, the hospital will receive no payment (White et al., 2012).
Hence, inadequate documentation of meal intake may preclude a patient from being diagnosed
with malnutrition. Absent the diagnoses of malnutrition, the hospital will not receive payment for

IMPROVING NUTRITION MONITORING
34
services rendered to improve that patients’ nutrition status. According to Ockenga et al. (2005),
after improving a hospital’s malnutrition screening protocol, the rate of diagnosed cases of
malnutrition increased by 15% and that resulted in $455 more per patient in reimbursement
money.
The evidence supporting better nutrition management is overwhelming. Studies show that
early treatment of malnutrition reduces the likelihood that patients develop complications
(Kruizenga et al., 2003; Meehan et al., 2016). Fewer complications reduces the average LOS and
results in a net cost savings for hospitals (Kruizenga et al., 2003; Meehan et al., 2016). After
implementing a nutrition related quality improvement protocol, Meehan et al. (2016)
demonstrates a reduction in the LOS by 0.77 days, 17% reduction in readmission probability,
50% reduction in HAPUs, and an average cost reduction of $969 for nutrition sensitive patients.
Kruizenga et al. (2005) finds that early screening and treatment of malnutrition results in a cost
savings of $91 per patient per day.
Measurement: Sources of Data and Tools
Structured interviews will be conducted with participation from the RNs and PCAs who
are core microsystem staff members. The MSN student will also interview members from the
nutrition microsystem, that is, the RD and the tray runners. The purpose of the structured
interviews is to gain an appreciation of how different members impact the current nutrition
related processes on the target microsystem.
After interviewing microsystem staff, the student plans to shadow a tray runner from the
nutrition department so that the entirety of the meal tray delivery process for the microsystem of
interest is observed. The MSN student will observe the movement of meal trays from their

IMPROVING NUTRITION MONITORING
35
inception in the kitchen, to delivery on bedside tables in patients’ rooms, and back down to the
kitchen. With regards to the clinical project, the process measure is the meal tray delivery
process, and it will be operationalized by developing a meal tray process flowchart. The MSN
student will quantify the current process by creating the process flowchart (see Appendix C for
the pre-intervention meal tray delivery process flowchart). Essentially, the proposed intervention
will be the adoption of a new meal tray delivery process that facilitates improved documentation
of meal intake and monitoring of nutrition status. A new process flowchart of the intervention
will be created to detail the process change (see Appendix E for the post-intervention meal tray
delivery process flowchart). After implementation of the intervention, the MSN student plans to
shadow the tray runner and make observations of the new process during meal times. By using
the flowcharts and observing the workflow, the MSN student will compare the pre-intervention
meal tray process to the post-intervention meal tray process and evaluate whether the project
resulted in an observable change in workflow.
The final and most important source of information for this project will come from
auditing the EHR for the presence of meal documentation. The rate of meal documentation is the
primary outcome indicator. The EHR was initially audited by hand, though an automated EHR
report will be created to support data collection. Both data collection methods will apply the
same criteria to determine what qualifies as a valid entry for purposes of quantifying meal intake
documentation. See the “Meal Documentation” section of Appendix F for the full description of
valid documentation criteria. In a brief description of the criteria, its assumed that each patient
would be receiving three meals per day. The rate of meal documentation would be diminished by
a third for each instance that the EHR doesn’t reflect documentation during an assumed meal

IMPROVING NUTRITION MONITORING
36
time. The patient doesn’t necessarily have to eat a certain amount of food during each meal, the
EHR merely has to reflect information about a patient’s nutritional situation. Examples of
acceptable documentation include, a patient who refuses to eat, a patient who is prohibited from
eating for medical reasons, and a patient who eats 75% of their meal. The purpose of this project
is to increase the rate of meal intake documentation so that the EHR provides a more accurate
representation of a patients’ nutritional status. The MSN student will track the rate of meal
documentation and compare the results before and after the project is implemented. To determine
if the project was successful, the post-intervention rate of meal documentation needs to be higher
than the pre-intervention rate of meal documentation. Additionally, the stated objective of the
project is to increase rates of meal documentation from 54% to 80%.

IMPROVING NUTRITION MONITORING
37
Chapter 5: Project Evaluation
Project Overview, Strengths, and Weaknesses
A new process for delivering, removing, and documenting meal trays was developed and
implemented on the microsystem with the purpose of increasing monitoring of patients’
nutritional status. The results of the intervention will be discussed in this chapter, as well as an
evaluation of the execution of the project plan (see Appendix G for a Gantt chart detailing the
project timeline). Barriers presented opportunities to change and improve upon the planned
intervention, though in other instances, the challenge was too great to overcome and resulted in
changes that undermine the effectiveness of the intervention.
Define. It was believed that patients on the clinical microsystem were not achieving
optimal nutritional outcomes, though it was initially difficult to establish and clearly articulate
the clinical problem and the scope of what would be the proposed intervention. After reviewing
the published literature, the organizational policies and procedures, assessing the microsystem,
and speaking with stakeholders, it became clear the problem was that organizational
documentation standards were not being upheld which degrades nurses’ ability to monitor their
patients.
Originally, the key stakeholders desired a more comprehensive intervention, though there
were several limitations that restrained the scope of the clinical project. Ideally the desired
protocol would include detecting and correcting malnutrition in hospitalized patients who
experience a decline in their nutritional status. The desired outcomes of this ideal version of the
protocol would be to show that it resulted in a lower prevalence of nutrition related
complications (e.g., decreased average LOS and fewer pressure injuries). However, an
IMPROVING NUTRITION MONITORING
38
intervention of that scale would have required a hospital-wide policy shift regarding the delivery
of nutritional supplements and changes to the composition of patient meals. Additionally, the
more basic problem of identifying the patients who develop a risk for malnutrition while they are
hospitalized had to be addressed first. Consequently, the problem is defined as a lack of adequate
meal intake documentation which violates organizational standards and negatively affects the
monitoring of patients’ nutritional status. Therefore, the scope of the protocol would be to
improve meal intake documentation which would theoretically increase nurses’ monitoring of
patients’ nutritional status.
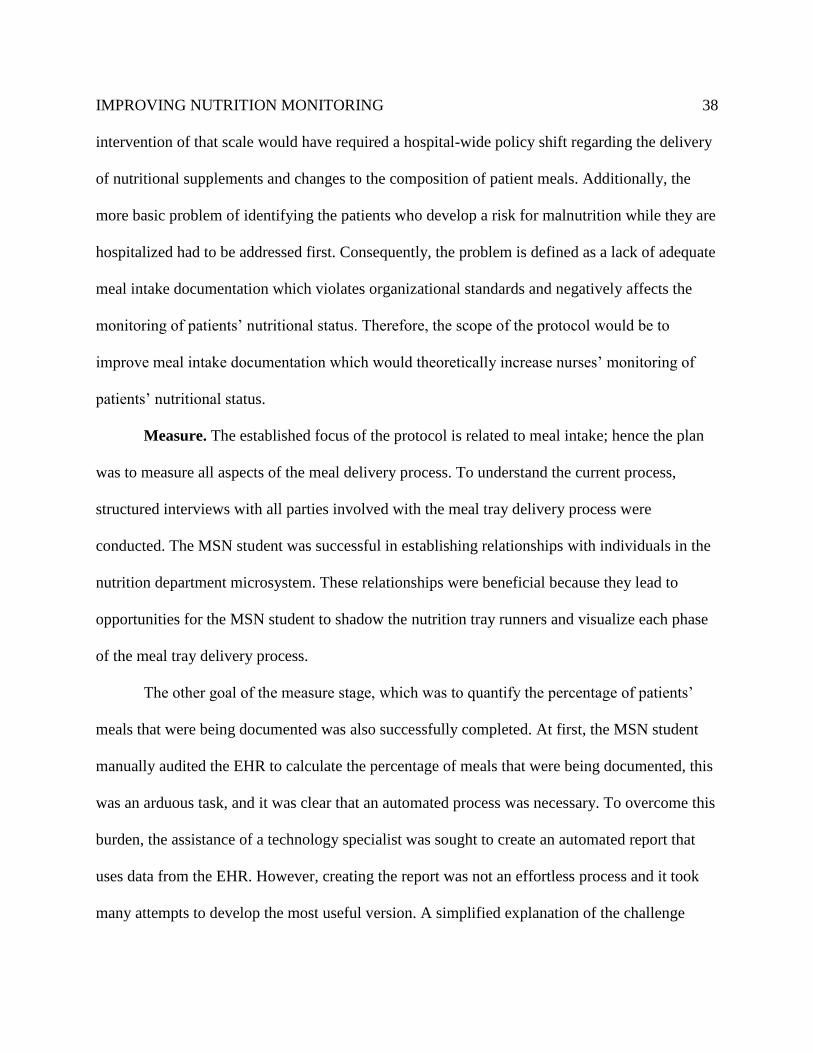
Measure. The established focus of the protocol is related to meal intake; hence the plan
was to measure all aspects of the meal delivery process. To understand the current process,
structured interviews with all parties involved with the meal tray delivery process were
conducted. The MSN student was successful in establishing relationships with individuals in the
nutrition department microsystem. These relationships were beneficial because they lead to
opportunities for the MSN student to shadow the nutrition tray runners and visualize each phase
of the meal tray delivery process.
The other goal of the measure stage, which was to quantify the percentage of patients’
meals that were being documented was also successfully completed. At first, the MSN student
manually audited the EHR to calculate the percentage of meals that were being documented, this
was an arduous task, and it was clear that an automated process was necessary. To overcome this
burden, the assistance of a technology specialist was sought to create an automated report that
uses data from the EHR. However, creating the report was not an effortless process and it took
many attempts to develop the most useful version. A simplified explanation of the challenge

IMPROVING NUTRITION MONITORING
39
presented by creating an automated report is that quantifying the rate of omitted data entries is
impossible. Therefore, the report had to gather enough contextual variables that when considered
together would present a meaningful data point, yet it had to limit the amount of unnecessary
information so that using the report did not become as arduous as auditing the original EHR by
hand. A set of standards was developed to analyze the information presented in the automated
report. The standards uniformly applied to make use of the report and was able to quantify the
rate of meal intake documentation for each patient.
Analyze. Every objective for the analysis phase of the project was successfully
completed. The MSN student conducted several hours of observation of the meal tray delivery
process including shadowing the nutrition tray runners. From the observations, a process
flowchart was created and analyzed to determine at which point in the process variations
occurred. The variations identified in the pre-intervention process flowchart were inputs for the
root cause analysis (RCA). Stakeholders also made significant contributions to the RCA. Several
root causes were identified as contributory factors precluding accurate nutritional care, namely
the documentation of meal intake. The RCA uncovered that markedly rapid removal of used
meal trays was the principal antecedent factor that resulted in poor documentation of meal
intake. An opinion shared among the PCAs was that the TRs removed used meal trays so quickly
that they were not able to come back after the patient was done eating and visualize how much of
the meal was consumed. Conversely part of the TR workflow expectation was to remove meal
trays from patients’ rooms 60-minutes after they were delivered. The MSN student worked
closely with the key stakeholders (i.e., day-shift PCAs, the nutrition tray runners, and the

IMPROVING NUTRITION MONITORING
40
manager of the nutrition department) to find alternative steps that maintain the priorities of each
constituent yet avoids the circumstances that perpetuate the clinical problem.
Improve. The purpose of the improve phase is to establish the new standard work related
to meal tray delivery, removal, and documentation. The analysis phase yielded several possible
interventions. After much discussion, the stakeholders settled upon a set of small changes to the
workflow. The two key innovations of the process change were: (a) establishing the uniform
location for meal tray placement; and (b) standardizing the rounding times for used meal tray
removal. The new process involves an expectation that used meal trays will now be placed on a
specific shelf in the patient’s room. Placement of used meal trays in that location signifies that
meal intake documentation is complete and the used tray is ready to be cleared from the room.
Instead of TRs removing used meal trays 60-minutes after they are delivered, in the new standard
process TRs will only remove trays that are placed in the standard location. The remaining meal
trays will be removed during standard rounding times at 1000, 1400, and 2000. The change
resulted in a simplified and more predictable workflow for RNs, PCAs, and TRs.
The MSN student successfully introduced the intervention to the microsystem by
presenting the project to unit personnel during pre-shift huddles, posting information on a
centrally located bulletin board, and creating the standard process document which was
distributed to staff. The standard process document provided rationale for the process change and
defined the standard workflow for RNs, PCAs, and TRs. The plan for the intervention, the
content of the bulletin board, and the standard process document were approved by the
appropriate nutrition department and nursing unit leadership prior to implementation.

IMPROVING NUTRITION MONITORING
41
Establishing the standard rounding times to remove used meal trays is a strength of the
project and in many regards, it is the most elegant accomplishment of the project. There are
several reasons to highlight this aspect of the intervention. First, this is a practical change and it
addresses the dominant root cause of the clinical problem. According to the RCA, the primary
reason that meal intake was not being documented in the EHR was because used meal trays were
being removed from patients’ rooms too quickly for the PCAs to visualize the amount of food
that the patient had consumed. Other root causes were identified; however, the clearance rate of
used meal trays was the most significant factor contributing to the problem. Additionally, the
change to implement standardized rounding times was the product of collaboration between
individuals from separate microsystems, who have disparate priorities, and it is supported by
each constituent stakeholder group. One of the benefits of using the DMAIC framework is to
involve microsystems personnel in the process of problem solving. An intentional design of this
project was to empower individuals to suggest their own solutions to the clinical problem.
According to Nelson et al. (2011), staff members are more likely to support an intervention if
they have been involved in developing the final product. Representatives from multiple
microsystems took part in developing the protocol, which gives additional credence that the
process change will be sustained. Moreover, standardizing meal tray rounding times lessens
variation in the process and eases the pressure of the workload. Another reason that staff
members are likely to sustain the intervention, is that it diminishes the time pressure they have to
complete tasks. The same amount of work is being done, yet, because unit personnel are able to
predict their workflow they have an increased capacity to complete assigned tasks.

IMPROVING NUTRITION MONITORING
42
Control. The objective of the control phase is to sustain the process change. This phase
of the project is ongoing. There are three facets to the sustainability plan; they are staff member
education, modification to the physical environment, and auditing the EHR for documentation
compliance.
Part of the sustainability strategy is to ensure that unit personnel are sufficiently educated.
To this end, the standard process document was distributed to staff as part of the weekly email
update. Another intention of the standard process document was that it would be included in the
orientation materials for new staff members. Beginning two weeks before the process change
went into effect, the MSN student presented the intervention during the pre-shift huddle each
morning. Moreover, the MSN student individually approached staff members from both shifts to
educate them about how the change impacts their workflow. If staff members had questions or
suggestions they were encouraged to ask the MSN student directly. Unit personnel could also
anonymously submit questions to a folder attached to the bulletin board. To ensure
accountability, staff were expected to certify their understanding of the intervention by initialing
next to their name on a unit roster, which was also posted on the bulletin board.
Originally the plan was to modify the physical environment on the microsystem by
adding small signs to designate the standardized location for used meal trays. The signs were
supposed to be located on a closet door in the patients’ room or on the shelf inside of the closet.
However, this part of the sustainability plan was unsuccessful. Signs and decorations posted
inside patient care areas are governed by strict criteria and any changes to the microsystem
appearance had to be approved by a committee. To maintain the timeline and implement the

IMPROVING NUTRITION MONITORING
43
intervention prior to the end of the MSN students clinical experience, this aspect of the plan was
jettisoned.
The final aspect of the sustainability plan includes establishing an automated mechanism
to audit the electronic health record for meal intake documentation (See Appendix F for a visual
representation of the EHR). With the assistance of a technology expert, an automatic report was
created and runs each morning. The report encompasses all of the patients on the microsystem.
The report gathers information from the EHR according to specified location instructions. For
example, the report gathers all the information located in the “ADL Nutrition” column. Then, the
information gathered from the EHR is deposited onto an electronic spreadsheet and emailed to
the MSN student and CNL. The most useful information that the report provides is from the
“meal intake” cell. The “meal intake” cell contains options to document 0%, 25%, 50%, 75%,
100%, bites, ice chips, sips, and refused. However, other contextual variables are necessary to
provide a holistic picture of a patient’s nutritional status, therefore, other cells are included in the
report.
The MSN student demonstrated technological proficiency by working with exerts to
create the automated EHR auditing report. However, the report is also a significant weakness of
the project. The purpose of making an automated report is that it should provide a relatively easy
and more reliable method for auditing the EHR. However, the report in its current state does not
provide the CNL with a quick method to gauge the documentation performance of the
microsystem personnel. The flaw in the report is that it too heavily relies upon the contextual
information to provide the most accurate representation of a patient’s documented meal intake.
By including the contextual data, the report is truer to the clinical picture but is also too
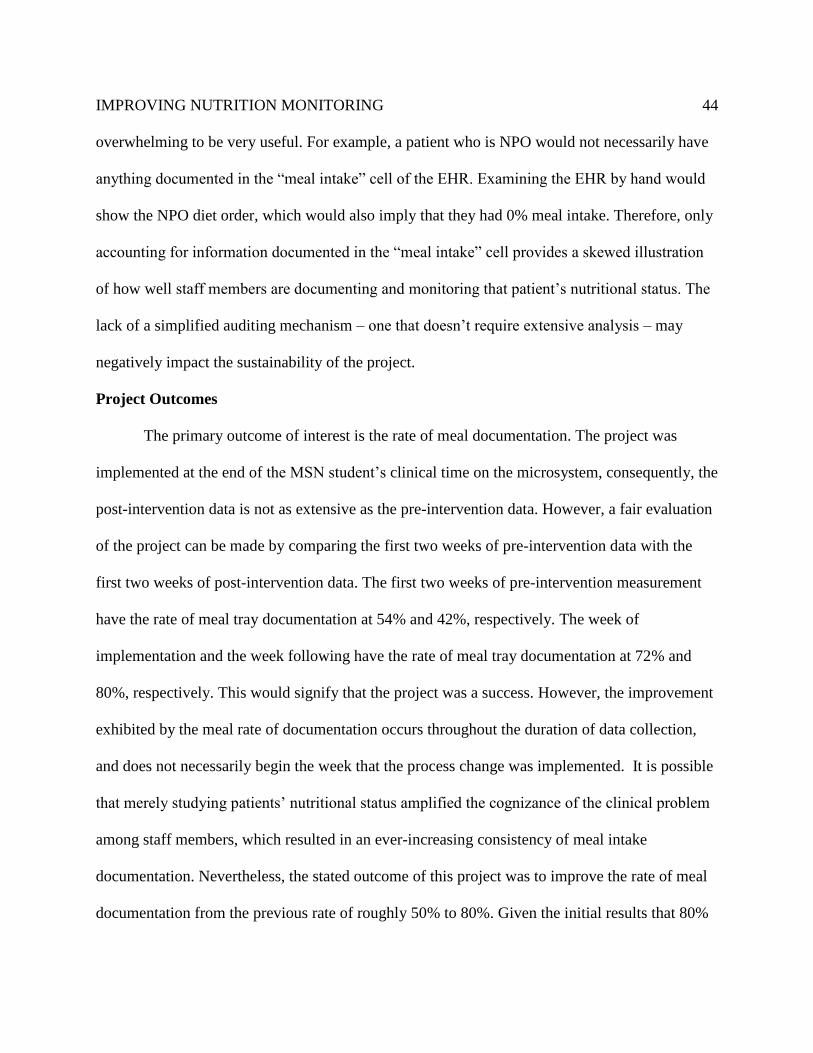
IMPROVING NUTRITION MONITORING
44
overwhelming to be very useful. For example, a patient who is NPO would not necessarily have
anything documented in the “meal intake” cell of the EHR. Examining the EHR by hand would
show the NPO diet order, which would also imply that they had 0% meal intake. Therefore, only
accounting for information documented in the “meal intake” cell provides a skewed illustration
of how well staff members are documenting and monitoring that patient’s nutritional status. The
lack of a simplified auditing mechanism – one that doesn’t require extensive analysis – may
negatively impact the sustainability of the project.
Project Outcomes
The primary outcome of interest is the rate of meal documentation. The project was
implemented at the end of the MSN student’s clinical time on the microsystem, consequently, the
post-intervention data is not as extensive as the pre-intervention data. However, a fair evaluation
of the project can be made by comparing the first two weeks of pre-intervention data with the
first two weeks of post-intervention data. The first two weeks of pre-intervention measurement
have the rate of meal tray documentation at 54% and 42%, respectively. The week of
implementation and the week following have the rate of meal tray documentation at 72% and
80%, respectively. This would signify that the project was a success. However, the improvement
exhibited by the meal rate of documentation occurs throughout the duration of data collection,
and does not necessarily begin the week that the process change was implemented. It is possible
that merely studying patients’ nutritional status amplified the cognizance of the clinical problem
among staff members, which resulted in an ever-increasing consistency of meal intake
documentation. Nevertheless, the stated outcome of this project was to improve the rate of meal
documentation from the previous rate of roughly 50% to 80%. Given the initial results that 80%

IMPROVING NUTRITION MONITORING
45
of meals are being documented in the EHR, the intervention can be considered a success. For the
project to endure, the CNL must continue to enact the sustainability plan and continue to audit
the rate of meal documentation.
Implications for Practice
Though the post-intervention data is somewhat limited with regards to prolonged
sustainability, the preliminary post-intervention outcome suggests that this project successfully
improved the rate of meal documentation on the microsystem of interest. It should be noted that
the results of quality improvement projects cannot be generalized to other settings in the way that
the findings of a research study can be. Nonetheless, there may be implications for nursing
practice, patient outcomes, and the cost of delivering care. For instance, monitoring patients’
intake and providing care that maintains or improves a patient’s nutritional status is a basic
nursing skill, yet it is given lower priority than other aspects of patient care (Somanchi et al.,
2010). Consumers and payers of healthcare services have an expectation that patients will not
suffer from preventable complications related to insufficient nutrient and energy intake, yet, the
literature shows that maintaining the status quo yields insufficient results (White et al., 2012).
The consequence of failing to address patients’ nutritional status is associated with increased
rates of morbidity, mortality, length of stay, and infections (Meehan et al. 2016). Not only does
inadequate nutritional care result in needless patient suffering, complications that are associated
with malnutrition increase the cost of care. Tappenden et al. (2013) shows that treating
malnourished patients with oral supplements resulted in a cost savings of $4734 and reduces the
LOS by 20%.

IMPROVING NUTRITION MONITORING
46
The protocol developed in this project addresses a phenomenon that is not unique to the
microsystem of interest and given the strong upside potential it may be appropriate to apply this
protocol to other microsystems in the organization. The literature suggests that half of all patients
are malnourished and 69% of patients experience a decline in their nutritional status during their
hospital stay (Somanchi et al., 2010). The goal of this project is to improve nurses’ ability to
monitor their patients’ nutritional intake by encouraging more thorough documentation of meal
consumption. More effective monitoring of patients’ nutritional status may diminish the rate of
or the severity of nutritional deterioration that patients experience.
Project Limitations
There are limitations to the project that merit a discussion. The two prominent
shortcomings of the project involve failing to meet expectations. At the outset, the MSN student
believed the scope of the project was that the intervention would incorporate a novel way to treat
malnourished patients, beyond the current mechanism of providing food. That is to say, the
intervention would not merely be to enhance detection and monitoring of nutrition but do more
to intervene, once the at-risk patients were identified. However, the evidence suggests that
simply identifying patients who are malnourished is a fairly ambitious task and is the starting
point for addressing nutritional issues in this population. Additionally, supporting an essential
nursing role of monitoring patients’ meal intake is a necessary first step to implementing more
intensive interventions.
The other limitation of the project is the method of data collection. The final version of
the automated EHR auditing report still does not adequately perform its intended function. The
intent behind creating an automated method for evaluating the EHR was to reduce the time and

IMPROVING NUTRITION MONITORING
47
labor involved in auditing the EHR for compliance with meal documentation. However, sorting
out the irrelevant data that accompanies the valuable information is still burdensome. The nature
of how the EHR is built and the way it functions bears responsibility.
Enactment of MSN Essentials
Besides improving the operations of the microsystem of interest, this project provided an
opportunity for the MSN student to enact several of the MSN Essentials. Demonstrating
proficiency in the nine MSN Essentials is a critical part of the curriculum (American Association
of Colleges of Nursing, 2013). The MSN student demonstrated competency in Essential II
(Organizational and Systems Leadership for Quality Improvement and Systems Thinking). The
MSN student used systems theory to evaluate the delivery of care in a complex organization by
assessing the delivery of nutritional care on the microsystem and determined how multiple
components of the system interact to affect patient outcomes.
Essential III (Clinical Scholarship and Analytical methods for Evidence-Based Practice)
was enacted by the MSN student by first performing a microsystem assessment to identify
clinical problems. Using the DMAIC framework, the student applied problem solving
techniques, such as root cause analysis (RCA), to identify the cause of the clinical problem.
Results from the RCA and evidence from the literature informed the design of an intervention.
Performance measures were created to evaluate the effectiveness of the protocol. After the
protocol was implemented, the outcomes were compared to the pre-implementation data to
demonstrate that the intervention lead to higher quality care.
Aspects of Essential IV (Translating and Integrating Scholarship into Practice) were
realized throughout the project. For example, during the analysis and improve phases of the
IMPROVING NUTRITION MONITORING
48
project the MSN student diligently reviewed the available literature related to the clinical
problem and incorporated the best evidence in the protocol development. Furthermore, the MSN
student performed a gap analysis to interpret the discrepancy between the desired state of
nutritional monitoring and the current practices observed on the microsystem. The organization’s
policies and procedures were reviewed to determine the expectations of the desired state. The
protocol was influenced by the evidence provided in the literature and by the standards
determined by the institution.
The MSN student proficiently used technology in the clinical setting thereby satisfying
Essential V (Informatics and Healthcare Technologies). The student studied the electronic health
record (EHR) system in great detail and became familiar with the capabilities and restrictions of
the system. Though there were many frustrating limitations of the system, an automated report
was created with the help of a technology specialist. Since the report is integrated with the EHR
it is used to audit compliance with the documentation requirement of the protocol.
The entire project depended on fostering participation from the various stakeholder
groups. The MSN student actualized Essential VII (Interprofessional Collaboration for
Improving Patient and Population Health Outcomes) by developing leadership skills which were
necessary to facilitate the development of the intervention by willing participants. Relationships
were developed with individuals who represent different microsystems and who have diverse
objectives. As the leader of the team, the student was responsible for creating an
interprofessional coalition of stakeholders who supported the project by analyzing the root
causes of the clinical problem, brain storming solutions, and providing feedback to improve the
intervention.

IMPROVING NUTRITION MONITORING
49
Ultimately the MSN student enacted Essential IX (Masters Level Nursing Practice).
Patients on the microsystem were assessed to determine their actual and potential health risks.
With the participation of many others, the MSN student designed an intervention targeted at
improving patient health outcomes by modifying the delivery of nursing care on the
microsystem. The intervention developed in this project may bolster RNs’ resolve to continue
providing the best nutrition related care to all patients.
Conclusion
The results of a microsystem assessment indicated that even routine microsystem
processes have the potential to be optimized. Additionally, it demonstrated that the monitoring of
fundamental patient needs, such as nutritional intake, can be overlooked. Subsequently, a team of
key stakeholders was assembled to perform a more in-depth analysis of the situation and
brainstorm potential solutions. The provision of nutrition related care is a complex process
spanning multiple microsystems, hence, multiple groups of stakeholders were invited to
participate. DMAIC, a valid quality improvement framework, was used to guide the project plan.
The team’s efforts resulted in the recommendation to implement a series of coordinated steps,
that were designed to improve the rate of meal documentation and streamline workflow. The
new standard process, developed by the quality improvement team, was successful. Meal intake
documentation rates increased from 54%, prior to implementation, to 80%. The new process is
popular among staff members because it makes their workflow more predictable. However, the
long-term sustainability of the project relies on continued staff engagement and regularly
auditing the EHR using the automated report.

IMPROVING NUTRITION MONITORING
50
References
Agarwal, E., Ferguson, M., Banks, M., Bauer, J., Capra, S., & Isenring, E. (2013). An
exploratory study to evaluate whether medical nutrition therapy can improve dietary
intake in hospital patients who eat poorly. Journal of Human Nutrition and Dietetics,
26(6), 538-543. doi:10.1111/jhn.12173
American Association of Colleges of Nursing (2013). Competencies and curricular expectations
for clinical nurse leader education and practice. Retrieved from
http://www.aacn.nche.edu/cnl/CNL-Competencies-October-2013.pdf
Baldwin, C., Kimber, K. L., Gibbs, M., & Weekes, C. E. (2016). Supportive interventions for
enhancing dietary intake in mal-nourished or nutritionally at-risk adults. Cochrane
Database of Systematic Reviews 2016, Issue 12. Art. No.: CD009840.
doi:10.1002/14651858.CD009840.pub2.
Bally, M. R., Blaser Yildirim, P. Z., Bounoure, L., Gloy, V. L., Mueller, B., Briel, M., &
Schuetz, P. (2016). Nutritional support and outcomes in malnourished medical inpatients:
A systematic review and meta-analysis. JAMA Internal Medicine, 176(1), 43-53.
doi:10.1001/jamainternmed.2015.6587
Berrut, G., Favreau, A. M., Dizo, E., Tharreau, B., Poupin, C., Gueringuili, M., . . . Ritz, P.
(2002). Estimation of calorie and protein intake in aged patients: Validation of a method
based on meal portions consumed. The Journals of Gerontology. Series A, Biological
Sciences and Medical Sciences, 57(1), M52-M56. doi:10.1093/gerona/57.1.M52
Blair, W., & Smith, B. (2012). Nursing documentation: Frameworks and barriers. Contemporary
Nurse, 41(2), 160-168. doi:10.5172/conu.2012.41.2.160

IMPROVING NUTRITION MONITORING
51
Bounoure, L., Gomes, F., Stanga, Z., Keller, U., Meier, R., Ballmer, P., . . . Members of the
Working Group. (2016). Detection and treatment of medical inpatients with or at-risk of
malnutrition: Suggested procedures based on validated guidelines. Nutrition, 32(7-8),
Bjornsdottir, R., Oskarsdottir, E. S., Thordardottir, F. R., Ramel, A., Thorsdottir, I., &
Gunnarsdottir, I. (2013). Validation of a plate diagram sheet for estimation of energy and
protein intake in hospitalized patients. Clinical Nutrition (Edinburgh, Scotland), 32(5),
746. doi:10.1016/j.clnu.2012.12.007
Budiningsari, D., Shahar, S., Manaf, Z. A., & Susetyowati, S. (2016). A simple dietary
assessment tool to monitor food intake of hospitalized adult patients. Journal of
Multidisciplinary Healthcare, 9, 311-322. doi:10.2147/JMDH.S105000
Corrigan, M. L., Escuro, A. A., Celestin, J., & Kirby, D. F. (2011). Nutrition in the stroke
patient. Nutrition in Clinical Practice, 26(3), 242-252. doi:10.1177/0884533611405795
De Mast, J., & Lokkerbol, J. (2012). An analysis of the six sigma DMAIC method from the
perspective of problem solving. International Journal of Production Economics, 139(2),
604-614. doi:10.1016/j.ijpe.2012.05.035
Deutz, N. E., Matheson, E. M., Matarese, L. E., Luo, M., Baggs, G. E., Nelson, J. L., . . .
NOURISH Study Group. (2016). Readmission and mortality in malnourished, older,
hospitalized adults treated with a specialized oral nutritional supplement: A randomized
clinical trial. Clinical Nutrition (Edinburgh, Scotland), 35(1), 18-26.
doi:10.1016/j.clnu.2015.12.010s
Dupertuis, Y. M., Kossovsky, M. P., Kyle, U. G., Raguso, C. A., Genton, L., & Pichard, C.
(2003). Food intake in 1707 hospitalised patients: A prospective comprehensive hospital
IMPROVING NUTRITION MONITORING
52
survey. Clinical Nutrition, 22(2), 115-123. doi:10.1054/clnu.2002.0623
Førli, L., Oppedal, B., Skjelle, K., & Vatn, M. (1998). Validation of a self-administered form for
recording food intake in hospital patients. European Journal of Clinical Nutrition,
52(12), 929-933. doi:10.1038/sj.ejcn.1600667
Hafsteinsdóttir, T. B., Mosselman, M., Schoneveld, C., Riedstra, Y. D., & Kruitwagen, Cas L J J.
(2010). Malnutrition in hospitalised neurological patients approximately doubles in 10
days of hospitalisation. Journal of Clinical Nursing, 19(5-6), 639-648.
doi:10.1111/j.1365-2702.2009.03142.x
Harris, J. L., Roussel, L., & Thomas, P. L. (2014). Initiating and sustaining the clinical nurse
leader role: A practical guide (2nd ed.). Burlington, MA: Jones & Bartlett Learning.
Husted, M. M., Fournaise, A., Matzen, L., & Scheller, R. A. (2017). How to measure energy and
protein intake in a geriatric department – A comparison of three visual methods. Clinical
Nutrition ESPEN, 17, 110-113. doi:10.1016/j.clnesp.2016.10.002
Kalisch, B. (2006). Missed nursing care - A qualitative study. Journal of Nursing Care
Quality, 21(4), 306-313. doi:10.1097/00001786-200610000-00006
Kandiah, J., Stinnett, L., & Lutton, D. (2006). Visual plate waste in hospitalized patients: Length
of stay and diet order. Journal of the American Dietetic Association, 106(10), 1663-1666.
doi:10.1016/j.jada.2006.07.015
Kawasaki, Y., Sakai, M., Nishimura, K., Fujiwara, K., Fujisaki, K., Shimpo, M., & Akamatsu, R.
(2016). Criterion validity of the visual estimation method for determining patients' meal
intake in a community hospital. Clinical Nutrition, 35(6), 1543-1549.
doi:10.1016/j.clnu.2016.04.006

IMPROVING NUTRITION MONITORING
53
Kruizenga H.M., Wierdsma N.J., van Bokhorst M.A., de van der Schueren, Haollander H.J.,
Jonkers-Schuitema C.F., … van Staveren W.A. (2003). Screening of nutritional status in
the netherlands. Clinical Nutrition, 22(2), 147-152. doi:10.1054/clnu.2002.0611
Langley, G. J., (2009). The improvement guide: A practical approach to enhancing
organizational performance (2nd ed.). San Francisco: Jossey-Bass.
Linderman, K., Schroeder, R. G., Zaheer, S., & Choo, A. S. (2003). Six sigma: A goal-theoretic
perspective. Journal of Operations Management, 21(2), 193-203. doi:10.1016/S0272-
6963(02)00087-6
Meehan, A., Loose, C., Bell, J., Partridge, J., Nelson, J., & Goates, S. (2016). Health system
quality improvement: Impact of prompt nutrition care on patient outcomes and health
care costs. Journal of Nursing Care Quality, 31(3), 217.
Nelson, E. C., Batalden, P. B., Godfrey, M. M., & Lazar, J.S. (2011). Value by design:
Developing clinical microsystems to achieve organizational excellence. (2nd ed.). San
Fransisco, CA: Jossey-Bass.
Ockenga, J., Freudenreich, M., Zakonsky, R., Norman, K., Pirlich, M., & Lochs, H. (2005).
Nutritional assessment and management in hospitalised patients: Implication for DRG-
based reimbursement and health care quality. Clinical Nutrition, 24(6), 913-919.
doi:10.1016/j.clnu.2005.05.019
Palmer, M., Miller, K., & Noble, S. (2015). The accuracy of food intake charts completed by
nursing staff as part of usual care when no additional training in completing intake tools
is provided. Clinical Nutrition (Edinburgh, Scotland), 34(4), 761-766.
doi:10.1016/j.clnu.2014.09.001

IMPROVING NUTRITION MONITORING
54
Perry, L., Hamilton, S., Williams, J., & Jones, S. (2013). Nursing interventions for improving
nutritional status and outcomes of stroke patients: Descriptive reviews of processes and
outcomes: Nursing nutritional interventions for stroke patients. Worldviews on Evidence-
Based Nursing, 10(1), 17-40. doi:10.1111/j.1741-6787.2012.00255.x
Russell, C. A. (2007). The impact of malnutrition on healthcare costs and economic
considerations for the use of oral nutritional supplements. Clinical Nutrition Supplements,
2(1), 25-32. doi:10.1016/j.clnu.2007.04.002
Schroeder, R. G., Linderman, K., Liedtke, C., & Choo, A. S. (2008). Six sigma: Definition and
underlying theory. Journal of Operations Management, 26(4), 536-554.
doi:10.1016/j.jom.2007.06.007
Shankar, R. (2009). Process improvement using six sigma: A DMAIC guide. Milwaukee,
Wisconsin: ASQ Quality Press.
Somanchi, M., Tao, X., & Mullin, G. E. (2011). The facilitated early enteral and dietary
management effectiveness trial in hospitalized patients with malnutrition. Journal of
Parenteral and Enteral Nutrition, 35(2), 209-216. doi:10.1177/0148607110392234
Sura, L., Madhavan, A., Carnaby, G., & Crary, M. A. (2012). Dysphagia in the elderly:
Management and nutritional considerations. Clinical Interventions in Aging, 7, 287-298.
doi:10.2147/CIA.S23404
Tappenden, K. A., Quatrara, B., Parkhurst, M. L., Malone, A. M., Fanjiang, G., & Ziegler, T. R.
(2013). Critical role of nutrition in improving quality of care: An interdisciplinary call to

IMPROVING NUTRITION MONITORING
55
action to address adult hospital malnutrition. Journal of Parenteral and Enteral
Nutrition, 37(4), 482-497. doi:10.1177/0148607113484066
Toussaint, J. S., & Berry, L. L. (2013). The promise of lean in health care. Mayo Clinic
Proceedings, 88(1), 74-82. doi:10.1016/j.mayocp.2012.07.025
Vest, J. R. & Gamm, L. D. (2009). A critical review of the research literature on Six Sigma, Lean
and StuderGroup's Hardwiring Excellence in the United States: The need to demonstrate
and communicate the effectiveness of transformation strategies in healthcare.
Implementation Science, 4(35). doi: 10.1186/1748-5908-4-35.
Wang, N., Dong, Y., Huo, T., Shao, Y., Xing, W., & Li, S. (2016). Nutritional risk, malnutrition
and nutritional support among hospitalized patients in orthopedics/spinal surgery of a
hohhot teaching hospital. Asia Pacific Journal of Clinical Nutrition, 25(2), 273-282.
doi:10.6133/apjcn.2016.25.2.26
Warner, C. J., Walsh, D. B., Horvath, A. J., Walsh, T. R., Herrick, D. P., Prentiss, S. J., &
Powell, R. J. (2013). Lean principles optimize on-time vascular surgery operating room
starts and decrease resident work hours. Journal of Vascular Surgery, 58(5), 1417.
doi:10.1016/j.jvs.2013.05.007
White, J. V., Guenter, P., Jensen, G., Malone, A., Schofield, M., Academy Malnutrition Work
Group, . . . and the A.S.P.E.N. Board of Directors. (2012). Consensus statement:
Academy of nutrition and dietetics and american society for parenteral and enteral
nutrition: Characteristics recommended for the identification and documentation of adult
malnutrition (undernutrition). Journal of Parenteral and Enteral Nutrition, 36(3), 275-
283. doi:10.1177/0148607112440285

IMPROVING NUTRITION MONITORING
56
Wirth, R., Smoliner, C., Jäger, M., Warnecke, T., Leischker, A. H., Dziewas, R., & DGEM
Steering Committee. (2013). Guideline clinical nutrition in patients with stroke.
Experimental & Translational Stroke Medicine, 5(1), 14. doi:10.1186/2040-7378-5-14
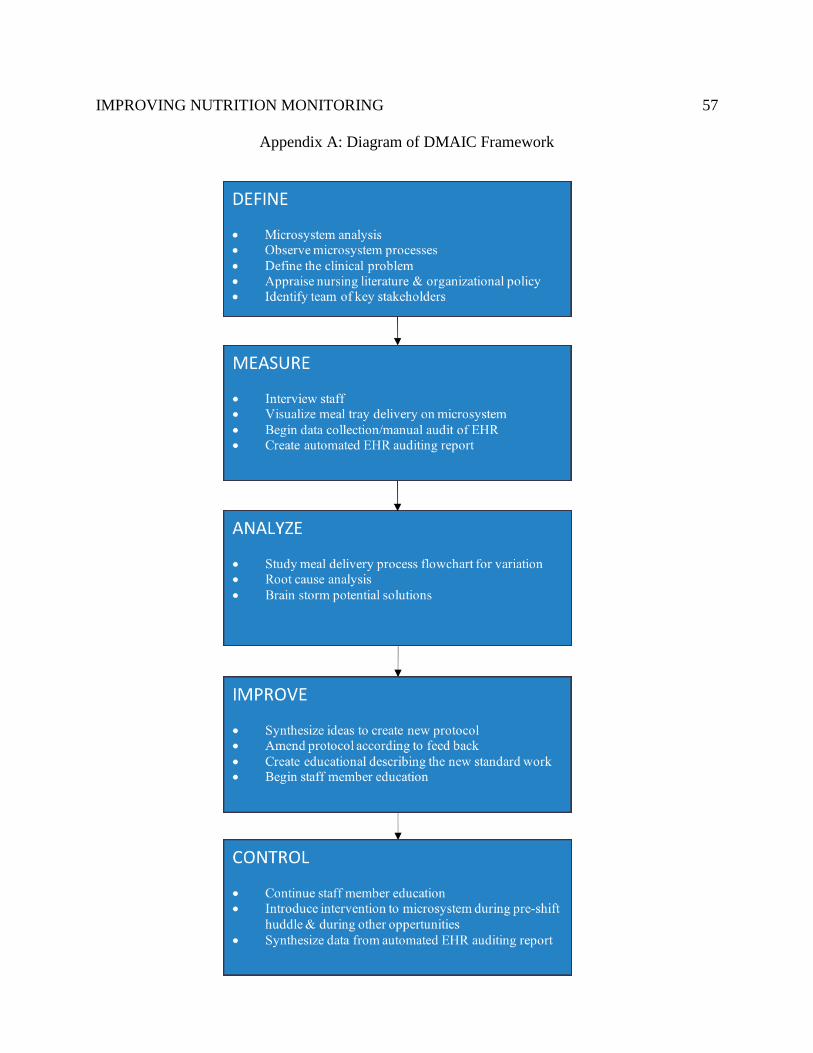
IMPROVING NUTRITION MONITORING
57
Appendix A: Diagram of DMAIC Framework
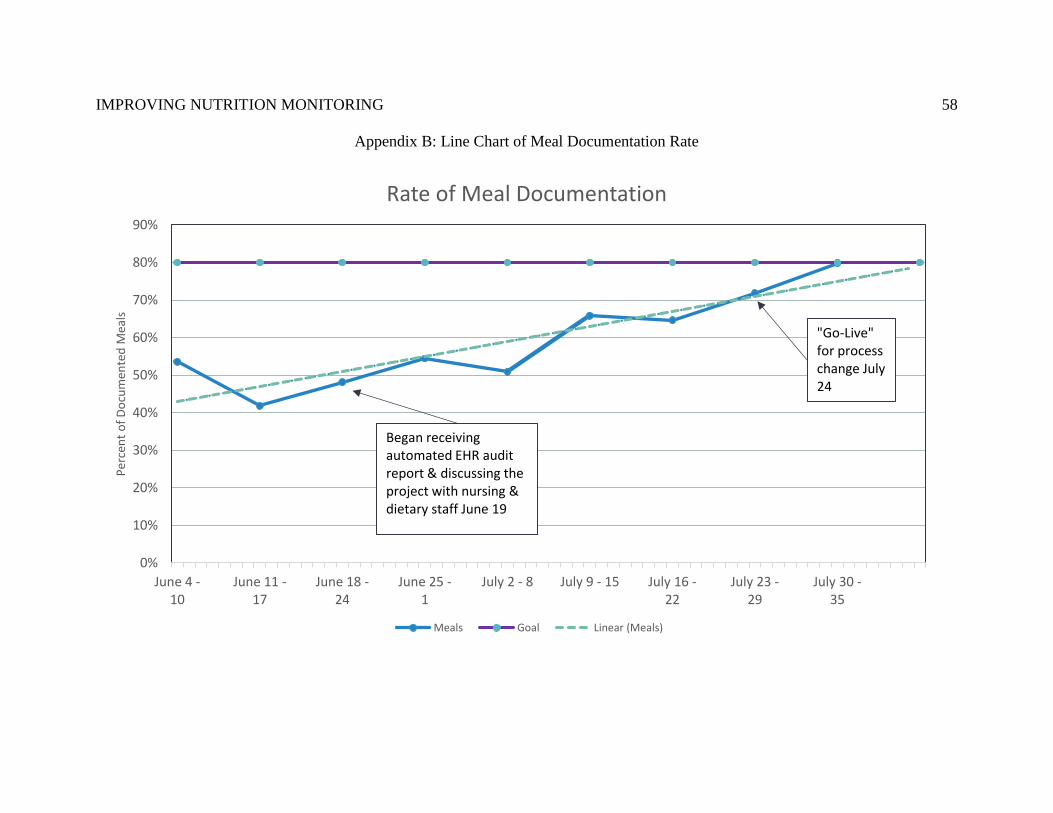
IMPROVING NUTRITION MONITORING
58
Appendix B: Line Chart of Meal Documentation Rate
0%
10%
20%
30%
40%
50%
60%
70%
80%
90%
June 4 -10
June 11 -17
June 18 -24
June 25 -1
July 2 - 8 July 9 - 15 July 16 -22
July 23 -29
July 30 -35
Per
cen
t o
f D
ocu
men
ted
Mea
ls
Rate of Meal Documentation
Meals Goal Linear (Meals)
Began receiving automated EHR audit report & discussing the project with nursing & dietary staff June 19
"Go-Live"for process change July 24

IMPROVING NUTRITION MONITORING
59
Appendix C: Pre-intervention Meal Tray Delivery Process Flowchart
Tablet application (CBORD) shows the tray runner (TR) that a meal is waiting in the kitchen warming cart
TR picks up tray from cart & changes the custody/location of the tray within the CBORD app
CBORD app & meal slip are checked to verify the room number where the meal is to be delivered
TR checks the CBORD app for used trays to pick-up or trays that are ready for delivery
in 60 minutes, the CBORD system will flag the tray as being ready for pick-up
the TR changes custody/location of the tray within the CBORD app, asks for two patient identifiers, & delivers the tray
if the RN can't be reached, the TR will call the PCA - Depending on the TR, a PCA may be called first
if the meal slip is for carb. count or diabetic diet - tray runner calls RN to verify if the POC blood glucose was taken
meal tray is placed on the TR's cart & walked up to clinical unit

IMPROVING NUTRITION MONITORING
60
Appendix D: Root Cause Analysis
Gap in nutrition intake documentation between policy and practice
Technology Policies
Environment People Procedures
timing of tasks on CBORD
difficulty navigating EHR
compliance with standard
no tray delivery
delegation / communication
lack of knowledge
scheduling room service meal delivery
tray placement / room layout
competing time demands
tray pick-up
orientation competency
staff lunch
interval of screening
patient orientation

IMPROVING NUTRITION MONITORING
61
Appendix E: Post-intervention Meal Tray Delivery Process Flowchart
TRAY RUNNER delivers meal tray to bedside table
TRAY RUNNER places meal ticket on computer table in patient's room
Patient eats meal, with assist of nursing staff - if necessary
PCA or RN places used meal tray in designated location – top shelf of the patient’s closet or in the soiled utility
PCA or RN documents the meal, including percentage intake, in IView
TRAY RUNNER picks-up completed meal trays at 1000, 1400, & 2000
*
RN assesses meal intake and menu selection daily
PCA rounds on patients before tray runner pick-up times
* If patient has inadequate meal intake or menu selection for 1-2 days or NPO
≥ 3 days - notify clinical dietitian via pager (397-1452) or during multidisciplinary rounds

IMPROVING NUTRITION MONITORING
62
Appendix F: Standard Process Document
Standard Process for Meal Tray Delivery, Removal, & Nutrition
Documentation STANDARD WORK FOR- RN, PCA, TR This document outlines the process for nutrition delivery, documentation and monitoring.
Request:
□ Requesting to implement a process change that is designed to improve nutrition monitoring & documentation.
□ Similar to the current process, though it adds more structure to the workflow and assigns responsibilities to employees in different job categories (i.e., RN,
PCA, TR).
□ Please validate that you’ve received the education (self-validation check sheet is posted on bulletin board near time clock).
□ Start date is July 24.
Tray Delivery:
□ Meals delivered to bedside table by tray runner.
□ Meal ticket placed on computer table.
o Meal ticket is used to provide information about carb. counts, calorie counts, and to aide in documentation.
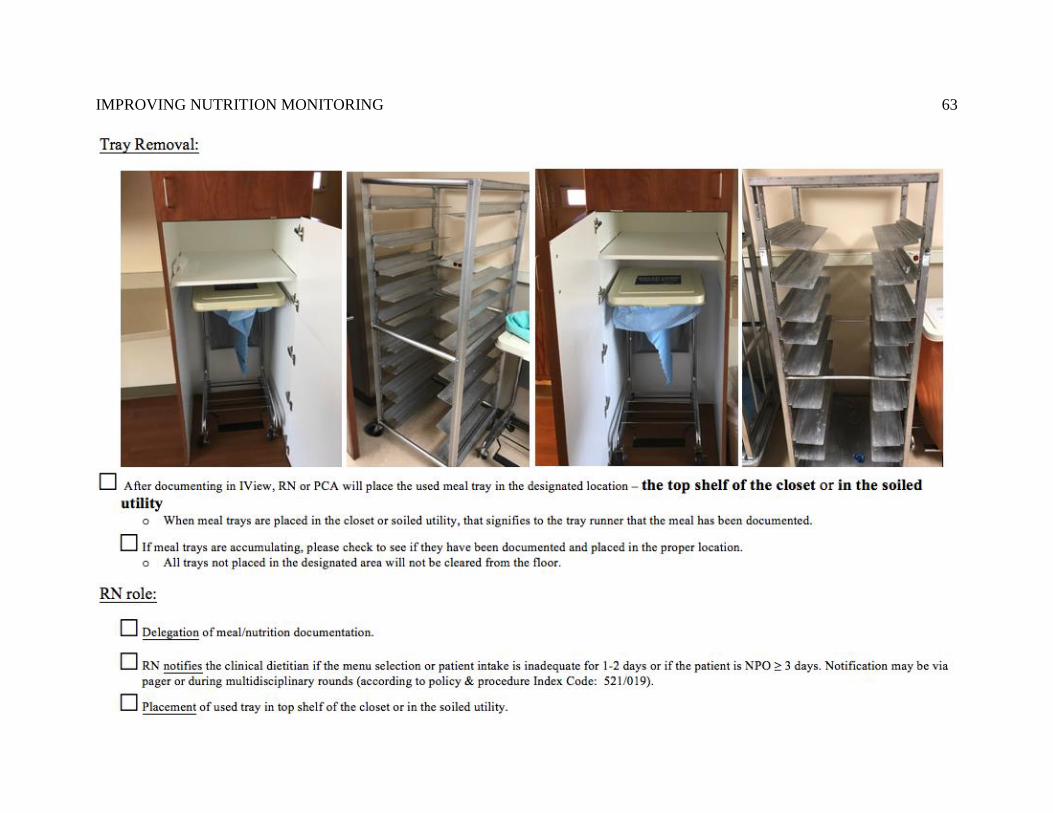
IMPROVING NUTRITION MONITORING
63

IMPROVING NUTRITION MONITORING
64

IMPROVING NUTRITION MONITORING
65

IMPROVING NUTRITION MONITORING
66

IMPROVING NUTRITION MONITORING
67
IMPROVING NUTRITION MONITORING
68
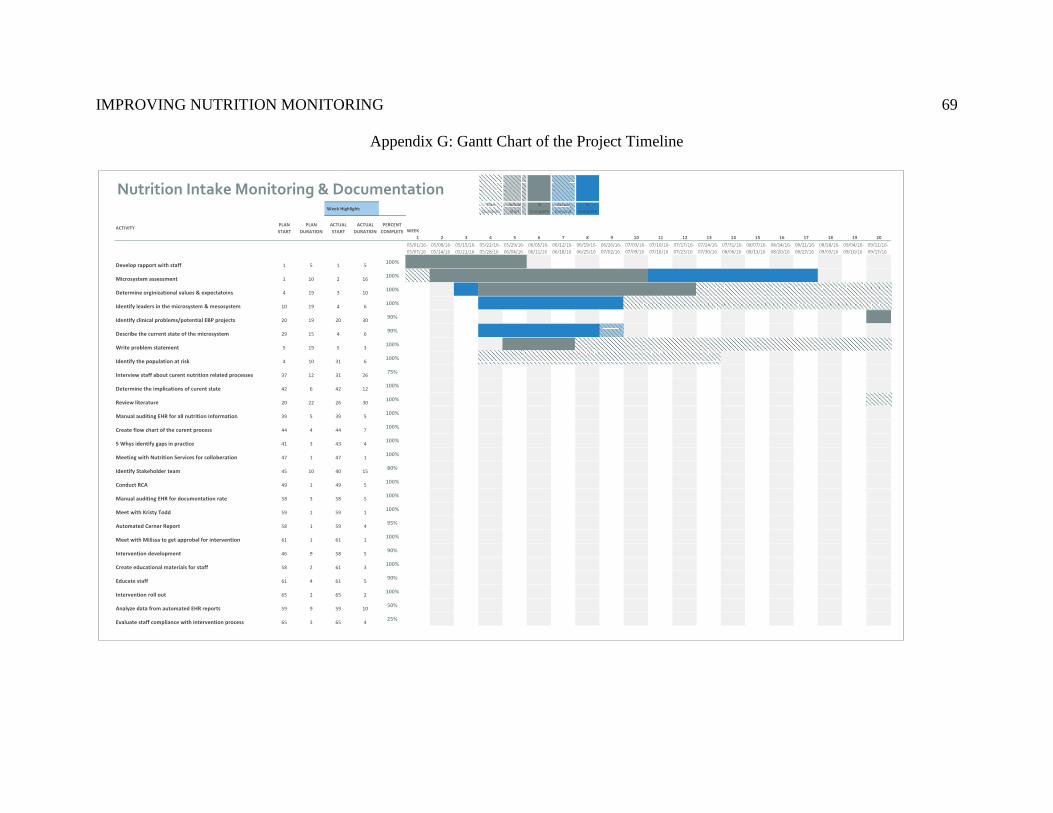
IMPROVING NUTRITION MONITORING
69
Appendix G: Gantt Chart of the Project Timeline

IMPROVING NUTRITION MONITORING
70

IMPROVING NUTRITION MONITORING
71