Evidence-based policy-making in the Pacific: … · Kiribati 20.4 39.9 Nauru 16.2 58.1 Niue 38.4...
17
Evidence-based policy-making in the Pacific: developing targeted food and nutrition policies using Household Income and Expenditure Survey data Tim Martyn Policy Officer Food and Agriculture Organisation
Transcript of Evidence-based policy-making in the Pacific: … · Kiribati 20.4 39.9 Nauru 16.2 58.1 Niue 38.4...

Evidence-based policy-making in the Pacific: developing targeted food and nutrition policies using
Household Income and Expenditure Survey data
Tim Martyn
Policy Officer
Food and Agriculture Organisation

What are statistics for?
• We know what statistics are
• Why do we collect them?
• Informing effective, evidence-based policy
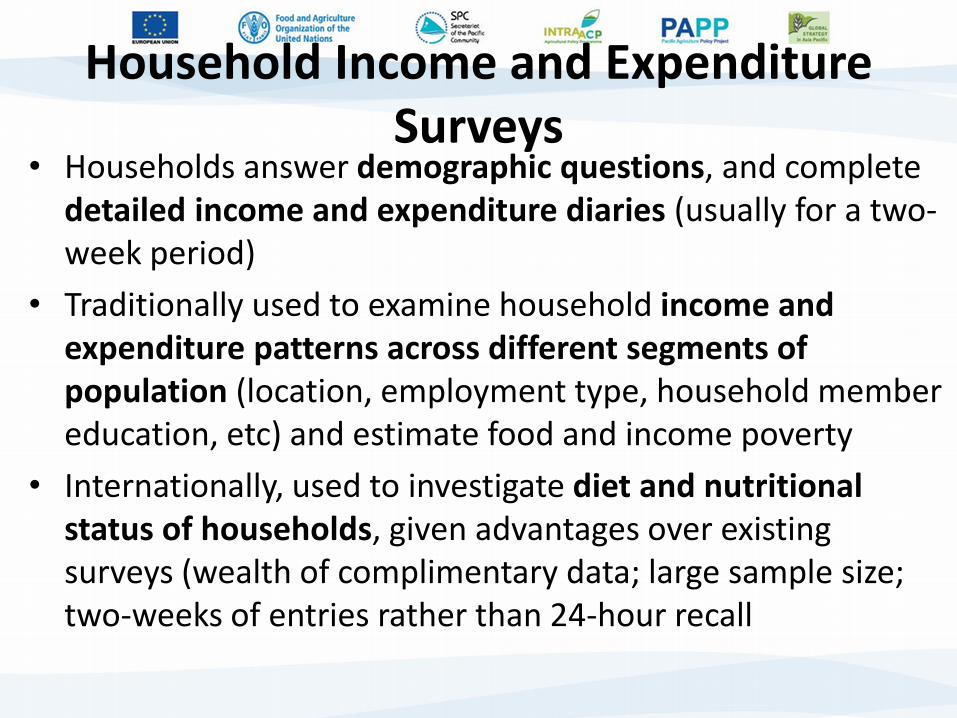
Household Income and Expenditure Surveys
• Households answer demographic questions, and complete
detailed income and expenditure diaries (usually for a two-week period)
• Traditionally used to examine household income and expenditure patterns across different segments of population (location, employment type, household member education, etc) and estimate food and income poverty
• Internationally, used to investigate diet and nutritional status of households, given advantages over existing surveys (wealth of complimentary data; large sample size; two-weeks of entries rather than 24-hour recall

Poor diet, nutrition and NCDS have
increasingly come into focus among PICs
Country Diabetes rate (%) Obesity rates (%)
Cook Islands 23.6 61.4
FSM 32.1 42.6
Fiji 12.9 18.0
Kiribati 20.4 39.9
Nauru 16.2 58.1
Niue 38.4 61.0
Palau - -
PNG 13.3 16.2
RMI 37.2 31.6
Samoa 22.0 54.7
Solomon Islands 17.7 23.7
Tonga 17.5 57.6
Tuvalu - 58.7
Vanuatu 21.2 18.8
AVERAGE 22.7 40.3

Improving PIC resilience to food and nutritional insecurity, and reduction
of NCDs, is a priority

Policy lens moving from ‘basic needs’ to adequate diet
• Minimum calories not the issue for many PICs (nutrition transition improved access to calories, impoverished diet) therefore need to move beyond kcal only food poverty lines to identifying populations not accessing an adequate diet
• Ask what is the cost (and who lacks access) to a diet sufficient to live in state of good health (taking into account age and sex, level of physical activity) including
- minimum and maximum daily intake for kcal, with the correct proportion from protein, fat and sugar;
- getting intake above minimum for range of micronutrients, like iron, vitamin a;
- not too much certain micronutrients, like sodium; • Use HIES to identify populations suffering poor diet and target
policy interventions to improve nutrition/reduce NCDs

Methodology for converting HIES food expenditure to nutrition info
We adapted WB/FAO methodology to Pacific context: - Included fat, sodium and protein in addition
to calories (kcal), vitamin A and iron - Establish ADER/RDI/UL for (by age and sex)
based on average height and weight (BMI) and physical activity (PAL) (not 5% percentile)
- Convert food expenditure into nutrition information using Pacific Food Composition Tables (FAO/USP/SPC)
- Also provided more detailed investigation of sub-populations (location, household demographics, etc) combined factors important to livelihoods in Pacific context (subsistence income, gift expenditure, etc)

Doing this accurately is a lot of work (1)! After establishing thresholds:
1. Match COICOP codes in HIES diaries with food composition table entries to define nutrients/calories per 100g estimate
2. Determine AME for each nutrient

Doing this accurately is a lot of work(2)!
code type sub-category food item code weight kg conversion factor 100g
3 bundle cooking banana 11103 6 60 3 bundle ripe banana 11132 2 20
4 bag Fiji taro/Island taro/water taro 11211 15 150
4 bag yam 11208 15 150 4 bag kumala 11209 15 150 4 bag potatoes 11210 20 200 4 bag manioc 11203 20 200 4 bag cooking banana 11103 15 150
4 bag seafood 12116, 12303, 12350 5 50 4 bag rice 13207 2 20 4 bag flour 13209 20 200
4 bag nuts 16026, 11104, 11107, 11108 2 20
4 bag fruit 11103, 11110,
11212, 11132, 11247 5 50 5 Loaf bread, coconut bread 13101, 13103 0.5 5
6 fruit nuts 16026, 111104,
11107, 11108 0.1 1
6 fruit onion, corn, carrot, tomato
11111, 11204, 11214, 11216, 11232, 11245 0.15 1.5
6 Fruit organge, apple, mango lime
11101, 11109, 11111, 11110 0.25 2.5
Food Item EP%
kumala 83
manioc 75
yam 86
taro 82
chinese cabbage 79
island cabbage 69
carrots 92
pumpkin 68
ripe bananna 71
cooking banana 66
breadfruit 55
mangoes 62
watermelon 53
papaya 66
pineapple 64
coconut cream 15
peanuts 75
corn 38
3. Standardization of the 4. Adjustment for
quantities into grams nonedible portions

Enables detailed dietary insight into sub-populations (location, income, education..
etc VARIABLES Overall Rural Urban
VANUATU: RURAL V URBAN n=3957 n=3037 n=920
Average monthly income (Vt) 86,021.28 83,145.72 95,513.73
Av. monthly expenditure food (Vt) 42,652.37 43,429.44 40,087.19
Caloric Intake (AME) 3,154.80 3,224.51 2,924.69
Calories >150% ADER 0.18 0.19 0.16
Calories <50% ADER 0.12 0.1 0.16
Fat >150% UL 0.09 0.09 0.10
Fat <50% RDI 0.18 0.19 0.13
Sodium >150% UL 0.15 0.12 0.23
Sodium <50% RDI 0.21 0.24 0.09
Protein < 50% of RDI 0.05 0.06 0.05
Iron <50% RDI 0.06 0.03 0.14
Vit. A <50% RDI 0.08 0.07 0.13

And which of these factors contribute most to poor dietary outcomes
(1) (2) (3) (4) (5) (6) (7) (8) (9)
VARIABLES
Meets all RDI
and UL
Calories
<50% ADER
Sodium
<50%
RDI
Sodium
>150%
UL
Fat
<50%
RDI
Fat
> 150%
UL
Protein
<50%
RDI
Iron
<50%
RDI
Vit. A
<50%
RDI
Household head is female 0.05 -0.14+ -0.14* 0.13 -0.16* 0.10 -0.15 0.03 -0.21*
HHH age is <25 or >65 -0.00+ -0.00* -0.00 0.00 0.00 -0.00 -0.00 -0.01** -0.00
Household head has obtained post-
primary education -0.01 0.00 -0.03** 0.03* -0.01 0.02 -0.03 -0.02 -0.01
Ratio of dependents to adults -0.23** 0.43** 0.44** -0.55** 0.32** -0.46** 0.31** 0.42** 0.28**
Modern cooking fuel (gas, electricity,
kerosene) 0.00 -0.18* -0.08 0.31** -0.17** 0.19* -0.05 -0.12 -0.11
Household in urban location -0.49** 0.59** 0.01 0.05 0.03 -0.09 0.44** 0.71** 0.46**
Household wage labour income rate -0.02* -0.01 -0.04** 0.00 -0.01* 0.01 -0.03** 0.02* 0.01
Observations 3,833 3,833 3,833 3,833 3,833 3,833 3,833 3,833 3,833
chi2 92.74 63.96 149.4 52.36 53.18 18.68 54.74 62.77 84.97

HIES enables policy-makers to identify foods contributing most to obesity and NCDs
Contribution to Samoan Dieta Average nutrient density of foods in Samoab
Commodity Description
Calories
(%
Share)
Sodium
(% Share)
Fat (%
Share)
Protein (%
Share)
Mean
Energy
content
(Kj/100g)
Mean Fat
content
(%)
Mean
Sugar
content (%)
Mean
Sodium
content
(mg/100g)
Confectionary 8 1 1 0 1266 13 56 94
Cakes, sweet biscuits etc 2 2 3 2 1938 19 31 356
Savoury snacks 2 3 4 1 2039 23 8 667
Beverages 2 1 5 3 374 2 17 56
Edible ices 1 0 2 1 754 9 20 50
Breakfast cereals 0 0 0 0 1581 3 46 485
Other milk products 0 0 0 0 666 8 10 57
Cheese 0 0 0 0 1595 32 1 713
Convenience foods 1 9 2 1 897 8 4 1236
Fats & oils 2 1 11 0 3030 81 0 328
Breads 3 7 2 3 956 6 7 551
Pasta, rice, grains 5 1 2 4 1514 10 2 314
Meat, poultry, fish, eggs 12 8 26 52 910 14 - 162
Processed meats (incl canned) 6 18 15 16 1041 18 4 904
Fruit & veg (fresh & frozen) 3 0 1 2 191 1 - 16
Processed fruit & vegetables 0 0 0 0 329 2 9 329
Sauces and spices 0 4 0 0 555 6 21 1685
Table Salt 0 41 0 0 0 0 0 38758
Coconut products 5 0 21 2 1289 29 - 11
Root crops 47 3 3 14 459 1 - 28
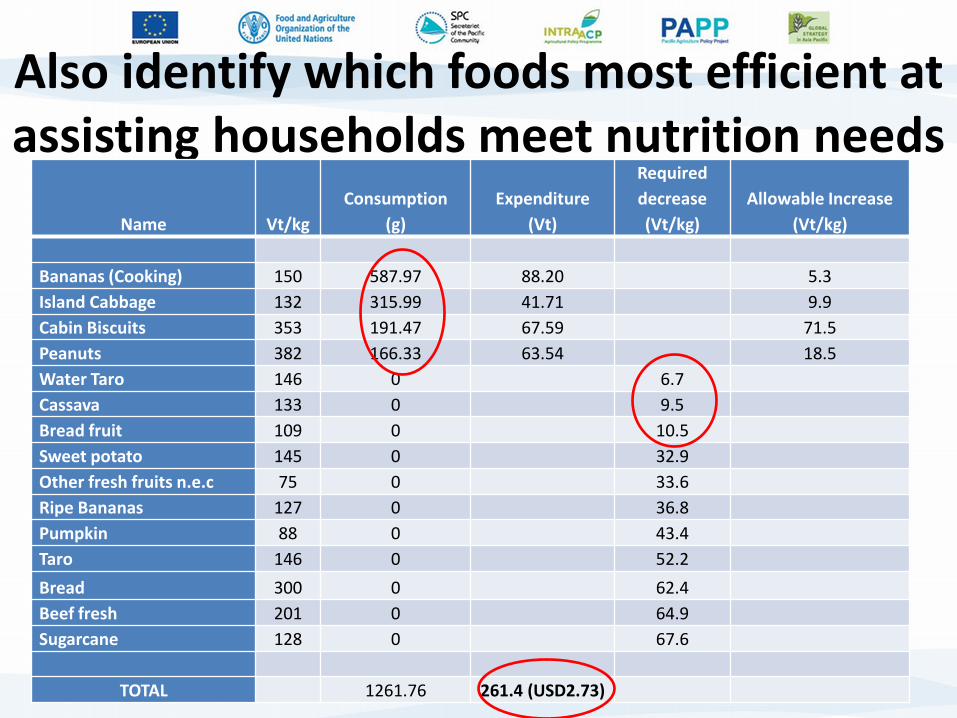
Also identify which foods most efficient at assisting households meet nutrition needs
Name Vt/kg
Consumption
(g)
Expenditure
(Vt)
Required
decrease
(Vt/kg)
Allowable Increase
(Vt/kg)
Bananas (Cooking) 150 587.97 88.20 5.3
Island Cabbage 132 315.99 41.71 9.9
Cabin Biscuits 353 191.47 67.59 71.5
Peanuts 382 166.33 63.54 18.5
Water Taro 146 0 6.7
Cassava 133 0 9.5
Bread fruit 109 0 10.5
Sweet potato 145 0 32.9
Other fresh fruits n.e.c 75 0 33.6
Ripe Bananas 127 0 36.8
Pumpkin 88 0 43.4
Taro 146 0 52.2
Bread 300 0 62.4
Beef fresh 201 0 64.9
Sugarcane 128 0 67.6
TOTAL 1261.76 261.4 (USD2.73)

Inform targeted policy interventions for assisting households most at risk of
poor nutrition outcomes • Pricing policies (excises) and tariff
reform (for f and v) to encourage substitution
• Multi-sector programs improving access to nutritious food and bev. for targeted groups (households in hardship via e-vouchers; school fruit programs)
• Investing in improving efficiency of production and marketing systems for select foods most efficient at improving diet among at risk hhs
Key messages • HIES data provides policy-makers with an
insight into food and nutritional security of households, by sub-population, in order to identify at risk groups
• HIES also identifies which foods contribute most to poor nutrition, and improved nutrition
• This enables PICs to design and implement policies which effectively target policy interventions

Road ahead FAO working in number of PICs using HIES to provide food and nutritional security insights to agriculture and health sector stakeholders:
• Vanuatu (launching report October 2015)
• Samoa (launching November 2015)
• FSM (beginning Nov 2015; aim to launch Jan 2015)
• Solomon Islands (beginning Nov 2015; launching Feb 2016)
Looking forward to more opportunities for collaboration with PICs and technical partners

Thankyou!