Everything you wanted to know about SEX (research budgets) but were afraid to ask.
32
Everything you wanted to know about SEX (research budgets) but were afraid to ask
-
Upload
melanie-phillips -
Category
Documents
-
view
241 -
download
0
Transcript of Everything you wanted to know about SEX (research budgets) but were afraid to ask.

Everything you wanted to know about SEX (research budgets) but were afraid to ask
Research Budgets and Funding FlowsDr Campbell Thomson, Director Office of Research Enterprise

Overview
• Context
• How does the Australian research funding system work?
• How do you construct a research budget?
• What is research infrastructure and why do we charge it?

2014-15 Federal Budget
(Approx. AU$415 Billion)

2014-15 Federal Budget
(Approx. AU$415 Billion)
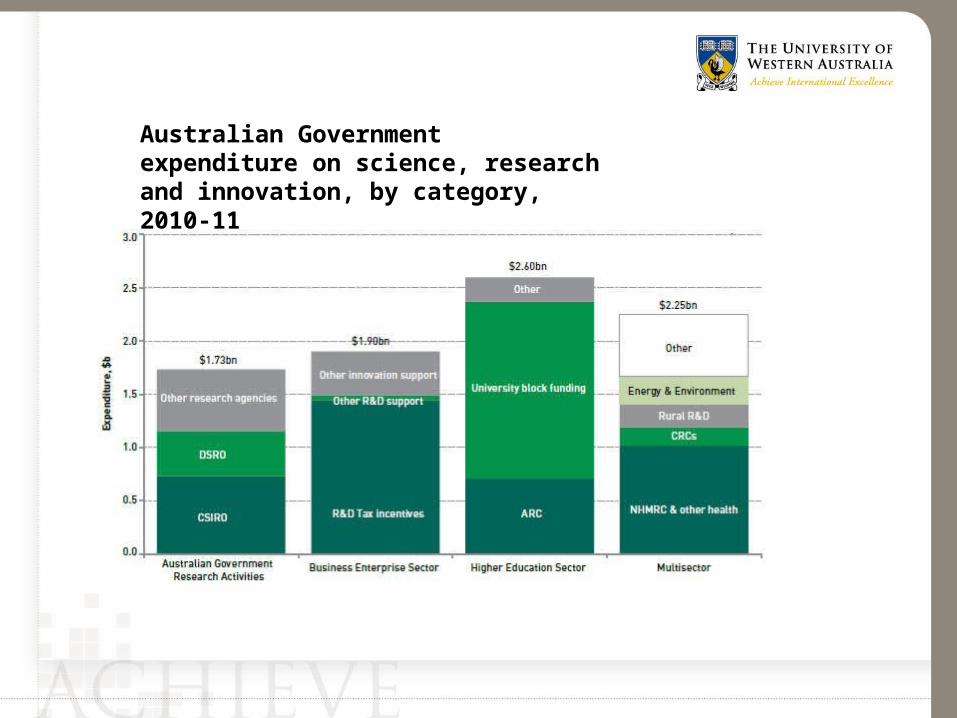
Australian Government expenditure on science, research and innovation, by category, 2010-11

Australian Government expenditure on science, research and innovation, by category, 2010-11

ARC NCGP funding by University ($m) 2007-2013
RUNIRUATNGo8Unaligned

Australian Government expenditure on science, research and innovation, by category, 2010-11

Australian dual funding system
• Competitive research grants encourage researchers to compete on quality and impact
• Research block funding provides a research base to allow institutions to make strategic choices
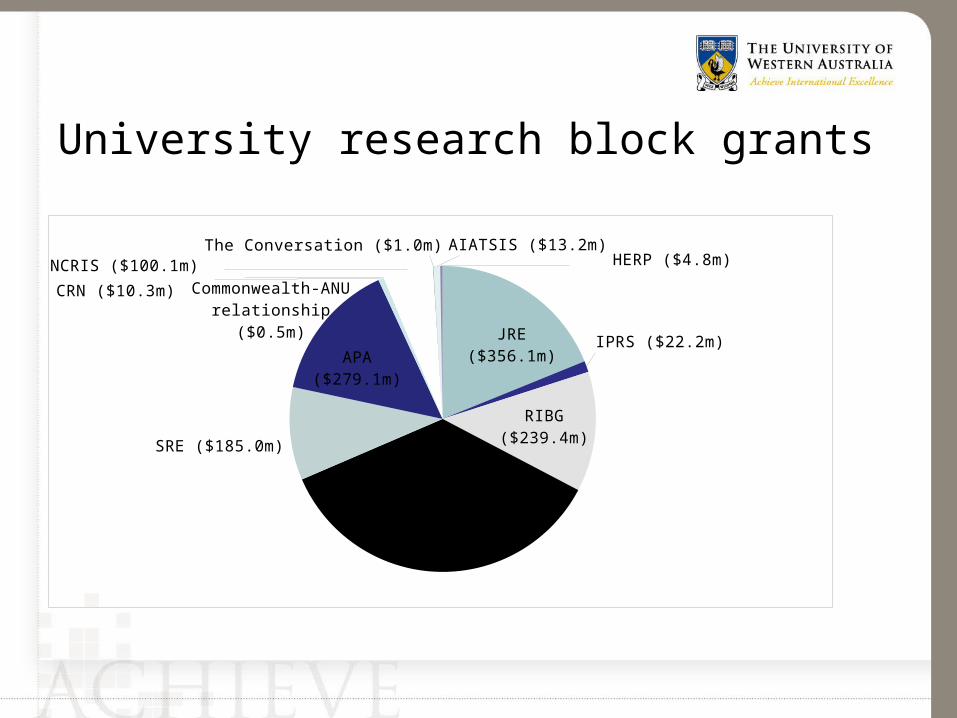
University research block grants
JRE ($356.1m) IPRS ($22.2m)
RIBG ($239.4m)
RTS ($676.7m)
SRE ($185.0m)
APA ($279.1m)
CRN ($10.3m)
Commonwealth-ANU re-lationship ($0.5m)
NCRIS ($100.1m)The Conversation ($1.0m) AIATSIS ($13.2m)
HERP ($4.8m)
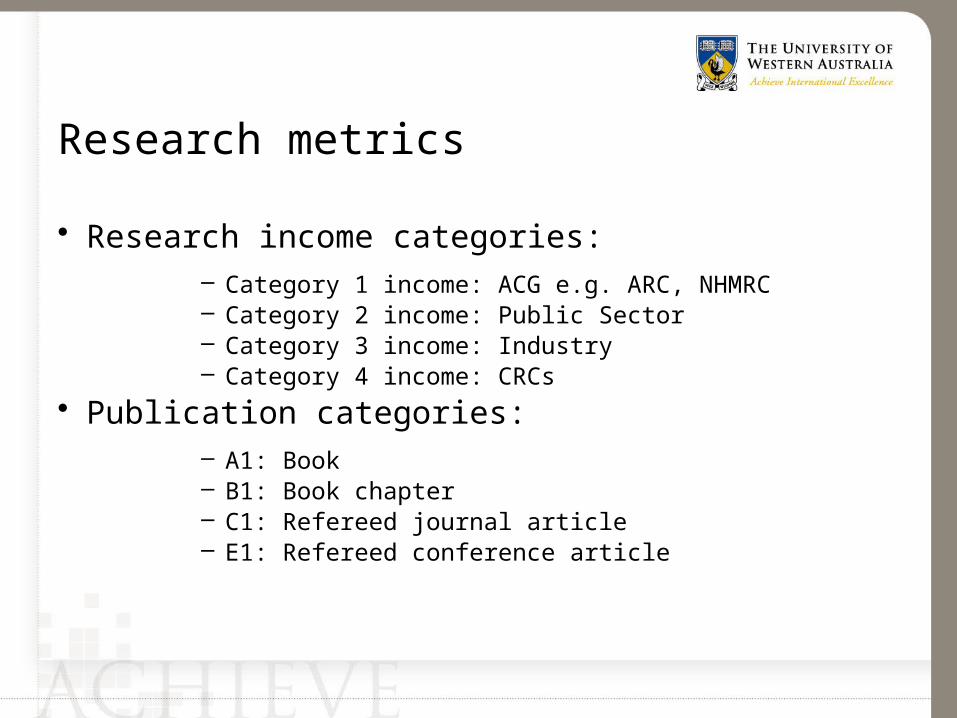
Research metrics
• Research income categories:– Category 1 income: ACG e.g. ARC, NHMRC– Category 2 income: Public Sector– Category 3 income: Industry– Category 4 income: CRCs
• Publication categories:– A1: Book– B1: Book chapter– C1: Refereed journal article– E1: Refereed conference article
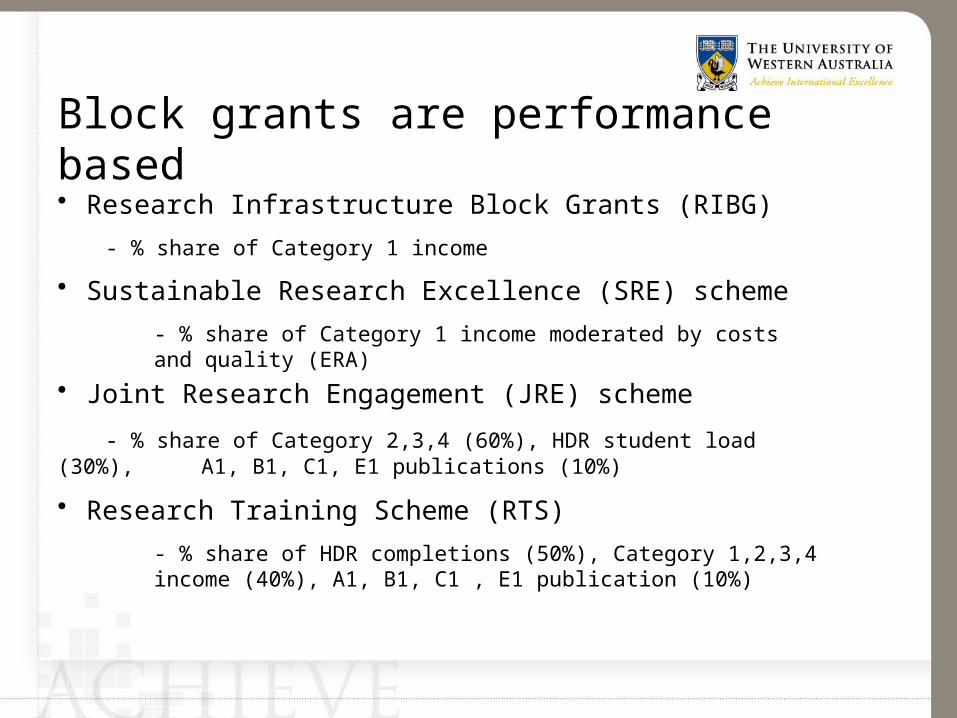
Block grants are performance based• Research Infrastructure Block Grants (RIBG)
- % share of Category 1 income
• Sustainable Research Excellence (SRE) scheme
- % share of Category 1 income moderated by costs and quality (ERA)
• Joint Research Engagement (JRE) scheme
- % share of Category 2,3,4 (60%), HDR student load (30%), A1, B1, C1, E1 publications (10%)
• Research Training Scheme (RTS)
- % share of HDR completions (50%), Category 1,2,3,4 income (40%), A1, B1, C1 , E1 publication (10%)

Drivers of RBG amounts – 2014
Data type% of total RBG funding driven by data type
Amount of total RBG funding driven by data type ($m)
Research Income - Category 1 34% 584.8
Research Income - Categories 2, 3 & 4 24% 417.0
Publications 8% 131.6
HDR Completions 28% 484.8
RTS Student Load 6% 103.8
Total 100% 1,721.9
* Other data types are used as ‘moderators’ to make modest adjustments to initial funding amounts allocated based on performance on the data types above
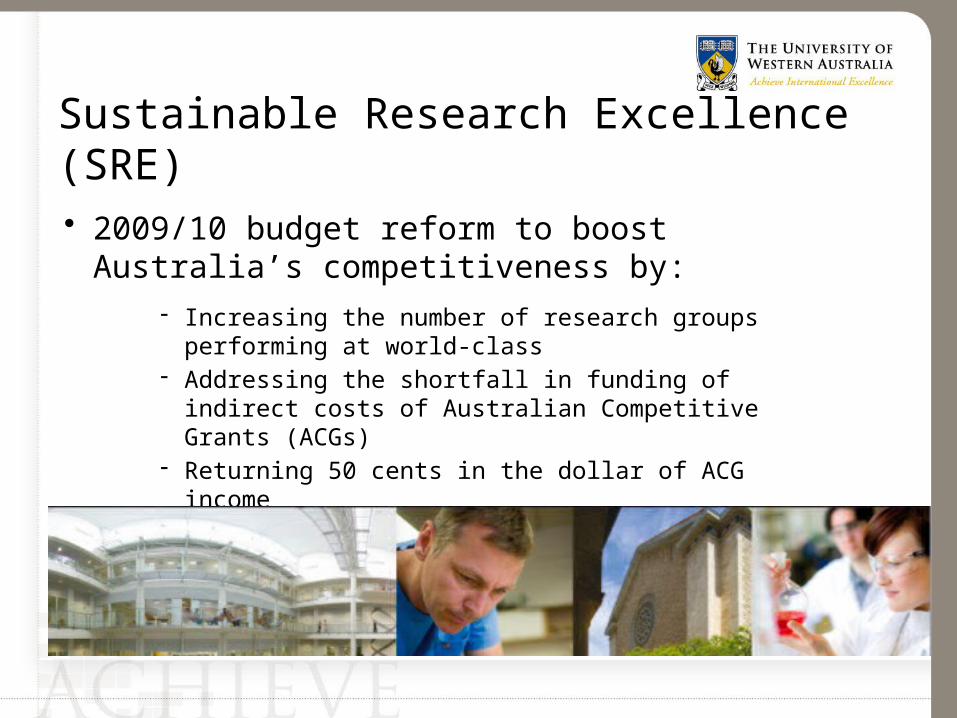
Sustainable Research Excellence (SRE)• 2009/10 budget reform to boost Australia’s
competitiveness by:- Increasing the number of research groups performing at
world-class- Addressing the shortfall in funding of indirect costs of
Australian Competitive Grants (ACGs)- Returning 50 cents in the dollar of ACG income

SRE block funding
• 20% baseline on % share of ACG income
• 13% for universities who sign up for Excellence in Research for Australia (ERA) and transparent costing (TC) – based on % share of first $2.5M ACG (threshold 1)
• 67% for universities signed up for ERA and TC – based on % share of ACG above $2.5M moderated by quality (ERA) and costs (TC) (threshold 2)

SRE moderated by quality
• Excellence in Research Australia (ERA) initiative
- Publications over a 6 year window by Field of Research (FOR)
- Discipline specific outputs peer reviewed- Esteem factors
• Results published at FOR level on 5 point scale
1 is well below world class
5 is well above world class
• Ei moderator
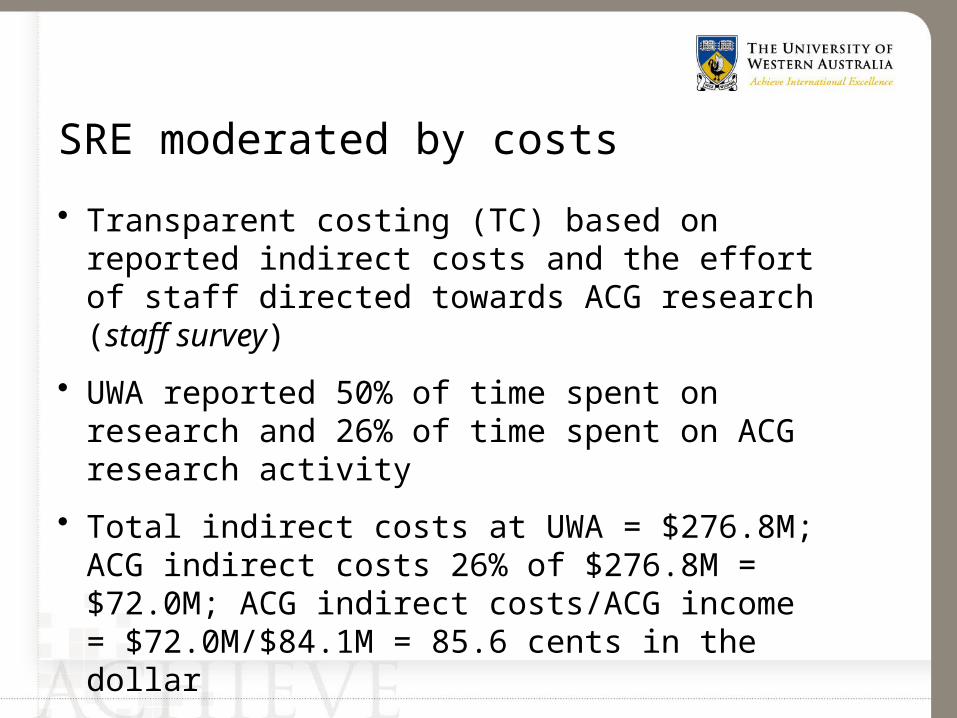
SRE moderated by costs
• Transparent costing (TC) based on reported indirect costs and the effort of staff directed towards ACG research (staff survey)
• UWA reported 50% of time spent on research and 26% of time spent on ACG research activity
• Total indirect costs at UWA = $276.8M; ACG indirect costs 26% of $276.8M = $72.0M; ACG indirect costs/ACG income = $72.0M/$84.1M = 85.6 cents in the dollar
• TC moderator

SRE threshold 2 funding
• Two pools:
Share of ACG income x TC moderator = Share of TC pool (40%)
Share of ACG income x Ei moderator = Share of Ei pool (60%)
• Ei is share of research outputs in FORs rated 3,4 or 5 as a proportion of total research outputs
• TC is a multiplier between 1 and 1.2

Constructing a research budget
• Forms the basis on which your project is funded
• A well constructed budget should include all direct costs of your project
• A well justified budget should increase your chances of having these direct costs funded
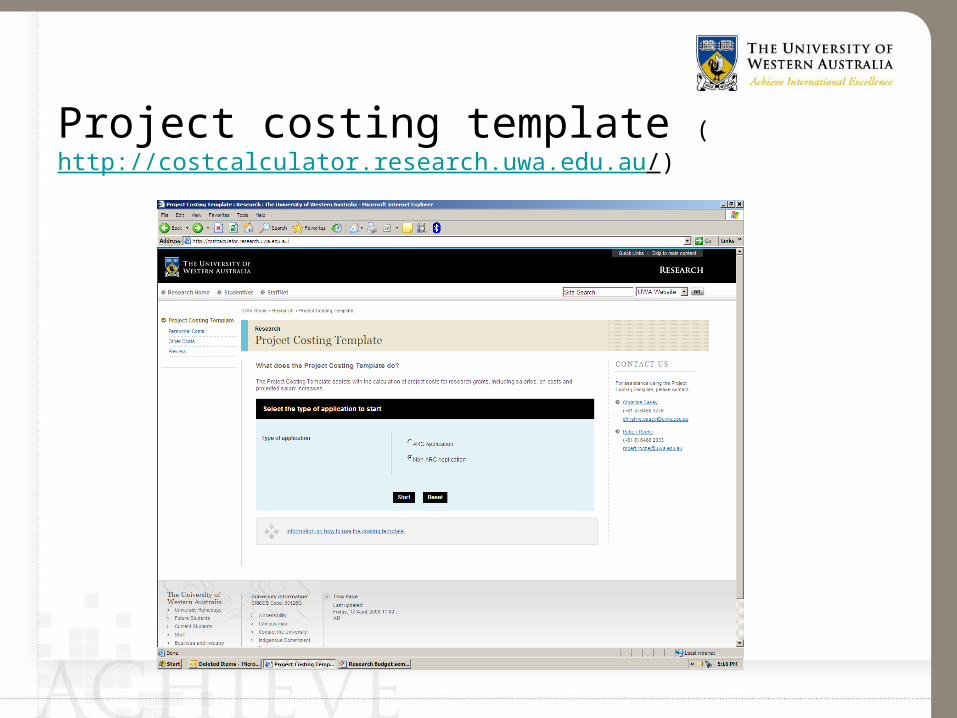
Project costing template (http://costcalculator.research.uwa.edu.au/)
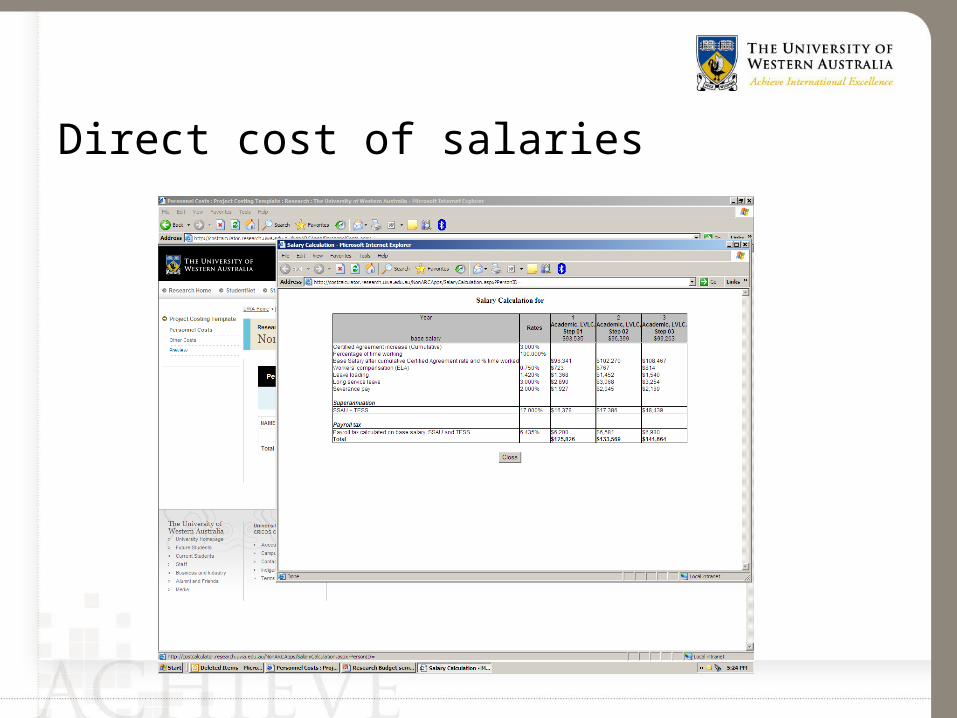
Direct cost of salaries
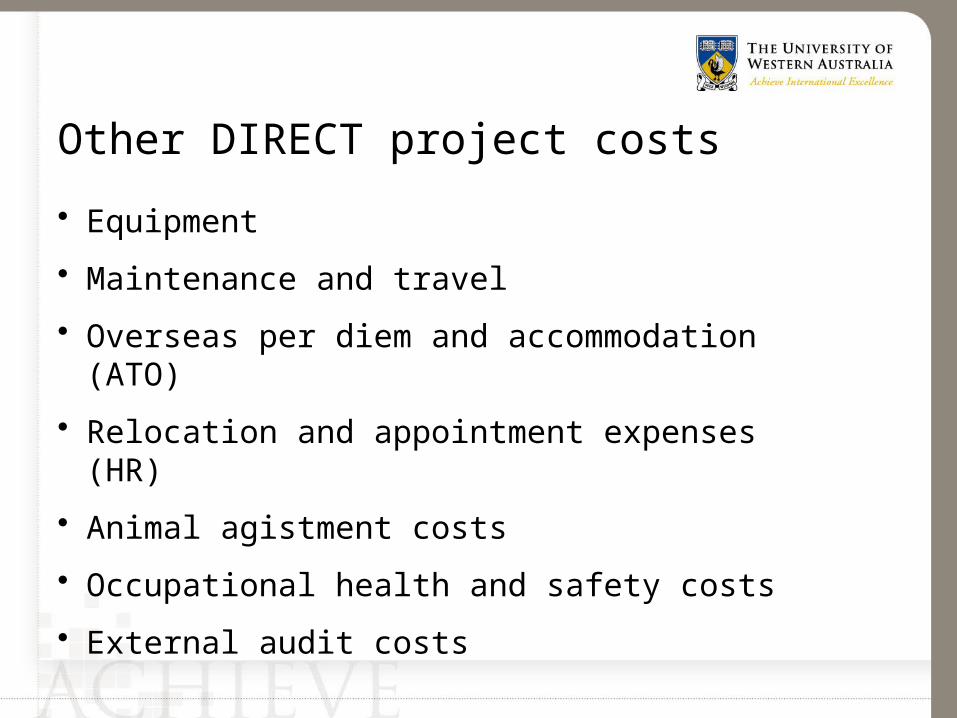
Other DIRECT project costs
• Equipment
• Maintenance and travel
• Overseas per diem and accommodation (ATO)
• Relocation and appointment expenses (HR)
• Animal agistment costs
• Occupational health and safety costs
• External audit costs

INDIRECT project costs
• Laboratory/office space
• Existing research support/administrative support
• Libraries
• Power and lighting
• Computer services and telecommunications
• Building maintenance/cleaning

Indirect costs = infrastructure
• When to apply infrastructure charge:- All research grants, contracts tenders and consultancies
except:- Australian Competitive Grants (e.g. ARC and NHRMC)- Projects funded by Charitable Trusts/Foundations- Bona-fide donations- Student stipends
• University policy at http://www.governance.uwa.edu.au/procedures/policies/policies-and-procedures?method=document&id=UP07/2
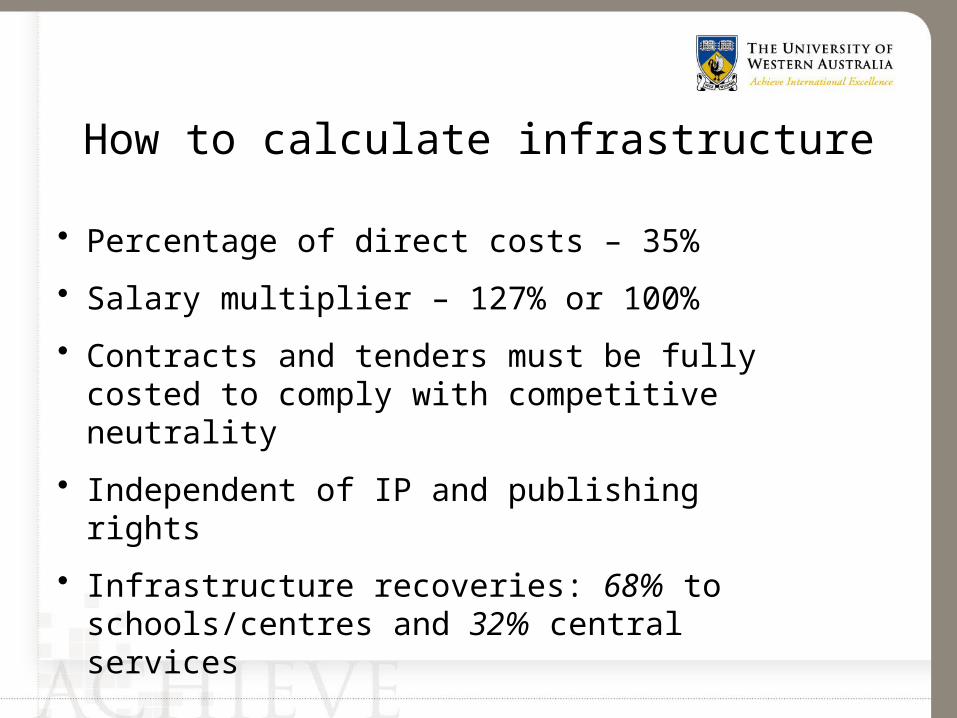
How to calculate infrastructure
• Percentage of direct costs – 35%
• Salary multiplier – 127% or 100%
• Contracts and tenders must be fully costed to comply with competitive neutrality
• Independent of IP and publishing rights
• Infrastructure recoveries: 68% to schools/centres and 32% central services

Fully costed budget using % of direct costs
Fund Body University Total
DIRECT COSTS
Postdoc Fellow $71,267 - $71,267
Research Assistant $66,836 - $66,836
CI (LVLC 1) (20%) - $20,716 $20,716
equipment $100,000 - $100,000
INDIRECT COSTS
35% of direct costs - $90,587 $90,587
TOTAL $238,103 $111,303 $349,406
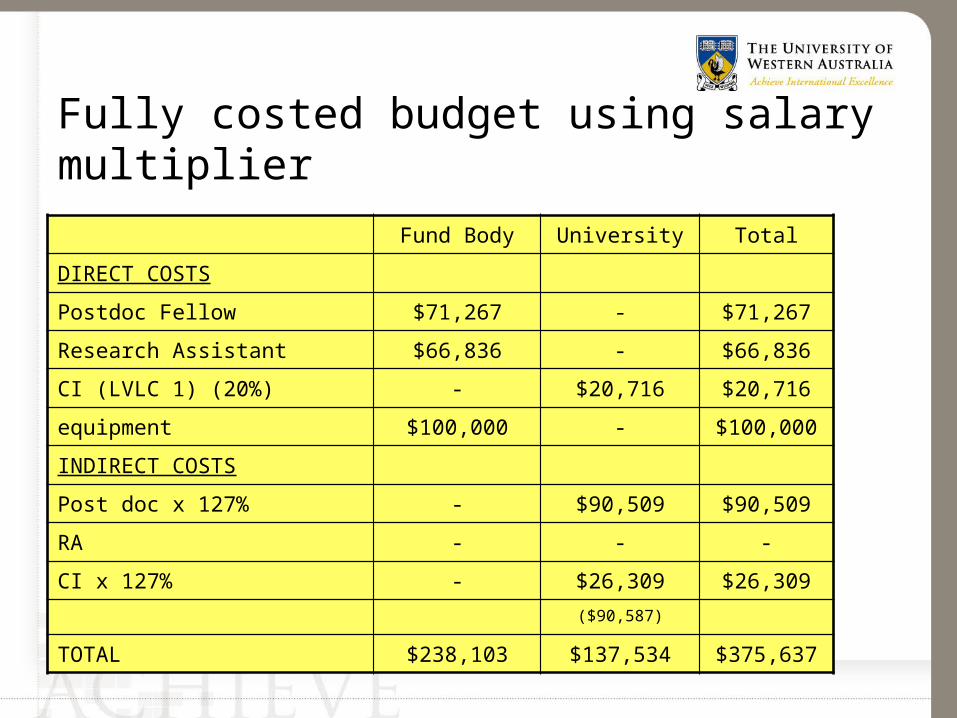
Fully costed budget using salary multiplier
Fund Body University Total
DIRECT COSTS
Postdoc Fellow $71,267 - $71,267
Research Assistant $66,836 - $66,836
CI (LVLC 1) (20%) - $20,716 $20,716
equipment $100,000 - $100,000
INDIRECT COSTS
Post doc x 127% - $90,509 $90,509
RA - - -
CI x 127% - $26,309 $26,309
($90,587)
TOTAL $238,103 $137,534 $375,637
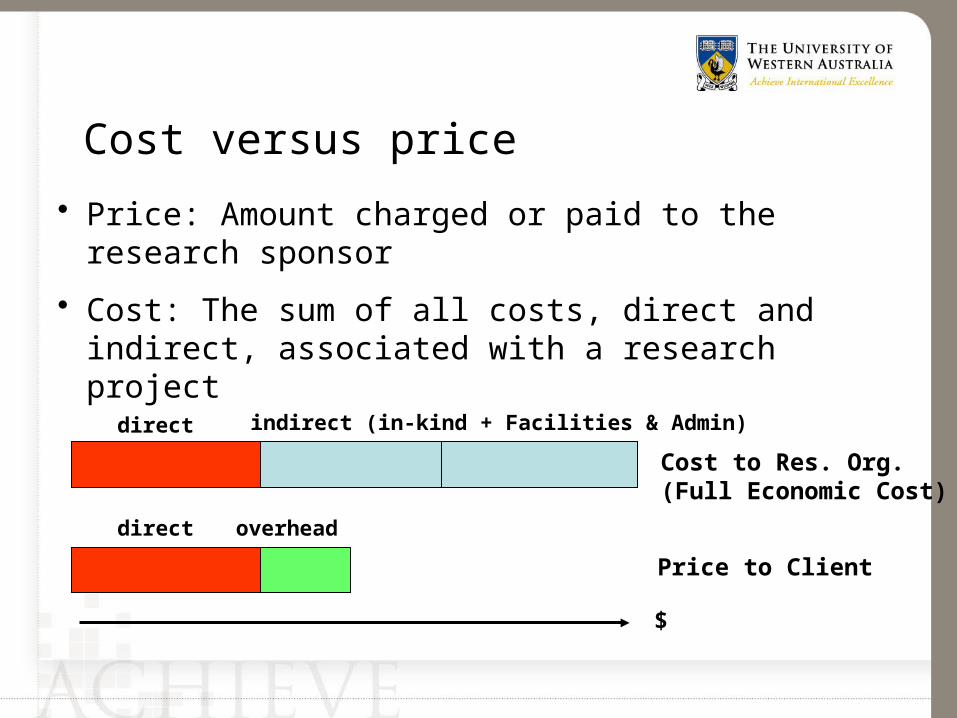
Cost versus price
• Price: Amount charged or paid to the research sponsor
• Cost: The sum of all costs, direct and indirect, associated with a research project
$
Cost to Res. Org.(Full Economic Cost)
Price to Client
direct indirect (in-kind + Facilities & Admin)
direct overhead


What are the barriers to industry supporting university research ?

What are the barriers to industry supporting university research ?
• Intellectual property
• Cost!