
Everybody gets it - Free TV Australia
56
Everybody gets it The economic and social benefits of commercial television in Australia Free TV Australia 2020
Transcript of Everybody gets it - Free TV Australia

Everybody gets it The economic and social benefits of commercial television in AustraliaFree TV Australia
2020

General use restriction This report is prepared solely for the use of Free TV. This report is not intended to and should not be relied upon by anyone else and we accept no duty of care to any other person or entity. The report has been prepared for the purpose of providing an industry census around commercial television broadcasting. You should not refer to or use our name or the advice for any other purpose.
Everybody gets it| Free TV Australia
2
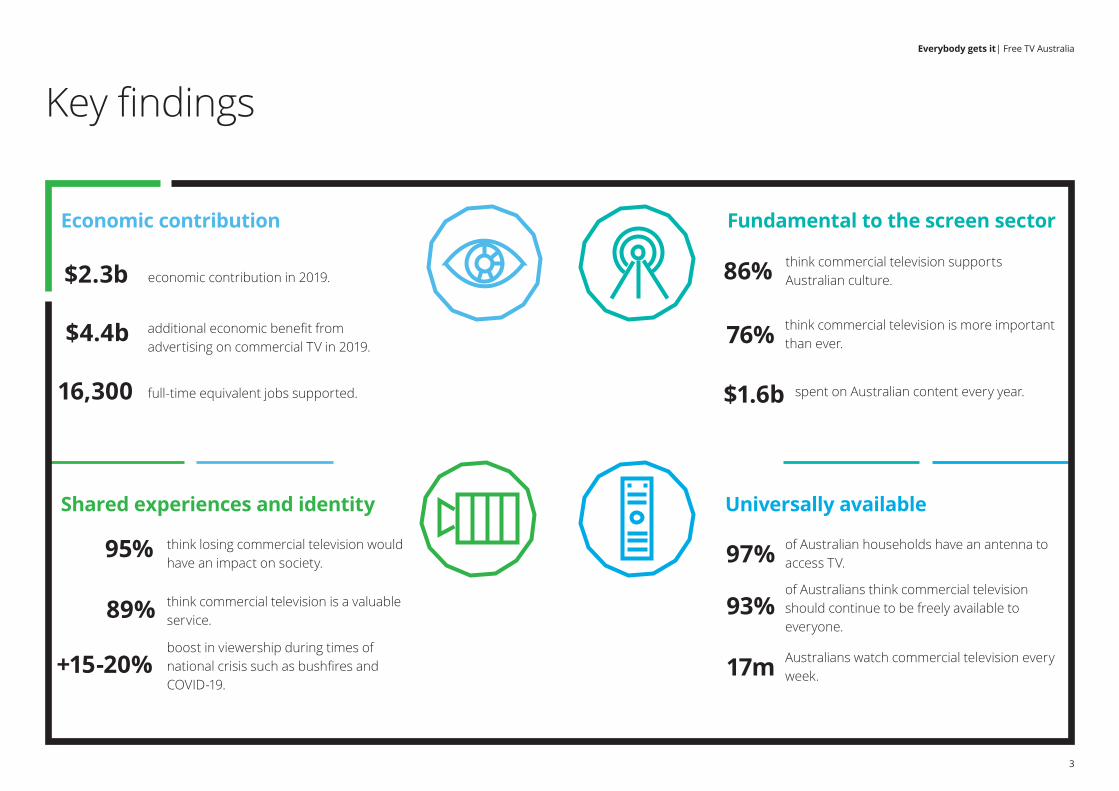
Key findings
Fundamental to the screen sector
Universally availableShared experiences and identity
Economic contribution
think commercial television is a valuable service.
of Australian households have an antenna to access TV.
boost in viewership during times of national crisis such as bushfires and COVID-19.
economic contribution in 2019.
of Australians think commercial television should continue to be freely available to everyone.
think commercial television supports Australian culture.
additional economic benefit from advertising on commercial TV in 2019.
Australians watch commercial television every week.
think losing commercial television would have an impact on society.
full-time equivalent jobs supported. spent on Australian content every year.
89%
97%
93%
17m
$1.6b
+15-20%
$2.3b 86%
$4.4b
16,300
95%
think commercial television is more important than ever. 76%
Everybody gets it | Free TV Australia
3

Executive summary
Commercial television broadcasters provide Australians with access to a vast library of content. In almost every market, 18 channels are available 24/7, broadcasting news and drama, light entertainment and sport, including more than 100,000 hours of Australian content. It is available readily and reliably at the push of a button to 97% of Australians.
Fresh insights from a consumer survey fielded in May 2020 for this report found that 89% of Australians think commercial television is a valuable service. 76% believe it is more important than ever.
This report seeks to quantify the economic and social impact of the commercial television industry in Australia. It provides a snapshot to inform public understanding of the industry.
The industry’s economic contribution to GDP was $2.3 billion in 2019. This includes both the direct value added generated by the industry, and a ‘multiplier effect’.
For every $1 in value added generated directly by the industry, its purchases support another $1.20 in value added in other industries.
The commercial television industry also supports around 16,300 full-time equivalent jobs, both directly (7,500 staff employed by the industry) and indirectly (8,800 supported through the supply chain).
Advertising on commercial television contributes to economic activity. Economic modelling for this report estimates that, by supporting competition and innovation, the economy was $4.4 billion larger in 2019 as a result of this advertising.
The industry invests $1.6 billion in Australian content each year. In doing so, it has supported the careers and growth of Australia’s creative talent.
Australian audiences continue to prefer local stories and content on commercial television. More Australians cite television (all free-to-air networks) as their most frequent source of news than any other medium. It’s also nominated as a trusted source.
The consumer survey revealed that 95% of Australians think losing commercial television would have an impact on society. The top reason for this was less access to Australian entertainment, news and sport.
Commercial television brings Australians together, regardless of location. During peak times, half of all television viewers watch together with family or friends.
With more than 3.2 million people tuning in at the same time for the top-rated show in 2019, commercial television continues to be central to Australia’s culture.
4

Introduction
Free TV Australia is the industry representative body for commercial television broadcasters. The Free TV members are Imparja Television, the Nine Network, Prime Media Group, Seven West Media, WIN, Southern Cross Austereo (SCA) and Network 10.
Free TV Australia has engaged Deloitte Access Economics to prepare an independent report which captures the economic and social contribution of its members to Australia. This report refers to these members as ‘commercial television broadcasters’, and the associated ‘commercial television industry’.
The report draws on data from a range of sources. It is also informed by an economic contribution model, which calculates the economic contribution of the industry using an input-output framework.
The survey
This report is informed by an industry survey, which gathered information from Free TV members for the 2019 calendar year.
All seven members completed the survey over a three-month period. The survey collected data on the financial performance of members, broadcasting, production and content.
The data collected through the survey relates only to broadcasting, production and distribution businesses, and associated overheads. This includes broadcast video on demand.
It does not include other activities which are undertaken by Free TV members, such as subscription video on demand (SVOD), print and online publishing.
Compiling statistics
The report synthesises data from over 15 sources to provide a holistic view of the industry.
• Ratings and content data is collected from OzTAM (metropolitan) and RegTAM (regional).
• Data on viewer/consumer trends is sourced from Deloitte’s 2019 Media Consumer Survey, which collected data from more than 2,000 consumers in June 2019.
• Other data sources include the Australian Bureau of Statistics, Nielsen, ThinkTV, ACMA, ZenithOptimedia, IAB, Roy Morgan, Screen Producers Australia, Screen Australia, IBISWorld, IMDB and previous research by Deloitte Access Economics.
The statistics are supplemented by consultations with industry experts.
Consumer survey
Consumer perspectives on commercial television are sourced from a consumer survey fielded in May 2020. The survey was fielded by Dynata, a global online market research firm.
Over 1,000 Australians participated, providing their views on commercial television, its features and value in contemporary society.
Fielded at the height of the COVID-19 pandemic, results provide a unique perspective into audience attitudes during the crisis. However, it should be noted that consumer attitudes may change over time.
Further information on the consumer survey is detailed in the Appendix.
Everybody gets it | Free TV Australia
5
COVID-19 and the commercial television sectorThis report is based on research undertaken in early 2020, prior to the impacts of COVID-19 and the resulting mandated restrictions on certain types of economic activity. As a result, it is a snapshot of the economic and social impacts of the commercial television sector prior to the crisis.
COVID-19 significantly changed the landscape for the sector, as for other industries. Revenues fell as television advertising expenditure decreased. At the same time, audience numbers spiked, as Australians turned to commercial television for news and information. To provide a more direct view on the impacts of COVID-19, this report is supported by findings from a consumer survey, fielded in May 2020. The survey provides unique insights into audience attitudes during COVID-19 lockdowns.
In mid-2020, the sector has been directly impacted by COVID-19 in a number of ways, including the delay of major sporting fixtures such as the AFL and NRL, the temporary or indefinite ceasing of production activities for a range of programs, and a significant decline in television advertising expenditure.
Despite this, the survey results demonstrate the continuing importance of the commercial sector. With Australians seeking up-to-date, reliable information about the crisis, audiences for news and current affairs programs increased — by more than 40% on average.1 Trust in news broadcast on commercial television also increased in the context of COVID-19, in particular for younger people.2 Also, the Commonwealth Government invested in a public awareness campaign, using commercial television advertising, and other media, to communicate the importance of social distancing and other measures.
More generally, government policies discouraging non-essential travel resulted in more Australians tuning in or streaming commercial television programming in general. Audience sizes increased — at its peak, by 15% from mid-February for metro viewers and 12% for regional viewers.3 This reflects the percentage change in average primary viewing, comparing mid-February to April 2020. When restrictions were lifted, audience levels returned to pre-COVID levels.4 However, the episode highlighted was the importance of commercial television during a crisis.
The consumer survey fielded for this report revealed that over three-quarters of all Australians think commercial television is more important than ever before, despite the economic challenges facing the industry.5
Even with fewer advertising dollars available, the importance of commercial television as an advertising medium has grown in 2020. Television is one of the few ways for brands to reach a wide audience, with many Australians working from home and staying indoors. 82% of Australians think it’s important that brands continue to advertise during COVID-19.6
The long-term impacts of the COVID-19 pandemic on the free-to-air sector are difficult to predict. Already, some production, sport, and economic activity is resuming, which could minimise the long-term damage. However, with economic activity likely to be subdued through 2020, the COVID-19 crisis has the potential to result in significant, long term impacts on the sector.
1 Deloitte Access Economics based on OzTAM/RegTAM data (2020). Reflects the percentage change in average primary metro channel audiences between w/c 16 February 2020 and 26 April 2020 (between 6am and midnight). 2 Deloitte Access Economics and Dynata, Consumer survey (2020). 3 Deloitte Access Economics based on OzTAM/RegTAM data (2020). Reflects the percentage change in average primary channel audiences between w/c 16 February 2020 and 26 April 2020 (between 6am and midnight). 4 Ibid. 5 Deloitte Access Economics and Dynata, Consumer survey (2020). 6 Kantar, COVID-19 Barometer (27-31 March 2020), cited in ThinkTV (2020), Advertising out of CV-19 <https://thinktv.com.au/deep-dive/advertising-out-of-cv-19/>.
Everybody gets it| Free TV Australia
6

Contents
Economic contribution
Fundamental to the screen
sector
Shared experiences and identity
Universally available
Everybody gets it | Free TV Australia
7

Economic contributionCommercial television makes a significant contribution to Australia’s economy, by generating revenue and supporting employment.
8
Everybody gets it| Free TV Australia

Commercial television generated $2.3 billion in value added in 2019 The commercial television industry makes a significant contribution to Australia’s economy. In 2019, the total economic contribution of the commercial television industry was $2.3 billion.7
This contribution consists of gross operating surplus (returns to capital owners) and wages paid to labour, which collectively determine the industry’s value add.
The industry generates value added both directly and indirectly. Direct value added captures the wages and gross operating surplus of the industry’s own operations. While the indirect value added captures the flow-on economic activity associated with purchases of intermediate goods and services by the industry. For instance, the industry commissions productions from independent screen producers.
In 2019, $1.3 billion of the total economic contribution of the commercial television industry was through indirect value added.8
Further details on the methodology used to estimate the economic contribution of the industry are in the Appendix A of this report.
Total economic contribution of the commercial television industry, 2019 ($ million)9
Direct Indirect Total
Total value added 1,032 1,255 2,288
Including:
Gross operating surplus 443 476 919
Labour income 589 779 1,369
Employment (FTE) 7,470 8,786 16,256
Note: This economic contribution has been calculated based of survey data provided by Free TV members, and refers only to activity related to broadcasting, production and distribution businesses, as well as any associated overheads. It relates to the calendar rather than financial year. As a result it may not reconcile with data presented in annual reports.
7 Deloitte Access Economics based on data provided by Free TV members (2019).8 Ibid. 9 Ibid.
Everybody gets it | Free TV Australia
9

Breakdown of indirect valued added of the commercial television industry, 2019 ($ million)10
Indirect
value added
Motion Picture and Sound Recording 481.5
Professional, Scientific and Technical Services 99.8
Public Administration and Regulatory Services 90.5
Non-Residential Property Operators and Real Estate Services
89.6
Employment, Travel Agency and Other Administrative Services
53.9
Retail Trade 44.1
Finance 41.4
Wholesale Trade 41.0
Broadcasting (except Internet) 39.5
Printing (including the reproduction of recorded media)
25.0
Auxiliary Finance and Insurance Services 20.6
Telecommunication Services 16.2
Construction Services 16.0
Heritage, Creative and Performing Arts 14.0
All other 182.5
The economic contribution of commercial television benefits many industries
The commercial television industry indirectly contributed $1.3 billion to the wider Australian economy in 2019.
The largest component of this is commercial television’s contribution to the motion picture and sound recording industry, which accounts for the largest share of total indirect value added at $482 million (38%).
A further $100 million (8.0%) can be attributed to professional, scientific and technical services and $91 million (7.2%) to public administration and regulatory services.
While the top five industries account for over two-thirds of the indirect contribution, the commercial television industry also contributes to a range of other industries.
For example, commercial television indirectly contributed $44 million to retail trade and $25 million to printing in 2019.
10 Deloitte Access Economics based on data provided by Free TV members (2019).
Everybody gets it| Free TV Australia
10

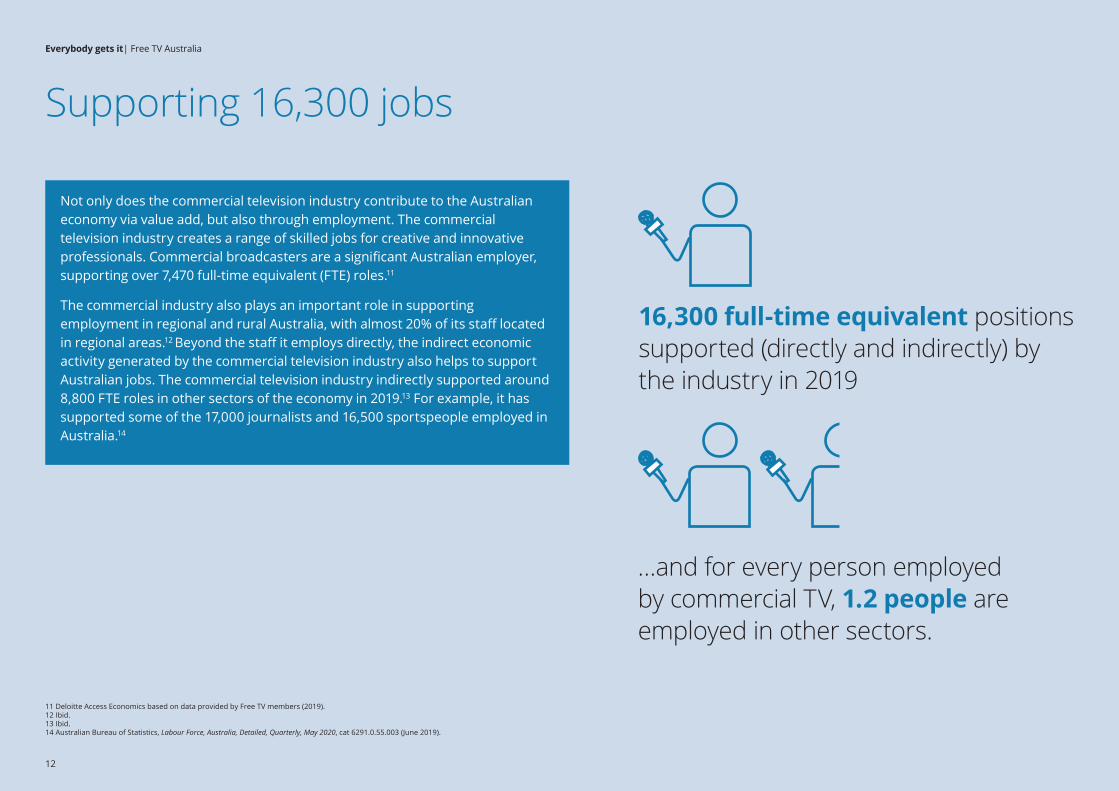
16,300 full-time equivalent positions supported (directly and indirectly) by the industry in 2019
Supporting 16,300 jobs
…and for every person employed by commercial TV, 1.2 people are employed in other sectors.
Not only does the commercial television industry contribute to the Australian economy via value add, but also through employment. The commercial television industry creates a range of skilled jobs for creative and innovative professionals. Commercial broadcasters are a significant Australian employer, supporting over 7,470 full-time equivalent (FTE) roles.11
The commercial industry also plays an important role in supporting employment in regional and rural Australia, with almost 20% of its staff located in regional areas.12 Beyond the staff it employs directly, the indirect economic activity generated by the commercial television industry also helps to support Australian jobs. The commercial television industry indirectly supported around 8,800 FTE roles in other sectors of the economy in 2019.13 For example, it has supported some of the 17,000 journalists and 16,500 sportspeople employed in Australia.14
11 Deloitte Access Economics based on data provided by Free TV members (2019).12 Ibid. 13 Ibid. 14 Australian Bureau of Statistics, Labour Force, Australia, Detailed, Quarterly, May 2020, cat 6291.0.55.003 (June 2019).
12
Everybody gets it | Free TV Australia

Advertising on commercial television
Advertising plays an important role in the economy. It promotes price competition and helps consumers make more informed choices. Advertising also improves market efficiency by providing an incentive for businesses to innovate and to offer better products, at lower prices.
The advertising industry is a significant employer in Australia. There were over 26,000 people employed in advertising in February 2019.15 For every one person employed in advertising, two more people are employed in supported sectors and occupations.16
Commercial television is an important part of the advertising mix, and plays a significant role in the advertising industry’s contribution to the economy. Around 20% of advertising expenditure went to commercial television in 2019.17
Advertising on Free TV supports competition and innovation, which in turn increases GDP. This report estimates that the economy was $4.4 billion larger in 2019 as a result.18
Viewers report that television advertising is influential in shaping buying decisions. New insights from analysis of a survey of over 2,000 Australian consumers indicated that 12.6% think television ads influence their buying decisions to a ‘high extent’.19 This was higher than all other paid forms of advertising considered (including print, outdoor, social and digital).20
This doesn’t mean all Australians enjoy watching ads. Unsurprisingly, the survey also revealed that the majority of Australians (75%) would prefer to watch less than 10 minutes of ads per hour.21
Some Australians opt for paid, ad-free content online. Yet, of those surveyed, 93% think it continue to be freely available.22
15 Australian Bureau of Statistics, Labour Force, Australia, Detailed, Quarterly, Nov 19, cat. no. 6219.0.55.003 (March 2019). 16 Deloitte Access Economics (2015), Advertising Pays. 17 Deloitte Access Economics based on ThinkTV (2019) and ZenithOptmiedia (2019). 18 Estimates are relative to 1992 and as such cannot capture the full benefit of advertising on commercial free-to-air TV to GDP. Deloitte
Access Economics estimates based on data provided by ZenithOptmiedia (2019), ABS (2019), OECD (2019) and World Bank (2019).19 Deloitte Access Economics based on data from Deloitte, Media Consumer Survey 2019 (2019).20 Ibid.21 Ibid.22 Deloitte Access Economics and Dynata, Consumer survey (2020).
Everybody gets it | Free TV Australia
13

Industry perspective: An interview with Peter Horgan, CEO, Omnicom Media
If you don’t support TV now, you’ll miss it when it is gone.
Television is still extremely important in the marketing mix. It sits at the top of the purchase funnel and is essential in building mass market awareness.
Creating impactful advertising requires investment in video. We have seen production budgets as a share of the total media spend increasing over time. This has provided more support for the broader screen industry outside advertising.
TV advertising might have a higher total price than some other mediums. However, on a per person basis, it’s an efficient way to reach a broad audience.
To date, no other medium has replicated TV’s ability to provide a mass audience, particularly inside an ad-funded environment.
The main challenge is how to continue to keep viewers engaged; viewers have diminished tolerance for advertising. There is a danger of the industry facing an audience cliff.
The most effective television campaigns are when the brand meets performance. By using a variety of assets — including both television and digital — the campaign is able to better forge a two-way relationship between the brand and consumers.
Everybody gets it| Free TV Australia
14

Commercial television supports Australian tourism
The commercial television industry also plays a critical role in boosting tourism through Australian screen content. Shows produced by Australian commercial television broadcasters are shown in over 190 countries around the world.23
For example, viewing data from the UK indicates that between 4 May–10 May 2020, episodes of Neighbours broadcast by Channel 5 attracted an audience of around one million viewers each.24 In the same period, the most viewed program broadcast on channel 5Star was Home and Away, with an audience of almost half a million.25
23 Deloitte Access Economics based on data provided by Free TV members (2019).24 Broadcasters’ Audience Research Board, Weekly top programmes on four screens, <https://www.barb.co.uk/viewing-data/four-screen-dashboard/> accessed May 2020.25 Ibid. 26 Deloitte Access Economics, What are our stories worth? Measuring the economic and cultural value of Australia’s screen sector (2016).
In May 2020, Free TV Australia jointly announced the commencement of the PacificAus TV initiative with the Australian Government. Under this initiative the broadcast rights to a variety of Australian television programs are being made freely available to Pacific broadcast partners in Papua New Guinea, Fiji, Vanuatu, Solomon Islands, Kiribati, Tuvalu and Nauru. This will include 1,000 hours per year for three years of content including lifestyle programs, factual programs, children’s programs, drama, reality TV and sport.
This is important because Australian content drives international tourism and visitors to the region. It is estimated that 230,000 international tourists visit or extend their stay as a result of viewing Australia film and television content, generating $725 million in estimated tourism expenditure every year.26
Everybody gets it | Free TV Australia
15

Fundamental to the screen sector
16
Everybody gets it| Free TV Australia

Commercial television plays a critical role in the Australian screen ecosystem; supporting independent screen production, nurturing Australian talent and providing diverse content.
The Australian screen sector is diverse. It spans the entire supply chain from production to distribution and broadcast.
Commercial television plays a critical role in the screen ecosystem by investing in Australian content. Collectively, commercial television broadcasters had $1.6 billion of commercial programming expenditure in 2018–19.27
More than half (55%) of investment in first release Australian TV/online dramas came from commercial television broadcasters in 2018–19.28
This includes significant support for the independent screen production sector: as a whole, the independent screen production sector was estimated to generate $1.2 billion in production revenues in 2019.29
This investment helps to support local production, which benefits local audiences through the provision of unique content, while also helping to grow a thriving independent sector in which actors and other screen creatives can start their career.
The consumer survey revealed that the number one selected impact of commercial television not being available is less access to Australian news, drama and entertainment programs.30
Commercial television broadcasters further support a diverse ecosystem and a wide range of businesses, engaging with 2,276 suppliers on average.31 This diversity fosters competition and incentivises innovation across the screen industry.
27 Note: This includes commissioning new content and acquiring the rights to broadcast existing content. Deloitte Access Economics based on data provided by Free TV members (2019).
28 Screen Australia, Drama Report: production of feature films, TV and online drama in Australia in 2018/19 (2019),<https://www.screenaustralia.gov.au/getmedia/08d8518b-867b-4f61-8c2e-ebd10f0dc3a4/Drama-Report-2018-2019.pdf>.
29 Deloitte Access Economics, Screen Production in Australia (2019).30 Deloitte Access Economics and Dynata, Consumer survey (2020). 31 Deloitte Access Economics based on data provided by Free TV members (2019).
Everybody gets it | Free TV Australia
17

Nurturing Australian talent
Across just five Australian TV shows, commercial television has supported the careers of over 10,000 screen creatives32
Many of Australia’s internationally recognised actors gained early television experience and exposure on local shows. For example, Australian dramas created by commercial television broadcasters have helped to launch the acting careers of Naomi Watts, Chris and Liam Hemsworth, Heath Ledger, Kylie Minogue, Delta Goodrem, Margot Robbie, and Isabel Lucas, among many others.
Beyond actors, commercial television has also helped to forge the early careers of screen writers and directors. This includes writer, actor and director Wayne Blair, who went on to direct the feature film ‘The Sapphires’ and Jennifer Kent, best known for writing and directing ‘The Nightingale’ and ‘The Babadook’.
Reality television acts as a catalyst for contestants to dive into a new career, often outside of the screen industry. Former MasterChef Australia and My Kitchen Rules contestants have gone on to write cookbooks, open restaurants and even host their own cooking shows. Likewise, former contestants on The Block have since opened their own interior design businesses.
Regional broadcasters also play an important role in helping aspiring screen professionals gain experience in their local area.
32 Deloitte Access Economics based on IMBD data (2019). Analysis based on MasterChef, Neighbours, The Block , Home and Away and The Footy Show (AFL).
By investing in local content, commercial television provides a platform for screen creatives to launch their career. Just five Austarlian TV shows have supported over 10,000 actors, writers, directors, producers, and other screen creatives, nurturing Australian talent.
Everybody gets it| Free TV Australia
18


What Australians watch is changing
Audience patterns are changing, and Australians rely on commercial television to broadcast the programs they want to watch. The diversity of content on commercial television helps to support local production for a range of different types of programs across Australia.
In recent years, changing viewer preferences have shifted the composition of content broadcast on commercial television.
News and current affairs remains the most watched genre on commercial television, today making up more than a quarter (28%) of total cumulative program audience in 2019.33 Reality television is also growing, spurred by the rising popularity of TV shows such as The Bachelor, The Block, Survivor, My Kitchen Rules, and others.
In contrast, drama as a genre on commercial television has declined — from 17% in 2012, to 13% in 2019.34
Light entertainment and moves have also declined marginally.35
0
5
10
15
20
25
30
Proportion of total audience, by genre
2009 2019
1 Deloitte Access Economics, based on OzTAM data (2019).
Oth
er
Spor
ts e
vent
Mov
ies:
feat
ure
films
Dra
ma
Real
ityte
levi
sion
Ligh
ten
tert
ainm
ent
/Life
styl
e
New
s/Cu
rren
taffairs
33 Deloitte Access Economics based on OzTAM/RegTAM data (2019).34 Ibid. 35 Ibid.
Source: Deloitte Access Economics based on OzTAM/RegTAM data.
2012
Everybody gets it| Free TV Australia
20

36 Deloitte Access Economics based on data provided by Free TV members (2019). 37 Deloitte Access Economics based on data provided by Free TV, OzTAM and RegTAM (2019). 38 UN Environment Programme, Ten impacts of the Australian bushfires (20 January 2020) <https://www.unenvironment.org/news-and-stories/story/ten-impacts-australian-bushfires>..
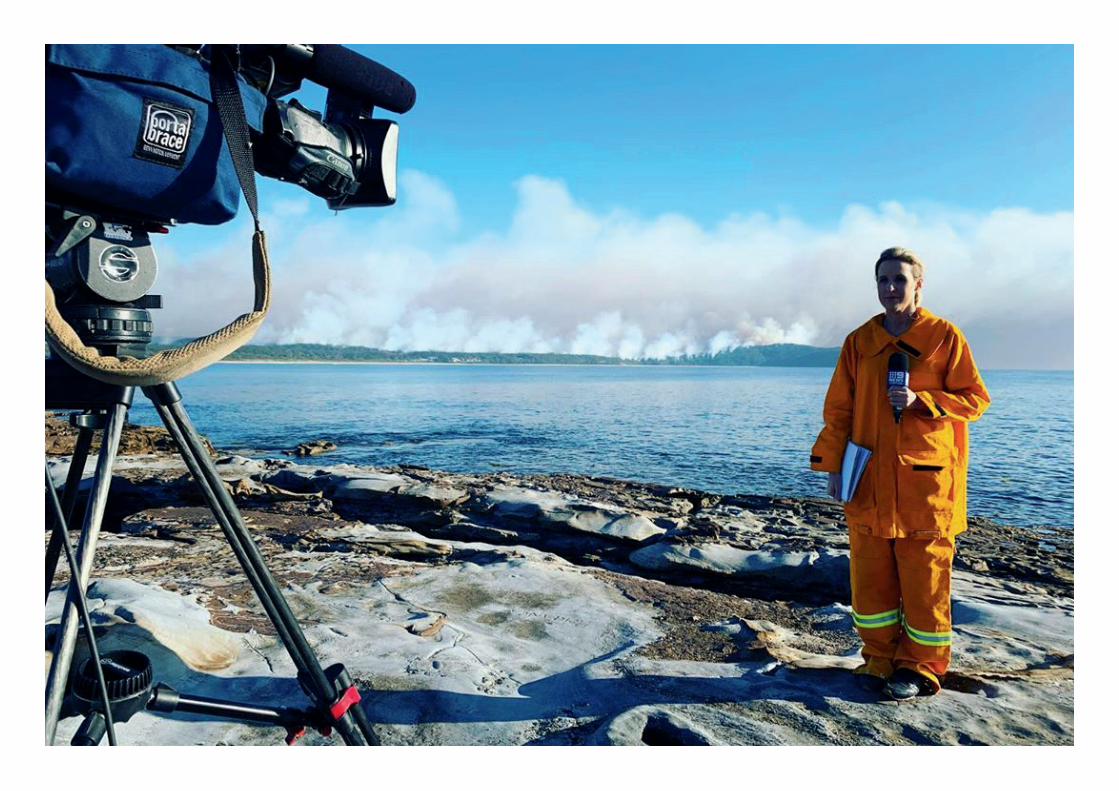
In focus: bushfiresProviding critical information in a time of national crisis:Live television broadcasts showed people in Australia and around the world the bushfire crisis as it evolved. It provided a powerful illustration of the full extent of community devastation that occurred during the 2019–20 Australian bushfires.
Broadcasters, journalists, support staff and news teams worked tirelessly to capture the important stories, sometimes in hazardous conditions. Across the broadcasters, over 160 journalists and operators provided more than 500 hours of coverage in more than 50 locations around the country.36
This coverage helped to inform the public during a time of crisis. At its peak, the Free TV national audience during the bushfire crisis was 23% higher, relative to a year earlier.37 It captured breaking news and national interest, but also personal and local stories. In some instances, reporters were interviewing members of their own communities.
The length of the bushfire event required a significant logistical operation and coordination to deploy reporters and resources to the right place at the right time. Instead of immediate updates in a single location, broadcasters provided rolling coverage of a bushfire season that saw more than 18 million hectares burnt across the country.38
Restrictions on movements in and around bushfire zones increased the challenges associated with reporting from the field. In some cases, reporters and crew members elected to sleep in the their cars, rather than missing the opportunity to go to air.
In the face of these difficult conditions, the broadcasters made significant efforts to collaborate with each other, to ensure that individuals in affected areas could receive the most up-to-date news. When transmission infrastructure was damaged or burnt, each network was invested in getting them back up and running as quickly as possible.
Everybody gets it | Free TV Australia
21


Over 160 journalists and camera crew
Over 500 hours of dedicated coverage
Broadcast from 50+ individual locations
Over $25 million raised, facilitated or provided in support
Social media with 10+ million interactions
BushfiresKeeping in touch with the local communityProviding regular, up-to-date news and current affairs is part of the core business of commercial television broadcasters. Since the bushfires, the industry has continued to tell the story of recovery and promote tourism in affected areas.
Broadcasters also undertook relief and fundraising activities, both individually and in partnership with other entities. Notable examples include:
• The Today Show partnering with the Block to promote local tourism and re-build a wildlife hospital on Kangaroo Island
• Sunrise’s ‘Road to Recovery Week’ showcasing tourism in bushfire-affected regions.
Broadcasters also set up dedicated information portals online, to help the public get the most up-to-date information on the bushfires and where to donate.
Millions of people in Australia and around the world also engaged with social media coverage from the broadcasters.
Nine Network dedicated $10 million worth of advertising support across its media channel to assist small businesses and local tourism bodies.
Seven Network co-funded production and broadcast the ‘Fire Fight Australia’ concert to an audience of almost five million people. This broadcast alone raised almost $10 million for fundraising and relief efforts. Seven Network also broadcast the ‘Bushfire Bash T20 Cricket’ match, which raised more than $7 million.
Other industry players, such as national broadcasters, social media platforms and radio, played a crucial role in providing coverage of the bushfires and fundraising activities.
Everybody gets it | Free TV Australia
23

Shared experiences and identity
24
Everybody gets it| Free TV Australia
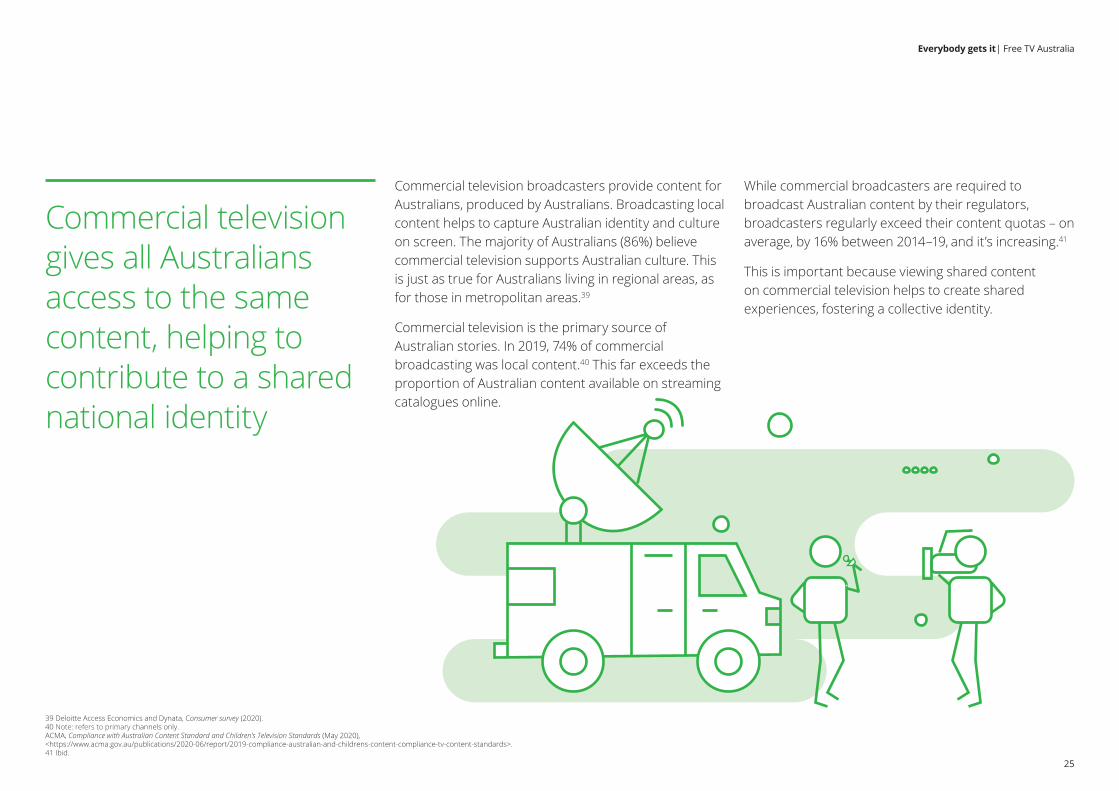
Commercial television gives all Australians access to the same content, helping to contribute to a shared national identity
Commercial television broadcasters provide content for Australians, produced by Australians. Broadcasting local content helps to capture Australian identity and culture on screen. The majority of Australians (86%) believe commercial television supports Australian culture. This is just as true for Australians living in regional areas, as for those in metropolitan areas.39
Commercial television is the primary source of Australian stories. In 2019, 74% of commercial broadcasting was local content.40 This far exceeds the proportion of Australian content available on streaming catalogues online.
While commercial broadcasters are required to broadcast Australian content by their regulators, broadcasters regularly exceed their content quotas – on average, by 16% between 2014–19, and it’s increasing.41
This is important because viewing shared content on commercial television helps to create shared experiences, fostering a collective identity.
39 Deloitte Access Economics and Dynata, Consumer survey (2020). 40 Note: refers to primary channels only.ACMA, Compliance with Australian Content Standard and Children’s Television Standards (May 2020), <https://www.acma.gov.au/publications/2020-06/report/2019-compliance-australian-and-childrens-content-compliance-tv-content-standards>. 41 Ibid.
Everybody gets it | Free TV Australia
25

One of the biggest sources of Australian screen stories
0%
10%
20%
30%
40%
50%
60%
70%
80%
20192018201720162015201420132012201120102009
Source: ACMA ‘Comparison report 2009 to 2018’ (May 2019) https://www.acma.gov.au/sites/default/files/2019-09/Comparison-report-2009-to-2018.pdf
Free TV regularly exceeds its local content quotas – on average, by 16% between 2014-19, and it's increasing.
Actual Australian content transmission on free TV Local content transmission on free TV
The proportion of Australian content by platform
SVOD platforms42 Free TV Australia43
<10% 74%
42 Lobato, R. & Scarlata, A., Australian Content in SVOD Catalogs: availability and discoverability (RMIT University, 2019) Lobato, R. and Scarlata, A. Australian content in SVOD catalogs: availability and discoverability, submission to the Australian and Children’s Screen content review (2017).
43 ACMA, Comparison report 2009 to 2018 (May 2019) and ACMA, Compliance with Australian Content Standard and Children’s Television Standards (May 2020).
44 Australian Broadcasting Corporation, Annual Report 2019 (2019), <https://about.abc.net.au/wp-content/uploads/2019/10/ABC-Annual-Report-201819v2.pdf>. Note: For primary channels only.
Local content quota on free-to-air television
Source: ACMA, Comparison report 2009 to 2018 (May 2019) and ACMA, Compliance with Australian Content Standard and Children’s Television Standards (May 2020).
Everybody gets it| Free TV Australia
26
ABC44
75%

Australians watch local content
Local content is fundamental to the Australian community. Broadcasting Australian content on commercial television not only helps to capture our stories on screen, but also reflects consumer demand.
Overwhelmingly, Australians are choosing to consume Australian content ahead of international programs.45
In 2019, the top twenty programs were all Australian.46 In particular, Australians favour sport, local news, reality and light entertainment, which together account for the most popular genres on commercial television.47
45 Deloitte Access Economics based on OzTAM/RegTAM data (2019).46 Ibid. 47 Ibid.
The top shows in 2019 were all Australian
Show Audience (millions)
State of Origin Rugby League, 1st Match 3.23
AFL Grand Final 2.96
State of Origin Rugby League, 3rd Match 2.91
State of Origin Rugby League, 2nd Match 2.84
Married at First Sight — Finale 2.78
The Block — Winner Announced 2.68
AFL Grand Final Presentations 2.68
NRL Grand Final 2.66
Married at First Sight — The Final Dinner Party 2.59
Lego Masters— Winner Accounced 2.47
Lego Masters— Launch 2.25
AFL Grand Final — On the Ground 2.17
The Block — Grand Final 2.13
2019 Australian Open Men’s Final 2.11
Married at First Sight — Sunday 2.06
Lego Masters — Finale 2.05
Australian Ninja Warrior — Winner Announced 1.98
The Masked Singer Australia — The Final Reveal 1.96
Married at First Sight — Wednesday 1.94
2019 Melbourne Cup Carnival 1.92
Source: Deloitte Access Economics based on OzTAM/RegTAM (2019).Note: Includes regional and metro audiences.
Everybody gets it | Free TV Australia
27
The top programs in 2019 were all Australian

Television is the main way Australians get their news.48 6.5 million Australians tune into commercial TV news and current affairs every day.49 Recent analysis of a survey of 2,000 Australian consumers revealed that 38% say they prefer television over any other medium when it comes to staying up to date. It’s even higher for regional audiences, with 41% citing TV as their preferred medium. The second most preferred medium is social media, at only 15%.50
Research from ACMA shows that television is becoming more popular for news consumption. In contrast, other mediums are declining.51 Even Millennials, who have the lowest rates of broadcast television viewership, still overwhelmingly opt for television to get their news.52
Commercial television broadcasters provide 486 hours of news and current affairs every week, reaching 13 million viewers.53
Across every news type — lifestyle, politics, sports and more — television is the prevailing source of news.54 Insights from the consumer survey reveal that staying informed and up-to-date is the main reason audiences tune into commercial television, exceeding any other reason for watching.55
Share of respondents (%)
Boomers & olderGen XMillennialsRegionalMetro%
25
50
75
100
I do not follow the newsMagazinesSocial media sitesOnline news sitesNews aggregatorsOnline/digital version of newspapersPrint newspapersRadio
48 Deloitte Access Economics based on data from Deloitte, Media Consumer Survey 2019 (2019). Note: TV also includes SBS and ABC. 49 Free TV Australia, News and Current Affairs. 49 Deloitte Access Economics based on data from Deloitte, Media Consumer Survey 2019 (2019).50 Ibid.
51 ACMA, Communications report 2018-19 (2020); ACMA-commissioned survey (2018).52 Deloitte Access Economics based on data from Deloitte, Media Consumer Survey 2019 (2019).53 Free TV Australia, News and Current Affairs. 54 Roy Morgan Research, Consumer Use of News (2018). 55 Deloitte Access Economics and Dynata, Consumer survey (2020).
Source: Deloitte Access Economics based on data from Deloitte, Media Consumer Survey 2019 (2019).
Television news
TV is the main source of news across all generations
Everybody gets it| Free TV Australia
28

The consumer survey revealed that three-quarters of Australians see commercial television as a trusted source of news, ahead of many other mediums.56 Public broadcasters, radio and TV also ranked highly.57
According to the 2019 Digital News Report, accessing news through digital platforms can increase viewers exposure to less reliable or lower quality news.58 Many Australians (62%) worry about what is real or fake on the internet, higher than the global average.59
However, commercial television broadcasters are also able to prioritise broadcasting local information, making it more relevant to local audiences.
This is particularly true for regional stations, who are often first on the ground covering local issues. For example, the ‘dollar a litre milk’ headline was first broken by WIN News, before being picked up by major stations.
Importantly, in the context of COVID-19, trust in news and information broadcast on commercial television increased. Twice as many people (40%) agreed that they trust it more as a source of news (rather then disagreed, 22%). This is especially true for younger people, more of whom tuned into commercial television during the crisis.60 Similarly, almost twice as many people (47% compared with 25%) were watching more rather than less commercial television during COVID-19.
The proportion of Australians that trust news and information broadcast on the following sources:61
Commercial television is a trusted source of news
56 Deloitte Access Economics and Dynata, Consumer survey (2020). Note: Includes respondents who selected ‘moderately’, ‘very’ or ‘extremely’ trusted. 57 Ibid. 58 News and Media Research Centre, Digital news report: Australia 2019 (2019) 59 Ibid. 60 Deloitte Access Economics and Dynata, Consumer survey (2020). 61 Ibid. Note: Includes respondents who selected ‘moderately’, ‘very’ or ‘extremely’ trusted.
81% Public broadcasters radio
80% Public broadcasters TV
75% Commercial TV
72% Newspapers (online or print)
65% Commercial radio
62% Internet search
58% Online news sites
54% Pay TV
44% Magazine (printed or online)
31% Social media
Everybody gets it| Free TV Australia
30

SportBringing Australians together as a communityMajor sporting events — such as State of Origin, the AFL and NRL grand finals, Melbourne Cup and the Australian Open — are the largest events on commercial television. They create an opportunity for Australians to gather, and drive the national conversation.
However, Australian sporting culture stretches well beyond these major events. Commercial television broadcasters play an important role in helping to develop and diversify sport.
Recent examples include the NRL All Stars match up between Indigenous and Maori teams and the rapid rise of the Women’s AFL.
The commercial television industry is an important source of revenue for sporting codes directly. It also facilitates other revenue and exposure, by making sponsorship more attractive.
Beyond the event, broadcasters strive to enhance the experience by taking viewers behind the scenes through specific sporting shows and news coverage.
For example, women’s participation in community AFL saw a substantial increase after the announcement of a national Women’s AFL league. As a result of the increased coverage, female players now account for around 30% of all AFL participants today.62
Commercial television sporting coverage is not limited to major national events; it is also used to amplify, promote and grow grass-roots and local sports.
Regional networks create specific news content to cover local leagues and personal interest stories exploring the depth of sport in the local community.
In some instances, broadcasters are directly involved in helping showcase local sporting talent. For example, the Imparja Cup Cricket Carnival is a showcase of more than 20 Indigenous cricket teams held in Alice Springs, and has been running since 1994.
62 Lough, N. & Geurin, A. N., Routledge Handbook of Business of Women’s Sport (Routledge. 2019).
Average commercial TV audience, for the top 10 sporting events
Sport event Audience
State of Origin* 2,994,333
AFL Grand Final 2,964,000
NRL Grand Final 2,659,000
Australian Open Men’s Final 2,106,000
Melbourne Cup 1,919,000
Bathurst 1000 1,387,000
AFL Finals (excluding the Grand Final) 1,053,250
NRL Finals (excluding the Grand Final) 872,556
AFL Regular Season 590,000
NRL Regular Season 520,000
*Reflects the average audience across the three matches.
Everybody gets it | Free TV Australia
31
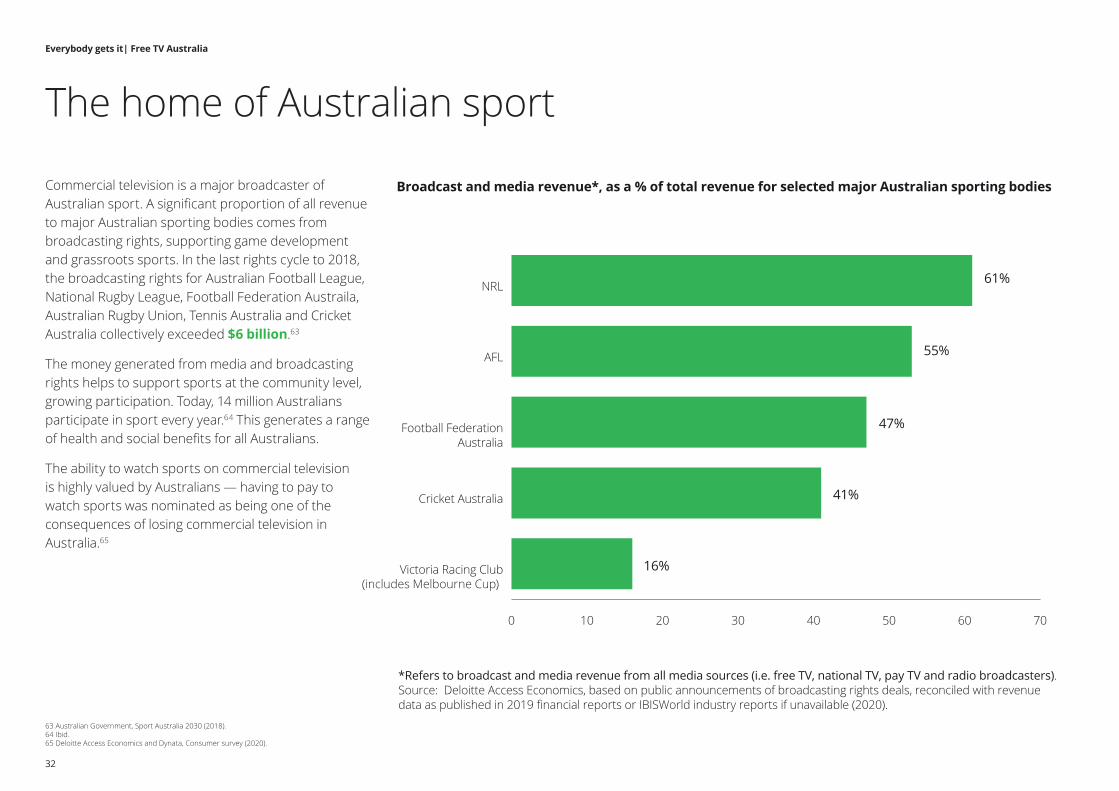
Commercial television is a major broadcaster of Australian sport. A significant proportion of all revenue to major Australian sporting bodies comes from broadcasting rights, supporting game development and grassroots sports. In the last rights cycle to 2018, the broadcasting rights for Australian Football League, National Rugby League, Football Federation Austraila, Australian Rugby Union, Tennis Australia and Cricket Australia collectively exceeded $6 billion.63
The money generated from media and broadcasting rights helps to support sports at the community level, growing participation. Today, 14 million Australians participate in sport every year.64 This generates a range of health and social benefits for all Australians.
The ability to watch sports on commercial television is highly valued by Australians — having to pay to watch sports was nominated as being one of the consequences of losing commercial television in Australia.65
0 10 20 30 40 50 60 70
Victoria Racing Club(Melbourne cup)
Cricket Australia
Football FederationAustralia
AFL
NRL
*Refers to broadcast and media revenue from all media sources (i.e. free TV, national TV, pay TV and radio broadcasters). Source: Deloitte Access Economics, based on public announcements of broadcasting rights deals, reconciled with revenue data as published in 2019 financial reports or IBISWorld industry reports if unavailable (2020).
Broadcast and media revenue*, as a % of total revenue for selected major Australian sporting bodies
61%
53%
47%
41%
16%
The home of Australian sport
63 Australian Government, Sport Australia 2030 (2018).64 Ibid. 65 Deloitte Access Economics and Dynata, Consumer survey (2020).
55%
(includes Melbourne Cup)
Everybody gets it| Free TV Australia
32


Commercial television has many programs that are broadcast live. This allows audiences to watch news, sports and other shows as they are scheduled to appear, providing a forum for families and friends to come together — creating shared experiences.
Compared to on-demand viewing, linear TV viewers are 1.8 times more likely to watch with family or friends.66 During peak times (19:30–21:00), half of all Australian TV viewers are co-viewing.67 Across the entire day, co-viewing sits at just under 42% of total television viewing.68
Considering the average metro viewer watches 2:43 hours of commercial television per day, this represents approximately 8 hours of family time every week.69
But shared experiences aren’t just limited to immediate households and close friends. Commercial television connects millions of Australians all over the country online. Social media provides a forum for viewers to interact with each other as they view their favourite programs live on commercial television. In 2018, free-to-air television (including SBS and ABC) fuelled 57 million social media interactions across Facebook, Twitter and Instagram.70
42% co-viewing
8 hours of family time every week
Commercial television: Australians watch it together
66 IAB, The OTT Co-Viewing Experience: 2017 (2017) <https://www.iab.com/wp-content/uploads/2017/11/The-Co-Viewing-Experience-2017_IAB__.pdf>. 67 ThinkTV, Fact Pack July – December 2018, <https://thinktv.com.au/wp-content/uploads/2019/09/THINKTV_FACT-PACK_H2C18_Public_FINAL-2-1.pdf>.68 Ibid. 69 Deloitte Access Economics calculations, based on OzTAM data (2019). 70 Nielsen Social, Social Content Ratings. 1 Jul – 31 Dec 2018. Episode Report.Note: Includes public broadcasters.
Everybody gets it| Free TV Australia
34

71 Deloitte Access Economics and Dynata, Consumer survey (2020). 72 Ibid. 73 Ibid.74 Ibid.
95% of Australians think that losing commercial television would have an impact on society71
Insights from the consumer survey reveal Australians recognise the value of commercial television for Australian society. 95% of respondents felt that losing commercial television would have an impact on Australian society.72
The most common impacts selected by respondents include less access to Australian news, drama and entertainment programs. Respondents also thought that losing commercial television would see audiences spending money on sport and entertainment that can currently be accessed for free.73
Even people who do not watch commercial television, still feel it plays an important role. Only 14% of those who do not watch commercial television thought losing it would have no impact on Australian society.74
A world without commercial televisionThe top selected reasons from the consumer survey:
Less access to Australian news, drama and entertainment.
Spending money on sports and entertainment currently accessed for free.
People would not know as much about news and what is happening in their community.
Everybody gets it | Free TV Australia
35

Universally availableCommercial television is one of the most available forms of content in Australia.
36
Everybody gets it| Free TV Australia

More than 17 million, or two in three Australians, watch commercial television in an average week.75
Commercial television remains the primary source of news and entertainment for many Australians today. On average, metropolitan viewers watch around 2:43 hours of commercial television per day.76 Older generations tend to watch slightly more than the average – close to 3.5 hours for over 55s.77
The broad reach of commercial television is particularly important for viewers who cannot afford to, or cannot get access to, alternative viewing. While the proportion of Australians using a pay/subscription TV service is increasing, 6.4 million Australians don’t use a paid service.78
75 Deloitte Access Economics based on OzTAM/RegTAM data (2019). Note: Calculated using reach data for commercial free-to-air networks. 76 Ibid. 77 Ibid. 78 Roy Morgan, ‘14.5 million Australians already have Pay TV/Subscription TV as Disney+ enters the market’ (2019),
<https://www.roymorgan.com/findings/8218-netflix-foxtel-stan-pay-tv-oct-2019-201912020339#:~:text=New%20Roy%20Morgan%20research%20shows,and%20Disney%2B%20enter%20the%20market>.
In an average week, more than 17 million Australians watch commercial television
65+
50-64
35-49
25-34
18-24
<18
*Among metropolitan audiences. Source: Deloitte Access Economics (2020) using OzTAM/RegTAM data.
Source: Deloitte Access Economics,based on RegTAM data (2019).
2:43 hourswatched on averageby metropolitanviewers per day
30%
23%
24%
13%
3%
7%
65+
50-64
35-49
25-34
18-24
<18
4.70 million viewers
4:49 hours watched on average
36%
22%
23%
11%
2%
6%
Regional TV
Commercial television audiences, by age*
Age breakdown of metropolitan audiences
3%
7%
14%
25%
19%
32%
Everybody gets it | Free TV Australia
37

Australia has high antenna penetration
…meaning commercial television is more accessible in Australia, compared with other countries.
Source: Deloitte analysis of public data in Deloitte Insights, My antennae are tingling: Terrestrial TV’s surprising staying power (2019).
Canada
USA
15%
13%
38
Everybody gets it| Free TV Australia

UK
France
Sweden
Germany Japan
India
China
Malaysia
Australia
New Zealand
44%
29%
29%
7% 95%
10%
1%
89%
97%
33%
Everybody gets it | Free TV Australia
39

79 Deloitte Access Economics based on OzTAM/RegTAM data (2019). 80 Free TV Australia, News and current affairs.81 RMIT University and Swinburne University of Technology, Measuring Australia’s Digital Divide: The Australian Digital Inclusion Index, (report
commissioned for Telstra, 2019). 82 Deloitte Access Economics and Dynata, Consumer survey (2020). 83 Ibid. Includes those that stated free access to sport was ‘moderately’, ‘very’ or ‘extremely’ important. 84 Ibid. 85 Deloitte Access Economics based on data provided by Free TV members (2019).
32% of all commercial television audiences are regional
20% of commercial television staff are employed in regional areas
Commercial television plays an important role in regional and remote Australia. Regional audiences make up 32% of the entire commercial television audience base.79 Further, commercial television broadcasters provide 66 nightly news bulletins across 40 markets, showcasing local news stories.80
Poor internet connectivity can prohibit regional viewers from accessing alternative streaming or pay TV services online.81 This means regional audiences rely heavily on commercial television for their news and entertainment. Being able to access commercial television, without needing data or internet, was highly valued by 87% of Australians.82 Further, 82% of regional Australians consider free access to sport to be important to society.83
Important for regional communities
The accessibility of commercial television in regional and remote communities is especially important given the age profile of these communities. Older individuals may struggle to access entertainment or news programs online, if they are unfamiliar with online platforms or the internet.
Regional viewers value the fact that commercial television is freely available. Half of all regional viewers stated it was ‘extremely’ important nobody has to pay money to watch commercial television, compared to 41% of metropolitan viewers.84
Beyond the benefits for viewers, commercial television also plays a role as a regional employer. One in five (20%) commercial television staff are employed in regional areas, supporting local economies.85
Everybody gets it| Free TV Australia
40


Australians do not think commercial television should be a paid service
86 Deloitte Access Economics and Dynata, Consumer survey (2020). 87 Ibid. 88 Ibid.
Should Australians have to pay for commercial television?
People should pay to access commercial TV7%
Commercial TV shouldcontinue to be freely available to everyone93%
In many countries, members of the public are directly charged to access free-to-air television via licence fees (sometimes several hundred dollars), as a way to help fund public broadcasting. A key part of the accessbility of commercial television in Australia is its affordability for general audiences.
Australians support commercial television remaining ‘free’. Only 7% of survey respondents believe people should pay to access commercial television, compared to 93% of respondents who think commercial television should be freely available across Australia.86
The accessibility of commercial television was highly valued by survey respondents. 91% thought it was moderately, very or extremely important that commercial television was available regardless of location or how much you earn. 91% also thought it was important that nobody has to pay money to watch commercial television.87
While streaming video on demand (SVOD) services provide viewers with the option of paying for an ad-free service, many viewers indicated that they value advertising on commercial television. More than two-thirds of Australians (72%) value the information about products/services broadcast on commercial television via advertising.88
Source: Deloitte Access Economics and Dynata, Consumer survey (2020).
Everybody gets it| Free TV Australia
42

BVOD and access to content
0
50
100
150
200
250
300
350
Jul-Dec 18Jan-Jun 19
Source: ThinkTV, Fact Pack, H1 2019 (2019).
Live On Demand
BVOD consumption by calendar half99 BVOD average daily hours per device type100
236
173
104
78
0 100 200 300 400 500 600 700 800 900
Mobiles
PC/Laptop
Tablets
Connected TV 897
339
338
260
89 Deloitte Access Economics and Dynata, Consumer survey (2020). NOTE: Includes those that selected ‘moderately/, ‘very’ or ‘extremely’ important. 90 Deloitte Access Economics based on OzTAM/RegTAM data (2019). 91 Deloitte Access Economics based on data from Deloitte, Media Consumer Survey 2019 (2019).92 Think TV, Fact Pack, H1 2019 (2019) via ACMA, Communications Report 2018-19 (2020),
<https://www.acma.gov.au/publications/2020-02/report/communications-report-2018-19>.93 Ibid.
94 Ibid.
Commercial television audiences are benefitting from the proliferation of Broadcast Video on Demand (BVOD), which means they can watch what they want, whenever they want, on the device they choose.
BVOD gives viewers access to a vast library of free-to-air content. And unlike other online subscription streaming services, viewers are not charged a direct fee to access content. Insights from the consumer survey revealed that 82% of Australians think the ability to view commercial television live and on catch-up is a valuable feature of the medium.89
BVOD audiences for commercial television vary from broadcast TV. More than half of all commercial television audiences for linear television are above the age of 50.90 In contrast, Millennials are the generation most likely to watch BVOD every day.91
The popularity of BVOD is growing, up 35% from the second calendar half of 2018 to the first half of 2019.92 In fact, from January to July 2019, more than 340 million hours of BVOD were consumed (both live, and on demand).93
In offering its service online via BVOD, commercial television allows audiences to watch content on a range of devices; including connected TV, computers, phones and others.94 However, as shown in the chart, Connected TVs — the ‘big screen’ — are still the most popular device for accessing BVOD services.
BVOD total daily average hours per device type (000s)
BVOD consumption by calendar half
Everybody gets it | Free TV Australia
43

Innovation
Businesses innovate for commercial reasons. This innovation also creates a better experience for Australians. Recent innovations have contributed to providing Australians with access to more content, in more ways. For example, multi-channelling is now well established, and means that there is more content to choose from in linear broadcasting. Broadcast video on demand services are widely available, and provide anywhere, anytime access to substantial libraries.
Commercial television broadcasters are also using new technology to provide timely news, even from locations which are difficult or dangerous to access.
For example, broadcasters are using drones to capture video of these locations, where before they might have required a helicopter. This means that broadcasters can provide better news coverage at lower cost. Broadcasters are also using artificial intelligence and machine learning to better meet the needs of advertisers. This new technology opens the ability to deliver improved performance for advertising partners and more personalised experiences for viewers.
Free TV members have all made significant investments in technologies that combine the power of television’s reach and brand building power with data and targeted advertising capabilities.
For example, broadcasters joined together in late 2019 to develop a demand-side buying platform (DSP) for the entire industry. The DSP will provide advertisers with a single interface to buy television across all broadcasters and all platforms in the Australian market.
Network 10 also launched a dynamic advertising platform, Buy10 in 2019 which enables precision targeting, automated tracking and inventory optimisation.
The Nine Network has invested in simplifying and automating the process for buying television advertising. 9Voyager, an extension of the previously launched 9Galaxy, gives SMEs access to ad buying platforms. Nine also plans to extend 9Galaxy to deliver audiences across key inventory sources, linear TV, live streaming and 9Now on a connected TV, mobile, desktop or tablet.
Seven West Media launched 7CAP (Contextual Ad Placement) in 2019. 7CAP can identify the best “objects, environments and moods” for specific advertising campaigns. By making sure that an ad is placed at the right moment in the right program, it expects to create more impactful advertising.
Free TV has a history of innovation in transmission from analog to digital, from black and white to colour, services from one channel to many, production technologies from studio to outside broadcast, drone cameras and live news gathering. BVOD services, live-streaming, multi-channelling, Hybrid Broadband Television and trials of Next Generation DTT are all part of innovation in television.
Everybody gets it| Free TV Australia
44

Industry challengesAround the world, the media landscape has changed. While this presents opportunities for commercial television broadcasters, it also creates challenges. CostsCommercial broadcasters in Australia operate in a high-cost environment.
In fact, over a third of screen producers cite high labour and capital costs in Australia as being the top challenge they face in the industry.95
Not only does this affect overall operational costs (due to high wages), but also impacts the ability for broadcasters to produce local content and adhere to regulatory standards.
RevenuesAdvertising demand for commercial television has declined, driven by a shifting preference towards online media.
Industry revenue (including national broadcasters) declined by 3.6% per annum in the five years to 2019, and is expected to drop by a further 2.8% annually to 2024.96
Increasing competition from other sources (such as SVOD), coupled with declining viewership, will continue to impact networks’ profitability.
ViewershipIn 2019, more than half (53%) of all Australian households had at least one on-demand streaming subscription, up from 12% in 2015.97 Not only does the proliferation of SVOD mean audiences have access to more content, but it also means viewers are consuming more international content than ever before.
Today, commercial television viewing makes up a smaller proportion of our overall viewing time.98 This is especially true for Millennials, who are more likely to watch content via SVOD than broadcast TV.99
Commercial television’s reach has also declined - by 10% in the five years to 2019.100
Regulatory environmentDespite significant disruption in the media landscape, regulation has remained relatively stagnant over the past decade.
In previous decades, the extensive regulatory obligations on the sector including around content, advertising, captioning and regulatory oversight of content have existing alongside favourable policy settings such as anti-siphoning laws, the prohibition on additional networks, and access to spectrum. While there have been regulatory updates that have benefited the sector such as the abolition of broadcast licence fees and the removal of restrictions on cross-media ownership, the industry’s view is that over time, value of policy benefits has declined relative to the cost of obligations.
In 2020, Australia’s media regulatory regime is a patchwork of rules based on incremental change. The system is not fit-for-purpose and commercial television is not treated the same way as other media. Several Government reports have suggested regulatory changes are not keeping pace with the changing media landscape (e.g. 2010 Convergence Review, 2019 ACCC Digital Platforms Inquiry).
95 Deloitte Access Economics, Screen production in Australia: Independent screen production industry census (2018).96 IBISWorld, Industry Report: Free-to-Air Broadcasting in Australia (2019).97 Deloitte Access Economics based on data from Deloitte, Media Consumer Survey 2019 (2019).98 Ibid.99 Ibid. 100 Deloitte Access Economics based on OzTAM/RegTAM data (2019).
Everybody gets it | Free TV Australia
45

Appendix: Economic contribution methodology
Everybody gets it | Free TV Australia
47

Economic contribution studies are intended to quantify measures such as value added, exports, imports and employment associated with a given industry or firm, in a historical reference year. The economic contribution is a measure of the value of production by a firm or industry.
A.1. Value addedValue added is the most appropriate measure of an industry’s economic contribution to gross domestic product (GDP) at the national level, or gross state product (GSP) at the state level. Other measures, such as total revenue or total exports, may be easier to estimate than value added, but they ‘double count’. That is, they overstate the contribution of a company to economic activity because they include, for example, the value added by external firms supplying inputs or the value added by other industries.
A.2. Measuring the economic contributionThere are several commonly used measures of economic activity, each of which describes a different aspect of an industry’s economic contribution.
Value added measures the value of output (i.e. goods and services) generated by the entity’s factors of production (i.e. labour and capital) as measured in the income to those factors of production. The sum of value added across all entities in the economy equals GDP. Given the relationship to GDP, the value added measure can be thought of as the increased contribution to welfare.
Value added is the sum of: Gross operating surplus (GOS), which represents the value of income generated by the entity’s direct capital inputs, generally measured as earnings before interest, tax, depreciation and amortisation (EBITDA).
Labour income, which represents the value of output generated by the entity’s direct labour inputs, as measured by the income to labour.
Tax on production less subsidy provided for production, which generally includes company taxes and taxes on employment (given the returns to capital before tax (EBITDA) are calculated, company tax is not included or this would double count that tax). Gross output measures the total value of the goods and services supplied by the entity. This is a broader measure than value added because it is an addition to the value added generated by the entity. It also includes the value of intermediate inputs used by the entity that flow from value added generated by other entities.
Employment is a fundamentally different measure of activity to those above. It measures the number of workers that are employed by the entity, rather than the value of the workers’ output.
Everybody gets it| Free TV Australia
48

Figure A.1 shows the accounting framework used to evaluate economic activity, along with the components that make up gross output. Gross output is the sum of value added and the value of intermediate inputs. Value added can be calculated directly by summing the payments to the primary factors of production, labour (i.e. salaries) and capital (i.e. GOS, or profit), as well as production taxes less subsidies. The value of intermediate inputs can also be calculated directly by summing up expenses related to non-primary factor inputs.
A.3.Direct and indirect contributionsDirect economic contribution is a representation of the flow from labour and capital within the sector of the economy in question. Indirect contribution is a measure of the demand for goods and services produced in other sectors as a result of demand generated by the sector in question.
Estimation of the indirect economic contribution is undertaken in an input-output (IO) framework using Australian Bureau of Statistics input-output tables, which report the inputs and outputs of specific sectors of the economy (ABS 2010). The total economic contribution to the economy is the sum of the direct and indirect economic contributions.
Figure A.1: Economic activity accounting framework
Intermediate inputs (sourced from other industries)
Gross operating labour
Labour
Production taxes less subsidies
Value added (output less intermediate inputs)
Output (total revenue)
Everybody gets it | Free TV Australia
49

A.4.Limitations of economic contribution studiesWhile describing the geographic origin of production inputs may be a guide to a firm’s linkages with the local economy, it should be recognised that these are the type of normal industry linkages that characterise all economic activities.
Unless there is significant unused capacity in the economy (such as unemployed labour) there is only a weak relationship between a firm’s economic contribution as measured by value added (or other static aggregates) and the welfare or living standard of the community.
Indeed, the use of labour and capital by demand created from the industry comes at an opportunity cost as it may reduce the amount of resources available to spend on other economic activities. This is not to say that the economic contribution, including employment, is not important.
As stated by the Productivity Commission in the context of Australia’s gambling industries:
“Value added, trade and job creation arguments need to be considered in the context of the economy as a whole … income from trade uses real resources, which could have been employed to generate benefits elsewhere. These arguments do not mean that jobs, trade and activity are unimportant in an economy. To the contrary they are critical to people’s well-being. However, any particular industry’s contribution to these benefits is much smaller than might at first be thought, because substitute industries could produce similar, though not equal gains.”
In a fundamental sense, economic contribution studies are simply historical accounting exercises. No ‘what-if’, or counterfactual inferences — such as ‘what would happen to living standards if the firm disappeared?’ – should be drawn from them.
The analysis — relies on a national input-output table modelling framework and there are some limitations to this modelling framework. The analysis assumes
that goods and services provided to the sector are produced by factors of production that are located completely within the state or region defined and that income flows do not leak to other states.
The IO framework and the derivation of the multipliers also assume that the relevant economic activity takes place within an unconstrained environment. That is, an increase in economic activity in one area of the economy does not increase prices and subsequently crowd out economic activity in another area of the economy. As a result, the modelled total and indirect contribution can be regarded as an upper-bound estimate of the contribution made by the supply of intermediate inputs.
Similarly, the IO framework does not account for further flow-on benefits as captured in a more dynamic modelling environment like a Computable General Equilibrium model.
Everybody gets it| Free TV Australia
50

A.5.Input-output analysisIO tables are required to account for the intermediate flows between sectors. These tables measure the direct economic activity of every sector in the economy at the national level. Importantly, these tables allow intermediate inputs to be further broken down by source. These detailed intermediate flows can be used to derive the total change in economic activity for a given sector.
A widely used measure of the spill over of activity from one sector to another is captured by the ratio of the total to direct change in economic activity. The resulting estimate is typically referred to as ‘the multiplier’. A multiplier greater than one implies some indirect activity, with higher multipliers indicating relatively larger indirect and total activity flowing from a given level of direct activity.
The IO matrix used for Australia is derived from the ABS IO tables. The industry classification used for input-output tables is based on ANZSIC, with 111 sectors in the modelling framework.
Everybody gets it | Free TV Australia
51

Appendix: Consumer Survey
52
Everybody gets it| Free TV Australia

Consumer surveyConsumer perspectives on commercial television in this report were sourced from a consumer survey, fielded by Dynata, in May 2020.
Over 1,000 Australians participated, providing their views on commercial free-to-air television, its features and value in contemporary society. Survey participants included both people who don’t watch commercial television and people who do. The survey was also nationally representative in terms of age, gender and location.
Fielded at the height of the COVID-19 pandemic, these survey results provide a unique perspective into audience attitudes during the crisis. However, it should be noted that views may differ to other times.
The demographic splits of the survey are provided on the subsequent slides.
Age
18-24 25-34 35-44 45-54 55-6465-74 75+
11%
19%
19%19%
15%
9%
8%
Deloitte Access Economics based on Dynata data, n=1008
Employment status
Working full-timeWorking casually
Working part-timeWorking in own business
Studying and not working Home dutiesUnemployed (seeking work)Not employed andnot seeking work
35%
14%6%4%
3%
6%
19%
9%4%
Deloitte Access Economics based on Dynata data, n=1008
Everybody gets it | Free TV Australia
53

Income
Less than $20,000$40,000-$59,999
$20,000-$39,999$60,000-$79,999
$80,000-$99,999 $100,000-$149,999$150,000-$199,999 $200,000-$299,999$300,000 or over
5%
1%
17%14%
18%
9%4%
14%
18%
Deloitte Access Economics based on Dynata data, n=1008
Household composition
One person (just me)Couple with children
Couple without childrenOne-parent family
Other family Group (e.g. housemates)
18%
32%
6%
6%
7%
31%
Deloitte Access Economics based on Dynata data, n=1008
Everybody gets it| Free TV Australia
54

Everybody gets it | Free TV Australia
55
This publication contains general information only, and none of Deloitte Touche Tohmatsu Limited, its member firms, or their related entities (collectively the “Deloitte Network”) is, by means of this publication, rendering professional advice or services. Before making any decision or taking any action that may affect your finances or your business, you should consult a qualified professional adviser. No entity in the Deloitte Network shall be responsible for any loss whatsoever sustained by any person who relies on this publication.
Deloitte refers to one or more of Deloitte Touche Tohmatsu Limited (“DTTL”), its global network of member firms, and their related entities. DTTL (also referred to as “Deloitte Global”) and each of its member firms and their affiliated entities are legally separate and independent entities. DTTL does not provide services to clients. Please see www.deloitte.com/about to learn more.
About Deloitte
Deloitte is a leading global provider of audit and assurance, consulting, financial advisory, risk advisory, tax and related services. Our network of member firms in more than 150 countries and territories serves four out of five Fortune Global 500®companies. Learn how Deloitte’s approximately 286,000 people make an impact that matters at www.deloitte.com.
About Deloitte Asia Pacific
Deloitte Asia Pacific Limited is a company limited by guarantee and a member firm of DTTL. Members of Deloitte Asia Pacific Limited and their related entities provide services in Australia, Brunei Darussalam, Cambodia, East Timor, Federated States of Micronesia, Guam, Indonesia, Japan, Laos, Malaysia, Mongolia, Myanmar, New Zealand, Palau, Papua New Guinea, Singapore, Thailand, The Marshall Islands, The Northern Mariana Islands, The People’s Republic of China (incl. Hong Kong SAR and Macau SAR), The Philippines and Vietnam, in each of which operations are conducted by separate and independent legal entities.
About Deloitte Australia
In Australia, the Deloitte Network member is the Australian partnership of Deloitte Touche Tohmatsu. As one of Australia’s leading professional services firms. Deloitte Touche Tohmatsu and its affiliates provide audit, tax, consulting, and financial advisory services through approximately 8,000 people across the country. Focused on the creation of value and growth, and known as an employer of choice for innovative human resources programs, we are dedicated to helping our clients and our people excel. For more information,
please visit our web site at www.deloitte.com.au
Liability limited by a scheme approved under Professional Standards Legislation.
Member of Deloitte Asia Pacific Limited and the Deloitte Network.
© 2020 Deloitte Touche Tohmatsu.
Designed by CoRe Creative Services. RITM0407944