Every Minute Around the World
76
Every Minute Around the World UPS Annual Report 2004
Transcript of Every Minute Around the World

Every Minute Around the World
UPS Annual Report 2004
55 Glenlake Parkway, NEAltanta, GA 30328
www.ups.comUPS Annual Report 2004

�������������������������������������������������������������������������������������������������������������������������������������������������������������������������������������������������������������������������������������������������������������������������������������������������������������������������������������������������
1 1 1 0 9 8 7 6 5 4 3 2 1 0 1 2 3 4 5 6 7 8 9 1 0 1 1 1 2
Copyright © 2005 United Parcel Service of America, Inc. All rights reserved.
Investor ServiceDirect EnhancementsMellon’s Investor ServiceDirect® application has been redesigned. It now offers: n Increased functionality and ease of use. n A streamlined portfolio page that summarizes your profile information and directs you quickly and easily to your accounts and the information you’re seeking. n User-friendly navigation that enables you to perform your transactions faster with easy access to account history and forms and materials. n New helpful tips, shortcuts and related links that give you the answers to the most common questions. n An expanded help center that features a new user manual, FAQs and investor support.
UPS Shareowner ServicesConvenient access 24 hours a day, 7 days a week
Class A Common Shareowners www.melloninvestor.com Select MellonOne 888-663-8325
Class B Common Shareowners www.melloninvestor.com Select for Investors and then Investor ServiceDirect 800-758-4674
Calls from outside the United States: 201-373-5334 TDD for hearing impaired: 800-231-5469 TDD for non-U.S. shareowners: 201-329-8354
Online Access to Shareowner Materials through MLink® Interested in receiving shareowner information electronically? Enroll in MLink, a self-service program that provides electronic notification and secure access to shareowner communications. To enroll, follow the MLink enrollment instructions when you access your UPS Class A or UPS Class B common shareowner account via the Web sites previously noted.
Transfer Agent and RegistrarAccount information and transactions are managed by Mellon Investor Services LLC. Please direct notices of address changes or questions regarding account status, stock transfers, lost certificates, or dividend payments to the transfer agent at the address below.
United Parcel Service, Inc.c/o Mellon Investor Services LLCP.O. Box 3415South Hackensack, NJ 07606-3415
or
85 Challenger RoadRidgefield Park, NJ 07660

�������������������������������������������������������������������������������������������������������������������������������������������������������������������������������������������������������������������������������������������������������������������������������������������������������������������������������������������������
1 1 1 0 9 8 7 6 5 4 3 2 1 0 1 2 3 4 5 6 7 8 9 1 0 1 1
IntroductionLetter to shareownersFinancial highlightsSmall package businessSupply chain businessHow we run our businessWorldwide recognitionUPS senior leadershipSelected financial dataFinancial table of contentsInvestor information
1368
162021222425
72
Copyright © 2005 United Parcel Service of America, Inc. All rights reserved.
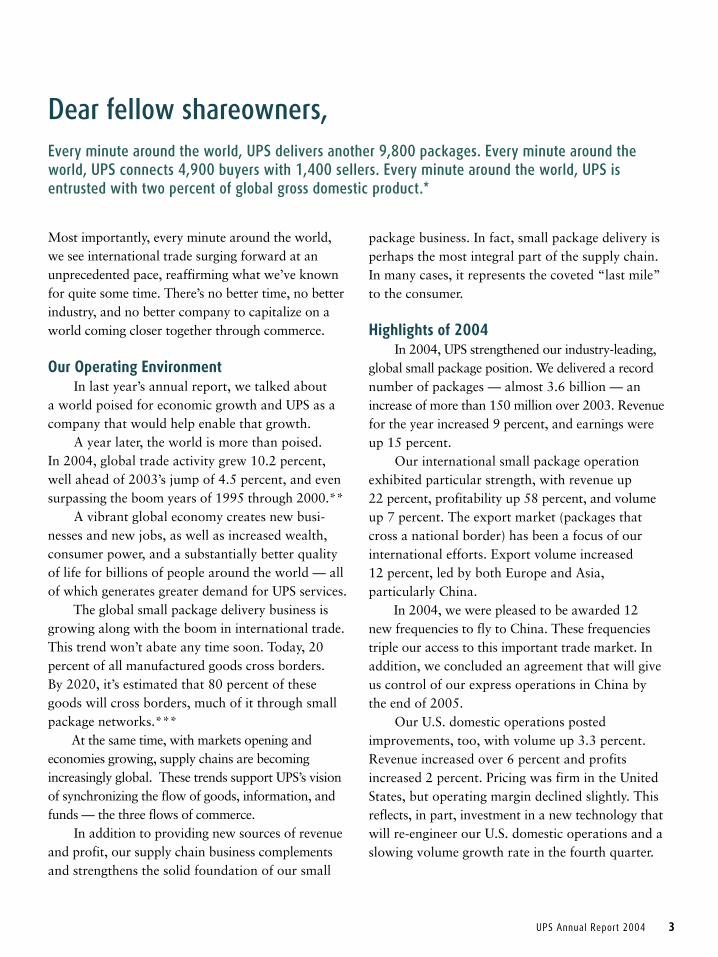
Dear fellow shareowners,Every minute around the world, UPS delivers another 9,800 packages. Every minute around the world, UPS connects 4,900 buyers with 1,400 sellers. Every minute around the world, UPS is entrusted with two percent of global gross domestic product.*
Most importantly, every minute around the world,we see international trade surging forward at an unprecedented pace, reaffirming what we’ve known for quite some time. There’s no better time, no better industry, and no better company to capitalize on a world coming closer together through commerce.
Our Operating Environment In last year’s annual report, we talked about a world poised for economic growth and UPS as a company that would help enable that growth. A year later, the world is more than poised. In 2004, global trade activity grew 10.2 percent, well ahead of 2003’s jump of 4.5 percent, and even surpassing the boom years of 1995 through 2000.** A vibrant global economy creates new busi-nesses and new jobs, as well as increased wealth, consumer power, and a substantially better quality of life for billions of people around the world — all of which generates greater demand for UPS services. The global small package delivery business is growing along with the boom in international trade. This trend won’t abate any time soon. Today, 20 percent of all manufactured goods cross borders. By 2020, it’s estimated that 80 percent of these goods will cross borders, much of it through small package networks.*** At the same time, with markets opening and economies growing, supply chains are becoming increasingly global. These trends support UPS’s vision of synchronizing the flow of goods, information, and funds — the three flows of commerce. In addition to providing new sources of revenue and profit, our supply chain business complements and strengthens the solid foundation of our small
package business. In fact, small package delivery is perhaps the most integral part of the supply chain. In many cases, it represents the coveted “last mile” to the consumer.
Highlights of 2004 In 2004, UPS strengthened our industry-leading, global small package position. We delivered a record number of packages — almost 3.6 billion — an increase of more than 150 million over 2003. Revenue for the year increased 9 percent, and earnings were up 15 percent. Our international small package operation exhibited particular strength, with revenue up 22 percent, profitability up 58 percent, and volume up 7 percent. The export market (packages that cross a national border) has been a focus of our international efforts. Export volume increased 12 percent, led by both Europe and Asia,particularly China. In 2004, we were pleased to be awarded 12 new frequencies to fly to China. These frequencies triple our access to this important trade market. In addition, we concluded an agreement that will give us control of our express operations in China by the end of 2005. Our U.S. domestic operations posted improvements, too, with volume up 3.3 percent. Revenue increased over 6 percent and profits increased 2 percent. Pricing was firm in the United States, but operating margin declined slightly. This reflects, in part, investment in a new technology that will re-engineer our U.S. domestic operations and a slowing volume growth rate in the fourth quarter.
UPS Annual Report 2004 3
UPS’s financial strength is derived from its unique business model, combined with a company culture developed over 97 years. The business model is based on an integrated network where all systems work cohesively together. One global network results in the most efficient use of assets and the highest reliability levels. And it makes it easier to bring products and services that are successful in the United States to the global market.
UPS produces the best financial returns in the industry
6 UPS Annual Report 2004
A significant aspect of UPS’s culture that contributes to the strength of the company is the owner/management philosophy, in place since the 1920s. This means UPS is run by investors for investors. As a result, the company brings a long-term focus to investment decision-making, with a keen eye on economic profit. n
��������������������
��
���
���
���
���
���
��
����
����
����
����
����
�� ��������
���
�����������������������
���
��
����
��
����
��
��
����
����
����
�����
����
��
��������������������������������������
��������
�����������������������
���
��
����
��
����
��
��
����
����
����
����
����
�� ��������
��������������������������������������
����������������������������������������
���
����
����
����
���
���
��
������
������
������
��������
�� ��������
Since 2000, revenue increased 24 percent
Net income has been improving due primarily to the impact of strong international growth and improvements in non-package.
With a relatively constant number of shares outstanding, diluted earnings per share have increased 17 percent since 2000.
One hundred dollars invested in UPS stock at the end of 2000, with reinvested dividends, would have increased over 50 percent in value by the end of 2004.

ATLANTA, GEORGIA 7:24 A.M.
Michael L. EskewChairman and Chief Executive Officer
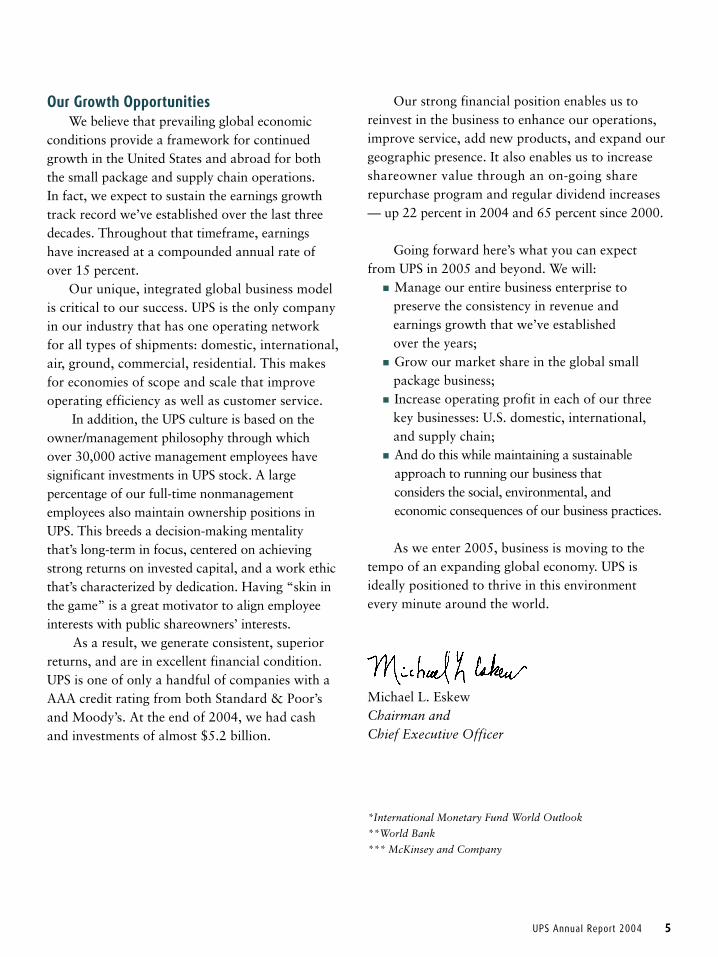
Our Growth Opportunities We believe that prevailing global economic conditions provide a framework for continued growth in the United States and abroad for both the small package and supply chain operations. In fact, we expect to sustain the earnings growth track record we’ve established over the last three decades. Throughout that timeframe, earnings have increased at a compounded annual rate of over 15 percent. Our unique, integrated global business model is critical to our success. UPS is the only company in our industry that has one operating network for all types of shipments: domestic, international, air, ground, commercial, residential. This makes for economies of scope and scale that improve operating efficiency as well as customer service. In addition, the UPS culture is based on the owner/management philosophy through which over 30,000 active management employees have significant investments in UPS stock. A large percentage of our full-time nonmanagement employees also maintain ownership positions in UPS. This breeds a decision-making mentality that’s long-term in focus, centered on achieving strong returns on invested capital, and a work ethic that’s characterized by dedication. Having “skin in the game” is a great motivator to align employee interests with public shareowners’ interests. As a result, we generate consistent, superior returns, and are in excellent financial condition. UPS is one of only a handful of companies with a AAA credit rating from both Standard & Poor’s and Moody’s. At the end of 2004, we had cash and investments of almost $5.2 billion.
Our strong financial position enables us to reinvest in the business to enhance our operations, improve service, add new products, and expand our geographic presence. It also enables us to increase shareowner value through an on-going share repurchase program and regular dividend increases — up 22 percent in 2004 and 65 percent since 2000.
Going forward here’s what you can expect from UPS in 2005 and beyond. We will: n Manage our entire business enterprise to preserve the consistency in revenue and earnings growth that we’ve established over the years; n Grow our market share in the global small package business; n Increase operating profit in each of our three key businesses: U.S. domestic, international, and supply chain; n And do this while maintaining a sustainable approach to running our business that considers the social, environmental, and economic consequences of our business practices.
As we enter 2005, business is moving to the tempo of an expanding global economy. UPS is ideally positioned to thrive in this environment every minute around the world.
Michael L. EskewChairman and Chief Executive Officer
*International Monetary Fund World Outlook
**World Bank
*** McKinsey and Company
UPS Annual Report 2004 5
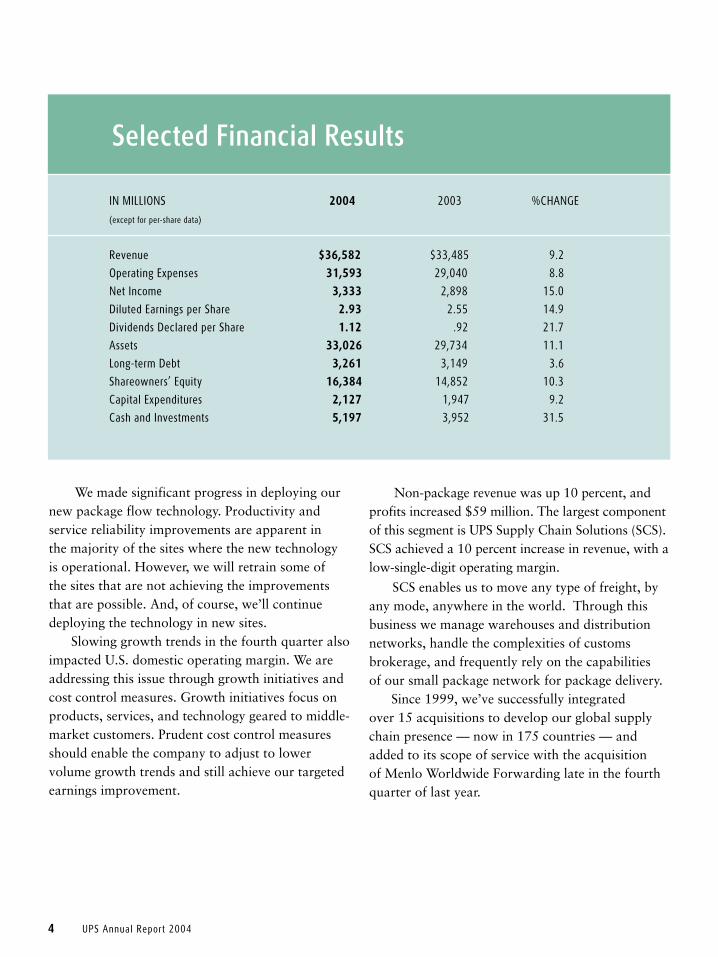
We made significant progress in deploying our new package flow technology. Productivity and service reliability improvements are apparent in the majority of the sites where the new technology is operational. However, we will retrain some of the sites that are not achieving the improvements that are possible. And, of course, we’ll continue deploying the technology in new sites. Slowing growth trends in the fourth quarter also impacted U.S. domestic operating margin. We are addressing this issue through growth initiatives and cost control measures. Growth initiatives focus on products, services, and technology geared to middle- market customers. Prudent cost control measures should enable the company to adjust to lower volume growth trends and still achieve our targeted earnings improvement.
Non-package revenue was up 10 percent, and profits increased $59 million. The largest component of this segment is UPS Supply Chain Solutions (SCS). SCS achieved a 10 percent increase in revenue, with a low-single-digit operating margin.
SCS enables us to move any type of freight, by any mode, anywhere in the world. Through this business we manage warehouses and distribution networks, handle the complexities of customs brokerage, and frequently rely on the capabilities of our small package network for package delivery. Since 1999, we’ve successfully integrated over 15 acquisitions to develop our global supply chain presence — now in 175 countries — and added to its scope of service with the acquisition of Menlo Worldwide Forwarding late in the fourth quarter of last year.
4 UPS Annual Report 2004 UPS Annual Report 2004 5
������������ � � ������������������ ������ � ������ ����������������������������������
���������������������������
�������� � � � ���������������������������� ������������������� �� �����
������������������� � � ���� ������� ���� �������� �� ������ � � � �
������������ � � � ���� ��������� ������ ��������������������� ����� � � � �
���������������������������� � ���� ���������� ������� ��������������������� ����� � � �
����������������������������� � ���� ���������� ��������� ����������� � ����� � � � �
������� � � � � ���� ��������� ����� �������������������� ����� � � � �
���������������� � � ���� ��������� ������� ��������� �� ������ � � � �
�������������������� � � ���� ������������������������������������������������� ����� � � �
��������������������� � � ���� ��������� ��������������������� �� ������ � � � �
��������������������� � � � ��������� ��������������������������������� ����
� � � � �
Selected Financial Results
UPS is the world’s largest package delivery company and a global leader in supply chain services. At any given moment, anywhere around the globe, UPS people enable the movement of goods, information, and funds through one integrated network that operates in more than 200 countries and territories.
�������������������������������������������������������������������������������������������������������������������������������������������������������������������������������������������������������������������������������������������������������������������������������������������������������������������������������������������������
1 1 1 0 9 8 7 6 5 4 3 2 1 0 1 2 3 4 5 6 7 8 9 1 0 1 1
IntroductionLetter to shareownersFinancial highlightsSmall package businessSupply chain businessHow we run our businessWorldwide recognitionUPS senior leadershipSelected financial dataFinancial table of contentsInvestor information
1368
162021222425
72
Copyright © 2005 United Parcel Service of America, Inc. All rights reserved.
Dear fellow shareowners,Every minute around the world, UPS delivers another 9,800 packages. Every minute around the world, UPS connects 4,900 buyers with 1,400 sellers. Every minute around the world, UPS is entrusted with two percent of global gross domestic product.*
Most importantly, every minute around the world,we see international trade surging forward at an unprecedented pace, reaffirming what we’ve known for quite some time. There’s no better time, no better industry, and no better company to capitalize on a world coming closer together through commerce.
Our Operating Environment In last year’s annual report, we talked about a world poised for economic growth and UPS as a company that would help enable that growth. A year later, the world is more than poised. In 2004, global trade activity grew 10.2 percent, well ahead of 2003’s jump of 4.5 percent, and even surpassing the boom years of 1995 through 2000.** A vibrant global economy creates new busi-nesses and new jobs, as well as increased wealth, consumer power, and a substantially better quality of life for billions of people around the world — all of which generates greater demand for UPS services. The global small package delivery business is growing along with the boom in international trade. This trend won’t abate any time soon. Today, 20 percent of all manufactured goods cross borders. By 2020, it’s estimated that 80 percent of these goods will cross borders, much of it through small package networks.*** At the same time, with markets opening and economies growing, supply chains are becoming increasingly global. These trends support UPS’s vision of synchronizing the flow of goods, information, and funds — the three flows of commerce. In addition to providing new sources of revenue and profit, our supply chain business complements and strengthens the solid foundation of our small
package business. In fact, small package delivery is perhaps the most integral part of the supply chain. In many cases, it represents the coveted “last mile” to the consumer.
Highlights of 2004 In 2004, UPS strengthened our industry-leading, global small package position. We delivered a record number of packages — almost 3.6 billion — an increase of more than 150 million over 2003. Revenue for the year increased 9 percent, and earnings were up 15 percent. Our international small package operation exhibited particular strength, with revenue up 22 percent, profitability up 58 percent, and volume up 7 percent. The export market (packages that cross a national border) has been a focus of our international efforts. Export volume increased 12 percent, led by both Europe and Asia,particularly China. In 2004, we were pleased to be awarded 12 new frequencies to fly to China. These frequencies triple our access to this important trade market. In addition, we concluded an agreement that will give us control of our express operations in China by the end of 2005. Our U.S. domestic operations posted improvements, too, with volume up 3.3 percent. Revenue increased over 6 percent and profits increased 2 percent. Pricing was firm in the United States, but operating margin declined slightly. This reflects, in part, investment in a new technology that will re-engineer our U.S. domestic operations and a slowing volume growth rate in the fourth quarter.
UPS Annual Report 2004 3
UPS’s financial strength is derived from its unique business model, combined with a company culture developed over 97 years. The business model is based on an integrated network where all systems work cohesively together. One global network results in the most efficient use of assets and the highest reliability levels. And it makes it easier to bring products and services that are successful in the United States to the global market.
UPS produces the best financial returns in the industry
6 UPS Annual Report 2004
A significant aspect of UPS’s culture that contributes to the strength of the company is the owner/management philosophy, in place since the 1920s. This means UPS is run by investors for investors. As a result, the company brings a long-term focus to investment decision-making, with a keen eye on economic profit. n
��������������������
��
���
���
���
���
���
��
����
����
����
����
����
�� ��������
���
�����������������������
���
��
����
��
����
��
��
����
����
����
�����
����
��
��������������������������������������
��������
�����������������������
���
��
����
��
����
��
��
����
����
����
����
����
�� ��������
��������������������������������������
����������������������������������������
���
����
����
����
���
���
��
������
������
������
��������
�� ��������
Since 2000, revenue increased 24 percent
Net income has been improving due primarily to the impact of strong international growth and improvements in non-package.
With a relatively constant number of shares outstanding, diluted earnings per share have increased 17 percent since 2000.
One hundred dollars invested in UPS stock at the end of 2000, with reinvested dividends, would have increased over 50 percent in value by the end of 2004.
ATLANTA, GEORGIA 7:24 A.M.
Michael L. EskewChairman and Chief Executive Officer
Our Growth Opportunities We believe that prevailing global economic conditions provide a framework for continued growth in the United States and abroad for both the small package and supply chain operations. In fact, we expect to sustain the earnings growth track record we’ve established over the last three decades. Throughout that timeframe, earnings have increased at a compounded annual rate of over 15 percent. Our unique, integrated global business model is critical to our success. UPS is the only company in our industry that has one operating network for all types of shipments: domestic, international, air, ground, commercial, residential. This makes for economies of scope and scale that improve operating efficiency as well as customer service. In addition, the UPS culture is based on the owner/management philosophy through which over 30,000 active management employees have significant investments in UPS stock. A large percentage of our full-time nonmanagement employees also maintain ownership positions in UPS. This breeds a decision-making mentality that’s long-term in focus, centered on achieving strong returns on invested capital, and a work ethic that’s characterized by dedication. Having “skin in the game” is a great motivator to align employee interests with public shareowners’ interests. As a result, we generate consistent, superior returns, and are in excellent financial condition. UPS is one of only a handful of companies with a AAA credit rating from both Standard & Poor’s and Moody’s. At the end of 2004, we had cash and investments of almost $5.2 billion.
Our strong financial position enables us to reinvest in the business to enhance our operations, improve service, add new products, and expand our geographic presence. It also enables us to increase shareowner value through an on-going share repurchase program and regular dividend increases — up 22 percent in 2004 and 65 percent since 2000.
Going forward here’s what you can expect from UPS in 2005 and beyond. We will: n Manage our entire business enterprise to preserve the consistency in revenue and earnings growth that we’ve established over the years; n Grow our market share in the global small package business; n Increase operating profit in each of our three key businesses: U.S. domestic, international, and supply chain; n And do this while maintaining a sustainable approach to running our business that considers the social, environmental, and economic consequences of our business practices.
As we enter 2005, business is moving to the tempo of an expanding global economy. UPS is ideally positioned to thrive in this environment every minute around the world.
Michael L. EskewChairman and Chief Executive Officer
*International Monetary Fund World Outlook
**World Bank
*** McKinsey and Company
UPS Annual Report 2004 5
We made significant progress in deploying our new package flow technology. Productivity and service reliability improvements are apparent in the majority of the sites where the new technology is operational. However, we will retrain some of the sites that are not achieving the improvements that are possible. And, of course, we’ll continue deploying the technology in new sites. Slowing growth trends in the fourth quarter also impacted U.S. domestic operating margin. We are addressing this issue through growth initiatives and cost control measures. Growth initiatives focus on products, services, and technology geared to middle- market customers. Prudent cost control measures should enable the company to adjust to lower volume growth trends and still achieve our targeted earnings improvement.
Non-package revenue was up 10 percent, and profits increased $59 million. The largest component of this segment is UPS Supply Chain Solutions (SCS). SCS achieved a 10 percent increase in revenue, with a low-single-digit operating margin.
SCS enables us to move any type of freight, by any mode, anywhere in the world. Through this business we manage warehouses and distribution networks, handle the complexities of customs brokerage, and frequently rely on the capabilities of our small package network for package delivery. Since 1999, we’ve successfully integrated over 15 acquisitions to develop our global supply chain presence — now in 175 countries — and added to its scope of service with the acquisition of Menlo Worldwide Forwarding late in the fourth quarter of last year.
4 UPS Annual Report 2004 UPS Annual Report 2004 5
������������ � � ������������������ ������ � ������ ����������������������������������
���������������������������
�������� � � � ���������������������������� ������������������� �� �����
������������������� � � ���� ������� ���� �������� �� ������ � � � �
������������ � � � ���� ��������� ������ ��������������������� ����� � � � �
���������������������������� � ���� ���������� ������� ��������������������� ����� � � �
����������������������������� � ���� ���������� ��������� ����������� � ����� � � � �
������� � � � � ���� ��������� ����� �������������������� ����� � � � �
���������������� � � ���� ��������� ������� ��������� �� ������ � � � �
�������������������� � � ���� ������������������������������������������������� ����� � � �
��������������������� � � ���� ��������� ��������������������� �� ������ � � � �
��������������������� � � � ��������� ��������������������������������� ����
� � � � �
Selected Financial Results
UPS is the world’s largest package delivery company and a global leader in supply chain services. At any given moment, anywhere around the globe, UPS people enable the movement of goods, information, and funds through one integrated network that operates in more than 200 countries and territories.

�������������������������������������������������������������������������������������������������������������������������������������������������������������������������������������������������������������������������������������������������������������������������������������������������������������������������������������������������
1 1 1 0 9 8 7 6 5 4 3 2 1 0 1 2 3 4 5 6 7 8 9 1 0 1 1
IntroductionLetter to shareownersFinancial highlightsSmall package businessSupply chain businessHow we run our businessWorldwide recognitionUPS senior leadershipSelected financial dataFinancial table of contentsInvestor information
1368
162021222425
72
Copyright © 2005 United Parcel Service of America, Inc. All rights reserved.
Dear fellow shareowners,Every minute around the world, UPS delivers another 9,800 packages. Every minute around the world, UPS connects 4,900 buyers with 1,400 sellers. Every minute around the world, UPS is entrusted with two percent of global gross domestic product.*
Most importantly, every minute around the world,we see international trade surging forward at an unprecedented pace, reaffirming what we’ve known for quite some time. There’s no better time, no better industry, and no better company to capitalize on a world coming closer together through commerce.
Our Operating Environment In last year’s annual report, we talked about a world poised for economic growth and UPS as a company that would help enable that growth. A year later, the world is more than poised. In 2004, global trade activity grew 10.2 percent, well ahead of 2003’s jump of 4.5 percent, and even surpassing the boom years of 1995 through 2000.** A vibrant global economy creates new busi-nesses and new jobs, as well as increased wealth, consumer power, and a substantially better quality of life for billions of people around the world — all of which generates greater demand for UPS services. The global small package delivery business is growing along with the boom in international trade. This trend won’t abate any time soon. Today, 20 percent of all manufactured goods cross borders. By 2020, it’s estimated that 80 percent of these goods will cross borders, much of it through small package networks.*** At the same time, with markets opening and economies growing, supply chains are becoming increasingly global. These trends support UPS’s vision of synchronizing the flow of goods, information, and funds — the three flows of commerce. In addition to providing new sources of revenue and profit, our supply chain business complements and strengthens the solid foundation of our small
package business. In fact, small package delivery is perhaps the most integral part of the supply chain. In many cases, it represents the coveted “last mile” to the consumer.
Highlights of 2004 In 2004, UPS strengthened our industry-leading, global small package position. We delivered a record number of packages — almost 3.6 billion — an increase of more than 150 million over 2003. Revenue for the year increased 9 percent, and earnings were up 15 percent. Our international small package operation exhibited particular strength, with revenue up 22 percent, profitability up 58 percent, and volume up 7 percent. The export market (packages that cross a national border) has been a focus of our international efforts. Export volume increased 12 percent, led by both Europe and Asia,particularly China. In 2004, we were pleased to be awarded 12 new frequencies to fly to China. These frequencies triple our access to this important trade market. In addition, we concluded an agreement that will give us control of our express operations in China by the end of 2005. Our U.S. domestic operations posted improvements, too, with volume up 3.3 percent. Revenue increased over 6 percent and profits increased 2 percent. Pricing was firm in the United States, but operating margin declined slightly. This reflects, in part, investment in a new technology that will re-engineer our U.S. domestic operations and a slowing volume growth rate in the fourth quarter.
UPS Annual Report 2004 3
UPS’s financial strength is derived from its unique business model, combined with a company culture developed over 97 years. The business model is based on an integrated network where all systems work cohesively together. One global network results in the most efficient use of assets and the highest reliability levels. And it makes it easier to bring products and services that are successful in the United States to the global market.
UPS produces the best financial returns in the industry
6 UPS Annual Report 2004
A significant aspect of UPS’s culture that contributes to the strength of the company is the owner/management philosophy, in place since the 1920s. This means UPS is run by investors for investors. As a result, the company brings a long-term focus to investment decision-making, with a keen eye on economic profit. n
��������������������
��
���
���
���
���
���
��
����
����
����
����
����
�� ��������
���
�����������������������
���
��
����
��
����
��
��
����
����
����
�����
����
��
��������������������������������������
��������
�����������������������
���
��
����
��
����
��
������
����
����
����
����
�� ��������
��������������������������������������
����������������������������������������
���
����
����
����
���
���
��
������
������
������
��������
�� ��������
Since 2000, revenue increased 24 percent
Net income has been improving due primarily to the impact of strong international growth and improvements in non-package.
With a relatively constant number of shares outstanding, diluted earnings per share have increased 17 percent since 2000.
One hundred dollars invested in UPS stock at the end of 2000, with reinvested dividends, would have increased over 50 percent in value by the end of 2004.
UPS’s global small package business continued its vibrant growth
10 UPS Annual Report 2004
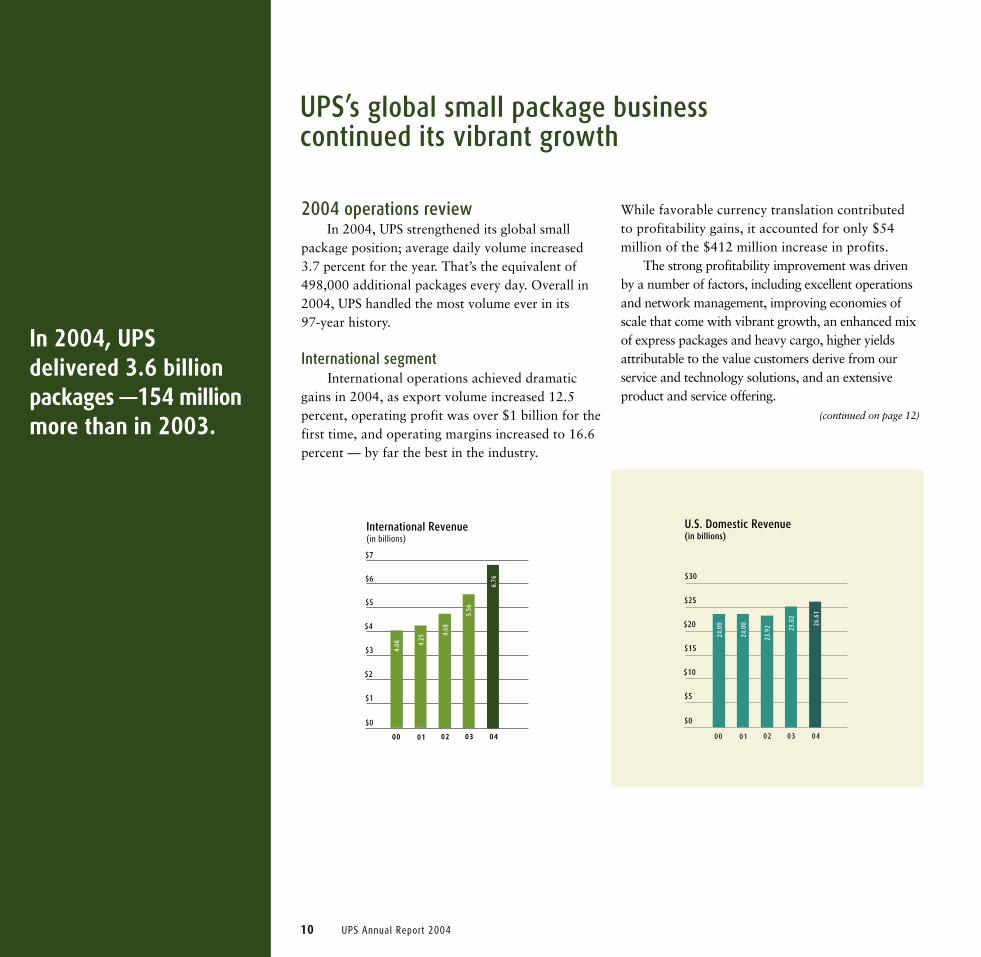
While favorable currency translation contributed to profitability gains, it accounted for only $54 million of the $412 million increase in profits. The strong profitability improvement was driven by a number of factors, including excellent operations and network management, improving economies of scale that come with vibrant growth, an enhanced mix of express packages and heavy cargo, higher yields attributable to the value customers derive from our service and technology solutions, and an extensive product and service offering. (continued on page 12)
��
���
���
���
���
��
����������������������������������
�� ��������
�����
�����
����� �����
���
�����
��
��
��
��
��
��
����������������������������������
�� ��������
����
����
����
����
������
��
UPS Annual Report 2004 7
(1) Includes after-tax effects of a charge related to an arbitration ruling under the 1997 Teamster contract, a gain recorded upon the sale of UPS Truck Leasing, and a gain from investments totalling $139 million or $0.12 per share.(2) Includes an after-tax charge upon adoption of FAS 133 of $26 million or $0.02 per share.(3) Includes after-tax effects of a gain related to a change in vacation policy, a restructuring charge, a charge upon adoption of FAS 142, and the settlement of a previously established tax assessment liability. The net effect of these items was to increase net income by $760 million or $0.67 per share.(4) Includes the after-tax effects of a gain on the sale of Mail Technologies, a gain on the sale of Aviation Technologies, an investment impairment charge, and a gain on the redemption of long-term debt. Also includes credits to income tax expense due to resolution of various tax contingencies, a favorable ruling on the
treatment of jet engine maintenance costs, and a lower effective state tax rate. The net effect of these items was to increase net income by $126 million or $0.11 per share. (5) Includes the after-tax effects of an impairment charge on Boeing 727, 747 and McDonnell Douglas DC-8 aircraft and related parts and engines and a charge to pension expense resulting from the consolidation of data collection systems. Also includes credits to income tax expense related to the resolution of various tax matters, the removal of a portion of the valuation allowance on certain deferred tax assets on net operating loss carry forwards, and an adjustment for identified tax contingency matters. The net effect of these items was to increase net income by $32 million or $0.03 per share.
����������������������������
��
���
���
���
���
���
��
�����
�����
�����
����������
�� ��������
���������������������������������
��
��
��
��
��
��
��
����
����
����
�����������
�� ��������
���������������������������������
���
����
����
����
����
����
��
���
���
���
���
���
�� ��������
����������������������������������������
����
�����
�����
����
����
��
����
����
����
����
����
�� ��������
�����������������������������
��
���
���
��
��
�����
�����
�����
�����
�����
�� ��������
��������������������������������������������������
��
���
���
���
���
���
��
��������
����
����
����
�� ��������
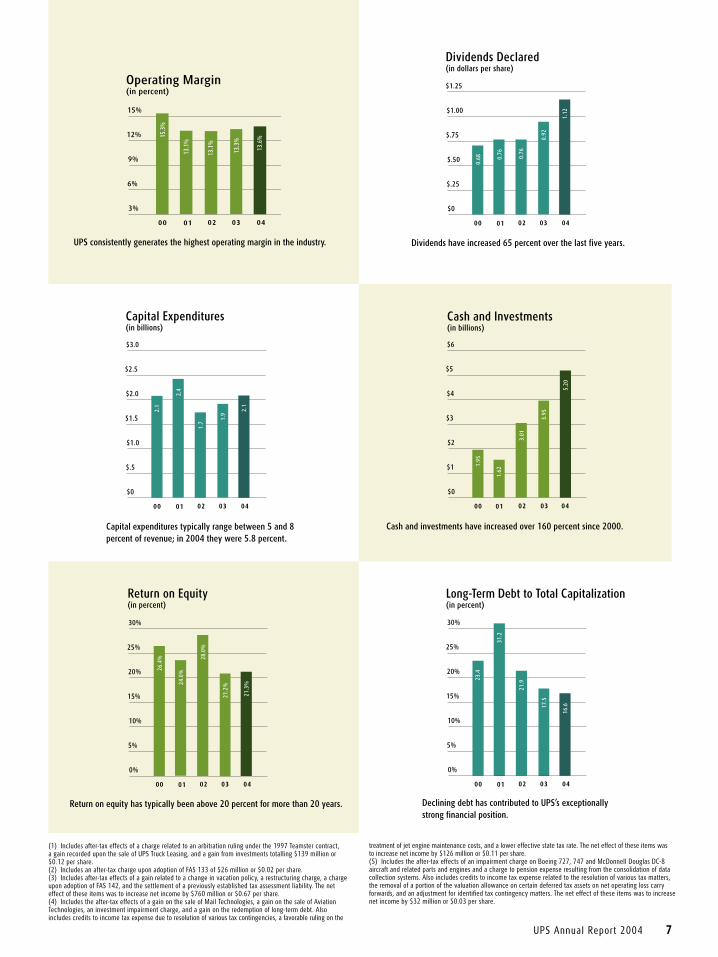
Cash and investments have increased over 160 percent since 2000.
Return on equity has typically been above 20 percent for more than 20 years.
Capital expenditures typically range between 5 and 8 percent of revenue; in 2004 they were 5.8 percent.
UPS consistently generates the highest operating margin in the industry.
Declining debt has contributed to UPS’s exceptionally strong financial position.
Dividends have increased 65 percent over the last five years.
In 2004, UPS delivered 3.6 billion packages —154 million more than in 2003.
2004 operations review In 2004, UPS strengthened its global small package position; average daily volume increased 3.7 percent for the year. That’s the equivalent of 498,000 additional packages every day. Overall in 2004, UPS handled the most volume ever in its 97-year history.
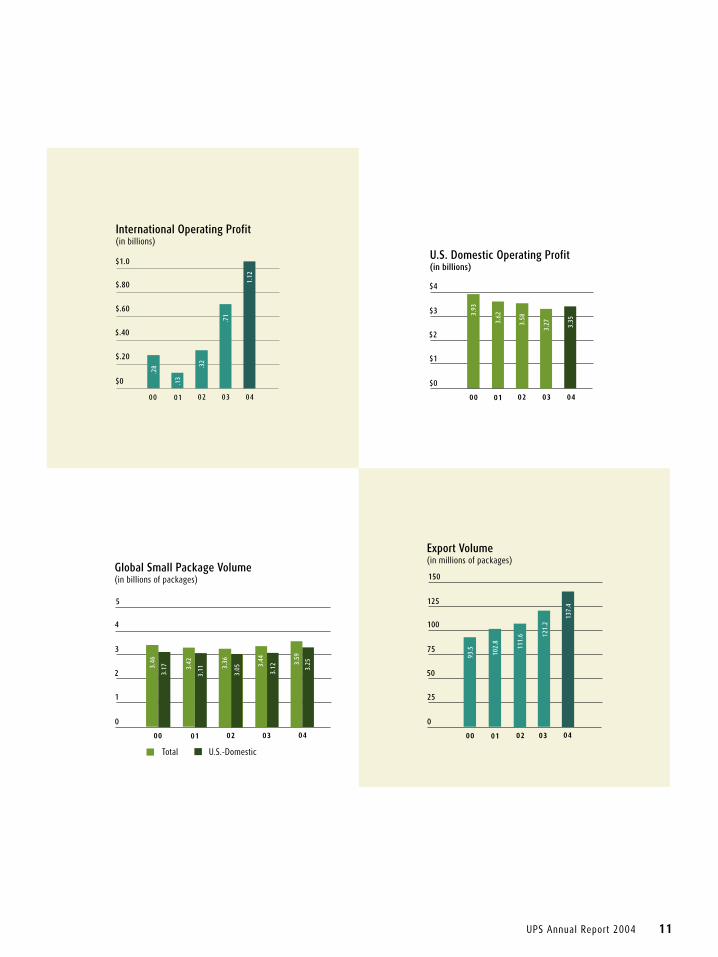
International segment International operations achieved dramatic gains in 2004, as export volume increased 12.5 percent, operating profit was over $1 billion for the first time, and operating margins increased to 16.6 percent — by far the best in the industry.

TAIPEI, TAIWAN 10:24 A.M.
Every minute of every day, UPS delivers more packages around the world than any other carrier.
TAIPEI, TAIWAN 10:24 A.M.
Every minute of every day, UPS delivers more packages around the world than any other carrier.
UPS has an extensive network across the globe. As a result, the company is the market leader in the United States and has a growing presence in all major international markets. In fact, every minute of every day, UPS delivers 9,800 packages.

TAIPEI, TAIWAN 10:24 A.M.
Every minute of every day, UPS delivers more packages around the world than any other carrier.
TAIPEI, TAIWAN 10:24 A.M.
Every minute of every day, UPS delivers more packages around the world than any other carrier.
UPS has an extensive network across the globe. As a result, the company is the market leader in the United States and has a growing presence in all major international markets. In fact, every minute of every day, UPS delivers 9,800 packages.
UPS’s global small package business continued its vibrant growth
10 UPS Annual Report 2004
While favorable currency translation contributed to profitability gains, it accounted for only $54 million of the $412 million increase in profits. The strong profitability improvement was driven by a number of factors, including excellent operations and network management, improving economies of scale that come with vibrant growth, an enhanced mix of express packages and heavy cargo, higher yields attributable to the value customers derive from our service and technology solutions, and an extensive product and service offering. (continued on page 12)
��
���
���
���
���
��
����������������������������������
�� ��������
�����
�����
����� �����
���
�����
��
��
��
��
��
��
����������������������������������
�� ��������
����
����
����
����
������
��
UPS Annual Report 2004 7
(1) Includes after-tax effects of a charge related to an arbitration ruling under the 1997 Teamster contract, a gain recorded upon the sale of UPS Truck Leasing, and a gain from investments totalling $139 million or $0.12 per share.(2) Includes an after-tax charge upon adoption of FAS 133 of $26 million or $0.02 per share.(3) Includes after-tax effects of a gain related to a change in vacation policy, a restructuring charge, a charge upon adoption of FAS 142, and the settlement of a previously established tax assessment liability. The net effect of these items was to increase net income by $760 million or $0.67 per share.(4) Includes the after-tax effects of a gain on the sale of Mail Technologies, a gain on the sale of Aviation Technologies, an investment impairment charge, and a gain on the redemption of long-term debt. Also includes credits to income tax expense due to resolution of various tax contingencies, a favorable ruling on the
treatment of jet engine maintenance costs, and a lower effective state tax rate. The net effect of these items was to increase net income by $126 million or $0.11 per share. (5) Includes the after-tax effects of an impairment charge on Boeing 727, 747 and McDonnell Douglas DC-8 aircraft and related parts and engines and a charge to pension expense resulting from the consolidation of data collection systems. Also includes credits to income tax expense related to the resolution of various tax matters, the removal of a portion of the valuation allowance on certain deferred tax assets on net operating loss carry forwards, and an adjustment for identified tax contingency matters. The net effect of these items was to increase net income by $32 million or $0.03 per share.
����������������������������
��
���
���
���
���
���
��
�����
�����
�����
����������
�� ��������
���������������������������������
��
��
��
��
��
��
��
����
����
����
�����������
�� ��������
���������������������������������
���
����
����
����
����
����
��
���
���
���
���
���
�� ��������
����������������������������������������
����
�����
�����
����
����
��
����
����
����
����
����
�� ��������
�����������������������������
��
���
���
��
��
�����
�����
�����
�����
�����
�� ��������
��������������������������������������������������
��
���
���
���
���
���
��
��������
����
����
����
�� ��������
Cash and investments have increased over 160 percent since 2000.
Return on equity has typically been above 20 percent for more than 20 years.
Capital expenditures typically range between 5 and 8 percent of revenue; in 2004 they were 5.8 percent.
UPS consistently generates the highest operating margin in the industry.
Declining debt has contributed to UPS’s exceptionally strong financial position.
Dividends have increased 65 percent over the last five years.
In 2004, UPS delivered 3.6 billion packages —154 million more than in 2003.
2004 operations review In 2004, UPS strengthened its global small package position; average daily volume increased 3.7 percent for the year. That’s the equivalent of 498,000 additional packages every day. Overall in 2004, UPS handled the most volume ever in its 97-year history.
International segment International operations achieved dramatic gains in 2004, as export volume increased 12.5 percent, operating profit was over $1 billion for the first time, and operating margins increased to 16.6 percent — by far the best in the industry.
10 UPS Annual Report 2004 UPS Annual Report 2004 11
��������������������������������������������
��
����
����
����
����
����
�� ��������
���
���
���
���
����
�
���
���
��
��
��
���������������������������������������
�� ��������
����
�����
�����
�����
�����
���
��
��
��
��
��
�� ��������
����
����
��������
��������������������������������������������
����
�������������������������������
�
�
�
�
�
����������������������������������������������������
�� ��������
����
���� ����
����
����
����
���� ����
����
����
�

The U.S. domestic segment The U.S. domestic package operations also reported a strong year. Ground volume increased 4 percent or 408,000 packages per day. Next day air volume was essentially flat in 2004 due to the comparison with the prior year’s unusually high volume resulting from the mortgage refinancing boom. Eliminating that impact, air volume would have increased in 2004. In fact, growth in overnight package volume was strong, increasing 5.7 percent for the year. Revenue per piece was up 2.1 percent, reflecting a rational pricing environment and a strong value proposition in the form of new products, technology solutions, and delivery reliability. U.S. domestic operating margin was slightly lower in 2004, reflecting the roll-out of new technology in our domestic operations and the impact of slowing volume growth. Implemen-tation of the technology had a negative impact on profitability of about $150 million in 2004.
LISBON, PORTUGAL 5:24 P.M.
In 2005, it is expected to have a positive net benefit of $50 to $100 million, even as some retraining occurs in selected sites and new sites are deployed. By the end of 2005, approximately 65 percent of UPS drivers are slated to be using the technology. Initiatives are in place to address U.S. domestic volume and margin decline. Growth initiatives focus on the middle-market customer, with better alignment of our resources; cross-selling of integrated solutions successfully used for large customers; expansion of the product portfolio with the addition of time-definite, guaranteed heavy airfreight service; and doubling the rate of technology integrations through which customers electronically access UPS shipping systems. In early 2005, prudent cost control measures were implemented to adjust to slower volume growth rates and help ensure achievement of earnings growth targets. Cost controls are expected to produce about $200 million in savings in 2005.
12 UPS Annual Report 2004 UPS Annual Report 2004 13

CLEVELAND, OHIO 9:24 A.M.
Small package growth opportunities remain strong We believe expanding global economies, development of international markets by customers large and small, and direct-to-consumer shipping trends — driven by just-in-time inventory and online purchasing — offer growth opportunities for the small package business. Going forward, look for UPS to continue international volume, revenue, and profitability growth, with an excellent operating margin. UPS anticipates achieving 2 to 3 percent U.S. domestic volume growth, along with an improving operating margin. To achieve growth objectives, UPS will rely on well-developed strengths — leading-edge technology, a broad portfolio of services and integrated solutions, and the most efficient global network in the industry.
Investment in the worldwide network means constant improvement UPS invests hundreds of millions of dollars in its network annually for facilities, vehicles, and aircraft. In Europe, construction continued on the expansion of the company’s highly automated air hub inCologne, Germany — the company’s largest hub outside the United States. In addition, UPS’s service
12 UPS Annual Report 2004 UPS Annual Report 2004 13
portfolio was broadened to, from, and within the 10 countries that joined the European Union in 2004. UPS also is extending its presence in Asia — one of the most important markets in the world. In addition to gaining 12 additional air routes to more extensively serve parts of China, Japan, and Hong Kong, UPS concluded an agreement with its Chinese partner to take full control of its international express operations in more than 200 cities in China by the end of 2005. These cities collectively account for about 80 percent of China’s GDP. UPS concluded a similar agreement to gain control of its express operation in Japan. In addition, in early 2005 UPS announced plans to expand its supply chain presence in China, combining small package delivery with freight forwarding, customs brokerage, and distribution.Strengthening the logistical links between China and global markets is critical to both China and companies doing business in China. In the United States, network improvements reduced transit times by one day on UPS ground service between 20 metropolitan areas, including Atlanta, Baltimore/Washington, D.C., Chicago, Dallas, Houston, Kansas City, Los Angeles, Philadelphia, and Pittsburgh. The company willcontinue enhancing transit times in the United States in 2005 and beyond.
14 UPS Annual Report 2004
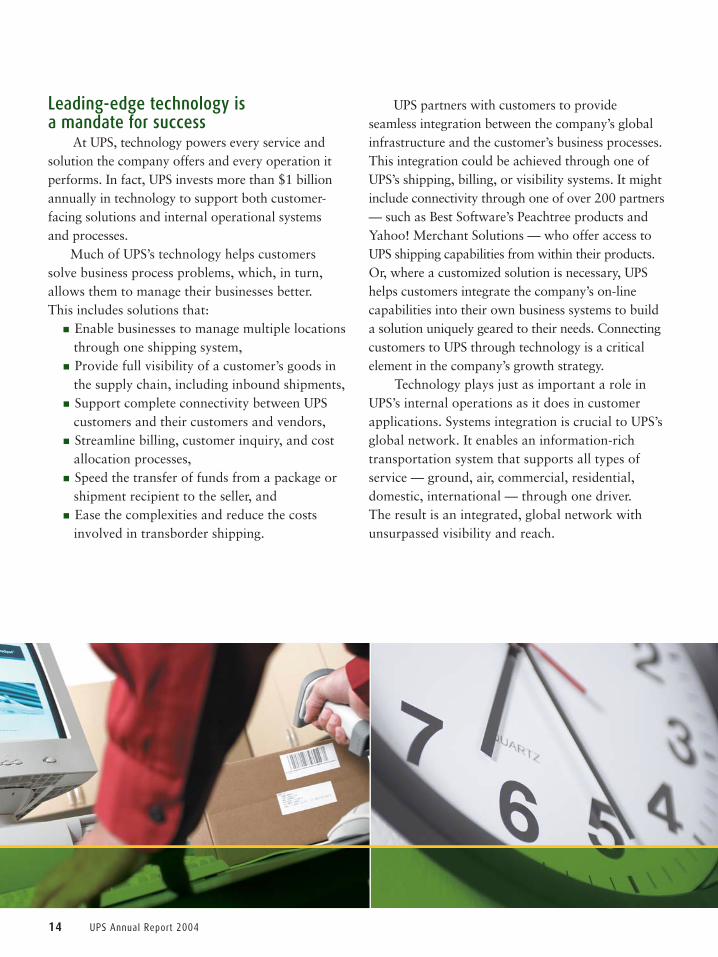
Leading-edge technology is a mandate for success At UPS, technology powers every service and solution the company offers and every operation it performs. In fact, UPS invests more than $1 billion annually in technology to support both customer-facing solutions and internal operational systems and processes. Much of UPS’s technology helps customers solve business process problems, which, in turn, allows them to manage their businesses better. This includes solutions that: n Enable businesses to manage multiple locations through one shipping system, n Provide full visibility of a customer’s goods in the supply chain, including inbound shipments, n Support complete connectivity between UPS customers and their customers and vendors, n Streamline billing, customer inquiry, and cost allocation processes, n Speed the transfer of funds from a package or shipment recipient to the seller, and n Ease the complexities and reduce the costs involved in transborder shipping.
UPS partners with customers to provide seamless integration between the company’s global infrastructure and the customer’s business processes. This integration could be achieved through one of UPS’s shipping, billing, or visibility systems. It might include connectivity through one of over 200 partners — such as Best Software’s Peachtree products and Yahoo! Merchant Solutions — who offer access to UPS shipping capabilities from within their products. Or, where a customized solution is necessary, UPS helps customers integrate the company’s on-line capabilities into their own business systems to build a solution uniquely geared to their needs. Connecting customers to UPS through technology is a critical element in the company’s growth strategy. Technology plays just as important a role in UPS’s internal operations as it does in customer applications. Systems integration is crucial to UPS’s global network. It enables an information-rich transportation system that supports all types of service — ground, air, commercial, residential, domestic, international — through one driver. The result is an integrated, global network with unsurpassed visibility and reach.
Effective supply chain management is becoming increasingly critical to virtually all businesses, large and small. It helps these businesses expand their markets, improve cash flow, deliver better customer service, differentiate products, and improve productivity. UPS has extended its value proposition to customers by helping them synchronize the flows of goods, information, and funds through its supply chain offerings. The company’s expanding supply chain portfolio leverages its international presence, infrastructure, extensive customer base, and network management expertise. When combined with package delivery services, supply chain management capabilities help UPS to deepen and extend customer relationships around the globe. UPS Supply Chain Solutions and other of our non-package businesses offer more than 60 products and services in transportation and freight management, logistics and distribution, international trade, financial services, and consulting. Its infrastructure includes facilities that handle such diverse tasks as overseeing global freight shipments, filling orders, performing technical repair and deploying critical parts, and managing customs brokerage.
18 UPS Annual Report 2004
UPS Supply Chain Solutions continues to expand its global presence and capabilities
�������������������������������������������
��
����
����
����
����
����
�� ��������
����
����
���� ����
����
��� ����
����
���� ����
����������������������������������������
These business units offer technology platforms that give customers extensive visibility into their global supply chain activities for better up-to-the-minute management decisions. All of these capabilities help UPS to design unique solutions for customer needs on an increasingly global scale. UPS has targeted several industries where it sees substantial supply chain management growth opportunities, including the health care, automotive, high-tech, retail, consumer, and government sectors.
2004 operations review UPS Supply Chain Solutions is the largest business unit within the non-package segment. In 2004, net revenue increased 10 percent to $2.35 billion. Contributing to Supply Chain Solutions’ performance has been the on-going integration of acquisitions that have expanded its reach, capabilities, and customer base. The latest acquisition, Menlo Worldwide Forwarding, was completed at the end of 2004 and added guaranteed, heavy air freight capabilities to the UPS portfolio of solutions. With the addition of Menlo, UPS can now offer expanded time-definite products, such as overnight, two-day, and deferred delivery of heavy air freight in North America.Menlo also substantially increases UPS Supply Chain Solutions’ ocean and customs brokerage volume.
UPS Annual Report 2004 15
Integrated solutions move goods seamlessly from factory to final delivery Many UPS solutions combine the scope of its global small package transportation network with supply chain services, allowing goods to move more quickly across borders via air, ground, or sea. The ability to tie together all modes of transportation to move anything from a small package to heavy freight enables UPS to develop the right solution for each customer. UPS’s suite of Trade DirectSM services, for example, improves the efficiency of international shipping for customers by moving multiple packages, going to multiple consignees, as one shipment with one customs clearance. The packages are then fed into the UPS network and shipped directly to the recipients. Whether it’s small packages moving between NAFTA markets, air freight moving between continents, or ocean-transported goods, UPS provides customers with improved time-in-transit, full visibility, and international trade services that facilitate participation in the global marketplace. n
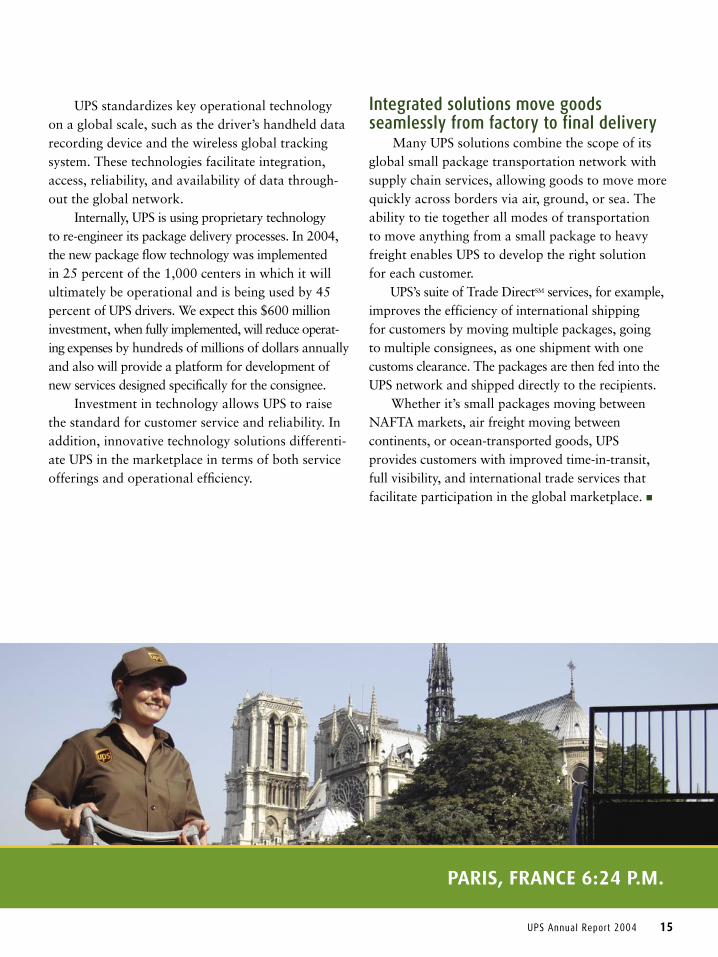
UPS standardizes key operational technology on a global scale, such as the driver’s handheld data recording device and the wireless global tracking system. These technologies facilitate integration, access, reliability, and availability of data through-out the global network. Internally, UPS is using proprietary technology to re-engineer its package delivery processes. In 2004, the new package flow technology was implemented in 25 percent of the 1,000 centers in which it will ultimately be operational and is being used by 45 percent of UPS drivers. We expect this $600 million investment, when fully implemented, will reduce operat-ing expenses by hundreds of millions of dollars annually and also will provide a platform for development of new services designed specifically for the consignee. Investment in technology allows UPS to raise the standard for customer service and reliability. In addition, innovative technology solutions differenti-ate UPS in the marketplace in terms of both service offerings and operational efficiency.
PARIS, FRANCE 6:24 P.M.
Moving boxes, bytes, and bucks is the essence of supply chain management.

PRAGUE, CZECH REPUBLIC 9:24 P.M.
When it comes to managing global supply chains, timing is everything. UPS synchronizes the world of commerce.
PRAGUE, CZECH REPUBLIC 9:24 P.M.
When it comes to managing global supply chains, timing is everything. UPS synchronizes the world of commerce.
UPS is one of the world’s largest providers of supply chain management services, operating more than 1,200 facilities in 175 countries.

PRAGUE, CZECH REPUBLIC 9:24 P.M.
When it comes to managing global supply chains, timing is everything. UPS synchronizes the world of commerce.
PRAGUE, CZECH REPUBLIC 9:24 P.M.
When it comes to managing global supply chains, timing is everything. UPS synchronizes the world of commerce.
UPS is one of the world’s largest providers of supply chain management services, operating more than 1,200 facilities in 175 countries.

Effective supply chain management is becoming increasingly critical to virtually all businesses, large and small. It helps these businesses expand their markets, improve cash flow, deliver better customer service, differentiate products, and improve productivity. UPS has extended its value proposition to customers by helping them synchronize the flows of goods, information, and funds through its supply chain offerings. The company’s expanding supply chain portfolio leverages its international presence, infrastructure, extensive customer base, and network management expertise. When combined with package delivery services, supply chain management capabilities help UPS to deepen and extend customer relationships around the globe. UPS Supply Chain Solutions and other of our non-package businesses offer more than 60 products and services in transportation and freight management, logistics and distribution, international trade, financial services, and consulting. Its infrastructure includes facilities that handle such diverse tasks as overseeing global freight shipments, filling orders, performing technical repair and deploying critical parts, and managing customs brokerage.
18 UPS Annual Report 2004
UPS Supply Chain Solutions continues to expand its global presence and capabilities
�������������������������������������������
��
����
����
����
����
����
�� ��������
����
����
���� ����
����
��� ����
����
���� ����
����������������������������������������
These business units offer technology platforms that give customers extensive visibility into their global supply chain activities for better up-to-the-minute management decisions. All of these capabilities help UPS to design unique solutions for customer needs on an increasingly global scale. UPS has targeted several industries where it sees substantial supply chain management growth opportunities, including the health care, automotive, high-tech, retail, consumer, and government sectors.
2004 operations review UPS Supply Chain Solutions is the largest business unit within the non-package segment. In 2004, net revenue increased 10 percent to $2.35 billion. Contributing to Supply Chain Solutions’ performance has been the on-going integration of acquisitions that have expanded its reach, capabilities, and customer base. The latest acquisition, Menlo Worldwide Forwarding, was completed at the end of 2004 and added guaranteed, heavy air freight capabilities to the UPS portfolio of solutions. With the addition of Menlo, UPS can now offer expanded time-definite products, such as overnight, two-day, and deferred delivery of heavy air freight in North America.Menlo also substantially increases UPS Supply Chain Solutions’ ocean and customs brokerage volume.
UPS Annual Report 2004 15
Integrated solutions move goods seamlessly from factory to final delivery Many UPS solutions combine the scope of its global small package transportation network with supply chain services, allowing goods to move more quickly across borders via air, ground, or sea. The ability to tie together all modes of transportation to move anything from a small package to heavy freight enables UPS to develop the right solution for each customer. UPS’s suite of Trade DirectSM services, for example, improves the efficiency of international shipping for customers by moving multiple packages, going to multiple consignees, as one shipment with one customs clearance. The packages are then fed into the UPS network and shipped directly to the recipients. Whether it’s small packages moving between NAFTA markets, air freight moving between continents, or ocean-transported goods, UPS provides customers with improved time-in-transit, full visibility, and international trade services that facilitate participation in the global marketplace. n
UPS standardizes key operational technology on a global scale, such as the driver’s handheld data recording device and the wireless global tracking system. These technologies facilitate integration, access, reliability, and availability of data through-out the global network. Internally, UPS is using proprietary technology to re-engineer its package delivery processes. In 2004, the new package flow technology was implemented in 25 percent of the 1,000 centers in which it will ultimately be operational and is being used by 45 percent of UPS drivers. We expect this $600 million investment, when fully implemented, will reduce operat-ing expenses by hundreds of millions of dollars annually and also will provide a platform for development of new services designed specifically for the consignee. Investment in technology allows UPS to raise the standard for customer service and reliability. In addition, innovative technology solutions differenti-ate UPS in the marketplace in terms of both service offerings and operational efficiency.
PARIS, FRANCE 6:24 P.M.
Moving boxes, bytes, and bucks is the essence of supply chain management.
18 UPS Annual Report 2004 UPS Annual Report 2004 19
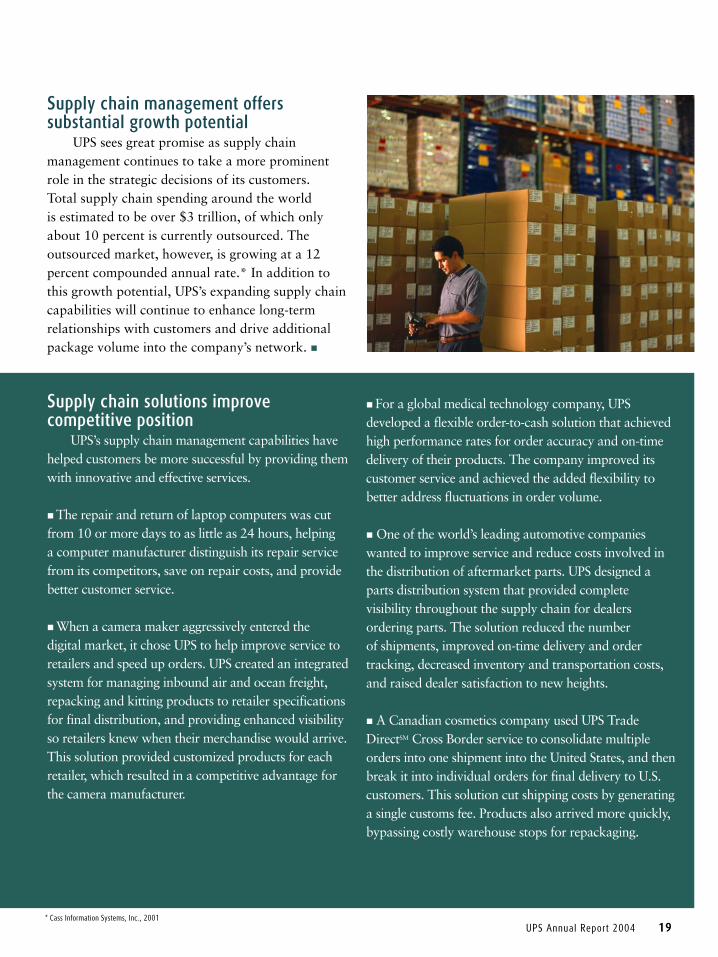
Supply chain management offers substantial growth potential UPS sees great promise as supply chain management continues to take a more prominent role in the strategic decisions of its customers. Total supply chain spending around the world is estimated to be over $3 trillion, of which only about 10 percent is currently outsourced. The outsourced market, however, is growing at a 12 percent compounded annual rate.* In addition to this growth potential, UPS’s expanding supply chain capabilities will continue to enhance long-term relationships with customers and drive additional package volume into the company’s network. n
Supply chain solutions improve competitive position UPS’s supply chain management capabilities have helped customers be more successful by providing them with innovative and effective services.
n The repair and return of laptop computers was cut from 10 or more days to as little as 24 hours, helping a computer manufacturer distinguish its repair service from its competitors, save on repair costs, and provide better customer service.
n When a camera maker aggressively entered the digital market, it chose UPS to help improve service to retailers and speed up orders. UPS created an integrated system for managing inbound air and ocean freight, repacking and kitting products to retailer specifications for final distribution, and providing enhanced visibility so retailers knew when their merchandise would arrive. This solution provided customized products for each retailer, which resulted in a competitive advantage for the camera manufacturer.
* Cass Information Systems, Inc., 2001
n For a global medical technology company, UPS developed a flexible order-to-cash solution that achieved high performance rates for order accuracy and on-time delivery of their products. The company improved its customer service and achieved the added flexibility to better address fluctuations in order volume.
n One of the world’s leading automotive companies wanted to improve service and reduce costs involved in the distribution of aftermarket parts. UPS designed a parts distribution system that provided complete visibility throughout the supply chain for dealers ordering parts. The solution reduced the number of shipments, improved on-time delivery and order tracking, decreased inventory and transportation costs, and raised dealer satisfaction to new heights.
n A Canadian cosmetics company used UPS Trade DirectSM Cross Border service to consolidate multiple orders into one shipment into the United States, and then break it into individual orders for final delivery to U.S. customers. This solution cut shipping costs by generating a single customs fee. Products also arrived more quickly, bypassing costly warehouse stops for repackaging.

How we run our businessUPS founder Jim Casey established principles and values that are part of the fabric of our business. For almost 100 years, these principles and values have remained constant and have been integral to our success. This legacy of honesty, quality, and integrity is fundamental to our ability to attract and retain the best people, gain and keep the trust of our customers, create shareowner value, support the communities in which we operate, and protect our reputation.
UPS BUSINESS PHILOSOPHY
Employees: We respect and value the individual. n We encourage a spirit of teamwork. n We promote from within. n We help people to develop themselves. n We place great value on diversity.
Customers: We believe that attention to our customers’ changing needs is central to the success of UPS. n We treat each customer as our only customer. n We never promise more than we can deliver, and we deliver on every promise.
Shareowners: We sustain a financially strong company. n We manage assets wisely. n We emphasize the “long-term” in strategy
development and decision-making. n We seek to provide long-term competitive
returns to our shareowners.
Ownership philosophy: We believe that employee ownership in the company is important. n The principle that has contributed a great deal to building our business is the ownership of the company by the people employed by it. n Having a personal stake in the company causes employees to think like owners and work like partners. Employee ownership creates a sense of teamwork and strengthens and preserves our values.
Sustainability: We operate our business with a balance between economic success, social responsibility, and environmental stewardship. n We believe our economic well-being benefits society by providing good wages, paying taxes, and practicing philanthropy. n We encourage community involvement and volunteerism by our employees. n We proactively seek solutions that limit the impact of our business on the environment. n
Our sustainability report can be found at www.sustainability.ups.com.
20 UPS Annual Report 2004 UPS Annual Report 2004 21

20 UPS Annual Report 2004 UPS Annual Report 2004 21
Integrity has been and will continue to be the basis of all we
do. It’s embedded in our culture. Therefore, the concept of
“corporate governance” is not new to UPS — running a fair,
honest business is what we’ve done for decades. A complete
description of our approach to governance is available at
www.shareholder.com/ups/corpgov.cfm.
The Board of Directors is entrusted with overseeing corporate
performance in an honest, diligent, and thorough manner.
It is accountable to the shareowners, not to management.
While governance practices may evolve and are reviewed
regularly, the commitment to integrity in our dealings with all
stakeholders never changes. n
The year 2004 brought more accolades, awards, and recognition for UPS. Some of the many awards bestowed last year include:
American Business Awards Most Innovative Company (second consecutive year)
American Jewish Committee National Human Relations Award
Aviation Week and Space Technology magazine Top Performing Airlines Ranking
BtoB Magazine CoreBrand survey’s Top 30 Most Valuable Brands
ComputerWorld magazine Among 100 Best Places to Work in Information Technology
The Customer Respect Group Number 1 for Online Customer Respect
DiversityInc magazine Among Top 50 Companies for Diversity and Top 10 Companies for Latinos
Financial Times/PriceWaterHouseCoopers Number one on World’s Most Respected Transport Companies survey
Forbes magazine Most Valuable Corporate Brands and Platinum 400 — the Best Big Companies in America list
FORTUNE magazine Among 50 Best Companies for Minorities (sixth consecutive year), America’s Most Admired company in its industry (21st consecutive year), Blue-Ribbon company, FORTUNE 500, FORTUNE Global 500, World’s Most Admired company in its industry (sixth consecutive year)
Gifts in Kind International Light of Hope Award
Intermec UPS Logistics Technologies wins 2003 North American Outstanding Partner Award
International Business Award Best Marketing Organization for the “UPS Delivers Synchronized Commerce” campaign
National Retail Federation Foundation The UPS Store included in Customer Service Excellence 2004: Exemplary Practices in Retail report
Parcel Shipping & Distribution Best Practice SurveyBest-in-Class in Customer Service
United Way Top in corporate donations in United States (fourth consecutive year)
Women’s Business Enterprise National Council “Elite Eleven” America’s Top Corporations for Women Business Enterprises (fifth consecutive year)
Harris Interactive/Reputation Institute Number 2 among Top Corporate Reputation
Hispanic Magazine Corporate 100, Top 25 Recruitment Programs, Top 25 Vendor Programs for Latinos
Illinois National Guard UPS Supply Chain Solutions receives National Guard Team-Employer Recognition Award
Inbound Logistics magazine UPS Supply Chain Solutions receives Top 100 3PL Providers Award (second consecutive year)
Industry Week magazine UPS Package Flow Technologies among “Technologies of the Year — Notable Innovations”
InformationWeek magazine InformationWeek 500 list of innovative companies
“We have become known to all who deal with us as people of integrity, and that priceless asset is more valuable than anything else we possess.” — JIM CASEY, UPS FOUNDER, 1955
Governance
Worldwide recognition

UPS 2004 Board of Directors
UPS Board of Directors
Calvin Darden* Senior Vice President, UPSExecutive CommitteeDirector since 2001
Michael L. EskewChairman and Chief Executive Officer, UPSChair, Executive CommitteeDirector since 1998
James P. KellyFormer UPS Chairman and Chief Executive Officer Director since 1991
Ann M. LivermoreExecutive Vice President, Hewlett-Packard CompanyChair, Audit Committee Nominating and Corporate Governance CommitteeDirector since 1997
Gary E. MacDougalFormer Chairman and Chief Executive Officer, Mark Controls CorporationChair, Nominating and Corporate Governance CommitteeCompensation CommitteeDirector since 1973
Victor A. Pelson Senior Advisor, UBS Securities LLCChair, Compensation CommitteeNominating and Corporate Governance CommitteeDirector since 1990
Lea N. Soupata Senior Vice President, UPSExecutive CommitteeDirector since 1998
John W. ThompsonChairman and Chief Executive Officer, Symantec CorporationAudit CommitteeCompensation CommitteeDirector since 2000
Carol B. ToméChief Financial Officer, The Home Depot Audit CommitteeDirector since 2003
Left to right: Ann M. Livermore, Victor A. Pelson, Lea N. Soupata, Gary E. MacDougal, Carol B. Tomé, John W. Thompson, Michael L. Eskew, Calvin Darden, James P. Kelly
UPS recognizes the contributions of Director Robert M. Teeter, who passed away in June 2004. Bob, who was President of Coldwater Corporation, provided dedicated service to the UPS Board since 1990. He will be remembered for his integrity and leadership, as well as the unique insights he brought to the Board.
22 UPS Annual Report 2004 UPS Annual Report 2004 23
*After many years of distinguished service, Calvin Darden retired, effective March 31, 2005. At the February 2005 Board meeting, John J. Beystehner was appointed to replace Cal on the Board.

David AbneySenior Vice President and President, UPS International
David BarnesSenior Vice President and Chief Information Officer
John J. BeystehnerSenior Vice President, Chief Operating Officer and President, UPS Airlines
D. Scott DavisSenior Vice President, Chief Financial Officer, and Treasurer
Michael L. EskewChairman and Chief Executive Officer
Allen E. HillSenior Vice President, General Counsel, and Corporate Secretary
Kurt KuehnSenior Vice President, Worldwide Sales and Marketing
John McDevittSenior Vice President, Global Transportation Services
Lea N. SoupataSenior Vice President, Human Resources
Robert E. StoffelSenior Vice President, UPS Supply Chain Group
James F. WinestockSenior Vice President,U.S. Operations
Senior OperationsManagement
George W. Brooks, Jr.Southeast Region
Jovita CarranzaAir Operations
Wolfgang FlickEurope Region
Stephen D. FlowersAmericas Region
Alan GershenhornUPS Supply Chain Solutions
Myron A. GrayNorth Central Region
Wayne C. HerringEast Central Region
Robert L. LekitesUPS Airlines
Gerald R. MattesPacific Region
Stephen R. MieleNortheast Region
Rocky RomanellaUPS Supply Chain Solutions
Anthony PoselenznyWest Region
Kenneth A. TorokAsia Pacific Region
Carolyn J. WalshSouthwest Region
Management Committee
After many years of dedicated service,Ken Lacy retired, and Chris Mahoney will retire effective March 31, 2005, from their positions on the Management Committee.
22 UPS Annual Report 2004 UPS Annual Report 2004 23
The committee is responsible for the day-to-day management ofour business.
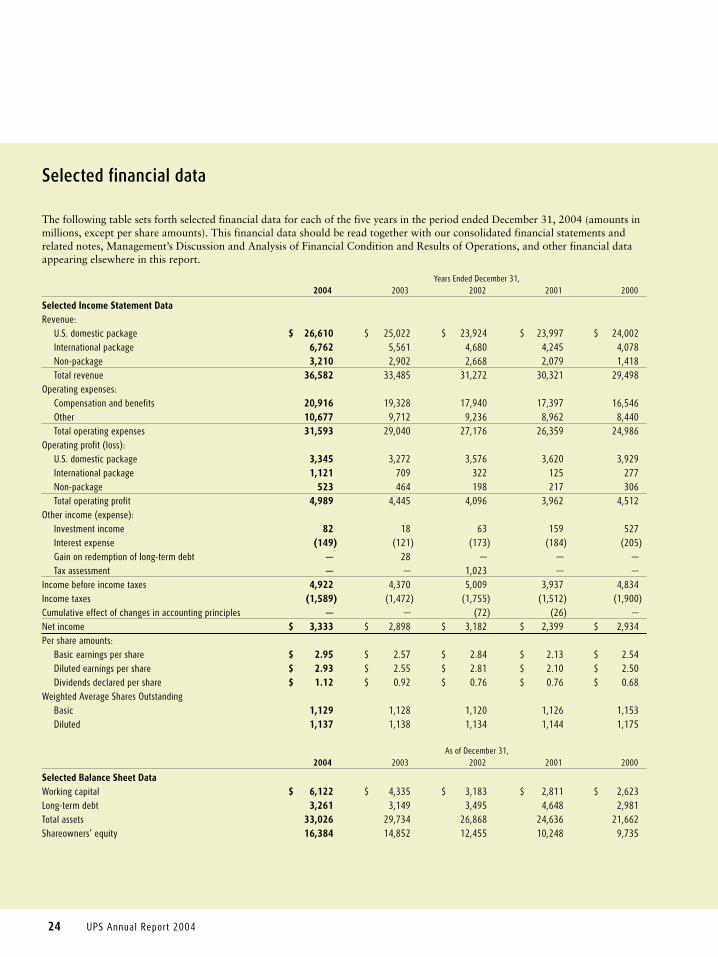
24 UPS Annual Report 2004
Selected financial data
The following table sets forth selected financial data for each of the five years in the period ended December 31, 2004 (amounts inmillions, except per share amounts). This financial data should be read together with our consolidated financial statements andrelated notes, Management’s Discussion and Analysis of Financial Condition and Results of Operations, and other financial dataappearing elsewhere in this report.
Years Ended December 31, 2004 2003 2002 2001 2000
Selected Income Statement DataRevenue:
U.S. domestic package $ 26,610 $ 25,022 $ 23,924 $ 23,997 $ 24,002International package 6,762 5,561 4,680 4,245 4,078Non-package 3,210 2,902 2,668 2,079 1,418Total revenue 36,582 33,485 31,272 30,321 29,498
Operating expenses:Compensation and benefits 20,916 19,328 17,940 17,397 16,546Other 10,677 9,712 9,236 8,962 8,440Total operating expenses 31,593 29,040 27,176 26,359 24,986
Operating profit (loss):U.S. domestic package 3,345 3,272 3,576 3,620 3,929International package 1,121 709 322 125 277Non-package 523 464 198 217 306Total operating profit 4,989 4,445 4,096 3,962 4,512
Other income (expense):Investment income 82 18 63 159 527Interest expense (149) (121) (173) (184) (205)Gain on redemption of long-term debt — 28 — — — Tax assessment — — 1,023 — —
Income before income taxes 4,922 4,370 5,009 3,937 4,834Income taxes (1,589) (1,472) (1,755) (1,512) (1,900)Cumulative effect of changes in accounting principles — — (72) (26) — Net income $ 3,333 $ 2,898 $ 3,182 $ 2,399 $ 2,934Per share amounts:
Basic earnings per share $ 2.95 $ 2.57 $ 2.84 $ 2.13 $ 2.54Diluted earnings per share $ 2.93 $ 2.55 $ 2.81 $ 2.10 $ 2.50Dividends declared per share $ 1.12 $ 0.92 $ 0.76 $ 0.76 $ 0.68
Weighted Average Shares OutstandingBasic 1,129 1,128 1,120 1,126 1,153Diluted 1,137 1,138 1,134 1,144 1,175
As of December 31, 2004 2003 2002 2001 2000
Selected Balance Sheet DataWorking capital $ 6,122 $ 4,335 $ 3,183 $ 2,811 $ 2,623Long-term debt 3,261 3,149 3,495 4,648 2,981Total assets 33,026 29,734 26,868 24,636 21,662Shareowners’ equity 16,384 14,852 12,455 10,248 9,735
Financial table of contents 25
Financial table of contents
Management’s discussion and analysis 26Management’s Report on Internal Control Over Financial Reporting 40Report of Independent Registered Public Accounting Firm on
Internal Control Over Financial Reporting 41Report of Independent Registered Public Accounting Firm 42Consolidated balance sheets 43Statements of consolidated income 44Statements of consolidated shareowners’ equity 45Statements of consolidated cashflows 46Notes to consolidated financial statements 47Price and dividend information 71Investor information 72
CertificationsUPS has included as Exhibit 31 to its Annual Report on Form 10-K filed with the Securities and Exchange Commission certificates of the Chief Executive Officer and Chief Financial Officercertifying the quality of UPS’s public disclosure. In addition, the Chief Executive Officer certifiedto the New York Stock Exchange on June 28, 2004, that he was not aware of any violations byUPS of New York Stock Exchange corporate governance listing standards.

26 UPS Annual Report 2004
Management’s discussion and analysis of financial condition and results of operations
Operations The following tables set forth information showing the change in revenue, average daily package volume, and average revenue perpiece, both in dollars or amounts and in percentage terms:
Year Ended December 31, Change
Revenue (in millions): 2004 2003 $ %
U.S. domestic package:Next Day Air $ 6,040 $ 5,580 $ 460 8.2%Deferred 3,161 2,982 179 6.0Ground 17,409 16,460 949 5.8
Total U.S. domestic package 26,610 25,022 1,588 6.3International package:
Domestic 1,346 1,134 212 18.7Export 4,944 4,001 943 23.6Cargo 472 426 46 10.8
Total International package 6,762 5,561 1,201 21.6Non-package:
UPS Supply Chain Solutions 2,346 2,126 220 10.3Other 864 776 88 11.3
Total Non-package 3,210 2,902 308 10.6Consolidated $ 36,582 $ 33,485 $ 3,097 9.2%
Average Daily Package Volume (in thousands): #U.S. domestic package:
Next Day Air 1,194 1,185 9 0.8%Deferred 910 918 (8) (0.9)Ground 10,676 10,268 408 4.0
Total U.S. domestic package 12,780 12,371 409 3.3International package:
Domestic 815 786 29 3.7Export 541 481 60 12.5
Total International package 1,356 1,267 89 7.0Consolidated 14,136 13,638 498 3.7%
Operating days in period 254 252
Average Revenue Per Piece: $U.S. domestic package:
Next Day Air $ 19.92 $ 18.69 $ 1.23 6.6%Deferred 13.68 12.89 0.79 6.1Ground 6.42 6.36 0.06 0.9
Total U.S. domestic package 8.20 8.03 0.17 2.1International package:
Domestic 6.50 5.73 0.77 13.4Export 35.98 33.01 2.97 9.0
Total International package 18.26 16.08 2.18 13.6Consolidated $ 9.16 $ 8.77 $ 0.39 4.4%

Management’s discussion and analysis 27
Year Ended December 31, Change
Revenue (in millions): 2003 2002 $ %
U.S. domestic package:Next Day Air $ 5,580 $ 5,349 $ 231 4.3%Deferred 2,982 2,868 114 4.0Ground 16,460 15,707 753 4.8
Total U.S. domestic package 25,022 23,924 1,098 4.6International package:
Domestic 1,134 943 191 20.3Export 4,001 3,276 725 22.1Cargo 426 461 (35) (7.6)
Total International package 5,561 4,680 881 18.8Non-package:
UPS Supply Chain Solutions 2,126 1,969 157 8.0Other 776 699 77 11.0
Total Non-package 2,902 2,668 234 8.8Consolidated $ 33,485 $ 31,272 $ 2,213 7.1%
Average Daily Package Volume (in thousands): # U.S. domestic package:
Next Day Air 1,185 1,111 74 6.7%Deferred 918 895 23 2.6Ground 10,268 10,112 156 1.5
Total U.S. domestic package 12,371 12,118 253 2.1International package:
Domestic 786 779 7 0.9Export 481 443 38 8.6
Total International package 1,267 1,222 45 3.7Consolidated 13,638 13,340 298 2.2%
Operating days in period 252 252
Average Revenue Per Piece: $ U.S. domestic package:
Next Day Air $ 18.69 $ 19.11 $ (0.42) (2.2)%Deferred 12.89 12.72 0.17 1.3Ground 6.36 6.16 0.20 3.2
Total U.S. domestic package 8.03 7.83 0.20 2.6International package:
Domestic 5.73 4.80 0.93 19.4Export 33.01 29.35 3.66 12.5
Total International package 16.08 13.70 2.38 17.4Consolidated $ 8.77 $ 8.37 $ 0.40 4.8%

28 UPS Annual Report 2004
Management’s discussion and analysis of financial condition and results of operations
Operating Profit The following tables set forth information showing the change in operating profit, both in dollars (in millions) and in percentage terms:
Year Ended December 31, Change
2004 2003 $ %
Operating SegmentU.S. domestic package $ 3,345 $ 3,272 $ 73 2.2%International package 1,121 709 412 58.1Non-package 523 464 59 12.7
Consolidated Operating Profit $ 4,989 $ 4,445 $ 544 12.2%
Year Ended December 31, Change
2003 2002 $ %
Operating SegmentU.S. domestic package $ 3,272 $ 3,576 $ (304) (8.5)%International package 709 322 387 120.2Non-package 464 198 266 134.3
Consolidated Operating Profit $ 4,445 $ 4,096 $ 349 8.5%
U.S. Domestic Package Operations
2004 compared to 2003 U.S. domestic package revenue increased $1.588 billion, or 6.3%,for the year, which resulted from a 3.3% increase in average dailypackage volume and a 2.1% increase in revenue per piece.Ground volume increased 4.0% during the year, driven in part bythe improving U.S. economy, and reflects growth in both com-mercial and residential deliveries. Ground volume increased 4.8%during the first nine months of the year, but slowed to 1.5% dur-ing the fourth quarter. Total Next Day Air volume (up 0.8%) andtotal deferred volume (down 0.9%) were both significantlyaffected by declines in letter volume, but offset by an increase inNext Day Air package volume. The 2004 decline in Next Day Airand deferred letter volume is largely due to the slowdown inmortgage refinancing, which was notably strong in 2003.
Ground revenue per piece increased 0.9% for the year prima-rily due to the impact of a rate increase that took effect in 2004,but growth was adversely impacted by approximately 220 basispoints due to the removal of the fuel surcharge on ground prod-ucts, as discussed below. Next Day Air revenue per pieceincreased 6.6%, while deferred revenue per piece increased6.1%, primarily due to the shift in product mix from letters topackages, the rate increase, and the modified fuel surcharge ondomestic air products.
On January 5, 2004, a rate increase took effect which was inline with previous years’ rate increases. We increased rates for
standard ground shipments an average of 1.9% for commercialdeliveries. The ground residential surcharge increased $0.25 to$1.40 over the commercial ground rate. An additional deliveryarea surcharge of $1.00 was implemented for commercial deliv-eries in certain ZIP codes. Rates for UPS Hundredweightincreased 5.9%. In addition, we increased rates for UPS NextDay Air an average of 2.9% and increased rates for deferredservices by 2.9%.
In addition, we discontinued the fuel surcharge on groundproducts, while we began to apply a new indexed surcharge todomestic air products. This indexed fuel surcharge for thedomestic air products is based on the U.S. Energy Department’sGulf Coast spot price for a gallon of kerosene-type jet fuel.Based on published rates, the average fuel surcharge applied toour air products during 2004 was 7.07%, compared with theaverage surcharge of 1.47% applied to both air and groundproducts in 2003, resulting in an increase in domestic fuel sur-charge revenue of $290 million during the year.
U.S. domestic package operating profit increased $73 million,or 2.2%, primarily due to the increase in volume and revenuegrowth discussed previously, but somewhat offset by increasedaircraft impairment charges ($91 million in 2004 compared to$69 million in 2003) and a $63 million pension charge related tothe consolidation of data systems used to collect and accumulateplan participant data.

Management’s discussion and analysis 29
2003 compared to 2002 U.S. domestic package revenue increased $1.098 billion, or4.6%, for the year, which was driven by a 2.1% increase in aver-age daily package volume and a 2.6% increase in revenue perpiece. Ground volume increased by 1.5% in 2003, reversing a2.0% decline in 2002, reflecting the improving U.S. economyand the impact that labor negotiations had on lowering volumeduring portions of 2002. The volume for our UPS Next Day Airproducts increased by 6.7% during the year, driven by double-digit growth in overnight letters which was influenced by thestrength in mortgage refinancing activity during 2003. Theincrease in U.S. domestic average daily package volume wasmore significant in the latter half of the year. In the third andfourth quarters of 2003, total U.S. domestic average dailypackage volume increased 3.2% and 4.9%, respectively.
The overall improvement in revenue per piece was primarilydue to the rate increase that became effective in January 2003,with some additional benefit from the fuel surcharge asdescribed below. The decline in revenue per piece for the NextDay Air products, and the relatively smaller increase for thedeferred products, was primarily due to the relatively highergrowth in letter volume compared with the growth in packagevolume for these products.
On January 6, 2003, we increased rates for standard groundshipments an average of 3.9% for commercial deliveries. Theground residential surcharge increased $0.05 to $1.15 over thecommercial ground rate. The additional delivery area surchargeadded to residential deliveries in certain ZIP codes increased$0.25 to $1.75. Rates for UPS Hundredweight increased 5.9%.In addition, we increased rates for UPS Next Day Air an averageof 3.4% and increased rates for deferred services by 4.5%.
During 2003, the index-based fuel surcharge reset on amonthly basis and was based on the National U.S. Average On-Highway Diesel Fuel Prices as reported by the U.S. Departmentof Energy. Based on published rates, the average fuel surchargeincreased to 1.47% in 2003 from 0.78% in 2002, resulting in anincrease in fuel surcharge revenue of $144 million. Effective in2004, we discontinued the fuel surcharge on ground service,while an indexed surcharge was applied to our Next Day Air anddeferred products. This indexed fuel surcharge for the domesticair products was based on the U.S. Energy Department’s GulfCoast spot price for a gallon of kerosene-type jet fuel.
U.S. domestic package operating profit declined $304 million,or 8.5%, primarily due to the slow volume and revenue growthcombined with an increase in operating expenses (discussed fur-ther below under the section titled “Operating Expenses andOperating Margin”). U.S. domestic package operating profitincreased 2.0% in the third quarter and decreased by 9.4% inthe fourth quarter. In the fourth quarter of 2002, U.S. domestic
package operating profit benefited from a $175 million creditdue to a change in our vacation policy for non-union employees.
International Package Operations
2004 compared to 2003 International package revenue improved $1.201 billion, or21.6%, for the year primarily due to the 12.5% volume growthfor our export products and strong revenue per piece improve-ments. Revenue increased $295 million during the year due tocurrency fluctuations. Revenue growth was also impacted by thechange to our fuel surcharge (discussed below) as well as ratechanges, which vary by geographical market and occur through-out the year. Rates for international shipments originating in theUnited States (Worldwide Express, Worldwide Express Plus, UPSWorldwide Expedited and UPS International Standard service)increased an average of 3.5%.
In January 2004, changes were made to the calculation of ourfuel surcharge on international products (including U.S. exportproducts). The surcharge is now indexed to fuel prices in our dif-ferent international regions, depending on where the shipmenttakes place. The current surcharge is only applied to our interna-tional express products, while the previous surcharge wasapplied to all international products. These changes, along withhigher fuel prices, had the effect of increasing international pack-age revenue by $231 million during the year.
We experienced double-digit export volume growth in eachregion throughout the world, with the Asia-Pacific region lead-ing with 24% export volume growth, including a 101% increasein China export volume. Export volume continues to benefitfrom our expanding international network, such as the six addi-tional flights to Shanghai, China that were added in the fourthquarter. European export volume grew in excess of 10%, andwas positively influenced by the addition of 10 countries to theEuropean Union. Non-U.S. domestic volume increased 3.7% forthe year, and primarily reflects improvements in our Europeanand Canadian domestic delivery businesses.
Export revenue per piece increased 9.0% for the year (3.1%currency-adjusted), benefiting from rate increases and the impactof the fuel surcharge. In total, international average daily pack-age volume increased 7.0% and average revenue per pieceincreased 13.6% (6.7% currency-adjusted).
The improvement in operating profit for our internationalpackage operations was $412 million, or 58.1%, for the year,$54 million of which was due to favorable currency fluctuations.This increase in operating profit was primarily due to the strongexport volume growth and revenue per piece increases describedpreviously, and a strong increase in operating margin throughbetter network utilization. International operating profit was
30 UPS Annual Report 2004
Management’s discussion and analysis of financial condition and results of operations
adversely affected by aircraft impairment charges of $19 millionin 2004, compared to a $6 million charge in 2003.
2003 compared to 2002 International package revenue improved $881 million, or 18.8%,for the year due primarily to the 8.6% volume growth for ourexport products and strong revenue per piece improvements, aportion of which can be attributed to the impact of currency.Revenue increased $443 million during the year due to currencyfluctuations. Export volume increased throughout the world, withAsia-Pacific, Canada, and the Americas showing double-digitexport volume growth, and U.S. and European export volumeincreasing slightly over 6%. European export volume growth wasadversely impacted by the strength of the Euro and the weakEuropean economy. Domestic volume increased 0.9% for the year,reversing a 3.2% decline from the previous year, which was alsonegatively affected by the weak European economy.
Export revenue per piece increased 12.5% for the year (3.3%currency-adjusted), due to improvements in product mix andcontinued focus on yield management. In total, internationalaverage daily package volume increased 3.7% and average rev-enue per piece increased 17.4% (6.2% currency-adjusted). The7.6% decline in cargo revenue during the year was largely due to a reduction of flights in our air network in the Americas.
Rates for international shipments originating in the UnitedStates (UPS Worldwide Express, UPS Worldwide Express Plus,UPS Worldwide Expedited and UPS Standard service) increasedan average of 3.9%. Rate changes for shipments originating out-side the United States generally are made throughout the yearand vary by geographic market.
The improvement in operating profit for our internationalpackage operations was $387 million for the year, $117 millionof which was due to favorable currency fluctuations. Thisincrease in operating profit was primarily due to the strongexport volume growth and revenue per piece increases describedpreviously. In 2002, international operating profit benefitedfrom an $11 million credit to operating expense as a result of achange in our vacation policy for non-union employees.
Non-Package Operations
2004 compared to 2003 Non-package revenue increased $308 million, or 10.6%, forthe year. UPS Supply Chain Solutions increased revenue by10.3% during the year, with strong growth in our air andground freight forwarding businesses, as well as our logisticsbusiness. Favorable currency fluctuations provided $73 millionof the increase in revenue for the year. The remainder of ournon-package operations, which includes Mail Boxes Etc. (thefranchisor of Mail Boxes Etc. and The UPS Store), UPS Capital,our mail and consulting services, and our excess value package
insurance business, increased revenue by 11.3% for the year,largely due to strong double-digit franchise and royalty rev-enue growth at Mail Boxes Etc. resulting from an expandingstore base, as well as higher excess value insurance revenue.Menlo Worldwide Forwarding, which was acquired inDecember 2004, added $33 million in revenue.
Non-package operating profit increased $59 million, or12.7%, for the year, primarily due to improved results from ourUPS Capital, mail services, and excess value insurance business.Mail Boxes Etc. experienced strong profit growth, due to theincreased franchise and royalty revenue noted previously. Non-package operating profit includes $112 million (compared to$114 million in 2003) of intersegment profit for the year, with a corresponding amount of operating expense, which reducesoperating profit, in the U.S. domestic package segment.
During the second quarter of 2003, we sold our MailTechnologies business unit in a transaction that increased netincome by $14 million, or $0.01 per diluted share. The gain con-sisted of a pre-tax loss of $24 million recorded in other operatingexpenses within the non-package segment, and a tax benefit of$38 million recognized in conjunction with the sale. The tax ben-efit exceeded the pre-tax loss from this sale primarily because thegoodwill impairment charge we previously recorded for the MailTechnologies business unit was not deductible for income taxpurposes. Consequently, our tax basis was greater than our bookbasis, thus producing the tax benefit described above.
During the third quarter of 2003, we sold our AviationTechnologies business unit and recognized a pre-tax gain of $24million ($15 million after-tax, or $0.01 per diluted share), whichis recorded in other operating expenses within the non-packagesegment. The operating results of both the Mail Technologiesunit and the Aviation Technologies unit were previously includedin our non-package segment, and were not material to our con-solidated operating results in any of the periods presented.
2003 compared to 2002 Non-package revenue increased $234 million, or 8.8%, for theyear. UPS Supply Chain Solutions increased revenue by 8.0%during the year. This increase was due to growth in our supplychain management and other logistics businesses, with interna-tional revenues growing faster than in the United States, partiallyas a result of favorable currency fluctuations. Favorable currencyfluctuations accounted for $74 million of the increase in rev-enue. Freight forwarding revenue increased at a slower rate,which was influenced by global economic conditions andincreased air revenue in 2002 as a result of the work disruptionat U.S. west coast ports. The remainder of our non-packageoperations, which includes Mail Boxes Etc. (the franchisor ofMail Boxes Etc. and The UPS Store), UPS Capital, our mail andconsulting services, and our excess value package insurance busi-ness, increased revenue by 11.0% for the year, primarily due to
Management’s discussion and analysis 31
increased franchise revenue at Mail Boxes Etc. and improve-ments from our Mail Innovations unit.
Non-package operating profit increased $266 million, or134.3%, for the year. This increase was primarily due to higheroperating profit from our Supply Chain Solutions unit, which wasdriven by the increase in revenue as well as the cost savings pro-duced by our integration and restructuring program. Non-packageoperating profit in 2002 was reduced by the $106 million restruc-turing charge and related expenses, and was increased by $11million due to the change in our vacation policy for non-unionemployees. Non-package operating profit includes $114 million(compared to $112 million in 2002) of intersegment profit, with acorresponding amount of operating expense, which reduces oper-ating profit, in the U.S. domestic package segment.
Operating Expenses and Operating Margin
2004 compared to 2003 Consolidated operating expenses increased by $2.553 billion, or8.8%, for the year, $311 million of which was due to currencyfluctuations in our international package and non-package seg-ments. Compensation and benefits increased by $1.588 billion, or 8.2%, for the year, largely due to increased payroll costs,increased health and welfare expense, and higher pension expensefor our union pension plans. Stock-based compensation expenseincreased $167 million, or 23.2%, during the year, primarily as aresult of increased management incentive awards expense andadopting the measurement provisions of FAS 123 prospectivelybeginning with 2003 stock-based compensation awards.
Other operating expenses increased by $965 million, or 9.9%,for the year, largely due to a 34.9% increase in fuel expense and a12.6% increase in purchased transportation, but were somewhatoffset by a decline in depreciation and amortization expense. Theincrease in fuel expense was primarily due to higher prices for Jet-A, diesel, and unleaded gasoline, in addition to somewhat higherfuel usage and lower hedging gains. The increase in purchasedtransportation expense was influenced by the impact of currency,higher fuel prices, and volume growth in our international pack-age business. The decline in depreciation and amortization for theyear was impacted by lower depreciation expense on aircraftengines, largely due to the retirement of some older aircraft. Theincrease in repairs and maintenance expense was affected byincreased expense on vehicle parts and airframe and engine main-tenance. The increase in other occupancy expense was largelyrelated to higher rent expense, but somewhat offset by lower realestate taxes. The increase in other expenses was affected by the$110 million impairment of aircraft, engines, and parts, as wellas the $63 million pension charge discussed previously, in addi-tion to higher advertising costs.
Our consolidated operating margin, defined as operatingprofit as a percentage of revenue, increased in 2004 comparedwith 2003. The operating margins for our three business seg-ments were as follows:
Year Ended December 31, 2004 2003 2002
Operating SegmentU.S. domestic package 12.6% 13.1% 14.9%International package 16.6% 12.7% 6.9%Non-package 16.3% 16.0% 7.4%
Consolidated 13.6% 13.3% 13.1%
2003 compared to 2002 Consolidated operating expenses increased by $1.864 billion, or6.9%, for the year, $398 million of which was due to currencyfluctuations in our international package and non-package seg-ments. Compensation and benefits increased by $1.388 billion, or7.7%, for the year, primarily due to increased health and welfarebenefit costs and higher pension expense. Stock-based compensa-tion expense totaled $724 million in 2003, a 14.0% increase over2002, primarily as a result of increased management incentiveawards expense and adopting the measurement provisions of FAS 123 for 2003 stock-based compensation awards.
Other operating expenses increased by $476 million, or 5.2%,for the year, largely due to a 12.3% increase in occupancy costs,a 10.3% increase in fuel expense, and smaller increases in pur-chased transportation, repairs and maintenance, and depreciationand amortization. Other operating expenses in 2002 wereaffected by the $106 million restructuring charge and relatedexpenses incurred in the integration of our Freight Services andLogistics Group operations into our UPS Supply Chain Solutionsunit. The growth in other occupancy expense was impacted byhigher rent expense on buildings and facilities, higher real estatetaxes, and weather-related increases in natural gas and utilitiesexpense. The fuel expense increase was due to higher fuel pricesin 2003, somewhat offset by hedging gains and lower fuel usage.The increase in purchased transportation expense was influencedby the impact of currency and growth in our international pack-age and Supply Chain Solutions businesses. The growth indepreciation and amortization reflects the addition of new air-craft, the completion of facilities projects (including UPSWorldport), and increased amortization of capitalized software.The increase in repairs and maintenance was primarily due tohigher vehicle, aircraft, and equipment maintenance expense.
The increase in other expenses was primarily due to a $75million impairment charge recorded in the fourth quarter of2003, resulting from an impairment evaluation performed whenwe permanently removed a number of Boeing 727 and DC-8aircraft from service.
32 UPS Annual Report 2004
Management’s discussion and analysis of financial condition and results of operations
Investment Income/Interest Expense
2004 compared to 2003 Investment income increased by $64 million during the year,primarily due to a $58 million impairment charge recognizedduring 2003. We periodically review our investments for indica-tions of other than temporary impairment considering manyfactors, including the extent and duration to which a security’sfair value has been less than its cost, overall economic and mar-ket conditions, and the financial condition and specific prospectsfor the issuer. During the first quarter of 2003, after consideringthe continued decline in the U.S. equity markets, we recognizedan impairment charge of $58 million, primarily related to ourinvestment in S&P 500 equity portfolios. Investment incomealso increased in 2004 due to higher interest rates earned oncash balances, but was somewhat offset by increased equity-method losses on certain investment partnerships.
The $28 million increase in interest expense during 2004 wasprimarily due to the impact of higher interest rates on variablerate debt and certain interest rate swaps, as well as the impact ofcurrency exchange rates and imputed interest expense associatedwith certain investment partnerships. The impact of higher inter-est rates was somewhat offset by lower average debt balancesoutstanding in 2004 compared to 2003.
In December 2003, we redeemed $300 million in cash-settledconvertible senior notes at a price of 102.703, and also termi-nated the swap transaction associated with the notes. Theredemption amount paid was lower than the amount recordedfor the fair value of the notes at the time of redemption, which,along with the cash settlement received on the swap, resulted ina $28 million non-operating gain recorded in 2003 results.
2003 compared to 2002 The decrease in investment income of $45 million in 2003 isprimarily due to the $58 million impairment charge recognizedduring the first quarter of 2003. The $52 million decline in inter-est expense in 2003 was primarily the result of lower commercialpaper balances outstanding, lower interest rates on variable ratedebt, and lower floating rates on interest rate swaps.
Net Income and Earnings Per Share
2004 compared to 2003 2004 net income was $3.333 billion, a 15.0% increase from the$2.898 billion in 2003, resulting in an increase in diluted earn-ings per share to $2.93 in 2004 from $2.55 in 2003. Net incomein 2004 was adversely impacted by a $70 million after-taximpairment charge ($0.06 per diluted share) on Boeing 727,747, and McDonnell Douglas DC-8 aircraft, engines, and parts,as well as a $40 million after-tax charge ($0.04 per dilutedshare) to pension expense resulting from the consolidation ofdata systems used to collect and accumulate plan participant
data. Net income was positively impacted by credits to incometax expense totaling $142 million ($0.13 per diluted share)related to various items, including the resolution of certain taxmatters, the removal of a portion of the valuation allowance oncertain deferred tax assets on net operating loss carryforwards,and an adjustment for identified tax contingency items.
Net income in 2003 was favorably impacted by the $14 mil-lion after-tax gain ($0.01 per diluted share) on the sale of MailTechnologies, the $15 million after-tax gain ($0.01 per dilutedshare) on the sale of Aviation Technologies, and the $18 millionafter-tax gain ($0.02 per diluted share) recognized uponredemption of our $300 million cash-settled senior convertiblenotes. Net income in 2003 was adversely impacted by the $37million after-tax investment impairment charge ($0.03 perdiluted share) described previously. Net income in 2003 wasalso favorably impacted by reductions in income tax expense of$116 million ($0.10 per diluted share) due to the resolution ofvarious tax issues with the IRS, a favorable court ruling on thetax treatment of jet engine maintenance costs, and a lowereffective state tax rate.
2003 compared to 2002 Net income for 2003 was $2.898 billion, a decrease of $284 mil-lion from the $3.182 billion achieved in 2002, resulting in adecrease in diluted earnings per share to $2.55 in 2003 from$2.81 in 2002. Net income in 2003 was affected by the itemsnoted above. Net income in 2002 was favorably impacted by a$776 million after-tax ($0.68 per diluted share) benefit resultingfrom the reversal of a portion of the previously established taxassessment liability, and by $121 million after-tax ($0.11 perdiluted share) from the credit to expense as a result of thechange in our vacation policy for non-union employees. Netincome in 2002 was adversely impacted by $65 million after-tax($0.06 per diluted share) due to the restructuring charge andrelated expenses and by $72 million after-tax ($0.06 per dilutedshare) due to the FAS 142 cumulative expense adjustment.
Liquidity and Capital Resources
Net Cash From Operating Activities Net cash provided by operating activities was $5.331, $4.576,and $5.688 billion in 2004, 2003 and 2002, respectively. Theincrease in 2004 operating cash flows compared with 2003 wasprimarily due to higher net income, decreased pension and retire-ment plan fundings, and cash received upon the resolution ofvarious tax matters. In 2004, we funded $450 million to our pen-sion plans as compared to $1.136 billion in 2003. As discussed inNote 5 to the consolidated financial statements, projected pen-sion contributions to plan trusts in 2005 are approximately $723million. In 2004, we received $610 million from our previouslydisclosed settlement with the Internal Revenue Service (IRS) pri-marily on tax matters related to excess value package insurance

Management’s discussion and analysis 33
for tax years 1983-84 and 1991-98 (see “Contingencies” sectionbelow). As of December 31, 2004, we had a $371 million receiv-able recorded for the settlement related to tax years 1985-90.
On October 28, 2004, we announced a rate increase and achange in the fuel surcharge that will take effect on January 3,2005. We increased rates 2.9% on UPS Next Day Air, UPS 2ndDay Air, UPS 3 Day Select, and UPS Ground. We also increasedrates 2.9% for international shipments originating in the UnitedStates (Worldwide Express, Worldwide Express Plus, UPSWorldwide Expedited and UPS International Standard service).Other pricing changes include an increase of $0.25 for deliveryarea surcharge on both residential and commercial services tocertain ZIP codes. The residential surcharge will increase $0.10for UPS Ground services and $0.35 for UPS Next Day Air, UPS2nd Day Air and UPS 3 Day Select. These rate changes are cus-tomary, and are consistent with previous years’ rate increases.Additionally, in January 2005 we will modify the fuel surchargeon domestic and international air services by setting a maximumcap of 9.5%. A fuel surcharge of 2% will be applied to UPSGround services that will fluctuate after January 2005 based onthe U.S. Energy Department’s On-Highway Diesel Fuel Price.Rate changes for shipments originating outside the U.S. weremade throughout the past year and varied by geographic market.
Net Cash Used In Investing ActivitiesNet cash used in investing activities was $3.638, $2.742, and$3.281 billion in 2004, 2003 and 2002, respectively. The pri-mary reason for the increased cash used in investing activitieshas been the increasing net purchases of marketable securities,due to the excess of cash generated over our capital investmentneeds. The increase in funds used for business acquisitions isprimarily due to the Menlo Worldwide Forwarding and UPSYamato Express Co. acquisitions in 2004 (see Note 7 to the con-solidated financial statements). The cash generated from financereceivables was primarily due to principal payments on financereceivables and sales of portions of our portfolio, primarily inthe receivable factoring business.
Capital expenditures represent a primary use of cash ininvesting activities, as follows (in millions):
2004 2003 2002
Buildings and facilities $ 547 $ 451 $ 528Aircraft and parts 829 1,019 638Vehicles 393 161 41Information technology 358 316 451Total $ 2,127 $ 1,947 $ 1,658
As described in the “Commitments” section below, we havecommitments for the purchase of aircraft, vehicles, equipmentand other fixed assets to provide for the replacement of existingcapacity and anticipated future growth. We fund our capitalexpenditures with our cash from operations.
Net Cash Used In Financing Activities Net cash used in financing activities was $2.014, $2.110 and$2.090 billion in 2004, 2003 and 2002, respectively. Our pri-mary use of cash in financing activities has been to repurchasestock, pay dividends, and repay long-term debt. In October2004, a total of $2.0 billion was authorized for share repur-chases as part of our continuing share repurchase program. Asof December 31, 2004, $1.817 billion of this authorization wasavailable for future share repurchases. We repurchased a total of$1.310 billion of common stock in 2004.
We increased our cash dividends per share to $1.12 in 2004from $0.92 in 2003, resulting in an increase in total cash divi-dends paid to $1.208 billion from $956 million. The declarationof dividends is subject to the discretion of the Board of Directorsand will depend on various factors, including our net income,financial condition, cash requirements, future prospects, andother relevant factors. We expect to continue the practice of pay-ing regular cash dividends. In February 2005, the Board ofDirectors declared a $0.33 per share dividend, which representsa 17.9% increase over the $0.28 previous quarterly dividend.The dividend is payable on March 9, 2005 to shareowners ofrecord on February 22, 2005.
During 2004, we repaid $468 million in debt, primarily con-sisting of $264 million in commercial paper, $56 million inredemptions of UPS Notes, $57 million in scheduled principalpayments on capital lease obligations, and $60 million for theredemption of our Singapore Dollar notes issue. Issuances ofdebt primarily consisted of $735 million in commercial paperand $41 million in UPS Notes. We consider the overall fixed andfloating interest rate mix of our portfolio and the related overallcost of borrowing when planning for future issuances and non-scheduled repayments of debt.
Sources of Credit We maintain two commercial paper programs under which weare authorized to borrow up to $7.0 billion. Approximately$1.015 billion was outstanding under these programs as ofDecember 31, 2004, with an average interest rate of 2.10%.The entire balance outstanding has been classified as a currentliability in our balance sheet. In addition, we maintain anextendable commercial notes program under which we areauthorized to borrow up to $500 million. No amounts wereoutstanding under this program at December 31, 2004.
We maintain two credit agreements with a consortium ofbanks. These agreements provide revolving credit facilities of$1.0 billion each, with one expiring on April 21, 2005 and theother on April 24, 2008. Interest on any amounts we borrowunder these facilities would be charged at 90-day LIBOR plus 15 basis points. There were no borrowings under either of theseagreements as of December 31, 2004.

34 UPS Annual Report 2004
Management’s discussion and analysis of financial condition and results of operations
In August 2003, we filed a $2.0 billion shelf registration state-ment under which we may issue debt securities in the UnitedStates. There was approximately $126 million issued under thisshelf registration statement at December 31, 2004, all of whichconsists of issuances under our UPS Notes program.
Our existing debt instruments and credit facilities do not havecross-default or ratings triggers, however these debt instrumentsand credit facilities do subject us to certain financial covenants.These covenants generally require us to maintain a $3.0 billionminimum net worth and limit the amount of secured indebtednessavailable to the company. These covenants are not consideredmaterial to the overall financial condition of the company, and allcovenant tests were passed as of December 31, 2004.
Commitments We have contractual obligations and commitments in the formof operating leases, capital leases, debt obligations and purchasecommitments. We intend to satisfy these obligations through theuse of cash flow from operations. The following table summa-rizes our contractual obligations and commitments as ofDecember 31, 2004 (in millions):
Capitalized Operating Debt PurchaseYear Leases Leases Principal Commitments
2005 $ 97 $ 370 $ 1,110 $ 1,0122006 70 327 6 4882007 121 242 — 2232008 132 169 27 2742009 76 128 84 637After 2009 62 590 2,777 1,129Total $ 558 $ 1,826 $ 4,004 $ 3,763
In December 2004, we amended our existing aircraft purchaseagreement with Airbus Industries. The amended agreement willreduce Airbus A300-600 aircraft on order from 50 to 13, andthe number of options on this aircraft from 37 to zero. These 13aircraft remaining on order will be delivered to UPS by July2006. Additionally, we placed a firm order for 10 Airbus A380freighter aircraft, and obtained options to purchase 10 addi-tional A380 aircraft. The Airbus A380 aircraft will be deliveredto UPS between 2009 and 2012. The purchase commitmentsinformation above reflects the amended agreement.
In January 2005, we also announced an agreement to pur-chase an additional 11 Boeing MD-11 pre-owned aircraft. Theseaircraft will be delivered to UPS between 2005 and 2007.
We believe that funds from operations and borrowing pro-grams will provide adequate sources of liquidity and capitalresources to meet our expected long-term needs for the operationof our business, including anticipated capital expenditures, suchas commitments for aircraft purchases, for the foreseeable future.
Contingencies On August 9, 1999 the United States Tax Court held that wewere liable for tax on income of Overseas Partners Ltd., aBermuda company that had reinsured excess value (“EV”) insur-ance purchased by our customers beginning in 1984, and that wewere liable for additional tax for the 1983 and 1984 tax years.The IRS took similar positions to those advanced in the TaxCourt decision for tax years subsequent to 1984 through 1998.On June 20, 2001, the U.S. Court of Appeals for the EleventhCircuit ruled in our favor and reversed the Tax Court decision. InJanuary 2003, we and the IRS finalized settlement of all out-standing tax issues related to EV package insurance. Under theterms of settlement, we agreed to adjustments that will result inincome tax due of approximately $562 million, additions to taxof $60 million and related interest. The amount due to the IRS asa result of the settlement is less than amounts we previously hadaccrued. As a result, we recorded income, before taxes, of $1.023billion ($776 million after tax) during the fourth quarter of 2002.In the first quarter of 2004, we received a refund of $185 millionpertaining to the 1983 and 1984 tax years.
The IRS had proposed adjustments, unrelated to the EV pack-age insurance matters discussed above, regarding the allowanceof deductions and certain losses, the characterization of expensesas capital rather than ordinary, the treatment of certain income,and our entitlement to tax credits in the 1985 through 1998 taxyears. In the third quarter of 2004, we settled all outstandingissues related to each of the tax years 1991 through 1998. In thefourth quarter of 2004, we received a refund of $425 millionpertaining to the 1991 through 1998 tax years. We expect toreceive the $371 million of refunds related to the 1985 through1990 tax years within the next six months.
The IRS may take similar positions with respect to some ofthe non-EV package insurance matters for each of the years1999 through 2004. If challenged, we expect that we will prevailon substantially all of these issues. Specifically, we believe thatour practice of expensing the items that the IRS alleges shouldhave been capitalized is consistent with the practices of otherindustry participants. We believe that the eventual resolution ofthese issues will not have a material adverse effect on our finan-cial condition, results of operations or liquidity.
We were named as a defendant in twenty-three now-dismissedlawsuits that sought to hold us liable for the collection of premiumsfor EV insurance in connection with package shipments since 1984.Based on state and federal tort, contract and statutory claims, thesecases generally claimed that we failed to remit collected EV premi-ums to an independent insurer; we failed to provide promised EVinsurance; we acted as an insurer without complying with stateinsurance laws and regulations; and the price for EV insurance wasexcessive. These actions were all filed after the August 9, 1999 U.S.Tax Court decision, discussed above, which the U.S. Court ofAppeals for the Eleventh Circuit later reversed.
Management’s discussion and analysis 35
These twenty-three cases were consolidated for pre-trial pur-poses in a multi-district litigation proceeding (“MDLProceeding”) in federal court in New York. In addition to thecases in which UPS was named as a defendant, there also was anaction, Smith v. Mail Boxes Etc., against Mail Boxes Etc. and itsfranchisees relating to UPS EV insurance and related servicespurchased through Mail Boxes Etc. centers. That case also wasconsolidated into the MDL Proceeding.
In late 2003, the parties reached a global settlement resolvingall claims and all cases in the MDL proceeding. In reaching thesettlement, we and the other defendants expressly denied anyand all liability. On July 30, 2004, the court issued an ordergranting final approval to the substantive terms of the settle-ment. No appeals were filed and the settlement became effectiveon September 8, 2004.
Pursuant to the settlement, UPS has provided qualifying settle-ment class members with vouchers toward the purchase ofspecified UPS services and will pay the plaintiffs’ attorneys’ fees,the total amount of which still remains to be determined by thecourt. Other defendants have contributed to the costs of the settle-ment, including the attorneys’ fees. The ultimate cost to us of theproposed settlement will depend on a number of factors, includinghow many vouchers settlement class members actually use. We donot believe that this proposed settlement will have a material effecton our financial condition, results of operations, or liquidity.
We are a defendant in a number of lawsuits filed in statecourts containing various class-action allegations under statewage-and-hour laws. In one of these cases, Marlo v. UPS, whichhas been certified as a class action in California state court,plaintiffs allege that they improperly were denied overtime,penalties for missed meal and rest periods, interest and attor-neys’ fees. Plaintiffs purport to represent a class of 1,200full-time supervisors.
We have denied any liability with respect to these claims andintend to vigorously defend ourselves in these cases. At this time,we have not determined the amount of any liability that mayresult from these matters or whether such liability, if any, wouldhave a material adverse effect on our financial condition, resultsof operations, or liquidity.
In addition, we are a defendant in various other lawsuits thatarose in the normal course of business. We believe that the even-tual resolution of these cases will not have a material adverseeffect on our financial condition, results of operations, or liquidity.
We participate in a number of trustee-managed multi-employer pension and health and welfare plans for employeescovered under collective bargaining agreements. Several factorscould result in potential funding deficiencies which could causeus to make significantly higher future contributions to theseplans, including unfavorable investment performance, changes indemographics, and increased benefits to participants. At thistime, we are unable to determine the amount of additional
future contributions, if any, or whether any material adverseeffect on our financial condition, results of operations, or cashflows could result from our participation in these plans.
Due to the events of September 11, 2001, increased securityrequirements for air carriers may be forthcoming; however, wedo not anticipate that such measures will have a material adverseeffect on our financial condition, results of operations, or liquid-ity. In addition, our insurance premiums have risen and we havetaken several actions, including self-insuring certain risks, to mit-igate the expense increase.
As of December 31, 2004, we had approximately 229,000employees employed under a national master agreement andvarious supplemental agreements with local unions affiliatedwith the International Brotherhood of Teamsters (“Teamsters”).These agreements run through July 31, 2008. The majority ofour pilots are employed under a collective bargaining agreementwith the Independent Pilots Association, which became amend-able January 1, 2004. Negotiations are ongoing with theassistance of the National Mediation Board. Our airlinemechanics are covered by a collective bargaining agreementwith Teamsters Local 2727, which becomes amendable onNovember 1, 2006. In addition, the majority of our groundmechanics who are not employed under agreements with theTeamsters are employed under collective bargaining agreementswith the International Association of Machinists and AerospaceWorkers. These agreements run through July 31, 2009.
Market Risk We are exposed to market risk from changes in certain commod-ity prices, foreign currency exchange rates, interest rates, andequity prices. All of these market risks arise in the normal courseof business, as we do not engage in speculative trading activities.In order to manage the risk arising from these exposures, we uti-lize a variety of foreign exchange, interest rate, equity andcommodity forward contracts, options, and swaps.
The following analysis provides quantitative informationregarding our exposure to commodity price risk, foreign cur-rency exchange risk, interest rate risk, and equity price risk. We utilize valuation models to evaluate the sensitivity of the fairvalue of financial instruments with exposure to market risk thatassume instantaneous, parallel shifts in exchange rates, interestrate yield curves, and commodity and equity prices. For optionsand instruments with non-linear returns, models appropriate tothe instrument are utilized to determine the impact of marketshifts. There are certain limitations inherent in the sensitivityanalyses presented, primarily due to the assumption thatexchange rates change in a parallel fashion and that interestrates change instantaneously. In addition, the analyses areunable to reflect the complex market reactions that normallywould arise from the market shifts modeled.
36 UPS Annual Report 2004
Management’s discussion and analysis of financial condition and results of operations
A discussion of our accounting policies for derivative instru-ments and further disclosures are provided in Note 16 to theconsolidated financial statements.
Commodity Price Risk We are exposed to an increase in the prices of refined fuels, prin-cipally jet-A, diesel, and unleaded gasoline, which are used in thetransportation of packages. Additionally, we are exposed to anincrease in the prices of other energy products, primarily naturalgas and electricity, used in our operating facilities throughout theworld. We use a combination of options, swaps, and futurescontracts to provide some protection from rising fuel and energyprices. These derivative instruments generally cover forecastedfuel and energy consumption for periods of one to three years.The net fair value of such contracts subject to price risk, exclud-ing the underlying exposures, as of December 31, 2004 and2003 was an asset of $101 and $30 million, respectively. Thepotential loss in the fair value of these derivative contracts,assuming a hypothetical 10% change in the underlying commod-ity price, would be approximately $32 and $17 million atDecember 31, 2004 and 2003, respectively. This amountexcludes the offsetting impact of the price risk inherent in thephysical purchase of the underlying commodities.
Foreign Currency Exchange Risk We have foreign currency risks related to our revenue, operatingexpenses, and financing transactions in currencies other than thelocal currencies in which we operate. We are exposed to currencyrisk from the potential changes in functional currency values ofour foreign currency-denominated assets, liabilities, and cashflows. Our most significant foreign currency exposures relate tothe Euro, the British Pound Sterling and the Canadian Dollar. Weuse a combination of purchased and written options and forwardcontracts to hedge cash flow currency exposures. These derivativeinstruments generally cover forecasted foreign currency exposuresfor periods up to one year. As of December 31, 2004 and 2003,the net fair value of the hedging instruments described above wasa liability of $(28) and $(48) million, respectively. The potentialloss in fair value for such instruments from a hypothetical 10%adverse change in quoted foreign currency exchange rates wouldbe approximately $117 and $97 million at December 31, 2004and 2003, respectively. This sensitivity analysis assumes a parallelshift in the foreign currency exchange rates. Exchange rates rarelymove in the same direction. The assumption that exchange rateschange in a parallel fashion may overstate the impact of changingexchange rates on assets and liabilities denominated in a foreigncurrency.
Interest Rate Risk As described in Note 8 to the consolidated financial statements,we have issued debt instruments, including debt associated with
capital leases, that accrue expense at fixed and floating rates ofinterest. We use a combination of derivative instruments, includ-ing interest rate swaps and cross-currency interest rate swaps, aspart of our program to manage the fixed and floating interestrate mix of our total debt portfolio and related overall cost ofborrowing. These swaps are generally entered into concurrentlywith the issuance of the debt that they are intended to modify,and the notional amount, interest payment, and maturity datesof the swaps match the terms of the associated debt.
Our floating rate debt and interest rate swaps subject us torisk resulting from changes in short-term (primarily LIBOR)interest rates. The potential change in annual interest expenseresulting from a hypothetical 100 basis point change in short-term interest rates applied to our floating rate debt and swapinstruments at December 31, 2004 and 2003 would be approxi-mately $29 and $25 million, respectively.
As described in Note 1 and Note 2 to the consolidated finan-cial statements, we have certain investments in debt, auctionrate, and preferred securities that accrue income at variable ratesof interest. The potential change in annual investment incomeresulting from a hypothetical 100 basis point change in interestrates applied to our investments exposed to variable interestrates at December 31, 2004 and 2003 would be approximately$45 and $31 million, respectively.
Additionally, as described in Note 3 to the consolidated finan-cial statements, we hold a portfolio of finance receivables thataccrue income at fixed and floating rates of interest. The poten-tial change in the annual income resulting from a hypothetical100 basis point change in interest rates applied to our variablerate finance receivables at December 31, 2004 and 2003 wouldbe immaterial.
This interest rate sensitivity analysis assumes interest ratechanges are instantaneous, parallel shifts in the yield curve. Inreality, interest rate changes are rarely instantaneous or parallel.While this is our best estimate of the impact of the specifiedinterest rate scenarios, these estimates should not be viewed asforecasts. We adjust the fixed and floating interest rate mix ofour interest rate sensitive assets and liabilities in response tochanges in market conditions.
Equity Price RiskWe hold investments in various common equity securities thatare subject to price risk, and for certain of these securities, weutilize options to hedge this price risk. At December 31, 2004and 2003, the fair value of such investments was $77 and $95million, respectively. The potential change in the fair value ofsuch investments, assuming a 10% change in equity prices netof the offsetting impact of any hedges, would be approximately$8 and $10 million at December 31, 2004 and 2003.
Management’s discussion and analysis 37
Credit Risk The forward contracts, swaps, and options previously discussedcontain an element of risk that the counterparties may be unableto meet the terms of the agreements. However, we minimize suchrisk exposures for these instruments by limiting the counterpar-ties to large banks and financial institutions that meet establishedcredit guidelines. We do not expect to incur any losses as a resultof counterparty default.
New Accounting Pronouncements In December 2004, the FASB issued Statement No. 123 (revised2004), “Share-Based Payment” (“FAS 123R”), which replacesFAS 123 and supercedes APB 25. FAS 123R requires all share-based payments to employees, including grants of employeestock options, to be recognized in the financial statements basedon their fair values, beginning with the first interim or annualperiod after June 15, 2005, with early adoption encouraged. We will adopt FAS 123R in the third quarter of 2005, using theprospective method of adoption. The prospective methodrequires that compensation expense be recorded for all unvestedstock options and restricted stock at the beginning of the firstquarter of adoption of FAS 123R. There will be no impact uponadoption, as we will already be expensing all unvested optionand restricted stock awards.
In December 2004, the FASB issued FASB Staff Position(“FSP”) No. 109-2, “Accounting and Disclosure Guidance forthe Foreign Earnings Repatriation Provision within theAmerican Jobs Creation Act of 2004” (“FSP 109-2”). FSP 109-2provides guidance under FAS 109 with respect to recording thepotential impact of the repatriation provisions of the AmericanJobs Creation Act of 2004 (the “Jobs Act”) on enterprises’income tax expense and deferred tax liability. The Jobs Act wasenacted on October 22, 2004. FSP 109-2 states that an enter-prise is allowed time beyond the financial reporting period ofenactment to evaluate the effect of the Jobs Act on its plan forreinvestment or repatriation of foreign earnings for purposes ofapplying FAS 109. We have not yet completed our evaluation ofthe impact of the repatriation provisions of the Jobs Act.Accordingly, as provided for in FSP 109-2, we have not adjustedour income tax provision or deferred tax liabilities to reflect therepatriation provisions of the Jobs Act.
The adoption of the following recent accounting pronounce-ments did not have a material impact on our results ofoperations or financial condition:
n FASB Interpretation No. 45, “Guarantor’s Accounting andDisclosure Requirements for Guarantees, Including IndirectGuarantees of Indebtedness of Others — An Interpretationof FASB Statements No. 5, 57, and 107 and Rescission ofFASB Interpretation No. 34”;
n FASB Interpretation No. 46(R), “Consolidation of VariableInterest Entities — An Interpretation of ARB No. 51”;
n FASB Statement No. 132(R) (revised 2003), “Employer’sDisclosures about Pensions and Other Post-RetirementBenefits — An Amendment of FASB Statements No. 87, 88, and 106”;
n FASB Statement No. 146, “Accounting for Costs Associatedwith Exit or Disposal Activities”;
n FASB Statement No. 149, “Amendment of Statement 133on Derivative Instruments and Hedging Activities”;
n FASB Statement No. 150, “Accounting for CertainInstruments with Characteristics of Both Liabilities andEquity”; and
n FSP 106-2, “Accounting and Disclosure RequirementsRelated to the Medicare Prescription Drug, Improvementand Modernization Act of 2003”.
Critical Accounting Policies and Estimates Our discussion and analysis of our financial condition andresults of operations are based on our consolidated financialstatements, which are prepared in accordance with accountingprinciples generally accepted in the United States of America. Asindicated in Note 1 to our consolidated financial statements, theamounts of assets, liabilities, revenue, and expenses reported inour financial statements are affected by estimates and judgmentsthat are necessary to comply with generally accepted accountingprinciples. We base our estimates on prior experience and otherassumptions that we consider reasonable to our circumstances.Actual results could differ from our estimates, which wouldaffect the related amounts reported in our financial statements.While estimates and judgments are applied in arriving at manyreported amounts, we believe that the following matters mayinvolve a higher degree of judgment and complexity.
Contingencies — As discussed in Note 10 to our consolidatedfinancial statements, we are involved in various legal proceed-ings and contingencies. We have recorded liabilities for thesematters in accordance with Statement of Financial AccountingStandards No. 5, “Accounting for Contingencies” (“FAS 5”).FAS 5 requires a liability to be recorded based on our estimate ofthe probable cost of the resolution of a contingency. The actualresolution of these contingencies may differ from our estimates.If a contingency is settled for an amount greater than our esti-mate, a future charge to income would result. Likewise, if acontingency is settled for an amount that is less than our esti-mate, a future credit to income would result.
Goodwill Impairment — The Financial Accounting StandardsBoard issued Statement No. 142, “Goodwill and Other IntangibleAssets” (“FAS 142”), in June 2001. As a result of the issuance ofthis standard, goodwill is no longer amortized, but is subjected toannual impairment testing. Goodwill impairment testing requires

38 UPS Annual Report 2004
Management’s discussion and analysis of financial condition and results of operations
that we estimate the fair value of our goodwill and compare thatestimate to the amount of goodwill recorded on our balancesheet. The estimation of fair value requires that we make judg-ments concerning future cash flows and appropriate discountrates. Our estimate of the fair value of goodwill could changeover time based on a variety of factors, including the actualoperating performance of the underlying reporting units. Uponadoption of FAS 142, we recorded a non-cash impairment chargeof $72 million ($0.06 per diluted share), as of January 1, 2002,related to our Mail Technologies business. The primary factorresulting in the impairment charge was the lower than antici-pated growth experienced in the expedited mail deliverybusiness. In conjunction with our annual test of goodwill in2002, we recorded an additional impairment charge of $2 mil-lion related to our Mail Technologies business, resulting in totalgoodwill impairment of $74 million for 2002. Our annualimpairment tests performed in 2003 and 2004 resulted in nogoodwill impairment. As of December 31, 2004, our recordedgoodwill was $1.255 billion.
Self-Insurance Accruals — We self-insure costs associatedwith workers’ compensation claims, automotive liability, healthand welfare, and general business liabilities, up to certain limits.Insurance reserves are established for estimates of the loss thatwe will ultimately incur on reported claims, as well as estimatesof claims that have been incurred but not yet reported. Recordedbalances are based on reserve levels determined by outside actu-aries, who incorporate historical loss experience and judgmentsabout the present and expected levels of cost per claim. Trendsin actual experience are a significant factor in the determinationof such reserves. We believe our estimated reserves for suchclaims are adequate, but actual experience in claim frequencyand/or severity could materially differ from our estimates andaffect our results of operations.
Pension and Postretirement Medical Benefits — TheCompany’s pension and other postretirement benefit costs arecalculated using various actuarial assumptions and methodolo-gies as prescribed by Statement of Financial AccountingStandards No. 87, “Employers’ Accounting for Pensions” andStatement of Financial Accounting Standards No. 106,“Employers’ Accounting for Postretirement Benefits Other thanPensions.” These assumptions include discount rates, health carecost trend rates, inflation, rate of compensation increases,expected return on plan assets, mortality rates, and other factors.Actual results that differ from our assumptions are accumulatedand amortized over future periods and, therefore, generally affectour recognized expense and recorded obligation in such futureperiods. We believe that the assumptions utilized in recording theobligations under our plans are reasonable based on input fromour outside actuaries and other advisors and information as tohistorical experience and performance. Differences in actual
experience or changes in assumptions may affect our pension andother postretirement obligations and future expense.
Financial Instruments — As discussed in Notes 2, 3, 8, and 16to our consolidated financial statements, and in the “MarketRisk” section of this report, we hold and issue financial instru-ments that contain elements of market risk. Certain of thesefinancial instruments are required to be recorded at fair value.Fair values are based on listed market prices, when such pricesare available. To the extent that listed market prices are notavailable, fair value is determined based on other relevantfactors, including dealer price quotations. Certain financialinstruments, including over-the-counter derivative instruments,are valued using pricing models that consider, among other fac-tors, contractual and market prices, correlations, time value,credit spreads, and yield curve volatility factors. Changes in thefixed income, equity, foreign exchange, and commodity marketswill impact our estimates of fair value in the future, potentiallyaffecting our results of operations.
Depreciation, Residual Value, and Impairment of Fixed Assets — As of December 31, 2004, we had approximately $14.0billion of net fixed assets, the most significant category of whichis aircraft. In accounting for fixed assets, we make estimatesabout the expected useful lives and the expected residual valuesof the assets, and the potential for impairment based on the fairvalues of the assets and the cash flows generated by these assets.
In estimating the lives and expected residual values of air-craft, we have relied upon actual experience with the same orsimilar aircraft types. Subsequent revisions to these estimatescould be caused by changes to our maintenance program,changes in the utilization of the aircraft, governmental regula-tions on aging aircraft, and changing market prices of new andused aircraft of the same or similar types. We periodically evalu-ate these estimates and assumptions, and adjust the estimatesand assumptions as necessary. Adjustments to the expected livesand residual values are accounted for on a prospective basisthrough depreciation expense.
When appropriate, we evaluate our fixed assets for impair-ment. Factors that would indicate potential impairment mayinclude, but are not limited to, a significant change in the extentto which an asset is utilized, a significant decrease in the marketvalue of an asset, and operating or cash flow losses associatedwith the use of the asset.
In December 2003, we permanently removed from service anumber of Boeing 727 and McDonnell Douglas DC-8 aircraft.As a result, we conducted an impairment evaluation, whichresulted in a $75 million impairment charge during the fourthquarter for these aircraft (including the related engines), $69 mil-lion of which impacted the U.S. domestic package segment and$6 million of which impacted the international package segment.
In December 2004, we permanently removed from service anumber of Boeing 727, 747 and McDonnell Douglas DC-8 air-

Management’s discussion and analysis 39
craft. As a result of the actual and planned retirement of theseaircraft, we conducted an impairment evaluation, whichresulted in a $110 million impairment charge during the fourthquarter for these aircraft (including the related engines andparts), $91 million of which impacted the U.S. domestic pack-age segment and $19 million of which impacted theinternational package segment.
These charges are classified in the caption “other expenses”within other operating expenses (see Note 13 to the consolidatedfinancial statements). UPS continues to operate all of its otheraircraft and continues to experience positive cash flow.
Income Taxes — We operate in numerous countries aroundthe world and are subject to income taxes in many jurisdic-tions. We estimate our annual effective income tax rate basedon statutory income tax rates in these jurisdictions and takinginto consideration items that are treated differently for finan-cial reporting and tax purposes. The process of estimating oureffective income tax rate involves judgments related to taxplanning and expectations regarding future events. Theincreasing profitability of our International segment increasesthe significance of our non-U.S. income tax provision to ouroverall effective income tax rate. We recognize deferred taxassets for items that will generate tax deductions or credits infuture years. Realization of deferred tax assets requires suffi-cient future taxable income (subject to any carry-forwardlimitations) in the applicable jurisdictions. We make judgmentsregarding the realizability of deferred tax assets based, in part,on estimates of future taxable income. A valuation allowanceis established for the portion, if any, of the deferred tax assetsthat we conclude cannot be realized. Income tax related con-tingency matters also affect our effective income tax rate. Inthis regard, we make judgments related to the identificationand quantification of income tax related contingency matters.
Forward-Looking Statements
“Management’s Discussion and Analysis of Financial Conditionand Results of Operations,” “Liquidity and Capital Resources”and other parts of this report contain “forward-looking” state-ments about matters that inherently are difficult to predict. Thewords “believes,” “expects,” “anticipates,” “we see,” and similarexpressions are intended to identify forward-looking statements.These statements include statements regarding our intent, beliefand current expectations about our strategic direction, prospectsand future results. We have described some of the important fac-tors that affect these statements as we discussed each subject.Forward-looking statements involve risks and uncertainties, andcertain factors may cause actual results to differ materially fromthose contained in the forward-looking statements.
Risk Factors The following are some of the factors that could cause ouractual results to differ materially from the expected resultsdescribed in our forward-looking statements:
n The effect of general economic and other conditions in themarkets in which we operate, both in the United States andinternationally. Our operations in international markets are also affected by currency exchange and inflation risks.
n The impact of competition on a local, regional, national,and international basis. Our competitors include the postalservices of the U.S. and other nations, various motor carriers,express companies, freight forwarders, air couriers and oth-ers. Our industry is undergoing rapid consolidation, and thecombining entities are competing aggressively for business.
n The impact of complex and stringent aviation, transporta-tion, environmental, labor, employment and othergovernmental laws and regulations, and the impact of newlaws and regulations that may result from increased securityconcerns following the events of September 11, 2001. Ourfailure to comply with applicable laws, ordinances or regu-lations could result in substantial fines or possiblerevocation of our authority to conduct our operations.
n Strikes, work stoppages and slowdowns by our employees.Such actions may affect our ability to meet our customers’needs, and customers may do more business with competi-tors if they believe that such actions may adversely affectour ability to provide service. We may face permanent lossof customers if we are unable to provide uninterruptedservice. The terms of future collective bargaining agree-ments also may affect our competitive position and resultsof operations.
n Possible disruption of supplies, or an increase in the prices,of gasoline, diesel and jet fuel for our aircraft and deliveryvehicles as a result of war or other factors. We require sig-nificant quantities of fuel and are exposed to the commodityprice risk associated with variations in the market price forpetroleum products.
n Cyclical and seasonal fluctuations in our operating resultsdue to decreased demand for our services.
40 Management’s Report on Internal Control Over Financial Reporting
Management’s Report on Internal Control Over Financial Reporting
UPS management is responsible for establishing and maintaining adequate internal controls over financial reporting for United ParcelService, Inc. and subsidiaries (“the Company”). Based on the criteria for effective internal control over financial reporting establishedin Internal Control — Integrated Framework issued by the Committee of Sponsoring Organizations of the Treadway Commission,management has assessed the Company’s internal control over financial reporting as effective as of December 31, 2004. The scope ofmanagement’s assessment of the effectiveness of internal control over financial reporting includes all of the Company’s businessesexcept for Menlo Worldwide Forwarding, a business acquired on December 20, 2004. Menlo constituted less than 3% of total assets asof December 31, 2004 and less than 1% of total revenue and net income for the year then ended. Further discussion of this acquisi-tion can be found in Note 7 to our consolidated financial statements. The registered independent public accounting firm of Deloitte &Touche LLP, as auditors of the consolidated balance sheet of United Parcel Service, Inc. and its subsidiaries as of December 31, 2004and the related consolidated statements of income, shareowners’ equity and cashflows for the year ended December 31, 2004, hasissued an attestation report on management’s assessment of the Company’s internal control over financial reporting.
United Parcel Service, Inc.
March 14, 2005
Report of Independent Registered Public Accounting Firm on Internal Control Over Financial Reporting 41
Report of Independent Registered Public Accounting Firm on Internal Control Over Financial Reporting
Board of Directors and Shareowners United Parcel Service, Inc. Atlanta, Georgia
We have audited management’s assessment, included in the accompanying Management’s Report on Internal Control Over FinancialReporting, that United Parcel Service, Inc. and its subsidiaries (the “Company”) maintained effective internal control over financialreporting as of December 31, 2004, based on criteria established in Internal Control — Integrated Framework issued by theCommittee of Sponsoring Organizations of the Treadway Commission. As described in Management’s Report on Internal ControlOver Financial Reporting, management excluded from their assessment the internal control over financial reporting at MenloWorldwide Forwarding, Inc., which was acquired on December 20, 2004 and whose financial statements reflect total assets and rev-enues constituting less than 3% and 1%, respectively, of the related consolidated financial statement amounts as of and for the yearended December 31, 2004. Accordingly, our audit did not include the internal control over financial reporting at Menlo WorldwideForwarding, Inc. The Company’s management is responsible for maintaining effective internal control over financial reporting and forits assessment of the effectiveness of internal control over financial reporting. Our responsibility is to express an opinion on manage-ment’s assessment and an opinion on the effectiveness of the Company’s internal control over financial reporting based on our audit.
We conducted our audit in accordance with the standards of the Public Company Accounting Oversight Board (United States).Those standards require that we plan and perform the audit to obtain reasonable assurance about whether effective internal controlover financial reporting was maintained in all material respects. Our audit included obtaining an understanding of internal controlover financial reporting, evaluating management’s assessment, testing and evaluating the design and operating effectiveness of internalcontrol, and performing such other procedures as we considered necessary in the circumstances. We believe that our audit provides areasonable basis for our opinions.
A company’s internal control over financial reporting is a process designed by, or under the supervision of, the company’s principalexecutive and principal financial officers, or persons performing similar functions, and effected by the company’s Board of Directors,management, and other personnel to provide reasonable assurance regarding the reliability of financial reporting and the preparationof financial statements for external purposes in accordance with generally accepted accounting principles. A company’s internal con-trol over financial reporting includes those policies and procedures that (1) pertain to the maintenance of records that, in reasonabledetail, accurately and fairly reflect the transactions and dispositions of the assets of the company; (2) provide reasonable assurancethat transactions are recorded as necessary to permit preparation of financial statements in accordance with generally acceptedaccounting principles, and that receipts and expenditures of the company are being made only in accordance with authorizations ofmanagement and directors of the company; and (3) provide reasonable assurance regarding prevention or timely detection of un-authorized acquisition, use, or disposition of the company’s assets that could have a material effect on the financial statements.
Because of the inherent limitations of internal control over financial reporting, including the possibility of collusion or impropermanagement override of controls, material misstatements due to error or fraud may not be prevented or detected on a timely basis.Also, projections of any evaluation of the effectiveness of the internal control over financial reporting to future periods are subject tothe risk that the controls may become inadequate because of changes in conditions, or that the degree of compliance with the policiesor procedures may deteriorate.
In our opinion, management’s assessment that the Company maintained effective internal control over financial reporting as ofDecember 31, 2004, is fairly stated, in all material respects, based on the criteria established in Internal Control — Integrated Frameworkissued by the Committee of Sponsoring Organizations of the Treadway Commission. Also in our opinion, the Company maintained, inall material respects, effective internal control over financial reporting as of December 31, 2004, based on the criteria established inInternal Control — Integrated Framework issued by the Committee of Sponsoring Organizations of the Treadway Commission.
We have also audited, in accordance with the standards of the Public Company Accounting Oversight Board (United States), theconsolidated balance sheet of United Parcel Service, Inc. and its subsidiaries as of December 31, 2004, and the related consolidatedstatements of income, shareowners equity, and cash flows for the year ended December 31, 2004 of the Company and our reportdated March 14, 2005 expressed an unqualified opinion on those financial statements.
Atlanta, Georgia March 14, 2005
42 Report of Independent Registered Public Accounting Firm
Report of Independent Registered Public Accounting Firm
Board of Directors and Shareowners United Parcel Service, Inc. Atlanta, Georgia
We have audited the accompanying consolidated balance sheets of United Parcel Service, Inc. and its subsidiaries as of December 31,2004 and 2003, and the related consolidated statements of income, shareowners’ equity, and cash flows for each of the three years inthe period ended December 31, 2004. These financial statements are the responsibility of the Company’s management. Our responsi-bility is to express an opinion on these financial statements based on our audits.
We conducted our audits in accordance with the standards of the Public Company Accounting Oversight Board (United States).Those standards require that we plan and perform the audit to obtain reasonable assurance about whether the financial statements arefree of material misstatement. An audit includes examining, on a test basis, evidence supporting the amounts and disclosures in thefinancial statements. An audit also includes assessing the accounting principles used and significant estimates made by management, aswell as evaluating the overall financial statement presentation. We believe that our audits provide a reasonable basis for our opinion.
In our opinion, such consolidated financial statements present fairly, in all material respects, the financial position of United ParcelService, Inc. and its subsidiaries at December 31, 2004 and 2003, and the results of their operations and their cash flows for each ofthe three years in the period ended December 31, 2004 in conformity with accounting principles generally accepted in the UnitedStates of America.
As described in Note 1 to the consolidated financial statements, the Company adopted Statement of Financial Accounting StandardsNo. 142, “Goodwill and Other Intangible Assets,” effective January 1, 2002; and began applying prospectively the provisions ofStatement of Financial Accounting Standards No. 123, “Accounting for Stock-Based Compensation,” effective January 1, 2003.
We have also audited, in accordance with the standards of the Public Company Accounting Oversight Board (United States), theeffectiveness of the Company’s internal control over financial reporting as of December 31, 2004, based on the criteria established inInternal Control — Integrated Framework issued by the Committee of Sponsoring Organizations of the Treadway Commission andour report dated March 14, 2005 expressed an unqualified opinion on management’s assessment of the effectiveness of theCompany’s internal control over financial reporting and an unqualified opinion on the effectiveness of the Company’s internal controlover financial reporting.
Atlanta, Georgia March 14, 2005

Consolidated financial statements 43
Consolidated balance sheetsAs of December 31,
(In millions, except per share amounts) 2004 2003
ASSETSCurrent Assets:
Cash & cash equivalents $ 739 $ 1,064Marketable securities & short-term investments 4,458 2,888Accounts receivable, net 5,156 4,004Finance receivables, net 524 840Income tax receivable 371 — Deferred income taxes 392 316Other current assets 965 847
Total Current Assets 12,605 9,959Property, Plant & Equipment — at cost, net of accumulated depreciation & amortization
of $13,505 and $12,516 in 2004 and 2003 13,973 13,298Prepaid Pension Costs 3,160 2,922Goodwill and Intangible Assets, Net 1,924 1,883Other Assets 1,364 1,672
$ 33,026 $ 29,734LIABILITIES AND SHAREOWNERS’ EQUITYCurrent Liabilities:
Current maturities of long-term debt and commercial paper $ 1,187 $ 674Accounts payable 2,266 2,003Accrued wages & withholdings 1,197 1,166Dividends payable 315 282Other current liabilities 1,518 1,499
Total Current Liabilities 6,483 5,624Long-Term Debt 3,261 3,149Accumulated Postretirement Benefit Obligation, Net 1,516 1,335Deferred Taxes, Credits & Other Liabilities 5,382 4,774Shareowners’ Equity:
Preferred stock, no par value, authorized 200 shares, none issued — — Class A common stock, par value $.01 per share, authorized 4,600 shares,
issued 515 and 571 in 2004 and 2003 5 6Class B common stock, par value $.01 per share, authorized 5,600 shares,
issued 614 and 560 in 2004 and 2003 6 5Additional paid-in capital 417 662Retained earnings 16,192 14,356Accumulated other comprehensive loss (236) (177)Deferred compensation obligations 169 136
16,553 14,988Less: Treasury stock (3 and 2 shares in 2004 and 2003) (169) (136)
16,384 14,852$ 33,026 $ 29,734
See notes to consolidated financial statements.
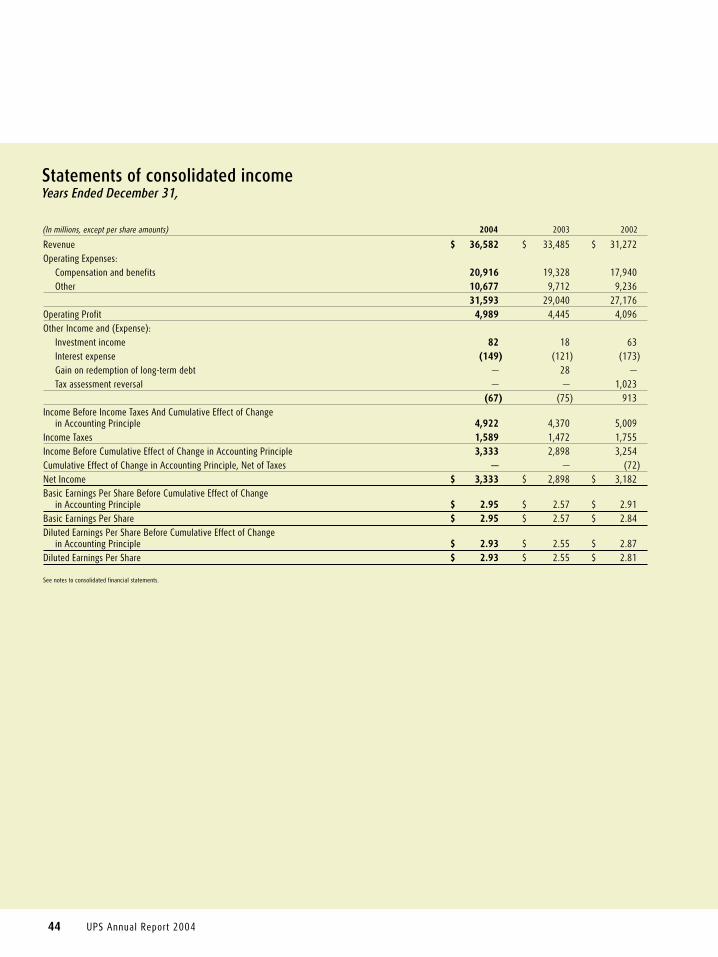
44 UPS Annual Report 2004
Statements of consolidated incomeYears Ended December 31,
(In millions, except per share amounts) 2004 2003 2002
Revenue $ 36,582 $ 33,485 $ 31,272Operating Expenses:
Compensation and benefits 20,916 19,328 17,940Other 10,677 9,712 9,236
31,593 29,040 27,176Operating Profit 4,989 4,445 4,096Other Income and (Expense):
Investment income 82 18 63Interest expense (149) (121) (173)Gain on redemption of long-term debt — 28 — Tax assessment reversal — — 1,023
(67) (75) 913Income Before Income Taxes And Cumulative Effect of Change
in Accounting Principle 4,922 4,370 5,009Income Taxes 1,589 1,472 1,755Income Before Cumulative Effect of Change in Accounting Principle 3,333 2,898 3,254Cumulative Effect of Change in Accounting Principle, Net of Taxes — — (72)Net Income $ 3,333 $ 2,898 $ 3,182Basic Earnings Per Share Before Cumulative Effect of Change
in Accounting Principle $ 2.95 $ 2.57 $ 2.91Basic Earnings Per Share $ 2.95 $ 2.57 $ 2.84Diluted Earnings Per Share Before Cumulative Effect of Change
in Accounting Principle $ 2.93 $ 2.55 $ 2.87Diluted Earnings Per Share $ 2.93 $ 2.55 $ 2.81
See notes to consolidated financial statements.
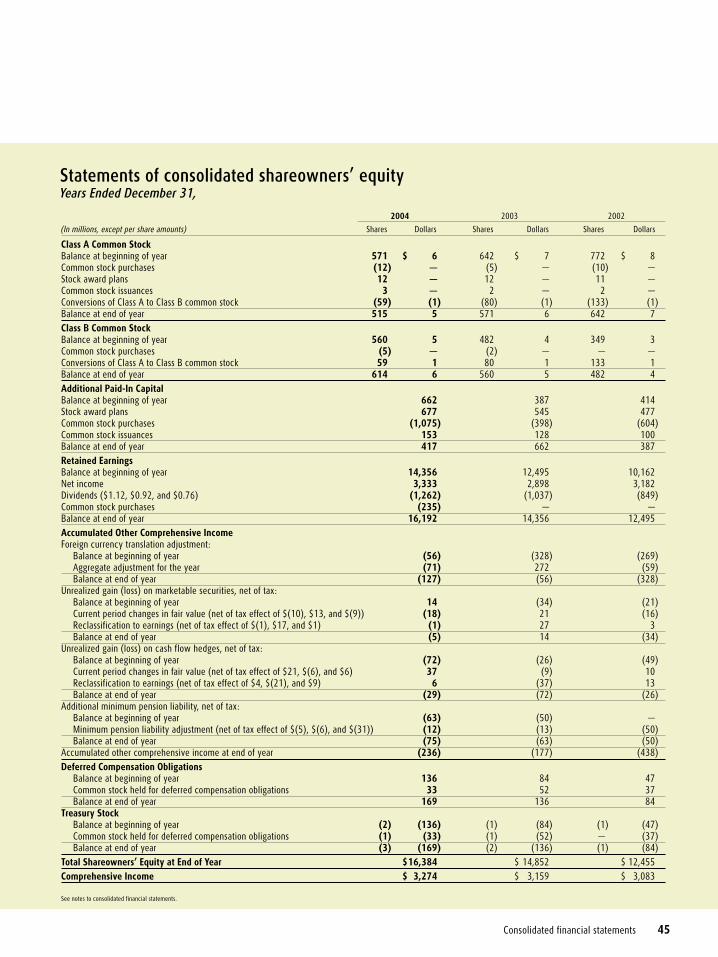
Consolidated financial statements 45
Statements of consolidated shareowners’ equityYears Ended December 31,
2004 2003 2002
(In millions, except per share amounts) Shares Dollars Shares Dollars Shares Dollars
Class A Common StockBalance at beginning of year 571 $ 6 642 $ 7 772 $ 8Common stock purchases (12) — (5) — (10) — Stock award plans 12 — 12 — 11 — Common stock issuances 3 — 2 — 2 — Conversions of Class A to Class B common stock (59) (1) (80) (1) (133) (1)Balance at end of year 515 5 571 6 642 7Class B Common StockBalance at beginning of year 560 5 482 4 349 3Common stock purchases (5) — (2) — — — Conversions of Class A to Class B common stock 59 1 80 1 133 1Balance at end of year 614 6 560 5 482 4Additional Paid-In CapitalBalance at beginning of year 662 387 414Stock award plans 677 545 477Common stock purchases (1,075) (398) (604)Common stock issuances 153 128 100Balance at end of year 417 662 387Retained EarningsBalance at beginning of year 14,356 12,495 10,162Net income 3,333 2,898 3,182Dividends ($1.12, $0.92, and $0.76) (1,262) (1,037) (849)Common stock purchases (235) — — Balance at end of year 16,192 14,356 12,495Accumulated Other Comprehensive IncomeForeign currency translation adjustment:
Balance at beginning of year (56) (328) (269)Aggregate adjustment for the year (71) 272 (59)Balance at end of year (127) (56) (328)
Unrealized gain (loss) on marketable securities, net of tax:Balance at beginning of year 14 (34) (21)Current period changes in fair value (net of tax effect of $(10), $13, and $(9)) (18) 21 (16)Reclassification to earnings (net of tax effect of $(1), $17, and $1) (1) 27 3Balance at end of year (5) 14 (34)
Unrealized gain (loss) on cash flow hedges, net of tax:Balance at beginning of year (72) (26) (49)Current period changes in fair value (net of tax effect of $21, $(6), and $6) 37 (9) 10Reclassification to earnings (net of tax effect of $4, $(21), and $9) 6 (37) 13Balance at end of year (29) (72) (26)
Additional minimum pension liability, net of tax:Balance at beginning of year (63) (50) — Minimum pension liability adjustment (net of tax effect of $(5), $(6), and $(31)) (12) (13) (50)Balance at end of year (75) (63) (50)
Accumulated other comprehensive income at end of year (236) (177) (438)Deferred Compensation Obligations
Balance at beginning of year 136 84 47Common stock held for deferred compensation obligations 33 52 37Balance at end of year 169 136 84
Treasury StockBalance at beginning of year (2) (136) (1) (84) (1) (47)Common stock held for deferred compensation obligations (1) (33) (1) (52) — (37)Balance at end of year (3) (169) (2) (136) (1) (84)
Total Shareowners’ Equity at End of Year $16,384 $ 14,852 $ 12,455Comprehensive Income $ 3,274 $ 3,159 $ 3,083
See notes to consolidated financial statements.

46 UPS Annual Report 2004
Statements of consolidated cash flowsYears Ended December 31,
(In millions) 2004 2003 2002
Cash Flows From Operating Activities:Net income $ 3,333 $ 2,898 $ 3,182
Adjustments to reconcile net income to net cash from operating activities:Depreciation and amortization 1,543 1,549 1,464Postretirement benefits 135 84 121Deferred taxes, credits and other 289 317 162Stock award plans 610 497 445Tax assessment reversal — — (776)Vacation policy change — — (121)Restructuring charge and related expenses — — 85Loss (gain) on impairment or disposal of assets 129 55 19Other (gains) losses 15 96 116
Changes in assets and liabilities, net of effect of acquisitions:Accounts receivable, net (686) (264) 312Other assets 390 13 403Prepaid pension costs (238) (990) (87)Accounts payable 318 66 (56)Accrued wages and withholdings (73) 83 112Income taxes payable (399) 204 16Other current liabilities (35) (32) 291
Net cash from operating activities 5,331 4,576 5,688Cash Flows From Investing Activities:
Capital expenditures (2,127) (1,947) (1,658)Disposals of property, plant and equipment 75 118 89Purchases of marketable securities and short-term investments (6,322) (8,083) (3,833)Sales and maturities of marketable securities and short-term investments 4,724 7,118 2,654Net (increase) decrease in finance receivables 318 50 (495)Cash received (paid) for business acquisitions / dispositions (238) 8 (14)Other investing activities (68) (6) (24)
Net cash (used in) investing activities (3,638) (2,742) (3,281)Cash Flows From Financing Activities:
Proceeds from borrowings 811 361 419Repayments of borrowings (468) (1,245) (1,099)Purchases of common stock (1,310) (398) (604)Issuances of common stock 193 154 116Dividends (1,208) (956) (840)Other financing activities (32) (26) (82)
Net cash (used in) financing activities (2,014) (2,110) (2,090)Effect Of Exchange Rate Changes On Cash (4) 216 (51)Net Increase (Decrease) In Cash And Cash Equivalents (325) (60) 266Cash And Cash Equivalents:
Beginning of period 1,064 1,124 858End of period $ 739 $ 1,064 $ 1,124
Cash Paid During The Period For:Interest (net of amount capitalized) $ 120 $ 126 $ 190Income taxes $ 2,037 $ 1,097 $ 1,416
See notes to consolidated financial statements.
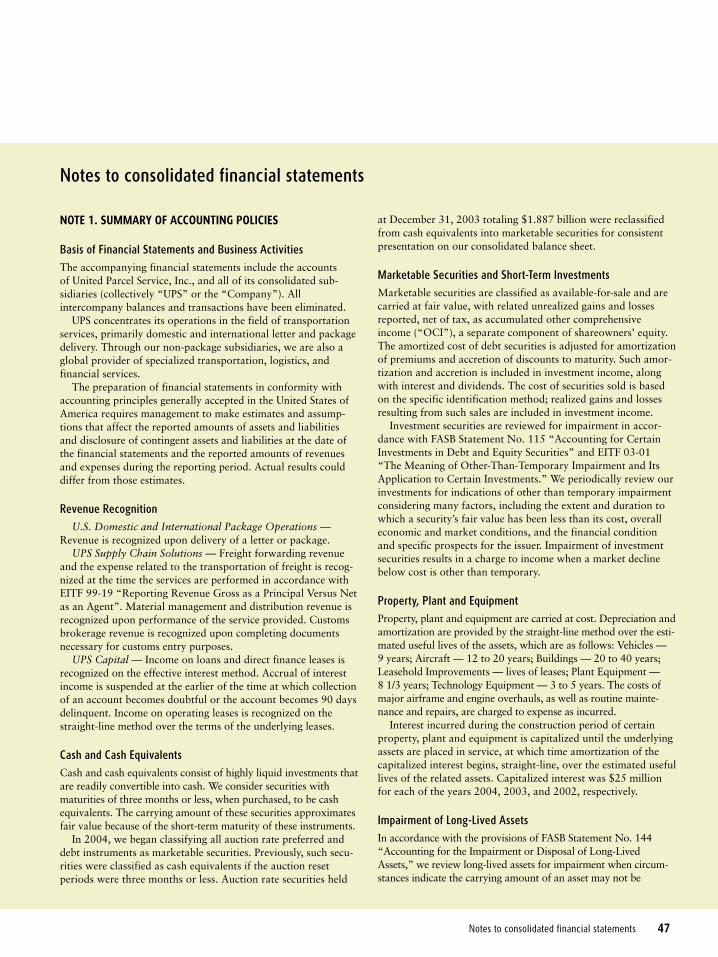
Notes to consolidated financial statements 47
Notes to consolidated financial statements
NOTE 1. SUMMARY OF ACCOUNTING POLICIES
Basis of Financial Statements and Business Activities The accompanying financial statements include the accounts of United Parcel Service, Inc., and all of its consolidated sub-sidiaries (collectively “UPS” or the “Company”). Allintercompany balances and transactions have been eliminated.
UPS concentrates its operations in the field of transportationservices, primarily domestic and international letter and packagedelivery. Through our non-package subsidiaries, we are also aglobal provider of specialized transportation, logistics, andfinancial services.
The preparation of financial statements in conformity withaccounting principles generally accepted in the United States ofAmerica requires management to make estimates and assump-tions that affect the reported amounts of assets and liabilitiesand disclosure of contingent assets and liabilities at the date ofthe financial statements and the reported amounts of revenuesand expenses during the reporting period. Actual results coulddiffer from those estimates.
Revenue RecognitionU.S. Domestic and International Package Operations —
Revenue is recognized upon delivery of a letter or package.UPS Supply Chain Solutions — Freight forwarding revenue
and the expense related to the transportation of freight is recog-nized at the time the services are performed in accordance withEITF 99-19 “Reporting Revenue Gross as a Principal Versus Netas an Agent”. Material management and distribution revenue isrecognized upon performance of the service provided. Customsbrokerage revenue is recognized upon completing documentsnecessary for customs entry purposes.
UPS Capital — Income on loans and direct finance leases isrecognized on the effective interest method. Accrual of interestincome is suspended at the earlier of the time at which collectionof an account becomes doubtful or the account becomes 90 daysdelinquent. Income on operating leases is recognized on thestraight-line method over the terms of the underlying leases.
Cash and Cash EquivalentsCash and cash equivalents consist of highly liquid investments thatare readily convertible into cash. We consider securities withmaturities of three months or less, when purchased, to be cashequivalents. The carrying amount of these securities approximatesfair value because of the short-term maturity of these instruments.
In 2004, we began classifying all auction rate preferred anddebt instruments as marketable securities. Previously, such secu-rities were classified as cash equivalents if the auction resetperiods were three months or less. Auction rate securities held
at December 31, 2003 totaling $1.887 billion were reclassifiedfrom cash equivalents into marketable securities for consistentpresentation on our consolidated balance sheet.
Marketable Securities and Short-Term InvestmentsMarketable securities are classified as available-for-sale and arecarried at fair value, with related unrealized gains and lossesreported, net of tax, as accumulated other comprehensiveincome (“OCI”), a separate component of shareowners’ equity.The amortized cost of debt securities is adjusted for amortizationof premiums and accretion of discounts to maturity. Such amor-tization and accretion is included in investment income, alongwith interest and dividends. The cost of securities sold is basedon the specific identification method; realized gains and lossesresulting from such sales are included in investment income.
Investment securities are reviewed for impairment in accor-dance with FASB Statement No. 115 “Accounting for CertainInvestments in Debt and Equity Securities” and EITF 03-01“The Meaning of Other-Than-Temporary Impairment and ItsApplication to Certain Investments.” We periodically review ourinvestments for indications of other than temporary impairmentconsidering many factors, including the extent and duration towhich a security’s fair value has been less than its cost, overalleconomic and market conditions, and the financial conditionand specific prospects for the issuer. Impairment of investmentsecurities results in a charge to income when a market declinebelow cost is other than temporary.
Property, Plant and EquipmentProperty, plant and equipment are carried at cost. Depreciation andamortization are provided by the straight-line method over the esti-mated useful lives of the assets, which are as follows: Vehicles — 9 years; Aircraft — 12 to 20 years; Buildings — 20 to 40 years;Leasehold Improvements — lives of leases; Plant Equipment — 8 1/3 years; Technology Equipment — 3 to 5 years. The costs ofmajor airframe and engine overhauls, as well as routine mainte-nance and repairs, are charged to expense as incurred.
Interest incurred during the construction period of certainproperty, plant and equipment is capitalized until the underlyingassets are placed in service, at which time amortization of thecapitalized interest begins, straight-line, over the estimated usefullives of the related assets. Capitalized interest was $25 millionfor each of the years 2004, 2003, and 2002, respectively.
Impairment of Long-Lived AssetsIn accordance with the provisions of FASB Statement No. 144“Accounting for the Impairment or Disposal of Long-LivedAssets,” we review long-lived assets for impairment when circum-stances indicate the carrying amount of an asset may not be
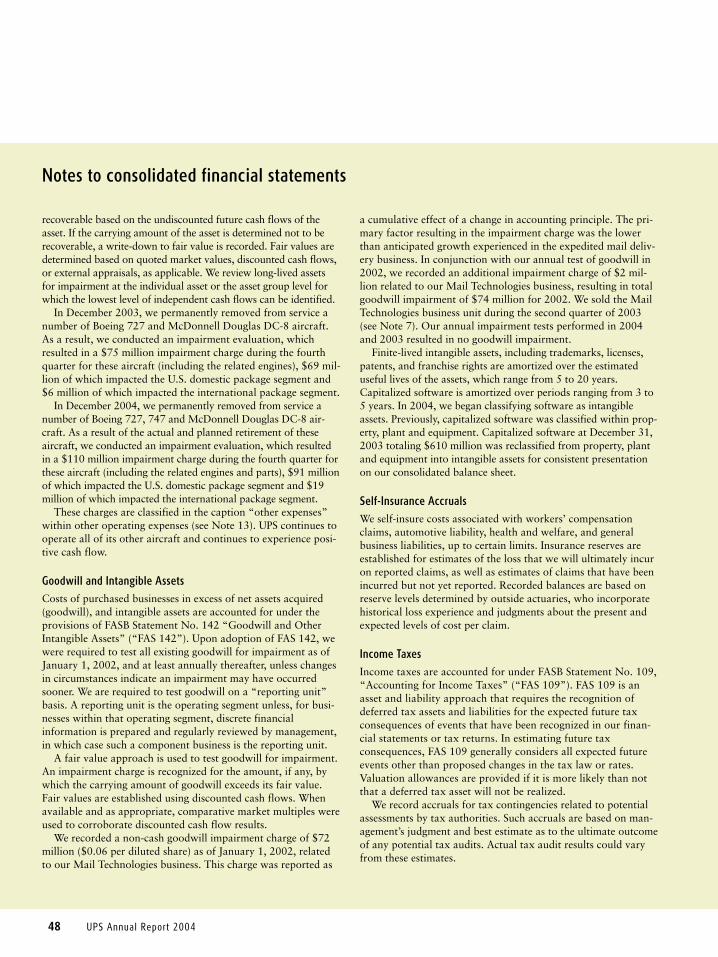
48 UPS Annual Report 2004
Notes to consolidated financial statements
recoverable based on the undiscounted future cash flows of theasset. If the carrying amount of the asset is determined not to berecoverable, a write-down to fair value is recorded. Fair values aredetermined based on quoted market values, discounted cash flows,or external appraisals, as applicable. We review long-lived assetsfor impairment at the individual asset or the asset group level forwhich the lowest level of independent cash flows can be identified.
In December 2003, we permanently removed from service anumber of Boeing 727 and McDonnell Douglas DC-8 aircraft.As a result, we conducted an impairment evaluation, whichresulted in a $75 million impairment charge during the fourthquarter for these aircraft (including the related engines), $69 mil-lion of which impacted the U.S. domestic package segment and$6 million of which impacted the international package segment.
In December 2004, we permanently removed from service anumber of Boeing 727, 747 and McDonnell Douglas DC-8 air-craft. As a result of the actual and planned retirement of theseaircraft, we conducted an impairment evaluation, which resultedin a $110 million impairment charge during the fourth quarter forthese aircraft (including the related engines and parts), $91 millionof which impacted the U.S. domestic package segment and $19million of which impacted the international package segment.
These charges are classified in the caption “other expenses”within other operating expenses (see Note 13). UPS continues tooperate all of its other aircraft and continues to experience posi-tive cash flow.
Goodwill and Intangible AssetsCosts of purchased businesses in excess of net assets acquired(goodwill), and intangible assets are accounted for under theprovisions of FASB Statement No. 142 “Goodwill and OtherIntangible Assets” (“FAS 142”). Upon adoption of FAS 142, wewere required to test all existing goodwill for impairment as ofJanuary 1, 2002, and at least annually thereafter, unless changesin circumstances indicate an impairment may have occurredsooner. We are required to test goodwill on a “reporting unit”basis. A reporting unit is the operating segment unless, for busi-nesses within that operating segment, discrete financialinformation is prepared and regularly reviewed by management,in which case such a component business is the reporting unit.
A fair value approach is used to test goodwill for impairment.An impairment charge is recognized for the amount, if any, bywhich the carrying amount of goodwill exceeds its fair value.Fair values are established using discounted cash flows. Whenavailable and as appropriate, comparative market multiples wereused to corroborate discounted cash flow results.
We recorded a non-cash goodwill impairment charge of $72million ($0.06 per diluted share) as of January 1, 2002, relatedto our Mail Technologies business. This charge was reported as
a cumulative effect of a change in accounting principle. The pri-mary factor resulting in the impairment charge was the lowerthan anticipated growth experienced in the expedited mail deliv-ery business. In conjunction with our annual test of goodwill in2002, we recorded an additional impairment charge of $2 mil-lion related to our Mail Technologies business, resulting in totalgoodwill impairment of $74 million for 2002. We sold the MailTechnologies business unit during the second quarter of 2003(see Note 7). Our annual impairment tests performed in 2004and 2003 resulted in no goodwill impairment.
Finite-lived intangible assets, including trademarks, licenses,patents, and franchise rights are amortized over the estimateduseful lives of the assets, which range from 5 to 20 years.Capitalized software is amortized over periods ranging from 3 to5 years. In 2004, we began classifying software as intangibleassets. Previously, capitalized software was classified within prop-erty, plant and equipment. Capitalized software at December 31,2003 totaling $610 million was reclassified from property, plantand equipment into intangible assets for consistent presentationon our consolidated balance sheet.
Self-Insurance AccrualsWe self-insure costs associated with workers’ compensationclaims, automotive liability, health and welfare, and generalbusiness liabilities, up to certain limits. Insurance reserves areestablished for estimates of the loss that we will ultimately incuron reported claims, as well as estimates of claims that have beenincurred but not yet reported. Recorded balances are based onreserve levels determined by outside actuaries, who incorporatehistorical loss experience and judgments about the present andexpected levels of cost per claim.
Income TaxesIncome taxes are accounted for under FASB Statement No. 109,“Accounting for Income Taxes” (“FAS 109”). FAS 109 is anasset and liability approach that requires the recognition ofdeferred tax assets and liabilities for the expected future taxconsequences of events that have been recognized in our finan-cial statements or tax returns. In estimating future taxconsequences, FAS 109 generally considers all expected futureevents other than proposed changes in the tax law or rates.Valuation allowances are provided if it is more likely than notthat a deferred tax asset will not be realized.
We record accruals for tax contingencies related to potentialassessments by tax authorities. Such accruals are based on man-agement’s judgment and best estimate as to the ultimate outcomeof any potential tax audits. Actual tax audit results could varyfrom these estimates.
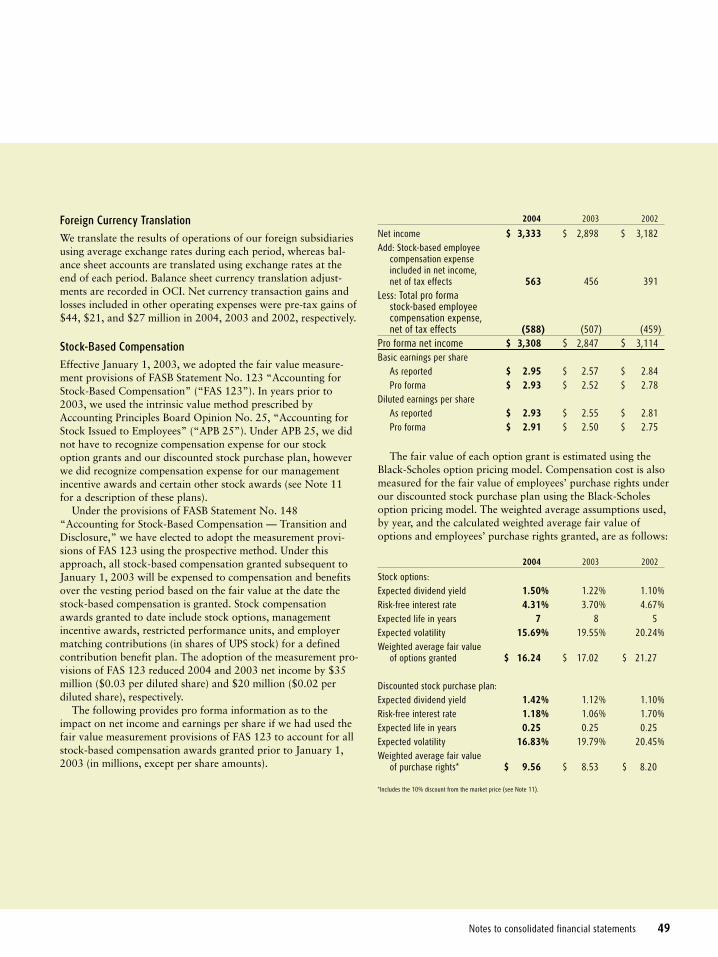
Notes to consolidated financial statements 49
Foreign Currency TranslationWe translate the results of operations of our foreign subsidiariesusing average exchange rates during each period, whereas bal-ance sheet accounts are translated using exchange rates at theend of each period. Balance sheet currency translation adjust-ments are recorded in OCI. Net currency transaction gains andlosses included in other operating expenses were pre-tax gains of$44, $21, and $27 million in 2004, 2003 and 2002, respectively.
Stock-Based CompensationEffective January 1, 2003, we adopted the fair value measure-ment provisions of FASB Statement No. 123 “Accounting forStock-Based Compensation” (“FAS 123”). In years prior to2003, we used the intrinsic value method prescribed byAccounting Principles Board Opinion No. 25, “Accounting forStock Issued to Employees” (“APB 25”). Under APB 25, we didnot have to recognize compensation expense for our stockoption grants and our discounted stock purchase plan, howeverwe did recognize compensation expense for our managementincentive awards and certain other stock awards (see Note 11for a description of these plans).
Under the provisions of FASB Statement No. 148“Accounting for Stock-Based Compensation — Transition andDisclosure,” we have elected to adopt the measurement provi-sions of FAS 123 using the prospective method. Under thisapproach, all stock-based compensation granted subsequent toJanuary 1, 2003 will be expensed to compensation and benefitsover the vesting period based on the fair value at the date thestock-based compensation is granted. Stock compensationawards granted to date include stock options, managementincentive awards, restricted performance units, and employermatching contributions (in shares of UPS stock) for a definedcontribution benefit plan. The adoption of the measurement pro-visions of FAS 123 reduced 2004 and 2003 net income by $35million ($0.03 per diluted share) and $20 million ($0.02 perdiluted share), respectively.
The following provides pro forma information as to theimpact on net income and earnings per share if we had used thefair value measurement provisions of FAS 123 to account for allstock-based compensation awards granted prior to January 1,2003 (in millions, except per share amounts).
2004 2003 2002
Net income $ 3,333 $ 2,898 $ 3,182Add: Stock-based employee
compensation expenseincluded in net income, net of tax effects 563 456 391
Less: Total pro forma stock-based employee compensation expense, net of tax effects (588) (507) (459)
Pro forma net income $ 3,308 $ 2,847 $ 3,114Basic earnings per share
As reported $ 2.95 $ 2.57 $ 2.84Pro forma $ 2.93 $ 2.52 $ 2.78
Diluted earnings per shareAs reported $ 2.93 $ 2.55 $ 2.81Pro forma $ 2.91 $ 2.50 $ 2.75
The fair value of each option grant is estimated using theBlack-Scholes option pricing model. Compensation cost is alsomeasured for the fair value of employees’ purchase rights underour discounted stock purchase plan using the Black-Scholesoption pricing model. The weighted average assumptions used,by year, and the calculated weighted average fair value ofoptions and employees’ purchase rights granted, are as follows:
2004 2003 2002
Stock options:Expected dividend yield 1.50% 1.22% 1.10%Risk-free interest rate 4.31% 3.70% 4.67%Expected life in years 7 8 5Expected volatility 15.69% 19.55% 20.24%Weighted average fair value
of options granted $ 16.24 $ 17.02 $ 21.27
Discounted stock purchase plan:Expected dividend yield 1.42% 1.12% 1.10%Risk-free interest rate 1.18% 1.06% 1.70%Expected life in years 0.25 0.25 0.25Expected volatility 16.83% 19.79% 20.45%Weighted average fair value
of purchase rights* $ 9.56 $ 8.53 $ 8.20
*Includes the 10% discount from the market price (see Note 11).
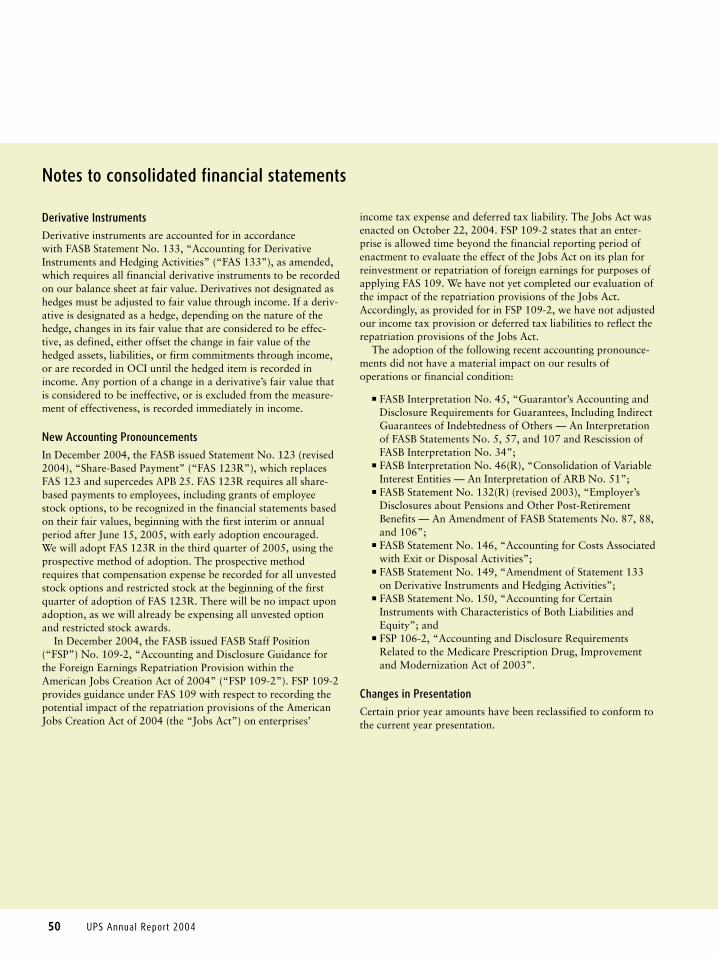
50 UPS Annual Report 2004
Notes to consolidated financial statements
Derivative InstrumentsDerivative instruments are accounted for in accordance with FASB Statement No. 133, “Accounting for DerivativeInstruments and Hedging Activities” (“FAS 133”), as amended,which requires all financial derivative instruments to be recordedon our balance sheet at fair value. Derivatives not designated ashedges must be adjusted to fair value through income. If a deriv-ative is designated as a hedge, depending on the nature of thehedge, changes in its fair value that are considered to be effec-tive, as defined, either offset the change in fair value of thehedged assets, liabilities, or firm commitments through income,or are recorded in OCI until the hedged item is recorded inincome. Any portion of a change in a derivative’s fair value thatis considered to be ineffective, or is excluded from the measure-ment of effectiveness, is recorded immediately in income.
New Accounting PronouncementsIn December 2004, the FASB issued Statement No. 123 (revised2004), “Share-Based Payment” (“FAS 123R”), which replacesFAS 123 and supercedes APB 25. FAS 123R requires all share-based payments to employees, including grants of employeestock options, to be recognized in the financial statements basedon their fair values, beginning with the first interim or annualperiod after June 15, 2005, with early adoption encouraged. We will adopt FAS 123R in the third quarter of 2005, using theprospective method of adoption. The prospective methodrequires that compensation expense be recorded for all unvestedstock options and restricted stock at the beginning of the firstquarter of adoption of FAS 123R. There will be no impact uponadoption, as we will already be expensing all unvested optionand restricted stock awards.
In December 2004, the FASB issued FASB Staff Position(“FSP”) No. 109-2, “Accounting and Disclosure Guidance forthe Foreign Earnings Repatriation Provision within theAmerican Jobs Creation Act of 2004” (“FSP 109-2”). FSP 109-2provides guidance under FAS 109 with respect to recording thepotential impact of the repatriation provisions of the AmericanJobs Creation Act of 2004 (the “Jobs Act”) on enterprises’
income tax expense and deferred tax liability. The Jobs Act wasenacted on October 22, 2004. FSP 109-2 states that an enter-prise is allowed time beyond the financial reporting period ofenactment to evaluate the effect of the Jobs Act on its plan forreinvestment or repatriation of foreign earnings for purposes ofapplying FAS 109. We have not yet completed our evaluation ofthe impact of the repatriation provisions of the Jobs Act.Accordingly, as provided for in FSP 109-2, we have not adjustedour income tax provision or deferred tax liabilities to reflect therepatriation provisions of the Jobs Act.
The adoption of the following recent accounting pronounce-ments did not have a material impact on our results ofoperations or financial condition:
n FASB Interpretation No. 45, “Guarantor’s Accounting andDisclosure Requirements for Guarantees, Including IndirectGuarantees of Indebtedness of Others — An Interpretationof FASB Statements No. 5, 57, and 107 and Rescission ofFASB Interpretation No. 34”;
n FASB Interpretation No. 46(R), “Consolidation of VariableInterest Entities — An Interpretation of ARB No. 51”;
n FASB Statement No. 132(R) (revised 2003), “Employer’sDisclosures about Pensions and Other Post-RetirementBenefits — An Amendment of FASB Statements No. 87, 88,and 106”;
n FASB Statement No. 146, “Accounting for Costs Associatedwith Exit or Disposal Activities”;
n FASB Statement No. 149, “Amendment of Statement 133on Derivative Instruments and Hedging Activities”;
n FASB Statement No. 150, “Accounting for CertainInstruments with Characteristics of Both Liabilities andEquity”; and
n FSP 106-2, “Accounting and Disclosure RequirementsRelated to the Medicare Prescription Drug, Improvementand Modernization Act of 2003”.
Changes in PresentationCertain prior year amounts have been reclassified to conform tothe current year presentation.

Notes to consolidated financial statements 51
NOTE 2. MARKETABLE SECURITIES AND SHORT-TERM INVESTMENTS The following is a summary of marketable securities and short-term investments at December 31, 2004 and 2003 (in millions):
Unrealized Unrealized EstimatedCost Gains Losses Fair Value
2004U.S. government & agency securities $ 269 $ 1 $ 1 $ 269U.S. mortgage & asset-backed securities 1,042 1 1 1,042U.S. corporate securities 446 1 1 446U.S. state and local municipal securities 1,098 — — 1,098Other debt securities 2 — — 2
Total debt securities 2,857 3 3 2,857Common equity securities 63 14 — 77Preferred equity securities 1,546 — 22 1,524
$ 4,466 $ 17 $ 25 $ 4,458
Unrealized Unrealized EstimatedCost Gains Losses Fair Value
2003U.S. government & agency securities $ 151 $ 1 $ — $ 152U.S. mortgage & asset-backed securities 474 1 — 475U.S. corporate securities 192 2 1 193U.S. state and local municipal securities 561 — — 561Other debt securities 4 — 1 3
Total debt securities 1,382 4 2 1,384Common equity securities 66 29 — 95Preferred equity securities 1,418 — 9 1,409
$ 2,866 $ 33 $ 11 $ 2,888
The gross realized gains on sales of marketable securities totaled $7, $21, and $11 million in 2004, 2003, and 2002, respectively.The gross realized losses totaled $5, $7, and $10 million in 2004, 2003, and 2002, respectively. Impairment losses recognized onmarketable securities and short-term investments totaled $0, $58, and $5 million during 2004, 2003, and 2002, respectively.
The following table presents the age of gross unrealized losses and fair value by investment category for all securities in a lossposition as of December 31, 2004 (in millions):
Less Than 12 Months 12 Months or More Total
Fair Unrealized Fair Unrealized Fair UnrealizedValue Losses Value Losses Value Losses
U.S. government & agency securities $ 189 $ 1 $ 5 $ — $ 194 $ 1U.S. mortgage & asset-backed securities 111 1 2 — 113 1U.S. corporate securities 197 1 22 — 219 1U.S. state and local municipal securities — — — — — — Other debt securities — — — — — —
Total debt securities 497 3 29 — 526 3Common equity securities — — — — — — Preferred equity securities 10 — 98 22 108 22
$ 507 $ 3 $ 127 $ 22 $ 634 $ 25
The unrealized losses in the preferred equity securities relate to securities issued by the Federal National Mortgage Association(FNMA) and the Federal Home Loan Mortgage Corporation (FHLMC), and are primarily due to changes in market interest rates.Due to the periodic interest rate adjustment features on these securities, we do not consider these losses to be other-than-temporary.We have both the intent and ability to hold the securities contained in the previous table for a time necessary to recover the cost basis.
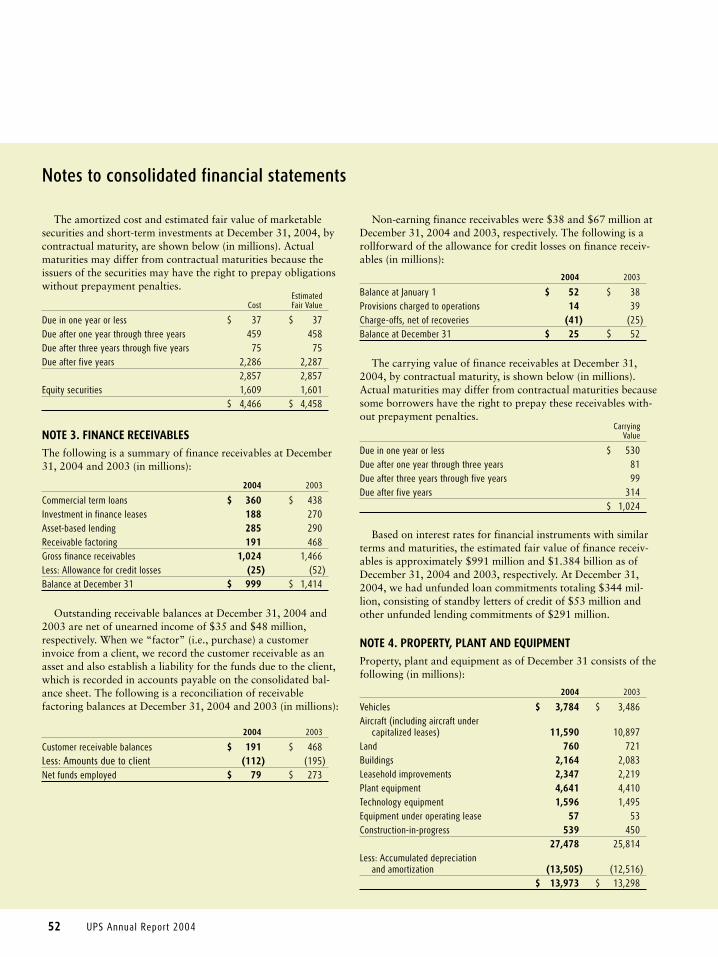
52 UPS Annual Report 2004
Notes to consolidated financial statements
The amortized cost and estimated fair value of marketablesecurities and short-term investments at December 31, 2004, bycontractual maturity, are shown below (in millions). Actualmaturities may differ from contractual maturities because theissuers of the securities may have the right to prepay obligationswithout prepayment penalties.
EstimatedCost Fair Value
Due in one year or less $ 37 $ 37Due after one year through three years 459 458Due after three years through five years 75 75Due after five years 2,286 2,287
2,857 2,857Equity securities 1,609 1,601
$ 4,466 $ 4,458
NOTE 3. FINANCE RECEIVABLES The following is a summary of finance receivables at December31, 2004 and 2003 (in millions):
2004 2003
Commercial term loans $ 360 $ 438Investment in finance leases 188 270Asset-based lending 285 290Receivable factoring 191 468Gross finance receivables 1,024 1,466Less: Allowance for credit losses (25) (52)Balance at December 31 $ 999 $ 1,414
Outstanding receivable balances at December 31, 2004 and2003 are net of unearned income of $35 and $48 million,respectively. When we “factor” (i.e., purchase) a customerinvoice from a client, we record the customer receivable as anasset and also establish a liability for the funds due to the client,which is recorded in accounts payable on the consolidated bal-ance sheet. The following is a reconciliation of receivablefactoring balances at December 31, 2004 and 2003 (in millions):
2004 2003
Customer receivable balances $ 191 $ 468Less: Amounts due to client (112) (195)Net funds employed $ 79 $ 273
Non-earning finance receivables were $38 and $67 million atDecember 31, 2004 and 2003, respectively. The following is arollforward of the allowance for credit losses on finance receiv-ables (in millions):
2004 2003
Balance at January 1 $ 52 $ 38Provisions charged to operations 14 39Charge-offs, net of recoveries (41) (25)Balance at December 31 $ 25 $ 52
The carrying value of finance receivables at December 31,2004, by contractual maturity, is shown below (in millions).Actual maturities may differ from contractual maturities becausesome borrowers have the right to prepay these receivables with-out prepayment penalties.
CarryingValue
Due in one year or less $ 530Due after one year through three years 81Due after three years through five years 99Due after five years 314
$ 1,024
Based on interest rates for financial instruments with similarterms and maturities, the estimated fair value of finance receiv-ables is approximately $991 million and $1.384 billion as ofDecember 31, 2004 and 2003, respectively. At December 31,2004, we had unfunded loan commitments totaling $344 mil-lion, consisting of standby letters of credit of $53 million andother unfunded lending commitments of $291 million.
NOTE 4. PROPERTY, PLANT AND EQUIPMENT Property, plant and equipment as of December 31 consists of thefollowing (in millions):
2004 2003
Vehicles $ 3,784 $ 3,486Aircraft (including aircraft under
capitalized leases) 11,590 10,897Land 760 721Buildings 2,164 2,083Leasehold improvements 2,347 2,219Plant equipment 4,641 4,410Technology equipment 1,596 1,495Equipment under operating lease 57 53Construction-in-progress 539 450
27,478 25,814Less: Accumulated depreciation
and amortization (13,505) (12,516)$ 13,973 $ 13,298
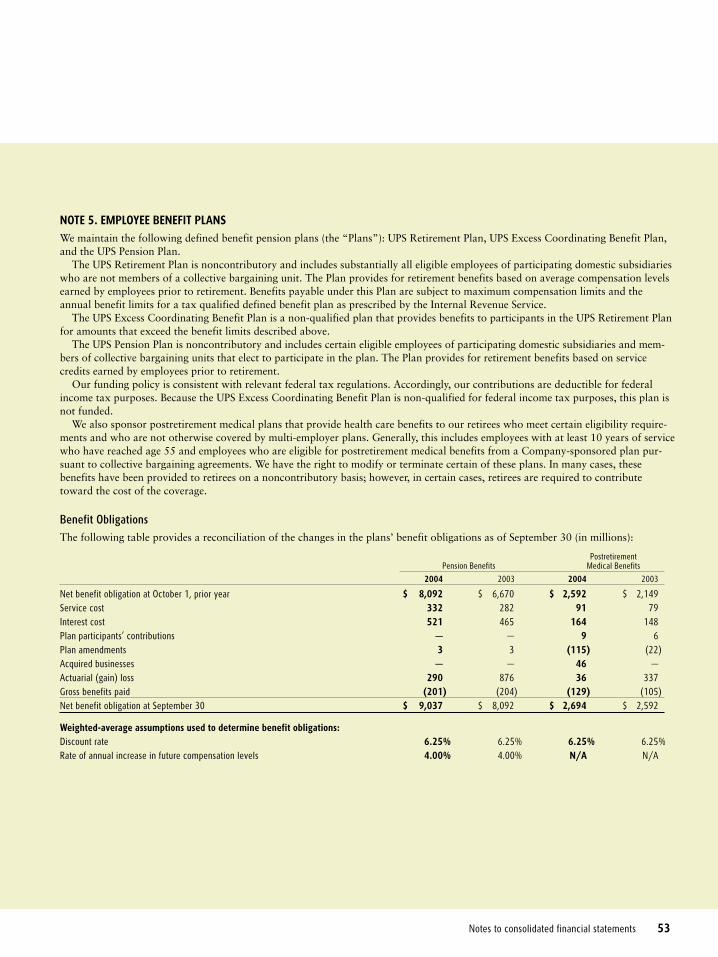
Notes to consolidated financial statements 53
NOTE 5. EMPLOYEE BENEFIT PLANS We maintain the following defined benefit pension plans (the “Plans”): UPS Retirement Plan, UPS Excess Coordinating Benefit Plan,and the UPS Pension Plan.
The UPS Retirement Plan is noncontributory and includes substantially all eligible employees of participating domestic subsidiarieswho are not members of a collective bargaining unit. The Plan provides for retirement benefits based on average compensation levelsearned by employees prior to retirement. Benefits payable under this Plan are subject to maximum compensation limits and theannual benefit limits for a tax qualified defined benefit plan as prescribed by the Internal Revenue Service.
The UPS Excess Coordinating Benefit Plan is a non-qualified plan that provides benefits to participants in the UPS Retirement Planfor amounts that exceed the benefit limits described above.
The UPS Pension Plan is noncontributory and includes certain eligible employees of participating domestic subsidiaries and mem-bers of collective bargaining units that elect to participate in the plan. The Plan provides for retirement benefits based on servicecredits earned by employees prior to retirement.
Our funding policy is consistent with relevant federal tax regulations. Accordingly, our contributions are deductible for federalincome tax purposes. Because the UPS Excess Coordinating Benefit Plan is non-qualified for federal income tax purposes, this plan isnot funded.
We also sponsor postretirement medical plans that provide health care benefits to our retirees who meet certain eligibility require-ments and who are not otherwise covered by multi-employer plans. Generally, this includes employees with at least 10 years of servicewho have reached age 55 and employees who are eligible for postretirement medical benefits from a Company-sponsored plan pur-suant to collective bargaining agreements. We have the right to modify or terminate certain of these plans. In many cases, thesebenefits have been provided to retirees on a noncontributory basis; however, in certain cases, retirees are required to contributetoward the cost of the coverage.
Benefit Obligations The following table provides a reconciliation of the changes in the plans’ benefit obligations as of September 30 (in millions):
PostretirementPension Benefits Medical Benefits
2004 2003 2004 2003
Net benefit obligation at October 1, prior year $ 8,092 $ 6,670 $ 2,592 $ 2,149Service cost 332 282 91 79Interest cost 521 465 164 148Plan participants’ contributions — — 9 6Plan amendments 3 3 (115) (22)Acquired businesses — — 46 — Actuarial (gain) loss 290 876 36 337Gross benefits paid (201) (204) (129) (105)Net benefit obligation at September 30 $ 9,037 $ 8,092 $ 2,694 $ 2,592
Weighted-average assumptions used to determine benefit obligations:Discount rate 6.25% 6.25% 6.25% 6.25%Rate of annual increase in future compensation levels 4.00% 4.00% N/A N/A

54 UPS Annual Report 2004
Notes to consolidated financial statements
The accumulated benefit obligation for our pension plans asof September 30, 2004 and 2003 was $8.113 and $7.325 billion,respectively. We use a measurement date of September 30 for ourpension and postretirement benefit plans.
In December 2003, the Medicare Prescription Drug,Improvement and Modernization Act of 2003 (the “Act”) wasenacted. The Act established a prescription drug benefit underMedicare, known as “Medicare Part D”, and a federal subsidyto sponsors of retiree health care plans that provide a benefitthat is at least actuarially equivalent to Medicare Part D. Webelieve that benefits provided to certain participants will be atleast actuarially equivalent to Medicare Part D, and, accordinglymay be entitled to a subsidy.
In May 2004, the FASB issued FSP 106-2, which requires (a)that the effects of the federal subsidy be considered an actuarialgain and recognized in the same manner as other actuarial gainsand losses and (b) certain disclosures for employers that sponsorpostretirement health care plans that provide prescription drugbenefits. We determined the effects of the Act were not a signifi-cant event requiring an interim remeasurement under FAS 106.Consequently, as permitted by FSP 106-2, net periodic benefitcost for 2004 does not reflect the effects of the Act. The accumu-lated postretirement benefit obligation (APBO) was remeasuredas of September 30, 2004 to reflect the effects of the Act, whichresulted in an immaterial reduction in the APBO and expectednet employer benefit payments.
Future postretirement medical benefit costs were forecastedassuming an initial annual increase of 9.0%, decreasing to 5.0%by the year 2009 and with consistent annual increases at thoseultimate levels thereafter.
Assumed health care cost trends have a significant effect onthe amounts reported for the postretirement medical plans. Aone-percent change in assumed health care cost trend rateswould have the following effects (in millions):
1% Increase 1% Decrease
Effect on postretirement benefit obligation $ 69 $ (75)
Because the UPS Excess Coordinating Plan is not funded, theCompany has recorded an additional minimum pension liabilityfor this plan of $91 and $105 million at December 31, 2004 and2003, respectively. This liability is included in the other creditsand non-current liabilities portion of Note 9. As of December31, 2004 and 2003, the Company has recorded an intangibleasset of $4 and $5 million, respectively, representing the netunrecognized prior service cost for this plan. A total of $55 and$63 million at December 31, 2004 and 2003, respectively, wererecorded as a reduction of other comprehensive income in share-owners’ equity (net of the tax effect of $32 and $37 million,respectively). The unfunded accumulated benefit obligation ofthe UPS Excess Coordinating Benefit Plan was $160 and $154million as of December 31, 2004 and 2003, respectively.
Additionally, we maintain several non-U.S. defined benefitpension plans. As of December 31, 2004, we have recorded aprepaid pension asset of $5 million, an additional minimum pen-sion liability of $30 million, and a $20 million (net of the taxeffect of $11 million) reduction of other comprehensive incomein shareowners’ equity. The impact of these non-U.S. plans is notmaterial to our operating results or financial position.
Plan AssetsThe following table provides a reconciliation of the changes in the plans’ assets as of September 30 (in millions):
PostretirementPension Benefits Medical Benefits
2004 2003 2004 2003
Fair value of plan assets at October 1, prior year $ 7,823 $ 6,494 $ 409 $ 337Actual return on plan assets 1,140 1,143 51 47Employer contributions 1,200 390 115 124Plan participants’ contributions — — 9 6Gross benefits paid (201) (204) (129) (105)Fair value of plan assets at September 30 $ 9,962 $ 7,823 $ 455 $ 409
Employer contributions and benefits paid under the pension plans include $6 million and $5 million paid from employer assets in2004 and 2003, respectively. Employer contributions and benefits paid (net of participant contributions) under the postretirementmedical benefit plans include $57 and $45 million paid from employer assets in 2004 and 2003, respectively.

Notes to consolidated financial statements 55
The asset allocation for our pension and other postretirement plans as of September 30, 2004 and 2003 and the target allocationfor 2005, by asset category, are as follows:
Percentage of Weighted Average Plan Assets atTarget Allocation September 30,
2005 2004 2003
Equity securities 55% - 65% 60.6% 60.2%Fixed income securities 20% - 30% 28.0% 28.5%Real estate/other 10% - 15% 11.4% 11.3%Total 100.0% 100.0%
Equity securities include UPS Class A shares of common stock in the amounts of $466 (4.5% of total plan assets) and $392 million(4.8% of total plan assets), as of September 30, 2004 and 2003, respectively.
The UPS benefit plan committees establish investment guidelines and strategies, and regularly monitor the performance of the fundsand portfolio managers. Our investment strategy with respect to pension assets is to invest the assets in accordance with ERISA andfiduciary standards. The long-term primary objectives for our pension assets are to (1) provide for a reasonable amount of long-termgrowth of capital, without undue exposure to risk; and protect the assets from erosion of purchasing power, and (2) provide invest-ment results that meet or exceed the plans’ actuarially assumed long-term rate of return.
Funded Status The funded status of the plans, reconciled to the amounts on the balance sheet, is as follows (in millions):
PostretirementPension Benefits Medical Benefits
2004 2003 2004 2003
Fair value of plan assets at September 30 $ 9,962 $ 7,823 $ 455 $ 409Benefit Obligation at September 30 (9,037) (8,092) (2,694) (2,592)Funded status at September 30 925 (269) (2,239) (2,183)
Amounts not yet recognized:Unrecognized net actuarial loss 1,918 2,085 810 820Unrecognized prior service cost 297 331 (104) 11Unrecognized net transition obligation 18 23 — — Employer contributions 2 752 17 17Net asset (liability) recorded at December 31 $ 3,160 $ 2,922 $ (1,516) $ (1,335)
Prepaid pension cost $ 3,227 $ 2,970 $ — $ — Accrued benefit cost (188) (153) (1,516) (1,335)Intangible asset 4 5 — — Accumulated other comprehensive income (pre-tax) 117 100 — — Net asset (liability) recorded at December 31 $ 3,160 $ 2,922 $ (1,516) $ (1,335)
At September 30, 2004 and 2003, the projected benefit obligation, the accumulated benefit obligation, and the fair value of planassets for pension plans with a projected benefit obligation in excess of plan assets and for pension plans with an accumulated benefitobligation in excess of plan assets were as follows (in millions):
Projected Benefit Obligation Accumulated Benefit ObligationExceeds the Fair Value of Exceeds the Fair Value of
Plan Assets Plan Assets
2004 2003 2004 2003
As of September 30Projected benefit obligation $ 200 $ 6,772 $ 200 $ 178Accumulated benefit obligation $ 160 $ 6,004 $ 160 $ 154Fair value of plan assets $ — $ 6,479 $ — $ —
The accumulated postretirement benefit obligation exceeds plan assets for all of our other postretirement benefit plans.
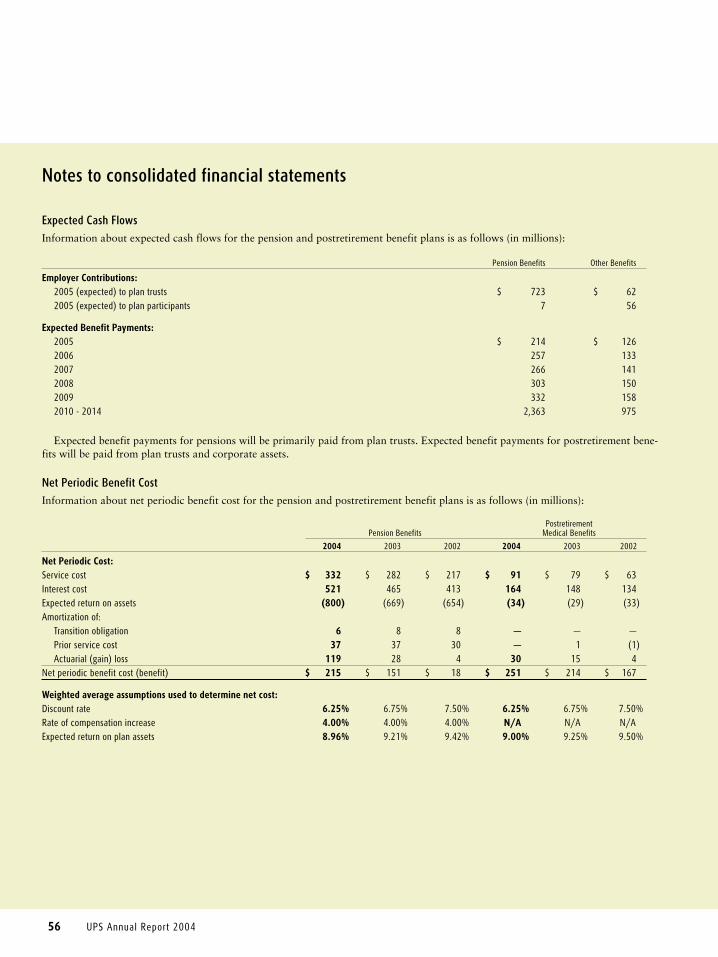
56 UPS Annual Report 2004
Notes to consolidated financial statements
Expected Cash Flows Information about expected cash flows for the pension and postretirement benefit plans is as follows (in millions):
Pension Benefits Other Benefits
Employer Contributions:2005 (expected) to plan trusts $ 723 $ 622005 (expected) to plan participants 7 56
Expected Benefit Payments:2005 $ 214 $ 1262006 257 1332007 266 1412008 303 1502009 332 1582010 - 2014 2,363 975
Expected benefit payments for pensions will be primarily paid from plan trusts. Expected benefit payments for postretirement bene-fits will be paid from plan trusts and corporate assets.
Net Periodic Benefit Cost Information about net periodic benefit cost for the pension and postretirement benefit plans is as follows (in millions):
PostretirementPension Benefits Medical Benefits
2004 2003 2002 2004 2003 2002
Net Periodic Cost:Service cost $ 332 $ 282 $ 217 $ 91 $ 79 $ 63Interest cost 521 465 413 164 148 134Expected return on assets (800) (669) (654) (34) (29) (33)Amortization of:
Transition obligation 6 8 8 — — — Prior service cost 37 37 30 — 1 (1)Actuarial (gain) loss 119 28 4 30 15 4
Net periodic benefit cost (benefit) $ 215 $ 151 $ 18 $ 251 $ 214 $ 167
Weighted average assumptions used to determine net cost:Discount rate 6.25% 6.75% 7.50% 6.25% 6.75% 7.50%Rate of compensation increase 4.00% 4.00% 4.00% N/A N/A N/AExpected return on plan assets 8.96% 9.21% 9.42% 9.00% 9.25% 9.50%
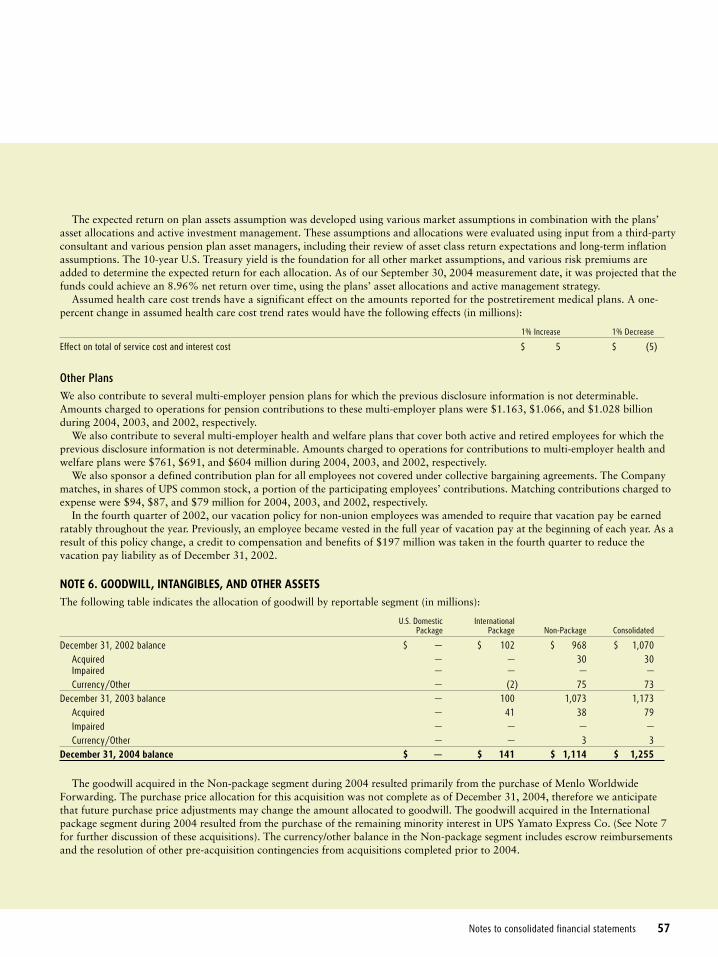
Notes to consolidated financial statements 57
The expected return on plan assets assumption was developed using various market assumptions in combination with the plans’asset allocations and active investment management. These assumptions and allocations were evaluated using input from a third-partyconsultant and various pension plan asset managers, including their review of asset class return expectations and long-term inflationassumptions. The 10-year U.S. Treasury yield is the foundation for all other market assumptions, and various risk premiums areadded to determine the expected return for each allocation. As of our September 30, 2004 measurement date, it was projected that thefunds could achieve an 8.96% net return over time, using the plans’ asset allocations and active management strategy.
Assumed health care cost trends have a significant effect on the amounts reported for the postretirement medical plans. A one-percent change in assumed health care cost trend rates would have the following effects (in millions):
1% Increase 1% Decrease
Effect on total of service cost and interest cost $ 5 $ (5)
Other PlansWe also contribute to several multi-employer pension plans for which the previous disclosure information is not determinable.Amounts charged to operations for pension contributions to these multi-employer plans were $1.163, $1.066, and $1.028 billionduring 2004, 2003, and 2002, respectively.
We also contribute to several multi-employer health and welfare plans that cover both active and retired employees for which theprevious disclosure information is not determinable. Amounts charged to operations for contributions to multi-employer health andwelfare plans were $761, $691, and $604 million during 2004, 2003, and 2002, respectively.
We also sponsor a defined contribution plan for all employees not covered under collective bargaining agreements. The Companymatches, in shares of UPS common stock, a portion of the participating employees’ contributions. Matching contributions charged toexpense were $94, $87, and $79 million for 2004, 2003, and 2002, respectively.
In the fourth quarter of 2002, our vacation policy for non-union employees was amended to require that vacation pay be earnedratably throughout the year. Previously, an employee became vested in the full year of vacation pay at the beginning of each year. As aresult of this policy change, a credit to compensation and benefits of $197 million was taken in the fourth quarter to reduce thevacation pay liability as of December 31, 2002.
NOTE 6. GOODWILL, INTANGIBLES, AND OTHER ASSETS The following table indicates the allocation of goodwill by reportable segment (in millions):
U.S. Domestic InternationalPackage Package Non-Package Consolidated
December 31, 2002 balance $ — $ 102 $ 968 $ 1,070Acquired — — 30 30Impaired — — — — Currency/Other — (2) 75 73
December 31, 2003 balance — 100 1,073 1,173Acquired — 41 38 79Impaired — — — — Currency/Other — — 3 3
December 31, 2004 balance $ — $ 141 $ 1,114 $ 1,255
The goodwill acquired in the Non-package segment during 2004 resulted primarily from the purchase of Menlo WorldwideForwarding. The purchase price allocation for this acquisition was not complete as of December 31, 2004, therefore we anticipatethat future purchase price adjustments may change the amount allocated to goodwill. The goodwill acquired in the Internationalpackage segment during 2004 resulted from the purchase of the remaining minority interest in UPS Yamato Express Co. (See Note 7for further discussion of these acquisitions). The currency/other balance in the Non-package segment includes escrow reimbursementsand the resolution of other pre-acquisition contingencies from acquisitions completed prior to 2004.

58 UPS Annual Report 2004
Notes to consolidated financial statements
The following is a summary of intangible assets at December 31, 2004 and 2003 (in millions):
Trademarks, Intangible TotalLicenses, Patents, Franchise Capitalized Pension Intangible
and Other Rights Software Asset Assets
December 31, 2004:Gross carrying amount $ 29 $ 97 $ 1,249 $ 4 $ 1,379Accumulated amortization (16) (18) (676) — (710)Net carrying value $ 13 $ 79 $ 573 $ 4 $ 669
December 31, 2003:Gross carrying amount $ 30 $ 88 $ 1,101 $ 5 $ 1,224Accumulated amortization (10) (13) (491) — (514)Net carrying value $ 20 $ 75 $ 610 $ 5 $ 710
Amortization of intangible assets was $221, $196, and $129 million during 2004, 2003 and 2002, respectively. Expected amortiza-tion of finite-lived intangible assets recorded as of December 31, 2004 for the next five years is as follows (in millions):2005 — $198; 2006 — $198; 2007 — $198; 2008 — $12; 2009 — $11. Amortization expense in future periods will be affected bybusiness acquisitions, software development and other factors.
Other assets as of December 31 consist of the following (in millions):
2004 2003
Non-current finance receivables, net of allowance for credit losses $ 475 $ 574Other non-current assets 889 1,098
$ 1,364 $ 1,672
NOTE 7. BUSINESS ACQUISITIONS AND DISPOSITIONS We regularly explore opportunities to make acquisitions thatwould enhance our package delivery business and our variousnon-package businesses. During the three years ended December31, 2004, we completed several acquisitions, including bothdomestic and international transactions, which were accountedfor under the purchase method of accounting. In connection withthe foregoing transactions, we paid cash (net of cash acquired) inthe aggregate amount of $238, $30, and $14 million in 2004,2003, and 2002, respectively. Pro forma results of operationshave not been presented for any of the acquisitions because theeffects of these transactions were not material on either an indi-vidual or aggregate basis. The results of operations of eachacquired company are included in our statements of consolidatedincome from the date of acquisition. The purchase price alloca-tions of acquired companies can be modified up to one year afterthe date of acquisition, however we generally expect such adjust-ments to the purchase price allocations to be immaterial.
During the second quarter of 2003, we sold our MailTechnologies business unit in a transaction that increased netincome by $14 million, or $0.01 per diluted share. The gain con-sisted of a pre-tax loss of $24 million recorded in other operatingexpenses within the non-package segment, and a tax benefit of$38 million recognized in conjunction with the sale. The tax ben-efit exceeded the pre-tax loss from this sale primarily because thegoodwill impairment charge we previously recorded for the Mail
Technologies business unit was not deductible for income taxpurposes. Consequently, our tax basis was greater than our bookbasis, thus producing the tax benefit described above.
During the third quarter of 2003, we sold our AviationTechnologies business unit and recognized a pre-tax gain of $24million ($15 million after-tax, or $0.01 per diluted share), whichwas recorded in other operating expenses within the non-packagesegment. The operating results of both the Mail Technologies unitand the Aviation Technologies unit were previously included inour non-package segment, and were not material to our consoli-dated operating results in any of the periods presented.
In March 2004, we acquired the remaining 49% minorityinterest in UPS Yamato Express Co., which was previously ajoint venture with Yamato Transport Co. in Japan, for $65 mil-lion in cash. UPS Yamato Express provides express packagedelivery services in Japan. Upon the close of the acquisition, UPSYamato Express became a wholly-owned subsidiary of UPS. Theacquisition had no material effect on our financial condition orresults of operations.
In December 2004, we acquired the Menlo WorldwideForwarding unit from CNF Inc. for $150 million in cash (net ofcash acquired) plus the assumption of $110 million in par valueof debt and capital lease obligations. Menlo WorldwideForwarding is a global freight forwarder that provides a fullsuite of heavy air freight forwarding services, ocean services andinternational trade management, including customs brokerage.
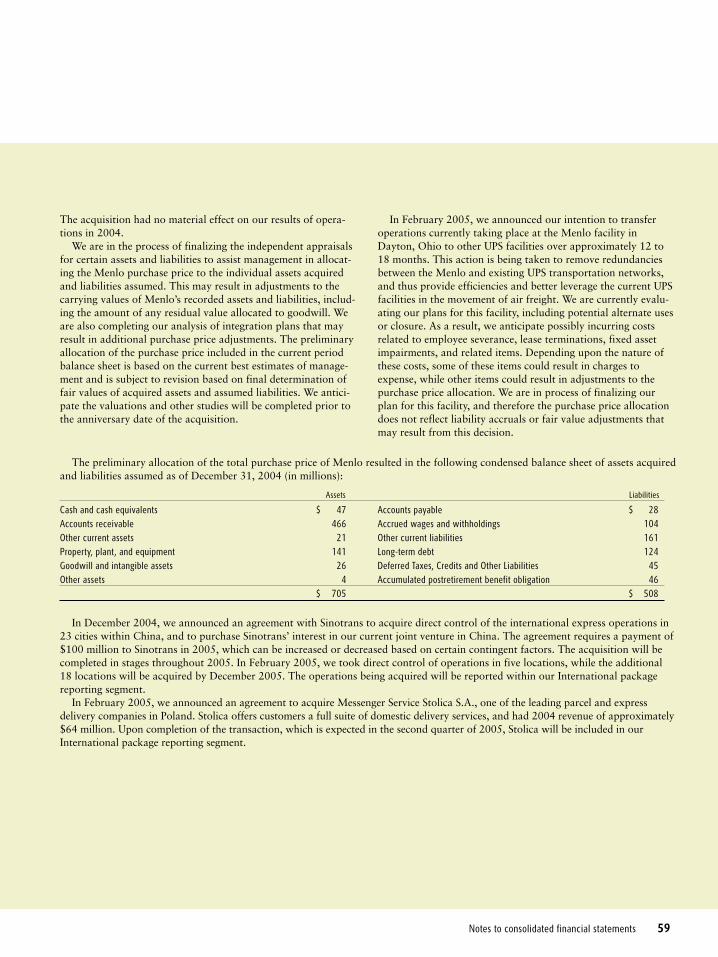
Notes to consolidated financial statements 59
The acquisition had no material effect on our results of opera-tions in 2004.
We are in the process of finalizing the independent appraisalsfor certain assets and liabilities to assist management in allocat-ing the Menlo purchase price to the individual assets acquiredand liabilities assumed. This may result in adjustments to thecarrying values of Menlo’s recorded assets and liabilities, includ-ing the amount of any residual value allocated to goodwill. Weare also completing our analysis of integration plans that mayresult in additional purchase price adjustments. The preliminaryallocation of the purchase price included in the current periodbalance sheet is based on the current best estimates of manage-ment and is subject to revision based on final determination offair values of acquired assets and assumed liabilities. We antici-pate the valuations and other studies will be completed prior tothe anniversary date of the acquisition.
In February 2005, we announced our intention to transferoperations currently taking place at the Menlo facility inDayton, Ohio to other UPS facilities over approximately 12 to18 months. This action is being taken to remove redundanciesbetween the Menlo and existing UPS transportation networks,and thus provide efficiencies and better leverage the current UPSfacilities in the movement of air freight. We are currently evalu-ating our plans for this facility, including potential alternate usesor closure. As a result, we anticipate possibly incurring costsrelated to employee severance, lease terminations, fixed assetimpairments, and related items. Depending upon the nature ofthese costs, some of these items could result in charges toexpense, while other items could result in adjustments to thepurchase price allocation. We are in process of finalizing ourplan for this facility, and therefore the purchase price allocationdoes not reflect liability accruals or fair value adjustments thatmay result from this decision.
The preliminary allocation of the total purchase price of Menlo resulted in the following condensed balance sheet of assets acquiredand liabilities assumed as of December 31, 2004 (in millions):
Assets Liabilities
Cash and cash equivalents $ 47 Accounts payable $ 28Accounts receivable 466 Accrued wages and withholdings 104Other current assets 21 Other current liabilities 161Property, plant, and equipment 141 Long-term debt 124Goodwill and intangible assets 26 Deferred Taxes, Credits and Other Liabilities 45Other assets 4 Accumulated postretirement benefit obligation 46
$ 705 $ 508
In December 2004, we announced an agreement with Sinotrans to acquire direct control of the international express operations in23 cities within China, and to purchase Sinotrans’ interest in our current joint venture in China. The agreement requires a payment of$100 million to Sinotrans in 2005, which can be increased or decreased based on certain contingent factors. The acquisition will becompleted in stages throughout 2005. In February 2005, we took direct control of operations in five locations, while the additional18 locations will be acquired by December 2005. The operations being acquired will be reported within our International packagereporting segment.
In February 2005, we announced an agreement to acquire Messenger Service Stolica S.A., one of the leading parcel and expressdelivery companies in Poland. Stolica offers customers a full suite of domestic delivery services, and had 2004 revenue of approximately$64 million. Upon completion of the transaction, which is expected in the second quarter of 2005, Stolica will be included in ourInternational package reporting segment.

60 UPS Annual Report 2004
Notes to consolidated financial statements
NOTE 8. LONG-TERM DEBT AND COMMITMENTS Long-term debt, as of December 31, consists of the following (in millions):
2004 2003
8.38% debentures, due April 1, 2020 (i) $ 463 $ 4448.38% debentures, due April 1, 2030 (i) 276 276Commercial paper (ii) 1,015 544Industrial development bonds, Philadelphia Airport facilities, due December 1, 2015 (iii) 100 100Special facilities revenue bonds, Louisville Airport facilities, due January 1, 2029 (iv) 149 149Floating rate senior notes (v) 441 441Capitalized lease obligations (vi) 401 451UPS Notes (vii) 393 4195.50% Pound Sterling notes, due February 12, 2031 961 8874.50% Singapore Dollar notes, due November 11, 2004 — 59Special facilities revenue bonds, Dayton, OH facilities (viii) 121 — Installment notes, mortgages, and bonds at various rates 128 53
4,448 3,823Less current maturities (1,187) (674)
$ 3,261 $ 3,149
(i) On January 22, 1998, we exchanged $276 million of an original $700 million in debentures for new debentures of equal principal with a maturity of April 1, 2030. The new debentures have the sameinterest rate as the 8.38% debentures due 2020 until April 1, 2020, and, thereafter, the interest rate will be 7.62% for the final 10 years. The 2030 debentures are redeemable in whole or in part at ouroption at any time. The redemption price is equal to the greater of 100% of the principal amount and accrued interest or the sum of the present values of the remaining scheduled payout of principal andinterest thereon discounted to the date of redemption at a benchmark treasury yield plus five basis points plus accrued interest. The remaining $424 million of 2020 debentures are not subject to redemp-tion prior to maturity. Interest is payable semiannually on the first of April and October for both debentures and neither debenture is subject to sinking fund requirements.
(ii) The weighted average interest rate on the commercial paper outstanding as of December 31, 2004 and 2003, was 2.10% and 0.96%, respectively. At December 31, 2004 and 2003, the entire com-mercial paper balance has been classified as a current liability. The amount of commercial paper outstanding in 2005 is expected to fluctuate. We are authorized to borrow up to $7.0 billion under thetwo commercial paper programs we maintain as of December 31, 2004.
(iii) The industrial development bonds bear interest at a daily variable rate. The average interest rates for 2004 and 2003 were 1.08% and 0.89%, respectively. (iv) The special facilities revenue bonds bear interest at a daily variable rate. The average interest rates for 2004 and 2003 were 1.20% and 1.02%, respectively. (v) The floating rate senior notes bear interest at one-month LIBOR less 45 basis points. The average interest rates for 2004 and 2003 were 1.00% and 0.78%, respectively. These notes are callable at vari-
ous times after 30 years at a stated percentage of par value, and putable by the note holders at various times after 10 years at a stated percentage of par value. The notes have maturities ranging from2049 through 2053.
(vi) We have certain aircraft subject to capital leases. Some of the obligations associated with these capital leases have been legally defeased. The recorded value of aircraft subject to capital leases, whichare included in Property, Plant and Equipment is as follows as of December 31 (in millions):
2004 2003
Aircraft $ 1,795 $ 1,474
Accumulated amortization (257) (198)
$ 1,538 $ 1,276
(vii) The UPS Notes program involves the periodic issuance of fixed rate notes in $1,000 increments with various terms and maturities. At December 31, 2004, the coupon rates of the outstanding notes varied between 3.00% and 6.20%, and the interest payments are made either monthly, quarterly or semiannually. The maturities of the notes range from 2006 to 2024. Substantially all of the fixedobligations associated with the notes were swapped to floating rates, based on different LIBOR indices plus or minus a spread. The average interest rate payable on the swaps for 2004 and 2003 was1.13% and 0.81%, respectively.
(viii) The special facilities revenue bonds were assumed in the acquisition of Menlo Worldwide Forwarding in December 2004 (see Note 7). The bonds have a par value of $108 million, $62 million of whichis due in 2009, while the remaining $46 million is due in 2018. The bonds due in 2018 are callable beginning in 2008. The bonds due in 2018 bear interest at a fixed rate of 5.63%, while the bondsdue in 2009 bear interest at fixed rates ranging from 6.05% to 6.20%. The bonds were recorded at fair value on the date of acquisition.
Based on the borrowing rates currently available to the Company for long-term debt with similar terms and maturities, the fairvalue of long-term debt, including current maturities, is approximately $4.708 and $4.109 billion as of December 31, 2004 and 2003,respectively.
We lease certain aircraft, facilities, equipment and vehicles under operating leases, which expire at various dates through 2054.Certain of the leases contain escalation clauses and renewal or purchase options. Rent expense related to our operating leases was$693, $678 and $685 million for 2004, 2003 and 2002, respectively.
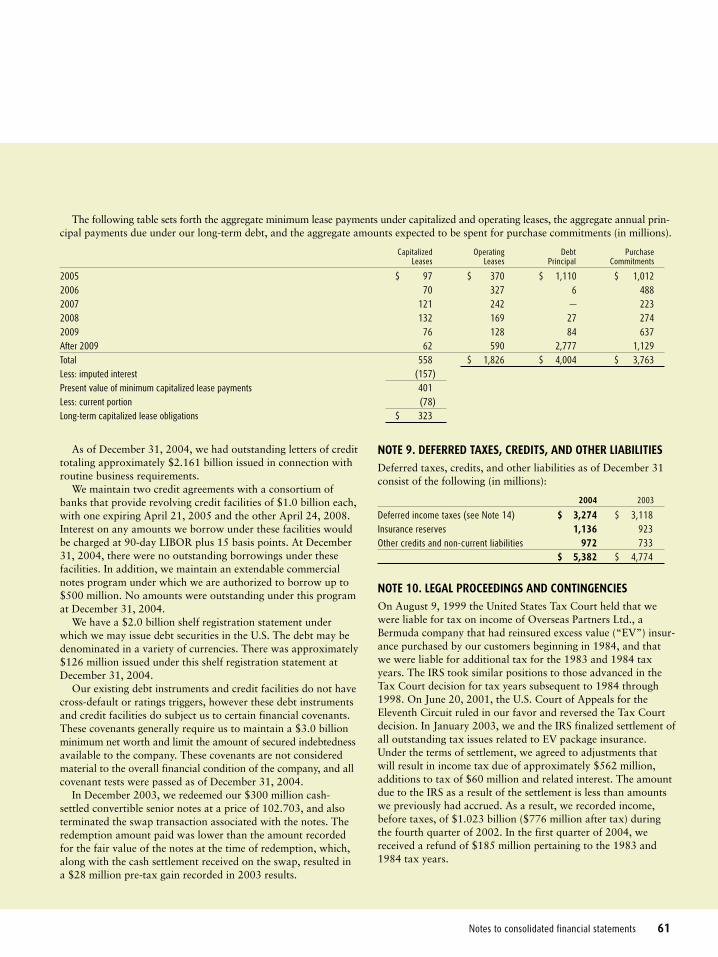
Notes to consolidated financial statements 61
The following table sets forth the aggregate minimum lease payments under capitalized and operating leases, the aggregate annual prin-cipal payments due under our long-term debt, and the aggregate amounts expected to be spent for purchase commitments (in millions).
Capitalized Operating Debt PurchaseLeases Leases Principal Commitments
2005 $ 97 $ 370 $ 1,110 $ 1,0122006 70 327 6 4882007 121 242 — 2232008 132 169 27 2742009 76 128 84 637After 2009 62 590 2,777 1,129Total 558 $ 1,826 $ 4,004 $ 3,763Less: imputed interest (157)Present value of minimum capitalized lease payments 401Less: current portion (78)Long-term capitalized lease obligations $ 323
As of December 31, 2004, we had outstanding letters of credittotaling approximately $2.161 billion issued in connection withroutine business requirements.
We maintain two credit agreements with a consortium ofbanks that provide revolving credit facilities of $1.0 billion each,with one expiring April 21, 2005 and the other April 24, 2008.Interest on any amounts we borrow under these facilities wouldbe charged at 90-day LIBOR plus 15 basis points. At December31, 2004, there were no outstanding borrowings under thesefacilities. In addition, we maintain an extendable commercialnotes program under which we are authorized to borrow up to$500 million. No amounts were outstanding under this programat December 31, 2004.
We have a $2.0 billion shelf registration statement underwhich we may issue debt securities in the U.S. The debt may bedenominated in a variety of currencies. There was approximately$126 million issued under this shelf registration statement atDecember 31, 2004.
Our existing debt instruments and credit facilities do not havecross-default or ratings triggers, however these debt instrumentsand credit facilities do subject us to certain financial covenants.These covenants generally require us to maintain a $3.0 billionminimum net worth and limit the amount of secured indebtednessavailable to the company. These covenants are not consideredmaterial to the overall financial condition of the company, and allcovenant tests were passed as of December 31, 2004.
In December 2003, we redeemed our $300 million cash-settled convertible senior notes at a price of 102.703, and alsoterminated the swap transaction associated with the notes. Theredemption amount paid was lower than the amount recordedfor the fair value of the notes at the time of redemption, which,along with the cash settlement received on the swap, resulted ina $28 million pre-tax gain recorded in 2003 results.
NOTE 9. DEFERRED TAXES, CREDITS, AND OTHER LIABILITIES Deferred taxes, credits, and other liabilities as of December 31consist of the following (in millions):
2004 2003
Deferred income taxes (see Note 14) $ 3,274 $ 3,118Insurance reserves 1,136 923Other credits and non-current liabilities 972 733
$ 5,382 $ 4,774
NOTE 10. LEGAL PROCEEDINGS AND CONTINGENCIES On August 9, 1999 the United States Tax Court held that wewere liable for tax on income of Overseas Partners Ltd., aBermuda company that had reinsured excess value (“EV”) insur-ance purchased by our customers beginning in 1984, and thatwe were liable for additional tax for the 1983 and 1984 taxyears. The IRS took similar positions to those advanced in theTax Court decision for tax years subsequent to 1984 through1998. On June 20, 2001, the U.S. Court of Appeals for theEleventh Circuit ruled in our favor and reversed the Tax Courtdecision. In January 2003, we and the IRS finalized settlement ofall outstanding tax issues related to EV package insurance.Under the terms of settlement, we agreed to adjustments thatwill result in income tax due of approximately $562 million,additions to tax of $60 million and related interest. The amountdue to the IRS as a result of the settlement is less than amountswe previously had accrued. As a result, we recorded income,before taxes, of $1.023 billion ($776 million after tax) duringthe fourth quarter of 2002. In the first quarter of 2004, wereceived a refund of $185 million pertaining to the 1983 and1984 tax years.
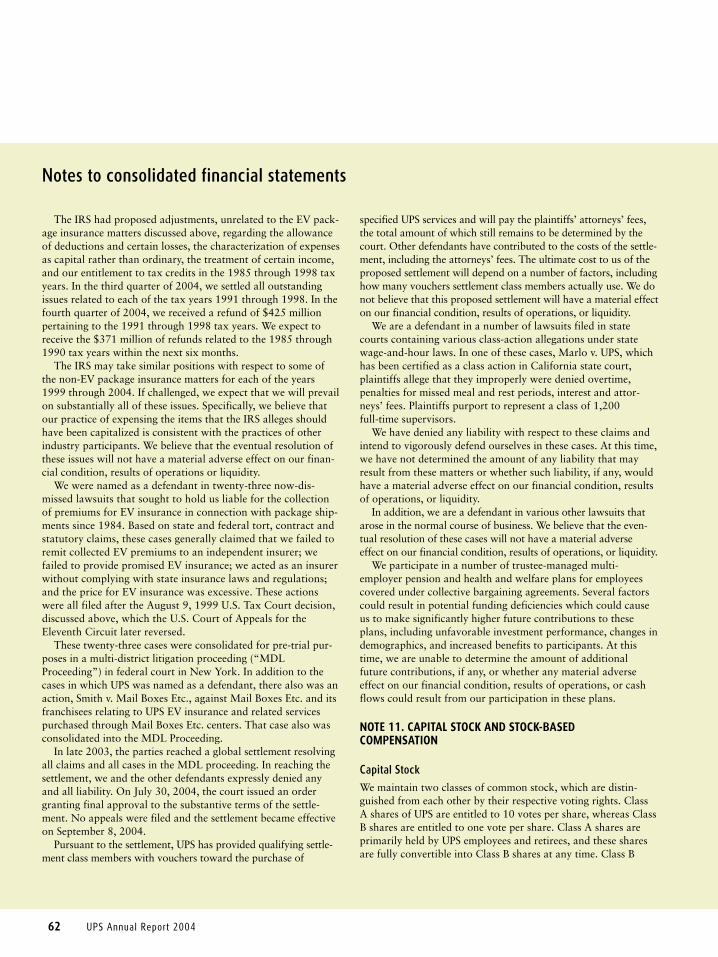
62 UPS Annual Report 2004
Notes to consolidated financial statements
The IRS had proposed adjustments, unrelated to the EV pack-age insurance matters discussed above, regarding the allowanceof deductions and certain losses, the characterization of expensesas capital rather than ordinary, the treatment of certain income,and our entitlement to tax credits in the 1985 through 1998 taxyears. In the third quarter of 2004, we settled all outstandingissues related to each of the tax years 1991 through 1998. In thefourth quarter of 2004, we received a refund of $425 millionpertaining to the 1991 through 1998 tax years. We expect toreceive the $371 million of refunds related to the 1985 through1990 tax years within the next six months.
The IRS may take similar positions with respect to some ofthe non-EV package insurance matters for each of the years1999 through 2004. If challenged, we expect that we will prevailon substantially all of these issues. Specifically, we believe thatour practice of expensing the items that the IRS alleges shouldhave been capitalized is consistent with the practices of otherindustry participants. We believe that the eventual resolution ofthese issues will not have a material adverse effect on our finan-cial condition, results of operations or liquidity.
We were named as a defendant in twenty-three now-dis-missed lawsuits that sought to hold us liable for the collectionof premiums for EV insurance in connection with package ship-ments since 1984. Based on state and federal tort, contract andstatutory claims, these cases generally claimed that we failed toremit collected EV premiums to an independent insurer; wefailed to provide promised EV insurance; we acted as an insurerwithout complying with state insurance laws and regulations;and the price for EV insurance was excessive. These actionswere all filed after the August 9, 1999 U.S. Tax Court decision,discussed above, which the U.S. Court of Appeals for theEleventh Circuit later reversed.
These twenty-three cases were consolidated for pre-trial pur-poses in a multi-district litigation proceeding (“MDLProceeding”) in federal court in New York. In addition to thecases in which UPS was named as a defendant, there also was anaction, Smith v. Mail Boxes Etc., against Mail Boxes Etc. and itsfranchisees relating to UPS EV insurance and related servicespurchased through Mail Boxes Etc. centers. That case also wasconsolidated into the MDL Proceeding.
In late 2003, the parties reached a global settlement resolvingall claims and all cases in the MDL proceeding. In reaching thesettlement, we and the other defendants expressly denied anyand all liability. On July 30, 2004, the court issued an ordergranting final approval to the substantive terms of the settle-ment. No appeals were filed and the settlement became effectiveon September 8, 2004.
Pursuant to the settlement, UPS has provided qualifying settle-ment class members with vouchers toward the purchase of
specified UPS services and will pay the plaintiffs’ attorneys’ fees,the total amount of which still remains to be determined by thecourt. Other defendants have contributed to the costs of the settle-ment, including the attorneys’ fees. The ultimate cost to us of theproposed settlement will depend on a number of factors, includinghow many vouchers settlement class members actually use. We donot believe that this proposed settlement will have a material effecton our financial condition, results of operations, or liquidity.
We are a defendant in a number of lawsuits filed in statecourts containing various class-action allegations under statewage-and-hour laws. In one of these cases, Marlo v. UPS, whichhas been certified as a class action in California state court,plaintiffs allege that they improperly were denied overtime,penalties for missed meal and rest periods, interest and attor-neys’ fees. Plaintiffs purport to represent a class of 1,200full-time supervisors.
We have denied any liability with respect to these claims andintend to vigorously defend ourselves in these cases. At this time,we have not determined the amount of any liability that mayresult from these matters or whether such liability, if any, wouldhave a material adverse effect on our financial condition, resultsof operations, or liquidity.
In addition, we are a defendant in various other lawsuits thatarose in the normal course of business. We believe that the even-tual resolution of these cases will not have a material adverseeffect on our financial condition, results of operations, or liquidity.
We participate in a number of trustee-managed multi-employer pension and health and welfare plans for employeescovered under collective bargaining agreements. Several factorscould result in potential funding deficiencies which could causeus to make significantly higher future contributions to theseplans, including unfavorable investment performance, changes indemographics, and increased benefits to participants. At thistime, we are unable to determine the amount of additionalfuture contributions, if any, or whether any material adverseeffect on our financial condition, results of operations, or cashflows could result from our participation in these plans.
NOTE 11. CAPITAL STOCK AND STOCK-BASED COMPENSATION
Capital Stock We maintain two classes of common stock, which are distin-guished from each other by their respective voting rights. ClassA shares of UPS are entitled to 10 votes per share, whereas ClassB shares are entitled to one vote per share. Class A shares areprimarily held by UPS employees and retirees, and these sharesare fully convertible into Class B shares at any time. Class B
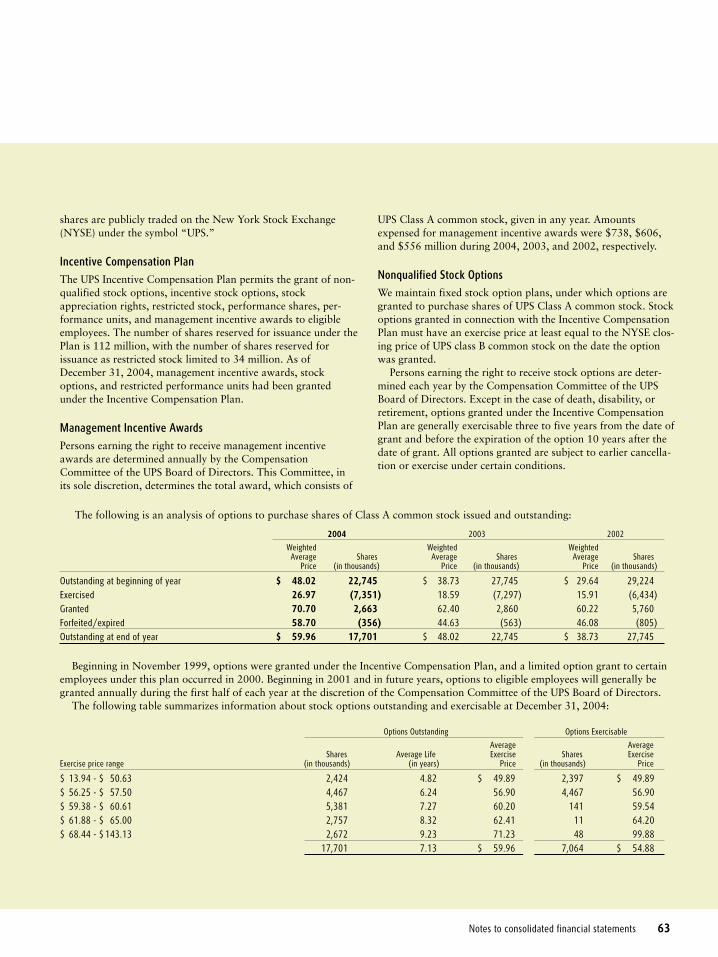
Notes to consolidated financial statements 63
shares are publicly traded on the New York Stock Exchange(NYSE) under the symbol “UPS.”
Incentive Compensation Plan The UPS Incentive Compensation Plan permits the grant of non-qualified stock options, incentive stock options, stockappreciation rights, restricted stock, performance shares, per-formance units, and management incentive awards to eligibleemployees. The number of shares reserved for issuance under thePlan is 112 million, with the number of shares reserved forissuance as restricted stock limited to 34 million. As ofDecember 31, 2004, management incentive awards, stockoptions, and restricted performance units had been grantedunder the Incentive Compensation Plan.
Management Incentive Awards Persons earning the right to receive management incentiveawards are determined annually by the CompensationCommittee of the UPS Board of Directors. This Committee, inits sole discretion, determines the total award, which consists of
UPS Class A common stock, given in any year. Amountsexpensed for management incentive awards were $738, $606,and $556 million during 2004, 2003, and 2002, respectively.
Nonqualified Stock Options We maintain fixed stock option plans, under which options aregranted to purchase shares of UPS Class A common stock. Stockoptions granted in connection with the Incentive CompensationPlan must have an exercise price at least equal to the NYSE clos-ing price of UPS class B common stock on the date the optionwas granted.
Persons earning the right to receive stock options are deter-mined each year by the Compensation Committee of the UPSBoard of Directors. Except in the case of death, disability, orretirement, options granted under the Incentive CompensationPlan are generally exercisable three to five years from the date ofgrant and before the expiration of the option 10 years after thedate of grant. All options granted are subject to earlier cancella-tion or exercise under certain conditions.
The following is an analysis of options to purchase shares of Class A common stock issued and outstanding:
2004 2003 2002
Weighted Weighted WeightedAverage Shares Average Shares Average Shares
Price (in thousands) Price (in thousands) Price (in thousands)
Outstanding at beginning of year $ 48.02 22,745 $ 38.73 27,745 $ 29.64 29,224Exercised 26.97 (7,351) 18.59 (7,297) 15.91 (6,434)Granted 70.70 2,663 62.40 2,860 60.22 5,760Forfeited/expired 58.70 (356) 44.63 (563) 46.08 (805)Outstanding at end of year $ 59.96 17,701 $ 48.02 22,745 $ 38.73 27,745
Beginning in November 1999, options were granted under the Incentive Compensation Plan, and a limited option grant to certainemployees under this plan occurred in 2000. Beginning in 2001 and in future years, options to eligible employees will generally begranted annually during the first half of each year at the discretion of the Compensation Committee of the UPS Board of Directors.
The following table summarizes information about stock options outstanding and exercisable at December 31, 2004:
Options Outstanding Options Exercisable
Average AverageShares Average Life Exercise Shares Exercise
Exercise price range (in thousands) (in years) Price (in thousands) Price
$ 13.94 - $ 50.63 2,424 4.82 $ 49.89 2,397 $ 49.89$ 56.25 - $ 57.50 4,467 6.24 56.90 4,467 56.90$ 59.38 - $ 60.61 5,381 7.27 60.20 141 59.54$ 61.88 - $ 65.00 2,757 8.32 62.41 11 64.20$ 68.44 - $143.13 2,672 9.23 71.23 48 99.88
17,701 7.13 $ 59.96 7,064 $ 54.88
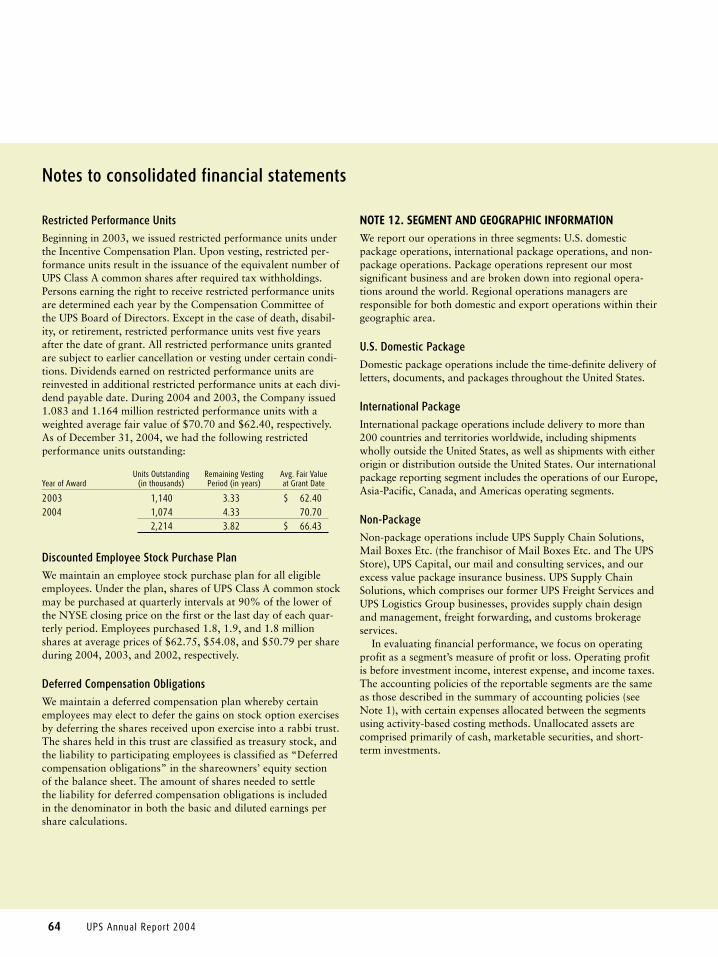
64 UPS Annual Report 2004
Notes to consolidated financial statements
Restricted Performance Units Beginning in 2003, we issued restricted performance units underthe Incentive Compensation Plan. Upon vesting, restricted per-formance units result in the issuance of the equivalent number ofUPS Class A common shares after required tax withholdings.Persons earning the right to receive restricted performance unitsare determined each year by the Compensation Committee ofthe UPS Board of Directors. Except in the case of death, disabil-ity, or retirement, restricted performance units vest five yearsafter the date of grant. All restricted performance units grantedare subject to earlier cancellation or vesting under certain condi-tions. Dividends earned on restricted performance units arereinvested in additional restricted performance units at each divi-dend payable date. During 2004 and 2003, the Company issued1.083 and 1.164 million restricted performance units with aweighted average fair value of $70.70 and $62.40, respectively.As of December 31, 2004, we had the following restrictedperformance units outstanding:
Units Outstanding Remaining Vesting Avg. Fair ValueYear of Award (in thousands) Period (in years) at Grant Date
2003 1,140 3.33 $ 62.402004 1,074 4.33 70.70
2,214 3.82 $ 66.43
Discounted Employee Stock Purchase PlanWe maintain an employee stock purchase plan for all eligibleemployees. Under the plan, shares of UPS Class A common stockmay be purchased at quarterly intervals at 90% of the lower ofthe NYSE closing price on the first or the last day of each quar-terly period. Employees purchased 1.8, 1.9, and 1.8 millionshares at average prices of $62.75, $54.08, and $50.79 per shareduring 2004, 2003, and 2002, respectively.
Deferred Compensation Obligations We maintain a deferred compensation plan whereby certainemployees may elect to defer the gains on stock option exercisesby deferring the shares received upon exercise into a rabbi trust.The shares held in this trust are classified as treasury stock, andthe liability to participating employees is classified as “Deferredcompensation obligations” in the shareowners’ equity section of the balance sheet. The amount of shares needed to settle the liability for deferred compensation obligations is included in the denominator in both the basic and diluted earnings pershare calculations.
NOTE 12. SEGMENT AND GEOGRAPHIC INFORMATIONWe report our operations in three segments: U.S. domesticpackage operations, international package operations, and non-package operations. Package operations represent our mostsignificant business and are broken down into regional opera-tions around the world. Regional operations managers areresponsible for both domestic and export operations within theirgeographic area.
U.S. Domestic Package Domestic package operations include the time-definite delivery ofletters, documents, and packages throughout the United States.
International Package International package operations include delivery to more than200 countries and territories worldwide, including shipmentswholly outside the United States, as well as shipments with eitherorigin or distribution outside the United States. Our internationalpackage reporting segment includes the operations of our Europe,Asia-Pacific, Canada, and Americas operating segments.
Non-Package Non-package operations include UPS Supply Chain Solutions,Mail Boxes Etc. (the franchisor of Mail Boxes Etc. and The UPSStore), UPS Capital, our mail and consulting services, and ourexcess value package insurance business. UPS Supply ChainSolutions, which comprises our former UPS Freight Services andUPS Logistics Group businesses, provides supply chain designand management, freight forwarding, and customs brokerageservices.
In evaluating financial performance, we focus on operatingprofit as a segment’s measure of profit or loss. Operating profitis before investment income, interest expense, and income taxes.The accounting policies of the reportable segments are the sameas those described in the summary of accounting policies (seeNote 1), with certain expenses allocated between the segmentsusing activity-based costing methods. Unallocated assets arecomprised primarily of cash, marketable securities, and short-term investments.
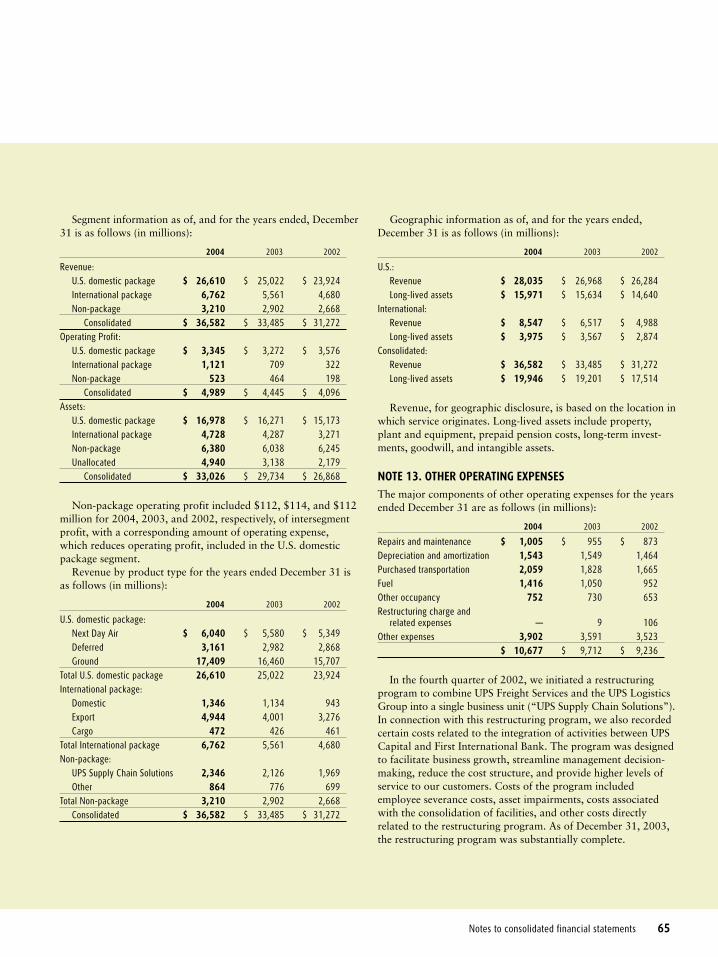
Notes to consolidated financial statements 65
Segment information as of, and for the years ended, December31 is as follows (in millions):
2004 2003 2002
Revenue:U.S. domestic package $ 26,610 $ 25,022 $ 23,924International package 6,762 5,561 4,680Non-package 3,210 2,902 2,668
Consolidated $ 36,582 $ 33,485 $ 31,272Operating Profit:
U.S. domestic package $ 3,345 $ 3,272 $ 3,576International package 1,121 709 322Non-package 523 464 198
Consolidated $ 4,989 $ 4,445 $ 4,096Assets:
U.S. domestic package $ 16,978 $ 16,271 $ 15,173International package 4,728 4,287 3,271Non-package 6,380 6,038 6,245Unallocated 4,940 3,138 2,179
Consolidated $ 33,026 $ 29,734 $ 26,868
Non-package operating profit included $112, $114, and $112million for 2004, 2003, and 2002, respectively, of intersegmentprofit, with a corresponding amount of operating expense,which reduces operating profit, included in the U.S. domesticpackage segment.
Revenue by product type for the years ended December 31 isas follows (in millions):
2004 2003 2002
U.S. domestic package:Next Day Air $ 6,040 $ 5,580 $ 5,349Deferred 3,161 2,982 2,868Ground 17,409 16,460 15,707
Total U.S. domestic package 26,610 25,022 23,924International package:
Domestic 1,346 1,134 943Export 4,944 4,001 3,276Cargo 472 426 461
Total International package 6,762 5,561 4,680Non-package:
UPS Supply Chain Solutions 2,346 2,126 1,969Other 864 776 699
Total Non-package 3,210 2,902 2,668Consolidated $ 36,582 $ 33,485 $ 31,272
Geographic information as of, and for the years ended,December 31 is as follows (in millions):
2004 2003 2002
U.S.:Revenue $ 28,035 $ 26,968 $ 26,284Long-lived assets $ 15,971 $ 15,634 $ 14,640
International:Revenue $ 8,547 $ 6,517 $ 4,988Long-lived assets $ 3,975 $ 3,567 $ 2,874
Consolidated:Revenue $ 36,582 $ 33,485 $ 31,272Long-lived assets $ 19,946 $ 19,201 $ 17,514
Revenue, for geographic disclosure, is based on the location inwhich service originates. Long-lived assets include property,plant and equipment, prepaid pension costs, long-term invest-ments, goodwill, and intangible assets.
NOTE 13. OTHER OPERATING EXPENSES The major components of other operating expenses for the yearsended December 31 are as follows (in millions):
2004 2003 2002
Repairs and maintenance $ 1,005 $ 955 $ 873Depreciation and amortization 1,543 1,549 1,464Purchased transportation 2,059 1,828 1,665Fuel 1,416 1,050 952Other occupancy 752 730 653Restructuring charge and
related expenses — 9 106Other expenses 3,902 3,591 3,523
$ 10,677 $ 9,712 $ 9,236
In the fourth quarter of 2002, we initiated a restructuringprogram to combine UPS Freight Services and the UPS LogisticsGroup into a single business unit (“UPS Supply Chain Solutions”).In connection with this restructuring program, we also recordedcertain costs related to the integration of activities between UPSCapital and First International Bank. The program was designedto facilitate business growth, streamline management decision-making, reduce the cost structure, and provide higher levels ofservice to our customers. Costs of the program includedemployee severance costs, asset impairments, costs associatedwith the consolidation of facilities, and other costs directlyrelated to the restructuring program. As of December 31, 2003,the restructuring program was substantially complete.

66 UPS Annual Report 2004
Notes to consolidated financial statements
NOTE 14. INCOME TAXESThe income tax expense (benefit) for the years ended December 31consists of the following (in millions):
2004 2003 2002
Current:U.S. Federal $ 1,675 $ 1,103 $ 1,208U.S. State & Local 71 112 148Non-U.S. 98 86 62
Total Current 1,844 1,301 1,418Deferred:
U.S. Federal (155) 181 323U.S. State & Local (84) (11) 14Non-U.S. (16) 1 —
Total Deferred (255) 171 337Total $ 1,589 $ 1,472 $ 1,755
Income before income taxes includes income of foreign sub-sidiaries of $270, $237, and $16 million in 2004, 2003, and2002, respectively.
A reconciliation of the statutory federal income tax rate to theeffective income tax rate for the years ended December 31 con-sists of the following:
2004 2003 2002
Statutory U.S. federal income tax rate 35.0% 35.0% 35.0%
U.S. state & local income taxes (net of federal benefit) 1.2 1.5 2.1
Tax assessment reversal (tax portion) — — (2.8)
Other (3.9) (2.8) 0.7Effective income tax rate 32.3% 33.7% 35.0%
During the third quarter of 2004, we recognized a $99 millionreduction of income tax expense related to the favorable settle-ment of various U.S. federal tax contingency matters with theIRS pertaining to tax years 1985 through 1998, and variousstate and non-U.S. tax contingency matters.
During the fourth quarter of 2004, we recognized a $109 mil-lion reduction of income tax expense primarily related to thefavorable resolution of a U.S. state tax contingency matter,improvements in U.S. state and non-U.S. effective tax rates, andthe reversal of valuation allowances associated with certain U.S.state & local and non-U.S. net operating loss and credit carry-forwards due to sufficient positive evidence that the relatedsubsidiaries will be profitable and generate taxable incomebefore such carryforwards expire.
During the first quarter of 2003, we recognized a $55 millionreduction of income tax expense due to the favorable resolutionof several outstanding contingency matters with the IRS. Duringthe third quarter of 2003, we recognized a $22 million credit toincome tax expense as a result of a favorable tax court ruling inrelation to an outstanding contingency matter with the IRS.
After filing our 2002 state tax returns during the fourthquarter of 2003, we completed a review of the taxability of ouroperations in various U.S. state taxing jurisdictions and theeffects of available state tax credits. As a result of this review,we recorded a decrease of $39 million in the income tax provi-sion in the fourth quarter of 2003. This decrease includes areduction in our estimated state tax liabilities and the effect ofthe estimated state income tax effective rate applied to ourtemporary differences.
Deferred tax liabilities and assets are comprised of the follow-ing at December 31 (in millions):
2004 2003
Property, plant and equipment $ 2,624 $ 2,453Goodwill and intangible assets 428 349Pension plans 1,481 1,266Other 167 473Gross deferred tax liabilities 4,700 4,541Other postretirement benefits 684 588Loss carryforwards (non-U.S. and state) 113 117Insurance reserves 469 347Vacation pay accrual 145 131Other 471 673Gross deferred tax assets 1,882 1,856Deferred tax assets valuation allowance (64) (117)Net deferred tax assets 1,818 1,739Net deferred tax liability 2,882 2,802Current deferred tax asset (392) (316)Long-term liability — see Note 9 $ 3,274 $ 3,118
The valuation allowance increased (decreased) by $(53), $25and $23 million during the years ended December 31, 2004,2003 and 2002, respectively. We reclassified $719 million fromdeferred income taxes to other non-current assets as ofDecember 31, 2003. This amount represents various income taxreceivable items that had previously been netted against ourdeferred tax liabilities.
As of December 31, 2004, we have U.S. state & local operatingloss and credit carryforwards of approximately $428 million and$25 million, respectively. The operating loss carryforwards expireat varying dates through 2024. The majority of the credit carry-forwards may be carried forward indefinitely. We also have

Notes to consolidated financial statements 67
non-U.S. loss carryforwards of approximately $874 million as ofDecember 31, 2004, the majority of which may be carried for-ward indefinitely. As indicated in the table above, we haveestablished a valuation allowance for certain non-U.S. and stateloss carryforwards, due to the uncertainty resulting from a lack of previous taxable income within the applicable tax jurisdictions.
Undistributed earnings of our non-U.S. subsidiaries amountedto approximately $728 million at December 31, 2004. Thoseearnings are considered to be indefinitely reinvested and, accord-ingly, no U.S. federal or state deferred income taxes have beenprovided thereon. Upon distribution of those earnings in theform of dividends or otherwise, we would be subject to U.S.income taxes and withholding taxes payable in various non-U.S.jurisdictions, which could potentially be offset by foreign taxcredits. Determination of the amount of unrecognized deferredU.S. income tax liability is not practicable because of the com-plexities associated with its hypothetical calculation.
We have not changed our position with respect to the indefi-nite reinvestment of foreign earnings to take into account thepossible election of the repatriation provisions contained in theAmerican Jobs Creation Act of 2004. The American JobsCreation Act of 2004 (the “Jobs Act”), as enacted on October22, 2004, provides for a temporary 85% dividends receiveddeduction on certain foreign earnings repatriated during a one-year period. The deduction would result in an approximate5.25% U.S. federal tax rate on any repatriated earnings. Toqualify for the deduction, the earnings must be reinvested in theUnited States pursuant to a domestic reinvestment plan estab-lished by the Company’s Chief Executive Officer and approvedby the Company’s Board of Directors. Certain other criteria inthe Jobs Act must be satisfied as well. The maximum amount ofour foreign earnings that qualify for the temporary deductionunder the Jobs Act is $500 million.
We are in the process of evaluating whether we will repatri-ate foreign earnings under the repatriation provisions of theJobs Act, and if so, the amount that will be repatriated. We areconsidering repatriating any amount up to $500 million underthe Jobs Act. We are awaiting the issuance of further regulatoryguidance and passage of statutory technical corrections withrespect to certain provisions in the Jobs Act prior to determin-ing the amounts we could repatriate. We expect to determinethe amounts and sources of foreign earnings to be repatriated, if any, during the fourth quarter of 2005. We cannot reasonablyestimate the impact of a qualifying repatriation, should wechoose to make one, on our income tax expense for 2005 at this time.
NOTE 15. EARNINGS PER SHAREThe following table sets forth the computation of basic anddiluted earnings per share (in millions except per shareamounts):
2004 2003 2002
Numerator:Net income before the
cumulative effect of change in accounting principle $ 3,333 $ 2,898 $ 3,254
Denominator:Weighted average shares 1,125 1,125 1,117Management incentive awards 1 1 1Deferred compensation
obligations 3 2 2Denominator for basic
earnings per share 1,129 1,128 1,120Effect of dilutive securities:
Management incentive awards 4 4 4Stock option plans 4 6 10
Denominator for diluted earnings per share 1,137 1,138 1,134
Basic earnings per share before cumulative effect of changein accounting principle $ 2.95 $ 2.57 $ 2.91
Diluted earnings per share before cumulative effect of change in accounting principle $ 2.93 $ 2.55 $ 2.87
Diluted earnings per share for the years ended December 31,2004, 2003, and 2002 exclude the effect of 2.7, 2.9, and 0.1 mil-lion shares, respectively, of common stock that may be issuedupon the exercise of employee stock options because such effectwould be antidilutive.
68 UPS Annual Report 2004
Notes to consolidated financial statements
NOTE 16. DERIVATIVE INSTRUMENTS AND RISK MANAGEMENT We are exposed to market risk, primarily related to foreignexchange rates, commodity prices, equity prices, and interest rates.These exposures are actively monitored by management. To man-age the volatility relating to certain of these exposures, we enterinto a variety of derivative financial instruments. Our objective isto reduce, where it is deemed appropriate to do so, fluctuations inearnings and cash flows associated with changes in foreign cur-rency rates, commodity prices, equity prices, and interest rates. Itis our policy and practice to use derivative financial instrumentsonly to the extent necessary to manage exposures. As we use pricesensitive instruments to hedge a certain portion of our existingand anticipated transactions, we expect that any loss in value forthose instruments generally would be offset by increases in thevalue of those hedged transactions.
We do not hold or issue derivative financial instruments fortrading or speculative purposes.
Commodity Price Risk ManagementWe are exposed to an increase in the prices of refined fuels, prin-cipally jet-A, diesel, and unleaded gasoline. Additionally, we areexposed to an increase in the prices of other energy products,principally natural gas and electricity. We use a combination ofoptions, swaps, and futures contracts to provide partial protec-tion from rising fuel and energy prices. The net fair value of suchcontracts subject to price risk, excluding the underlying expo-sures, as of December 31, 2004 and 2003 was an asset of $101and $30 million, respectively. We have designated and accountfor these contracts as cash flow hedges, and, therefore, theresulting gains and losses from these hedges are recognized as acomponent of fuel expense or other occupancy expense when theunderlying fuel or energy product being hedged is consumed.
Foreign Currency Exchange Risk ManagementWe have foreign currency risks related to our revenue, operatingexpenses, and financing transactions in currencies other than thelocal currencies in which we operate. We are exposed to cur-rency risk from the potential changes in functional currencyvalues of our foreign currency denominated assets, liabilities,and cash flows. Our most significant foreign currency exposures
relate to the Euro, the British Pound Sterling, and the CanadianDollar. We use a combination of purchased and written optionsand forward contracts to hedge currency cash flow exposures.As of December 31, 2004 and 2003, the net fair value of thehedging instruments described above was a liability of $(28) and$(48) million, respectively. We have designated and account forthese contracts as cash flow hedges of anticipated foreign cur-rency denominated revenue and, therefore, the resulting gainsand losses from these hedges are recognized as a component ofinternational revenue when the underlying sales occur.
Interest Rate Risk ManagementOur indebtedness under our various financing arrangements cre-ates interest rate risk. We use a combination of derivativeinstruments, including interest rate swaps and cross-currencyinterest rate swaps, as part of our program to manage the fixedand floating interest rate mix of our total debt portfolio andrelated overall cost of borrowing. These swaps are entered intoconcurrently with the issuance of the debt that they are intendedto modify, and the notional amount, interest payment, andmaturity dates of the swaps match the terms of the associateddebt. Interest rate swaps allow us to maintain a target range offloating rate debt.
We have designated and account for these contracts as eitherhedges of the fair value of the associated debt instruments, or ashedges of the variability in expected future interest payments.Any periodic settlement payments are accrued monthly, aseither a charge or credit to interest expense, and are not mate-rial to net income. The net fair value of our interest rate swapsat December 31, 2004 and 2003 was a liability of $(32) and$(27) million, respectively.
Credit Risk ManagementThe forward contracts, swaps, and options previously discussedcontain an element of risk that the counterparties may be unableto meet the terms of the agreements. However, we minimize suchrisk exposures for these instruments by limiting the counterpar-ties to large banks and financial institutions that meet establishedcredit guidelines. We do not expect to incur any losses as a resultof counterparty default.

Notes to consolidated financial statements 69
Derivatives Not Designated As Hedges Derivatives not designated as hedges primarily consist of a smallportfolio of stock warrants in public and private companies thatare held for investment purposes. These warrants are recorded atfair value, and the impact of these warrants on our results wasimmaterial for 2004, 2003 and 2002.
Income Effects of DerivativesIn the context of hedging relationships, “effectiveness” refers tothe degree to which fair value changes in the hedging instrumentoffset corresponding changes in the hedged item. Certain ele-ments of hedge positions cannot qualify for hedge accountingunder FAS 133 whether effective or not, and must therefore bemarked to market through income. Both the effective and inef-fective portions of gains and losses on hedges are reported in theincome statement category related to the hedged exposure. Boththe ineffective portion of hedge positions and the elementsexcluded from the measure of effectiveness were immaterial for2004, 2003 and 2002.
As of December 31, 2004, $13 million in losses related to cashflow hedges that are currently deferred in OCI are expected to bereclassified to income over the 12 month period ending December31, 2005. The actual amounts that will be reclassified to incomeover the next 12 months will vary from this amount as a result ofchanges in market conditions. No amounts were reclassified toincome during 2004 in connection with forecasted transactionsthat were no longer considered probable of occurring.
At December 31, 2004, the maximum term of derivativeinstruments that hedge forecasted transactions, except thoserelated to cross-currency interest rate swaps on existing financialinstruments, was three years. We maintain cross-currency inter-est rate swaps that extend through 2009.
Fair Value of Financial InstrumentsAt December 31, 2004 and 2003, our financial instrumentsincluded cash and cash equivalents, marketable securities andshort-term investments, accounts receivable, finance receivables,accounts payable, short-term and long-term borrowings, andcommodity, interest rate, foreign currency, and equity options,forwards, and swaps. The fair values of cash and cash equiva-lents, accounts receivable, and accounts payable approximatecarrying values because of the short-term nature of these instru-ments. The fair value of our marketable securities and short-terminvestments is disclosed in Note 2, finance receivables in Note 3,and debt instruments in Note 8.
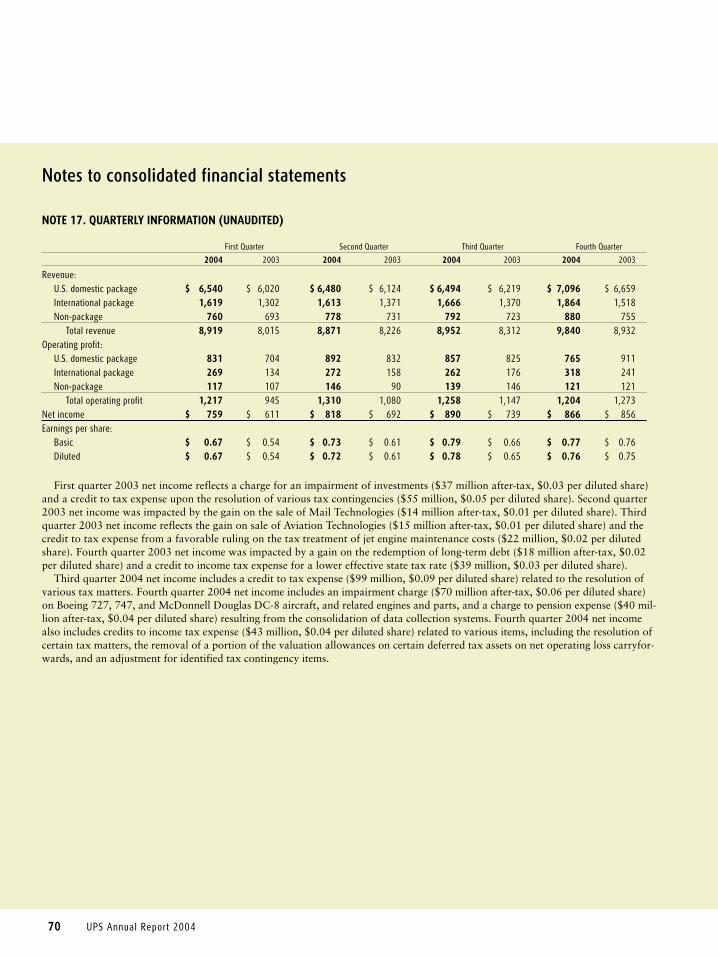
70 UPS Annual Report 2004
NOTE 17. QUARTERLY INFORMATION (UNAUDITED)
First Quarter Second Quarter Third Quarter Fourth Quarter
2004 2003 2004 2003 2004 2003 2004 2003
Revenue:U.S. domestic package $ 6,540 $ 6,020 $ 6,480 $ 6,124 $ 6,494 $ 6,219 $ 7,096 $ 6,659International package 1,619 1,302 1,613 1,371 1,666 1,370 1,864 1,518Non-package 760 693 778 731 792 723 880 755
Total revenue 8,919 8,015 8,871 8,226 8,952 8,312 9,840 8,932Operating profit:
U.S. domestic package 831 704 892 832 857 825 765 911International package 269 134 272 158 262 176 318 241Non-package 117 107 146 90 139 146 121 121
Total operating profit 1,217 945 1,310 1,080 1,258 1,147 1,204 1,273Net income $ 759 $ 611 $ 818 $ 692 $ 890 $ 739 $ 866 $ 856Earnings per share:
Basic $ 0.67 $ 0.54 $ 0.73 $ 0.61 $ 0.79 $ 0.66 $ 0.77 $ 0.76Diluted $ 0.67 $ 0.54 $ 0.72 $ 0.61 $ 0.78 $ 0.65 $ 0.76 $ 0.75
First quarter 2003 net income reflects a charge for an impairment of investments ($37 million after-tax, $0.03 per diluted share)and a credit to tax expense upon the resolution of various tax contingencies ($55 million, $0.05 per diluted share). Second quarter2003 net income was impacted by the gain on the sale of Mail Technologies ($14 million after-tax, $0.01 per diluted share). Thirdquarter 2003 net income reflects the gain on sale of Aviation Technologies ($15 million after-tax, $0.01 per diluted share) and thecredit to tax expense from a favorable ruling on the tax treatment of jet engine maintenance costs ($22 million, $0.02 per dilutedshare). Fourth quarter 2003 net income was impacted by a gain on the redemption of long-term debt ($18 million after-tax, $0.02per diluted share) and a credit to income tax expense for a lower effective state tax rate ($39 million, $0.03 per diluted share).
Third quarter 2004 net income includes a credit to tax expense ($99 million, $0.09 per diluted share) related to the resolution ofvarious tax matters. Fourth quarter 2004 net income includes an impairment charge ($70 million after-tax, $0.06 per diluted share)on Boeing 727, 747, and McDonnell Douglas DC-8 aircraft, and related engines and parts, and a charge to pension expense ($40 mil-lion after-tax, $0.04 per diluted share) resulting from the consolidation of data collection systems. Fourth quarter 2004 net incomealso includes credits to income tax expense ($43 million, $0.04 per diluted share) related to various items, including the resolution ofcertain tax matters, the removal of a portion of the valuation allowances on certain deferred tax assets on net operating loss carryfor-wards, and an adjustment for identified tax contingency items.
Notes to consolidated financial statements

Price and dividend information 71
Price and dividend information
Our Class A common stock is not listed on a national securities exchange or traded in an organized over-the-counter market, but eachshare of our Class A common stock is convertible into one share of our Class B common stock.
The following is a summary of our Class B common stock price activity and dividend information for 2004 and 2003. Our Class Bcommon stock is listed on the New York Stock Exchange under the symbol “UPS.”
DividendsHigh Low Close Declared
2004:First Quarter $ 74.46 $ 67.51 $ 69.84 $ 0.28Second Quarter $ 75.26 $ 68.57 $ 75.17 $ 0.28Third Quarter $ 76.00 $ 69.15 $ 75.92 $ 0.28Fourth Quarter $ 87.70 $ 75.76 $ 85.46 $ 0.28
2003:First Quarter $ 64.48 $ 53.00 $ 57.00 $ 0.21Second Quarter $ 64.32 $ 56.52 $ 63.70 $ 0.21Third Quarter $ 64.99 $ 61.17 $ 63.80 $ 0.25Fourth Quarter $ 74.86 $ 63.76 $ 74.55 $ 0.25
As of February 28, 2005, there were 168,651 and 15,728 record holders of Class A and Class B common stock, respectively. The policy of our Board of Directors is to declare dividends each year out of current earnings. The declaration of future dividends
is subject to the discretion of the Board of Directors in light of all relevant facts, including earnings, general business conditions andworking capital requirements.
On February 9, 2005, our Board declared a dividend of $0.33 per share, which was payable on March 9, 2005 to shareowners ofrecord on February 22, 2005.
Investor information
Annual MeetingOur annual meeting of shareowners will be held at8 a.m. on May 5, 2005 at the Hotel Du Pont,11th and Market Streets, Wilmington, DE 19801.Shareowners of record as of March 7, 2005 areentitled to vote at the meeting.
Investor RelationsUPS maintains a comprehensive Web site at www.shareholder.com/ups and has an active Investor Relations program. You can contact the Investor Relations Department at:
UPS55 Glenlake Parkway, NEAtlanta, GA 30328800-877-1503 or 404-828-6059
Exchange ListingOur Class B common stock is listed on the New York Stock Exchange under the symbol “UPS.”
Form 10-KA copy of our Annual Report on Form 10-K may be obtained without charge through the Internet at www.shareholder.com/ups or at www.sec.gov, the Web site for the Securities and Exchange Commission. It also is available by calling or writing to the Investor Relations Department. Additional investor information is available on the Investor Relations Web site, www.shareholder.com/ups.
Direct Stock Purchase and Dividend Reinvestment PlanThe Mellon Direct Investment & Dividend Reinvestment Plan enables UPS Class B common shareowners to purchase additional Class B common shares and/or to reinvest dividends paid on shares of UPS Class B stock in additional UPS Class B common shares. Current UPS Class B common stock shareowners can enroll in the plan online by accessing your account at www.melloninvestor.com/isd or calling toll-free 800-758-4674. If you wish to make an initial purchase of UPS Class B common stock online, visit www.melloninvestor.com and select For Investors. Follow the instructions provided to search for Direct Investment Plans and access the Enrollment Wizard. The dividend reinvestment plan enables shareholders of UPS Class A and Class B common stock to purchase additional shares. To learn more about the dividend reinvestment plan, Class A common stock shareowners can visit www.melloninvestor.com and select MellonOne. Class B shareowners can visit www.melloninvestor.com/isd.
72 Investor information
�������������������������������������������������������������������������������������������������������������������������������������������������������������������������������������������������������������������������������������������������������������������������������������������������������������������������������������������������
1 1 1 0 9 8 7 6 5 4 3 2 1 0 1 2 3 4 5 6 7 8 9 1 0 1 1 1 2
Copyright © 2005 United Parcel Service of America, Inc. All rights reserved.
Investor ServiceDirect EnhancementsMellon’s Investor ServiceDirect® application has been redesigned. It now offers: n Increased functionality and ease of use. n A streamlined portfolio page that summarizes your profile information and directs you quickly and easily to your accounts and the information you’re seeking. n User-friendly navigation that enables you to perform your transactions faster with easy access to account history and forms and materials. n New helpful tips, shortcuts and related links that give you the answers to the most common questions. n An expanded help center that features a new user manual, FAQs and investor support.
UPS Shareowner ServicesConvenient access 24 hours a day, 7 days a week
Class A Common Shareowners www.melloninvestor.com Select MellonOne 888-663-8325
Class B Common Shareowners www.melloninvestor.com Select for Investors and then Investor ServiceDirect 800-758-4674
Calls from outside the United States: 201-373-5334 TDD for hearing impaired: 800-231-5469 TDD for non-U.S. shareowners: 201-329-8354
Online Access to Shareowner Materials through MLink® Interested in receiving shareowner information electronically? Enroll in MLink, a self-service program that provides electronic notification and secure access to shareowner communications. To enroll, follow the MLink enrollment instructions when you access your UPS Class A or UPS Class B common shareowner account via the Web sites previously noted.
Transfer Agent and RegistrarAccount information and transactions are managed by Mellon Investor Services LLC. Please direct notices of address changes or questions regarding account status, stock transfers, lost certificates, or dividend payments to the transfer agent at the address below.
United Parcel Service, Inc.c/o Mellon Investor Services LLCP.O. Box 3415South Hackensack, NJ 07606-3415
or
85 Challenger RoadRidgefield Park, NJ 07660

Every Minute Around the World
UPS Annual Report 2004
55 Glenlake Parkway, NEAltanta, GA 30328
www.ups.com
UPS Annual Report 2004