Every Child Matters? An Evaluation of 'Special Educational ...ftp.iza.org/dp6069.pdf · pupil)....
45
DISCUSSION PAPER SERIES Forschungsinstitut zur Zukunft der Arbeit Institute for the Study of Labor Every Child Matters? An Evaluation of “Special Educational Needs” Programmes in England IZA DP No. 6069 October 2011 Francois Keslair Eric Maurin Sandra McNally
Transcript of Every Child Matters? An Evaluation of 'Special Educational ...ftp.iza.org/dp6069.pdf · pupil)....
DI
SC
US
SI
ON
P
AP
ER
S
ER
IE
S
Forschungsinstitut zur Zukunft der ArbeitInstitute for the Study of Labor
Every Child Matters?An Evaluation of “Special Educational Needs”Programmes in England
IZA DP No. 6069
October 2011
Francois KeslairEric MaurinSandra McNally

Every Child Matters? An Evaluation of “Special Educational
Needs” Programmes in England
Francois Keslair Paris School of Economics
Eric Maurin
Paris School of Economics and IZA
Sandra McNally
CEP, London School of Economics and IZA
Discussion Paper No. 6069 October 2011
IZA
P.O. Box 7240 53072 Bonn
Germany
Phone: +49-228-3894-0 Fax: +49-228-3894-180
E-mail: [email protected]
Any opinions expressed here are those of the author(s) and not those of IZA. Research published in this series may include views on policy, but the institute itself takes no institutional policy positions. The Institute for the Study of Labor (IZA) in Bonn is a local and virtual international research center and a place of communication between science, politics and business. IZA is an independent nonprofit organization supported by Deutsche Post Foundation. The center is associated with the University of Bonn and offers a stimulating research environment through its international network, workshops and conferences, data service, project support, research visits and doctoral program. IZA engages in (i) original and internationally competitive research in all fields of labor economics, (ii) development of policy concepts, and (iii) dissemination of research results and concepts to the interested public. IZA Discussion Papers often represent preliminary work and are circulated to encourage discussion. Citation of such a paper should account for its provisional character. A revised version may be available directly from the author.

IZA Discussion Paper No. 6069 October 2011
ABSTRACT
Every Child Matters? An Evaluation of “Special Educational Needs” Programmes in England*
The need for education to help every child rather than focus on average attainment has become a more central part of the policy agenda in the US and the UK. Remedial programmes are often difficult to evaluate because participation is usually based on pupil characteristics that are largely unobservable to the analyst. In this paper we evaluate programmes for children with moderate levels of ‘special educational needs’ in England. We show that the decentralized design of the policy generates significant variations in access to remediation resources across children with similar prior levels of difficulty. However, this differential is not reflected in subsequent educational attainment – suggesting that the programme is ineffective for ‘treated’ children. In the second part of our analysis, we use demographic variation within schools to consider the effect of the programme on whole year groups. Our analysis is consistent with no overall effect on account of the combined direct and indirect (spillover) effects. Thus, the analysis suggests that a key way that English education purports to help children with learning difficulties is not working. JEL Classification: I2 Keywords: education, special needs, evaluation Corresponding author: Francois Keslair Paris School of Economics (PSE) 48 Boulevard Jourdan Paris 75014 France E-mail: [email protected]
* We thank participants at seminars in CEP and PSE. We acknowledge the support of the RTN network “Economics of Education and Education Policy in Europe (EEEPE)” in providing Francois Keslair with the financial support to pursue part of this research project in London.

2
I. Introduction
A controversial issue in education throughout the world is the design of remediation policies
for pupils with learning difficulties.2 In recent times, the policy agenda in the US and the UK
has moved to consider the needs of all children more explicitly (i.e. not only the average
pupil). This can be seen in the US with ‘No Child Left Behind’ and in the UK with the ‘Every
Child Matters’. Whether every child benefits from government policy is an empirical question
– and one important indicator is what government programmes do for children with learning
difficulties. England has opted for a highly decentralized policy (Special Education Needs
programmes, hereafter SEN), designed to address the specific difficulties of each child. Such
policies are difficult to evaluate because children with learning difficulties are not randomly
assigned to programmes. Furthermore, the selection mechanism is not usually fully observed
(if at all) by researchers, making it very difficult to distinguish between the effects of the
programme and selection into the programme in any analysis. Hence, good studies that
evaluate remediation policies are rare.3 This paper provides one of the first evaluations of the
effect of a SEN programme on the relative performance of treated students compared to non-
treated students within the same year group. It also investigates whether an increase in the
overall proportion of treated students in a year group generates spillover effects on non-
treated students in the same year group.
In England, SEN programmes largely consist of asking schools to identify pupils with
learning difficulties and then to adapt their teaching strategies accordingly with the help of a
Code of Practice.4 About 20% of English pupils participate in these programmes.
2 See for example, the debate on the effectiveness of special education programmes in the US (Hanushek et al.
2002, versus Morgan et al. 2008) or the debate on the effectiveness of grade retention in the US, France and
other countries (Manacorda, 2010). 3 Exceptions include Crawford and Vignoles (2010) for England; Hanushek et al. (2002) for the US and
Schlosser and Lavy (2005) for Israel. 4A small percentage of children (about 3% of the population) get a Statement of Special Educational Needs
through the Local Authority.

3
Interventions are decided at school-level and include one-to-one tuition, teaching assistance
etc. At each school, there is a SEN coordinator who oversees the implementation of this
policy. The SEN team typically receives resources from the school budget to achieve the
remediation targets that are specific to the school. Overall SEN expenditure amounts to about
£1,320 per SEN pupil (on average). Notionally, this is about 30% of the average spending per
targeted pupil. In practice, schools have flexibility about how they spend SEN resources.
SEN programmes have the attractive feature of being designed to address the specific
difficulties of each pupil. They are targeted at individuals, rather than whole classes or
schools. On the other hand, such a policy might possibly generate individual stigma and thus
be counterproductive, especially for pupils with relatively minor difficulties. In other words,
the labelling of a child as SEN could itself be a source of difficulty.
The second basic feature of SEN programmes is that they are largely defined at the
local level, by school heads themselves. The obvious advantage of such decentralized policies
is that they can better take account of local constraints and make better use of local resources.
On the other hand, the policy may become context-specific, especially for children with
moderate difficulties, for which the diagnosis is not usually medical. What this means is that a
child with a significant learning difficulty may not have access to remediation simply because
she attends a school where there are a lot of other children with stronger learning difficulties.
At the same time a child with only moderate difficulties may have access to a remediation
programme simply because she attends a school where nobody else has learning difficulties.
In this way, a SEN programme defined at the school level may be a source of very significant
variation across schools in the relative access to remediation programmes for children with
moderate learning difficulties The first question asked by this paper is whether these
variations translate into variations across schools in the relative performance of children with
moderate difficulties at school.

4
Our paper sheds light on this issue using a unique longitudinal dataset (National Pupil
Database) which provides information on SEN assignment and test scores in national tests
that take place when pupils are of age 7 and 11. These data confirm that there are very
significant variations in the probability of SEN assignment across children with similar
learning difficulties at age 7 but attending different schools. Importantly, these differences are
much less marked for pupils who achieve a relatively high performance or relatively low
performance early on in primary school than for pupils in-between these two extremes. Pupils
who achieve a relatively high performance at age 7 are almost never assigned to a SEN
programme, regardless of their school context. Similarly, pupils who achieve very low
performance at age 7 are almost always assigned to a SEN programme and there is no
significant probability gap according to their school type. In contrast, the gap in access to
SEN is very significant for pupils with moderate difficulties. These pupils are much more
often assigned to a SEN programme when they attend a high-context school (where the
average level of age 7 test attainment is relatively high) than when they attend a low-context
school. Thus, the decentralized design of SEN policy generates significant inequalities in
access to remediation resources across children with similar (moderate) difficulties at age 7.
Secondly, we show that the specific variation across schools in access to SEN
resources for pupils with moderate difficulties early on in primary school does not generate
any change in academic performance at the end of primary school. The improvement of pupil
performance between age 7 and 11 is slightly faster in high-context than in low-context
schools. But this difference in improvement across contexts is almost exactly the same for
pupils who achieved a relatively high performance or a relatively low performance or
somewhere in-between with regard to attainment in tests at age 7. In other words, the school
context generates a very significant difference in access to SEN resources for children with
moderate difficulties early on in primary school (when compared to other children), but no
5
difference at all in relative performance at the end of primary school. This result suggests that
there is no net effect of being assigned to a SEN programme on the relative performance of
pupils with moderate difficulties compared to other pupils in the same year group and the
same school.
One possible reason for observing no significant effect of SEN programmes on the
relative performance of participants may be that non-participants are themselves indirectly
affected by the programme. As it turns out, SEN programmes typically involve a
reorganisation of teaching practice which might generate spillover effects on non-participants.
For example, if the group of non-SEN pupils keeps on working while SEN pupils are
attending their particular classes, the programme may be associated with an increase in the
quality of teaching received by non-SEN pupils. However, in this case, we should observe
that the average performance of a year group is positively affected by the overall proportion
of SEN participants in the year group. We explore this issue by using school-level
demographic shocks as a source of exogenous variation in the overall proportion of children
assigned to a SEN programme in a year group. Specifically, the proportion of SEN students in
a given year group is shown to be positively affected by the proportion of relatively young
students in other year groups, namely the proportion of August born students (in the UK,
August corresponds to the end of the academic year). Using this in the context of an
Instrumental Variable strategy suggests that exogenous change in the overall proportion of
children assigned to a SEN programme in a year group has no perceptible effect on the
average performance of the year group. In other words, we can find no evidence for
significant spillover effects.
Overall, our analysis suggests that remediation programs are not working for a
significant proportion of children known as ‘SEN’ and are not generating positive

6
externalities on other children. Our results suggest that the mechanisms through which
vulnerable children are helped needs to be reconsidered.
There have been relatively few rigorous quantitative studies about the effects of
‘special needs programmes. This is probably on account of the difficulty of dealing with
selection of pupils into these programmes. Our study shows how this difficulty can be
overcome in the English context. While inevitably an evaluation of a ‘special needs’
programme in one country does not necessarily have applicability in other countries, one
general message is that well-intentioned programmes might even have negative effects due to
the labelling of children.
In Section II, we provide an overview of the Special Educational Needs Programme in
England. In Section III, we describe our data. Then in Section IV, we use a graphical analysis
to illustrate inequality in access to SEN resources across pupils with similar learning
difficulties. In Section V, we use a graphical and regression analysis to illustrate the
implications of this inequality for school performance at age 11. Section VI provides evidence
on spillover effects. In Section VII, we discuss the interpretation of our findings. We conclude
in Section VIII.
II. Special Educational Needs Programme in England
The current framework of special education in England was introduced about 30 years ago by
the Education Act 1981. This Act introduced the legal concept of “special educational needs”
(SEN) and emphasized the general principle of educating all children in mainstream schools.
Generally speaking, SEN programmes consist of asking schools to identify pupils with
learning difficulties and to adapt their teaching strategies accordingly, as outlined in the Code
of Practice. About 20% of English pupils participate in these programmes. The policy is led
by a SEN coordinator, and the team receive resources from the school budget to achieve

7
remediation targets that are specific to the school5. Notionally SEN expenditure amounts to
about 30% of the average spending per targeted pupil (about £1,320 on average). However, in
practice schools have flexibility about how they spend SEN resources.
The Special Educational Needs Code of Practice recommends a graduated approach to
helping children who are in need of special provision. The first stages are at the discretion of
the school (both in the identification of a student as having ‘special educational needs’ and in
the type of provision given). The later stages involve the Local Authority, with the granting of
a statement being reserved for the most serious cases (about 15% of the SEN population). The
first type of programme is called ‘School Action’, which is when the school identifies a child
as having ‘special educational needs’ and sets about providing an intervention that is
additional to or different from that which is provided to the rest of the pupils. The Code of
Practice explains that the triggers for this level of intervention could be one of several
concerns relating to the child: (a) makes little or no progress even when teaching approaches
are targeted particularly at the child’s identified area of weakness; (b) shows signs of
difficulty in developing literacy or mathematics skills which result in poor attainment in some
curriculum areas; (c) presents persistent emotional or behavioural difficulties which are not
ameliorated by the behaviour management techniques usually employed in the school; (d) has
sensory or physical problems and continues to make little or no progress despite the provision
of specialist equipment; (e) has communication and/or interaction difficulties and continues to
make little or no progress despite the provision of a differentiated curriculum. According to
the Audit Commission (2002), in practice children with needs associated with a physical
disability tend to be identified earlier and more reliably. However, they note that most needs
are not clear cut – for the majority, there are no medical tests and different professionals may
5 The funding of schools is largely determined by pupil numbers and by the school’s level of deprivation. The
formula used to distribute funds to schools varies between Local Authorities. The formula typically takes
account of factors that are correlated with the probability of having special needs (e.g. economic deprivation
indicators), but schools do not get specific additional funding whenever they assign a child to a SEN programme.
They get additional funding only if the pupil has a statement of special needs.
8
reach differing conclusions about the underlying causes for SEN. A report by the Schools
Inspectorate (OfSTED, 2004) finds that there is wide variation between schools in the
numbers defined as having SEN and that the criteria vary considerably in practice. There is no
prescribed intervention strategy, but the Code of Practice gives some examples of strategies
that might be deployed: one-to-one tuition; different learning materials or special equipment;
group support; staff development and training to introduce more effective strategies for these
students. It recommends that an Individual Education Plan should be made in relation to each
child and used to assess progress in relation to targets.
The next type of programme comes into place if ‘School Action’ is deemed
inadequate. This is where the school seeks the help of external support services and is called
‘School Action Plus’. The specialist might act in an advisory capacity or provide additional
specialist assessment or be involved in teaching the child directly. Finally, if all school action
fails, the school may request a statutory assessment, which may lead to a statement of special
educational needs for the child.6 This statement gives details of the nature of the child’s needs
and how these will be provided for. It imposes a statutory duty on the Local Authority to
make the provision set out in the statement. Only about 2.8% of pupils get a SEN statement.
Recently, Crawford and Vignoles (2010) evaluated the effectiveness of SEN provision
in a region of the South West of England (Avon). They use a rich data set and a methodology
based on statistical matching. They find no evidence that SEN provision raises educational
attainment for the pupils in their sample. Keslair and McNally (2009) have also produced a
descriptive study of SEN provision in England. Simple regression techniques show that the
‘SEN’ label continues to have a negative association with pupil outcomes even after
controlling for a very rich set of controls. However, both these studies rely on ‘selection by
6 The child’s parent or guardian may also request a statutory assessment.

9
observables’, which may be problematic as the selection process is not fully observable to the
analyst. In our study, we try to apply techniques that overcome these problems.
III. Data
The National Pupil Database (NPD) is a census of all pupils in state schools in England.
Available since 2002, it includes measures of each pupil’s attainment in national tests, some
personal information and school identifiers (which can then be linked to school-level data
sets). The personal characteristics include gender, a measure of deprivation (whether the pupil
is known to be eligible to receive Free School Meals), ethnicity, whether English is spoken as
an additional language and whether the pupil is classified as having Special Educational
Needs (SEN). If the pupil is classified as having SEN, information is also provided on SEN
type7 (severe learning difficulties, moderate learning difficulties etc.) and the programme into
which he/she is placed (School Action; School Action Plus; Statemented).
In England, compulsory education is divided into various ‘Key Stages’, after which
there is a national test. In primary school, ‘Key Stage 1’ tests are taken at age 7 and ‘Key
Stage 2’ tests are taken at age 11.8 The tests are set and marked externally to the school. As
there is no grade repetition in the English system, all children within the year group (or grade)
are born within a year of each other.
In this paper, we use information available on all pupils observed in the NPD at age 11
(i.e. the final year of primary school) between 2002 and 2008. For each pupil, we have
information on his/her result at the national test taken at age 79 (Key-stage 1, hereafter KS1),
his/her SEN status during the current academic year, as well as his/her result at the national
7 This information is only available for the last two cohorts
8 In recent years, the test at age 7 has been replaced by teacher assessment. However, the cohorts considered in
this paper all took the test at this age. 9We derive a composite score for Key Stage 1 based on tests in reading, writing and maths. There are six
possible levels on each of these tests (0, 1, 2C, 2B, 2A, 3, 4). We assign a score to each of the six levels (0-6)
and then sum across the three subjects.

10
test taken at the end of the academic year (Key stage 2, hereafter KS2). For each child, we can
construct the average KS1 results of the other pupils in his/her school and year group
(because we know the school identification number of each pupil).
It is important to note that all children have to take national tests in English, Maths and
Science at KS2 and (up to recently) in English and Maths at KS1. This applies to most
children who have special needs, which is one very interesting feature of the English
evaluation system.10
This is not the case in the US for instance, where existing evaluations of
special education programmes have to address the difficult issue of selection into national
tests (only a selected subsample of SEN students undertake the tests).
Within this framework, our first main question is to ask whether school context (as
measured by peers’ average KS1) has an effect on SEN assignment and whether this effect is
significantly stronger for pupils with moderate difficulties early on in primary school (i.e.
low-medium KS1 at age 7). The second main question is to ask whether we observe similar
variation in the effect of school context on pupils’ performance at KS2, which would be
consistent with SEN assignment having an impact on subsequent performance. We then move
on to an analysis where we investigate whether the proportion of pupils assigned to a SEN
programme has an impact on the entire year group (a combination of any direct effect and a
spillover effect).
IV. School Contexts and Distribution of SEN Resources Within Year Groups
Although all schools are likely to classify pupils with more obvious needs as having ‘special
educational needs’, there is plenty of scope for judgment to differ for the many less obvious
cases. In fact, the detection of learning difficulties is likely to depend on what is considered
‘normal’ and this is likely to vary a lot between schools, a higher yardstick being applied in
10
While some children can be exempt from these tests, this is only true for a small minority of children in our
data sets. We have excluded ‘special schools’ from the analysis – where children with very severe levels of need
are often placed.
11
schools where average performance is higher. Of course, children of low enough ability will
plausibly be assigned to a SEN programme regardless of the average performance of their
peers whereas children of high enough ability will never be assigned to a SEN programme.
However, significant variation across school context is likely to occur for pupils with less
serious learning difficulties.
To test this assumption, Figure 1a shows variation across school context (denoted C)
in the relationship between a child’s score at age 7 (KS1) and his/her probability of being
assigned to a SEN programme (i.e., E(T | KS1, C), where T is a dummy indicating access to a
SEN programme). For each school, the ‘school context’ is defined by the mean of the pupils’
test score distribution at age 7. Figure 1a distinguishes between quartiles of the distribution of
this variable across schools.
Interestingly, Figure 1a confirms that highly able pupils (measured at age 7) are almost
never assigned to a SEN programme, regardless of the school context. Also, those at the
bottom of the ability distribution will be assigned to a SEN programme in all school contexts.
In contrast, for those in-between the two extremes, there is a substantial gap between the
probability of being assigned to a SEN programme in a high context school compared to a
low context school. For example, when we focus on a pupil with a score of 5 at age 711
, we
find that the gap between the probability of being assigned to the SEN programme is more
than 20 percentage points higher in top-quartile schools than in bottom-quartile schools (see
Figure 1b).
A higher probability of being assigned to a SEN programme does not necessarily
mean greater access to SEN resources. It may well be that schools which assign more children
to SEN programmes commit less resources per SEN pupil. In such a case, the gap across
schools in the SEN assignment probability for pupils with moderate difficulties does not
11
A score of 5 corresponds to the average score of SEN pupils at age 7.
12
necessarily correspond to a gap in access to SEN resources. To address this issue, we have
matched our dataset to an administrative database which provides information on the average
expenditure per SEN pupil for each school. Using this, we construct a variable (ti) which takes
the value of average SEN expenditure per pupil (in the pupil’s school) in the case when he/she
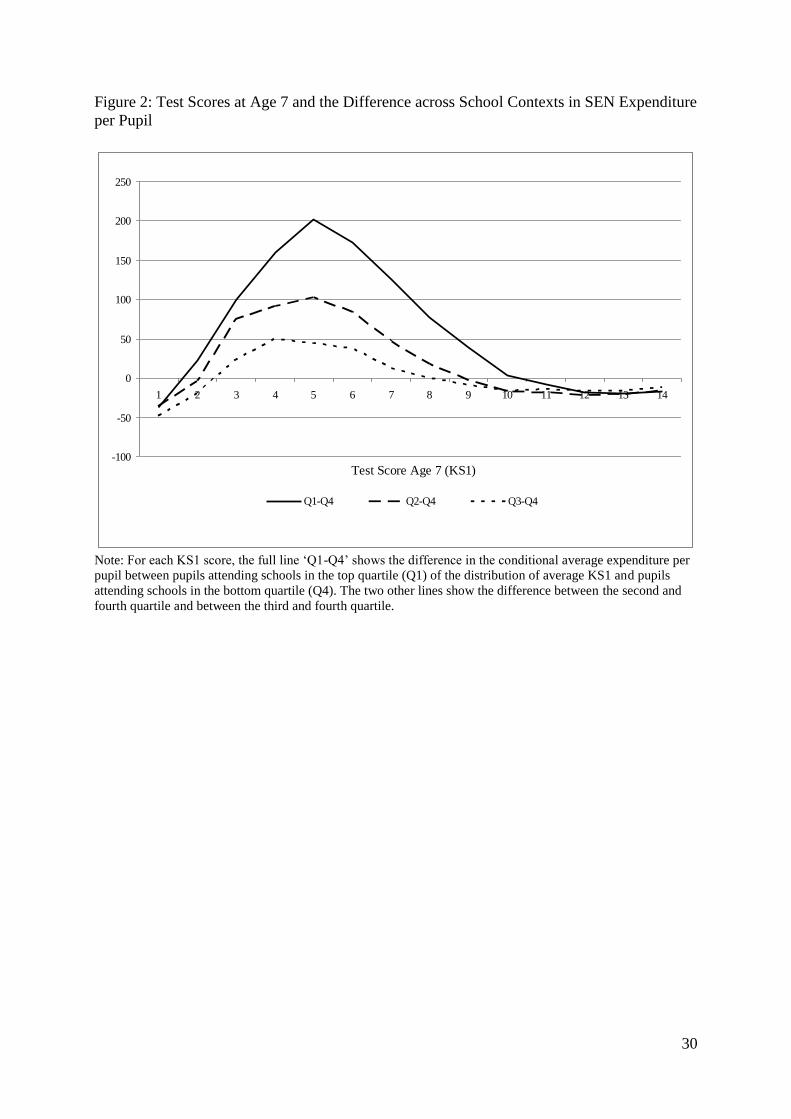
is on a SEN programme and takes the value zero otherwise. It is reassuring to see (Figure 2)
that school context has exactly the same effect on this measure of exposure to SEN
programmes as on the SEN assignment probability. The reason is that school context has no
specific effect on the level of SEN expenditure per pupil. The expenditure per pupil on SEN is
slightly higher in in low-context schools than in high-context schools, but the gap is relatively
small (about 5%-6%) and importantly, is not different for pupils with moderate difficulties
early on in primary schools than it is for other pupils. Thus a higher probability of SEN
assignment corresponds mechanically to higher access to SEN expenditure for these pupils.12
V. School Contexts and Distribution of Performances Within Year Groups
Overall, the highly decentralized nature of SEN policy gives rise to very significant variation
across school context in the distribution of SEN resources within year groups. The next
important question is whether this variation in the distribution of remediation resources is
associated with corresponding variation in the distribution of performance at the end of
primary school.
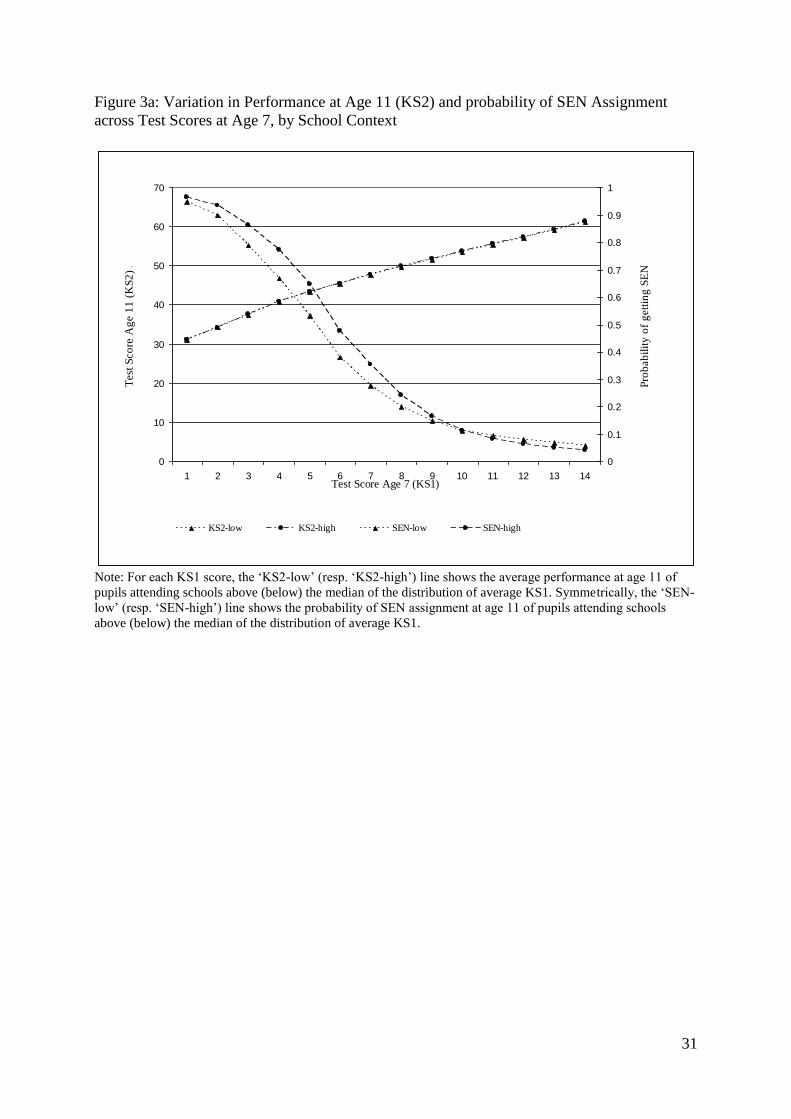
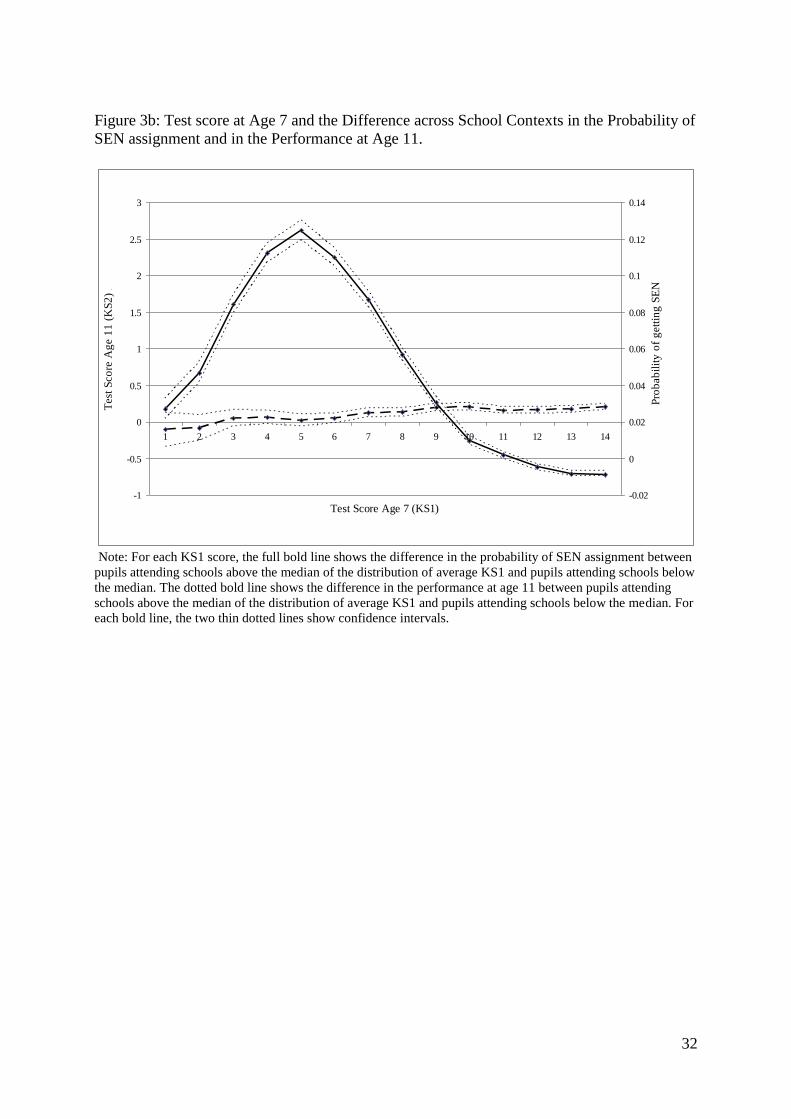
Figures 3a-3b provide a simple test for this hypothesis by comparing the effect of
school context on the distribution of SEN assignment probability and on the distribution of
performance at age 11 across pupils with different age 7 test scores. For the sake of clarity,
we distinguish between only two school contexts: a school is classified as “high context”
12
Formally, we have, E(t | KS1, C)≡ E(t | KS1, C, T =1) × E(T | KS1, C). Hence, if context C has no effect on
average expenditure for pupils on SEN (as measured by E(t | KS1, C, T =1)), then it necessarily has the same
impact on average expenditure E(t | KS1, C) and the assignment probability E(T | KS1, C)).
13
when its pupils’ average test score at age 7 is above the median of the distribution across
schools. These Figures confirm the very strong effect of school context on SEN assignment
for low-medium ability pupils, but reveal that it does not correspond to any shift in academic
performance at age 11. Although “high school context” is associated with slightly better
performance at age 11, the effect is neither more or less important for low-medium ability
pupils than for the other pupils. In fact, we observe the same smooth quasi-linear relationship
between scores at age 7 and scores at age 11 in both contexts (with a one point increase in age
7 scores being associated with a two point increase in age 11 scores).
As a robustness test, Figures A1 and A2 in the Appendix replicate these graphs when
we compare schools in the top and bottom deciles of the distribution of average scores at age
7. The first stage shift in the effect of school context on the probability of being assigned to
SEN (for low-medium ability pupils) is much larger with this specification. However, we do
not find stronger evidence of any positive shift in the effect of school context on test scores at
age 11. If anything, the variation in the effect of school context on age 11 scores is negative
(though not statistically significant).
As additional specification tests, we have constructed similar graphs comparing pupils
attending schools in the 1st and 2
nd quartiles of the distribution of mean KS1 across schools as
well as pupils attending schools in the 3rd
and 4th
quartiles. When we compare the 1st and 2
nd
quartile, the impact of school context on SEN assignment is at a maximum for KS1=4,
whereas the mode is at about KS1=6 when we compare the 3rd
and 4th
quartiles (available on
request). But in both cases, the effect of school context on KS2 results remains small and does
not show any positive peak for low-medium ability pupils. This further confirms that a
significant increase in the SEN assignment probability is not associated with any increase in
subsequent performance, regardless of whether we focus on pupils in schools above or below
the median of average ability.

14
Generally speaking, our Figures suggest that there is no net effect of being assigned to
SEN programmes on the educational performance of pupils with moderate difficulties
compared to other pupils in the same year group. This interpretation relies on the identifying
assumption that the specific increase in the SEN assignment probability for children with low-
medium ability in high-context schools does not relate to any confounding variation in pre-
assignment characteristics. Figure 4 does not reveal any such confounding variation in
observed pre-assignment characteristics. For example, it does not show any specific peak in
the difference across school contexts in the probability of being eligible to receive Free
School Meals for low-medium ability pupils.
V.1. Regression analysis
To further explore the robustness of the relationship between SEN assignment, school context
and early ability, we estimate the following regression,
(1) iiisiisiisi udXCcKSCbKSCaSEN 11)(1)(1)(16 1)713(1
where SEN6i is a dummy indicating SEN assignment at age 11 (year 6), Cs(i) is a school
context dummy indicating whether person i attends a school s(i) in the top half of the test
score distribution at age 7, whereas KS1i represents the score of person i at age 7 and Xi is a
set of control variables which includes a full set of 14 dummies indicating the score at age 7
(i.e. 1(KS1i=k) for k=1,…14). The parameter of interest is a1 which captures the specific
effect of school context on the assignment probability of pupils with low-medium ability at
age 7. Table 2 shows the results of this first-stage regression, which confirm that pupils of
low-medium ability have a significantly higher probability of being assigned to a SEN
programme in high context schools. The estimated difference in SEN assignment is about 5.6
percentage points and this first-stage estimate is not influenced by adding controls for
attainment at age 7, school context, gender, ethnicity, Free School meal status or a dummy
15
indicating that English is second language at home (column 2). Also it is unchanged when we
further control for school fixed effects (column 3), which confirms that observed variation in
SEN assignment across school contexts is not driven by school unobserved heterogeneity.
First stage estimates are all highly significant at standard levels across specifications.
Table 2 also shows the results of the corresponding reduced-form regressions of
performance at age 11 (KS2i) on the same set of explanatory variables as in Eq. (1):
(2) iiisiisiisi udXCcKSCbKSCaKS 22)(2)(2)(2 1)713(12
The results confirm that the relative (age 11) performance of pupils with low-medium ability
is not larger in high context schools. The estimated reduced-form effect is actually small and
negative (about -2% of a SD). It does not vary significantly across specifications, although it
becomes marginally significant when we control for both individual observed heterogeneity
and school fixed effects. Overall, Table 2 provides results that are consistent with the
previous graphical analysis: pupils of low-medium ability have a higher probability of being
assigned to a SEN programme in high context schools, but no higher test scores at KS2.
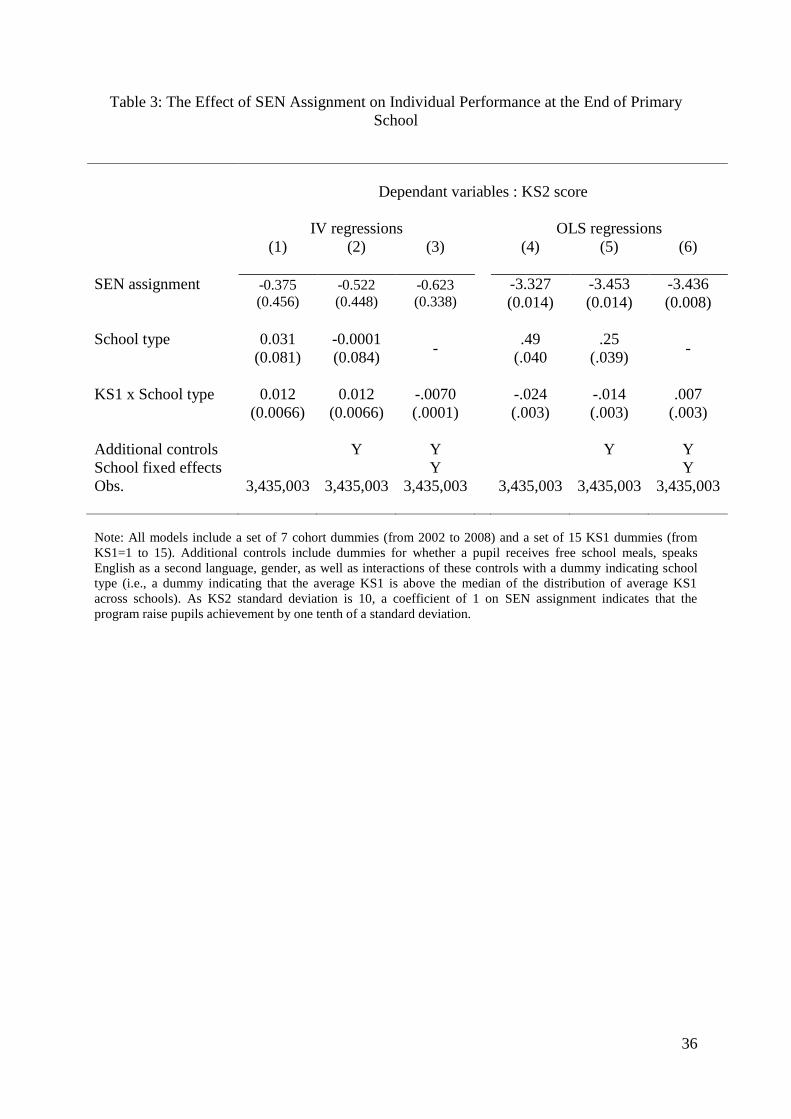
To take this one step further, Table 3 shows the results of the corresponding OLS and
IV regressions of SEN assignment on performance at age 11,
(3) iiisiisii udXCcKSCbSENaKS 33)(3)(363 12
where the IV regressions uses the interaction between school context and whether the
pupil has an age 7 test score in the range from 3 to 7 as an instrumental variable (i.e. Z= Cs(i)
×1(3≤ KS1i≤7)). The identifying assumption is simply that the effect of school context (Cs(i))
on the test score at the end of primary school (KS2i) is neither particularly strong nor
particularly weak for pupils who have a test score at age 7 in the range of 3 to 7, i.e. the very
children for whom we find school context to be a key determinant of access to the SEN
programme. Let us emphasize that we do not constrain the effect of school context to be the
same for pupils with low and high ability (the effect may indeed vary monotonically across

16
ability levels). The only restriction is that there is no specific peak in this effect for pupils
with moderate learning difficulties at age 7.
The OLS results show that pupils involved in a SEN programme have a test score at
age 11 which is about one third of a standard deviation lower than other pupils. It is consistent
with the assumption that selection into a SEN programme is based in part on unobservable
characteristics that are negatively associated with school performance. The IV strategy
plausibly removes these selection effects and yields a causal estimate of the effect of SEN
programmes on age 11 test scores. As expected from first-stage and reduced-form estimates,
the IV estimate is negative, small (about -5% of a SD) and not very precisely estimated. It
becomes marginally significant at standard levels when we control for both observed
individual heterogeneity and school fixed effects.
Note that this causal effect is identified for pupils who are likely to have moderate
difficulties (i.e. whether they are placed on a SEN programme is sensitive to school context)
but not for pupils who would always be placed on a SEN programme (i.e. very severe
difficulties that involve assignment to a SEN programme in all school contexts). Our results
suggest that students with moderate difficulties do not benefit from being involved in the SEN
programme.
V. 4 Alternative specifications
The approach developed in this paper sheds light on whether SEN assignment during the last
year of primary school (i.e. age 11) has an impact on school performance at the end of this
year (i.e. Year 6) using variation in assignment across school contexts (at age 11) as a source
of identification. It is worth emphasising, however, that a small fraction of children are on a
SEN programme at age 10 but not on a SEN programme at age 11. It may be that our
specification does not capture the effect of SEN assignment on these children. To address this

17
issue, it is possible to focus on the effect of SEN assignment the year before Year 6 (i.e. age
10) on performance at KS2 using variation in assignment across school contexts observed at
age 10 (i.e. the mean KS1 scores of peers at age 10) as a source of identification13
. We have
checked that this specification produces exactly the same results as the basic one (see Figure
A3 in the appendix).
Another possible specification test involves focusing on the effect of SEN assignment
in any year between age 7 and 11, and then using variation in assignment across school
context at age 7 as a source of identification.14
Again, the results are very similar.
VI. Spillover Effects of SEN Programmes Across Year Groups
In the previous section, we have found that variation in the difference in performance at Key
Stage 2 between mid and low ability students (or between high and mid-ability students) is
largely unrelated to exogenous variation in the difference in exposure to SEN programmes
between these students. This finding suggests that, within a given school context, SEN
programmes have no significant effect on the relative performance of students who participate
in these programmes compared to other students.
However, it does not necessarily follow that SEN programmes have no effect at all on
students’ outcomes. In particular, it still remains possible that SEN programmes jointly affect
treated and non-treated pupils, i.e. have direct effects on treated pupils and indirect spillover
effects on non-treated students. In such a case, a SEN programme may have no perceptible
effect on the relative performance of treated students compared to the other students in the
same year group, but have a significant effect on the overall performance of the year group.
13
When we use this strategy, we have to exclude the 2002 cohort since the data does not include this cohort
when at age 10. 14
When we use this strategy, we have to focus on the 2006 cohort only, since it is the only one for which we
observe SEN assignment each year between the age of 7 and 11.

18
There are several channels through which a SEN programme may induce spillover
effects. On the one hand, given that SEN programmes are not associated with increases in the
school budget, any new SEN programme (or any increase in the size of the existing
programme) is likely to be associated with a decline in the level of resources allocated to non-
SEN pupils, which may be detrimental to these pupils. If teachers have to spend more time
with SEN pupils, the number of hours spent with non-SEN pupils will decrease.15
On the
other hand, we cannot exclude the possibility that the help provided to low-ability pupils in a
year group has a positive effect on the overall performance of the year group. In particular, it
may be that the overall quality of teaching will be improved by SEN programmes. Teachers
may spend fewer hours with non-SEN pupils, but if these hours are less disrupted by SEN
pupils with behavioural problems, we may observe positive spillover effects on non-SEN
pupils (if only because the class of non-SEN pupils keep on working while SEN pupils are
attending their particular courses). Overall, SEN programmes might well generate spillover
effects on non-SEN pupils, although the sign and magnitude of these effects are difficult to
predict.
In this Section we do not provide a separate identification of direct and spillover
effects, but provide an evaluation of the overall effect of SEN programmes – bearing in mind
that this is likely to be a combination of direct and spillover effects. Specifically, we deliver
an analysis at the level of the year group. We analyse the effect of the proportion of pupils
assigned to a SEN programme on the average performance of pupils. The estimated effect can
be understood as a reduced-form impact at the year-group level.
With respect to identification, we need to isolate a source of variation in the proportion
of SEN pupils in a year group which has no direct effect on the performance of this year
group. To address this issue, we build on demographic shocks which affect the other year
15
Cullen (1997) provides evidence that special education needs programmes may detract from spending on
regular education students.
19
groups in the same school. As discussed below, these shocks directly affect the proportion of
SEN pupils in these other year groups, while also having an indirect effect on the proportion
of SEN pupils in the year group under consideration. This is due to school-level constraints in
the overall size of the SEN programme. Under the maintained assumption that demographic
shocks in other year groups do not have any direct effect on the performance of the year group
under consideration, this provides an interesting tool for identifying the overall effect of the
proportion of SEN pupils in a year group on their average performance. Under the weaker
assumption that adverse shocks in other year groups also reduce access to other school
resources (i.e. not just to SEN resources), this strategy provides an upper bound for the effect
of the SEN programme.
VI. 2 Spillover Effects of SEN assignments Across Year Groups
Existing qualitative evidence and official regulations imply a couple of basic features about
the process of pupil assignment to a SEN programme. First, the overall level of resources
allocated to SEN in a given school is to a large extent determined at the school level and
stable over time. For example, there is typically only one SEN coordinator per school and the
contribution of this key input does not vary substantially from one year to the other. Given
these school level constraints, the amount of SEN resources allocated to a specific year group
at a given time is likely to depend not only on the proportion of pupils with learning
difficulties within this year group, but also on the proportion of pupils with learning
difficulties in other year groups within the same school. In particular, if the year group who
entered into school s at date t0 is followed at date t0+1 by a year group with a relatively high
proportion of pupils with learning difficulties, then the year group who entered at t0 will
undergo a more severe competition for holding on to SEN resources during the five
20
subsequent years after t0+1. Consequently, this year group is likely to have relatively low
access to these resources.
To provide a test for the assumption that younger year groups influence the SEN
resources allocated to older year groups within schools, we need an instrumental variable
which affects the proportion of SEN pupils in the younger year groups, but which is unrelated
to the other potential determinants of SEN resources in the older year groups. One possible
candidate is the proportion of pupils born in August16
within the younger year groups. In the
English system, pupils born in August are the youngest in their year group and it has long
been established that the least mature children within a given year group are also the most
exposed to early learning difficulties.17
Within the English context, a year group with a
relatively high proportion of August born children is likely to be a year group with a relatively
high proportion of pupils with learning difficulties and, consequently, a year group with a
relatively high proportion of SEN pupils. Under the maintained assumption that this is the
only channel through which the proportion of August born pupils in a year group affects the
proportion of SEN pupils within older year groups, the proportion of August born pupils
within a year group can be used as an instrument to identify spillover effects in SEN
assignment across year groups. Specifically, if tskSEN ,, denotes the proportion of SEN pupils
in grade k, school s at date t. Table 4 reports the results of the IV regressions of tsSEN ,,6 on
tsSEN ,,5
(4) tssttsts XSENSEN ,,1,6,,5,,6
16
We have tried to use other aspects of the distribution of month of birth within the younger age group (such as
mean month of birth), but the proportion August born has the strongest first-stage effects. 17
See, for example, Crawford et al. (2007) for England.
21
where we use three alternative sets of control variables18
stX ,6 and where the spillover
effect α is identified using the proportion ( tsAugust ,,5 ) of pupils born in August observed in
grade 5 and school s at date t as an instrumental variable. To start with, the two first columns
of Table 4 show the results of the first stage regressions of tsSEN ,,5 on tsAugust ,,5 which
confirms that the proportion of pupils assigned to a SEN programme in a year group is very
significantly affected by the proportion of pupils born late within the year, even when we
focus on the last grades of primary school. The estimated effect does not vary significantly
across specifications and suggests that a 10 percentage point increase in the proportion of
August born pupils in a year group is associated with a 0.3 percentage point increase in the
proportion of SEN pupils in this year group.
Most interestingly, columns (3) and (4) show that tsAugust ,,5 has also a significant
reduced-form effect on tsSEN ,,6 the proportion of SEN pupils observed in the older year
group. Again, the estimated effect is stable across specifications. It suggests that a 10
percentage point increase in the proportion of August born children in the younger year group
is associated with a decrease of about 0.17 percentage points in the proportion of SEN in the
older year group. The stability of this effect across specifications suggests that the instrument
is not correlated with the other observed determinants of SEN in the older year group. In
Appendix B, we report additional regressions (using the same specifications) providing direct
evidence on the fact that the instrument used in this analysis is not related to the main control
variables. In particular, there is no significant association between the proportion of August
born pupils in the younger year group and the proportion of pupils with low Key Stage 1
results in the older year group.
18
In baseline specification, we only control for school context (as measured by four dummies indicating the
proportion of low KS1 pupils within school s over the period under consideration) whereas the second
specification controls for the size of the year group, various other school-level characteristics including the
proportion of low KS1 pupils in year group 6 in school s at date t
22
Finally, columns (5) and (6) show the corresponding IV regressions of tsSEN ,,6 on
tsSEN ,,5 using August5,s,t as an instrument. They provide estimates for the parameter which
are significant and consistent with previous first-stage and reduced-form analysis. They
suggest that a 10 percentage point increase in the proportion of SEN pupils in year group 5
causes a reduction of 5 percentage points in the proportion of SEN pupils in year group 6.
Overall, our data suggest that there are significant spillover effects from SEN
assignment across year groups. In the next subsection, we build on this externality to provide
an evaluation of the effect of the proportion of pupils assigned to a SEN programme in a year
group on the average performance of pupils in this year group.
VI.3 Proportion of SEN Pupils and Year Group Average Performance
Because of school-level constraints on SEN assignment, the proportion of August born
pupils in a year group significantly affects the proportion of SEN pupils in the older year
group. The next question is whether it also affects average performance for the older year
group. To test this assumption, Table 5 reports the results of regressing the average
performance at KS2 of year group 6 in school s at date t (denoted KS26,s,t) on the proportion of
August born pupils in year group 5 at the same date in the same school,
(5) tssttsts XAugustKS ,,2,6,,5,,62 ,
using the same set of alternative specifications as in Table 4. Variable tsKS ,,62 is standardized
with mean 50 and standard deviation 10. The estimate of the reduced-form effect
of proportion of August born pupils on attainment at KS2 is stable across specifications and is
positively signed (although not statistically significant).
Table 5 also shows the corresponding IV regressions of tsKS ,,62 on tsSEN ,,6 ,
(6) tssttsts XSENKS ,,3,6,,6,,62

23
where August5,s,t is used as an instrument to identify the year-group level effect γ. It provides
an evaluation of the effect of the proportion of SEN pupils in a year group on the average
performance of this year group, under the maintained assumption that the proportion of
August born pupils in a year group affects the average performance of older year groups only
through its spillover effect on SEN assignment in these year groups. Given the normalization
used, the point estimates suggest that a 10 percentage point increase in the proportion of SEN
pupils in a given year group is associated with a decrease of about 13% of a SD in the
average performance at KS2. However, the effects are not significant at conventional levels
(i.e. they are only significant at the 20% level). Nonetheless, they suggest that positive effects
can be ruled out.
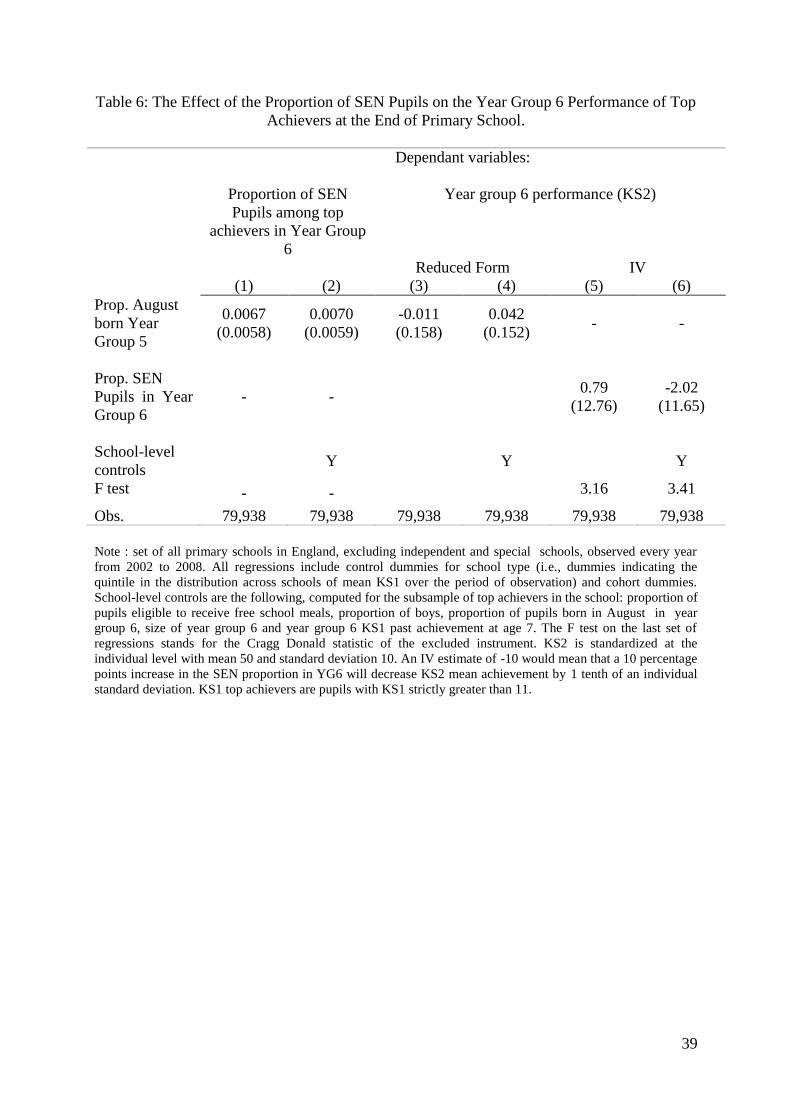
To take this one step further, we have replicated the regression analysis by focusing on
SEN assignment and average KS2 performance of the subgroup of high-ability pupils (KS1
above 11). As expected the instrument August5,s,t has no effect on SEN assignment for this
sub-group (see Columns 1 and 2 of Table 6), which confirms that the instrument affects the
proportion of SEN pupils in year group 6 only because it affects the probability of SEN
assignment for low and mid-ability pupils19
. Given this fact, any effect of the instrument
August5,s,t on the average performance at KS2 of high-ability pupils may be interpreted as
the pure spillover effect of the programme on these pupils. As shown by Columns 3 to 6 of
Table 6, we do not find any such spillover effect. Overall, SEN programmes have had no
significant effect on the relative performance of treated pupils and no significant spillover
effects on the performance of untreated pupils.
19
The sample used in Table 6 is slightly different than the sample used in Tables 4 or 5 due to a small subset of
schools having no high-ability pupils.
24
VII Discussion
Overall, our findings suggest that the programme for Special Educational Needs in England is
ineffective for pupils with moderate difficulties early on in primary school. As discussed
above, a key feature of the programme is its high degree of decentralization. Building on the
existing literature in psychology and education as well as on official reports, this Section
discusses the potential failures of such a system.
To begin with, it is often hypothesised in the literature that being labelled as having
special needs has stigmatizing effects on pupils (compared to similar pupils who are not
labelled), which may generate low self-esteem and worsen subsequent outcomes. Analyzing a
longitudinal survey of about 8,000 American pupils and using Propensity Score Matching
techniques, Morgan et al. (2008) confirm that pupils with a relatively low ex ante probability
of being placed into special education (but who nevertheless were so placed) more frequently
displayed subsequent problems of self-esteem, sadness and anxiety. Also, they found that
these pupils displayed significantly lower reading and mathematical skills at the end of
primary school than closely matched peers who did not receive special education services. In
fact, one issue with being labelled as SEN may be that it makes pupils (and families) attribute
causes of low performance to low intrinsic ability rather than to lack of effort. As it happens,
modern theories of cognition argue that the propensity to attribute causes of negative
outcomes (such as failure at school) to stable self-referent terms (such as low personal ability)
is a determinant of depression and hopelessness (Abramson et al., 1978). Using a sample of
about 1,800 Norwegian pupils and Path Analysis techniques, Valas (2001) confirms that
children who attribute the causes of failure at school to ability rather than to effort have on
average lower self-esteem, expect less from increased efforts in the future and perform less
well at school.

25
Another general issue with labelling children as having SEN is that it can change
teachers’ perceptions and expectations (see Fogel and Nelson, 1983). According to a recent
report of English School Inspectorates (OfSTED, 2004), lack of expectation is actually one
important reason for why pupils on SEN make too little progress. The report argues that in six
out of ten primary and secondary school visited, expectations of improvement in reading and
writing were too low.
Another general criticism is that labelling specific children as “special needs” often
induces schools to treat them separately and differently rather than to adapt the regular class
(Ho, 2004). A report by the Qualifications and Curriculum Authority (QCA, 2004) confirms
that ‘when a child is identified as having SEN, a whole set of processes and structures come
into operation. While these may be valuable in bringing a rigour to planning and possibly
extra resources, they also imply a separateness that can be unhelpful. For example, the
presence of a learning support assistant may mean that the class teacher gives less attention to
a child with SEN’. Similar problems are emphasized by OfSTED (2004) who reports that
SEN pupils are kept out of the main class for too much of the day, isolated from their peers
and deprived of access to a broad curriculum and the classroom teacher.
Additional problems may also come from the highly decentralized nature of this type
policy and lack of central monitoring and regulations. As discussed in this paper, it generates
strong inequalities in the probability of treatment across children with similar learning
difficulties, but it may also be one explanation for why the teaching of pupils with SEN is of
varying quality and not necessarily adequate. The Audit Commission (2002) confirms that ‘a
lack of systematic monitoring by schools and Local Education Authorities means that poor
practice may go unchallenged’. Their survey found that only half of Local Education
Authorities were systematically monitoring schools’ work on SEN. The report also suggests
that one of the reasons why schools and Local Education Authorities have difficulty analyzing
26
the performance of children with SEN is a lack of national benchmarks for children with
learning difficulties. Similar conclusions are reported by OfSTED (2004), which also finds
that few schools evaluate their provision for pupils with SEN systematically. More recent
research reported by Wilkins (2008) finds that only 47 per cent of Local (Education)
Authorities detail the help they are providing for SEN children on their websites and only 27
percent explain the funding of School Action and School Action Plus; only 29 percent of
authorities explained how they monitored the effectiveness of SEN spending (another legal
requirement). OfSTED (2004) suggest that lack of provision of appropriate data at Local
Authority level means that they cannot easily compare how well they are doing with the
lowest-attaining pupils compared with other schools and that this weakens the drive to
challenge underachievement.
VIII. Conclusion
Remediation programmes are difficult to evaluate because the selection process is not fully
observed by analysts and those pupils who are selected are likely to be relatively low
achievers. In this paper, we build on the highly decentralized nature of the Special
Educational Needs programme in England to evaluate whether increased access to the
programme for a year group, or for a group of pupils within a year group, is accompanied by
an increase in the relative performance of this year group or this group of pupils.
We first demonstrate that the probability of assignment to a SEN programme is much
more sensitive to school context for the group of children with low-mid ability than for other
children. Specifically the group of pupil with low-mid ability will have a relatively high
probability of being placed on a SEN programme in a ‘high context’ school (i.e. where the
average ability of peers is higher), but a relatively low probability in a ‘low context’ school.
Secondly, we show that this variation in the relative probability of SEN assignment does not

27
translate into variation in the relative performance of the group of children with low-mid
ability compared to other children within the same year group. This suggests that SEN
programmes have no effect on relative performance for the marginal pupil with moderate
learning difficulties compared to other pupils within the same year group.
One possible reason for why we see no effect may be that other children in the same
year group are indirectly affected by the SEN programme. In particular, high ability pupils
might indirectly benefit from low-mid ability pupils being put into a SEN programme if this
improves the quality of the class (e.g. if more SEN students are taken out of the classroom
and this includes some additional badly behaved pupils). In such a case, SEN programmes
could improve the average performance of all pupils in the year group, even though they do
not necessarily improve the relative performance of the treated. The second main contribution
of the paper is to test for such year group effects, using exogenous demographic shocks that
affect the distribution of SEN resources across the different year groups. Specifically, we
build on the fact that an unusually large fraction of relatively young pupils within a year
group (i.e. a relatively large fraction of August born pupils) increases the probability of SEN
assignment for this year group, but decreases it for the other year groups in the same school
(because of overall budget constraints). Under the assumption that this type of shock affects
other year groups only through the reallocation of SEN resources, we are able to use the
proportion of relatively young children in a year group as an instrument for identifying the
impact of the proportion of SEN students in the other year groups. As it turns out, this
analysis rules out positive effects at the year group level – confirming that the SEN policy
has, at best, a negligible overall impact.
Overall, the different parts of our analysis suggest that SEN policies are not effective
in achieving their stated aims. Therefore the ways in which vulnerable children are helped by
school-level initiatives need to be reconsidered.

28
References
Abramson, L.Y. , M. E. Seligman and J. D. Teasdale, (1978), Learned helplessness in
humans: Critique and reformulation, Journal of Abnormal Psychology. 87(1)
Audit Commission, (2002), Special Educational Needs: A Mainstream Issue, London
Crawford, C., L. Dearden, and C. Meghir, (2007), When you are born matters: the impact of
date of birth on child cognitive outcomes in England. IFS Report. October 2007.
Crawford, C., and A. Vignoles, (2010), An Analysis of the Educational Progress of Children
with Special Educational Needs. Department of Quantitative Social Science. Working
Paper No. 10-19. Institute of Education. University of London.
Cullen, J., (1997), Essays on Special education Finance and Intergovernmental Relations,
PhD Dissertation, MIT.
Fogel, L. and R. Nelson (1983), The effects of special education labels on teachers behavioral
observations, checklist scores, and grading of academic work, Journal of School
Psychology 3(21)
Ho, Anita. (2004) To be Labeled, or Not to be Labeled: That is the Question. British Journal
of Learning Disabilities 32(2):86-92.
Keslair, F., and S. McNally, (2009), ‘Special Educational Needs in England’. Report to the
National Equality Panel. July 2009.
http://www.equalities.gov.uk/pdf/Special%20Educational%20Needs%20in%20England.pdf
Hanushek, E.A., J.F.Kain and S.G. Rivkin, (2002), ‘Inferring Program Effects For Special
Populations: Does Special Education Raise Achievement for Students with
Disabilities?’ Review of Economics and Statistics, 84(4)
Manacorda, M., (2010), The Cost of Grade Retention. Review of Economics and Statistics.
Forthcoming.
Morgan P L., M. L. Frisco, G. Farkas, J. Hibel (2008), A Propensity Score Matching Analysis
of the Effects of Special Education Services
Journal of Special Education
OfSTED, (2004), Special Educational Needs and Disability: Towards Inclusive Schools, HMI
2276.
Qualifications and Curriculum Authority, (2004), Inclusive Learning: 2002/3 Annual Report
on Curriculum and Assessment. London.
Schlosser, A., and V. Lavy, (2005), Targeted Remedial Education for Underperforming
Teenagers: Costs and Benefits, Journal of Labor Economics, 23(4).
Valås, Harald, (2001), Learned Helplessness and Psychological Adjustment II: effects of
learning disabilities and low achievement, Scandinavian Journal of Educational
Research, 45(2)
Wilkins, L., (2008), Learning the Hard Way: A Strategy for Special Educational Needs.
Policy Exchange. Centre:Forum.

29
Figure 1a: Test Scores at Age 7 and Probability of SEN Assignment, by School Context
0
0.1
0.2
0.3
0.4
0.5
0.6
0.7
0.8
0.9
1
1 2 3 4 5 6 7 8 9 10 11 12 13 14
Test Score Age 7 (KS1)
Prob
abili
ty
Q4 Q3 Q2 Q1
Note: For each KS1 score, the full line ‘Q1’ shows the probability of SEN assignment for pupils attending
schools in the top quartile of the distribution of average KS1. The three other lines show the probability of SEN
assignment for the three other quartiles.
Figure 1b: Test Scores at Age 7 and the Difference across School Contexts in the Probability
of SEN Assignment.
-0.05
0
0.05
0.1
0.15
0.2
0.25
1 2 3 4 5 6 7 8 9 10 11 12 13 14
Test Score Age 7 (KS1)
Prob
abilt
y of
get
ting
SEN
Q1-Q4 Q2-Q4 Q3-Q4
Note: For each KS1 score, the full line ‘Q1-Q4’ shows the difference in the probability of SEN assignment
between pupils attending schools in the top quartile (Q1) of the distribution of average KS1 and pupils attending
schools in the bottom quartile (Q4). The two other lines show the difference between second and fourth quartile
and between third and fourth quartile.
30
Figure 2: Test Scores at Age 7 and the Difference across School Contexts in SEN Expenditure
per Pupil
-100
-50
0
50
100
150
200
250
1 2 3 4 5 6 7 8 9 10 11 12 13 14
Test Score Age 7 (KS1)
Q1-Q4 Q2-Q4 Q3-Q4
Note: For each KS1 score, the full line ‘Q1-Q4’ shows the difference in the conditional average expenditure per
pupil between pupils attending schools in the top quartile (Q1) of the distribution of average KS1 and pupils
attending schools in the bottom quartile (Q4). The two other lines show the difference between the second and
fourth quartile and between the third and fourth quartile.
31
Figure 3a: Variation in Performance at Age 11 (KS2) and probability of SEN Assignment
across Test Scores at Age 7, by School Context
0
10
20
30
40
50
60
70
1 2 3 4 5 6 7 8 9 10 11 12 13 14Test Score Age 7 (KS1)
Test
Sco
re A
ge 1
1 (
KS
2)
.
0
0.1
0.2
0.3
0.4
0.5
0.6
0.7
0.8
0.9
1
Pro
bab
ilit
y o
f g
ett
ing
SE
N .
KS2-low KS2-high SEN-low SEN-high
Note: For each KS1 score, the ‘KS2-low’ (resp. ‘KS2-high’) line shows the average performance at age 11 of
pupils attending schools above (below) the median of the distribution of average KS1. Symmetrically, the ‘SEN-
low’ (resp. ‘SEN-high’) line shows the probability of SEN assignment at age 11 of pupils attending schools
above (below) the median of the distribution of average KS1.
32
Figure 3b: Test score at Age 7 and the Difference across School Contexts in the Probability of
SEN assignment and in the Performance at Age 11.
-1
-0.5
0
0.5
1
1.5
2
2.5
3
1 2 3 4 5 6 7 8 9 10 11 12 13 14
Test Score Age 7 (KS1)
Test
Sco
re A
ge 1
1 (
KS
2)
.
-0.02
0
0.02
0.04
0.06
0.08
0.1
0.12
0.14
Pro
bab
ilit
y o
f g
ett
ing
SE
N .
Note: For each KS1 score, the full bold line shows the difference in the probability of SEN assignment between
pupils attending schools above the median of the distribution of average KS1 and pupils attending schools below
the median. The dotted bold line shows the difference in the performance at age 11 between pupils attending
schools above the median of the distribution of average KS1 and pupils attending schools below the median. For
each bold line, the two thin dotted lines show confidence intervals.

33
Figure 4: Test Score at Age 7 and the Difference across School Contexts in the Probability of
SEN assignment and in the Performance at Age 11.
-0.2
-0.15
-0.1
-0.05
0
0.05
0.1
1 2 3 4 5 6 7 8 9 10 11 12 13 14
Test Score Age 7 (KS1)
Pro
bab
ilit
y
.
Free School meals Male English as a second language
Note: For each KS1 score, the full bold line shows the difference in the probability of Free School Meals
between pupils attending schools above the median of the distribution of average KS1 and pupils attending
schools below the median. The two other lines show difference in proportion of male students and difference in
the proportion of students having English as a second language.
34
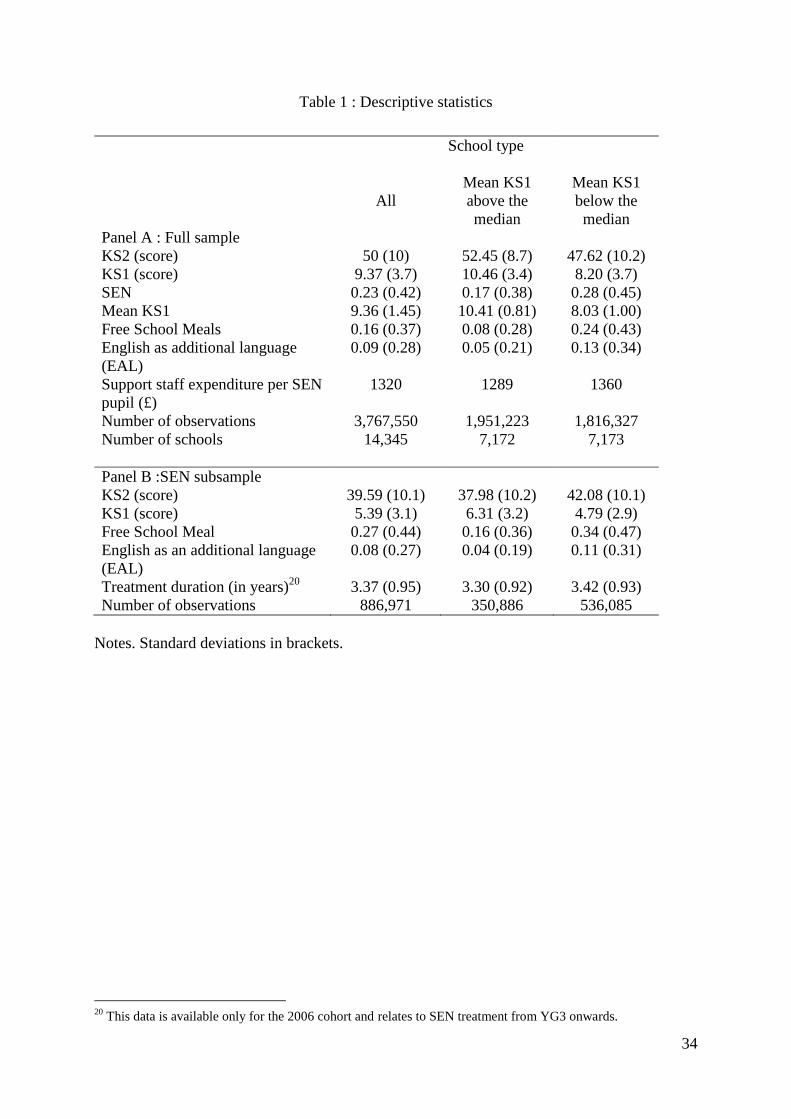
Table 1 : Descriptive statistics
School type
All
Mean KS1
above the
median
Mean KS1
below the
median
Panel A : Full sample
KS2 (score) 50 (10) 52.45 (8.7) 47.62 (10.2)
KS1 (score) 9.37 (3.7) 10.46 (3.4) 8.20 (3.7)
SEN 0.23 (0.42) 0.17 (0.38) 0.28 (0.45)
Mean KS1 9.36 (1.45) 10.41 (0.81) 8.03 (1.00)
Free School Meals 0.16 (0.37) 0.08 (0.28) 0.24 (0.43)
English as additional language
(EAL)
0.09 (0.28) 0.05 (0.21) 0.13 (0.34)
Support staff expenditure per SEN
pupil (£)
1320 1289 1360
Number of observations 3,767,550 1,951,223 1,816,327
Number of schools 14,345 7,172 7,173
Panel B :SEN subsample
KS2 (score)
39.59 (10.1)
37.98 (10.2)
42.08 (10.1)
KS1 (score) 5.39 (3.1) 6.31 (3.2) 4.79 (2.9)
Free School Meal 0.27 (0.44) 0.16 (0.36) 0.34 (0.47)
English as an additional language
(EAL)
0.08 (0.27) 0.04 (0.19) 0.11 (0.31)
Treatment duration (in years)20
3.37 (0.95) 3.30 (0.92) 3.42 (0.93)
Number of observations 886,971 350,886 536,085
Notes. Standard deviations in brackets.
20
This data is available only for the 2006 cohort and relates to SEN treatment from YG3 onwards.

35
Table 2:Variation in the relative outcomes of low-medium ability students across school types
Dependent variables :
SEN assignment (first stage) KS2 score (reduced form)
(1) (2) (3) (4) (5) (6)
KS1 in [3-7]
×School type
.056
(.0015)
.056
(.0015)
.057
(.001)
-.021
(.025)
-.029
(.025)
-.035
(.019)
School type
.084
(.0021)
.095
(.0021)
.105
(.002)
.000
(.051)
-.049
(.051)
-1.10
(.032)
KS1 x School type
-.0068
(.0001)
-.0070
(.0001)
-.0070
(.0001)
.015
(.004)
.016
(.004)
.007
(.003)
Additional controls
Y
Y
Y
Y
School fixed effects Y Y
Obs. 3,435,003 3,435,003 3,435,003 3,435,003 3,435,003 3,435,003
Note: All models include a set of 7 cohort dummies (from 2002 to 2008) and a set of 15 KS1 dummies (from
KS1=1 to 15). Additional controls include dummies for eligibility to receive free school meals; whether English
is spoken as an additional language; gender; as well as interactions of these controls with a dummy indicating
school type (i.e. a dummy indicating that the average KS1 is above the median of the distribution of average KS1
across schools). As KS2 standard deviation is 10, a coefficient of 1 on SEN assignment indicates that the
programme raise pupil achievement by one tenth of a standard deviation.
36
Table 3: The Effect of SEN Assignment on Individual Performance at the End of Primary
School
Dependant variables : KS2 score
IV regressions OLS regressions
(1) (2) (3) (4) (5) (6)
SEN assignment -0.375
(0.456) -0.522
(0.448) -0.623
(0.338) -3.327
(0.014)
-3.453
(0.014)
-3.436
(0.008)
School type
0.031
(0.081)
-0.0001
(0.084)
-
.49
(.040
.25
(.039)
-
KS1 x School type
0.012
(0.0066)
0.012
(0.0066)
-.0070
(.0001)
-.024
(.003)
-.014
(.003)
.007
(.003)
Additional controls
Y
Y
Y
Y
School fixed effects Y Y
Obs. 3,435,003 3,435,003 3,435,003 3,435,003 3,435,003 3,435,003
Note: All models include a set of 7 cohort dummies (from 2002 to 2008) and a set of 15 KS1 dummies (from
KS1=1 to 15). Additional controls include dummies for whether a pupil receives free school meals, speaks
English as a second language, gender, as well as interactions of these controls with a dummy indicating school
type (i.e., a dummy indicating that the average KS1 is above the median of the distribution of average KS1
across schools). As KS2 standard deviation is 10, a coefficient of 1 on SEN assignment indicates that the
program raise pupils achievement by one tenth of a standard deviation.

37
Table 4: The Effect of the Proportion of SEN Pupils in Year Group 5 on the Proportion of
SEN Pupils in Year Group 6.
Dependant variables:
Prop. SEN Pupils in
Year Group 5
Prop. SEN Pupils in Year Group 6
First Stage Reduced Form IV
(1) (2) (3) (4) (5) (6)
Prop. August
born Year
Group 5
0.029
(0.007)
0.030
(0.007)
-0.017
(0.007)
-0.017
(0.007) - -
Prop. SEN
Pupils in Year
Group 5
- - - - -0.610
(0.346)
-0.578
(0.316)
School-level
controls Y Y Y
F test - - - - 16.4 18.2
Obs. 81,208 81,208 81,208 81,208 81,208 81,208
Note : set of all primary schools in England, excluding independent and special schools, observed every year
from 2002 to 2008. All regressions include control dummies for school type (i.e., dummies indicating the
quintile in the distribution across schools of mean KS1 over the period of observation) and cohort dummies.
School-level controls are the following: proportion eligible to receive free school meals, proportion of boys,
proportion of pupils born in August in year group 6, size of year group 6 and year group 6 KS1 past
achievement at age 7. The F test on the last set of regressions stands for the Cragg Donald statistic of the
excluded instrument.

38
Table 5: The Effect of the Proportion of SEN Pupils on the Year Group 6 Performance at the
End of Primary School
Dependant variables:
Proportion SEN Pupils
in Year Group 6
Year group 6 performance (KS2)
First Stage Reduced Form IV
(1) (2) (3) (4) (5) (6)
Prop. August
born Year
Group 5
-0.017
(0.007)
-0.017
(0.007)
0.238
(0.185)
0.234
(0.173) - -
Prop. SEN
Pupils in Year
Group 6
- - - - -13.37
(10.12)
-13.38
(9.98)
School-level
controls Y Y Y
F test - - - - 5.88 6.21
Obs. 81,208 81,208 81,208 81,208 81,208 81,208
Note : set of all primary schools in England, excluding independent and special schools, observed every year
from 2002 to 2008. All regressions include control dummies for school type (i.e., dummies indicating the
quintile in the distribution across schools of mean KS1 over the period of observation) and cohort dummies.
School-level controls are the following: proportion eligible to receive free school meals, proportion of boys,
proportion of pupils born in August in year group 6, size of year group 6 and year group 6 KS1 past
achievement at age 7. The F test on the last set of regressions stands for the Cragg Donald statistic of the
excluded instrument.
39
Table 6: The Effect of the Proportion of SEN Pupils on the Year Group 6 Performance of Top
Achievers at the End of Primary School.
Dependant variables:
Proportion of SEN
Pupils among top
achievers in Year Group
6
Year group 6 performance (KS2)
Reduced Form IV
(1) (2) (3) (4) (5) (6)
Prop. August
born Year
Group 5
0.0067
(0.0058)
0.0070
(0.0059)
-0.011
(0.158)
0.042
(0.152) - -
Prop. SEN
Pupils in Year
Group 6
- -
0.79
(12.76)
-2.02
(11.65)
School-level
controls Y Y Y
F test - - 3.16 3.41
Obs. 79,938 79,938 79,938 79,938 79,938 79,938
Note : set of all primary schools in England, excluding independent and special schools, observed every year
from 2002 to 2008. All regressions include control dummies for school type (i.e., dummies indicating the
quintile in the distribution across schools of mean KS1 over the period of observation) and cohort dummies.
School-level controls are the following, computed for the subsample of top achievers in the school: proportion of
pupils eligible to receive free school meals, proportion of boys, proportion of pupils born in August in year
group 6, size of year group 6 and year group 6 KS1 past achievement at age 7. The F test on the last set of
regressions stands for the Cragg Donald statistic of the excluded instrument. KS2 is standardized at the
individual level with mean 50 and standard deviation 10. An IV estimate of -10 would mean that a 10 percentage
points increase in the SEN proportion in YG6 will decrease KS2 mean achievement by 1 tenth of an individual
standard deviation. KS1 top achievers are pupils with KS1 strictly greater than 11.

40
Appendix A: Robustness tests for the individual level regressions
Figure A1: Variation in Performance at Age 11 (KS2) and probability of SEN Assignment
across Test Scores at Age 7, by School Context (extreme deciles)
0
10
20
30
40
50
60
70
1 2 3 4 5 6 7 8 9 10 11 12 13 14
Test Score Age 7 (KS1)
Test S
core
Age 1
1 (
KS
2)
.
0
0.1
0.2
0.3
0.4
0.5
0.6
0.7
0.8
0.9
1
Pro
bab
ilit
y o
f g
ett
ing
SE
N
.
KS2-lowest KS2-highest SEN-lowest SEN-highest
For each KS1 score, the ‘KS2-lowest’ (resp. ‘KS2-highest’) line shows the average performance at age 11 of
pupils attending schools in the worse (best) decile of the distribution of average KS1. Symmetrically, the ‘SEN-
lowest’ (resp. ‘SEN-highest’) line shows the probability of SEN assignment at age 11 of pupils attending schools
in the worse (best) decile of the distribution of average KS1.
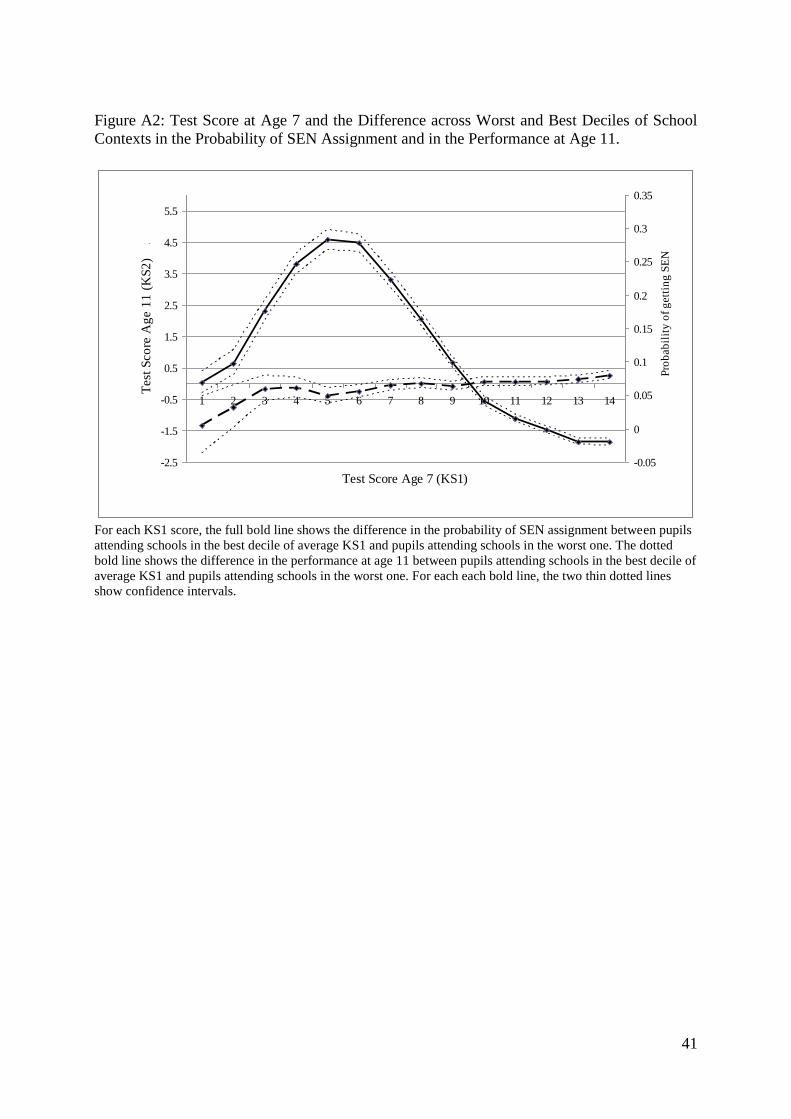
41
Figure A2: Test Score at Age 7 and the Difference across Worst and Best Deciles of School
Contexts in the Probability of SEN Assignment and in the Performance at Age 11.
-2.5
-1.5
-0.5
0.5
1.5
2.5
3.5
4.5
5.5
1 2 3 4 5 6 7 8 9 10 11 12 13 14
Test Score Age 7 (KS1)
Test
Sco
re A
ge 1
1 (
KS
2)
.
-0.05
0
0.05
0.1
0.15
0.2
0.25
0.3
0.35
Pro
bab
ilit
y o
f g
ett
ing
SE
N .
For each KS1 score, the full bold line shows the difference in the probability of SEN assignment between pupils
attending schools in the best decile of average KS1 and pupils attending schools in the worst one. The dotted
bold line shows the difference in the performance at age 11 between pupils attending schools in the best decile of
average KS1 and pupils attending schools in the worst one. For each each bold line, the two thin dotted lines
show confidence intervals.
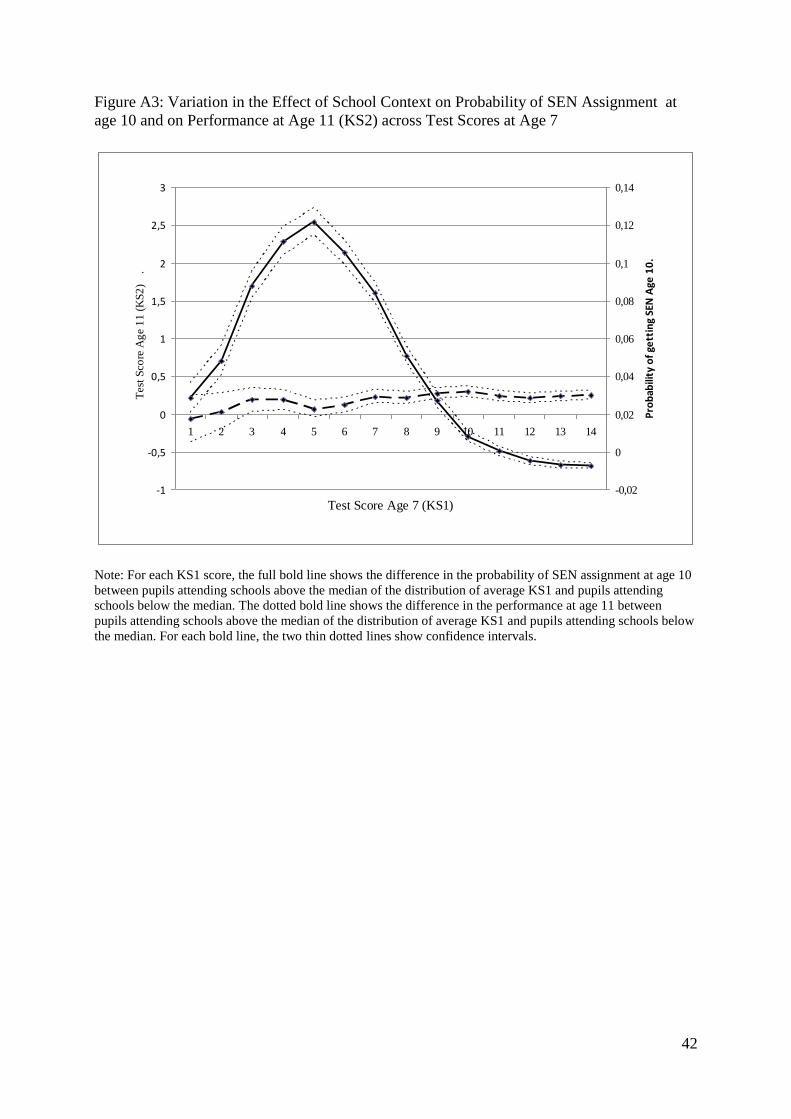
42
Figure A3: Variation in the Effect of School Context on Probability of SEN Assignment at
age 10 and on Performance at Age 11 (KS2) across Test Scores at Age 7
-1
-0,5
0
0,5
1
1,5
2
2,5
3
1 2 3 4 5 6 7 8 9 10 11 12 13 14
Test Score Age 7 (KS1)
Test
Sco
re A
ge 1
1 (
KS
2)
.
-0,02
0
0,02
0,04
0,06
0,08
0,1
0,12
0,14
Pro
bab
ility
of
gett
ing
SEN
Age
10
.
Note: For each KS1 score, the full bold line shows the difference in the probability of SEN assignment at age 10
between pupils attending schools above the median of the distribution of average KS1 and pupils attending
schools below the median. The dotted bold line shows the difference in the performance at age 11 between
pupils attending schools above the median of the distribution of average KS1 and pupils attending schools below
the median. For each bold line, the two thin dotted lines show confidence intervals.

43
Appendix B: Robustness test for the school level regressions
Table B1: Relationships between The Proportion of August born Pupils in Year Group 5 and
The Demographic Characteristics of Year Group 6.
Dependant Variables:
Mean KS1
YG6
FSM prop
YG6
Male Prop
YG6
Mean MoB
YG6
(1) (2) (3) (4)
Proportion August
Born Year Group 5
-0.016
(0.054)
-0.0063
(0.0069)
-0.0075
(0.0065)
-0.0026
(0.0044)
Observations 81,208 81,208 81,208 81,208
Note: All regressions in a set of dummies controlling for school type (i.e., dummies indicating the quintile in the
distribution across schools of mean KS1 over the period of observation) and additional control dummies:
proportion of pupils eligible to receive free school meals, proportion of boys, proportion of pupils born in
August in year group 6, size of year group 6 and year group 6 KS1 past achievement at age 7 (excluding the
dependant variable)