
EveMicrobial Phylogenomics (EVE161) Class 9
28
-
Upload
jonathan-eisen -
Category
Science
-
view
357 -
download
4
Transcript of EveMicrobial Phylogenomics (EVE161) Class 9


Problem Set Due Tuesday• For each figure in this paper
• 1) Write a question for other students to answer about the methods used in the figure
• 2) Write a question for other students to answer about the results or conclusions of the figure
• 3) Write a question for instructors about something you do not understand in the figure.

Fig. 1Bacterial community distance within and between indoor surfaces. A subset of studies from similar indoor environments was analyzed (Colorado kitchen surfaces, Colorado restroom surfaces, South Korea restroom and kitchen surfaces, and North Carolina kitchen and restroom surfaces), and figures show the density of unweighted UniFrac pairwise distances (a) within restrooms, within kitchens, and between restrooms and kitchen, as well as (b) within toilets, within fridges, and between toilets and fridges. Results indicate that the bacterial OTUs found on these surfaces tend to be more similar to each other than between surfaces

Fig. 2 Sources tracking of indoor environments. A subset of samples from each of the studies (see Table 1) was analyzed
using the SourceTracker algorithm to apportion microbial sources for different “sinks” of indoor settings. Prominent
sources were outdoor air, skin, soil, and laboratory kits (a), although the likelihood of identifying sources varied strongly
by study. b Those studies that were more likely to have sources identified were those that originally included source
environment samples (using their own sampling and laboratory methods—denoted by asterisk in the figure),
contained samples that were more strongly sourced from skin, or targeted the same variable region as those in the
source samples

Contamination is a critical issue in high-throughput metagenomic studies, yet progress towards a comprehensive
solution has been limited. We present SourceTracker, a Bayesian approach to estimating the proportion of a novel
community that comes from a set of source environments. We apply SourceTracker to new microbial surveys from neonatal intensive care units (NICUs), offices, and molecular biology
laboratories, and provide a database of known contaminants for future testing.

Based on our results, simple analytical steps can be suggested for tracking sources and assessing contamination
in newly acquired data sets. Although source-tracking estimates are limited by the comprehensiveness of the source environments used for training, large-scale projects such as the Earth Microbiome Project will dramatically expand the
availability of such resources. SourceTracker is applicable not only to source tracking and forensic analysis in a wide variety of microbial community surveys (e.g., “where did this biofilm come from?”), but also to shotgun metagenomics and other
population genetics data. We have made our implementation of SourceTracker available as an R package (http://
sourcetracker.sf.net), and we advocate automated tests of deposited data to screen samples that may be contaminated
prior to deposition.

Key Lesson
• You don’t have to know exactly how something works in order to make some use of it


Fig. 3 Principal coordinate analysis (PCoA) of bacteria in the 16 “sink” studies in this meta-analysis. Communities are compared using the unweighted UniFrac distance metric. a Studies cluster generally by study identity, and the top ten indicator taxa (triangles) are indicative of human-associated bacteria as well as outdoor-derived taxa. b Bacterial community composition also tend to group by the matrix type (the physical sample type) as well as the way the building is used (c)


Difference between taxonomic and phylogenetic distance methods. Points from four studies of similar indoor environments (restroom and kitchen surfaces) are colored by study and analyzed by the Canberra community distance (a) and unweighted Unifrac (b). Similarly, points colored by sequencing protocols (including different primers and platforms) differ according to the Canberra distance (c) and the unweighted Unifrac (d)

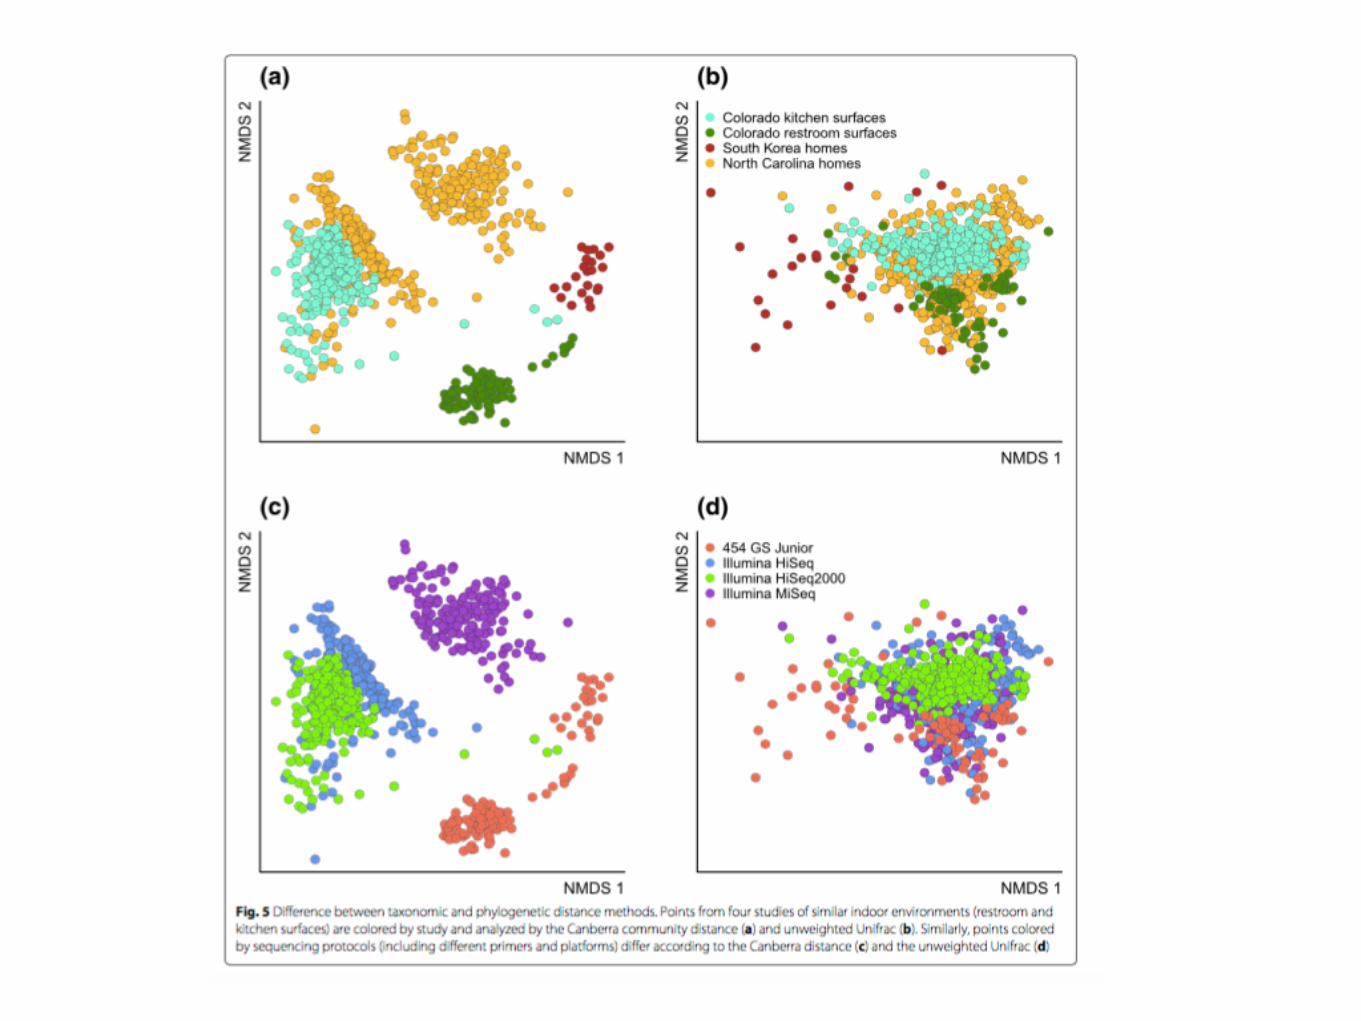


Fig. 6Closed and open-reference OTU picking yielded similar β-diversity results. Three pairs of studies were separately analyzed using the two OTU picking methods and then compared using Procrustes analysis. Each point is the result of open-reference OTU picking, and each arrowhead is the same sample from closed-reference OTU picking. A significant Procrustes statistic indicates that the results from β-diversity analysis are strongly correlated. The same sample across the two methods are linked with an arrow. a California dairy and neonatal intensive care unit, both near Davis, California; b North Carolina homes in and near Raleigh, North Carolina, and Boulder, Colorado residential kitchen surfaces; c Oregon classroom air and surface samples from Eugene. Although the California Dairy study appears to be different between the two methods (a), the Dairy site was statistically distinct from the paired NICU study regardless of OTU picking method


Fig. 7Example of taxonomic bias observed in technical control samples compared to environmental samples. The composition of each of the pooled a dust, b kit controls, and c surfaces samples is shown as a donut. The “kit microbiome” displayed higher abundances of the bacterial phylum Tenericutes (green slice in the donut chart indicated by arrows). Per-sample abundance of Tenericutes is represented by green bars displayed across all panels. Some samples in the North Carolina homes study showed similar levels of Tenericutes compared to the kit controls (c, far right); this implies some level of contamination in non-control environmental samples from this study, which the authors identified and removed in the original study [9]. Donut and bar charts were generated using the Phinch data visualization framework [63]

OTUs were considered to be contaminants if they were present in at least 25% of control samples from either sequencing run