EVAPORATION LOSS OF AMMONIUM NITRATE … · Yu-Hsiang Cheng and Chuen-Jinn Tsai* ... D_v~ diffusion...
15
Pergamon PII: S0021-8502(97) 00033-5 J. Aerosol Sci. Vol.28. No. 8. pp. 1553 1567.1997 ~? 1997Elsevier Science Ltd. All rights reserved Printed in Great Britain 0021-8502/97 $17.00 + 0.00 EVAPORATION LOSS OF AMMONIUM NITRATE PARTICLES DURING FILTER SAMPLING Yu-Hsiang Cheng and Chuen-Jinn Tsai* Institute of Environmental Engineering, National Chiao Tung University, No. 75, Poai St., Hsin Chu, Taiwan, R.O.C. (First received 20 February 1997; and in final form 9 May 1997) Abstract--This study examines the evaporation loss of submicron, monodisperse ammonium nitrate particles during filter sampling when the upstream saturation ratio is zero. The proposed model has considered the upstream particle concentration, the porosity of the particle bed, particle diameter, upstream temperature, pressure drop. According to the present results, upstream particle concentration heavily influences the evaporation loss of ammonium nitrate particles, Theoretical results agree reasonably well with the experimental data obtained in the laboratory under well- controlled conditions. Results presented herein confirm that the simplified theory by Zhang and McMurry (1992) provides a reasonable yet somewhat lower collection efficiency of volatile species during filter sampling owing to the assumptions in the downstream saturation ratio and pressure drop, © 1997 Elsevier Science Ltd. All rights reserved NOMENCLATURE A filtration area, cm z a specific surface area of particle bed, cm-1 B E/(2 - E ) Cm species concentration in particle phase on the filter, gcm- 3 Op particle diameter, cm D_v~ diffusion coefficient of vapor, cm 2 s 1 Op average particle diameter, cm E evaporation coefficient or accommodation coefficient Jc mass transfer flux at continuum regime, g cm- 2 S- Jk mass transfer flux at free molecule regime, g cm- 2 s- K2 specific cake resistance coefficient, s- Kn Knudsen number k particle-to-fluid mass transfer coefficient, cm s- 1 L thickness of particle bed, cm m collected particle mass on the filter, g mo.~ evaporation loss at ith time interval, g rh evaporation rate at ith time interval, g s- N total number of collected particles on the filter, # Ni NoQ Atl, # No particle concentration at upstream of sampler, # cm- 3 n the ratio of bed thickness to particle diameter, L/Dp Po pressure at upstream of sampler, dyn cm- 2 Pe Peclet number AP pressure drop across particle bed, dyn cm -2 Q sampling flow rate (in this study Q = Q~n), cm 3 s-1 Q~° air flow rate at upstream of particle bed, cm 3 s- Qout air flow rate at downstream of particle bed, cm 3 s- Re particle Reynolds number S~. saturation ratio of vapor at upstream of particle bed, P~./Pe Sour saturation ratio of vapor at downstream of particle bed, Pout/Pc Sc Schmidt number Sh Sherwood number She Sherwood number of particle bed, defined by equation (8) Sh b modified Sherwood number of particle bed, defined by equation (9) Shs Sherwood number for single particle t sampling time, Z Ati, s * Author to whom correspondence should be addressed. 1553
Transcript of EVAPORATION LOSS OF AMMONIUM NITRATE … · Yu-Hsiang Cheng and Chuen-Jinn Tsai* ... D_v~ diffusion...
Pergamon
PII: S0021-8502(97) 00033-5
J. Aerosol Sci. Vol. 28. No. 8. pp. 1553 1567. 1997 ~? 1997 Elsevier Science Ltd. All rights reserved
Printed in Great Britain 0021-8502/97 $17.00 + 0.00
E V A P O R A T I O N LOSS OF A M M O N I U M NITRATE PARTICLES D U R I N G FILTER S A M P L I N G
Yu-Hsiang Cheng and Chuen-Jinn Tsai*
Institute of Environmental Engineering, National Chiao Tung University, No. 75, Poai St., Hsin Chu, Taiwan, R.O.C.
(First received 20 February 1997; and in final form 9 May 1997)
Abstract--This study examines the evaporation loss of submicron, monodisperse ammonium nitrate particles during filter sampling when the upstream saturation ratio is zero. The proposed model has considered the upstream particle concentration, the porosity of the particle bed, particle diameter, upstream temperature, pressure drop. According to the present results, upstream particle concentration heavily influences the evaporation loss of ammonium nitrate particles, Theoretical results agree reasonably well with the experimental data obtained in the laboratory under well- controlled conditions. Results presented herein confirm that the simplified theory by Zhang and McMurry (1992) provides a reasonable yet somewhat lower collection efficiency of volatile species during filter sampling owing to the assumptions in the downstream saturation ratio and pressure drop, © 1997 Elsevier Science Ltd. All rights reserved
N O M E N C L A T U R E
A filtration area, cm z a specific surface area of particle bed, cm-1 B E/(2 - E ) Cm species concentration in particle phase on the filter, g c m - 3 Op particle diameter, cm D_v~ diffusion coefficient of vapor, cm 2 s 1 Op average particle diameter, cm E evaporation coefficient or accommodation coefficient Jc mass transfer flux at continuum regime, g c m - 2 S- Jk mass transfer flux at free molecule regime, g cm- 2 s - K2 specific cake resistance coefficient, s - Kn Knudsen number k particle-to-fluid mass transfer coefficient, cm s - 1 L thickness of particle bed, cm m collected particle mass on the filter, g mo.~ evaporation loss at ith time interval, g rh evaporation rate at ith time interval, g s - N total number of collected particles on the filter, # Ni NoQ Atl, # No particle concentration at upstream of sampler, # cm- 3 n the ratio of bed thickness to particle diameter, L/Dp Po pressure at upstream of sampler, dyn c m - 2 Pe Peclet number AP pressure drop across particle bed, dyn cm -2 Q sampling flow rate (in this study Q = Q~n), cm 3 s-1 Q~° air flow rate at upstream of particle bed, cm 3 s - Qout air flow rate at downstream of particle bed, cm 3 s - Re particle Reynolds number S~. saturation ratio of vapor at upstream of particle bed, P~./Pe Sour saturation ratio of vapor at downstream of particle bed, Pout/Pc Sc Schmidt number Sh Sherwood number She Sherwood number of particle bed, defined by equation (8) Sh b modified Sherwood number of particle bed, defined by equation (9) Shs Sherwood number for single particle t sampling time, Z Ati, s
* Author to whom correspondence should be addressed.
1553

1554 Y.-H. Cheng and C.-J. Tsai
At~ ith sampling interval, s u superficial fluid velocity, cm s Uo superficial fluid velocity when pressure is equal to P,,, cm s t x traveling direction of flowing fluid x~ ratio of molecular weight for particle to vapor z ratio of molecular mass for vapor to air
Greek 3
P ,%
Pin ,Oo~t f)e
letters dimensionless pressure drop, AP/Po porosity of particle bed collection efficiency, % time-averaged collection efficiency, % AP/(P,+ -- AP) vapor concentration in particle bed, g cm 3 equilibrium concentration of vapor, g cm 3 vapor concentration at upstream of particle bed, g cm 3 vapor concentration at downstream of particle bed, g cm "~ time-averaged equilibrium gas-phase concentration, g cm 3 dimensionless collision integral
I N T R O D U C T I O N
In atmospheric aerosol sampling, sampling errors often occur as a result of gas-particle and particle-particle interactions, gas adsorption by sampling media and/or collected species, and evaporation of collected particles due to pressure drop across the filter or subsaturated conditions of atmospheric aerosols. SO2 and HNO3 gases are adsorbed by collected particles and sampling media and oxidized to sulfate and nitrate resulting in positive artifacts (Coutant, 1977; Liberti et al., 1978; Appel et al., 1984; Japar and Brachaczek, 1984). Volatile species such as ammonium chloride and ammonium nitrate are lost due to dissociation and evaporation when ambient temperature changes or pressure drop increases across the filter during sampling (Stelson et al., 1979; Appel et al., 1980; Forrest et al., 1980; Appel et al., 1981; Appel and Tokiwa 1981; Wang and John 1988; Zhang and McMurry, 1987, 1992).
Appel et al. (1980) determined evaporation loss of ammonium nitrate by loading 185 + 7 ~g particles on Teflon filters and passing purified air through the filter at a flow rate of 20 1 min ~ for about 6 h (21 'C, 50-80% relative humidity). According to their results, evaporation caused approximately half of the nitrate to be lost. Forrest et al. (1980) spiked a 47 mm quartz filter with 700 ttg ammonium nitrate and drew ambient air through the filter pack for 3--5 h. The greatest ammonium nitrate loss was found to occur when the relative humidity was below 60%, whereas when the relative humidity was 100%, no ammonium nitrate was lost. Stelson and Seinfeld (1982) accounted for these results, indicating that dissociation constant of ammonium nitrate depends on relative humidity and temperature. When relative humidity approaches 100%, the dissociation constant decreases by several orders of magnitude resulting in negligible evaporation loss.
Wang and John (1988) also observed that the loss of ammonium nitrate from the Teflon filter was as high as 80-95% when clean air (35'C and 18% relative humidity) was drawn through a 47 mm filter, which was loaded with 93-208 pg ammonium nitrate particles, at a flow rate of 30 1 min ~ for 6-24 h. However, when loaded mass was heavy (>2500 ~tg), the evaporation loss was smaller than 10%. That is, the evaporation loss depends on loaded mass. According to their results, evaporation losses from filter samplers are more serious than that from impactor samplers. This occurs primarily because more particle surface area per mass of deposit is exposed to air flow in filter samplers than in impactor samplers.
Zhang and McMurry (1987, 1992) developed a theoretical model to calculate evaporation loss from filter and impactor samplers. More evaporation loss of particles from filter samplers than from impactor samplers were also found. The evaporation loss of particles from filter samplers depends primarily on pressure drop across the filter and the vapor- to-particle mass distribution of volatile species. Assuming that the downstream saturation ratio, Pou,/Pe, is 1.0 and the pressure drop is equal to a fixed value during entire sampling

Evaporation loss of ammonium nitrate particles 1555
period, the lower limit of collection efficiency of volatile species, q, for filter sampler can be expressed as
r /= 1 +~Egln +(1 - - S i n ) / a ] ~ ) ¢ / C m " (1)
This is a simplified model (Zhang and McMurry, 1992). More detailed theoretical model can be seen in Zhang and McMurry (1987).
In this paper, the evaporation loss of solid ammonium nitrate particles during filter sampling when the relative humidity is below the deliquescent point has been studied theoretically and experimentally. Herein, the theoretical model was developed to predict the evaporation loss based on the mass transport equation and thermodynamic equilibrium. The model takes into account the porosity of the particle bed, the particle size, the upstream particle concentration, the pressure drop across the particle bed, the saturation condition and the ambient temperature. In the experiment, 0.2 and 0.4 ~m monodisperse ammonium nitrate particles were generated from an electrostatic classifier and collected by a filter sampler. The evaporation loss of ammonium nitrate from the filter sampler was determined with an annular denuder-filter pack system. Theoretical results were compared and discussed in light of experimental data.
T H E O R E T I C A L
Convection diffusion equation of the particle bed
In this study, evaporation loss from collected particles on the filter media is considered in Fig. 1 as a mass transfer problem of packed bed. The concentration of a vapor species, p, in the particle bed can be determined by considering a one-dimensional convection diffusion equation as
Dvg d2p d(pu) + ak(pe -p ) =0. (2) dx z dx
In this equation, the first term denotes the axial diffusive component, the second term represents the convective component and the third term is the particle-to-fluid mass transfer component (sink or source).
The fluid velocity increases in the fluid's traveling direction when there is a significant pressure drop across the particle bed. By assuming that the pressure drop is proportional to
L
particle bed [ Pin, Po, Uo = Q / A
o oo ~ ) o u u o o o ,o ° o ° o oo% o°o 2 0% °o~oo~, oo o oOOoo OooOooooooO OO o o; Ogo _oZoOo o%ooOsoO_ oOO, vO v~ov^ 0 0^0 v~ v ~OUm , 0 ,., u 0 u O0 u ~ ~0 o ~ o~o o oO oo 000 ^o ~3o ~ o oc .~o o°~O o o ~°oO oOo o o ~QOo% ~ o~o o, ~o_o~ ~,, OUoO..U,, olonu~,~o..~ o'~o ~
°o -o°oOoOo°o ° ° x , gg , / / / / / / / / / / / / / / / / / / / / / / / / / / / ")'7//~
~ Pout, Po -
filter
Fig. 1. Schematic diagram of the particle bed on a filter.
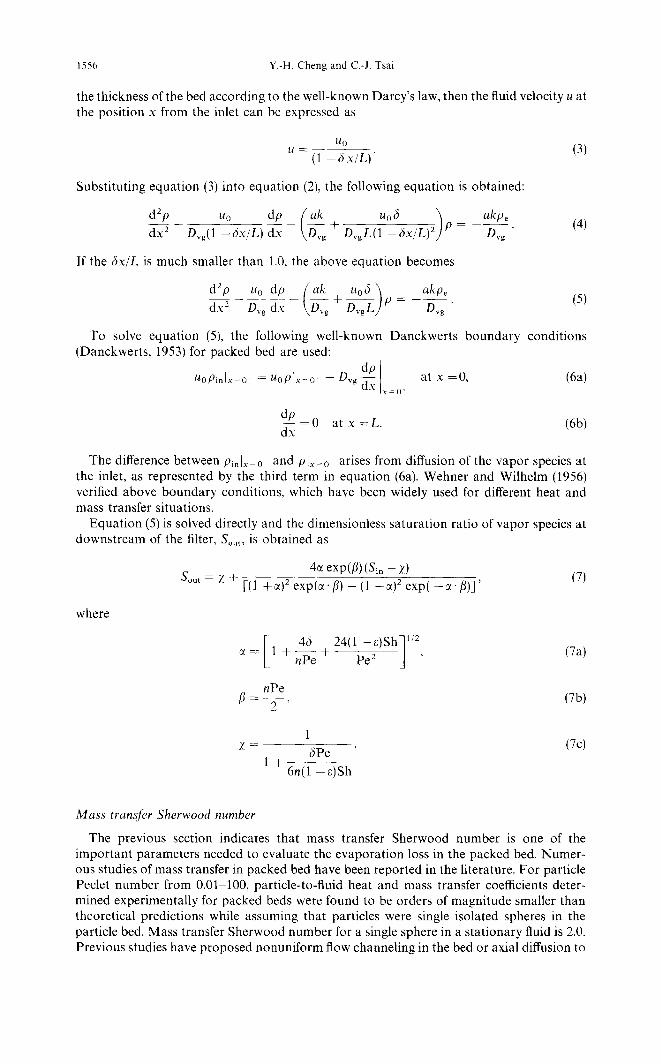
1556 Y.-H. Cheng and C.-J. Tsai
the thickness of the bed according to the well-known Darcy's law, then the fluid velocity u at the position x from the inlet can be expressed as
Uo u - (1 -~ x---"/LI (3)
Substituting equation (3) into equation (2), the following equation is obtained:
d2p Uo dp ( ak Uo g) ~ akpe dx 2 D~g(1 -6x/L) dx Dvg + D~gL(1 ---6x/L)2J p - D~g (4)
If the 3x/L is much smaller than 1.0, the above equation becomes
d2p Uo dp [ak Uog) ~ akpe dx 2 D,gdx ~g~g+~vgL; p - D~g (5)
To solve equation (5), the following well-known Danckwerts boundary conditions (Danckwerts, 1953) for packed bed are used:
Uoflinlx=O UoPlx=o- Dvg d~PxP x=o" = - at x =0, (6a)
od, = 0 a t x = L . (6b) dx
The difference between Pinlx-0 and plx=O + arises from diffusion of the vapor species at the inlet, as represented by the third term in equation (6a). Wehner and Wilhelm (1956) verified above boundary conditions, which have been widely used for different heat and mass transfer situations.
Equation (5) is solved directly and the dimensionless saturation ratio of vapor species at downstream of the filter, Sou,, is obtained as
4~ exp(fl)(Si, -Z ) Sou, = Z -~ [(1 +~)2 exp(c~, fl) - (1 -c02 exp( -c~. fi)]' (7)
where
46 24(1 -- ~)Sh'] 1'2 (7a)
nPe / 3 - 2 ' (7b)
Z = aPe (7c) 1 +
6n(1 - e ) S h
Mass transfer Sherwood number
The previous section indicates that mass transfer Sherwood number is one of the important parameters needed to evaluate the evaporation loss in the packed bed. Numer- ous studies of mass transfer in packed bed have been reported in the literature. For particle Peclet number from 0.01 100, particle-to-fluid heat and mass transfer coefficients deter- mined experimentally for packed beds were found to be orders of magnitude smaller than theoretical predictions while assuming that particles were single isolated spheres in the particle bed. Mass transfer Sherwood number for a single sphere in a stationary fluid is 2.0. Previous studies have proposed nonuniform flow channeling in the bed or axial diffusion to

Evaporation loss of ammonium nitrate particles 1557
account for why the Sherwood number in the bed is less than 2.0 (Kunii and Suzuki, 1967; Gunn and De Souza, 1974; Martin, 1978; Glicksman and Joos, 1980).
Nelson and Galloway (1975) presented a cell model and analytically solved the mass transfer equation for the particle bed. In the cell model, mass transfer from the particle bed is considered to be the same as that from a spherical particle surrounded by an imaginary concentric spherical shell. The porosity of the particle bed is equal to the ratio of the volume between the spherical shell and the particle to that of the spherical shell. Nelson and Galloway (1975) assumed that the radial gradient of the vapor species concentration is zero at the boundary of the spherical shell. This study adopts the following equation for the mass transfer Sherwood number of the particle bed, Sh,, obtained by Nelson and Galloway (1975):
where
2~ + [ -e - -~]2 - 2 tanh She = , (8)
-- tanh 1 - (1 - e ) 1/3
L 1 1 ( = 0.3 (1 -e ) 1/3 1 Re 1/2 Sc 1/a. (8a)
The above equation predicts that the Sherwood number is significantly smaller than Shs when the Peclet number is significantly smaller than 1.0. However, this equation can only be applied to the case when a particle bed has formed. During the initial stage of the filter sampling when a uniform particle cake has not formed yet, this equation underestimates the Sherwood number. For instance, when only few particles are collected on the filter at the beginning of filter sampling, the Sherwood number should approach 2.0 as these particles can be considered as single isolated spheres. To address this problem, the following empirical equation is proposed:
Shb = {[5 +6(n - 1)]Shc +Shs} 6n , n >/1 (9)
Despite no sound physical basis, this empirical equation is proposed intuitively such that when the porosity is close to 1.0 and n is 1.0, the Sherwood number approaches that of a single sphere, Shs. In addition, when n is rather large, the Sherwood number approaches that predicted by equation (8). The form of this equation is also discovered to provide an optimum fit of theoretical collection efficiency with experimental data, which is discussed later.
In the transition flow regime when 0.25 <Kn < 10 (Zhang and Liu, 1992), the Sherwood number originally developed for continuum flow regime, equation (9), must be corrected as
Shb = {[5 +6(n --1)]She +Shs} ~, n >~1, (10) 6n
where 7 denotes the ratio of the mass transfer flux in the transition flow regime J to that in the continuum flow regime Jc. There are many different formulae developed for y in the open literature. The following equation originally developed by Davis et al. (1980) is used in this study:
Jk K. I1 3B(1 +z) 2 Kn] Z +
= 8f~ 1''' ~B(1 +2z) 1 ] 9(1 +z) 2 2' 3rr(1 +z~) + L~-~ +5z) + ~ _ K. + 8(3 +5z~ K.
where B = E/(2 --E), E is the evaporation coefficient (or accommodation coefficient).
(11)

1558 Y.-H. C h e n g a n d C.-J. Tsa i
Evaporation loss during ,filter sampling
The solution to the convection diffusion equation and mass transfer Sherwood number of the particle bed discussed in the previous sections are used to calculate evaporation loss of particles during filter sampling.
Total number of particles collected on the filter during sampling increases with sampling time as
N = E A N , = g o O y A t , . (12)
If a uniform particle cake has formed on the filter, the bed's thickness, L, can be calculated as the following equation if the total number of collected particles N and the porosity ~: are known
L n D3 - n > 1. ( 1 3 )
6(1 --s)A'
The number of layer n is determined as L/Dp. However, before a uniform cake is formed, the above formulae cannot be used. Here it is
assumed that n = 1.0 before the cake is formed. The porosity s is considered to gradually reduce from 1.0 according to the following equation:
~ :=1- - 6--A-' n = l . (14)
As e approaches a preset value (for example 0.65), L will become greater than O v. Then, the cake is considered to have formed.
Equations (12)-(14) are used to calculate the saturation ratio at downstream of particle bed, Sour. The total evaporated mass of the collected particles during Ati is calculated according to mass conservation principle as
me,i = m~,iAti (15)
= Xrpe(Sout Qou, - s i n Qin)Ati, (15a)
where evaporation rate, ~fi~, is equal to Xrpe(SoutQout-&~Qi,); Xr is the ratio of the molecular weight of the particle to the molecular weight of the vapor. For ammonium nitrate dissociated to ammonia and nitric acid, x~ is the ratio of the molecular weight of ammonium nitrate to the molecular weight of nitric acid. This is due to that fact that evaporation of nitric acid is the rate-limiting step since the diffusion coefficient of nitric acid is smaller than that of ammonia.
In the above equation, Oout must be evaluated while assuming that Q~, is known. Because of pressure drop, the volumetric flow rate at the downstream of the particle bed, Qoot, is related to the upstream volumetric flow rate Q~, as
Q i . Qom - (1 -fi)" (16)
The pressure drop of the particle bed can be written as (Gupta et al., 1993)
and
U o m AP = K 2 - - (17)
A
d = K 2 u ° m PoA"
In this study, K2 is determined experimentally.
(i 7a)
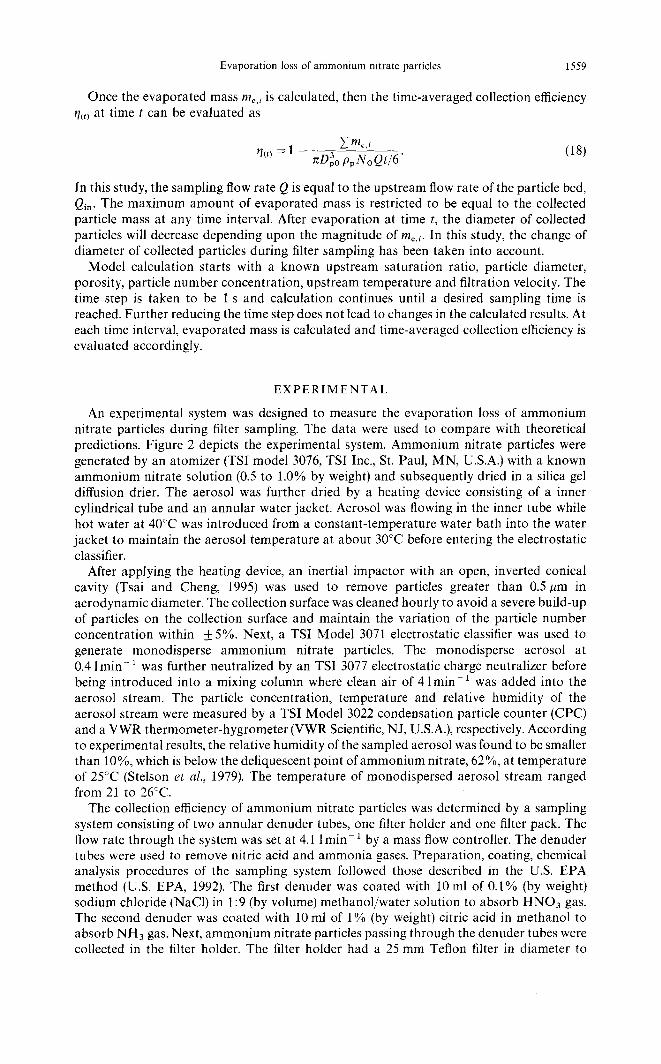
Evaporation loss of ammonium nitrate particles 1559
Once the evaporated mass me,i is calculated, then the time-averaged collection efficiency q~,~ at time t can be evaluated as
~me,i (18) r/m = 1 - 7rDp o3 ppNoQt/6"
In this study, the sampling flow rate Q is equal to the upstream flow rate of the particle bed, Qin. The maximum amount of evaporated mass is restricted to be equal to the collected particle mass at any time interval. After evaporation at time t, the diameter of collected particles will decrease depending upon the magnitude of me,i. In this study, the change of diameter of collected particles during filter sampling has been taken into account.
Model calculation starts with a known upstream saturation ratio, particle diameter, porosity, particle number concentration, upstream temperature and filtration velocity. The time step is taken to be 1 s and calculation continues until a desired sampling time is reached. Further reducing the time step does not lead to changes in the calculated results. At each time interval, evaporated mass is calculated and time-averaged collection efficiency is evaluated accordingly.
E X P E R I M E N T A L
An experimental system was designed to measure the evaporation loss of ammonium nitrate particles during filter sampling. The data were used to compare with theoretical predictions. Figure 2 depicts the experimental system. Ammonium nitrate particles were generated by an atomizer (TSI model 3076, TSI Inc., St. Paul, MN, U.S.A.) with a known ammonium nitrate solution (0.5 to 1.0% by weight) and subsequently dried in a silica gel diffusion drier. The aerosol was further dried by a heating device consisting of a inner cylindrical tube and an annular water jacket. Aerosol was flowing in the inner tube while hot water at 40°C was introduced from a constant-temperature water bath into the water jacket to maintain the aerosol temperature at about 30°C before entering the electrostatic classifier.
After applying the heating device, an inertial impactor with an open, inverted conical cavity (Tsai and Cheng, 1995) was used to remove particles greater than 0.5 pm in aerodynamic diameter. The collection surface was cleaned hourly to avoid a severe build-up of particles on the collection surface and maintain the variation of the particle number concentration within +5%. Next, a TSI Model 3071 electrostatic classifier was used to generate monodisperse ammonium nitrate particles. The monodisperse aerosol at 0.4 1 rain- 1 was further neutralized by an TSI 3077 electrostatic charge neutralizer before being introduced into a mixing column where clean air of 4 1 min- 1 was added into the aerosol stream. The particle concentration, temperature and relative humidity of the aerosol stream were measured by a TSI Model 3022 condensation particle counter (CPC) and a VWR thermometer-hygrometer (VWR Scientific, N J, U.S.A.), respectively. According to experimental results, the relative humidity of the sampled aerosol was found to be smaller than 10%, which is below the deliquescent point of ammonium nitrate, 62%, at temperature of 25°C (Stelson et al., 1979). The temperature of monodispersed aerosol stream ranged from 21 to 26°C.
The collection efficiency of ammonium nitrate particles was determined by a sampling system consisting of two annular denuder tubes, one filter holder and one filter pack. The flow rate through the system was set at 4.1 1 min- 1 by a mass flow controller. The denuder tubes were used to remove nitric acid and ammonia gases. Preparation, coating, chemical analysis procedures of the sampling system followed those described in the U.S. EPA method (U.S. EPA, 1992). The first denuder was coated with 10ml of 0.1% (by weight) sodium chloride (NaC1) in 1:9 (by volume) methanol/water solution to absorb HNO3 gas. The second denuder was coated with 10 ml of 1% (by weight) citric acid in methanol to absorb NH3 gas. Next, ammonium nitrate particles passing through the denuder tubes were collected in the filter holder. The filter holder had a 25 mm Teflon filter in diameter to

1560
compressed air-,-
Y.-H. Cheng and C.-J. Tsai
mass fiowmeter flow controller
air supply system
diffusion dryer
compressed air 7-
waterJaeket
~actor 0.4 L/min
ware1: bath electrostatic classifier
atomizer
air supply system ~ filter [ ~
pump neutralizer
mixing column
CNC I ~ ~ . 3 [ L/min
R.H. sensor and temperature sensor
denuder
filter holder
filter pack
4.0 L/min
4.1 ~L/min I
I I ! , --e ',
I
~mass flowmeter
s a m p l i n g s y s t e m pump t . _ _
Fig. 2. Schematic diagram of the present experimental setup.
collect ammonium nitrate particles. The actual diameter of the filter's collection area was designed to be only 5 m m to increase the sampling flow rate and reduce sampling time, which typically ran from 3-16 h.
The pressure drop across the filter holder was measured by a pressure gage and recorded every half an hour. A filter pack installed after the filter holder was used to collect evaporated vapors from ammonium nitrate particles collected in the filter holder. The filter pack has two 47 mm nylon membrane filters and a 47 turn glass fiber. The first and second nylon filters were used to absorb HNO3 gas which evaporated from the ammonium nitrate particles collected on the front Teflon filter, while the third glass fiber filter was coated with 2% (by weight) citric acid in ethanol to absorb evaporated NH3. After sampling, the denuder tubes and filters were extracted with distilled deionized water in an ammonia-free box. The NO;- and NO,~ concentrations were determined by an ion chromatograph (Model 4500i, Dionex Crop., CA, U.S.A.) and the amount of evaporated nitric acid and ammonium gases were calculated accordingly. Molar ratios of N O 3 and NO~- were found to be the same.
The evaporat ion loss of ammonium nitrate particles during filter sampling could then be calculated from the ratio of the mass of nitrate on the nylon membrane filters to the sum of the mass of nitrate on the Teflon and nylon membrane filters. Accordingly, the time- averaged collection efficiency could be calculated and compared with experimental data.

Evaporation loss of ammonium nitrate particles 1561
RESULTS AND D I S C U S S I O N
The specific cake resistance coefficient K2 was determined from the experimental data of pressure drop versus mass of collected particles. Following the work of Novick et al. (1992), an equation that represents a best fit to the experimental Kz data is found as
K 2 = 6.46 x 10⁵ + 1.76 x 10⁻⁴/Dp 2 . (19)
Figure 3 shows that correlation. This equation can be applied for the ammonium nitrate particles with an initial diameter equal to 0.2 and 0.4 pm.
Comparison of experimental data with theoretical results
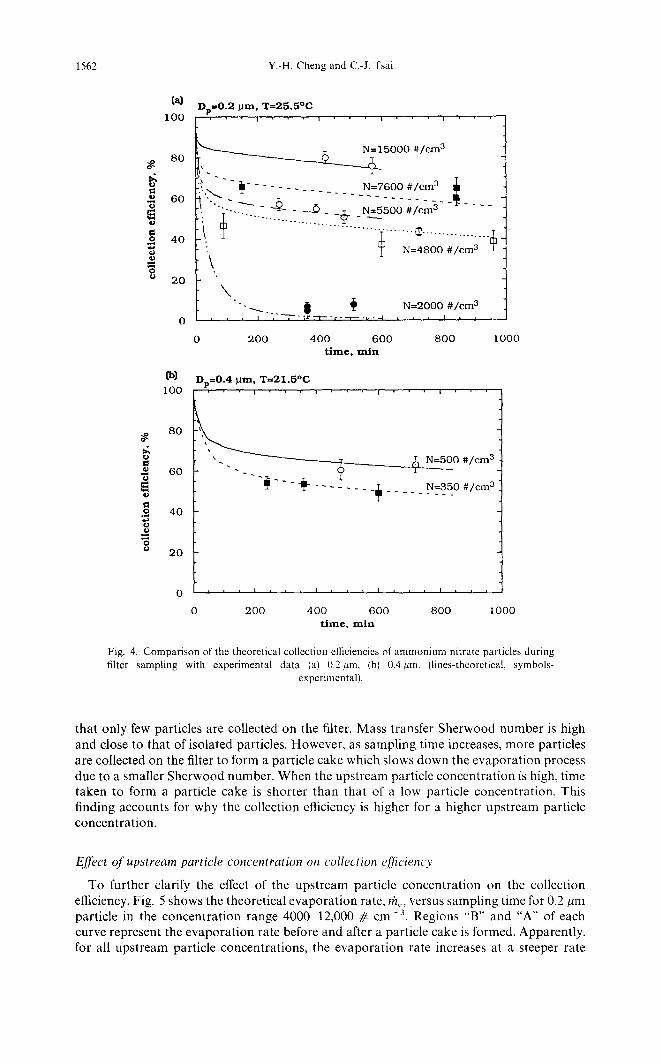
Figures 4a and b summarize the experimental data of the collection efficiency of the ammonium nitrate during filter sampling for particle diameters of 0.2 and 0.4 klm, respec- tively. The error bar in the figures was estimated from the variation of the particle concentration and temperature during the experiment. The data are also compared with the theoretical results, in which the porosity of the particle bed is assumed to be 0.65 and the evaporation coefficient, E, is assumed as 0.52 (Hightower and Richardson, 1988). Different values in available literature range from 0.004 to 1.0 for the evaporation coefficient E (Larson and Taylor, 1983; Richardson and Hightower, 1987; Harrison et al., 1990). This study demonstrates that the evaporation coefficient of 0.52 yields a best fit to the present experimental data. The equilibrium concentration of the vapor species p~ for nitric acid is obtained from Stelson and Seinfeld (1982) and Kim et al. (1993).
From Fig. 4a and b, it is seen that the experimental data agree well with theoretical results except when the collection efficiency is low. There are no experimental data available to compare with theoretical predictions when the sampling time is short. Because of the low detection limit of the IC analysis, it is hard to determine the evaporation loss of ammonium nitrate in the beginning of sampling.
The results show that the collection efficiency drops significantly from 100% at the initial sampling period for the concentration range of 2000-15,000 # cm -3 (0.2/tm) and 350-500 # cm- 3 (0.4/~m). Collection efficiency is higher for a higher inlet particle concen- tration. The reason why there is a initial rapid drop the collection efficiency is due to the fact
x 10 6
1 . 6
1.5
,?, 1.4
~'~ 1.3
1.2
1 . 1
2.5
' ' ' ' I . . . . I . . . . I . . . . L ' ' ' '
K 2 = 6 . 4 6 x I 0 5 + 1 . 7 6 x I 0 - 4 / D 2 R : 0 . 9 7
i i
o
. , ? ~ f N H 4 N 0 3
0 0 , E x p e r i m e n t a l D a t a
i I i i r ' I . . . . I , , , , I , , , ,
3 3.5 4 4.5 I / D p 2 , C m - 2
5
x 10 9
Fig. 3. The specific resistance K~ of ammonium nitrate particle cake plotted as a function of the inverse of the square of particle diameter.
1562 Y.-H. Cheng and C.-J. Tsai
I I
¢J it ¢.1
0
0 ¢,1
(a) Dp=0 .2 ~ m , T = 2 5 . 5 ° C I 0 0 , , , , ,
80
60
40
20
100
80
6O
40
20
I I "=I
~ 5000 #/crn 3
'! . ~ - - ~ . . . . . . . . . N=7600 # /cm 3
i ' , . . . ..,...._ ~ - ~ ~ - . . . . . . . . . . . : _ _ , _ . . . . • "'.~ . . . . . . . . . . . . . . . . . . . . . . . . . . . . . . . . - ~ - ---£P_ ~ N=5500~ # / c m °
"\ T N=4800 # /cm a i
\ ' , . ~ ) ~ ~=2ooo #/cm~
0 200 400 600 800 I000 t i m e , r a i n
Dp=0 .4 ~ m , T = 2 1 . 5 ° C i I l D
" ~ - - - ~ . . . . . . . . ~ . . . . . ~:3~.o #/cm3
t ) , , 1 I I , , ,
0 200 400 600 800 1000 t i m e , m l n
Fig. 4. Comparison of the theoretical collection efficiencies of ammonium nitrate particles during filter sampling with experimental data (a) 0.2pro, (b) 0.4/~m. (lines-theoretical, symbols-
experimental).
that only few particles are collected on the filter. Mass transfer Sherwood number is high and close to that of isolated particles. However, as sampling time increases, more particles are collected on the filter to form a particle cake which slows down the evaporation process due to a smaller Sherwood number• When the upstream particle concentration is high, time taken to form a particle cake is shorter than that of a low particle concentration, This finding accounts for why the collection efficiency is higher for a higher upstream particle concentration.
Effect of upstream particle concentration on collection efficiency
To further clarify the effect of the upstream particle concentration on the collection efficiency, Fig. 5 shows the theoretical evaporation rate, 'fie, versus sampling time for 0.2 pm particle in the concentration range 4000-12,000 # c m - 3 Regions "B" and "A" of each curve represent the evaporation rate before and after a particle cake is formed. Apparently, for all upstream particle concentrations, the evaporation rate increases at a steeper rate

Evaporation loss of ammonium nitrate particles 1563
¢ J
::£
b ~
O
O
× 10 -3 3
2.5
1.5
0.5
i , i , r i , J [ i , , , , , , i B , , , , , , , ,
Q=4.1 L/min, Dr5 m m , AP=502.9 cmHn'~ Dp=0.2 pro, Sin=0.0 / .
N = I 2 0 0 0 # / c m 3 / - " - N = 8 0 0 0 # / c m 3 / . . . . . . . Nff i4000 # / c m 3 A P = 3 0 9 . ~
.... j
t ° o , ° "
. . . , . . . ° "
1 10 1 0 0 1 0 0 0 t i m e , rain
Fig. 5. Comparison of the evaporation rate of ammonium nitrate during filter sampling at different upstream particle concentrations. (region B: before the particle cake is formed, n = 1; region A: after
the cake is formed, n >1)
before the cake is formed than after the cake is formed. Before the cake is formed, particles are sparsely distributed on the filter and evaporation is severe for these seemingly isolated particles. After the cake is formed, the decrease of the evaporation rate due to decreasing Sherwood number is nearly equal to the increase of evaporation rate due to the increase of collected mass. This leads to a more or less constant evaporation rate from 10 to 100 rain of sampling time.
As sampling time is greater than 100 rain, pressure drop across the particle cake becomes very high for the case when the upstream particle concentration No is 12,000 # cm- 3. For instance, at the sampling time of 1000 rain, the pressure drop is as high as 502.9 cm H20, compared to 309.5 and 111.2 cm H 2 0 for the case when No = 8000 and 4000 # cm -a, respectively. Evaporation rate increases again when sampling time is greater than 100 rain due to the increase in pressure drop and decrease in vapor concentration within the particle cake for No = 12,000 # cm -3. Increases in evaporation rate for No =8000 # cm -3 is not as important primarily because that the pressure drop is less than the case when No = 12,000 # cm-3. At No =4000 # cm-3, the evaporation rate remains relatively con- stant after sampling time is greater than 100 min because the pressure drop is the smallest, 111 .2 cm H20.
Effect of porosity of particle bed on collection efficiency
In Figs 4a and b, the porosity of the particle bed is assumed to be fixed at 0.65. To investigate the effect of the porosity on the collection efficiency, Fig. 6 compares the theoretical collection efficiency for porosity of the particle bed ranging from 0.5 to 0.8 and particle concentration ranging from 4000 to 12,000 # cm- 3. This figure indicates that when the particle concentration is high, different assumptions of porosity make small differences in the prediction of the collection efficiency except during the initial sampling period. This is the case when No =8000 and 12000 # cm -3. However, for the case when No = 4000 # cm-3, the assumption of ~ =0.5 results in much smaller collection efficiency than the case when e =0.8.

1564 Y.-H. Cheng and C.-J. Tsai
2. f,,)
U
' 0
100
8O
60
40
20
i i i . I
", ~ N=8000 #/cm 3 " ' ' - . ° . .
Q=4.1 L/min, Dr=5 mm, N=4000 #/cm 3 Dp=0.2 ~tm, Sin=0.0
- - Porosity=0.8 ....... Porosity=0.5
, , , I , i . T I , , , I I 0 J
0 200 400 600 800 1000 time, rain
Fig. 6. C•••ecti•nefficiency•famm•niumnitratepartic•esduring••tersamp•ingwhenthep•r•sity of the particle bed is equal to 0.5 and 0.8 at different upstream particle concentrations.
The above argument accounts for why more deviations of experimental data from theoretical results occur for the case of a smaller upstream particle concentration shown in Fig. 4(a). In view that the porosity of particle cake is normally in that range of 0.6-0.95 (Gupta et al., 1993), also because that the actual porosity of the particle bed may be time varying and difficult to measure, the present theoretical model is considered to agree satisfactorily with experimental data. Further study of the porosity of the particle cake and its relationship with pressure drop, particle material and filtration velocity is important and worth investigating,
Comparison with the theory by Zhang and McMurry (1992)
According to Fig. 7, experimental results of the collection efficiency of ammonium nitrate are also compared with the theoretical prediction by equation (1) of Zhang and McMurry (1992). This figure indicates that while the theoretical results in this study agree quite well with the experimental data, the theory for the lower limit of collection efficiency of Zhang and McMurry (1992) underestimates the collection efficiency by 5-15%. This comparison is reasonable since the simplified theory of Zhang and McMurry assumes that the downstream saturation ratio, So,t, is 1.0, and variation of pressure drop with sampling time is not considered. Both lead to an underestimation of the collection efficiency.
The assumption that downstream saturation ratio is 1.0 is usually invalid. Figure 8 shows the variation of Sour, which is calculated from equation (7), with collected particle mass for 0.2 #m particles when the porosity of the particle bed is 0.65. For all collected mass, So,, is seen to be less than 1.0. In addition, Sour increases from zero with an increasing collect particle mass (or sampling time) before the particle cake is formed (region "B"). After the particle cake is formed (region "A"), the rate of increase of So,t becomes smaller until the pressure drop increases to a significant value when the rate of evaporation (or the rate of increase of So,0 becomes higher again. During the entire sampling period, the downstream saturation ratio is less than 1.0 for the upstream conditions assumed in this investigation.

Evaporation loss of ammonium nitrate particles 1565
I00 • ' I ' ' ' ; ' ' ' I ' ' ' ; " ' ' , , j _ T h e o r e t i c a l M o d e l . . . . /
O T h i s w o r k
8 0 [] Z h a n g a n d M c M u r r y ( 1 9 9 2 ) ~ o
~ - - I : I _ S ° El o~ ~ DO c~o DD
H 60
"+ j / ¢ 0 ~ 40 ~
2 0
I I I 0
0 20 40 60 80 I00 c o l l e c t i o n e f f i c i e n c y , %
( e x p e r i m e n t a l d a t a )
Fig. 7. Comparison of the experimental collection efficiencies of ammonium mtrate particles with theoretical predictions by the present model and the simplified model of Zhang and McMurry
(1992).
0.8 'T3" "A"
0.6
0.4
0.2
0
Q = 4 . 1 L / m i n , D I = 5 r a m ,
D p = 0 . 2 g m , S i n = 0 . 0
- - P o r o s l t y - - 0 . 6 5
0.1 1 10 100 1000 c o l l e c t e d p a r t i c l e m a s s , lag
Fig. 8. The relationship between collected particle mass and downstream saturation ratio of the particle bed. (region B: before the particle cake is formed, n = 1; region A: after the cake is formed,
n >1)
C O N C L U S I O N S
This s tudy invest igates the e v a p o r a t i o n loss of submicron , monod i spe r s e a m m o n i u m ni t ra te par t ic les dur ing filter s ampl ing when the ups t r eam sa tu ra t ion ra t io is zero. The exper imenta l d a t a were ob t a ined under con t ro l l ed cond i t ions in the l abora to ry . The p r o p o s e d mode l considers the ups t r eam par t ic le concen t ra t ion , the po ros i ty of the par t ic le bed, par t ic le d iameter , u p s t r e a m tempera tu re , pressure d r o p and sa tu ra t ion condi t ion . Theore t i ca l results agree r easonab ly well with the exper imenta l data .

1566 Y.-H. Cheng and C.-J. Tsai
Resul ts in this s tudy d e m o n s t r a t e tha t severe e v a p o r a t i o n loss occurs dur ing the init ial s tage of sampl ing due to the fact tha t only few part ic les are col lected on the filter which have a high mass t ransfer She rwood number . W h e n a par t ic le cake is formed, the evapo ra t i on rate increases at a s lower ra te due to the smal ler She rwood number in the par t ic le bed.
U p s t r e a m par t ic le concen t ra t ion heavi ly influences the e v a p o r a t i o n loss of a m m o n i u m ni t ra te part icles. W h e n the ups t r eam par t ic le concen t ra t ion is high, a par t ic le cake forms sooner than the case of low ups t r eam par t ic le concent ra t ion . As col lected par t ic les are mass ive enough such tha t pressure d r o p across the par t ic le bed becomes signif icantly high, the e v a p o r a t i o n rate increases again due to the increase in pressure d r o p and decrease in the v a p o r concen t ra t ion within the par t ic le bed.
Theore t ica l results indicate that the col lect ion efficiency is affected by the poros i ty of the par t ic le cake especial ly when the par t ic le cake is not thick enough. To provide a more precise theore t ica l model , fur ther s tudy of the poros i ty of par t ic le cake and its re la t ionship with pressure drop , par t ic le mate r ia l and f i l t ra t ion veloci ty is i m p o r t a n t and wor th inves- t igat ing.
The theory for the lower l imit of col lect ion efficiency of Z h a n g and M c M u r r y (1992) is a dvan t ageous in tha t it p rov ides a r easonab le a l though somewha t lower es t imat ion of col lect ion efficiency of volat i le species. The m a j o r a s sumpt ion that d o w n s t r e a m sa tu ra t ion ra t io is 1.0 may not be val id and va r ia t ion of pressure d rop with sampl ing t ime must be considered.
The cur ren t exper imenta l da t a were ob t a ined under wel l -cont ro l led l a b o r a t o r y condi - t ions to develop fundamen ta l unde r s t and ing of par t ic le e v a p o r a t i o n rate dur ing filter sampling. In ac tua l field sampling, the concen t ra t ions of nitric acid, a m m o n i a and a m m o n i u m ni t ra te usual ly change con t inuous ly with sampl ing time, ambien t t empera tu re and relat ive humidi ty . These changes should be cons idered in the theore t ica l model .
Acknowledgement--The authors would like to thank the National Science Council of the Republic of China for financially supporting this work under Contract No. NSC 86-2621-P-009-001.
R E F E R E N C E S
Appel, B. R. and Tokiwa, Y. (1981) Atmospheric particulate nitrate sampling errors due to reactions with particulate and gaseous strong acids. Atmos. Envir. 15, 1087.
Appel, B. R., Tokiwa, Y. and Haik, M. (1981) Sampling of nitrates in ambient air. Atmos. Envir. 15, 283. Appel, B. R., Tokiwa, Y., Haik, M. and Kothny, E. L. (1984) Artifact particulate sulfate and nitrate formation on
filter media. Atmos. Envir. lg, 409. Appel, B. R., Wall, S. M., Tokiwa, Y. and Haik, M. (1980) Simultaneous nitric acid, particulate nitrate and acidity
measurements in ambient air. Armos. Envir. 14, 549. Coutant, R. W. (1977) Effect of environmental variables on collection of atmospheric sulfate. Environ. Sci. Technol.
11,873. Danckwerts, P. V. (1953) Continuous flow systems: distribution of residence times. Chem. Engng Sci. 2, 1. Davis, E. J., Ravindran, P. and Ray, A. K. (1980) A review of theory and experiments on diffusion from
submicroscopic particles. Chem. Engng Commun. 5, 251. Forrest, J., Tanner, R. L., Spandau, D., D'Ottavio, T. and Newman, L. (1980) Determination of total inorganic
nitrate utilizing collection of nitric acid on NaCl-impregnated filters. Atmos. Envir. 14, 137. Glicksman, L. R. and Joos, F. M. (1980) Heat and mass transfer in fixed beds at low Reynolds numbers. J. Heat
Transfer 102, 736. Gunn, D. J. and De Souza J. F. C. (1974) Heat transfer and axial dispersion in packed beds. Chem. Engng Sci. 29,
1363. Gupta, A., Novick, V. J., Biswas, P. and Monson, P. R. (1993) Effect of humidity and particle hygroscopicity on the
mass loading capacity of high efficiency particulate air filters. Aerosol Sci. Technol. 19, 94. Harrison, R. M., Sturges, W. T., Kitto A.-M. N. and Li, Y., (1990) Kinetics of evaporation of ammonium chloride
and ammonium nitrate aerosols. Atmos. Envir. 24A, 1883. Hightower, R. L. and Richardson, C. B. (1988) Evaporation of ammonium nitrate particles containing ammonium
sulfate. Atmos. Envir. 22, 2587. Japar, S. M. and Brachaczek, W. W. (1984) Artifact sulfate formation from SO2 on nylon filters. Atmos. Envir. 18,
2479. Kim, Y. P., Seinfeld, J. H. and Saxena, P. (1993) Atmospheric gas-aerosol equilibrium I. Thermodynamic model.
Aerosol Sci. Technol. 19, 157. Kunii, D. and Suzuki, M. (1967) Particle-to-fluid heat and mass transfer in packed beds of fine particles. Int. J.
Heat Mass Transfer 10, 845. Larson, T. V. and Taylor, G. S. (1983) On the evaporation of ammonium nitrate aerosol. Atmos. Environ. 17, 2489.

Evaporation loss of ammonium nitrate particles 1567
Liberti, A., Brocco, D. and Possanzini, M. (1978) Adsorption and oxidation of sulfur dioxide on particles. Atmos. Envir. 12, 255.
Martin, H. (1978) Low peclet number particle-to-fluid heat and mass transfer in packed beds. Chem. Engng Sci. 33, 913.
Nelson, P. A. and Galloway, T. R. (1975) Particle-to-fluid heat and mass transfer in dense systems of fine particles. Chem. Engng Sci. 30, 1.
Novick, V. J., Monson, P. R. and EUison, P. E. (1992) The effect of solid particle mass loading on the pressure drop of HEPA filters. J. Aerosol Sci. 23, 657.
Richardson, C. B. and Higbtower, R. L. (1987) Evaporation of ammonium nitrate particles. Atmos. Envir. 21,971. Stelson, A. W., Friedlander, S. K. and Seinfeld, J. H. (1979) A note on the equilibrium relationship between
ammonia and nitric acid and particulate ammonium nitrate. Atmos. Envir. 13, 369. Stelson, A. W. and Seinfeld, J. H. (1982) Relative humidity and temperature dependence of the ammonium nitrate
dissociation constant. Atmos. Envir. 16, 983. Tsai, C.-J. and Cheng, Y.-H. (1995) Solid particle collection characteristics on impaction surfaces of different
designs. Aerosol Sci. Technol. 23, 96. US EPA (1992) Determination of the stron9 acidity of atmospheric fine-particles (<2.5 #m) usin9 annular denuder
technology. EPA/600/R-93/037. Wang, H.-C. and John, W. (1988) Characteristics of the Berner impactor for sampling inorganic ions. Aerosol Sci.
Technol. 8, 157. Wehner, J. F. and Wilhelm, R. H. (1956) Boundary conditions of flow reactor. Chem. Engn9 Sci. 6, 89. Zhang, X. and McMurry, P. H. (1987) Theoretical analysis of evaporative losses from impactor and filter deposits.
Atmos. Envir. 21, 1779. Zhang, X. and McMurry, P. H. (1992) Evaporative losses of fine particulate nitrates during sampling. Atmos. Envir.
26A, 3305. Zhang, Z. and Liu, B. Y. H. (1992) Experimental study of aerosol filtration in the transition flow regime. Aerosol
Sci. Technol. 16, 227.