Evaporation and crystallization in micro flow systems - Pure · 2.2 Falling Film Micro Reactor ......
141
Evaporation and crystallization in micro flow systems Moschou, P. DOI: 10.6100/IR769888 Published: 01/01/2014 Document Version Publisher’s PDF, also known as Version of Record (includes final page, issue and volume numbers) Please check the document version of this publication: • A submitted manuscript is the author's version of the article upon submission and before peer-review. There can be important differences between the submitted version and the official published version of record. People interested in the research are advised to contact the author for the final version of the publication, or visit the DOI to the publisher's website. • The final author version and the galley proof are versions of the publication after peer review. • The final published version features the final layout of the paper including the volume, issue and page numbers. Link to publication Citation for published version (APA): Moschou, P. (2014). Evaporation and crystallization in micro flow systems Eindhoven: Technische Universiteit Eindhoven DOI: 10.6100/IR769888 General rights Copyright and moral rights for the publications made accessible in the public portal are retained by the authors and/or other copyright owners and it is a condition of accessing publications that users recognise and abide by the legal requirements associated with these rights. • Users may download and print one copy of any publication from the public portal for the purpose of private study or research. • You may not further distribute the material or use it for any profit-making activity or commercial gain • You may freely distribute the URL identifying the publication in the public portal ? Take down policy If you believe that this document breaches copyright please contact us providing details, and we will remove access to the work immediately and investigate your claim. Download date: 26. Jun. 2018
Transcript of Evaporation and crystallization in micro flow systems - Pure · 2.2 Falling Film Micro Reactor ......
Evaporation and crystallization in micro flow systems
Moschou, P.
DOI:10.6100/IR769888
Published: 01/01/2014
Document VersionPublisher’s PDF, also known as Version of Record (includes final page, issue and volume numbers)
Please check the document version of this publication:
• A submitted manuscript is the author's version of the article upon submission and before peer-review. There can be important differencesbetween the submitted version and the official published version of record. People interested in the research are advised to contact theauthor for the final version of the publication, or visit the DOI to the publisher's website.• The final author version and the galley proof are versions of the publication after peer review.• The final published version features the final layout of the paper including the volume, issue and page numbers.
Link to publication
Citation for published version (APA):Moschou, P. (2014). Evaporation and crystallization in micro flow systems Eindhoven: Technische UniversiteitEindhoven DOI: 10.6100/IR769888
General rightsCopyright and moral rights for the publications made accessible in the public portal are retained by the authors and/or other copyright ownersand it is a condition of accessing publications that users recognise and abide by the legal requirements associated with these rights.
• Users may download and print one copy of any publication from the public portal for the purpose of private study or research. • You may not further distribute the material or use it for any profit-making activity or commercial gain • You may freely distribute the URL identifying the publication in the public portal ?
Take down policyIf you believe that this document breaches copyright please contact us providing details, and we will remove access to the work immediatelyand investigate your claim.
Download date: 26. Jun. 2018
Evaporation and Crystallization
in Micro Flow Systems
PROEFSCHRIFT
ter verkrijging van de graad van doctor aan de Technische Universiteit Eindhoven, op gezag van de rector magnificus, prof.dr.ir. C.J. van Duijn, voor een
commissie aangewezen door het College voor Promoties, in het openbaar te verdedigen op maandag 17 maart 2014 om 16:00 uur
door
Parthena Moschou
geboren te Katerini, Griekenland
Dit proefschrift is goedgekeurd door de promotoren en de samenstelling van de promotiecomissie is als volgt: voorzitter: prof.dr.ir. R.A.J. Janssen 1e promotor: prof.dr.ir. J.C. Schouten copromotor(en): dr. M.H.J.M. de Croon dr.ir. J. van der Schaaf leden: prof.dr. G.J. Witkamp - TU Delft prof.dr. A. Gavriilidis - University College London prof.dr. V. Hessel Dr. P. Löb – Fraunhofer ICT-IMM


Eindhoven University of Technology
A catalogue record is available from the Eindhoven University of Technology Library
Moschou, Parthena Evaporation and Crystallization in Micro Flow Systems
ISBN: 978-90-386-3573-6
Cover Image: Benzoic Acid Melt Crystal, 40x, polarizing microscope, ©2013 Doug Craft, all rights reserved

Table of Contents
Summary ix 1 Introduction 1 1.1 Downstream processing .......................................................................................... 1 1.2 Micro process technology ....................................................................................... 2 1.3 Objectives of this thesis ........................................................................................... 3 1.4 Outline ....................................................................................................................... 4 2 Continuous separation in micro systems – a review on solvent removal and crystallization 5 2.1 Solvent removal ........................................................................................................ 6 2.2 Falling Film Micro Reactor ..................................................................................... 8 2.3 Crystallization ........................................................................................................... 11 2.3.1 Precision and control .................................................................................. 12 2.3.2 Intensified mixing ....................................................................................... 13 2.3.3 Droplet based crystallization ...................................................................... 20 3 Mass transfer model of solvent evaporation in a FFMR 25 3.1 Introduction .............................................................................................................. 26 3.2 Materials .................................................................................................................... 26 3.3 Modelled geometry .................................................................................................. 27 3.4 Gas side mass transfer model ................................................................................. 28 3.4.1 Numerical model ......................................................................................... 28 3.4.2 Semi-analytical model ................................................................................. 31 3.4.3 Results ........................................................................................................... 33 3.5 Liquid-Gas mass transfer model ............................................................................ 36 3.5.1 Model development ..................................................................................... 36

vi Table of Contents
3.5.2 Results ........................................................................................................... 39 3.6 Concluding remarks ................................................................................................ 43 4 Liquid flow rate effects during partial evaporation in a FFMR 45 4.1 Introduction .............................................................................................................. 46 4.2 Materials and methods ............................................................................................ 46 4.2.1 Materials ....................................................................................................... 46 4.2.2 Experimental setup and procedure ........................................................... 46 4.3 Microscope observations for the liquid flow profiles ......................................... 48 4.4 Results ........................................................................................................................ 51 4.4.1 Temperature measurements ...................................................................... 51 4.4.2 Evaporation rate measurements ................................................................ 52 4.5 Heat transfer model ................................................................................................. 54 4.6 Concluding remarks ................................................................................................ 61 5 Solvent evaporation experiments in the FFMR 63 5.1 Introduction .............................................................................................................. 64 5.2 Materials and methods ............................................................................................ 64 5.2.1 Materials ....................................................................................................... 64 5.2.2 Experimental setup and procedure ........................................................... 65 5.2.3 STACK-1x-FFMR-Lab-V2 ......................................................................... 66 5.3 Gas side mass transfer measurements ................................................................... 67 5.3.1 Liquid recirculation experiments .............................................................. 67 5.3.2 STACK-1x-FFMR-Lab-V2 experiments .................................................. 70 5.3.3 Gas side mass transfer model validation .................................................. 75 5.4 Toluene/benzoic acid evaporation measurements .............................................. 76 5.4.1 Effect of recirculation on concentration .................................................. 76 5.4.2 Results ........................................................................................................... 79 5.5 Process efficiency ..................................................................................................... 81 5.6 Concluding remarks ................................................................................................ 83 6 Preliminary study on ultrasonication enhanced continuous crystallization 85 6.1 Introduction .............................................................................................................. 86 6.2 Materials and methods ............................................................................................ 87 6.3 Results ........................................................................................................................ 90

Table of Contents vii
6.3.1 Crystals shape and size observations ........................................................ 91 6.3.2 Effect of ultrasonic irradiation on crystal size ......................................... 94 6.3.3 Crystallinity measurements ........................................................................ 95 6.3.4 Purity measurements .................................................................................. 97 6.4 Conclusions and outlook ........................................................................................ 98 7 Conclusions and recommendations 101 7.1 Conclusions .............................................................................................................. 101 7.2 Recommendations ................................................................................................... 103 References 107 Nomenclature 117 List of publications 121 Acknowledgements 123 About the author 127

Evaporation and Crystallization in Micro Flow Systems
Micro process technology is yet to be applied in the production of fine chemicals and
pharmaceuticals, due to the lack of appropriate continuous separation methods. A continuous production line fully based on micro technology would combine the cost benefits of continuous operation with the advantages of micro reactors. The high heat and mass transfer rates and small volumes involved with such systems lead to improved product yield and quality and safer operation. This thesis describes the application of micro technology for continuous separation methods, with the goal of implementation in an industrial production line.
Solvent removal and crystallization are two very important steps of the work up facilities
in a chemical production plant. Solvent removal in a micro reactor based system can be performed with the use of a contactor providing the gas-liquid interface for evaporation or stripping to take place, and/or the use of a carrier gas. The goal of the process is to concentrate a product/solvent stream by controlled evaporation and reach high concentrations close to solubility. The subsequent process of crystallization is the most challenging for micro systems, as very few micro devices have the capability of handling solids without blocking.
In this work, solvent evaporation is performed in a falling film micro reactor (FFMR),
used as a contactor, with nitrogen as a carrier gas to enable high mass transfer rates at moderate temperatures. Evaporation of pure isopropyl-alcohol and toluene are investigated
Summary
x Summary
for the determination of the gas side mass transfer coefficient, while a solution of benzoic acid in toluene is the model system for product/solvent evaporation.
Two mass transfer models are developed to describe solvent evaporation in the FFMR,
through simulations for laminar flow and by solving the mass balance equations; both models give similar results. The semi-analytical model based on the mass balance equations gives faster predictions of the evaporation results, while the numerical model is used for more detailed information about evaporation throughout the contactor’s length. It is found that due to the thin liquid films obtained in the FFMR the overall mass transfer is dominantly controlled by the gas side resistance for a large range of operating conditions; it is therefore possible to control evaporation by adjusting the gas volumetric flow rate.
Channel wetting during evaporation is found to have a significant effect on the process
efficiency. Visual observations and experimental measurements indicate that one or more of the channels dry out, leading to a decrease in interfacial area and therefore lower mass transfer rates and temperatures than expected. A heat transfer model is developed solving the heat balance equations and theoretical calculations for the heat transfer coefficients and it is found that the liquid temperature is expected to be almost uniform at all investigated liquid flow rates. The low temperature measurements that are obtained at low liquid flow rates can be fitted to the model by adjusting the degree of channel wetting. It is found, however, that channel drying occurs at relatively high flow rates, above the estimated minimum wetting limit. Evaporation seems to enhance liquid maldistribution, as small deviations in film thickness can lead to enhanced local heat and mass transfer rates, leading to even higher flow deviations between the channels that eventually lead to drying.
Liquid recirculation is investigated as a method to improve channel wetting and the
effect of recirculation on the process efficiency is found to be very small at the investigated range of concentrations and mass transfer rates. A second version of the contactor is also tested, as an improved liquid distribution system is expected to have a beneficial effect on channel wetting. Evaporation in both contactors is performed successfully without channel drying for low liquid flow rates between 1 and 3 ml min-1 and high mass transfer rates are achieved at relatively low temperatures, with gas side mass transfer coefficients in the range of 0.007 – 0.01 m s-1.
Summary xi
The challenge during evaporation in the FFMR is the formation of crystals at the sharp edges of the contactor’s plate that can occur at high concentrations, even when the liquid bulk concentration is below the solubility limit. The improved liquid distribution of the second version of the contactor minimizes this undesired crystal formation by preventing liquid to be in contact with the edges of the plate, and allows for higher concentrations to be achieved. The concentration of the toluene/benzoic acid stream can be more than doubled and reach 90% of the solubility limit, at a temperature 20 °C below the solvent’s boiling point. Experimental measurements of mass transfer and concentration are predicted within an error of ± 15% by the described mass transfer model, which provides a tool for tailoring the end product concentration by adjusting the operating conditions.
A method for crystallization of the concentrated solvent/product stream is finally
investigated, based on ultrasonic irradiation. Cooling crystallization of benzoic acid is performed in an ultrasonicated tubular crystallizer, with an internal diameter of 2 mm, at relatively low supersaturation values. Channel blockage is successfully prevented by the ultrasound and a dense slurry of crystals is produced, flowing continuously in the tube. It is found that the crystals appear within 2 to 5 residence times, indicating that nucleation occurs at the walls of the channels, where cavitation by the ultrasound is more intense. The large role of cavitation in nucleation is expected for the investigated range of superaturation, with ratios below 1.8. The crystallinity and purity of the crystals is high, but no dependence on supersaturation or residence time is identified for the average crystal size in the investigated range of conditions. This study opens a wide variety of opportunities for the application of ultrasonic irradiation in microfluidic systems, enabling solids handling both for reaction and separation purposes.


1.1 Downstream processing
Separation equipment occupies the largest part of a production process as a large number of steps are required after the reactor for the formation of the final product. Downstream processing refers to all the separation and purification steps in the production of chemical and pharmaceutical compounds, which include a variety of operations for performing phase separation of insolubles, solvent removal and final product purification.
In the fine chemical and pharmaceutical industry these processes are performed in batch or semi-batch mode. Production is managed in the form of campaigns, which include the reaction and work-up steps required for the production of a specific amount of product. Batch or semi-batch processes have the advantage of versatility, as a reaction vessel can be used for a variety of different reactions, as well as many downstream operations such as distillation, extraction and crystallization. A typical batch production campaign can last approximately 4 – 8 weeks and is usually followed by a 2 – 3 week cleaning procedure (Roberge et al., 2005). Several consecutive reactions are typically performed without intermediate work-up as long as the product quality is not decreased, so that the number of downstream operations is optimized. Still the downstream processing unit operations are the largest part of the production equipment, with a batch reactor accounting for only 15% of the total capital cost (Roberge et al., 2005).
Introduction

2 Introduction
Continuous processes can diminish the cost of work-up facilities by smaller volume requirements, which can also lead to increased safety in cases of handling hazardous materials. The low production per annum that is required in pharmaceutical industry, however, intensifies the need for multi-purpose plants, which have been a synonym for batch reactors in the past. The modular approach that comes along with micro reactor technology might be the key to the development of continuous versatile equipment for fine chemical and pharmaceutical production.
1.2 Micro process technology Microreactors have been highly investigated through the past two decades and the number of chemical reactions and operations being successfully performed in such devices is steadily increasing. One of the great advantages that make such systems appealing for commercial application is the extremely high surface to volume ratio, leading to very high heat and mass transfer rates, with easy process control and therefore increased process safety. The possibility to operate safely at extreme conditions, combined with the intensified heat and mass transfer rates of such devices lead to higher selectivity and conversion rates. Finally, the numbering up approach that can be used for production scale up eliminates the challenges of scaling up conventional batch equipment without sacrificing on product quality.
Although microreactors have long been investigated, separation processes in such systems have only gained particular attention in the past few years. A trend for a complete micro device based production process has been identified and a network of microreactors and separators have been demonstrated as a platform for continuous synthesis of a family of chemical compounds (Sahoo et al., 2007). It should be noted, however, that the application of microreactors for industrial production would entail the parallelisation of a large number of microchannels or microchips, which would lead to very high requirements for expensive process control. A distinction between microreactors and microstructered reactors is made by Hessel et al. (2004), in which the latter are described to have larger outer dimensions and higher throughput capability, and therefore are more suitable for production.
Several successful applications of microreactors with potential of commercial
application have been reported in literature (Pennemann et al., 2004; Watts and Haswell, 2005). The cost benefits of replacing the conventional batch reactor with a continuous one,
Chapter 1 3
incorporating microreactor technology, have also been investigated. Apart from yield improvement and high automation, which are the main reasons for reduced operational costs, new reaction pathways that might be enabled by such systems may lead to more cost efficient processes (Roberge et al., 2005). It is highlighted, however, that a challenge in incorporating micro process technology in industrial production still lays in the handling of solid materials.
1.3 Objectives of this thesis
The main objective of this thesis is the investigation of new separation processes as part of a micro device based production system for fine chemical and pharmaceutical industry. Solvent removal is performed by evaporation in a falling film micro reactor, and crystallization of the concentrated product stream is performed in a micro capillary in the presence of ultrasonic irradiation.
The goal for solvent evaporation is the design of a system with well-defined mass transfer rates that gives the possibility for tailoring the final stream concentration and is capable of increasing the concentration to high values, close to the solubility limit. Crystal formation needs to be prevented so that continuous flow is not disrupted, and controlled crystallization can occur in a subsequent processing step. Processing at moderate temperature conditions and in versatile equipment is also crucial for application in pharmaceutical production. For a typical production capacity of 1 kg h-1 the desired capacity of the evaporation device is estimated to be less than 100 ml min-1 of the product/solvent stream.
The main objective for the crystallization device is to achieve production and handling of large amounts of solids in the small dimensions of a micro flow system. Crystallization investigations focus on the prevention of channel blockage, which is the main challenge with microfluidic systems, using ultrasonication. In an approach towards low energy consumption, the use of ultrasonication also enhances nucleation and enables crystallization at low supersaturation values that can be achieved at moderate temperatures.
4 Introduction
1.4 Outline The main characteristics of the investigated processes are described in Chapter 2, with a literature review on micro device based methods for evaporation and crystallization. The falling film micro reactor (FFMR) is also introduced and described in this introductory chapter.
Chapter 3 focuses on the theoretical description of mass transfer during evaporation in the FFMR. The gas side mass transfer coefficient is defined by numerical simulations and an existing Sherwood number correlation is validated. The overall mass transfer model and the effect of gas and liquid side resistance are investigated.
The degree of channel wetting is investigated in Chapter 4, where it is found that channel drying occurs during evaporation faster than it would during flow at a constant flow rate. A heat transfer model is developed and the results are compared with experimental temperature measurements, in order to quantify the number of wetted channels through an indirect approach.
The performance of the FFMR during solvent evaporation is evaluated in Chapter 5. Experimental measurements of mass transfer rate and concentration are explained according to the mass transfer model described in Chapter 3. The efficiency of the developed process is determined based on the ability of the device to produce a concentrated product/solvent stream.
In Chapter 6, a preliminary experimental study on continuous crystallization is described. Cooling crystallization is performed under ultrasonic irradiation and some effects of the ultrasonication are identified. The investigated parameters are temperature and residence time, and the produced solid materials are examined in terms of shape, average size, crystallinity and purity.
A summary of the most important results of this thesis is given in Chapter 7, with recommendations for future work towards the successful application of micro process technology in continuous industrial production.

Section 3 of this chapter is adapted from:
Moschou, P., Croon, M.H.J.M. de, Schaaf, J. van der, Schouten, J.C., 2013. Advances in continuous crystallization: towards microfluidic systems,
Reviews in Chemical Engineering, submitted.
Abstract
In this chapter an overview of microfluidic based separation methods is presented. Conventional distillation is replaced in microreactor based production by solvent evaporation in a gas-liquid contactor. The use of a membrane or mesh is discussed as a contactor and the introduction of an inert gas as a carrier for enhancing overall mass transfer. The falling film micro reactor, which is the contactor investigated for evaporation in this thesis, is described, and a short overview of existing applications is presented. Finally, an overview of continuous microfluidic crystallization methods is reported focusing on the points of improvement and the challenges that still remain.
Continuous separationin micro systems – a review on solvent removal and crystallization
6 Continuous separation in micro systems - a review
2.1 Solvent removal
The step of solvent removal in industrial production usually corresponds to large distillation columns operating at high temperatures. Apart from the growing need for continuous versatile equipment, which distillation columns do not meet, it is also a challenge to process thermolabile compounds or certain polymers at high temperatures. It is therefore necessary to manage separation of solvents at temperatures well below their boiling point.
Conventional distillation is based on the generation of a vapour phase above a liquid
through boiling and forcing this vapour into a cooling device for condensation. Gravitational forces enable the controlled boiling in a liquid reservoir, while the vapour is transported into the cooling device due to the continuous evaporation of liquid. Substituting gravitational forces by capillary forces has been proposed as a method to increase the specific interfacial area of mass transfer and improve separation efficiency (Seok and Hwang, 1985). This approach makes it possible to perform distillation in microfluidic devices but the volumetric flow rates that can be processed are very low and a stabilization method for the gas-liquid interface is typically required.
A method for enabling efficient distillation on microscale has been the use of a carrier
gas for transporting the vapour of the volatile component without boiling it (Wootton and DeMello, 2004). A microfluidic device with 50 μm deep microchannels and between 100 and 500 μm wide has been developed for continuous evaporation, which enables the separation of volatiles from a mixture according to their vapour pressure, at a temperature 20 °C lower compared to conventional distillation. Careful design of the microdevice ensures laminar flow conditions during operation, and a stable evaporation interface with minimal contamination of distillate.
The use of a carrier gas has been combined with a membrane based process in a sweep
gas membrane distillation micro separator (Adiche and Sundmacher, 2010). Membrane based separation methods, such as pervaporation, provide a stable gas-liquid contact area without hydrodynamic restrictions, allowing for a wide range of operating flow rates. Sweep gas membrane distillation combines the advantages of membrane distillation with the high permeate fluxes that are inherent to gas stripping methods. It was found that the inert gas flow rate was the most important parameter affecting separation efficiency, while

Chapter 2 7
temperature polarization effects that typically lead to low evaporation efficiency could be somewhat controlled by an appropriate selection of membrane contactor.
An alternative to membrane distillation on the micro scale has been the use of a metal
foam as distillation packing in a flat column (Sundberg et al., 2009). The metal foam has high porosity, good wetting characteristics and high permeability for the liquid phase, while preventing vapour flow to the liquid side. While adequate separation efficiency values were obtained, the challenge in heat control during distillation in micro devices is highlighted. Due to the high heat transfer rates that are achieved in such systems, the required temperature gradients can be challenging to obtain, and most importantly external heat losses can be difficult to control.
At large vapour pressure differences between the different components of a mixture, a
concentrated stream can be obtained by evaporation without the need for temperature gradients. Pervaporation is a membrane based evaporation method that has been used both for analytical (Timmer et al., 2003) and processing purposes (Ramprasad and Palmer, 2007). The liquid flow rate in the membrane concentrator for chemical analysis was as small as 7.5 μL min-1. In this study nitrogen was used as a carrier gas, enhancing evaporation rate by an increase in convective flow. In the work of Ramprasad and Palmer, no carrier gas was utilized and it was found that mass transfer was significantly restricted by the membrane resistance.
Some of the challenges that come along with membrane separation methods can be avoided by replacing the membrane contactor with a thin metal mesh. Such a mesh can have high porosity with well-defined pore size, smaller mass transfer resistance compared to conventional membranes and very good mechanical strength. A microstructured mesh contactor has been developed by Gavriilidis and co-workers, and used for hydrogenation with simultaneous stripping of the by-product (Zanfir et al., 2008). In this process solvent removal is enabled by a carrier gas, so unlike evaporation mass transfer is not only temperature driven. Mass transfer is mainly determined by the ratio of the inlet gas to liquid flow rate, and increases for increasing gas throughput. Gas stripping in a microfabricated device has also been performed for the removal of volatile organic compounds from water (Cypes and Engstrom, 2004). In this stripping column made of silicon, gas-liquid contact is made through perforations between the gas and liquid channels, which act like a silicon mesh between the two phases. Stripping efficiency was
8 Continuous separation in micro systems - a review
improved compared to a conventional packed tower, due to the small liquid film thickness that leads to higher mass transfer rates in the micro contactor.
Although the range of operating flow rates might be influenced, it is possible to enable
continuous gas-liquid contact without the use of a membrane or mesh. A falling film micro contactor enables the formation of a thin liquid film driven by gravity, with a distinct and continuous gas-liquid interface. A microstructured falling film evaporator was first used in the DEMiS® project for vaporization of hydrogen peroxide, as part of a pilot plant for propene conversion to propylene oxide (Klemm et al., 2006; Markowz et al., 2005). This type of micro contactor was firstly tested for separation by Kane et al. (2011). In this study an electrically heated, double-plate falling film contactor was used for the separation of ethanol and n-propanol, and it was found that dry zones occur at high heat flux or low feed flow rates.
The combination of the falling film micro contactor with a carrier gas stream was first
investigated for evaporation of hydrogen peroxide from an aqueous solution (Klemm et al., 2011). It was found that the micro contactor, made out of AlMg3, allows a safe and stable evaporation of hydrogen peroxide, with vapour/liquid equilibrium almost reached at the top of the evaporator. This method of evaporation in a falling film micro contactor with a carrier gas is extensively investigated in this thesis.
2.2 Falling Film Micro Contactor The falling film micro reactor (FFMR) utilizes the ability of a liquid stream to wet a surface and, governed by gravity forces, spread to form an expanded thin film. Guiding the liquid through microchannels leads to the formation of liquid films only a few tens of μm thin. The Institut für Mikrotechnik Mainz GmbH (IMM) has developed a series of FFMRs, with the most investigated one being the FFMR-Standard (Hessel et al., 2000; Wille, 2002; catalogue IMM “The catalogue, 5/09” available under www.imm-mainz.de). The reactor/contactor investigated in this thesis is the STACK-1x-FFMR-Lab (catalogue IMM “The catalogue, 5/09” available under www.imm-mainz.de) and it was developed using brazing technology to facilitate the use of very strong solvents and high pressure applications. In Chapter 5 a second version of this contactor with the nomination STACK-1x-FFMR-Lab-V2 is also discussed, after improvements in the distribution system made by IMM led to improved performance of the contactor during evaporation.
Chapter 2 9
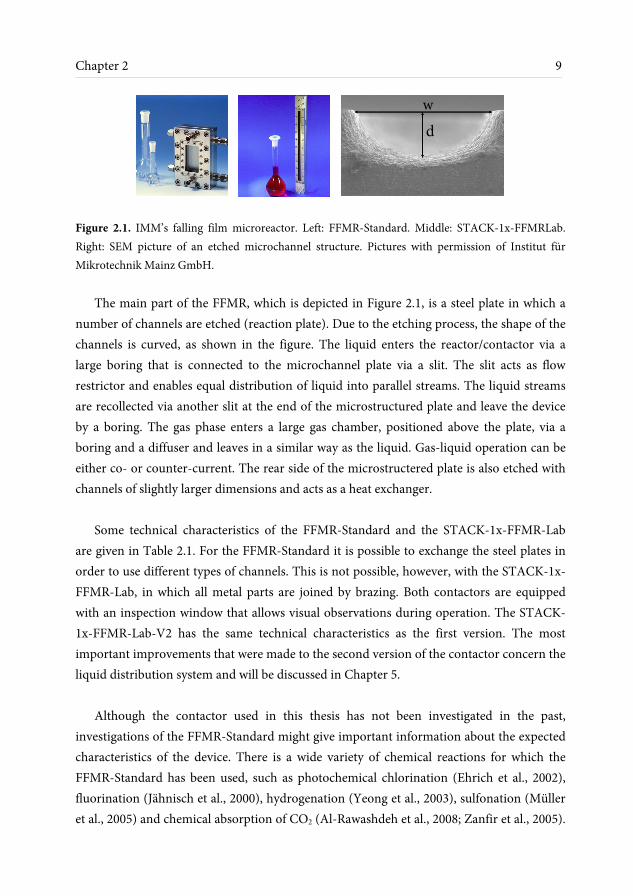
Figure 2.1. IMM’s falling film microreactor. Left: FFMR-Standard. Middle: STACK-1x-FFMRLab. Right: SEM picture of an etched microchannel structure. Pictures with permission of Institut für Mikrotechnik Mainz GmbH.
The main part of the FFMR, which is depicted in Figure 2.1, is a steel plate in which a
number of channels are etched (reaction plate). Due to the etching process, the shape of the channels is curved, as shown in the figure. The liquid enters the reactor/contactor via a large boring that is connected to the microchannel plate via a slit. The slit acts as flow restrictor and enables equal distribution of liquid into parallel streams. The liquid streams are recollected via another slit at the end of the microstructured plate and leave the device by a boring. The gas phase enters a large gas chamber, positioned above the plate, via a boring and a diffuser and leaves in a similar way as the liquid. Gas-liquid operation can be either co- or counter-current. The rear side of the microstructered plate is also etched with channels of slightly larger dimensions and acts as a heat exchanger.
Some technical characteristics of the FFMR-Standard and the STACK-1x-FFMR-Lab
are given in Table 2.1. For the FFMR-Standard it is possible to exchange the steel plates in order to use different types of channels. This is not possible, however, with the STACK-1x-FFMR-Lab, in which all metal parts are joined by brazing. Both contactors are equipped with an inspection window that allows visual observations during operation. The STACK-1x-FFMR-Lab-V2 has the same technical characteristics as the first version. The most important improvements that were made to the second version of the contactor concern the liquid distribution system and will be discussed in Chapter 5.
Although the contactor used in this thesis has not been investigated in the past,
investigations of the FFMR-Standard might give important information about the expected characteristics of the device. There is a wide variety of chemical reactions for which the FFMR-Standard has been used, such as photochemical chlorination (Ehrich et al., 2002), fluorination (Jähnisch et al., 2000), hydrogenation (Yeong et al., 2003), sulfonation (Müller et al., 2005) and chemical absorption of CO2 (Al-Rawashdeh et al., 2008; Zanfir et al., 2005).
dw

10 Continuous separation in micro systems - a review
Table 2.1. Technical specifications of FFMR-Standard and STACK-1x-FFMR-Lab.
FFMR-Standard STACK-1x-FFMR-Lab
Outer dimension (L x B x H) (mm) 120 x 76 x 40 294 x 28 x 19
Channel length (cm) 7.6 25
Gas chamber height (mm) 5 4
Channel dimensions (w x d) (number of channels per plate)
(μm)
300 x 100 (64 channels)
1200 x 400 (5 channels) or
600 x 200 (32 channels)
or 1200 x 400 (16 channels)
The two latter authors have developed a modelling description of CO2 absorption with a 2-D and a pseudo 3-D model respectively, giving good agreement with experimental data. A 2-D numerical investigation of the same process was performed by Chasanis et al. (2010), where the position of the gas-liquid interface was included in the model, resulting in a better agreement with the experimental data of Zanfir et al. (2005).
The hydrodynamic characteristics including the film thickness and the shape of the gas-
liquid interface have been calculated through CFD simulations by Ho et al. (2011). In their work the film thickness was compared to theoretical correlations of Nusselt, Kapitza and Feind with good agreement. Similar results were obtained experimentally by Yeong et al. (2006), where the film thickness was measured through laser scanning confocal microscopy. The liquid flow distribution was also investigated and the worst case for the liquid flow maldistribution was found at the lowest flow rate tested (Al-Rawashdeh et al., 2008). A similar study was made for a different type of microreactor, IMM’s FFMR-Large, for which the liquid film thickness was investigated by fluorescence microscopy (Tourvieille et al., 2013). For low liquid flow rates, film thickness differences up to 25% were observed at the centre of the contactor when compared with the edges. These studies refer to a constant liquid flow rate; however, the liquid flow profile is expected to be different and more complicated during evaporation especially at high mass transfer rates.

Chapter 2 11
Zhang et al. (2009) also studied the liquid film flow patterns and determined the liquid side mass transfer coefficient for the complete falling film flow pattern. The overall mass transfer coefficient was found to be independent of liquid flow rate by Monnier and Falk (2011), suggesting that the measured values describe the predominating gas side mass transfer coefficient. Mass transfer measurements for the gas side were finally performed by Commenge et al. (2011), who had previously investigated the gas-phase residence time distribution in the FFMR (Commenge et al., 2006), where it was found that the formation of recirculation loops at the gas inlet and an inlet jet effect considerably enhance the mixing in the gas phase and prevent the development of plug-flow behaviour in the gas phase of the FFMR-Standard.
2.3 Crystallization Crystallization has always been the most important separation and purification step in the production of solid materials in chemical industry, especially in fine chemicals and pharmaceuticals. Particle properties such as size, shape and size distribution have a tremendous effect on the particle behaviour during downstream processing and can determine the requirements for operations like filtration, drying and milling. Moreover, the effect that the crystal habit and crystal form have on the dissolution rate and solubility of pharmaceutical compounds explain the need for excellent control and tailoring of such properties. Due to the high reproducibility which is mandated by the strict regulations on product quality, the manipulation of the particle size distribution in order to narrow the size range has been extensively investigated in literature.
Mixing is one of the most important features that affects the particle size distribution and at the same time one of the main challenges during scale up of batch processes. Mixing quality is significantly decreased with an increasing vessel volume under constant overall power (Tung, 2013), and the product quality obtained in the laboratory is difficult to maintain in high scale production. For this reason continuous crystallization methods with a focus in mixing optimization have been extensively investigated as a more versatile option, and more recently microfluidic systems have been developed for crystallization, eliminating such scale up challenges.
Intense mixing, well defined residence times and excellent heat transfer control are only
a few characteristics of micro devices that fuel the drive towards their application in
12 Continuous separation in micro systems - a review
crystallization methods. The main challenge in microfluidic crystallization systems is to prevent channel blockage, which can easily happen due to crystal formation on the channel walls or agglomeration leading to bridging of crystals between the walls (Hartman et al., 2010). For this reason, many of the applications investigated in literature discuss the production of particles in the nano scale size range, although larger particles in the scale of several μm have also been reported.
The following discussion of microreactor based crystallization methods is divided in
three different sections, according to the main point of interest for the utilization of micro systems. The first point that has been identified is the accurate control and precision that can be achieved due to the well-defined residence times. This is a more general utilization of the microreactor advantages in the production of particles. However, most microfluidics applications in crystallization that are found in literature are focused in two main points: intensified mixing and droplet based crystallization.
2.3.1 Precision and control The well controlled characteristics of microreactors have been utilized in the production of nanoparticles. A Pyrex glass microchip has been used for reactive seeded crystallization of gold nanoparticles, with three different microfluidic ports for the entrance of the seed solution, ascorbic acid and chloroauric acid (Wagner et al., 2004). Particles were produced without blocking of the channels, and their size could be controlled by adjusting the flow rate of the reactants.
Drug carrier nanoparticles have also been produced by melt crystallization in a micro heat exchanger (Jasch et al., 2009). The heat exchanger consists of a metal plate with rectangular (0.4 x 0.4 mm or 0.2 x 0.2 mm) milled microchannels, kept in a polymer casing. Due to the high and well defined cooling rates of the device high supersaturation was achieved quickly and fast crystallization was induced, preventing the formation of unwanted polymorphs. Uniform and reproducible particles were produced without agglomeration and without fouling of the heat exchanger.
Chapter 2 13
2.3.2 Intensified mixing Depending on the size of the microchannel and the produced particles, both axial and radial dispersion in single flow systems can be the cause for polydispersity in the resulting particle sizes. Rapid mixing at the entrance point of the crystallizer has always been a key parameter for enhancing the uniformity of the produced crystals and several methods have been employed for intensifying mixing using microfluidics. Several types of mixers have been used in crystallization systems: the simple T-mixer, the grid mixer, the jet mixer, flow focusing mixing or other types of micro mixers. Flow segmentation has also been investigated as a method to minimize axial dispersion and produce uniform crystals, due to the internal circulation between discrete slugs that enhances mixing. T-mixer
Crystallization with a T-mixer is typically performed using the mixer connected to a tube or capillary. After a well-mixed homogeneous solution or suspension is produced in the mixer, crystallization takes place in the tubular reactor. In an investigation of barium sulphate precipitation with a T-mixer and a 0.5 mm feed tubing, it was found that increasing the flow rate and the mixing intensity leads to a narrower particle size distribution with a smaller mean size (Gradl et al., 2006; Schwarzer and Peukert, 2002). This can be explained by the higher supersaturation values that can be achieved much faster with intensified mixing, which enhances crystal nucleation at the expense of crystal growth.
T-mixers with tubing on the millimetre scale have been used for reactive crystallization of benzoic acid (Ståhl et al., 2001) and magnetic nanoparticles (Cote et al., 2002; Hao and Teja, 2003). In the case of benzoic acid, crystallization kinetics were investigated and the use of a powerful mixer before nucleation eliminated the influence of mixing on kinetics. A mixer made of Perspex was used, with inlet and outlet tubing of 1 mm and 2 mm diameter respectively, and particles in the range of a few μm were produced. Magnetic nanoparticles were produced by hydrothermal synthesis in a 6 mm (O.D.) stainless steel tube connected to a T-mixer, and it was found that precipitation mainly occurred in the mixer while growth and secondary changes, like recrystallization and aggregation, would occur in the tubular crystallizer. Despite the size of the crystals, which was smaller than 25 nm, the mixer was blocked during operation due to the sudden production of particles.
14 Continuous separation in micro systems - a review
A coiled tube stainless steel reactor (0.15 and 0.59 mm I.D.) has been used connected to a T-mixer for the hydrothermal synthesis of ZnO nanoparticles (Sue et al., 2004). The setup is similar to the hydrothermal synthesis of magnetic nanoparticles, with an additional mixer at the exit of the reactor for the fast cooling of the outlet stream by mixing with cold water. Similar size nanoparticles were produced and no blockage of the mixer or the reactor was reported.
Silicon chips with a T-shaped mixing element and short mixing channels have been
used for the production of barium sulphate nanoparticles (Kockmann et al., 2008). Different chips have been fabricated with channel dimensions in the range of 300 μm to 600 μm, and a channel length of 1 or 3 mm. Narrow size distributions and crystals smaller than 150 nm were obtained, but gradual fouling on the glass lid of the microchip is reported as a challenge for long term continuous operation.
Grid mixer
Very similar to the T-mixer, the grid mixer has a T-shaped geometry but contains four wire grids in the mixing chamber to induce turbulence. The inlet tubing is 20 μm in diameter and is very narrow compared to the 0.57 mm mixing chamber, with the overall characteristics of the mixer leading to very fast and efficient mixing. It has also been used for kinetic studies of crystallization, as mixing effects on kinetics are eliminated (Mahajan and Kirwan, 1994, 1993). Jet mixer
The main characteristic of the jet mixer is the storage of the reagents in pressurized vessels and the small nozzles at the feed points of the mixer that create the impinging jet effect upon entering the mixing chamber. Merck & Co developed a system for rapid crystallization of pharmaceuticals with a glass mixing chamber, housing two stainless steel nozzles of 1 mm in diameter (Midler et al., 1994). Production of calcium oxalate with this system was found to have very high sensitivity to flow disturbances, as high variations in the polymorph ratios were observed between identical runs (Hacherl et al., 2003). However a clear indication of narrowing size distribution with increasing jet velocities was reported. Crystallization in a Y-shaped jet mixer has also been investigated and modelled with a hybrid computational fluid dynamics and process simulation method (Choi et al., 2005).

Chapter 2 15
Results showed that although the mixing time was very short, the mixing effect was important on a small scale. Flow focusing mixing
Extremely fast mixing can be achieved by hydrodynamic flow focusing in a microfluidic channel. In this method one of the streams to be mixed flows along the central channel, while the second stream flows in two adjacent channels at higher flow rates (Figure 2.2). When the streams meet, the central stream is squeezed into a narrow stream between the two adjacent ones, with very small diffusion lengths and therefore decreased mixing times. The formation of the central jet can be adjusted by the volumetric flow rates of each stream. The velocity profile at the central focused jet, where the crystallization takes place, is almost flat and can be very well described as plug flow. At the same time, the particles are constricted in the central focused stream and are not in contact with the channel walls, preventing in this way precipitation on the walls that can lead to clogging.
Drug carrier polymeric nanoparticles have been produced in a flow focusing micro channel with the potential for tailored properties by tuning the mixing intensity (Karnik et al., 2008). The PDMS channel was 20 μm wide, 60 μm high and 1 cm long, and achieving the constriction of an organic phase between the two adjacent streams of water was relatively easy. By increasing the ratio of water the mixing time was decreased, therefore a decreased particle size was obtained with a slightly narrower size distribution. Parameters such as the polymer composition and concentration were also investigated and an effect on particle properties such as size, polydispersity, drug loading and release, has been identified.
Figure 2.2. Flow focusing mixing principle (Karnik et al., 2008). Solution A is focused into a thin stream, between two adjacent streams of solution B and very fast mixing occurs due to the small diffusion lengths.
solution A
solution B
solution B

16 Continuous separation in micro systems - a review
The same technique has been used for the production of goethite in a 1.7 mm in diameter and 3 cm long PDMS channel, and a glass central capillary with a diameter of 150 μm (Abou Hassan et al., 2008). Experiments in a Y-shaped microreactor led to channel clogging, but no such issues where observed during flow focusing production. This mixing reactor was combined with an aging reactor, a 150 cm long microtubular coil, in order to physically separate the nucleation from the growth process (Abou Hassan et al., 2009). This is a way to obtain uniform particles without sacrificing on particle size, since very uniform small crystals are formed in the mixing/nucleation reactor and further nucleation is very limited in the aging reactor.
Other mixer types
A method very similar to the T-mixer is the Y-mixer which will also be discussed further in the following section. Reactive precipitation of calcium carbonate has been performed in square microchannels made of Perspex, with a 2 mm or 1 mm diagonal line, 0.172 m or 0.19 m long respectively (Trippa and Jachuck, 2003). The Perspex chip had a short Y-mixer connected to the inlet tubing for feeding the different streams to be mixed. Particles in the size range of a few μm were produced, with higher yield and smaller mean size compared to experiments in a well stirred vessel.
Production of metal nanoparticles has been investigated in a static chip mixer with split and recombine units, explained in Figure 2.3 (Köhler et al., 2008; Wagner and Köhler, 2005). The silicon/glass chip has an overall volume of 8.5 μL, channel widths ranging between 0.2 and 0.7 mm, and two or three inlet points for the different reagents. If necessary a fourth reagent is added at the exit of the chip with a T-mixer. The length of the connecting tube between the chip and the T-mixer is an important parameter that can be used to control residence time before that last reagent addition. Gold and gold/silver nanoparticles have been produced and the great influence of the flow rate ratio of the reactants, and therefore the mixing intensity, on the particle size was identified.
Production of pigment powders with microreactor technology has been patented by
Clariant (Nickel et al., 2001), and a number of different micro mixers have been investigated for the synthesis of yellow and red azo pigments (Wille et al., 2004). The helical static mixer by Statiflo International, the caterpillar mixer designed by IMM (Institut für Mikrotechnik Mainz GmbH), the PCR microreactor by Heatric and the micro-jet reactor by

Chapter 2 17
Figure 2.3. Schematic view of a mixer with eight split and recombine units, two inlet ports and one outlet (Wagner and Köhler, 2005).
Synthesechemie GmbH were all studied for the mixing quality and ability to produce the pigment powders. All devices have been successfully used for the synthesis of the yellow pigment with enhanced coloristic properties in a microreactor technology pilot plant, while synthesis of the red pigment failed due to blockage. Synthesis of a yellow pigment has also been successfully performed with an interdigital mixer developed by IMM (Pennemann et al., 2005), leading again to enhanced coloristic properties and narrower particle size distribution compared to a typical batch process. Still commercial application is not yet possible, due to the very narrow range of operating conditions that is required by the complexity of the mixers’ geometry, but it is highlighted that improving the quality of micro devices can and will lead to a wider variety of successful applications.
Segmented flow
The segmented flow tubular reactor (SFTR) was developed and patented as a method to reduce axial dispersion and enhance particle uniformity (Donnet et al., 2000; Jongen et al., 2003; Lemaître et al., 2002; Vacassy et al., 2000). In this reactor an immiscible phase, typically air, is used to create individual microvolumes with higher homogeneity compared to large volumes, prevent backmixing and ensure plug flow leading to narrower size distributions. The SFTR consists of a Y-type mixer or a cross mixer made of Plexiglas, connected to a PTFE tubular reactor (4 mm I.D.). As described in Figure 2.4, the mixer has three inlet ports, two for the reagent streams and one for the immiscible fluid, so mixing and segmentation occur simultaneously in the mixing chamber. Calcium carbonate particles in the size range of a few μm with controlled characteristics were produced continuously for a period of 25 hours, and with very similar products for different flow
1 2
3
5
4
7
6
8

18 Continuous separation in micro systems - a review
Figure 2.4. Schematic view of the SFTR with a cross mixer on the left and a Y-mixer on the right part of the picture (Vacassy et al., 2000). rates. It was observed that additionally to the described function of segmentation that leads to homogeneous precipitation conditions, air also acts as a purge that prevents fouling in the capillary.
Precipitation of magnesium hydroxide has also been performed in a very similar setup, with the mixer connected to a square channel of two different cross-sectional areas (1 and 2 mm2) (Shirure et al., 2005). The narrower channel leads to more uniform and smaller particles and with lower power consumption, leading to a much more efficient process.
A more recent development is the segmented flow microreactor, a chip with several inlet
ports, one of which is used for feeding air or nitrogen as the immiscible phase (Khan et al., 2004; Sultana, 2010). Several types of PDMS microreactors were tested for the synthesis of colloidal silica. The microfabricated channels are 150 μm deep and can be as long as 2.3 m, with a serpentine arrangement on the chip. A laminar flow reactor was designed as a benchmark, with only two inlet ports and no segmentation, while two segmented flow reactors where tested, with three and five inlet ports. It was clear that with the laminar flow design, monodisperse particle distribution was only feasible under a narrow range of operating conditions and more difficult at low residence times. Segmented flow reactors eliminate axial dispersion and were successfully used for tuning the size and distribution of the obtained particles.
This type of microreactor has been modified for the synthesis of titania shells on colloidal silica, and has three inlets ports with an additional fourth one that splits into eight streams, branching into the main reaction channel at eight evenly spaced feed points (Khan and Jensen, 2007). Two modes of operation are investigated, and as can be seen in Figure 2.5, only three of the four inlet ports are being used. It is known that very
immiscible
phase (air)
immiscible
phase (air)
Reagent A
Reagent B Reagent B
Reagent A

Chapter 2 19
Figure 2.5. Schematic view of the microreactor in two different modes of operation: (a) with TEOT introduced at the initial part of the chip, and (b) with multi step addition of TEOT through the side manifold of inlet 4 (Khan and Jensen, 2007).
monodisperse spherical silica particles can be produced, but the addition of titanium tetraethoxide (TEOT) in the initial part of the chip and before segmentation (Figure 2.5a) led to a polydisperse mixture of primary coated particles, secondary titania particles and large particle agglomerates. Multi step addition of TEOT through the fourth inlet port (Figure 2.5b), is the continuous flow equivalent of the drop-by-drop method, and preserves the monodispersity of the obtained nanoparticles.
A segmented microreactor with different temperature zones has been developed for the production of cadmium selenide quantum dots (QDs) (Marre et al., 2008; Yen et al., 2005). This is a similar silicon-Pyrex microchip with a serpentine channel arrangement and three inlet ports. It consists of a 0.1 m long mixing zone maintained at room temperature and a 1 m long reaction zone which is heated up to 350 °C. The two zones were separated by a thermally isolating halo etch that allowed for temperature gradients higher than 25 °C mm-1. This design was combined with the use of supercritical hexane as a solvent, and a high pressure high temperature microreactor process was developed. The low dispersity caused by segmented flow, combined with the low viscosity of supercritical hexane that narrows residence time distribution, and the high supersaturation that it causes as a solvent, lead to a significantly narrowed size distribution of the produced nanocrystals.
More recently, a particle image velocimetry study was made for a silicon/Pyrex
segmented microreactor during the production of gold nanoparticles (Cabeza et al., 2012). According to the results of this study the reduced axial dispersion in segmented flow is not the main reason for the resulting narrow size distributions. The slip velocity between the two fluids and the internal mixing through recirculation within the continuous phase slugs
~ ~ ~~
1
2 3 4
Reagent A
Reagent B
(TEOT)N2
~ ~ ~~
1
2 3 4
Reagent A
Reagent B
(TEOT)N2
(a) (b)
outlet outlet
20 Continuous separation in micro systems - a review
have the highest impact on the particle size distribution. This means that the physical properties of the two phases and the inlet flow rates have a substantial effect on particle growth, and both need to be chosen very carefully. In this investigation air, toluene and silicone oil were tested as the dispersed phase, and air was found to provide the best internal mixing within the continuous phase, and therefore more monodisperse gold nanoparticles.
2.3.3 Droplet based crystallization Droplet based methods are somewhat similar to segmented flow, with the crystallization taking place in the dispersed phase. The formation of small monodisperse droplets ensures perfect mixing and uniform conditions, while preventing the contact of crystals with the channel walls. Crystallization in a sufficiently small droplet can also ensure that crystal nucleation is homogeneous, with the possibility of encapsulating a single nucleus in one droplet. For this reason droplet based crystallization has been a very useful tool in kinetic studies and screening of crystallization parameters.
Due to the nanolitre volumes involved in such methods, protein crystallization screening, which requires a large number of tests with valuable materials, has been investigated in this type of microfluidics systems. Such methods are beyond the scope of this review, which is mainly focused on continuous crystallization with applications in production. An overview of microfluidic crystallization used for protein screening studies can be found elsewhere (Leng and Salmon, 2009).
These types of microfluidic crystallization are characterized by the method used for the
formation of the droplets. A system for droplets formed by two different reagents has been described and used for the synthesis of cadmium selenide (Shestopalov et al., 2004; Song et al., 2003). The developed microfluidic device is made of hydrophobic PDMS and has rectangular channels 50 x 50 μm, in a serpentine arrangement with an initial mixing section that enables chaotic advection (Figure 2.6). To avoid contact between the reagents before the droplet formation the two solutions are fed in a microchannel as two laminar streams, separated by a centre stream of an inert liquid. The three streams enter the main microchannel, where a water immiscible oil phase flows continuously, and they spontaneously break up into droplets. The periodic alternating motion of the walls that results from the channel arrangement induces unsteady, chaotic flow that ensures the fast mixing of the different reagents in the droplet. Synthesis of cadmium selenide nanoparticles
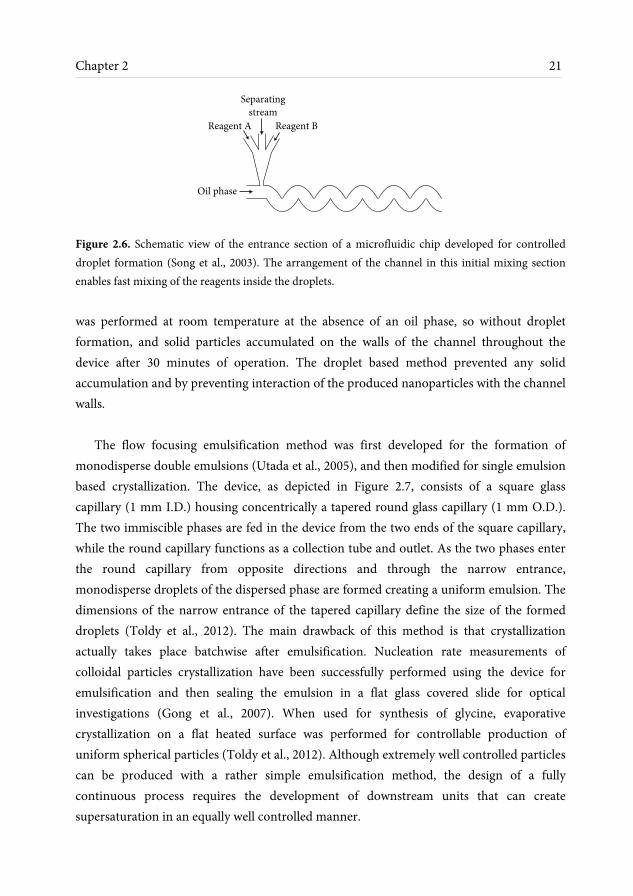
Chapter 2 21
Figure 2.6. Schematic view of the entrance section of a microfluidic chip developed for controlled droplet formation (Song et al., 2003). The arrangement of the channel in this initial mixing section enables fast mixing of the reagents inside the droplets.
was performed at room temperature at the absence of an oil phase, so without droplet formation, and solid particles accumulated on the walls of the channel throughout the device after 30 minutes of operation. The droplet based method prevented any solid accumulation and by preventing interaction of the produced nanoparticles with the channel walls.
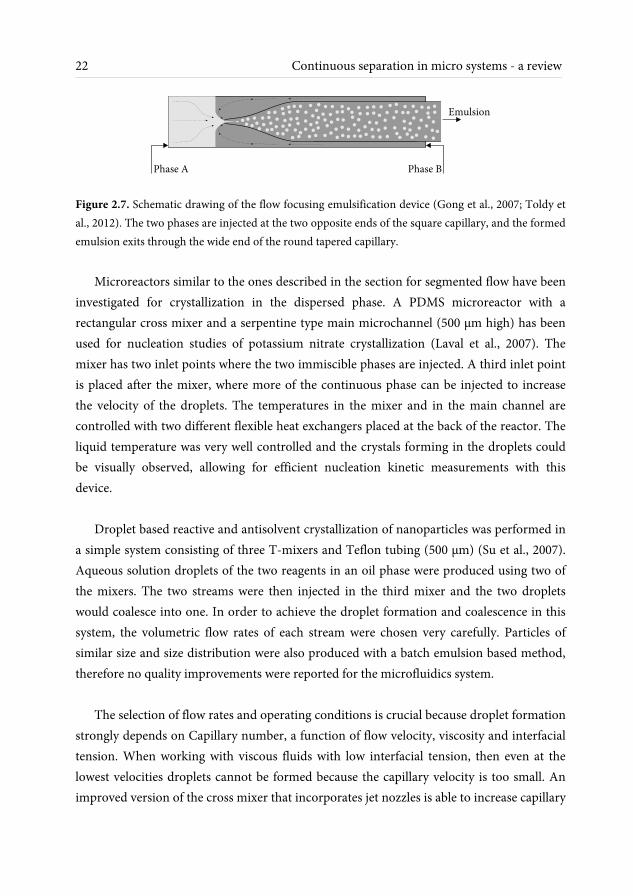
The flow focusing emulsification method was first developed for the formation of
monodisperse double emulsions (Utada et al., 2005), and then modified for single emulsion based crystallization. The device, as depicted in Figure 2.7, consists of a square glass capillary (1 mm I.D.) housing concentrically a tapered round glass capillary (1 mm O.D.). The two immiscible phases are fed in the device from the two ends of the square capillary, while the round capillary functions as a collection tube and outlet. As the two phases enter the round capillary from opposite directions and through the narrow entrance, monodisperse droplets of the dispersed phase are formed creating a uniform emulsion. The dimensions of the narrow entrance of the tapered capillary define the size of the formed droplets (Toldy et al., 2012). The main drawback of this method is that crystallization actually takes place batchwise after emulsification. Nucleation rate measurements of colloidal particles crystallization have been successfully performed using the device for emulsification and then sealing the emulsion in a flat glass covered slide for optical investigations (Gong et al., 2007). When used for synthesis of glycine, evaporative crystallization on a flat heated surface was performed for controllable production of uniform spherical particles (Toldy et al., 2012). Although extremely well controlled particles can be produced with a rather simple emulsification method, the design of a fully continuous process requires the development of downstream units that can create supersaturation in an equally well controlled manner.
Separating
stream
Oil phase
Reagent A Reagent B
22 Continuous separation in micro systems - a review
Figure 2.7. Schematic drawing of the flow focusing emulsification device (Gong et al., 2007; Toldy et al., 2012). The two phases are injected at the two opposite ends of the square capillary, and the formed emulsion exits through the wide end of the round tapered capillary.
Microreactors similar to the ones described in the section for segmented flow have been investigated for crystallization in the dispersed phase. A PDMS microreactor with a rectangular cross mixer and a serpentine type main microchannel (500 μm high) has been used for nucleation studies of potassium nitrate crystallization (Laval et al., 2007). The mixer has two inlet points where the two immiscible phases are injected. A third inlet point is placed after the mixer, where more of the continuous phase can be injected to increase the velocity of the droplets. The temperatures in the mixer and in the main channel are controlled with two different flexible heat exchangers placed at the back of the reactor. The liquid temperature was very well controlled and the crystals forming in the droplets could be visually observed, allowing for efficient nucleation kinetic measurements with this device.
Droplet based reactive and antisolvent crystallization of nanoparticles was performed in
a simple system consisting of three T-mixers and Teflon tubing (500 μm) (Su et al., 2007). Aqueous solution droplets of the two reagents in an oil phase were produced using two of the mixers. The two streams were then injected in the third mixer and the two droplets would coalesce into one. In order to achieve the droplet formation and coalescence in this system, the volumetric flow rates of each stream were chosen very carefully. Particles of similar size and size distribution were also produced with a batch emulsion based method, therefore no quality improvements were reported for the microfluidics system.
The selection of flow rates and operating conditions is crucial because droplet formation
strongly depends on Capillary number, a function of flow velocity, viscosity and interfacial tension. When working with viscous fluids with low interfacial tension, then even at the lowest velocities droplets cannot be formed because the capillary velocity is too small. An improved version of the cross mixer that incorporates jet nozzles is able to increase capillary
Phase A Phase B
Emulsion
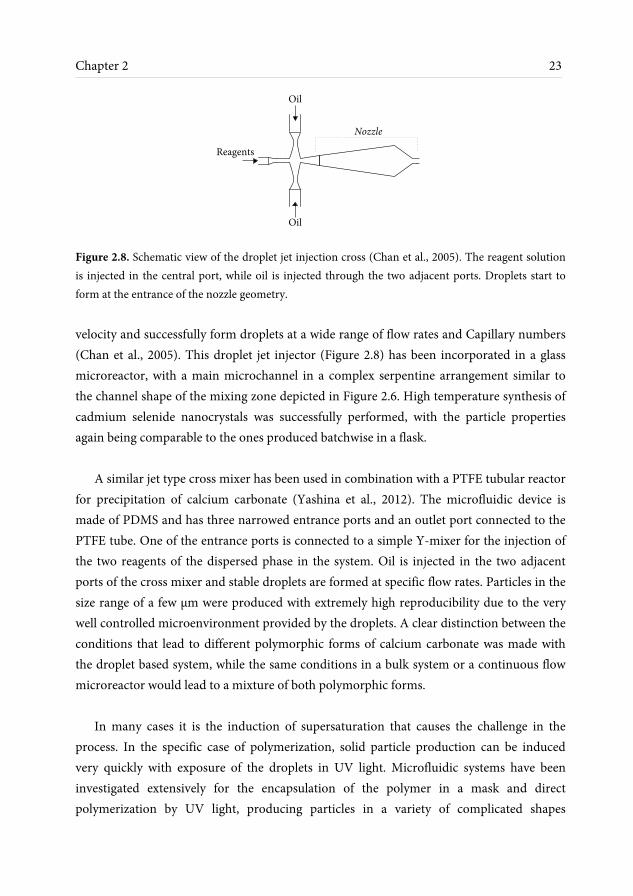
Chapter 2 23
Figure 2.8. Schematic view of the droplet jet injection cross (Chan et al., 2005). The reagent solution is injected in the central port, while oil is injected through the two adjacent ports. Droplets start to form at the entrance of the nozzle geometry. velocity and successfully form droplets at a wide range of flow rates and Capillary numbers (Chan et al., 2005). This droplet jet injector (Figure 2.8) has been incorporated in a glass microreactor, with a main microchannel in a complex serpentine arrangement similar to the channel shape of the mixing zone depicted in Figure 2.6. High temperature synthesis of cadmium selenide nanocrystals was successfully performed, with the particle properties again being comparable to the ones produced batchwise in a flask.
A similar jet type cross mixer has been used in combination with a PTFE tubular reactor
for precipitation of calcium carbonate (Yashina et al., 2012). The microfluidic device is made of PDMS and has three narrowed entrance ports and an outlet port connected to the PTFE tube. One of the entrance ports is connected to a simple Y-mixer for the injection of the two reagents of the dispersed phase in the system. Oil is injected in the two adjacent ports of the cross mixer and stable droplets are formed at specific flow rates. Particles in the size range of a few μm were produced with extremely high reproducibility due to the very well controlled microenvironment provided by the droplets. A clear distinction between the conditions that lead to different polymorphic forms of calcium carbonate was made with the droplet based system, while the same conditions in a bulk system or a continuous flow microreactor would lead to a mixture of both polymorphic forms.
In many cases it is the induction of supersaturation that causes the challenge in the
process. In the specific case of polymerization, solid particle production can be induced very quickly with exposure of the droplets in UV light. Microfluidic systems have been investigated extensively for the encapsulation of the polymer in a mask and direct polymerization by UV light, producing particles in a variety of complicated shapes
Reagents
Oil
Oil
Nozzle
24 Continuous separation in micro systems - a review
(Dendukuri et al., 2006). This process gives the possibility for synthesis of janus particles, containing different chemistries at different ends of the particle. An overview of the application of microfluidics on the synthesis of polymeric particles can be found elsewhere (Serra and Chang, 2008).

This chapter is adapted from:
Moschou, P., Croon, M. H. J. M. de, Schaaf, J. van der, Schouten, J. C., 2012. Nitrogen stripping of isopropyl-alcohol and toluene in a falling film micro reactor:
gas side mass transfer experiments and modelling at isothermal conditions. Chemical Engineering Science 76, 216-223.
Abstract
The mass transfer rates during solvent evaporation in a falling film micro reactor were calculated with a theoretical mass transfer model. First, two models were developed for the gas side mass transfer only, by solving for evaporation of a pure solvent. A numerical model was developed and solved in the finite element solver package COMSOL Multiphysics®, and a semi-analytical model was developed based on the mass balance equations and an existing Sherwood number correlation. Both models give the same results, and the semi-analytical one is preferred for faster calculations. An overall mass transfer model is developed by solving the mass balance equations for both phases, while the liquid side mass transfer coefficient is estimated according to film theory. It is found that the process is limited by mass transfer on the gas side alone, and there is no significant effect of the liquid flow rate or the liquid side mass transfer coefficient on the calculated evaporation rate.
Mass transfer model of solvent evaporation in a FFMR
26 Mass transfer model of solvent evaporation in a FFMR
3.1 Introduction
A micro structure based continuous separation process investigated in this thesis is solvent evaporation in a FFMR (introduced in Chapter 2). In order to enable processing of heat sensitive products, evaporation is performed at moderate temperatures, well below the solvent’s boiling point. For this reason a counter-current flow of a carrier gas is used to enhance the mass transfer rates by convection.
It is essential to define the mass transfer characteristics of the device, which will
eventually determine the efficiency of the evaporation process. This chapter gives the main theoretical background for mass transfer during partial evaporation with a carrier gas in the STACK-1x-FFMR-Lab.
Mass transfer calculations are first performed for the gas side only, by eliminating any
resistance on the liquid side with the use of a pure solvent. Two different models are developed, a numerical model solved with the finite element solver package COMSOL Multiphysics®, and a semi-analytical one based on the mass balance equations and an existing Sherwood number correlation.
Once the gas side mass transfer characteristics are determined, the liquid side resistance
is included in the semi-analytical model. The aim of the process is to concentrate a stream of a solvent/product solution by evaporating more than 50% of the solvent and to reach concentrations close to saturation. Therefore, the model is solved for a solution of a crystallizing material in the investigated solvent, at concentrations below the solubility of the system at room temperature.
Due to the high solid-liquid interfacial area of the reactor, heat transfer limitations are
neglected at this point and the process is assumed isothermal. It is also assumed that flow is evenly distributed in all micro channels and each channel is identical to the other in all characteristics.
3.2 Materials The model is developed for the gas-liquid-solid system that will be used for experimental
Chapter 3 27
testing of the device. The choice of the materials is discussed in this section. The main system requirements are related to the materials’ properties and availability: The carrier gas can be any typical inert gas. All materials should be easily available with known properties.
Solvents typically used in fine chemical and pharmaceutical industry are preferred. The solute should be easy to detect and quantify in the chosen solution with an available
measurement method. Considering the system requirements, nitrogen is selected as the carrier gas. Toluene is
chosen as a solvent which is frequently used in fine chemical and pharmaceutical industry, and isopropyl-alcohol, being an easy to handle solvent, is also tested. For the solute, benzoic acid is selected mainly due to its availability. Benzoic acid concentrations in the toluene/benzoic acid solution can be determined with UV-Visible Spectroscopy.
3.3 Modelled geometry
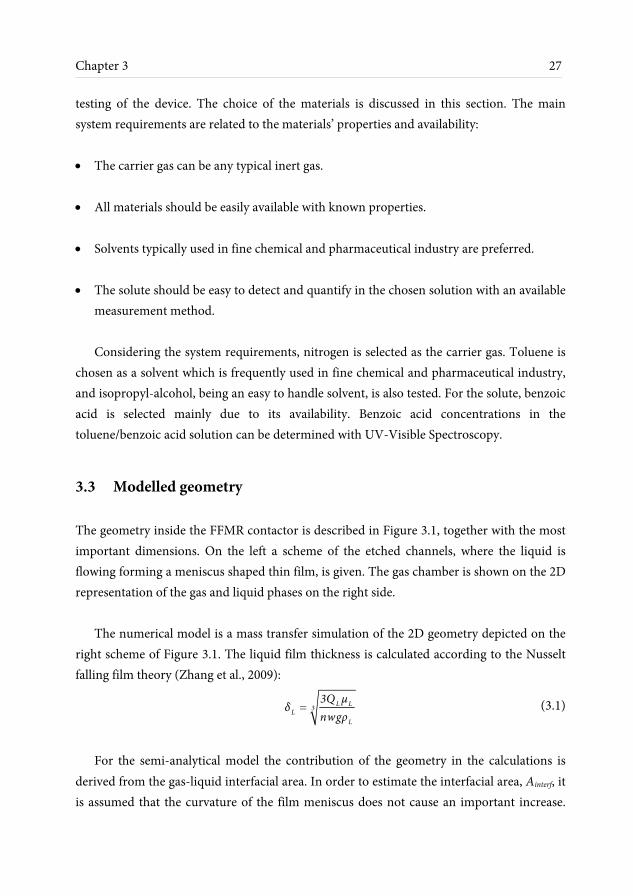
The geometry inside the FFMR contactor is described in Figure 3.1, together with the most important dimensions. On the left a scheme of the etched channels, where the liquid is flowing forming a meniscus shaped thin film, is given. The gas chamber is shown on the 2D representation of the gas and liquid phases on the right side.
The numerical model is a mass transfer simulation of the 2D geometry depicted on the right scheme of Figure 3.1. The liquid film thickness is calculated according to the Nusselt falling film theory (Zhang et al., 2009):
L L3LL
3Q μδ
nwgρ (3.1)
For the semi-analytical model the contribution of the geometry in the calculations is
derived from the gas-liquid interfacial area. In order to estimate the interfacial area, Ainterf, it is assumed that the curvature of the film meniscus does not cause an important increase.

28 Mass transfer model of solvent evaporation in a FFMR
Figure 3.1. Schematic view of the FFMR contactor’s geometry. Left: 3D geometry of the etched micro channels. Right: 2D geometry of the x cross section at the middle of a channel.
Then according to the 3D representation of the contactor it will be: Ainterf = n w L, with n being the number of channels.
3.4 Gas side mass transfer model
3.4.1 Numerical model
The numerical model is solved with the commercial solver package COMSOL Multiphysics®, which is based on the finite element method. The model is developed for two different systems: nitrogen/isopropyl-alcohol and nitrogen/toluene, and for laminar flow of both the gas and liquid phases at steady state. The modelled geometry consists of a 2D section of the liquid film and the gas chamber as shown in Figure 3.1.
First the hydrodynamics are solved for the two fluids flowing in contact and the velocity
field is determined. Subsequently the mass transfer equations are solved for the gas phase and the concentration and flux profiles are obtained. In this approach the effect of the mass transport on the hydrodynamics is not taken into account. For a hydrodynamics study this
δL
L
δG
z
Steel wall
Liquid film Gas Glass
wall
w = 1.2 mm
b = 7.3 mm
δG = 4 mm
L = 255 mm
δL = f(QL )
L
b
w
z
x
Chapter 3 29
effect should not be neglected; however, due to the low dependence of mass transfer from the velocity profiles that is expected for laminar flow in a microchannel, this simplification can be justified in this work.
Diffusion coefficient in the gas phase
The diffusion coefficient of the evaporating solvent (component A) in the gas phase, DA,G, is assumed equal to the diffusion coefficient of component A in nitrogen. It is calculated from an empirical correlation developed by Fuller, which is reported to give an average absolute error of about 4% (Poling et al., 2004).
1.75
A ,G 21/ 2 1/ 3 1/ 3w ,A N υ Α υ N
0.0143 TDP M ( Σ ) ( Σ )
(3.2)
where Mw,A-N is calculated from the molar masses of solvent A and nitrogen:
Mw,A-N = 2/(1/Mw,A + 1/Mw,N), and Συ is the sum of atomic diffusion volumes, which have been determined in literature by a regression analysis of many experimental data.
Hydrodynamics
The gas and liquid are described as two different blocks, each with a specific density and viscosity. The flow of the two phases is described by the continuity equation and the incompressible Navier Stokes equation for steady state:
▽·u = 0 (3.3)
ρ(u·▽u) = –▽P + μ▽2u + ρg (3.4)
The no slip boundary condition is applied for the two walls:
u|wall = 0 (3.5) For the gas-liquid interface velocity and shear stress continuity are assumed:
uL|interface = uG|interface (3.6)

30 Mass transfer model of solvent evaporation in a FFMR
μL▽uL|interface = μG▽uG|interface (3.7) The boundary conditions at the inlets and outlets of the two phases are predefined:
u|inlet = u0 (3.8)
P|outlet = Patm (3.9)
For the initial velocity, u0, it is assumed that it only consists of a z-component. The
liquid one is calculated according to Nusselt falling film theory:
2L L
L0 ,zL
gδ ρu
3μ (3.10)
The gas velocity is simply calculated from the volumetric flow rate and the gas chamber
cross section:
GG0 ,z
G
Qu
bδ (3.11)
Mass transfer equations
Mass transfer calculations are made for the gas phase only. The transport of component A from the liquid to the gas phase is described by the convection diffusion equation for steady state:
–▽·(DA,G▽CA) + u·▽CA = 0 (3.12)
The walls are considered impermeable:
n(–DA,G▽CA + uCA)|wall = 0 (3.13) For the outlet it is assumed that the diffusive flux is very small compared to the
convective flux and can therefore be neglected:
n(–DA,G▽CA)|outlet = 0 (3.14)

Chapter 3 31
The boundary conditions at the inlet and the gas-liquid interface are predefined:
CA|inlet = 0 (3.15)
CA|interface = CA* (3.16) The equilibrium concentration, CA*, is determined by the vapour pressure of the solvent
using the ideal gas law:
CA* = PvA / RT (3.17)
3.4.2 Semi-analytical model
This model is solved for the same two systems and the same conditions as the numerical simulations. A schematic representation of the mass transfer rate described in the following equations is given in Figure 3.2.
Figure 3.2. Schematic representation of the mass transfer through the gas-liquid interface. The driving force is indicated by the difference in molar fraction of the liquid A in the gas phase, yA, between the interface and the bulk of the gas phase.
The flux of liquid A transferred through the gas-liquid interface per interfacial area, NA,
is calculated by the mass balance on the interface (Bird et al., 2002):
Liquid film Gas
NA
z
ΔyA
32 Mass transfer model of solvent evaporation in a FFMR
NA,G = kG C ΔyA / (1 – yA*) = dFG/dAinterf (3.18) where the total concentration in the gas phase is calculated from the operating pressure:
C = P/RT. Considering for the gas molar flow rate that FG = FN + FA,G and FA,G = yA FG, where FN is
the constant molar flow rate of nitrogen and FA,G the molar flow of solvent A in the gas phase in the z direction, then dFG = (FN /(1 – yA)2) dyA.
Finally, the molar fraction yA* is calculated for vapour-liquid equilibrium on the
interface: yA* = PvA/P. The final differential equation that describes the mass transfer in the gas chamber
becomes from equation (3.18):
dyA/dz = kG P (yA – yA*) (1 – yA)2 n w / (R T FN (1 – yA*)), (3.19)
with the boundary condition: yA|z=0 = 0. Solving equation (3.19) for z = L gives the molar fraction of component A at the exit of
the gas chamber.
Gas side mass transfer coefficient In a mass transfer study for laminar flow by van Male et al. (2004), heat transport
simulations were performed for a long square micro channel with the CFD package FLUENT. Fluid would enter the channel at a specific temperature, with one of the four channel walls being isothermal, and the other three walls adiabatic. From the heat transport simulation, the Nusselt number at the isothermal wall was calculated and then converted to a mass transport correlation using the Chilton-Colburn analogy. In the equivalent mass transfer process the isothermal wall is a wall of constant concentration, which is the gas liquid interface at equilibrium concentration in the case of evaporation, and the adiabatic walls are the three impermeable walls of the channel. The Sherwood number for laminar flow in a square microchannel at the wall of constant concentration resulting from that work is:

Chapter 3 33
Sh = 2.43 (1 + (Gzm/132)0.835) (3.20) The mass transport Graetz number is Gzm = ReG Sc δG / z, where δG is the distance
between the wall of constant concentration and the opposite wall. In the case of partial evaporation in the STACK-1x-FFMR-Lab the wall of constant
concentration is in fact the gas-liquid interface and the gas chamber is a rectangular milli-channel in which mass transport is taking place during laminar flow. The Sherwood number at the gas-liquid interface can be calculated from equation (3.20). The gas side mass transfer coefficient can then be obtained:
kG = Sh DA,G / δG (3.21)
where δG is in this case the gas chamber height. For solving equation (3.19) a mean value for the mass transfer coefficient is used,
calculated from the mean Sherwood number.
Shmean = 2.43 (1 + (ReG Sc δG /15.26 L)0.835) (3.22)
3.4.3 Results
A first comparison between the two models is made in Figure 3.3. The empirical Sherwood correlation used in the semi-analytical model is compared with the Sherwood number calculated from the simulation results. The numerical values are calculated from the mass transfer coefficient, which results from the concentration and flux profiles according to the mass balance equation, NA = kG (CA* – CA). The empirical values are calculated for the gas velocity profile resulting also from the numerical solution.
The predicted amount of solvent at the gas exit, which serves as an indication of the
contactor’s performance, is given in Figure 3.4 for both models and for the two different investigated solvents. As expected, in these results there is a difference between the two models which lies in the different geometries and therefore different definitions of the interfacial area. In the 2D geometry of the numerical model the interface is described as a

34 Mass transfer model of solvent evaporation in a FFMR
Figure 3.3. Empirical and numerical values of Sherwood number, calculated for isopropyl-alcohol evaporation in the STACK-1x-FFMR-Lab (liquid flow rate: 1 ml min-1, gas flow rate: 750 ml min-1, temperature: 70 °C).
Figure 3.4. Model predictions for the molar flux of solvent at the gas exit point for different gas volumetric flows, and a liquid flow rate of 1 ml min-1 calculated for: (a) isopropyl-alcohol at 50 °C, (b) toluene at 70 °C. one dimensional line, so the gaps between the channels are not taken into account. In such a case the interfacial area would be Ainterf,2D = b L. However, the ratio between the calculated values of the two models differs from the ratio of the interfacial areas, which is n w / b, since according to equation (3.18) the molar fraction is not a linear function of interfacial area. In
Dimensionless channel length
Sherwood
number
0 0.2 0.4 0.6 0.8 10
1
2
3
4
5
6
7
8
9
10
Empirical
Numerical
0 200 400 600 8000
1
2
3
4
5
6
7x 10
-3 (a)
Gas flow rate (ml min-1
)
Evaporate
d solve
nt
(molmin
-1)
Semi−analytical
Numerical
Numerical with L’ = Lnw/b
0 200 400 600 8000
1
2
3
4
5
6
7x 10
-3 (b)
Gas flow rate (ml min-1
)
Evaporate
d solve
nt
(molmin
-1)
Semi−analytical
Numerical
Numerical with L’ = Lnw/b

Chapter 3 35
order to be able to compare the two models, the numerical model is also solved for the real interfacial area, Ainterf, by reducing the contactor’s length to L’ = L n w / b.
The comparison between the two models examines the validity of the empirical Sherwood correlation used in the semi-analytical model to the specific case of the STACK-1x-FFMR-Lab, where the gas chamber dimensions exceed the strict microchannel range. The agreement between the two models indicates that the process can be equally well described by both of them, allowing very fast calculations with the semi-analytical model for the prediction of the contactor’s performance.
The numerical solution can provide information about the process along the length of
the contactor, which gives a better understanding of the contactor’s performance. In Figure 3.5 the effect of changing driving force on the molar flux at the interface is shown along the channel length. It is expected that an increase in gas volumetric flow enhances the mass transfer coefficient and subsequently the molar flux, as shown in the figure. An increase in temperature, however, would shift the equilibrium and lead to even higher fluxes for the first part of the contactor. The curvature of the lines indicates how fast the driving force is decreased along the channel length, as the concentration in the gas phase is increasing.
Figure 3.5. Calculated molar flux of isopropyl-alcohol at the gas-liquid interface for different gas volumetric flow rates and temperatures (liquid flow rate: 1 ml min-1).
Dimensionless channel length
Interface m
olar flux
(mol m
-2 s
-1)
0 0.2 0.4 0.6 0.8 10
0.05
0.1
0.15
0.2
0.25
°C
°C
°C
400 ml min-1
, 50
750 ml min-1
, 50
400 ml min-1
, 70
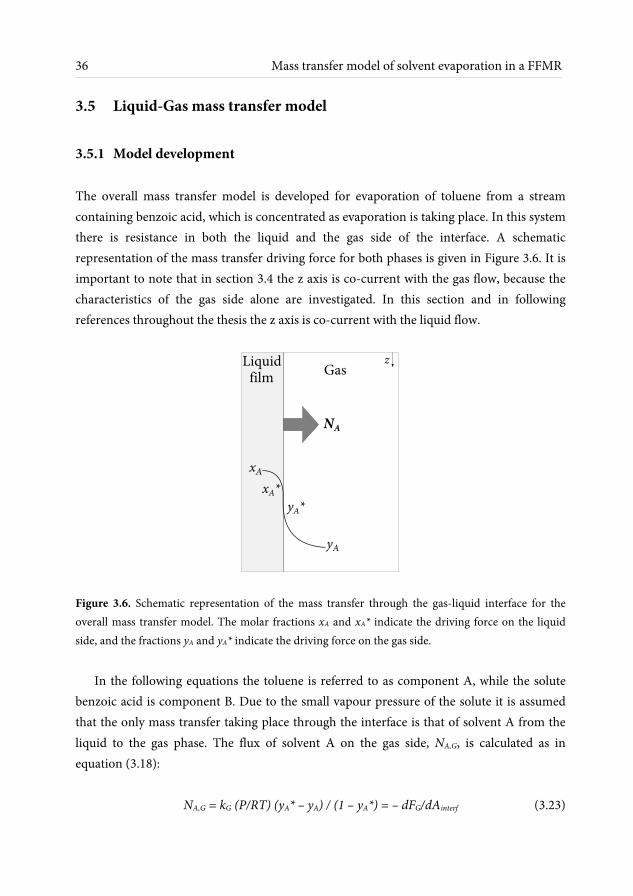
36 Mass transfer model of solvent evaporation in a FFMR
3.5 Liquid-Gas mass transfer model
3.5.1 Model development The overall mass transfer model is developed for evaporation of toluene from a stream containing benzoic acid, which is concentrated as evaporation is taking place. In this system there is resistance in both the liquid and the gas side of the interface. A schematic representation of the mass transfer driving force for both phases is given in Figure 3.6. It is important to note that in section 3.4 the z axis is co-current with the gas flow, because the characteristics of the gas side alone are investigated. In this section and in following references throughout the thesis the z axis is co-current with the liquid flow.
Figure 3.6. Schematic representation of the mass transfer through the gas-liquid interface for the overall mass transfer model. The molar fractions xA and xA* indicate the driving force on the liquid side, and the fractions yA and yA* indicate the driving force on the gas side.
In the following equations the toluene is referred to as component A, while the solute
benzoic acid is component B. Due to the small vapour pressure of the solute it is assumed that the only mass transfer taking place through the interface is that of solvent A from the liquid to the gas phase. The flux of solvent A on the gas side, NA,G, is calculated as in equation (3.18):
NA,G = kG (P/RT) (yA* – yA) / (1 – yA*) = – dFG/dAinterf (3.23)
yA
xA xA*
z Gas Liquid
film
NA
yA*

Chapter 3 37
Similarly, the flux on the liquid side is:
NA,L = kL (1/Vm) (xA – xA*) / (1 – xA*) = – dFL/dAinterf (3.24)
where Vm is the molar volume of the solution: Vm = Mw/ρL, with Mw the average molar mass and ρL the average density of the solution. The average density is estimated according to the volume fraction of the two components, φA and φB, as ρL = ρA φΑ + ρΒ φΒ. For simplification it is assumed that the volume fractions are equal to the mass fractions, so the average density can be written: ρL = ρA xΑ Mw,A/Mw + ρΒ xB Mw,B/Mw. The molar volume can then be written as a function of the molar fraction xA:
2
w ,A A w ,B Am
A w ,A A B w ,B A
M x M 1 xV
ρ M x ρ M 1 x
(3.25)
The vapour liquid equilibrium on the interface is in this case a relation between the gas
and liquid side molar fraction:
yA* = xA* PvA/P (3.26) For the gas molar flow rate it is dFG = (FN /(1 – yA)2) dyA, as in the gas side only mass
transfer model. The same is calculated for the liquid molar flow rate. Starting from FL = FA,L + FB and FA,L = xA FL, where FB is the constant molar flow rate of the solute (component B) and FA,L the molar flow of the solvent A in the liquid phase in the z direction, the differential liquid molar flow rate is written dFL = (FB /(1 – xA)2) dxA.
The combination of equations (3.23) and (3.26), forms the differential equation that
describes the molar fraction on the gas side:
2AG vAA
A AvA N
A
1 y nwk Pdy P x * yPdz RT P F1 x *P
(3.27)
with the boundary condition yA|z=L = 0.

38 Mass transfer model of solvent evaporation in a FFMR
The differential equation for the liquid side becomes from equation (3.24):
2AA L
A AA m B
1 x nwdx k 1 x x *dz 1 x * V F
(3.28)
with the boundary condition xA|z=0 = xA,feed. Finally, for the flux through the interface it is NA,G = NA,L, therefore equations (3.23) and
(3.24) become:
2 vA vAA L G
m
vA vAA L L A G G A
m m
L A G Am
P P1x * k kV P RTP P1 1 Px * k k x k k y
V V P RT RT
1 Pk x k y 0V RT
(3.29)
The system of equations (3.27), (3.28) and (3.29) is solved numerically in the computing
environment of MATLAB, with a standard solver using the Runge-Kutta iterative method.
Liquid side mass transfer coefficient In order to make an estimation for the liquid side mass transfer coefficient, the liquid
film needs to be described throughout the process of evaporation. As mentioned in section 3.3, the liquid film thickness is calculated according to Nusselt falling film theory. By substituting in equation (3.2) the liquid volumetric flow rate, QL, with FLVm, the liquid film thickness is written:
Bm L
3 AL
L
F3 V μ1 x
δnwgρ
(3.30)
where ρ and μ are the average density and viscosity of the solution. The average viscosity
is calculated with the method of Grunberg and Nissan (Poling et al., 2004)

Chapter 3 39
μL = exp(xA lnμΑ + (1 – xA)lnμB +xA(1 – xA)GBA ) (3.31) The interaction parameter, GBA, is determined from the functional group contributions
of components A and B, and is equal to – 0.311 for the benzoic acid/toluene system. The liquid film velocity, uL, is calculated according to equation (3.10), and the Fourier
number is then determined as:
Fo = (L/uL) / (δL2/DA,L) (3.32)
This number is found to be larger than unity, therefore a steady state close to
equilibrium can be assumed for the process. For this reason the film theory is expected to give a prediction for the liquid side mass transfer coefficient (Cussler, 2009). kL = DA,L / δL (3.33)
The diffusion coefficient of component A in the liquid phase is assumed equal to the
self-diffusion coefficient of the solvent. This simplification is justified for dilute solutions but can introduce large errors at higher concentrations. A parametric study is made in the following section to examine the effect of the liquid side mass transfer coefficient, and consequently also the diffusion coefficient, on the overall mass transfer rates. The self-diffusion coefficient of toluene is determined from experimental data in literature (O’Reilly and Peterson, 1972).
3.5.2 Results
Film theory has been found in literature to underestimate the liquid side mass transfer coefficient of a falling film micro reactor similar to the one investigated in this study, the FFMR Standard (Zhang et al., 2009). Therefore it can be expected that the actual kL values are larger than the calculated ones. Also the diffusion coefficient of the solution at low concentrations can be close to the self-diffusion coefficient of the solvent, but it is expected to decrease as the solute concentration is increasing. For these reasons it is important to investigate the actual effect of the liquid side resistance on the overall mass transfer rate. This is done by introducing an effect parameter aL in the model, and modifying the kL values as:
40 Mass transfer model of solvent evaporation in a FFMR
kL’ = aL DA,L / δL (3.34) The overall mass transfer model is solved for different values of the parameter aL, in the
extreme range of 10-1 to 104. The results are expressed as the ratio % of the end benzoic acid concentration calculated for the modified mass transfer coefficient, CB’, over the concentration calculated for aL =1, CB. In Figure 3.7 the concentration ratio is given for four different cases of temperature and liquid flow rate, and for a range of gas flow rates.
As expected, the effect of the liquid side mass transfer coefficient depends greatly on the
conditions. Comparing cases (a) and (b) of Figure 3.7 it is observed that when the equilibrium shifts due to an increase in temperature, and the overall mass transfer rates are higher, the effect of the liquid side mass transfer coefficient is much higher. However, the cases in Figure 3.7 (b) of gas flow rates above 450 ml min-1 are beyond the operation range of this work, since they represent concentrations above the saturation limit of benzoic acid in toluene. These values are presented only for examining the effect of the kL value at high mass transfer rates.
In all cases within the operating range, increasing the effect parameter from 1 to higher
values only causes an increase in concentration up to 2%. This shows that for aL =1, the overall mass transfer is limited by the gas side resistance, and kL values higher than those predicted by the film model cannot be measured with the investigated system.
Considering that the film model gives a good prediction or underestimation of the
liquid side mass transfer during evaporation, values lower than 1 for the effect parameter represent a decrease in the liquid diffusion coefficient (DA,L’ = aL DA,L). However, large variations in the concentration are predicted only for very low values of the effect parameter, which would require a decrease in the diffusion coefficient of almost an order of magnitude. This is unlikely to happen for the diffusion coefficient of a solvent in the liquid phase; therefore no deviations in the concentration higher than 6% are expected (assuming aL ≥ 0.4).
The results on Figure 3.7 (b), (c) and (d) show that increasing the liquid flow rate leads
to a smaller effect of the liquid side resistance on the overall mass transfer rate. At high liquid flow rates, the calculated liquid side mass transfer coefficient is higher, and therefore has a lower impact on the process.

Chapter 3 41
Figure 3.7. Effect of the liquid side mass transfer coefficient on the overall mass transfer rate. The concentration ratio CB’/CB is expressed as a function of the effect parameter aL, for a benzoic acid/ toluene system of an initial concentration 0.25 mol L-1 at different temperatures and liquid flow rates: (a) 80 °C and 2 ml min-1, (b) 90 °C and 2 ml min-1 (c) 90 °C and 3 ml min-1, (d) 90 °C and 4 ml min-1. Different gas flow rates ranging from 100 to 800 ml min-1 are indicated with different marker colours.
The equilibrium molar fractions throughout the channel lengths, together with the bulk
molar fraction of the gas and liquid phase are given in Figure 3.8. These values are calculated for the overall mass transfer model without modifications (aL ≥ 1).
10-1
100
101
102
103
104
0
20
40
60
80
100
(a)
Effect parameter
Co
nce
ntratio
n ratio
(%
)
450 ml min-1
500 ml min-1
550 ml min-1
600 ml min-1
650 ml min-1
700 ml min-1
750 ml min-1
800 ml min-1
100 ml min-1
150 ml min-1
200 ml min-1
250 ml min-1
300 ml min-1
350 ml min-1
400 ml min-1
10-1
100
101
102
103
104
0
20
40
60
80
100
(b)
Effect parameter
Co
nce
ntratio
n ratio
(%
)
450 ml min-1
500 ml min-1
550 ml min-1
600 ml min-1
650 ml min-1
700 ml min-1
750 ml min-1
800 ml min-1
100 ml min-1
150 ml min-1
200 ml min-1
250 ml min-1
300 ml min-1
350 ml min-1
400 ml min-1
10-1
100
101
102
103
104
0
20
40
60
80
100
(c)
Effect parameter
Co
nce
ntratio
n ratio
(%
)
450 ml min-1
500 ml min-1
550 ml min-1
600 ml min-1
650 ml min-1
700 ml min-1
750 ml min-1
800 ml min-1
100 ml min-1
150 ml min-1
200 ml min-1
250 ml min-1
300 ml min-1
350 ml min-1
400 ml min-1
10-1
100
101
102
103
104
0
20
40
60
80
100
(d)
Effect parameter
Co
nce
ntratio
n ratio
(%
)
450 ml min-1
500 ml min-1
550 ml min-1
600 ml min-1
650 ml min-1
700 ml min-1
750 ml min-1
800 ml min-1
100 ml min-1
150 ml min-1
200 ml min-1
250 ml min-1
300 ml min-1
350 ml min-1
400 ml min-1

42 Mass transfer model of solvent evaporation in a FFMR
Figure 3.8. Calculated molar fractions of toluene in the liquid and gas phase, on the bulk (xA, yA) and interface (xA*, yA*) throughout the channel length, for evaporation of a benzoic acid/toluene solution with an initial concentration 0.25 mol L-1 at 90 °C. Gas flow rate: (a), (c), (e) 100 ml min-1, (b), (d), (f) 800 ml min-1. Liquid flow rate: (a), (b) 2 ml min-1, (c), (d) 3 ml min-1, (e), (f) 4 ml min-1.
0 0.2 0.4 0.6 0.8 10
0.2
0.4
0.6
0.8
1
(a)
Dimensionless channel length
Tolue
ne
molar
fractio
n
xA
xA*
xA(solubility)
yA
yA*
0 0.2 0.4 0.6 0.8 10
0.2
0.4
0.6
0.8
1
(b)
Dimensionless channel length
Tolue
ne
molar
fractio
n
xA
xA*
xA(solubility)
yA
yA*
0 0.2 0.4 0.6 0.8 10
0.2
0.4
0.6
0.8
1
(c)
Dimensionless channel length
Tolue
ne
molar
fractio
n
xA
xA*
xA(solubility)
yA
yA*
0 0.2 0.4 0.6 0.8 10
0.2
0.4
0.6
0.8
1
(d)
Dimensionless channel length
Tolue
ne
molar
fractio
n
xA
xA*
xA(solubility)
yA
yA*
0 0.2 0.4 0.6 0.8 10
0.2
0.4
0.6
0.8
1
(e)
Dimensionless channel length
Tolue
ne
molar
fractio
n
xA
xA*
xA(solubility)
yA
yA*
0 0.2 0.4 0.6 0.8 10
0.2
0.4
0.6
0.8
1
(f)
Dimensionless channel length
Tolue
ne
molar
fractio
n
xA
xA*
xA(solubility)
yA
yA*

Chapter 3 43
In Figure 3.8 it is shown that the molar fraction on the liquid side is almost at equilibrium, while the molar fraction on the bulk of the gas phase is different than that on the interface. The difference yA* – yA depends mainly on the gas flow rate. This is in agreement with the conclusion that the process is limited by the mass transfer resistance on the gas side. This is also shown in Figure 3.9 where the overall mass transfer rate is shown to be completely independent of the liquid flow rate.
Figure 3.9. Calculated values of the amount of evaporated toluene from a benzoic acid/toluene solution 0.25 mol L-1, for different conditions as a function of liquid flow rate.
3.6 Concluding remarks
Both models developed for the gas side mass transfer during solvent evaporation in the STACK-1x-FFMR-Lab give very similar results. The semi-analytical model is solved in a fraction of the time required for the numerical solution with COMSOL Multiphysics®, it is therefore preferred for fast predictions of the evaporation results.
An overall mass transfer model, for both the gas and liquid side resistance, is developed
similar to the gas side semi-analytical model. It is found that under the conditions investigated the process is limited by the mass transfer in the gas side alone, since the evaporated amount is only a function of the temperature and the gas flow rate. Only if the experimental liquid side mass transfer coefficient is an order of magnitude smaller than the
0 1 2 3 4 5 60
0.4
0.8
1.2
1.6
L iquid flow rate (ml min-1
)
Evaporate
d solve
nt
(mlmin
-1)
100 ml min-1, 80
°C
800 ml min-1, 80
°C
100 ml min-1, 90
°C
800 ml min-1, 90
°C
44 Mass transfer model of solvent evaporation in a FFMR
theoretical value will it have a significant effect on the evaporated amount, and the process will no longer be gas side limited.

This chapter is adapted from:
Moschou, P., Croon, M. H. J. M. de, Schaaf, J. van der, Schouten, J. C., 2013. Liquid flow rate effects during partial evaporation in a FFMR.
Chemical Engineering and Processing: Process Intensification 69, 95-103.
Abstract
The focus of this study is the investigation of the effect of liquid flow rate on partial evaporation, enhanced by convective nitrogen flow, in a falling film micro contactor. Experiments are performed at different flow rates and for a certain fixed heating liquid temperature. The temperatures of the gas and liquid phases are measured at their exit points, and the evaporation rate is determined while the channels are monitored with a microscope. The channels do not appear fully wetted at low liquid flow rates, and the liquid temperature is relatively low. The bad wetting is attributed to liquid flow maldistribution that can cause temperature gradients and subsequently enhances the maldistribution by uneven evaporation. A heat transfer model is developed and solved for different numbers of wetted channels. According to the modelling results the low liquid temperatures, and subsequently the mass transfer rates that are lower than expected, can be fully explained by liquid flow maldistribution and channel drying.
Liquid flow rate effects during partial evaporation in a FFMR
46 Liquid flow rate effects during partial evaporation in a FFMR
4.1 Introduction
Partial evaporation is performed in a falling film micro reactor at mild temperatures with a carrier gas. In order to first determine the gas side mass transfer characteristics of the device, evaporation of a pure solvent is performed. According to the theoretical description of the process in Chapter 3, the overall mass transfer rate is not a function of the liquid flow rate. However, in this chapter the effect of liquid flow rate on the effective temperature and the channel wetting is investigated.
Experiments of evaporation are performed in the STACK-1x-FFMR-Lab, while the
channels are observed through the front glass window of the device with a microscope camera. Camera observations give an indication of channel drying, which is in agreement with the temperature and evaporation rate measurements for isopropyl-alcohol.
A heat transfer model is developed based on theoretical heat transfer coefficients and
the expected temperature profiles for the gas and liquid phase are calculated. The model is also solved for a limited number of wetted channels, in order to describe the heat transfer during evaporation with channel drying and verify in this way the experimental observations.
4.2 Materials and methods 4.2.1 Materials
All evaporation experiments in this chapter are performed with pure isopropyl-alcohol (≥ 99.9%, 2 Propanol, LC-MS Chromasolv®, Sigma-Aldrich, The Netherlands). The gas phase consists of pure nitrogen.
4.2.2 Experimental setup and procedure The detailed experimental setup is shown in Figure 4.1. The liquid phase is introduced at the top of the contactor via an HPLC pump (Shimadzu LC-20AD) with a flow range of 0.0001 to 10 ml min-1. The gas feed is regulated by a mass flow controller with a range of 50

Chapter 4 47
Figure 4.1. The STACK-1x-FFMR-Lab used in the evaporation experiments, with a scheme of the experimental setup on the right.
to 1000 ml min-1, and is introduced at the bottom of the contactor for counter-current flow with the liquid. Both the gas and liquid phase enter the contactor at room temperature, which is equal to 20 °C in all cases, and all experiments are performed at atmospheric pressure. The micro contactor is heated with water as heating fluid, recirculating through a LAUDA heat bath. The heating fluid flows in co-current mode with the liquid phase, which needs to be heated fast as soon as it enters the contactor. The temperatures at the exit points of the liquid and gas phase, and at the inlet and exit points of the heating fluid, are measured with temperature sensors (K type thermocouples) placed in T-junctions connected to the contactor.
The gas and vapours exiting at the top of the contactor are entering a glass vessel which
is submerged in ice, referred to as the condenser. The evaporation rate is determined from the amount of solvent that has condensed in the condenser in a specific amount of time. The time is measured with a normal stopwatch and the amount of liquid is weighed in a
Condenser
Isothermal ice vessel
HPLC Pump
Liquid
feed
Heat
Exchanger
Falling
Film
Micro
Reactor
Mass flow controller
N2 Gas
Liquid
ouput
TI-04
TI-01
TI-02
TI-03FI-01
48 Liquid flow rate effects during partial evaporation in a FFMR
Sartorius balance with an accuracy of ± 0.001 g. Equilibrium is assumed for the glass condenser so the small amount of solvent escaping in the gas phase with nitrogen can be calculated from the vapour pressure of the solvent at 0 °C. The evaporation rate is then defined as:
amount of condensed liquid ( g ) mol
rate amount of escaping liquid ( )g mintime (min) molecular weight ( )mol
.
The reproducibility of the results was determined by performing identical experiments
and calculating the standard deviation of the measured evaporation rate. Overall, the deviations found are acceptable for this investigation. It was observed that at lower liquid flow rates the standard deviation was generally higher, with the highest value found at a gas flow rate of 500 ml min-1 and a liquid flow rate of 1 ml min-1, to be 0.0014 mol min-1. The mean value of the evaporation rate at this case was 0.0045 mol min-1.
During all experiments the contactor’s channels are monitored from the inspection
window with a digital microscope (Dino-Lite Premier Digital Microscope AM3613TB). Pictures of the channels are taken throughout the experiments and compared with a picture of them when they are empty of liquid. No colour was added to the isopropyl-alcohol since any change in properties may affect the evaporation process. For this reason the pictures can only be examined comparatively and in combination with the other results.
Evaporation of isopropyl-alcohol is performed in the STACK-1x-FFMR-Lab for liquid flow rates ranging from 1 to 10 ml min-1; the evaporation rate is determined for a specific heating fluid temperature (70 °C) and a range of gas flow rates from 100 to 700 ml min-1.
4.3 Microscope observations for the liquid flow profiles Due to the nature of the contactor it is not possible to closely observe the liquid flow profiles with accuracy. The liquid flows on a steel plate, on which five distinct channels are etched, and the gas flows in the area above the plate with a height of 4 mm. At the front of the gas chamber a glass window allows the observation of the channels. However, all the parts of the contactor are brazed so it is not possible to take a closer look at the plate where the liquid flows.
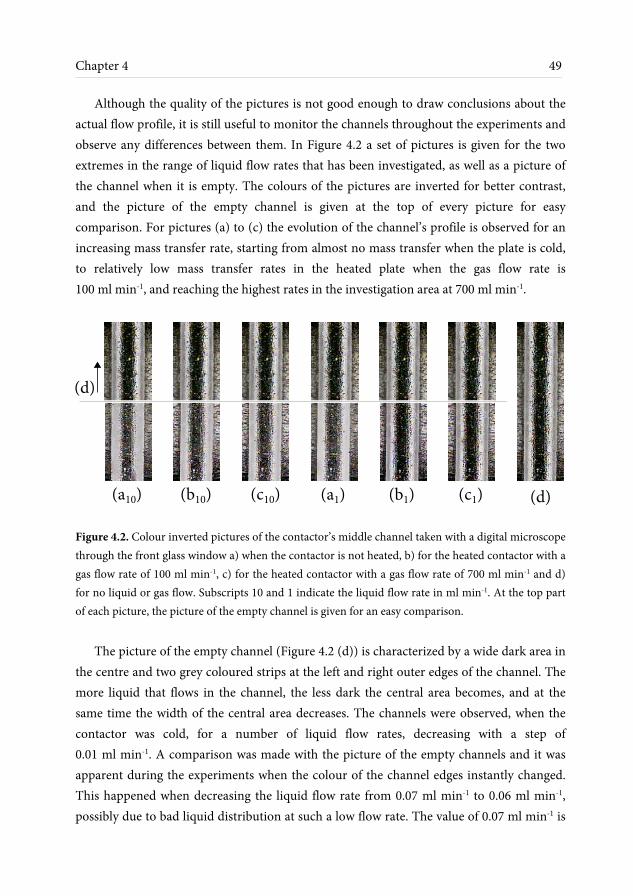
Chapter 4 49
Although the quality of the pictures is not good enough to draw conclusions about the actual flow profile, it is still useful to monitor the channels throughout the experiments and observe any differences between them. In Figure 4.2 a set of pictures is given for the two extremes in the range of liquid flow rates that has been investigated, as well as a picture of the channel when it is empty. The colours of the pictures are inverted for better contrast, and the picture of the empty channel is given at the top of every picture for easy comparison. For pictures (a) to (c) the evolution of the channel’s profile is observed for an increasing mass transfer rate, starting from almost no mass transfer when the plate is cold, to relatively low mass transfer rates in the heated plate when the gas flow rate is 100 ml min-1, and reaching the highest rates in the investigation area at 700 ml min-1.
Figure 4.2. Colour inverted pictures of the contactor’s middle channel taken with a digital microscope through the front glass window a) when the contactor is not heated, b) for the heated contactor with a gas flow rate of 100 ml min-1, c) for the heated contactor with a gas flow rate of 700 ml min-1 and d) for no liquid or gas flow. Subscripts 10 and 1 indicate the liquid flow rate in ml min-1. At the top part of each picture, the picture of the empty channel is given for an easy comparison.
The picture of the empty channel (Figure 4.2 (d)) is characterized by a wide dark area in the centre and two grey coloured strips at the left and right outer edges of the channel. The more liquid that flows in the channel, the less dark the central area becomes, and at the same time the width of the central area decreases. The channels were observed, when the contactor was cold, for a number of liquid flow rates, decreasing with a step of 0.01 ml min-1. A comparison was made with the picture of the empty channels and it was apparent during the experiments when the colour of the channel edges instantly changed. This happened when decreasing the liquid flow rate from 0.07 ml min-1 to 0.06 ml min-1, possibly due to bad liquid distribution at such a low flow rate. The value of 0.07 ml min-1 is
(a10) (b10) (c10) (a1) (b1) (c1) (d)
(d)
50 Liquid flow rate effects during partial evaporation in a FFMR
determined as the critical flow rate for channel wetting (at room temperature) and it is used to calculate the film thickness according to Nusselt film theory from equation (3.1). This is the critical film thickness for channel wetting according to the camera observations, which is found to be equal to 0.055 mm.
From a comparison with the empty channel’s picture, it can be seen that even at the
lowest liquid flow rate of 1 ml min-1 the channels are full of liquid when the contactor is cold, and no significant evaporation is taking place. Figure 4.2 (c1), where high mass transfer rates are expected, is very similar to the picture of the empty channel. It is predicted for this case that almost all the liquid should be evaporated, therefore it is expected that the channels will dry out. However, the case of 100 ml min-1 gas flow rate (Figure 4.2 (b1)) where only a small portion of the feed is predicted to evaporate also looks very similar to the case of dry channels. For the liquid flow rate of 10 ml min-1 the channels do not seem to have any dry spots in any of the cases.
Channel drying at low liquid flow rates would lead to underperformance of the contactor in terms of evaporation rate. Although these pictures are an indication of possible drying during evaporation, it is not certain if there is in fact any liquid in the channels that appear similar to an empty one. The most important observation that indicates flow maldistribution and drying cannot be depicted in still pictures. It has been observed throughout the experiments that the channels on the sides of the plate generally appear filled with liquid. As we move from high to lower liquid flow rates, in the middle channels of the plate, the liquid appears to move in a reciprocal manner. While the gas flows from bottom to top, it seems to remove all the liquid from one (or more) of the channels in its path until a certain point, or throughout the channel length, depending on the liquid flow rate. This leads to an apparent movement of the liquid in the upward direction. Then more liquid that comes from the top fills the channels again and the process is repeated. This movement of the liquid appears at moderate liquid flow rates (6 – 3 ml min-1). Shifting to lower flow rates, no refilling of the channel takes place after the apparent upwards movement, and it appears completely dry.
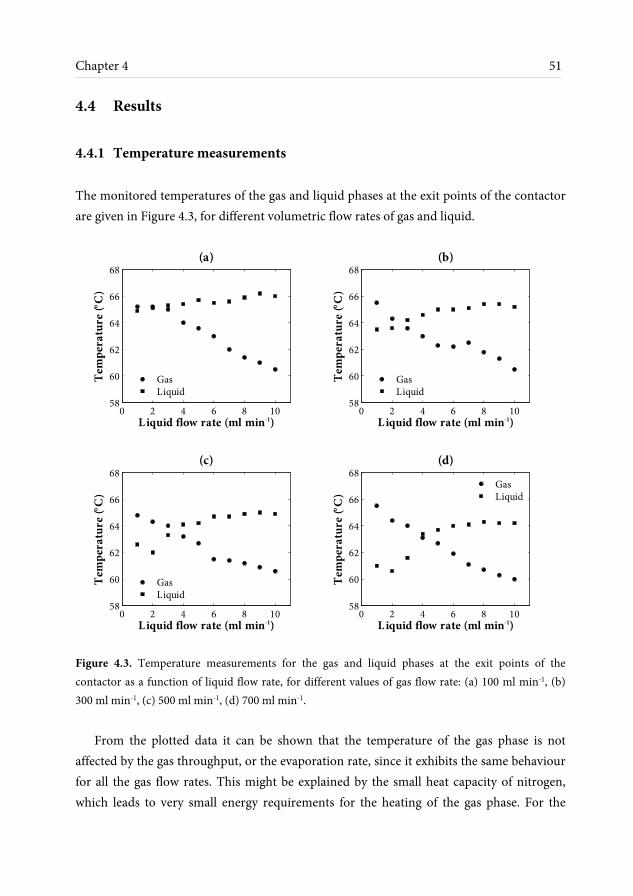
Chapter 4 51
4.4 Results 4.4.1 Temperature measurements
The monitored temperatures of the gas and liquid phases at the exit points of the contactor are given in Figure 4.3, for different volumetric flow rates of gas and liquid.
Figure 4.3. Temperature measurements for the gas and liquid phases at the exit points of the contactor as a function of liquid flow rate, for different values of gas flow rate: (a) 100 ml min-1, (b) 300 ml min-1, (c) 500 ml min-1, (d) 700 ml min-1.
From the plotted data it can be shown that the temperature of the gas phase is not
affected by the gas throughput, or the evaporation rate, since it exhibits the same behaviour for all the gas flow rates. This might be explained by the small heat capacity of nitrogen, which leads to very small energy requirements for the heating of the gas phase. For the
0 2 4 6 8 1058
60
62
64
66
68
(a)
L iquid flow rate (ml min-1
)
Temperature
(°C
)
Gas
Liquid
0 2 4 6 8 1058
60
62
64
66
68
(b)
L iquid flow rate (ml min-1
)
Temperature
(°C
)
Gas
Liquid
0 2 4 6 8 1058
60
62
64
66
68
(c)
L iquid flow rate (ml min-1
)
Temperature
(°C
)
Gas
Liquid
0 2 4 6 8 1058
60
62
64
66
68
(d)
L iquid flow rate (ml min-1
)
Temperature
(°C
)
Gas
Liquid

52 Liquid flow rate effects during partial evaporation in a FFMR
measured temperatures it is calculated that the energy used for heating the gas ranges from 0.075 to 0.55 Watts, between the flow rates of 100 ml min-1 and 700 ml min-1, a relatively small amount compared to the 1.3 to 13 Watts required for the liquid phase in the range of 1 to 10 ml min-1. However, it should be noted that the measuring thermocouple is placed inside the exiting tube for the gas phase, but does not reach the gas chamber in order to avoid blocking the gas flow. For this reason it is possible that the gas is slightly cooled by the steel connection at the measuring point, and the actual temperature at the end of its path inside the contactor is higher.
The liquid temperature appears to be almost constant at the lowest gas throughput, but
as we move to higher values we see a different behaviour. A decrease in temperature starts to appear at lower liquid flow rates and the higher the gas throughput is, the lower is the liquid temperature for flow rates smaller than 5 ml min-1. This is another indication of drying, which would decrease the contact area of the liquid with the plate, and therefore with the heating fluid, leading to lower temperatures.
4.4.2 Evaporation rate measurements The information provided by the temperature measurements and the channels pictures need to be combined with the determined evaporation rate in order to be able to discuss the contactor’s performance. In Figure 4.4 the measured evaporation rate is given for several cases, as a function of liquid flow rate, together with the theoretical values calculated for the measured liquid and gas temperatures. These values are calculated by solving the mass balance equation with the mass transfer coefficient as defined by the semi-analytical model described in Chapter 3.
Overall, the actual mass transfer seems to follow the same trend as the liquid
temperature, indicating again wetting problems that occur at low liquid flow rates. Low wetting at low liquid flow rates leads to a lower heat transfer rate, therefore lower liquid temperature. In addition, when the channels are not properly wetted, the gas-liquid interface is reduced; therefore the mass transfer tends to be lower than the predicted value for the measured temperature.
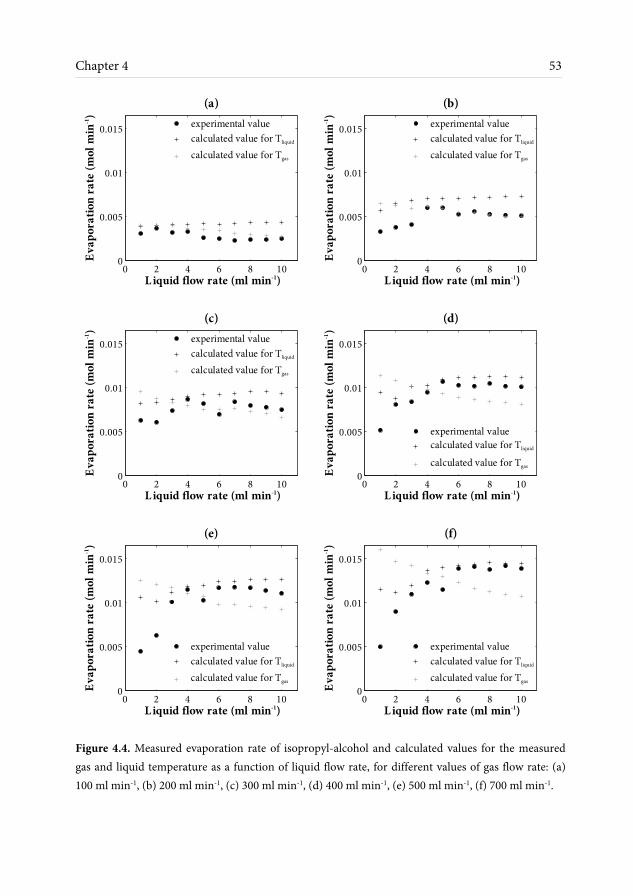
Chapter 4 53
Figure 4.4. Measured evaporation rate of isopropyl-alcohol and calculated values for the measured gas and liquid temperature as a function of liquid flow rate, for different values of gas flow rate: (a) 100 ml min-1, (b) 200 ml min-1, (c) 300 ml min-1, (d) 400 ml min-1, (e) 500 ml min-1, (f) 700 ml min-1.
0 2 4 6 8 100
0.005
0.01
0.015
(a)
L iquid flow rate (ml min-1
)
Evaporatio
n rate
(molmin
-1)
experimental value
calculated value for Tliquid
calculated value for Tgas
0 2 4 6 8 100
0.005
0.01
0.015
(b)
L iquid flow rate (ml min-1
)
Evaporatio
n rate
(molmin
-1)
experimental value
calculated value for Tliquid
calculated value for Tgas
0 2 4 6 8 100
0.005
0.01
0.015
(c)
L iquid flow rate (ml min-1
)
Evaporatio
n rate
(molmin
-1)
experimental value
calculated value for Tliquid
calculated value for Tgas
0 2 4 6 8 100
0.005
0.01
0.015
(d)
L iquid flow rate (ml min-1
)
Evaporatio
n rate
(molmin
-1)
experimental value
calculated value for Tliquid
calculated value for Tgas
0 2 4 6 8 100
0.005
0.01
0.015
(e)
L iquid flow rate (ml min-1
)
Evaporatio
n rate
(molmin
-1)
experimental value
calculated value for Tliquid
calculated value for Tgas
0 2 4 6 8 100
0.005
0.01
0.015
(f)
L iquid flow rate (ml min-1
)
Evaporatio
n rate
(molmin
-1)
experimental value
calculated value for Tliquid
calculated value for Tgas
54 Liquid flow rate effects during partial evaporation in a FFMR
The effect of the gas temperature appears to be higher at low mass transfer rates, for a gas flow rate of 300 ml min-1 or lower. In fact, it is observed that the evaporation rate is determined by the gas temperature until it switches to almost being determined by the liquid temperature after the gas flow rate reaches 400 ml min-1. It seems, however, that at high liquid flow rates, when there is no observation of a wetting problem, an average of the two temperatures could describe the evaporation rate results within an error of ± 15%.
According to the measured values of the evaporation rate, in most cases we do not
expect to encounter any wetting problems. The case of 2 ml min-1 liquid flow rate with a gas flow rate of 500 ml min-1 can be used as an example when the measured evaporation rate is much lower than the predicted value. Neither the measured amount nor the predicted value for the evaporation rate result to the remaining liquid flowing in the channels to be low enough to lead to drying. According to the predicted evaporation rate for the gas temperature, which is the worst case scenario for drying in this case, the remaining liquid flow is more than 1 ml min-1. Taking into account the effect of temperature on density and viscosity, the film thickness is calculated from Nusselt theory to be 0.095 mm and is 32% lower than it would be at room temperature. However, it is still much higher than the determined critical film thickness for channel wetting, which has been determined in section 4.3 as 0.055 mm.
It is therefore concluded that the specific wetting problems have to be related with the
process of evaporation. Because this is very strongly related to both heat and mass transfer, it is a very case sensitive process. It seems that any flow maldistribution that might appear due to fabrication differences can have a significant effect on the evaporation rate, by causing uneven evaporation through the channels that can lead to enhanced temperature gradients within the contactor. Temperature gradients and hot spots would then enhance the flow maldistribution leaving some of the channels to dry out. At high liquid flow rates when the channels are further from drying, and the flow distribution is actually better, then no wetting problems occur and the evaporation rate appears to be independent of the liquid flow rate in the range above 5 ml min-1.
4.5 Heat transfer model
A heat transfer model based on the heat balance equations for the gas and liquid phases is developed in order to obtain the expected temperature profiles and examine the actual
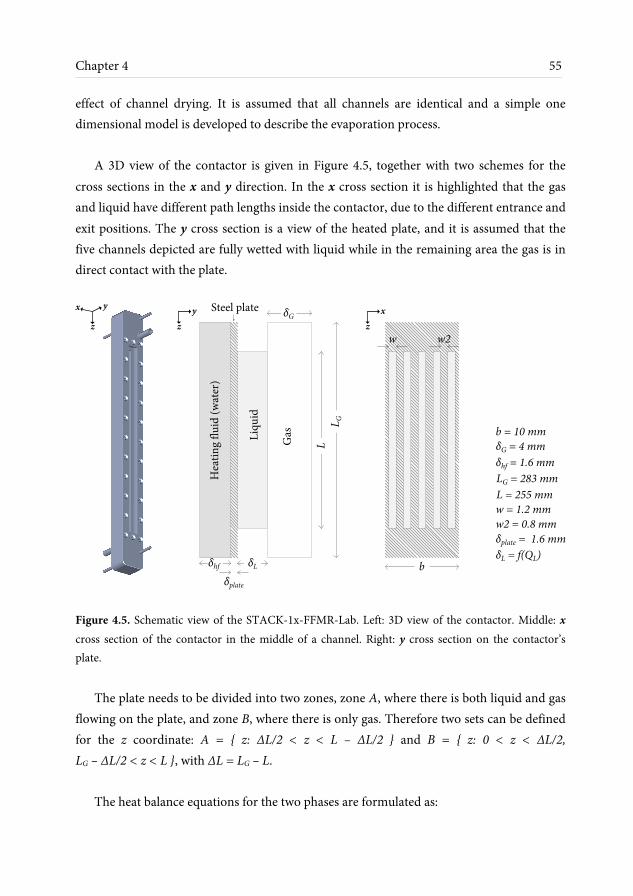
Chapter 4 55
effect of channel drying. It is assumed that all channels are identical and a simple one dimensional model is developed to describe the evaporation process.
A 3D view of the contactor is given in Figure 4.5, together with two schemes for the cross sections in the x and y direction. In the x cross section it is highlighted that the gas and liquid have different path lengths inside the contactor, due to the different entrance and exit positions. The y cross section is a view of the heated plate, and it is assumed that the five channels depicted are fully wetted with liquid while in the remaining area the gas is in direct contact with the plate.
Figure 4.5. Schematic view of the STACK-1x-FFMR-Lab. Left: 3D view of the contactor. Middle: x cross section of the contactor in the middle of a channel. Right: y cross section on the contactor’s plate.
The plate needs to be divided into two zones, zone A, where there is both liquid and gas
flowing on the plate, and zone B, where there is only gas. Therefore two sets can be defined for the z coordinate: A = { z: ΔL/2 < z < L – ΔL/2 } and B = { z: 0 < z < ΔL/2, LG – ΔL/2 < z < L }, with ΔL = LG – L.
The heat balance equations for the two phases are formulated as:
L
LG
Liqu
id
Gas
Heating
flu
id (
wate
r)
Steel plate
z
y δG
δL
δplate
δhf b
b = 10 mm
δG = 4 mm
δhf = 1.6 mm
LG = 283 mm
L = 255 mm
w = 1.2 mm
w2 = 0.8 mm
δplate = 1.6 mm
δL = f(QL)
z
yx
z
x
w w2

56 Liquid flow rate effects during partial evaporation in a FFMR
L LL
pL
d m TdqC ,z A
dz dz (4.1)
G GG pG
dq dTm C
dz dz (4.2)
The change in the liquid mass flux due to evaporation can be significant throughout the
channel length, it is therefore considered in equation (4.1). However, the vapours that enter the gas phase do not need to be heated, so no change in gas flow is taken into consideration in equation (4.2).
The effect of heat losses on the process is expected to be mostly due to the temperature
of the heating fluid, which is separated from the environment with a steel plate. This temperature profile, however, is not predicted by the model but is estimated according to the experimental measurements. The gas is less influenced by losses since the gas chamber is covered with a glass window, which has a much lower thermal conductivity than steel. Finally, the effect of heat losses on the liquid temperature is expected to be negligible, as the liquid only flows in the core of the contactor. The results of this study are mostly interpreted in terms of the liquid temperature profile. For these reasons the modelled process is considered adiabatic for simplification.
The total heat flux for the liquid phase is determined from the flux between the heating
fluid and the liquid (q1), between the gas and the liquid (q3) and the energy of evaporation (qevap):
qL = q1 – q3 – qevap (4.3)
Similarly, the heat flux for the gas phase is the sum of the flux between the gas and the
heating fluid (q2) and flux q3. Convective heat flux due to the movement of vapours through the interface is neglected, since the amount evaporated is only relevant at low gas flow rates and with the small heat capacity of the gas, it is assumed that this heat flux is not significant.
qG = q2 + q3 (4.4)

Chapter 4 57
The heat fluxes involved in the process can be calculated using the relevant heat transfer coefficients.
11 hf L
1
dqh nw T T ,z A
dzq 0 ,z B
(4.5)
2 hf G2
2 hf G
h b nw T T ,z Adqdz h b T T ,z B
(4.6)
33 L G
3
dqh nw T T ,z A
dzq 0 ,z B
(4.7)
The overall heat transfer coefficients are calculated from the individual ones, which are
then estimated according to empirical Nusselt number correlations for each phase.
1plate hf plate L
hf plate L hf hf plate L L
1 1hδ 2δ δ 2δ1 1
h λ h Nu λ λ Nu λ
(4.8)
2plate hf plate G
hf plate G hf hf plate G G
1 1hδ 2δ δ 2δ1 1
h λ h Nu λ λ Nu λ
(4.9)
3GL
L G L L G G
1 1h1 1 2δ2δ
h h Nu λ Nu λ
(4.10)
For the heating fluid, with a Reynolds number of approximately 2600, a Nusselt
correlation for turbulent flow is used (Gebhart, 1971):
0.8 0.3hf hf hfNu 0.023 Re Pr (4.11)

58 Liquid flow rate effects during partial evaporation in a FFMR
The gas phase Nusselt number is determined according to literature for a micro channel heated from one side as (Male et al., 2004):
0.809
hG
GzNu 4.69 1
233
(4.12)
For the thin liquid film, which can be heated from both sides depending on the
temperatures, the Nusselt number is considered constant according to a general estimation for laminar flow (Bird et al., 2002). NuL = 8.235.
The heat of evaporation is determined according to the evaporation rate and the
standard heat of vaporization.
evap A,G
vap
evap
dq dNΔH ,z A
dz dzq 0 ,z B
(4.13)
Finally the evaporation rate can be calculated according to equation (3.18)
G A AA ,G
int erface A
k P y * y nwdN,z A
dz RT 1 y *
(4.14)
The system is solved with the boundary condition of room temperature for the liquid
and gas phase at their entrance points: TL|z=ΔL/2 = TLAB and TG|z=LG = TLAB. For the mass balance equation the boundary condition is: ybulk|z=L = 0.
Experimental values of the gas exit temperature and the evaporation rate are used as
initial values for the solution of the system: TG,0|z=0 = TG,exp and NA,G,0|z=0 = NA,G,exp. Also the heating fluid temperature profile is considered linear and is calculated from the measured inlet and outlet temperatures during the experiments (because ΔΤhf < 1 °C).
The model is solved for different conditions and the calculated gas and liquid
temperatures at the exit of the contactor are compared with the experimental measurements in Figure 4.6. It is clear that the liquid temperature is expected to be almost constant, as it

Chapter 4 59
Figure 4.6. Experimental and modelling values of the gas and liquid temperatures at the exit points of the contactor as a function of liquid flow rate, for four different values of gas flow rate: (a) 100 ml min-1, (b) 300 ml min-1, (c) 500 ml min-1, (d) 700 ml min-1. Model values are calculated for all channels fully wetted. behaves for the gas flow rate of 100 ml min-1, in all cases. The gas temperature is not predicted as well by the model, but this may be due to temperature losses at the measuring point, as has been discussed in section 4.4.1, or overall heat losses through the window that are not taken into account in the adiabatic model.
0 2 4 6 8 1054
56
58
60
62
64
66
68
(a)
L iquid flow rate (ml min-1
)
Temperature
(°C
)
experiments: Gas
experiments: Liquid
model: Gas
model: Liquid
0 2 4 6 8 1054
56
58
60
62
64
66
68
(b)
L iquid flow rate (ml min-1
)
Temperature
(°C
)
experiments: Gas
experiments: Liquid
model: Gas
model: Liquid
0 2 4 6 8 1054
56
58
60
62
64
66
68
(c)
L iquid flow rate (ml min-1
)
Temperature
(°C
)
experiments: Gas
experiments: Liquid
model: Gas
model: Liquid
0 2 4 6 8 1054
56
58
60
62
64
66
68
(d)
L iquid flow rate (ml min-1
)
Temperature
(°C
)
experiments: Gas
experiments: Liquid
model: Gas
model: Liquid

60 Liquid flow rate effects during partial evaporation in a FFMR
Figure 4.7. Modelling values of gas and liquid temperature calculated for different numbers of wetted channels, fitting the corresponding experimental measurements. Gas flow rate: (a) 100 ml min-1, (b) 300 ml min-1, (c) 500 ml min-1, (d) 700 ml min-1.
The experimental observations indicate that at low liquid flow rates some of the
channels dry out; therefore the residence time of the liquid is decreased significantly. The lower temperatures that are measured for these cases are explained as seen in Figure 4.7 by a lower number of wetted channels. When the model is solved for a number of channels smaller than 5, the calculated temperatures match the experimental values. The number of
0 2 4 6 8 1054
56
58
60
62
64
66
68
L iquid flow rate (ml min-1
)
Temperature
(°C
)(a)
experiments: Gas
experiments: Liquid
model: Gas
model: Liquid
4 4.5 4.5 4.5 5 5 5 5 5 5
Number of wetted channels
0 2 4 6 8 1054
56
58
60
62
64
66
68
L iquid flow rate (ml min-1
)Temperature
(°C
)
(b)
experiments: Gas
experiments: Liquid
model: Gas
model: Liquid
3 3 3.5 4 4.5 4.5 5 5 5 5
Number of wetted channels
0 2 4 6 8 1054
56
58
60
62
64
66
68
L iquid flow rate (ml min-1
)
Temperature
(°C
)
(c)
experiments: Gas
experiments: Liquid
model: Gas
model: Liquid
3 3 3.5 4.5 4.5 5 5 5 5 5
Number of wetted channels
0 2 4 6 8 1054
56
58
60
62
64
66
68
L iquid flow rate (ml min-1
)
Temperature
(°C
)
(d)
experiments: Gas
experiments: Liquid
model: Gas
model: Liquid
2.5 2.5 3 4 4.5 5 5 5 5 5
Number of wetted channels
Chapter 4 61
wetted channels for each case is fitted for the measured liquid temperature. It is found that non-integer numbers sometimes describe best the results. This is in agreement with the experimental observation of the dynamic drying, during which different parts of a channel may appear to dry out throughout the process.
4.6 Concluding remarks The STACK-1x-FFMR-Lab was investigated for the effect of liquid flow rate during
partial evaporation of isopropyl-alcohol. Visual observations of the channels indicated channel drying during the evaporation process. This was attributed to liquid maldistribution that leads to temperature gradients and different rates of evaporation throughout the contactor, enhancing this way the maldistribution. Temperature and evaporation rate measurements also showed underperformance at low liquid flow rates. A heat transfer model was developed and after considering the number of wetted channels as a fitting factor, the experimental measurements were explained as a result of channel drying and therefore low liquid residence time.
The main result of this work is that drying can occur during evaporation at higher liquid
flow rates than it would without any process taking place. Since channel drying and liquid maldistribution are always challenging with micro structured devices many studies are performed to describe the wetting and distribution characteristics of such equipment. However, these studies are usually performed in different conditions than the goal process. This study is a perfect example of the need to work towards finding indirect techniques that allow such investigations to be performed at real time process conditions.


Publication of this chapter is under preparation in collaboration with Fraunhofer ICT-IMM.
Abstract
This chapter is focused on experimental work on solvent evaporation with two versions of a falling film microreactor as a contactor, STACK-1x-FFMR-Lab and STACK-1x-FFMR-Lab-V2. The STACK-1x-FFMR-Lab is operated in recirculating mode in order to improve the channel wetting, and it is found that channel drying is indeed prevented at high recirculation rates. The second version of the contactor, with an improved liquid distribution system, is found to perform better for liquid flow rates within the recommended operating range (< 2.5 ml min-1), as higher liquid flow rates seem to disturb the gas-liquid separation at the bottom of the contactor. Evaporation rate measurements are found to be very well predicted theoretically, within an error of ± 15%. The gas side mass transfer coefficient, which seems to determine the overall mass transfer process, is in the range of 0.007 – 0.01 m s-1. Concentrations as high as 0.53 mol L-1 can be achieved for a benzoic acid/toluene solution of initial concentration 0.26 mol L-1, reaching close to the 0.59055 mol L-1 solubility limit of the system at room temperature.
Solvent evaporation experiments in the FFMR
64 Solvent evaporation experiments in the FFMR
5.1 Introduction
The main goal of the first part of this thesis is to develop a continuous, micro device-based process in order to evaporate solvent from a product/solvent stream and concentrate it close to the saturation point, as explained in Chapter 1. The toluene/benzoic acid system which has been discussed in Chapter 3 is now tested for evaporation in the FFMR.
In this chapter solvent evaporation in the FFMR is investigated experimentally and interpreted according to the modelling work discussed earlier in the thesis. According to the findings of Chapter 4, liquid distribution plays a crucial role in the mass transfer performance of the micro contactor during evaporation. For this reason, a second version of the FFMR is also tested in this chapter. The STACK-1x-FFMR-Lab-V2 has been developed by IMM with improved liquid distribution characteristics and is now compared with the initial STACK-1x-FFMR-Lab in terms of the efficiency during partial solvent evaporation.
First the gas side mass transfer measurements are determined with evaporation of pure
isopropyl-alcohol and pure toluene. For the initial STACK-1x-FFMR-Lab it is crucial to ensure good wetting of the channels during evaporation. This is achieved by recirculating the liquid stream and increasing the apparent volumetric liquid flow rate in the contactor. The experimental results for both contactors are compared with the developed gas side mass transfer model.
The toluene/benzoic acid system is also investigated with evaporation in both contactors
and the results are compared with the overall mass transfer model. The efficiency of the process can then be determined and evaluated, compared to conventional technology.
5.2 Materials and methods 5.2.1 Materials
Evaporation experiments are performed for three different liquids: isopropyl-alcohol, toluene and toluene/benzoic acid solution. The specifications of the chemicals discussed in this chapter are given in Table 5.1. The gas phase consists of pure nitrogen, as in Chapter 4.
Chapter 5 65
Table 5.1. List of chemicals used in the solvent evaporation experiments.
Chemical Purity Product name Provider
Isopropyl-alcohol ≥ 99.9% 2 Propanol, LC-MS Chromasolv® Sigma-Aldrich, NL Toluene ≥ 99.3% Toluene, Reagentplus, 99 Sigma-Aldrich, NL Benzoic acid 99.5 – 100.5% Benzoic acid Merck KGaA
5.2.2 Experimental setup and procedure The experimental setup is described in Chapter 4. In order to prevent channel drying during evaporation and enhance the wetting of all channels, a recirculation stream is added to the experimental scheme as shown in Figure 5.1. During start-up, the HPLC Pump 1 is set at the highest flow rate of 10 ml min-1. The second pump, HPLC Pump 2, is then set to the desired recycling flow rate (< 10 ml min-1). Finally, Pump 1 is set to the desired operating liquid flow rate. In this way there is significant mixing of the liquid phase inside the contactor, therefore operating at counter-current flow with the gas is no longer a great advantage. However, counter-current flow is still preferred, as at co-current flow the chances of liquid escaping in the gas exit are higher due to gravity.
The new version of the contactor, STACK-1x-FFMR-Lab-V2, is also used in the same setup as described in Chapter 4. No recirculation is required as the liquid distribution is improved and good channel wetting can be achieved throughout the evaporation of the solvent.
Evaporation experiments are performed with isopropyl-alcohol and with toluene for different conditions and with both versions of the FFMR. A benzoic acid solution in toluene is also used for evaporation in both contactors, for two different initial concentrations and a range of operating conditions. In the benzoic acid/toluene experiments the concentration of benzoic acid in the feed and exiting liquid phase, as well as in the condensed vapour phase is determined offline. Concentration measurements are performed using UV-Visible Spectroscopy, with an accuracy of ± 0.3 10-3 mol L-1.
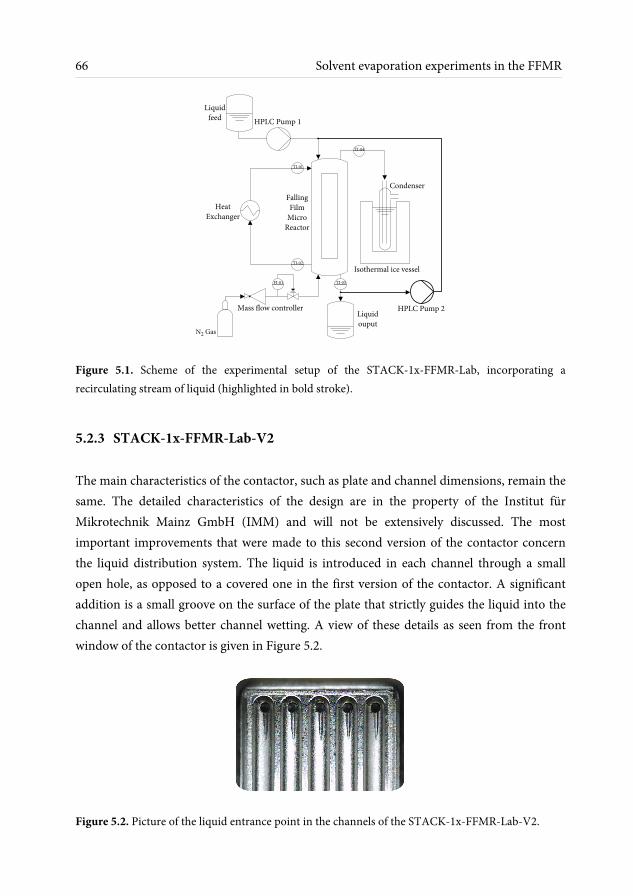
66 Solvent evaporation experiments in the FFMR
Figure 5.1. Scheme of the experimental setup of the STACK-1x-FFMR-Lab, incorporating a recirculating stream of liquid (highlighted in bold stroke).
5.2.3 STACK-1x-FFMR-Lab-V2 The main characteristics of the contactor, such as plate and channel dimensions, remain the same. The detailed characteristics of the design are in the property of the Institut für Mikrotechnik Mainz GmbH (IMM) and will not be extensively discussed. The most important improvements that were made to this second version of the contactor concern the liquid distribution system. The liquid is introduced in each channel through a small open hole, as opposed to a covered one in the first version of the contactor. A significant addition is a small groove on the surface of the plate that strictly guides the liquid into the channel and allows better channel wetting. A view of these details as seen from the front window of the contactor is given in Figure 5.2.
Figure 5.2. Picture of the liquid entrance point in the channels of the STACK-1x-FFMR-Lab-V2.
Condenser
Isothermal ice vessel
HPLC Pump 1
Liquid
feed
Heat
Exchanger
Falling
Film
Micro
Reactor
Mass flow controller
N2 Gas
Liquid
ouput
TI-04
TI-01
TI-02
TI-03FI-01
HPLC Pump 2

Chapter 5 67
Changes in the design were also made in order to decrease the pressure drop on the heat exchanger side, while the device has been placed in a PEEK® (polyether ether ketone) insulation in order to achieve a more uniform temperature distribution and improve the heat performance.
5.3 Gas side mass transfer measurements The gas side mass transfer measurements refer to the solvent evaporation experiments of isopropyl-alcohol and toluene, with no mass transfer resistance on the liquid side.
5.3.1 Liquid recirculation experiments Evaporation experiments in the STACK-1x-FFMR-Lab are performed with a recirculating liquid stream in order to improve the wetting of the channels. The effect of the recirculating stream on the mass transfer rate is shown in Figures 5.3 and 5.4, for isopropyl-alcohol and toluene respectively.
Figure 5.3. Measured evaporation rate values of isopropyl-alcohol at a heating fluid temperature of 70 °C and a gas flow rate of 700 ml min-1 for: (a) a range of liquid flow rates without any recirculation and (b) a range of recirculating liquid flow rates with a feed liquid flow rate of 1 ml min-1. Experimental values are compared with the calculated ones for the measured temperatures of the gas and liquid phase, as well as the average temperature.
0
0.005
0.01
0.015
(a)
No recirculation
Evaporatio
n rate
(molmin
-1)
experiment
model (Tliquid
)
model (Tgas
)
model (Taverage
)
0 2 4 6 8 10
L iquid flow rate (ml min-1
)
0 2 4 6 8 100
0.005
0.01
0.015
(b)
Recirculation rate (ml min-1
)
Evaporatio
n rate
(molmin
-1)
experiment
model (Tliquid
)
model (Tgas
)
model (Taverage
)
1 3 5 7 9 11
Apparent liquid flow rate (ml min-1
)

68 Solvent evaporation experiments in the FFMR
Figure 5.4. Measured evaporation rate values of toluene at a heating fluid temperature of 80 °C and a gas flow rate of 700 ml min-1 for: (a) a range of liquid flow rates without any recirculation, and a range of recirculating liquid flow rates with a feed liquid flow rate of (b) 1 ml min-1, (c) 2 ml min-1, (d) 10 ml min-1. Experimental values are compared with the calculated ones for the measured temperatures of the gas and liquid phase, as well as the average temperature.
As explained in Chapter 4, for the case of isopropyl-alcohol, channel drying occurs at liquid flow rates below 4 ml min-1 and causes a decrease in mass transfer rate. In Figure 5.3(b) it is shown that at a feed flow rate of 1 ml min-1, the mass transfer can be significantly enhanced by liquid recirculation. For the case of toluene at the specific conditions it is clear
0
0.002
0.004
0.006
0.008
(a)
No recirculation
Evaporatio
n rate
(molmin
-1)
experiment
model (Tliquid
)
model (Tgas
)
model (Taverage
)
0 2 4 6 8 10
L iquid flow rate (ml min-1
)
0 2 4 6 8 100
0.002
0.004
0.006
0.008
experiment
model (Tliquid
)
model (Tgas
)
model (Taverage
)
1 3 5 7 9 11
Recirculation rate (ml min-1
)E
vaporatio
n rate
(molmin
-1)
Apparent liquid flow rate (ml min-1
)
(b)
0 2 4 6 8 100
0.002
0.004
0.006
0.008
(c)
Recirculation rate (ml min-1
)
Evaporatio
n rate
(molmin
-1)
experiment
model (Tliquid
)
model (Tgas
)
model (Taverage
)
2 4 6 8 10 12
Apparent liquid flow rate (ml min-1
)
0 2 4 6 8 100
0.002
0.004
0.006
0.008
(d)
Recirculation rate (ml min-1
)
Evaporatio
n rate
(molmin
-1)
experiment
model (Tliquid
)
model (Tgas
)
model (Taverage
)
10 12 14 16 18 20
Apparent liquid flow rate (ml min-1
)

Chapter 5 69
from Figure 5.4(a) that the drying of the channel is more intense, as the mass transfer rate keeps increasing with increasing liquid flow rate. At high recirculating rates the mass transfer rate always reaches the same maximum point. This is very clear in Figure 5.4(d), when further increase of the apparent liquid flow rate has no influence on the mass transfer. This is because all channels are properly wetted at a flow rate of approximately 10 ml min-1, as opposed to the 5 ml min-1 limit for isopropyl-alcohol.
The highest liquid recirculation rate is chosen in order to ensure that all channels are properly wetted at all conditions. The results for isopropyl-alcohol for two different liquid feed flow rates are given in Figure 5.5 for a range of gas flow rates. The evaporation rate is no longer influenced by the liquid flow rate since all channels are wetted, even when the entire feed of isopropyl-alcohol evaporates, when the volumetric evaporation rate reaches 1 ml min-1. The measured temperatures are also practically the same for both cases, as shown by the dotted lines representing the model prediction for the measured average temperatures.
Figure 5.5. Evaporation rate of isopropyl-alcohol as a function of gas flow rate, at a heating fluid temperature of 70 °C and with a recirculating liquid flow rate of 9 ml min-1, for two different liquid feed flow rates. Measured values are compared with the calculated ones for the average measured temperature.
Similar results are shown in Figure 5.6 for toluene at three different temperatures. The same conclusions can be drawn for the wetting of the channels, as no significant difference is observed between the different liquid feed flow rates, considering the recirculation rate is
0 200 400 600 8000
0.0025
0.005
0.0075
0.01
0.0125
Evaporatio
n rate
(molmin
-1)
Gas flow rate (ml min-1
)
0.25
0.5
0.75
1
Volumetric
evaporatio
n rate
(mlmin
-1)
1 ml min-1
, experiments
1 ml min-1
, model
3 ml min-1
, experiments
3 ml min-1
, model
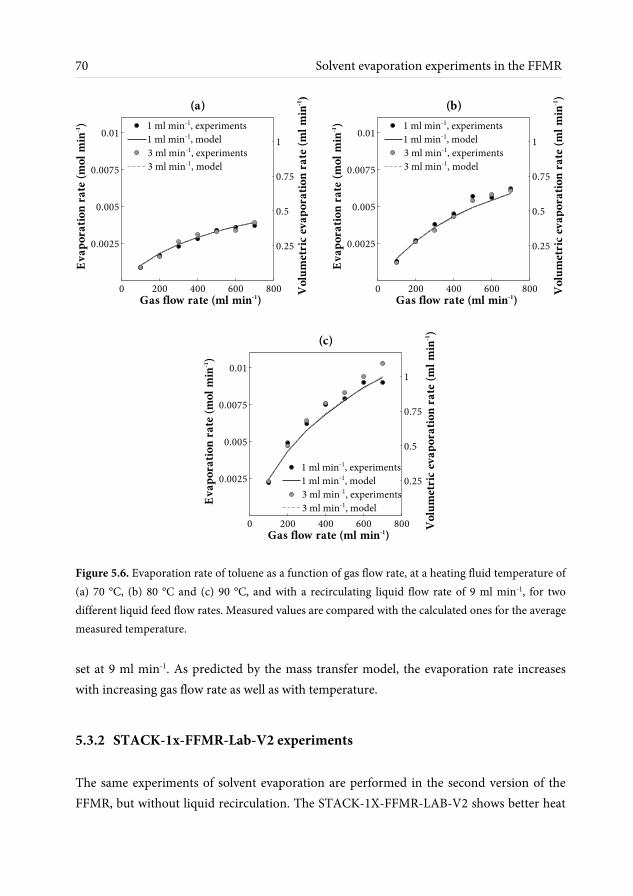
70 Solvent evaporation experiments in the FFMR
Figure 5.6. Evaporation rate of toluene as a function of gas flow rate, at a heating fluid temperature of (a) 70 °C, (b) 80 °C and (c) 90 °C, and with a recirculating liquid flow rate of 9 ml min-1, for two different liquid feed flow rates. Measured values are compared with the calculated ones for the average measured temperature. set at 9 ml min-1. As predicted by the mass transfer model, the evaporation rate increases with increasing gas flow rate as well as with temperature.
5.3.2 STACK-1x-FFMR-Lab-V2 experiments The same experiments of solvent evaporation are performed in the second version of the FFMR, but without liquid recirculation. The STACK-1X-FFMR-LAB-V2 shows better heat
0 200 400 600 800
0.0025
0.005
0.0075
0.01
Evaporatio
n rate
(molmin
-1)
Gas flow rate (ml min-1
)
(a)
0.25
0.5
0.75
1
Volumetric
evaporatio
n rate
(mlmin
-1)
1 ml min-1
, experiments
1 ml min-1
, model
3 ml min-1
, experiments
3 ml min-1
, model
0 200 400 600 800
0.0025
0.005
0.0075
0.01
Evaporatio
n rate
(molmin
-1)
Gas flow rate (ml min-1
)
(b)
0.25
0.5
0.75
1
Volumetric
evaporatio
n rate
(mlmin
-1)
1 ml min-1
, experiments
1 ml min-1
, model
3 ml min-1
, experiments
3 ml min-1
, model
0 200 400 600 800
0.0025
0.005
0.0075
0.01
Evaporatio
n rate
(molmin
-1)
Gas flow rate (ml min-1
)
(c)
0.25
0.5
0.75
1
Volumetric
evaporatio
n rate
(mlmin
-1)
1 ml min-1
, experiments
1 ml min-1
, model
3 ml min-1
, experiments
3 ml min-1
, model

Chapter 5 71
Figure 5.7. Evaporation rate of isopropyl-alcohol in the STACK-1X-FFMR-LAB-V2 as a function of liquid flow rate, at a heating fluid temperature of 70 °C and four different gas flow rates: (a) 100 ml min-1, (b) 300 ml min-1, (c) 500 ml min-1 and (d) 700 ml min-1. Experimental values are compared with the calculated ones for the measured temperatures of the gas and liquid phase, as well as the average temperature. performance and channel wetting at the same time. This is shown clearly in Figure 5.7, where the evaporation rate of isopropyl-alcohol is given for a range of liquid flow rates, and more specifically, by comparing Figures 5.7(d) and 5.3(a), which both refer to exactly the same conditions. The values that have been calculated according to the measured temperatures seem to practically form a straight line with a very small slope. This is mainly because the gas and liquid temperatures vary only slightly and they both range between 64.5 °C and 67 °C. This is a significant improvement compared to the first version of the contactor, where the range of measured temperatures for isopropyl-alcohol at the same
0 2 4 6 8 100
0.005
0.01
0.015
0.02
L iquid flow rate (ml min-1
)
Evaporatio
n rate
(molmin
-1)
(a)
experiment
model (Tliquid
)
model (Tgas
)
model (Taverage
)
0 2 4 6 8 100
0.005
0.01
0.015
0.02
L iquid flow rate (ml min-1
)
Evaporatio
n rate
(molmin
-1)
(b)
experiment
model (Tliquid
)
model (Tgas
)
model (Taverage
)
0 2 4 6 8 100
0.005
0.01
0.015
0.02
L iquid flow rate (ml min-1
)
Evaporatio
n rate
(molmin
-1)
(c)
experiment
model (Tliquid
)
model (Tgas
)
model (Taverage
)
0 2 4 6 8 100
0.005
0.01
0.015
0.02
L iquid flow rate (ml min-1
)
Evaporatio
n rate
(molmin
-1)
(d)
experiment
model (Tliquid
)
model (Tgas
)
model (Taverage
)

72 Solvent evaporation experiments in the FFMR
Figure 5.8. Evaporation rate of toluene in the STACK-1X-FFMR-LAB-V2 as a function of liquid flow rate, at a heating fluid temperature of 80 °C and four different gas flow rates: (a) 100 ml min-1, (b) 300 ml min-1, (c) 500 ml min-1 and (d) 700 ml min-1. Experimental values are compared with the calculated ones for the measured temperatures of the gas and liquid phase, as well as the average temperature. conditions was 60 – 66 °C. The higher temperatures achieved with the new contactor lead to higher mass transfer rates, since equilibrium is shifted to higher vapour pressure values. Similar results are obtained for toluene as shown in Figure 5.8. At a heating fluid temperature of 80 °C, the measured gas and liquid temperatures range between 75 °C and 78 °C, whereas with the first version of the contactor this range was as wide as 65 – 75 °C.
During evaporation of both solvents no channel drying is observed, and this is in agreement with the evaporation rate results, that show no mass transfer problems at low
0 2 4 6 8 100
0.002
0.004
0.006
0.008
L iquid flow rate (ml min-1
)
Evaporatio
n rate
(molmin
-1)
(a)
experiment
model (Tliquid
)
model (Tgas
)
model (Taverage
)
0 2 4 6 8 100
0.002
0.004
0.006
0.008
L iquid flow rate (ml min-1
)
Evaporatio
n rate
(molmin
-1)
(b)
experiment
model (Tliquid
)
model (Tgas
)
model (Taverage
)
0 2 4 6 8 100
0.002
0.004
0.006
0.008
L iquid flow rate (ml min-1
)
Evaporatio
n rate
(molmin
-1)
(c)
experiment
model (Tliquid
)
model (Tgas
)
model (Taverage
)
0 2 4 6 8 100
0.002
0.004
0.006
0.008
L iquid flow rate (ml min-1
)
Evaporatio
n rate
(molmin
-1)
(d)
experiment
model (Tliquid
)
model (Tgas
)
model (Taverage
)
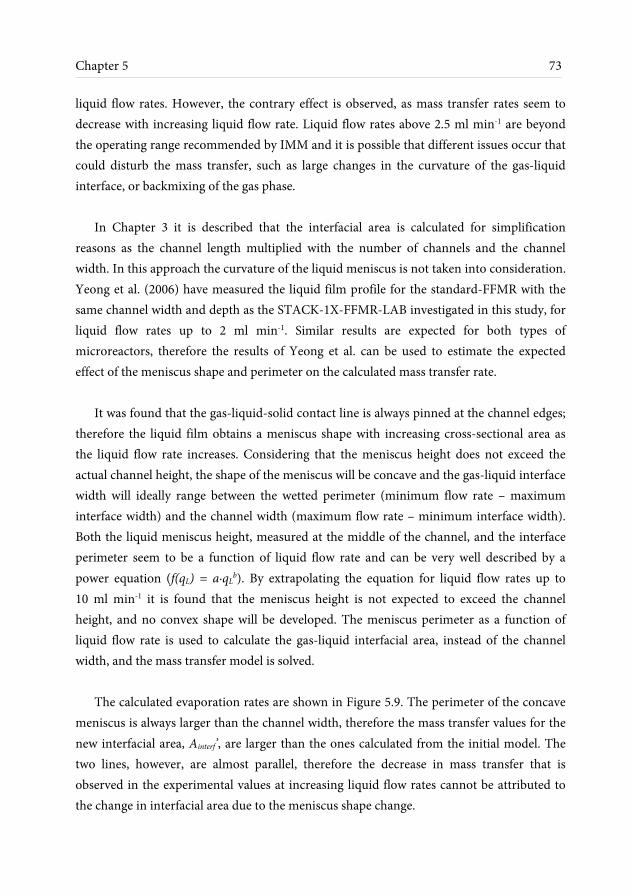
Chapter 5 73
liquid flow rates. However, the contrary effect is observed, as mass transfer rates seem to decrease with increasing liquid flow rate. Liquid flow rates above 2.5 ml min-1 are beyond the operating range recommended by IMM and it is possible that different issues occur that could disturb the mass transfer, such as large changes in the curvature of the gas-liquid interface, or backmixing of the gas phase.
In Chapter 3 it is described that the interfacial area is calculated for simplification
reasons as the channel length multiplied with the number of channels and the channel width. In this approach the curvature of the liquid meniscus is not taken into consideration. Yeong et al. (2006) have measured the liquid film profile for the standard-FFMR with the same channel width and depth as the STACK-1X-FFMR-LAB investigated in this study, for liquid flow rates up to 2 ml min-1. Similar results are expected for both types of microreactors, therefore the results of Yeong et al. can be used to estimate the expected effect of the meniscus shape and perimeter on the calculated mass transfer rate.
It was found that the gas-liquid-solid contact line is always pinned at the channel edges;
therefore the liquid film obtains a meniscus shape with increasing cross-sectional area as the liquid flow rate increases. Considering that the meniscus height does not exceed the actual channel height, the shape of the meniscus will be concave and the gas-liquid interface width will ideally range between the wetted perimeter (minimum flow rate – maximum interface width) and the channel width (maximum flow rate – minimum interface width). Both the liquid meniscus height, measured at the middle of the channel, and the interface perimeter seem to be a function of liquid flow rate and can be very well described by a power equation (f(qL) = a∙qL
b). By extrapolating the equation for liquid flow rates up to 10 ml min-1 it is found that the meniscus height is not expected to exceed the channel height, and no convex shape will be developed. The meniscus perimeter as a function of liquid flow rate is used to calculate the gas-liquid interfacial area, instead of the channel width, and the mass transfer model is solved.
The calculated evaporation rates are shown in Figure 5.9. The perimeter of the concave
meniscus is always larger than the channel width, therefore the mass transfer values for the new interfacial area, Ainterf’, are larger than the ones calculated from the initial model. The two lines, however, are almost parallel, therefore the decrease in mass transfer that is observed in the experimental values at increasing liquid flow rates cannot be attributed to the change in interfacial area due to the meniscus shape change.

74 Solvent evaporation experiments in the FFMR
Figure 5.9. Calculated evaporation rate in the STACK-1X-FFMR-LAB-V2 (and STACK-1X-FFMR-LAB) as a function of liquid flow rate for both a constant interfacial area, and an area calculated as a function of liquid flow rate, for different cases: (a) isopropyl-alcohol at a heating fluid temperature of 70 °C and (b) toluene at a heating fluid temperature of 80 °C. Gas flow rates: (1) 100 ml min-1, (2) 300 ml min-1, (3) 500 ml min-1 and (4) 700 ml min-1.
The numerical model described in section 3.4.1 can also provide information about an expected effect of liquid flow rate on the mass transfer rate. According to the solution of the Navier Stokes equations for the two phases, the backmixing of the gas phase that occurs due to the flow of liquid in the opposite direction is more intense at high liquid flow rates. As shown in Figure 5.10(b), a layer of gas flowing in the downwards direction can appear in front of the gas-liquid interface, which can decrease in this way the driving force for mass transfer. Considering that most of the mass transfer occurs at the bottom of the contactor where the gas phase is entering, the increase of concentration that is caused by the backmixing can have a significant effect on the process.
In order to investigate this effect, the convection diffusion equation of the numerical model is solved in COMSOL Multiphysics® for modified boundary conditions. The boundary condition for the inlet of the gas chamber was defined in Chapter 3 as a zero concentration of solvent A in the gas phase: CA|inlet = 0. Taking into consideration the backmixing that occurs in the gas phase, the boundary condition is now modified as: CA|inlet = 0 for u > 0, and CA|inlet = CA,initial for u < 0. The initial concentration, CA,initial, can be approximated by the exit concentration that has been calculated by the non-modified model, for CA|inlet = 0. It was found that solving the numerical model for these boundary conditions can cause a decrease of the overall mass transfer rate up to 7%.
0 2 4 6 8 100
0.005
0.01
0.015
0.02
L iquid flow rate (ml min-1
)
Evaporatio
n rate
(molmin
-1)
(a)
(1)
(2)
(3)
(4)
Ainterf = n w L
Ainterf' = n f(qL) L
0 2 4 6 8 100
0.002
0.004
0.006
0.008
L iquid flow rate (ml min-1
)
Evaporatio
n rate
(molmin
-1)
(b)
(1)
(2)
(3)
(4)
Ainterf = n w L
Ainterf' = n f(qL) L
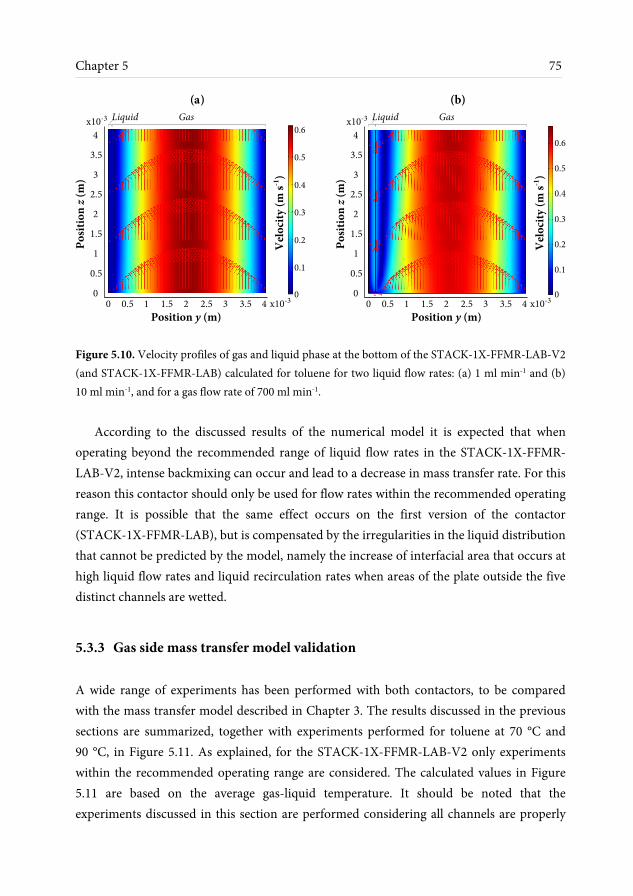
Chapter 5 75
Figure 5.10. Velocity profiles of gas and liquid phase at the bottom of the STACK-1X-FFMR-LAB-V2 (and STACK-1X-FFMR-LAB) calculated for toluene for two liquid flow rates: (a) 1 ml min-1 and (b) 10 ml min-1, and for a gas flow rate of 700 ml min-1.
According to the discussed results of the numerical model it is expected that when operating beyond the recommended range of liquid flow rates in the STACK-1X-FFMR-LAB-V2, intense backmixing can occur and lead to a decrease in mass transfer rate. For this reason this contactor should only be used for flow rates within the recommended operating range. It is possible that the same effect occurs on the first version of the contactor (STACK-1X-FFMR-LAB), but is compensated by the irregularities in the liquid distribution that cannot be predicted by the model, namely the increase of interfacial area that occurs at high liquid flow rates and liquid recirculation rates when areas of the plate outside the five distinct channels are wetted.
5.3.3 Gas side mass transfer model validation A wide range of experiments has been performed with both contactors, to be compared with the mass transfer model described in Chapter 3. The results discussed in the previous sections are summarized, together with experiments performed for toluene at 70 °C and 90 °C, in Figure 5.11. As explained, for the STACK-1X-FFMR-LAB-V2 only experiments within the recommended operating range are considered. The calculated values in Figure 5.11 are based on the average gas-liquid temperature. It should be noted that the experiments discussed in this section are performed considering all channels are properly
0
0.5
1
1.5
2
2.5
3
4
3.5
0 0.5 1.51 2 2.5 3 3.5 4
0
0.1
0.2
0.3
0.4
0.5
0.6
x10-3
x10-3
(a)
Po
sitio
n z
(m
)
Velocit
y (m
s-1
)
Position y (m)
GasLiquid
0
0.5
1
1.5
2
2.5
3
4
3.5
0 0.5 1.51 2 2.5 3 3.5 4
0
0.1
0.2
0.3
0.4
0.5
0.6
x10-3
x10-3
(b)
Po
sitio
n z
(m
)
Position y (m)
Velocit
y (m
s-1
)
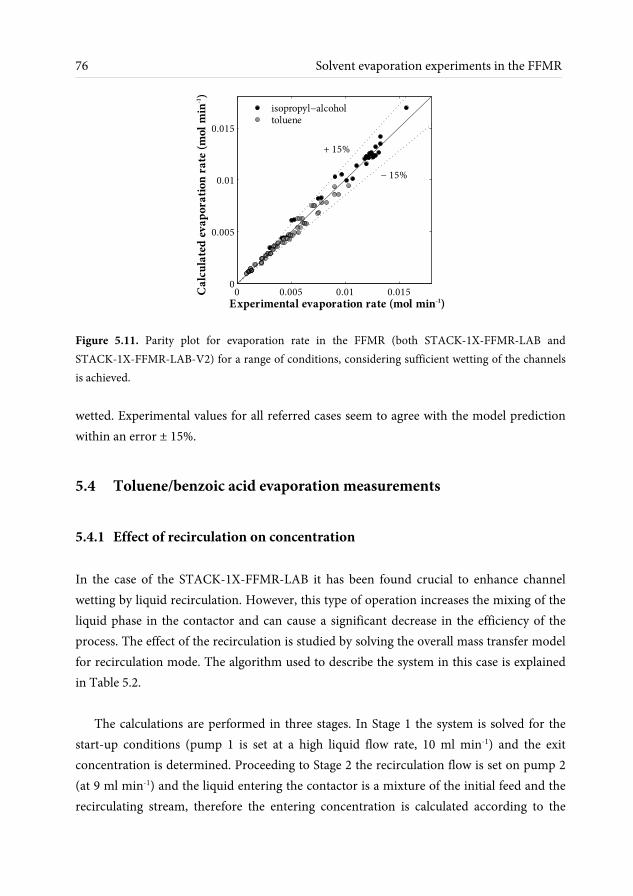
76 Solvent evaporation experiments in the FFMR
Figure 5.11. Parity plot for evaporation rate in the FFMR (both STACK-1X-FFMR-LAB and STACK-1X-FFMR-LAB-V2) for a range of conditions, considering sufficient wetting of the channels is achieved. wetted. Experimental values for all referred cases seem to agree with the model prediction within an error ± 15%.
5.4 Toluene/benzoic acid evaporation measurements
5.4.1 Effect of recirculation on concentration In the case of the STACK-1X-FFMR-LAB it has been found crucial to enhance channel wetting by liquid recirculation. However, this type of operation increases the mixing of the liquid phase in the contactor and can cause a significant decrease in the efficiency of the process. The effect of the recirculation is studied by solving the overall mass transfer model for recirculation mode. The algorithm used to describe the system in this case is explained in Table 5.2.
The calculations are performed in three stages. In Stage 1 the system is solved for the start-up conditions (pump 1 is set at a high liquid flow rate, 10 ml min-1) and the exit concentration is determined. Proceeding to Stage 2 the recirculation flow is set on pump 2 (at 9 ml min-1) and the liquid entering the contactor is a mixture of the initial feed and the recirculating stream, therefore the entering concentration is calculated according to the
0 0.005 0.01 0.0150
0.005
0.01
0.015
Experimental evaporation rate (mol min-1
)
Calculate
d e
vaporatio
n rate
(molmin
-1)
+ 15%
− 15%
isopropyl−alcohol
toluene
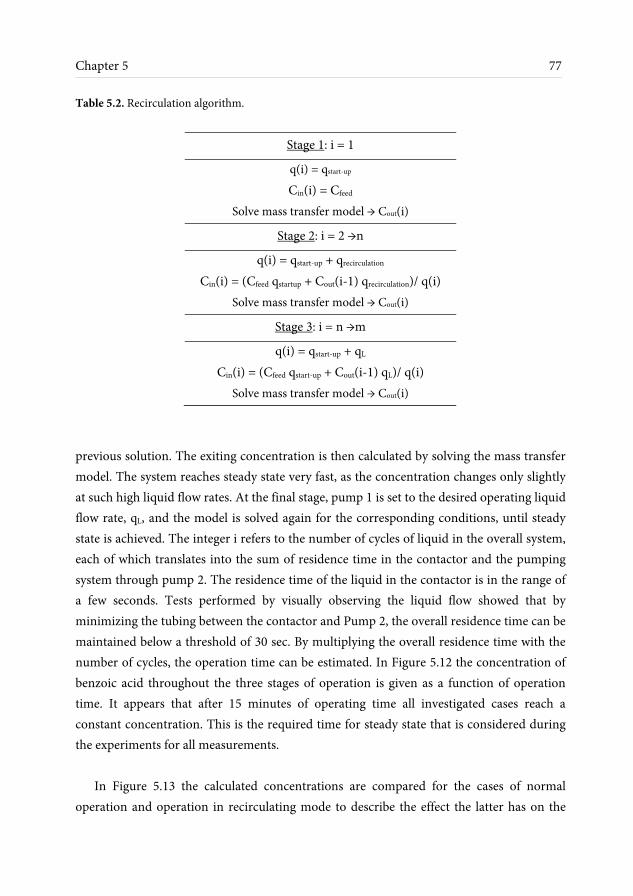
Chapter 5 77
Table 5.2. Recirculation algorithm.
Stage 1: i = 1
q(i) = qstart-up Cin(i) = Cfeed
Solve mass transfer model → Cout(i)
Stage 2: i = 2 →n
q(i) = qstart-up + qrecirculation
Cin(i) = (Cfeed qstartup + Cout(i-1) qrecirculation)/ q(i) Solve mass transfer model → Cout(i)
Stage 3: i = n →m
q(i) = qstart-up + qL
Cin(i) = (Cfeed qstart-up + Cout(i-1) qL)/ q(i) Solve mass transfer model → Cout(i)
previous solution. The exiting concentration is then calculated by solving the mass transfer model. The system reaches steady state very fast, as the concentration changes only slightly at such high liquid flow rates. At the final stage, pump 1 is set to the desired operating liquid flow rate, qL, and the model is solved again for the corresponding conditions, until steady state is achieved. The integer i refers to the number of cycles of liquid in the overall system, each of which translates into the sum of residence time in the contactor and the pumping system through pump 2. The residence time of the liquid in the contactor is in the range of a few seconds. Tests performed by visually observing the liquid flow showed that by minimizing the tubing between the contactor and Pump 2, the overall residence time can be maintained below a threshold of 30 sec. By multiplying the overall residence time with the number of cycles, the operation time can be estimated. In Figure 5.12 the concentration of benzoic acid throughout the three stages of operation is given as a function of operation time. It appears that after 15 minutes of operating time all investigated cases reach a constant concentration. This is the required time for steady state that is considered during the experiments for all measurements.
In Figure 5.13 the calculated concentrations are compared for the cases of normal operation and operation in recirculating mode to describe the effect the latter has on the
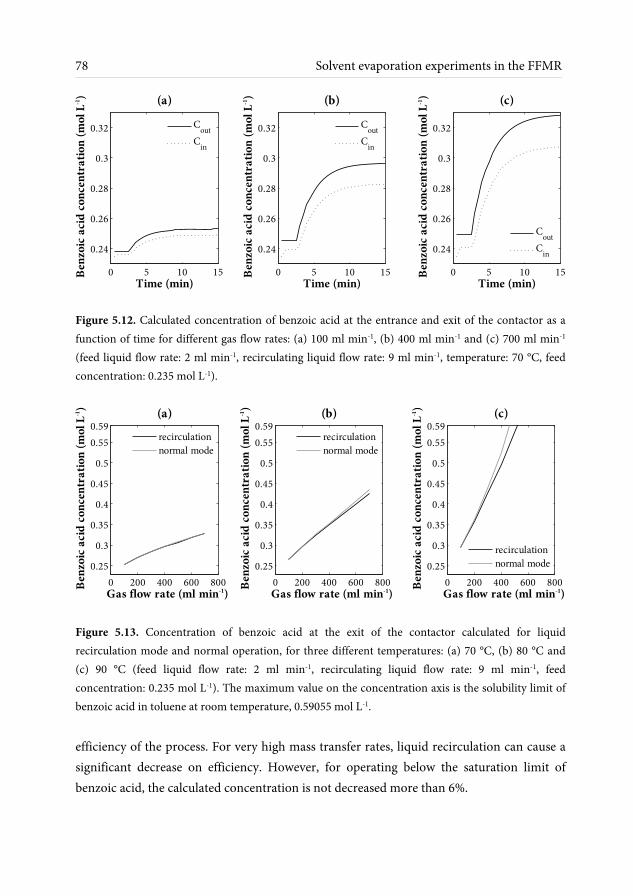
78 Solvent evaporation experiments in the FFMR
Figure 5.12. Calculated concentration of benzoic acid at the entrance and exit of the contactor as a function of time for different gas flow rates: (a) 100 ml min-1, (b) 400 ml min-1 and (c) 700 ml min-1 (feed liquid flow rate: 2 ml min-1, recirculating liquid flow rate: 9 ml min-1, temperature: 70 °C, feed concentration: 0.235 mol L-1).
Figure 5.13. Concentration of benzoic acid at the exit of the contactor calculated for liquid recirculation mode and normal operation, for three different temperatures: (a) 70 °C, (b) 80 °C and (c) 90 °C (feed liquid flow rate: 2 ml min-1, recirculating liquid flow rate: 9 ml min-1, feed concentration: 0.235 mol L-1). The maximum value on the concentration axis is the solubility limit of benzoic acid in toluene at room temperature, 0.59055 mol L-1. efficiency of the process. For very high mass transfer rates, liquid recirculation can cause a significant decrease on efficiency. However, for operating below the saturation limit of benzoic acid, the calculated concentration is not decreased more than 6%.
0 5 10 15
0.24
0.26
0.28
0.3
0.32
Time (min)
Be
nzoic
acid
co
nce
ntratio
n (mol
L-1
)
(a)
Cout
Cin
0 5 10 15
0.24
0.26
0.28
0.3
0.32
Time (min)
Be
nzoic
acid
co
nce
ntratio
n (mol
L-1
)
(b)
Cout
Cin
0 5 10 15
0.24
0.26
0.28
0.3
0.32
Time (min)
Be
nzoic
acid
co
nce
ntratio
n (mol
L-1
)
(c)
Cout
Cin
0 200 400 600 800
0.25
0.3
0.35
0.4
0.45
0.5
0.55
0.59
Gas flow rate (ml min-1
)
Be
nzoic
acid
co
nce
ntratio
n (mol
L-1
)
(a)
recirculation
normal mode
0 200 400 600 800
0.25
0.3
0.35
0.4
0.45
0.5
0.55
0.59
Gas flow rate (ml min-1
)
Be
nzoic
acid
co
nce
ntratio
n (mol
L-1
)
(b)
recirculation
normal mode
0 200 400 600 800
0.25
0.3
0.35
0.4
0.45
0.5
0.55
0.59
Gas flow rate (ml min-1
)
Be
nzoic
acid
co
nce
ntratio
n (mol
L-1
)(c)
recirculation
normal mode

Chapter 5 79
5.4.2 Results The main goal of this work is to increase the concentration of a benzoic acid/toluene solution by at least a factor of two, through evaporation in the FFMR, and reach a concentration close to the solubility limit of the system at room temperature. To examine the efficiency of the process the concentration values at the exit of the contactor are measured for two different feed concentrations and for various conditions (Figure 5.14). The operating conditions are chosen in order to ensure considerable variations of the final liquid concentration. This is because the accuracy of the UV-Visible spectroscopy measurements, combined with the error introduced by the required dilutions of all samples, could otherwise have a significant effect on the results. Although it is assumed in Chapter 3 that no benzoic acid is transferred to the gas phase, the concentration of the condensed vapour phase is also measured, as some entrainment might occur.
Figure 5.14. Benzoic acid concentration of the exiting gas and liquid phases after evaporation in the STACK-1X-FFMR-LAB with a recirculating liquid flow rate of 9 ml min-1, for two different cases: (a) feed flow rate: 2 ml min-1 and concentration: 0.06 mol L-1, heating fluid temperature: 90 °C and (b) feed flow rate: 1 ml min-1, concentration: 0.235 mol L-1, heating fluid temperature: 80 °C. Liquid phase concentrations are compared with model predictions for the average measured temperature.
The liquid concentrations for both presented cases seem to be well predicted by the
mass transfer model, and the values of evaporation rate are similar to the ones for evaporation of toluene in the absence of benzoic acid. Therefore, considering also the findings of Chapter 3, the overall process in the investigated conditions is gas side mass transfer limited.
200 400 600
0.075
0.085
0.095
0.105
0.115
Be
nzoic
acid
co
nce
ntratio
n
(mol
L-1
) in
liquid
pha
se
Gas flow rate (ml min-1
)
(a)
experiments
0
0.002
0.004
0.006
(mol
L-1
) in
ga
s p
ha
se
model
experiments
200 400 600
0.3
0.35
0.4
0.45
0.5
Be
nzoic
acid
co
nce
ntratio
n
(mol
L-1
) in
liquid
pha
se
Gas flow rate (ml min-1
)
(b)
experiments
0
0.002
0.004
0.006
(mol
L-1
) in
ga
s p
ha
se
model
experiments
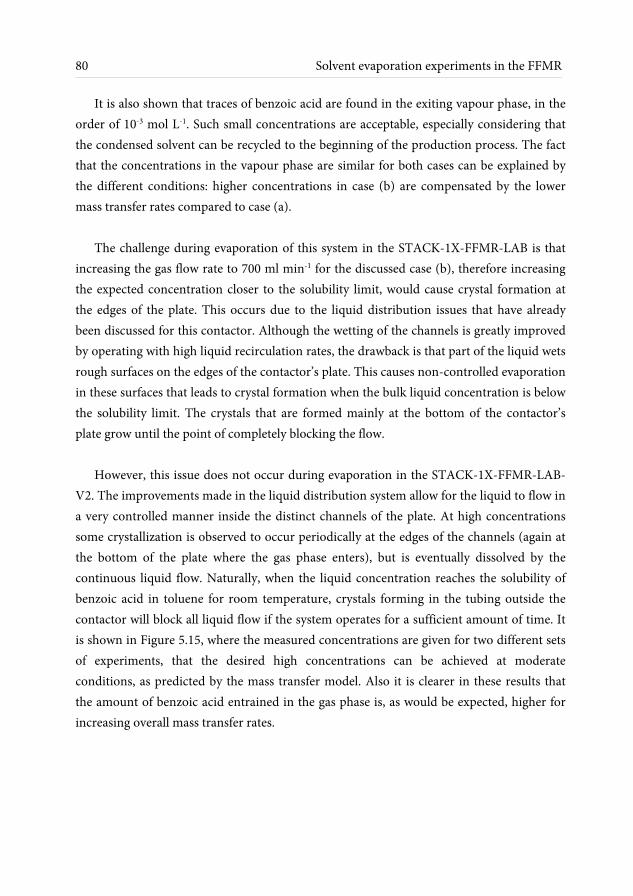
80 Solvent evaporation experiments in the FFMR
It is also shown that traces of benzoic acid are found in the exiting vapour phase, in the order of 10-3 mol L-1. Such small concentrations are acceptable, especially considering that the condensed solvent can be recycled to the beginning of the production process. The fact that the concentrations in the vapour phase are similar for both cases can be explained by the different conditions: higher concentrations in case (b) are compensated by the lower mass transfer rates compared to case (a).
The challenge during evaporation of this system in the STACK-1X-FFMR-LAB is that increasing the gas flow rate to 700 ml min-1 for the discussed case (b), therefore increasing the expected concentration closer to the solubility limit, would cause crystal formation at the edges of the plate. This occurs due to the liquid distribution issues that have already been discussed for this contactor. Although the wetting of the channels is greatly improved by operating with high liquid recirculation rates, the drawback is that part of the liquid wets rough surfaces on the edges of the contactor’s plate. This causes non-controlled evaporation in these surfaces that leads to crystal formation when the bulk liquid concentration is below the solubility limit. The crystals that are formed mainly at the bottom of the contactor’s plate grow until the point of completely blocking the flow.
However, this issue does not occur during evaporation in the STACK-1X-FFMR-LAB-
V2. The improvements made in the liquid distribution system allow for the liquid to flow in a very controlled manner inside the distinct channels of the plate. At high concentrations some crystallization is observed to occur periodically at the edges of the channels (again at the bottom of the plate where the gas phase enters), but is eventually dissolved by the continuous liquid flow. Naturally, when the liquid concentration reaches the solubility of benzoic acid in toluene for room temperature, crystals forming in the tubing outside the contactor will block all liquid flow if the system operates for a sufficient amount of time. It is shown in Figure 5.15, where the measured concentrations are given for two different sets of experiments, that the desired high concentrations can be achieved at moderate conditions, as predicted by the mass transfer model. Also it is clearer in these results that the amount of benzoic acid entrained in the gas phase is, as would be expected, higher for increasing overall mass transfer rates.
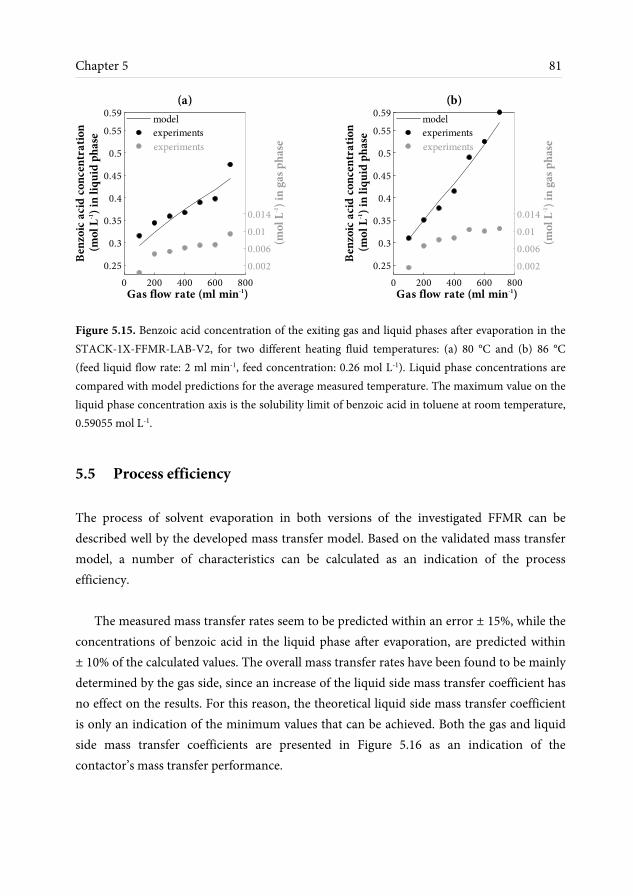
Chapter 5 81
Figure 5.15. Benzoic acid concentration of the exiting gas and liquid phases after evaporation in the STACK-1X-FFMR-LAB-V2, for two different heating fluid temperatures: (a) 80 °C and (b) 86 °C (feed liquid flow rate: 2 ml min-1, feed concentration: 0.26 mol L-1). Liquid phase concentrations are compared with model predictions for the average measured temperature. The maximum value on the liquid phase concentration axis is the solubility limit of benzoic acid in toluene at room temperature, 0.59055 mol L-1.
5.5 Process efficiency The process of solvent evaporation in both versions of the investigated FFMR can be described well by the developed mass transfer model. Based on the validated mass transfer model, a number of characteristics can be calculated as an indication of the process efficiency.
The measured mass transfer rates seem to be predicted within an error ± 15%, while the
concentrations of benzoic acid in the liquid phase after evaporation, are predicted within ± 10% of the calculated values. The overall mass transfer rates have been found to be mainly determined by the gas side, since an increase of the liquid side mass transfer coefficient has no effect on the results. For this reason, the theoretical liquid side mass transfer coefficient is only an indication of the minimum values that can be achieved. Both the gas and liquid side mass transfer coefficients are presented in Figure 5.16 as an indication of the contactor’s mass transfer performance.
0 200 400 600 800
0.25
0.3
0.35
0.4
0.45
0.5
0.55
0.59
Be
nzoic
acid
co
nce
ntratio
n
(mol
L-1
) in
liquid
pha
se
Gas flow rate (ml min-1
)
(a)
experiments
0.002
0.006
0.01
0.014
(mol
L-1
) in
ga
s p
ha
se
model
experiments
0 200 400 600 800
0.25
0.3
0.35
0.4
0.45
0.5
0.55
0.59
Gas flow rate (ml min-1
)
(b)
experiments
0.002
0.006
0.01
0.014
(mol
L-1
) in
ga
s p
ha
se
model
experiments
Be
nzoic
acid
co
nce
ntratio
n
(mol
L-1
) in
liquid
pha
se

82 Solvent evaporation experiments in the FFMR
Figure 5.16. Theoretical values of the gas side and liquid side mass transfer coefficient for both investigated versions of the STACK-1X-FFMR-LAB, as a function of gas flow rate and liquid flow rate respectively (properties calculated for toluene at 80 °C).
It should be noted that experimental values of the gas side mass transfer coefficient have
also been calculated according to the measured mass transfer rates. Due to the non-linearity of the mass balance equations, the mentioned error of ± 15% is enlarged to as high as ± 75% for the mass transfer coefficient values. This high sensitivity is introduced by the term (yA – yA*) in the mass balance equation (3.19), which moves from the numerator to the denominator when the equation is solved to calculate the kG values.
The percentage of gas saturation is calculated as the ratio of the bulk gas concentration
over the equilibrium concentration, which is the concentration on the gas-liquid interface. It is shown in Figure 5.17 that gas-liquid equilibrium is almost achieved at low gas flow rates, when the gas saturation is close to 100%. As the residence time of the gas decreases, the system grows further from equilibrium, maintaining in this way a significant driving force for mass transfer.
Considering the goal of this work, the main performance characteristic to be calculated
is a concentration based measure of efficiency. This is the increase of concentration in the liquid phase, defined as (Cout – Cin)/Cin. The outlet concentration and the rate of increase with gas flow rate depends greatly on the rest of the operating conditions. The developed model provides a tool to calculate the expected performance, and decide on the operating conditions considering the requirements of the system and the desired result. In Figure 5.18
100 300 500 7000.007
0.008
0.009
0.010
Gas flow rate (ml min-1
)
Ma
ss tra
nsfer
coe
fficie
nt
(ms
-1)
Gas side
0 2 4 6 8 10
0.00002
0.00006
0.00010
0.00014
0.00018
L iquid flow rate (ml min-1
)
Liquid side

Chapter 5 83
Figure 5.17. Calculated percentage of gas saturation after toluene evaporation in the STACK-1X-FFMR-LAB, for different temperatures and a range of gas flow rates.
Figure 5.18. Calculated percentage of concentration increase for a benzoic acid/toluene stream of initial concentration 0.25 mol L-1 and a range of operating conditions (calculated for non-recirculation mode). The upper limit on the y-axis corresponds to the solubility concentration of benzoic acid in toluene at room temperature. the calculated concentration increase is given as a function of gas flow rate to illustrate how a range of operating conditions can provide a significant increase on the liquid concentration.
5.6 Concluding remarks
Solvent evaporation experiments are performed in the STACK-1X-FFMR-LAB with liquid recirculation as a method to improve channel wetting. It is found that channel drying is
100 300 500 70060
70
80
90
100
Gas flow rate (ml min-1
)
Ga
s saturatio
n (
%)
70 °C
80 °C
90 °C
100 300 500 7000
20
40
60
80
100
120
Gas flow rate (ml min-1
)
Co
nce
ntratio
n i
ncrea
se
(%
)
1.5 ml min-1, 70
°C
1.5 ml min-1, 80
°C
1.5 ml min-1, 90
°C
2 ml min-1, 70
°C
2 ml min-1, 80
°C
2 ml min-1, 90
°C
84 Solvent evaporation experiments in the FFMR
prevented at high recirculation rates and mass transfer rates independent of the feed liquid flow rate can be achieved. A new version of the contactor that has been developed by IMM with an improved liquid distribution system is introduced in this chapter. The STACK-1X-FFMR-LAB-V2 is also investigated experimentally for solvent evaporation and it is found that the performance deteriorates at liquid flow rates beyond the recommended operating range of 2.5 ml min-1, because of gas-liquid separation difficulties at the bottom of the contactor.
The evaporation rates for both contactors are predicted well by the developed mass
transfer model, and so are the benzoic acid concentrations of a benzoic acid/toluene solution after evaporation in the FFMR. Concentrations seem to be increased more than 100% of the initial concentration, depending on the operating conditions. The challenge during evaporation of such a system is the formation of crystals in the sharp edges of the contactor’s plate that can occur at high concentrations, even when the liquid bulk concentration is below the solubility limit. Due to the improved liquid distribution of the STACK-1X-FFMR-LAB-V2, this undesired crystal formation is limited to the rough edges of the channels and only appears periodically, as the formed crystals are quickly dissolved by the continuous liquid flow. Concentrations as high as 90% of the solubility limit have been achieved for the investigated system in this contactor.
The findings of this chapter show that the investigated falling film micro reactor can be
used very efficiently as a contactor for solvent evaporation. The developed mass transfer model provides a tool to predetermine the required operating conditions according to the desired evaporation rate and final concentration of the system. The main advantage of this process is the high mass transfer rates that can be achieved at relatively mild conditions. The low operating temperatures, combined with the small volume of the system, translate into lower utility costs compared to conventional falling film evaporation technologies, which would require to be performed in vacuum in order to reduce the boiling point temperatures.

This chapter is adapted from:
Moschou, P., Croon, M. H. J. M. de, Schaaf, J. van der, Schouten, J. C., 2013. Ultrasonication enabled continuous crystallization in a milli capillary.
Chemical Engineering & Technology, submitted.
Abstract
This chapter is a preliminary study on continuous cooling crystallization of benzoic acid with the aid of ultrasonic irradiation. A saturated toluene/benzoic acid solution is introduced in a PFA capillary, submerged in a cooled ultrasonic bath. Different residence times are investigated by altering the feed flow rate, and different supersaturation ratios by changing the operating temperature. Crystallization is successfully performed without any sign of blockage. In a short start-up phase no crystals are formed. Crystals appear within 2 to 5 residence times and they flow as slurry through the capillary. The slurry is filtered under vacuum and the obtained solids are examined with SEM images. Due to the small range of investigated conditions no trend is identified for the effect of temperature and residence time as similar images are obtained in all cases. Still, the formation of highly crystalline and pure crystals at large volume fractions is achieved, indicating the significant potential of the developed method in separation and reaction applications.
Preliminary study on ultrasonication assisted continuous crystallization

86 Preliminary study on ultrasonication enhanced continuous crystallization
6.1 Introduction
The last part of this thesis is a preliminary study on a continuous crystallization method that can be integrated with the developed micro device-based work-up setup. Crystallization in a flow system in micro/milli scale is extremely challenging due to channel blockage that is bound to occur due to agglomeration of crystals, which can easily lead to bridging between channel walls when the channel dimensions are sufficiently small. Ultrasonic irradiation has been found to decrease the mean particle size (Dhumal et al., 2009; Guo et al., 2005; Kim et al., 2011; Li et al., 2003; Luque de Castro and Priego-Capote, 2007; Manish et al., 2005; McCausland and Cains, 2004; Nalajala and Moholkar, 2011) and significantly decrease particle agglomeration in batch applications (Kim et al., 2011).
There is a number of examples of ultrasound assisted crystallization, or sonocrystallization, implemented in industry mainly for control of the mean particle size and the size distribution (Ruecroft et al., 2005). It is generally stated that ultrasonication results into a narrow size distribution (Dhumal et al., 2009; Kim et al., 2011), although, when compared to mechanically agitated antisolvent crystallization, the size distribution is in fact wider (Guo et al., 2005; Nalajala and Moholkar, 2011). One of the most important advantages of sonocrystallization is the significant decrease of induction time, as the shock waves produced cause nucleation, eliminating at the same time the need for external seeding (Guo et al., 2005; Luque de Castro and Priego-Capote, 2007; Nalajala and Moholkar, 2011; Ruecroft et al., 2005). The intensified nucleation is also enhancing the formation of smaller crystals, since, as the number of nuclei increases, the amount of material available for growth of each nucleus is smaller (Nalajala and Moholkar, 2011). At the same time, cavitation that occurs due to ultrasonic irradiation causes particle breakage and attrition in the crystals, which also leads to a decrease in their average size (Boels et al., 2011; Devarakonda et al., 2004; Wagterveld et al., 2011). It has also been found that ultrasonication favours the formation of a specific crystal shape over another one (Dhumal et al., 2009; Guo et al., 2005; Ruecroft et al., 2005).
Overall, the effect that ultrasound has on the crystal properties depends on the specific
operating conditions, such as the supersaturation ratio, and altering different parameters (the frequency, intensity, power and pulsing) can yield different effects on the crystallization process (Ruecroft et al., 2005). This gives the opportunity to tailor such
Chapter 6 87
properties by altering the ultrasound parameters or conditions such as the sonication time and volume (or the residence time in continuous applications).
Most of the existing literature on sonocrystallization refers to lab scale batch processes,
with only suggestions for potential continuous applications, for example by the use of several ultrasonic probes in a tube where the crystallizing solution flows (Li et al., 2003). The effect of ultrasonic irradiation on continuous micro systems has been investigated for a Teflon microreactor with an integrated piezoelectric actuator (Kuhn et al., 2011) and for a PFA capillary submerged in an ultrasonic bath (Noël et al., 2011). In the same line of work an investigation was carried out on the mechanisms that lead to clogging in both devices, which have been identified to be bridging and constriction of particles in the channel walls (Hartman et al., 2010). The solids obtained in these studies are the by-products of a palladium-catalysed amination reaction and the crystal size ranges from 0.15 to 40 μm. The main result was that no channel blockage was observed under ultrasonic irradiation in the investigated systems, while the ultrasound decreased the mean particle size and narrowed the size distribution. It was also found that small residence times were sometimes sufficient to prevent blockage, as convective forces were able to overcome particle-to-particle or particle-to-wall interactions that could lead to constriction and eventually bridging and channel blockage.
A similar system is developed in this study for cooling crystallization of benzoic acid
from a toluene/benzoic acid solution. The ultrasound parameters are not investigated in this preliminary study, as a standard ultrasonic bath is used for the experiments. The effects of the residence time and supersaturation on the crystals size and shape are investigated by changing the feed flow rate and the bath temperature, respectively.
6.2 Materials and methods Crystallization experiments are performed for a toluene/benzoic acid solution. The specifications of the chemicals are given in Chapter 5. A saturated solution is prepared according to the known saturation concentration of benzoic acid in toluene at room temperature, which is 0.59055 mol L-1. The solubility curve of benzoic acid in toluene is given in Figure 6.1, as a reference for the expected effect of temperature on the supersaturation ratio.

88 Preliminary study on ultrasonication enhanced continuous crystallization
Figure 6.1. Solubility concentration of benzoic acid in toluene as a function of temperature. (Thati et al., 2010)
The experimental setup is depicted in Figure 6.2. The saturated solution of benzoic acid in toluene is introduced into a PFA capillary through an HPLC pump (Shimadzu LC- 20AD). The internal diameter of the capillary is 2 mm, and the length that is submerged in the cooled ultrasonic bath is 1.5 m. The water in the ultrasonic bath is recirculating through a cooling bath (Lauda Ecoline RE-104) with the help of two peristaltic pumps. The level of water in the two baths is manually controlled: the tubing that removes water from the ultrasonic bath is placed with a holder at a specific level while the Peristaltic Pump 1 is set at a slightly higher flow rate than Pump 2. In this way the amount of water in the two baths is balanced so that none of them will empty or flood. All the tubing in this water circle is insulated.
Figure 6.2. A scheme of the experimental setup for ultrasonication enhanced continuous cooling crystallization.
The cooling bath used in this setup has been found to cool water with a power of 130
Watts. The power with which the ultrasonic bath heats up the water depends on the
0 10 20 30 40 500
0.5
1
1.5
2
Temperature (°C)
Co
nce
ntratio
n (mol
L-1
)
HPLC Pump
Liquid feed:
saturated solution
Ultrasonic bath
Cooling bath
Peristaltic Pump 1
Peristaltic Pump 2
Vacuum
filtration
PFA tube
Solid
sample
Chapter 6 89
available volume, as the heating is performed in a molecular level. For this reason the minimum amount of water is used to fill the ultrasonic bath. For the volume of 0.5 L that is used, the power of the ultrasonic bath has been found to be less than 50 Watts. This means that the cooling capacity of the Lauda bath should be able to compensate for the heating power of the ultrasonic bath. However, due to the low temperatures involved (0-10 °C), heat transfer from the environment could not be avoided, and it was difficult to control the temperature with accuracy higher than ± 2 °C.
It was found that without ultrasonication the flow was blocked, as no liquid would
appear on the exit of the capillary after a few minutes. Under ultrasonication, the crystals appear within 2 to 5 residence times and they flow continuously as a dense slurry phase through the PFA capillary. This delay in the observation of crystals is an indication that ultrasonication induced nucleation does not occur on the bulk of the liquid but possibly on the channel walls. The start-up time is required for the crystals size to reach a critical value, in order for them to be released to the bulk of the liquid. Nucleation at the channel walls is in agreement with literature where it has been noted that cavitation effects, which are responsible for inducing nucleation, can be more intense in the presence of a solid surface (Wagterveld et al., 2011).
Once nucleation occurs then a slurry of crystals flows continuously and up to 45% of the
initial material crystallizes with solid volume fractions as high as 2.6%. The slurry phase is immediately filtered under vacuum after exiting the PFA capillary and the solids are collected. A Grade 41 Ashless filter paper by Whatman® is used to ensure fast filtration, so that no crystal growth takes place on the filter. The amount of benzoic acid that crystallizes in a specific amount of time was determined by weighing the filter paper before and after the filtration.
Scanning electron microscopy pictures of the samples are taken with a Phenom Pro
desktop SEM, in order to examine the size and shape of the crystals. A gold coating is sputtered to the samples before the SEM measurements with the EMITECH K550 sputter coater. XRD analysis is performed in order to define the crystallinity of the obtained solids, using a Rigaku X-Ray Machine. The purity of the crystals is also examined by Differential Scanning Calorimetry measurements, using the DSC Q100 calorimeter from TA Instruments.
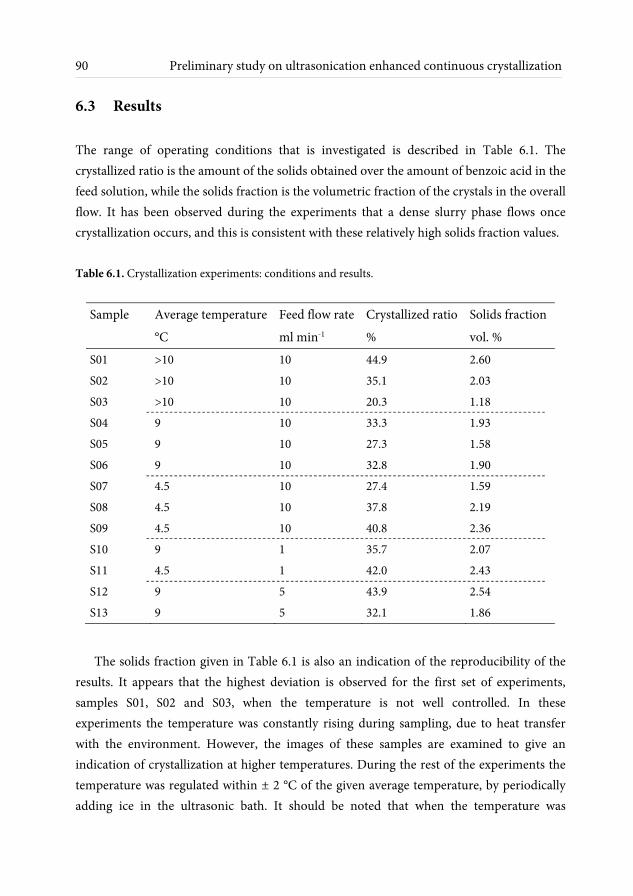
90 Preliminary study on ultrasonication enhanced continuous crystallization
6.3 Results The range of operating conditions that is investigated is described in Table 6.1. The crystallized ratio is the amount of the solids obtained over the amount of benzoic acid in the feed solution, while the solids fraction is the volumetric fraction of the crystals in the overall flow. It has been observed during the experiments that a dense slurry phase flows once crystallization occurs, and this is consistent with these relatively high solids fraction values. Table 6.1. Crystallization experiments: conditions and results.
Sample Average temperature Feed flow rate Crystallized ratio Solids fraction
°C ml min-1 % vol. % S01 >10 10 44.9 2.60 S02 >10 10 35.1 2.03 S03 >10 10 20.3 1.18 S04 9 10 33.3 1.93 S05 9 10 27.3 1.58 S06 9 10 32.8 1.90 S07 4.5 10 27.4 1.59 S08 4.5 10 37.8 2.19 S09 4.5 10 40.8 2.36 S10 9 1 35.7 2.07 S11 4.5 1 42.0 2.43 S12 9 5 43.9 2.54 S13 9 5 32.1 1.86
The solids fraction given in Table 6.1 is also an indication of the reproducibility of the results. It appears that the highest deviation is observed for the first set of experiments, samples S01, S02 and S03, when the temperature is not well controlled. In these experiments the temperature was constantly rising during sampling, due to heat transfer with the environment. However, the images of these samples are examined to give an indication of crystallization at higher temperatures. During the rest of the experiments the temperature was regulated within ± 2 °C of the given average temperature, by periodically adding ice in the ultrasonic bath. It should be noted that when the temperature was

Chapter 6 91
regulated at 15 °C no crystallization occurred for approximately 45 minutes (with a residence time of almost 1 min). It is possible that at such low supersaturation no nucleation can occur.
In all experiments mentioned in Table 6.1, the slurry flow appeared within 2 to 5
residence times. At a flow rate of 1 ml min-1 (residence time = 5 min) the slurry flow is not continuous, as it only appears periodically, alternated with a flow of clear liquid. This is an indication that the system does not actually prevent crystal formation at the walls of the capillary but it prevents it from blocking the flow: the crystals are accumulating inside the capillary that is submerged in the bath and clear liquid is exiting the system until the ultrasonic irradiation breaks the crystal agglomerates and the solids exit the system as a slurry. Unfortunately this theory is not supported by pressure measurements because the toluene punctured the connected pressure sensors and no measurements could be taken.
At higher flow rates the solids flow continuously as a slurry phase through the PFA
capillary. Experiments were run for more than 90 min without any sign of channel blockage.
6.3.1 Crystals shape and size observations In Figure 6.3 the SEM image of the fresh benzoic acid, as it is bought from the supplier, is given as a reference. The SEM images that are obtained for the experiments listed in Table 6.1 are given in Figures 6.4 to 6.8.
Figure 6.3. SEM image of the fresh benzoic acid crystals as a reference.

92 Preliminary study on ultrasonication enhanced continuous crystallization
Figure 6.4. SEM images of samples S01, S02 and S03 (flow rate: 10 ml min-1, temperature: >10 °C).
Figure 6.5. SEM images of samples S04, S05 and S06 (flow rate: 10 ml min-1, temperature: 9 °C).
Figure 6.6. SEM images of samples S07, S08 and S09 (flow rate: 10 ml min-1, temperature: 4.5 °C).
S01 S02 S03
S04 S05 S06
S07 S08 S09

Chapter 6 93
Figure 6.7. SEM images of samples S10 and S11 (flow rate: 1 ml min-1, temperature: 9 °C and 4.5 °C respectively).
Figure 6.8. SEM images of samples S12 and S13 (flow rate: 10 ml min-1, temperature: 9 °C).
It is clear that in all cases the crystals are shaped as plates, just as the fresh benzoic acid crystals. The thickness of the plates, however, appears to be smaller for the samples obtained in our system.
It is difficult to make a distinction between the crystals obtained at different supersaturation conditions because, depending on the position of the sample with respect to the microscope, and also depending on how the solids are handled during loading, different pictures can be obtained for identical samples, as can be seen in Figure 6.8 where two identical samples are compared (in S12 crystal size appears larger than S13). This is also an indication of the wide size distribution that results from our system. It is, however, reasonable to conclude that there is no observed effect of supersaturation on the crystal size. According to the crystal growth theory for crystallization from solution, low
S10 S11
S12 S13
94 Preliminary study on ultrasonication enhanced continuous crystallization
supersaturation leads to a parabolic dependence of growth rate on supersaturation, whereas higher S values would result in a linear dependence (Mersmann et al., 2001). It is expected that at the low supersaturation values investigated in our study, and within the relatively small range, there is no significant effect on crystal size.
Similarly, comparing images that correspond at different flow rates at the same
temperature does not allow any conclusion about the effect of residence time. The same type of crystals is obtained at 9 °C no matter what the residence time is (samples S04, S05, S06, S10, S12 and S13).
6.3.2 Effect of ultrasonic irradiation on crystal size A batch test was performed in order to examine the effect of the ultrasonic irradiation on the growth of the crystals. Four vials were prepared with 5 ml of saturated toluene/benzoic acid solution and 0.5 g of benzoic acid additionally, to obtain a slurry phase. One of the vials was immediately filtered and the solid sample was collected. The three remaining vials were submerged into the ultrasonic bath, where the temperature was controlled at 22 °C. After being filtered at different times the samples were collected and their SEM images are given in Figure 6.9.
The crystals appear to degrade even at ultrasonication times as small as 10 min. These results are in agreement with literature, where it is found that the mean crystal size decreases with increasing sonication times and eventually reaches a minimum value (Dhumal et al., 2009; Kim et al., 2011). It has been noted that the benzoic acid plates obtained at our continuous system are thinner compared to the fresh benzoic acid crystals. It is therefore expected that the degrading effect of the ultrasonication on them is much intense, especially when it occurs simultaneously with crystal growth.
The ultrasonication induced abrasion of crystals during crystallization appears to compete with crystal growth and supress it, leading to the trend of decreasing crystal size with increasing sonication times that is recorded in literature. However, in our continuous experiments it is possible that the investigated residence times (approximately 1 to 10 min) are already high enough to obtain the minimum mean crystal size, resulting in the residence time being insignificant for the final crystal size.

Chapter 6 95
Figure 6.9. SEM images of benzoic acid samples for different ultrasonication times (from top left to bottom right: t = 0 min, t = 10 min, t = 30 min, t = 60 min).
6.3.3 Crystallinity measurements The crystallinity of the samples is examined by X-ray diffraction analysis. The diffraction patterns of the fresh benzoic acid crystals, together with three of the samples obtained with our continuous crystallization system are given in Figure 6.10.
It might be assumed by observing the SEM images that the crystallinity of the solids obtained with our system is lower compared to pure benzoic acid, due to the roughness of the crystals. However, the sharp peaks that are observed for all samples show that the crystallinity is not decreased by the ultrasonic irradiation in our system. The heights of the peaks are different due to the difference in particle size, which is mainly caused by the way the solids are handled during measurements (samples are manually grinded when loaded). The effect that the ultrasonication has on the crystallinity seems to depend greatly on the
t = 0 min t = 10 min
t = 30 min t = 60 min
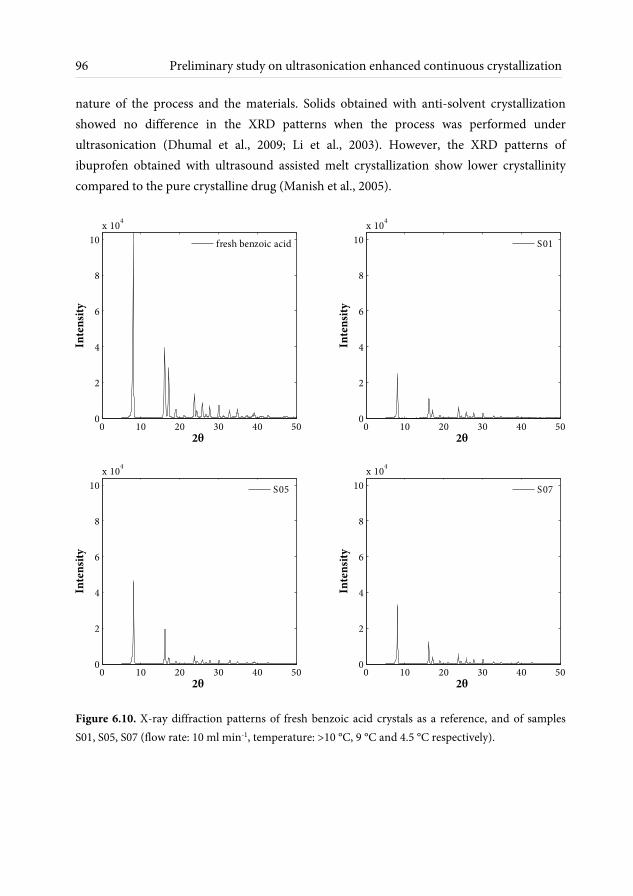
96 Preliminary study on ultrasonication enhanced continuous crystallization
nature of the process and the materials. Solids obtained with anti-solvent crystallization showed no difference in the XRD patterns when the process was performed under ultrasonication (Dhumal et al., 2009; Li et al., 2003). However, the XRD patterns of ibuprofen obtained with ultrasound assisted melt crystallization show lower crystallinity compared to the pure crystalline drug (Manish et al., 2005).
Figure 6.10. X-ray diffraction patterns of fresh benzoic acid crystals as a reference, and of samples S01, S05, S07 (flow rate: 10 ml min-1, temperature: >10 °C, 9 °C and 4.5 °C respectively).
0 10 20 30 40 500
2
4
6
8
10
x 104
2θ
Inte
nsit
y
fresh benzoic acid
0 10 20 30 40 500
2
4
6
8
10
x 104
2θ
Inte
nsit
y
S01
0 10 20 30 40 500
2
4
6
8
10
x 104
2θ
Inte
nsit
y
S05
0 10 20 30 40 500
2
4
6
8
10
x 104
2θ
Inte
nsit
y
S07
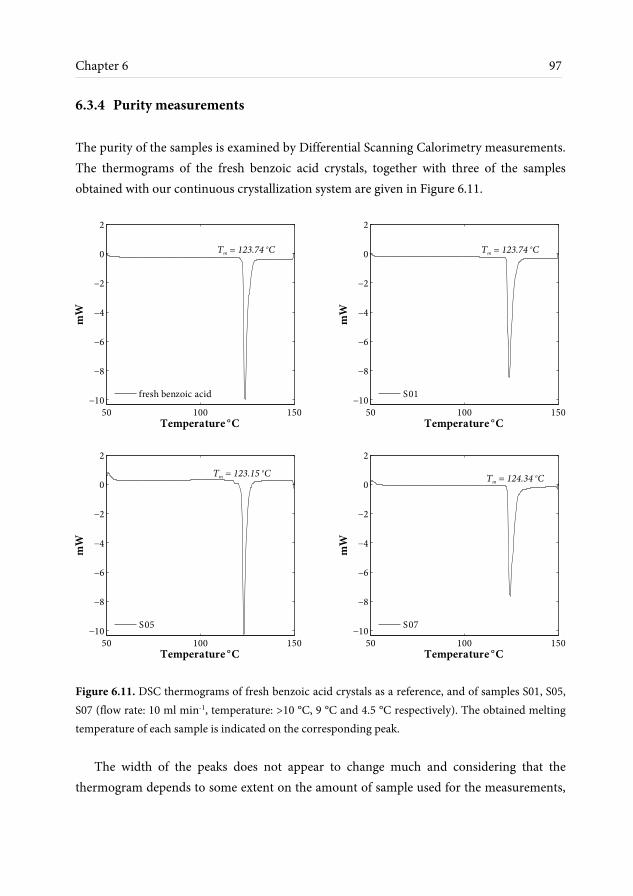
Chapter 6 97
6.3.4 Purity measurements The purity of the samples is examined by Differential Scanning Calorimetry measurements. The thermograms of the fresh benzoic acid crystals, together with three of the samples obtained with our continuous crystallization system are given in Figure 6.11.
Figure 6.11. DSC thermograms of fresh benzoic acid crystals as a reference, and of samples S01, S05, S07 (flow rate: 10 ml min-1, temperature: >10 °C, 9 °C and 4.5 °C respectively). The obtained melting temperature of each sample is indicated on the corresponding peak.
The width of the peaks does not appear to change much and considering that the
thermogram depends to some extent on the amount of sample used for the measurements,
50 100 150
−10
−8
−6
−4
−2
0
2
Temperature °C
mW
fresh benzoic acid
Tm = 123.74 oC
50 100 150
−10
−8
−6
−4
−2
0
2
Temperature °C
mW
S01
Tm = 123.74 oC
50 100 150
−10
−8
−6
−4
−2
0
2
Temperature °C
mW
S05
Tm = 123.15 oC
50 100 150
−10
−8
−6
−4
−2
0
2
Temperature °C
mW
S07
Tm = 124.34 oC

98 Preliminary study on ultrasonication enhanced continuous crystallization
and that different amounts were available for each sample, it can be concluded that the purity of the crystals obtained with our system is very high.
6.4 Conclusions and outlook This work is a critical first step for the development of continuous crystallization in the micro/milli scale. A saturated toluene/benzoic solution is introduced in a PFA capillary which is submerged in a cooled ultrasonic bath and crystallization is performed successfully without any sign of channel blockage while the crystals flow continuously as a dense slurry phase.
The effect of the investigated parameters is examined mainly by the SEM images of the obtained solids where an indication of the crystals shape and size is given. Crystals of similar properties are obtained at all investigated conditions, so no trend has been identified for the tested range of supersaturation and residence time values. Due to the shock waves and crystal abrasion that is caused by the ultrasound, the crystals degrade significantly while sonicated, and this is one of the reasons that lead to a small mean particle size in all ultrasonic assisted crystallization cases that appear in literature (with the other reason being the increased nucleation rate).
Overall, it appears that the effect the ultrasonication has on the crystallization is
specific to the investigated system, materials and conditions. Different trends have been recorded in literature for the crystal size distribution, the shape, the crystallinity and the purity of the obtained solids. According to the findings of this work the level of degradation that the crystals undergo is too high to implement such a process at the final step of a work up line. It is possible, however, that crystals with the desired shape and size characteristics can be obtained for different materials. Moreover parameters which have not been investigated in this study, such as the power and frequency of ultrasonication, are expected to have a significant effect on the crystallization process.
Successful continuous operation of a system with high solids fractions at the scale of
only a few millimetres is a breakthrough not only for crystallization purposes, but creates possibilities for new applications. The size of the obtained crystals is typical for slurry catalyst particles and it is expected from our results that much higher solid fractions can be
Chapter 6 99
handled by the ultrasonicated system at low residence times. The possibility rises for a micro/milli capillary catalytic slurry reactor for liquid and gas-liquid flow systems, with highly intensified mass transfer due to the ultrasonication and the high solid/liquid surface area. Such a reactor would eliminate the need for complex catalytic coating procedures and enable easy catalyst regeneration or replacement.

7.1 Conclusions
The development of continuous microfluidic based separation systems can lead to fundamental changes in the production of fine chemicals and pharmaceutical compounds. Replacement of the reactor alone with a microdevice leads to significant reductions in operating cost (Roberge et al., 2005). A complete production line, with micro processing equipment connected to a micro reactor, operating continuously can lead to lower costs, higher safety and even improved product quality compared to conventional industrial production. The results of this thesis describe the feasibility of evaporation and crystallization in such systems, as a first step towards continuous industrial production.
The need for a very well controlled evaporation process drove the development of the mass transfer model described in Chapter 3. Evaporation in the falling film micro contactor was modelled in terms of mass transfer in order to define the main parameters influencing overall mass transfer. According to previous work performed in IMM very small temperature gradients are expected along the length of the contactor, and therefore the process is assumed isothermal for simplification in this chapter. Due to the small dimensions of the device, laminar flow is established in both the gas and liquid phase. This might lead to a smaller Sherwood number compared to turbulent flow, but the mass transfer coefficient being a relatively weak function of flow rate is advantageous for being able to tailor the evaporation rate. Due to the very thin films achieved in the FFMR, very
Conclusions and recommendations
102 Conclusions and recommendations
high liquid side mass transfer coefficients are expected. The overall mass transfer coefficient is dominantly determined by the gas side, for a wide range of operating conditions. This conclusion is also beneficial for simplifying the adjustment of the evaporation rate and final stream concentration according to the desired values.
Although isothermal operation has been assumed, the actual temperature during
evaporation is defined by the temperature of the heating fluid, in combination with the gas and liquid flow rates. According to the heat transfer calculations performed in Chapter 4 it is expected that the temperature in the liquid phase is almost constant at all conditions. However, experimental measurements show considerably lower temperature values at low liquid flow rates. Combined with low measured mass transfer rates these results indicate that the interfacial area is lower than expected, which is the result of channel drying, confirmed also be visual observations. Although the liquid flow distribution and minimum wetting thickness in the FFMR have been investigated in the past, no work has been performed during a process like evaporation that leads to a constant decrease of liquid flow rate. Small degrees of maldistribution can lead to local gradients in evaporation rate, which then enhance the difference in flow rate between the different channels, potentially leading to temperature gradients as well. In this way evaporation enhances maldistribution, leading to drying of one or more of the channels at flow rates above the minimum wetting value.
The wetting issues of the investigated contactor can be resolved by introducing a liquid
recirculation loop, which increases the apparent liquid flow rate in the channels and prevents drying. This method can have a toll on efficiency, but it is calculated to be insignificant in the range of operating conditions, that is below the system’s solubility limit. An improvement in the liquid distribution system of the contactor, made by IMM, was also successful to minimize flow rate differences between the channels. This second version of the FFMR was successfully used for evaporation without channel drying.
Overall, high mass transfer rates can be achieved during evaporation in the investigated
FFMR, reaching concentration values close to equilibrium. For a toluene/benzoic acid stream with a flow rate of 1 – 3 ml min-1, the concentration of a benzoic acid can be more than doubled and reach 90% of the solubility limit, at a temperature 20 °C below the solvent’s boiling point. Experimental measurements of mass transfer and concentration are predicted within an error ± 15% by the described mass transfer model. According to the results of this thesis, evaporation in the FFMR is a well-defined process that enables
Chapter 7 103
concentration at moderate temperatures and up to concentrations very close to saturation, with potential application in a continuous production line. The main challenges in the application of this process will be to maintain a good liquid distribution that can prevent channel drying, and to avoid the formation of crystals in the rough edges of the plate.
Solids’ handling in micro devices has been the main limitation in the application of such
systems in industry. Crystal formation in the FFMR needs to be avoided because it will lead to channel blockage. An ultrasonicated tubular crystallizer is tested in this thesis as a system that can be integrated to a microreactor based production line, in line with the evaporation micro contactor. Ultrasonic irradiation has been identified as a method to prevent channel blockage in micro channels mainly by decreasing the average particle size (Hartman et al., 2010; Kuhn et al., 2011; Noël et al., 2011). The ability of ultrasonication to decrease nucleation induction times by cavitation is also utilized in our system in order to perform crystallization at low supersaturation values. Successful production of a continuous dense slurry of pure and crystalline benzoic acid is the first step towards the application of microfluidic crystallization in industry.
7.2 Recommendations Both processes investigated in this thesis have significant potential for application in chemical production. However, several improvements are required for the optimization of the method as a two-step separation.
It has already been highlighted that liquid distribution is crucial for maintaining full wetting of the contactor’s channels during evaporation in the FFMR. A good liquid distribution system combined with tight fitting between the plates also prevents liquid from flowing outside the microstructured channels, which can lead to undesired crystal formation in rough parts of the reactor. The modifications made on the STACK-1x-FFMR-Lab-V2 by IMM minimize these issues, but a further decrease of the distance between the plates after brazing might completely prevent undesired crystallization and allow operation at higher concentrations.
Apart from optimizing the contactor’s design, investigating other types of operation
might also have a beneficial effect on the process. In a recent study, falling film micro channels were investigated under different degrees of inclination (Anastasiou et al., 2013).

104 Conclusions and recommendations
As expected, the minimum wetting flow rate is increasing with increasing degree of inclination from the horizontal position. It is therefore possible that operating the investigated FFMR in a non-vertical position can improve the wetting of the channels and enable higher mass transfer rates without drying.
Scale up of the evaporation setup has been an important feature to consider during the
selection of the contactor. The STACK-1x-FFMR-Lab allows for easy scale up by numbering up from a plate of 5 channels to a plate of 50 channels in the STACK-1x-FFMR-LARGE, and eventually to ten plates with a total of 500 channels in the STACK-10x-FFMR-LARGE (catalogue IMM “The catalogue, 5/09” available under www.imm-mainz.de). The ten-plate contactor is pilot plant or even production scale equipment, with a liquid flow rate capability up to 12 L h-1. Experimental work with the two scaled up contactors step by step is required to ensure that the process efficiency is not decreased, mainly due to liquid distribution issues, which might reoccur.
Further experimental work is also required for the ultrasonicated crystallization process,
as several parameters that have not been investigated in this thesis are expected to have a significant effect on the crystallization process under ultrasonication. Crystal size distribution measurements are required to quantify their dependence on ultrasonication power and frequency.
It is known that ultrasonic irradiation decreases the average particle size, both by
increasing nucleation rates over growth and by abrasion of the formed crystals. In order to increase particle size while maintaining a small size distribution it is useful to consider applying ultrasonication locally. By sonicating at the initial part of the tubular crystallizer a high nucleation rate will be achieved, leading to uniform small crystals acting as seeds for the remaining length of the crystallizer, where growth will take place. In this type of operation it is possible that the pulsation of the channel walls will not be sufficient to prevent channel blockage in the growth part of the crystallizer. The use of an inert gas and therefore operation in segmented flow should be considered as a method to increase cavitation and prevent channel blockage throughout the tube.
Although many parameters are still to be investigated, the potential of ultrasonication is
highlighted in this thesis. Handling large fractions of solids in a milli channel gives the possibility for the development of a micro/milli capillary catalytic slurry reactor for liquid

Chapter 7 105
and gas-liquid flow systems, as described in Chapter 6. The intense mixing caused by the ultrasound combined with the high solid/liquid surface area would lead to very high mass transfer rates in such a reactor. Using a catalyst in slurry phase would eliminate the need for complex catalytic coating procedures and enable easy catalyst regeneration or replacement.
The combination of the two investigated processes in a pilot plant with other micro
separation equipment is the final and most important recommendation in this thesis. Continuous operation of the two setups in line is the next step for their application in fine chemical and pharmaceutical production. Tuning the flow rates and recycling of the solvent after evaporation are expected to be the main challenges in the integration of the equipment. In the scope of a complete evaporation and crystallization process it is also interesting to consider ultrasonication during evaporation in the FFMR to examine the possibility of a one step process. For such a process to be feasible many adjustments are required in the design of the contactor, focusing on the use of materials that would prevent crystal formation at the walls and the increase of channel and outlet port diameters to enable the exit of a slurry flow.

References
Abou Hassan, A., Sandre, O., Cabuil, V., Tabeling, P., 2008. Synthesis of iron oxide nanoparticles in a microfluidic device: preliminary results in a coaxial flow millichannel. Chemical Communications 44, 1783–1785.
Abou Hassan, A., Sandre, O., Neveu, S., Cabuil, V., 2009. Synthesis of goethite by separation of the nucleation and growth processes of ferrihydrite nanoparticles using microfluidics. Angewandte Chemie International Edition 48, 2342–2345.
Adiche, C., Sundmacher, K., 2010. Experimental investigation on a membrane distillation based micro-separator. Chemical Engineering and Processing: Process Intensification 49, 425–434.
Al-Rawashdeh, M., Hessel, V., Löb, P., Mevissen, K., Schönfeld, F., 2008. Pseudo 3-D simulation of a falling film microreactor based on realistic channel and film profiles. Chemical Engineering Science 63, 5149–5159.
Anastasiou, A.D., Gavriilidis, A., Mouza, A. a., 2013. Study of the hydrodynamic characteristics of a free flowing liquid film in open inclined microchannels. Chemical Engineering Science 101, 744–754.
Bird, R.B., Stewart, W.E., Lightfoot, E.N., 2002. Transport Phenomena, 2nd ed. Wiley, New York.
Boels, L., Wagterveld, R.M., Witkamp, G.J., 2011. Ultrasonic reactivation of phosphonate poisoned calcite during crystal growth. Ultrasonics sonochemistry 18, 1225–1231.
Cabeza, V.S., Kuhn, S., Kulkarni, A.A., Jensen, K.F., 2012. Size-Controlled Flow Synthesis of Gold Nanoparticles Using a Segmented Flow Microfluidic Platform. Langmuir 28, 7007–7013.

108 References
Chan, E.M., Alivisatos, A.P., Mathies, R.A., 2005. High-temperature microfluidic synthesis of CdSe nanocrystals in nanoliter droplets. Journal of the American Chemical Society 127, 13854–13861.
Chasanis, P., Lautenschleger, a., Kenig, E.Y., 2010. Numerical investigation of carbon dioxide absorption in a falling-film micro-contactor. Chemical Engineering Science 65, 1125–1133.
Choi, Y.-J., Chung, S.-T., Oh, M., Kim, H.-S., 2005. Investigation of Crystallization in a Jet Y-Mixer by a Hybrid Computational Fluid Dynamics and Process Simulation Approach. Crystal Growth & Design 5, 959–968.
Commenge, J.-M., Obein, T., Framboisier, X., Rode, S., Pitiot, P., Matlosz, M., 2011. Gas-phase mass-transfer measurements in a falling-film microreactor. Chemical Engineering Science 66, 1212–1218.
Commenge, J.-M., Obein, T., Genin, G., Framboisier, X., Rode, S., Schanen, V., Pitiot, P., Matlosz, M., 2006. Gas-phase residence time distribution in a falling-film microreactor. Chemical Engineering Science 61, 597–604.
Cote, L.J., Teja, A.S., Wilkinson, A.P., Zhang, Z.J., 2002. Continuous hydrothermal synthesis and crystallization of magnetic oxide nanoparticles. Journal of Materials Research 17, 2410–2416.
Cussler, E.L., 2009. Diffusion: Mass Transfer in Fluid Systems, 3rd ed. Cambridge University Press, Cambridge.
Cypes, S.H., Engstrom, J.R., 2004. Analysis of a toluene stripping process: a comparison between a microfabricated stripping column and a conventional packed tower. Chemical Engineering Journal 101, 49–56.
Dendukuri, D., Pregibon, D.C., Collins, J., Hatton, T.A., Doyle, P.S., 2006. Continuous-flow lithography for high-throughput microparticle synthesis. Nature Materials 5, 365–369.
Devarakonda, S., Evans, J.M.B., Myerson, A.S., 2004. Impact of Ultrasonic Energy on the Flow Crystallization of Dextrose Monohydrate. Crystal Growth & Design 4, 687–690.
Dhumal, R.S., Biradar, S. V., Paradkar, A.R., York, P., 2009. Particle engineering using sonocrystallization: salbutamol sulphate for pulmonary delivery. International Journal of Pharmaceutics 368, 129–137.

References 109
Donnet, M., Jongen, N., Lemaître, J., Bowen, P., 2000. New morphology of calcium oxalate trihydrate precipitated in a segmented flow tubular reactor. Journal of Materials Science Letters 19, 749–750.
Ehrich, H., Linke, D., Morgenschweis, K., Baerns, M., Jähnisch, K., 2002. Application of Microstructured Reactor Technology for the Photochemical Chlorination of Alkylaromatics. CHIMIA International Journal for Chemistry 56, 647–653.
Gebhart, B., 1971. Heat Transfer, 2nd ed. McGraw-Hill Book Company, New York.
Gong, T., Shen, J., Hu, Z., Marquez, M., Cheng, Z., 2007. Nucleation rate measurement of colloidal crystallization using microfluidic emulsion droplets. Langmuir 23, 2919–2923.
Gradl, J., Schwarzer, H.-C., Schwertfirm, F., Manhart, M., Peukert, W., 2006. Precipitation of nanoparticles in a T-mixer: Coupling the particle population dynamics with hydrodynamics through direct numerical simulation. Chemical Engineering and Processing: Process Intensification 45, 908–916.
Guo, Z., Zhang, M., Li, H., Wang, J., Kougoulos, E., 2005. Effect of ultrasound on anti-solvent crystallization process. Journal of Crystal Growth 273, 555–563.
Hacherl, J.M., Paul, E.L., Buettner, H.M., 2003. Investigation of Impinging-Jet Crystallization with a Calcium Oxalate Model System. AIChE Journal 49, 2352–2362.
Hao, Y., Teja, A.S., 2003. Continuous hydrothermal crystallization of a-Fe2O3 and Co3O4 nanoparticles. Journal of Materials Research 18, 415–422.
Hartman, R.L., Naber, J.R., Zaborenko, N., Buchwald, S.L., Jensen, K.F., 2010. Overcoming the challenges of solid bridging and constriction during Pd-catalyzed C-N bond formation in microreactors. Organic Process Research & Development 14, 1347–1357.
Hessel, V., Ehrfeld, W., Golbig, K., Haverkamp, V., Löwe, H., Storz, M., Wille, C., Guber, A.E., Jähnisch, K., Baerns, M., 2000. Gas/liquid microreactors for direct fluorination of aromatic compounds using elemental fluorine, in: Ehrfeld, Wolfgang (Ed.), Microreaction Technology: Industrial Prospects SE - 55. Springer Berlin Heidelberg, pp. 526–540.
Hessel, V., Hardt, S., Löwe, H., 2004. Chemical micro process engineering: fundamentals, modelling and reactions. Wiley-VCH, Weinheim.
110 References
Ho, C.-D., Chang, H., Chen, H.-J., Chang, C.-L., Li, H.-H., Chang, Y.-Y., 2011. CFD simulation of the two-phase flow for a falling film microreactor. International Journal of Heat and Mass Transfer 54, 3740–3748.
Jähnisch, K., Baerns, M., Hessel, V., Ehrfeld, W., Haverkamp, V., Löwe, H., Wille, C., Guber, A., 2000. Direct Fluorination of toluene using elemental fluorine in gas/liquid microreactors. Journal of Fluorine Chemistry 105, 117–128.
Jasch, K., Barth, N., Fehr, S., Bunjes, H., Augustin, W., Scholl, S., 2009. A Microfluidic Approach for a Continuous Crystallization of Drug Carrier Nanoparticles. Chemical Engineering & Technology 32, 1806–1814.
Jongen, N., Donnet, M., Bowen, P., Lemaître, J., Hofmann, H., Schenk, R., Hofmann, C., Aoun-Habbache, M., Guillemet-Fritsch, S., Sarrias, J., Rousset, a., Viviani, M., Buscaglia, M.T., Buscaglia, V., Nanni, P., Testino, a., Herguijuela, J.R., 2003. Development of a Continuous Segmented Flow Tubular Reactor and the “Scale-out” Concept – In Search of Perfect Powders. Chemical Engineering & Technology 26, 303–305.
Kane, A., Monnier, H., Tondeur, D., Falk, L., 2011. Capability of a falling film microstructured contactor for the separation of binary mixtures. Chemical Engineering Journal 167, 455–467.
Karnik, R., Gu, F., Basto, P., Cannizzaro, C., Dean, L., Kyei-Manu, W., Langer, R., Farokhzad, O.C., 2008. Microfluidic platform for controlled synthesis of polymeric nanoparticles. Nano Letters 8, 2906–2912.
Khan, S.A., Günther, A., Schmidt, M.A., Jensen, K.F., 2004. Microfluidic synthesis of colloidal silica. Langmuir 20, 8604–8611.
Khan, S.A., Jensen, K.F., 2007. Microfluidic Synthesis of Titania Shells on Colloidal Silica. Advanced Materials 19, 2556–2560.
Kim, J.-M., Chang, S.-M., Kim, K.-S., Chung, M.-K., Kim, W.-S., 2011. Acoustic influence on aggregation and agglomeration of crystals in reaction crystallization of cerium carbonate. Colloids and Surfaces A: Physicochemical and Engineering Aspects 375, 193–199.
Klemm, E., Albrecht, J., Oliveira, A.L. de, Markowz, G., Gross, S., Schuette, R., Ehrlich, J., Schirrmeister, S., Morstein, Olaf, V., 2006. Method for obtaining a gaseous phase from a liquid medium and device for carrying out the same. US Patent US20060060305 A1.

References 111
Klemm, E., Mathivanan, G., Schwarz, T., Schirrmeister, S., 2011. Evaporation of hydrogen peroxide with a microstructured falling film. Chemical Engineering and Processing: Process Intensification 50, 1010–1016.
Kockmann, N., Kastner, J., Woias, P., 2008. Reactive particle precipitation in liquid microchannel flow. Chemical Engineering Journal 135S, S110–S116.
Köhler, J.M., Abahmane, L., Wagner, J., Albert, J., Mayer, G., 2008. Preparation of metal nanoparticles with varied composition for catalytical applications in microreactors. Chemical Engineering Science 63, 5048–5055.
Kuhn, S., Noël, T., Gu, L., Heider, P.L., Jensen, K.F., 2011. A Teflon microreactor with integrated piezoelectric actuator to handle solid forming reactions. Lab on a Chip 11, 2488–2492.
Laval, P., Salmon, J.-B., Joanicot, M., 2007. A microfluidic device for investigating crystal nucleation kinetics. Journal of Crystal Growth 303, 622–628.
Lemaître, J., Jongen, N., Vacassy, R., Bowen, P., 2002. Production of powders. US Patent 6458335 B1.
Leng, J., Salmon, J.-B., 2009. Microfluidic crystallization. Lab on a Chip 9, 24–34.
Li, H., Wang, J., Bao, Y., Guo, Z., Zhang, M., 2003. Rapid sonocrystallization in the salting-out process. Journal of Crystal Growth 247, 192–198.
Luque de Castro, M.D., Priego-Capote, F., 2007. Ultrasound-assisted crystallization (sonocrystallization). Ultrasonics Sonochemistry 14, 717–724.
Mahajan, A.J., Kirwan, D.J., 1993. Rapid precipitation of biochemicals. Journal of Physics D: Applied Physics 26, B176–B180.
Mahajan, A.J., Kirwan, D.J., 1994. Nucleation and growth kinetics of biochemicals measured at high supersaturations. Journal of Crystal Growth 144, 281–290.
Male, P. van, Croon, M.H.J.M. de, Tiggelaar, R.M., Berg, A. van den, Schouten, J.C., 2004. Heat and mass transfer in a square microchannel with asymmetric heating. International Journal of Heat and Mass Transfer 47, 87–99.
Manish, M., Harshal, J., Anant, P., 2005. Melt sonocrystallization of ibuprofen: effect on crystal properties. European Journal of Pharmaceutical Sciences 25, 41–48.

112 References
Markowz, G., Schirrmeister, S., Albrecht, J., Becker, F., Schütte, R., Caspary, K.J., Klemm, E., 2005. Microstructured Reactors for Heterogeneously Catalyzed Gas-Phase Reactions on an Industrial Scale. Chemical Engineering & Technology 28, 459–464.
Marre, S., Park, J., Rempel, J., Guan, J., Bawendi, M.G., Jensen, K.F., 2008. Supercritical Continuous-Microflow Synthesis of Narrow Size Distribution Quantum Dots. Advanced Materials 20, 4830–4834.
McCausland, L.J., Cains, P.W., 2004. Power Ultrasound - a Means to Promote and Control Crystallization in Biotechnology. Biotechnology and Genetic Engineering Reviews 21, 3–10.
Mersmann, A., Eble, E., Heyer, C., 2001. Crystal Growth, in: Mersmann, A. (Ed.), Crystallization Technology Handbook. Marcel Dekker, Inc., New York, pp. 88–93.
Midler, M.J., Paul, E.L., Whittington, E.F., Liu, P.D., Hsu, J., Pan, S.-H., 1994. Crystallization method to improve crystal structure and size. US Patent 5314506 A.
Monnier, H., Falk, L., 2011. Intensification of G/L absorption in microstructured falling film. Application to the treatment of chlorinated VOC’s - part II: Modeling and geometric optimization. Chemical Engineering Science 66, 2475–2490.
Müller, A., Cominos, V., Hessel, V., Horn, B., Schürer, J., Ziogas, A., Jähnisch, K., Hillmann, V., Groser, V., Jam, K., Bazzanella, A., Rinke, G., Kraut, M., 2005. Fluidic bus system for chemical process engineering in the laboratory and for small-scale production. Chemical Engineering Journal 107, 205–214.
Nalajala, V.S., Moholkar, V.S., 2011. Investigations in the physical mechanism of sonocrystallization. Ultrasonics Sonochemistry 18, 345–355.
Nickel, U., Unverdorben, L., Weber, J., Dietz, E., Patzlaff, J., 2001. Verfahren zur Herstellung von Diketopyrrolopyrrol-Pigmenten. EP 1161240 A2.
Noël, T., Naber, J.R., Hartman, R.L., McMullen, J.P., Jensen, K.F., Buchwald, S.L., 2011. Palladium-catalyzed amination reactions in flow: overcoming the challenges of clogging via acoustic irradiation. Chemical Science 2, 287–290.
O’Reilly, D.E., Peterson, E.M., 1972. Self-Diffusion Coefficients and Rotational Correlation Times in Polar Liquids. III. Toluene. The Journal of Chemical Physics 56, 2262–2266.

References 113
Pennemann, H., Forster, S., Kinkel, J., Hessel, V., Löwe, H., Wu, L., 2005. Improvement of Dye Properties of the Azo Pigment Yellow 12 Using a Micromixer-Based Process. Organic Process Research & Development 9, 188–192.
Pennemann, H., Hessel, V., Löwe, H., 2004. Chemical microprocess technology—from laboratory-scale to production. Chemical Engineering Science 59, 4789–4794.
Poling, B.E., Prausnitz, J.M., O’Connel, J.P., 2004. The Properties of Gases and Liquids, 5th ed. McGraw-Hill, New York.
Ramprasad, S., Palmer, J.D., 2007. A Silicon Microseparator based Pervaporation Process for Separation of Ethanol/Water Mixtures using a Polymer Membrane. Separation Science and Technology 42, 2483–2499.
Roberge, D.M., Ducry, L., Bieler, N., Cretton, P., Zimmermann, B., 2005. Microreactor Technology: A Revolution for the Fine Chemical and Pharmaceutical Industries? Chemical Engineering & Technology 28, 318–323.
Ruecroft, G., Hipkiss, D., Ly, T., Maxted, N., Cains, P.W., 2005. Sonocrystallization: The Use of Ultrasound for Improved Industrial Crystallization. Organic Process Research & Development 9, 923–932.
Sahoo, H.R., Kralj, J.G., Jensen, K.F., 2007. Multistep continuous-flow microchemical synthesis involving multiple reactions and separations. Angewandte Chemie International Edition 46, 5704–5708.
Schwarzer, H.-C., Peukert, W., 2002. Experimental Investigation into the Influence of Mixing on Nanoparticle Precipitation. Chemical Engineering & Technology 25, 657–661.
Seok, D.R., Hwang, S.-T., 1985. Zero-gravity distillation utilizing the heat pipe principle(micro-distillation). AIChE Journal 31, 2059–2065.
Serra, C.A., Chang, Z., 2008. Microfluidic-Assisted Synthesis of Polymer Particles. Chemical Engineering & Technology 31, 1099–1115.
Shestopalov, I., Tice, J.D., Ismagilov, R.F., 2004. Multi-step synthesis of nanoparticles performed on millisecond time scale in a microfluidic droplet-based system. Lab on a Chip 4, 316–321.
114 References
Shirure, V.S., Pore, A.S., Pangarkar, V.G., 2005. Intensification of Precipitation Using Narrow Channel Reactors: Magnesium Hydroxide Precipitation. Industrial & Engineering Chemistry Research 44, 5500–5507.
Song, H., Tice, J.D., Ismagilov, R.F., 2003. A microfluidic system for controlling reaction networks in time. Angewandte Chemie International Edition 42, 768–772.
Ståhl, M., Åslund, Bengt, L., Rasmuson, Å.C., 2001. Reaction Crystallization Kinetics of Benzoic Acid. AIChE Journal 47, 1544–1560.
Su, Y.-F., Kim, H., Kovenklioglu, S., Lee, W.Y., 2007. Continuous nanoparticle production by microfluidic-based emulsion, mixing and crystallization. Journal of Solid State Chemistry 180, 2625–2629.
Sue, K., Kimura, K., Arai, K., 2004. Hydrothermal synthesis of ZnO nanocrystals using microreactor. Materials Letters 58, 3229–3231.
Sultana, M., 2010. Microfluidic Systems for Continuous Crystallization of Small Organic Molecules. PhD Thesis. Massachusetts Institute of Technology, Cambridge.
Sundberg, A., Uusi-Kyyny, P., Alopaeus, V., 2009. Novel micro-distillation column for process development. Chemical Engineering Research and Design 87, 705–710.
Timmer, B.H., van Delft, K.M., Olthuis, W., Bergveld, P., van den Berg, A., 2003. Micro-evaporation electrolyte concentrator. Sensors and Actuators B 91, 342–346.
Toldy, A.I., Badruddoza, A.Z.M., Zheng, L., Hatton, T.A., Gunawan, R., Rajagopalan, R., Khan, S.A., 2012. Spherical Crystallization of Glycine from Monodisperse Microfluidic Emulsions. Crystal Growth & Design 12, 3977–3982.
Tourvieille, J.-N., Bornette, F., Philippe, R., Vandenberghe, Q., Bellefon, C. de, 2013. Mass transfer characterisation of a microstructured falling film at pilot scale. Chemical Engineering Journal 227, 182–190.
Trippa, G., Jachuck, R.J.J., 2003. Precipitation of Calcium Carbonate Using Narrow Channel Reactors. Chemical Engineering Research and Design 81, 766–772.
Tung, H.-H., 2013. Industrial Perspectives of Pharmaceutical Crystallization. Organic Process Research & Development 17, 445–454.
Utada, A.S., Lorenceau, E., Link, D.R., Kaplan, P.D., Stone, H.A., Weitz, D.A., 2005. Monodisperse double emulsions generated from a microcapillary device. Science 308, 537–541.
References 115
Vacassy, R., Lemaître, J., Hofmann, H., Gerlings, J.H., 2000. Calcium Carbonate Precipitation Using New Segmented Flow Tubular Reactor. AIChE Journal 46, 1241–1252.
Wagner, J., Kirner, T., Mayer, G., Albert, J., Köhler, J.M., 2004. Generation of metal nanoparticles in a microchannel reactor. Chemical Engineering Journal 101, 251–260.
Wagner, J., Köhler, J.M., 2005. Continuous synthesis of gold nanoparticles in a microreactor. Nano Letters 5, 685–691.
Wagterveld, R.M., Boels, L., Mayer, M.J., Witkamp, G.J., 2011. Visualization of acoustic cavitation effects on suspended calcite crystals. Ultrasonics sonochemistry 18, 216–225.
Watts, P., Haswell, S.J., 2005. The Application of Microreactors for Small Scale Organic Synthesis. Chemical Engineering & Technology 28, 290–301.
Wille, C., 2002. Entwicklung und Charakterisierung eines Mikrofallfilm-Reaktors für stofftransportlimitierte hochexotherme Gas/Flüssig-Reaktionen. University Clausthal-Zellerfeld.
Wille, C., Gabski, H.-P., Haller, T., Kim, H., Unverdorben, L., Winter, R., 2004. Synthesis of pigments in a three-stage microreactor pilot plant—an experimental technical report. Chemical Engineering Journal 101, 179–185.
Wootton, R.C.R., DeMello, A.J., 2004. Continuous laminar evaporation: micron-scale distillation. Chemical Communications 266–267.
Yashina, A., Meldrum, F., de Mello, A., 2012. Calcium carbonate polymorph control using droplet-based microfluidics. Biomicrofluidics 6, 22001–2200110.
Yen, B.K.H., Günther, A., Schmidt, M.A., Jensen, K.F., Bawendi, M.G., 2005. A Microfabricated Gas-Liquid Segmented Flow Reactor for High-Temperature Synthesis: The Case of CdSe Quantum Dots. Angewandte Chemie 117, 5583–5587.
Yeong, K.K., Gavriilidis, A., Zapf, R., Hessel, V., 2003. Catalyst preparation and deactivation issues for nitrobenzene hydrogenation in a microstructured falling film reactor. Catalysis Today 81, 641–651.
Yeong, K.K., Gavriilidis, A., Zapf, R., Kost, H.-J., Hessel, V., Boyde, A., 2006. Characterisation of liquid film in a microstructured falling film reactor using laser scanning confocal microscopy. Experimental Thermal and Fluid Science 30, 463–472.

116 References
Zanfir, M., Gavriilidis, a., Wille, C., Hessel, V., 2005. Carbon Dioxide Absorption in a Falling Film Microstructured Reactor: Experiments and Modeling. Industrial & Engineering Chemistry Research 44, 1742–1751.
Zanfir, M., Sun, X., Gavriilidis, a., 2008. Microstructured Mesh Contactor for Asymmetric Transfer Hydrogenation with Simultaneous Stripping: Modeling and Experiments. Industrial & Engineering Chemistry Research 47, 8995–9005.
Zhang, H., Chen, G., Yue, J., Yuan, Q., 2009. Hydrodynamics and Mass Transfer of Gas – Liquid Flow in a Falling Film Microreactor. AIChE Journal 55, 1110–1120.
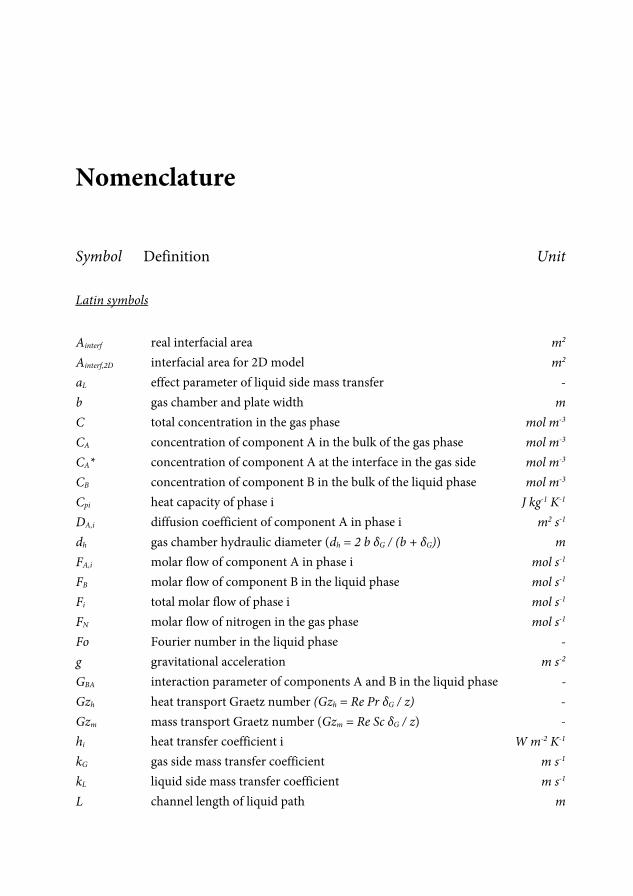
Nomenclature
Symbol Definition Unit Latin symbols Ainterf real interfacial area m2
Ainterf,2D interfacial area for 2D model m2
aL effect parameter of liquid side mass transfer -b gas chamber and plate width mC total concentration in the gas phase mol m-3
CA concentration of component A in the bulk of the gas phase mol m-3
CA* concentration of component A at the interface in the gas side mol m-3
CB concentration of component B in the bulk of the liquid phase mol m-3
Cpi heat capacity of phase i J kg-1 K-1 DA,i diffusion coefficient of component A in phase i m2 s-1
dh gas chamber hydraulic diameter (dh = 2 b δG / (b + δG)) mFA,i molar flow of component A in phase i mol s-1
FB molar flow of component B in the liquid phase mol s-1
Fi total molar flow of phase i mol s-1
FN molar flow of nitrogen in the gas phase mol s-1
Fo Fourier number in the liquid phase -g gravitational acceleration m s-2
GBA interaction parameter of components A and B in the liquid phase -Gzh heat transport Graetz number (Gzh = Re Pr δG / z) - Gzm mass transport Graetz number (Gzm = Re Sc δG / z) -hi heat transfer coefficient i W m-2 K-1 kG gas side mass transfer coefficient m s-1
kL liquid side mass transfer coefficient m s-1
L channel length of liquid path m

118 Nomenclature
L’ apparent channel length of liquid path for 2D model mLG channel length of gas path mmi mass flow rate of phase i kg s-1 Mw average molar volume of the liquid phase kg mol-1
Mw,i molar volume of component i kg mol-1
n number of channels -n normal vector to the interface -NA,i interface molar flux of component A on the side of phase i mol m-2 s-1
Nui Nusselt number of phase i Nu P operating pressure PaPri Prandtl number of phase i (Pr = μi Cpi / λi) - PvA vapour pressure of component A PaQi volumetric flow rate of phase i m3 s-1
qi total heat flux of phase i or local heat flux i W R ideal gas constant m3 Pa K-1 mol-1
Rei Reynolds number of phase i (e.g. ReG = ρG u dh / μG) -Sc Schmidt number of the gas phase (Sc = μG / (ρG DA,G) ) -Sh Sherwood number of the gas phase -T operating temperature (assuming isothermal conditions) KTi temperature of phase i K Tinterface gas-liquid interface temperature (Tinterface = maximum(TL,TG)) K u velocity m s-1
Vm molar volume of the liquid phase m3 mol-1
w channel width mxA molar fraction of component A in the bulk of the liquid phase -xA* molar fraction of component A at the interface in the liquid side -yA molar fraction of component A in the bulk of the gas phase -yA* molar fraction of component A at the interface in the gas side -z coordinate presenting the axial axis m
Greek symbols δG gas chamber height mδhf channel height on heat exchanger side mΔHvap standard heat of vaporization of isopropyl-alcohol W mol-1
δL liquid film thickness m
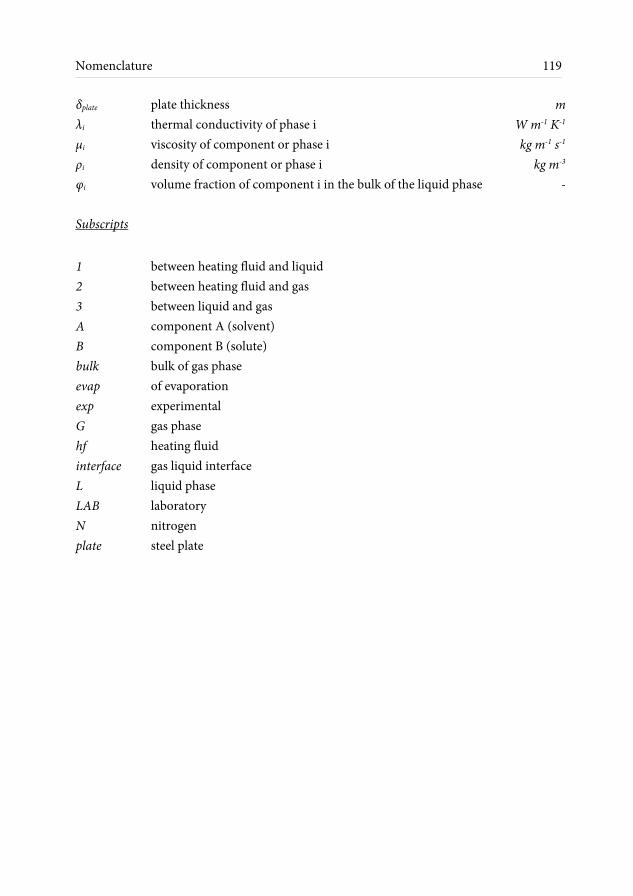
Nomenclature 119
δplate plate thickness mλi thermal conductivity of phase i W m-1 K-1
μi viscosity of component or phase i kg m-1 s-1
ρi density of component or phase i kg m-3
φi volume fraction of component i in the bulk of the liquid phase - Subscripts 1 between heating fluid and liquid 2 between heating fluid and gas 3 between liquid and gas A component A (solvent) B component B (solute) bulk bulk of gas phase evap of evaporation exp experimental G gas phase hf heating fluid interface gas liquid interface L liquid phase LAB laboratory N nitrogen plate steel plate

List of Publications
Journal Publications Moschou, P., Croon, M.H.J.M. de, Schaaf, J. van der, Schouten, J.C., 2014. Advances in
continuous crystallization: towards microfluidic systems. Reviews in Chemical Engineering. submitted.
Moschou, P., Croon, M.H.J.M. de, Schaaf, J. van der, Schouten, J.C., 2013. Ultrasonication enabled continuous crystallization in a milli capillary. Chemical Engineering & Technology. submitted.
Moschou, P., Croon, M.H.J.M. de, Schaaf, J. van der, Schouten, J.C., 2013. Liquid flow rate effects during partial evaporation in a falling film micro contactor. Chemical Engineering & Processing: Process Intensification 69, 95-103.
Moschou, P., Croon, M.H.J.M. de, Schaaf, J. van der, Schouten, J.C., 2012. Nitrogen stripping of isopropyl-alcohol and toluene in a falling film micro reactor: Gas side mass transfer experiments and modelling at isothermal conditions. Chemical Engineering Science 76, 216-223.
Oral Presentations Moschou, P., Croon, M.H.J.M. de, Schaaf, J. van der, Schouten, J.C., 2013. Concentration of
a toluene/benzoic acid stream through evaporation in a falling film micro contactor. Proceedings of the 9th European Congress of Chemical Engineering (ECCE 2013), The Hague, The Netherlands.
Moschou, P., Croon, M.H.J.M. de, Schaaf, J. van der, Schouten, J.C., 2012. Toluene evaporation in a falling film micro contactor with counter-current nitrogen flow.

122 List of Publications
Proceedings of the 20th International Congress of Chemical and Process Engineering (CHISA 2012), Prague, Czech Republic.
Moschou, P., Croon, M.H.J.M. de, Schaaf, J. van der, Schouten, J.C., 2011. Mass transfer measurements and modelling for solvent evaporation in a falling film micro contactor. Proceedings of the 8th European Congress of Chemical Engineering (ECCE 2011), Berlin, Germany.
Poster Presentations Moschou, P., Croon, M.H.J.M. de, Schaaf, J. van der, Schouten, J.C., 2013. Continuous
Separation methods in micro Structured Systems: Falling Film Evaporation and Crystallization. Proceedings of the 9th World Congress of Chemical Engineering (WCCE9), Seoul, North Korea.
Moschou, P., Croon, M.H.J.M. de, Schaaf, J. van der, Schouten, J.C., 2012. Nitrogen enhanced solvent evaporation in a falling film micro contactor. Proceedings of the 22nd International Symposium on Chemical Reaction and Engineering (ISCRE 22), Maastricht, The Netherlands.
Moschou, P., Croon, M.H.J.M. de, Schaaf, J. van der, Schouten, J.C., 2012. Mass transfer measurements and modelling for solvent evaporation in a falling film micro contactor. Proceedings of the 12th International Conference on Microreaction Technology (IMRET12), Lyon, France.
Moschou, P., Croon, M.H.J.M. de, Schaaf, J. van der, Schouten, J.C., 2011. Nitrogen stripping of toluene in a falling film micro contactor. Netherlands Process Technology Meeting (NPS-11), Arnhem, The Netherlands.
Moschou, P., Croon, M.H.J.M. de, Schaaf, J. van der, Schouten, J.C., 2010. Micro-evaporation in a falling film contactor. Netherlands Process Technology Symposium (NPS-10), Veldhoven, The Netherlands.
Acknowledgments
It has been four years and a few months since I started my work in TU/e and it is finally time to give thanks to all the people that helped me be where I am today.
I would first like to thank my promoter, Prof. Jaap Schouten, for giving me the opportunity to join the SCR group and contribute with my work as a PhD researcher. Dear Jaap, thank you for the trust and encouragement throughout the years. I quickly realized your high standards for all types of scientific publications, and followed them ever since. You always gave valuable feedback during our progress meetings and had a way of motivating me to always do better. Thank you for everything!
To my daily supervisor, Dr. Mart de Croon, it was a great pleasure to be your student. I can always count on you for checking my punctuation… and double-checking my calculations! Thank you for always keeping your office door open. Our discussions would always help me go one step closer to solving my problem. And would usually come with a bonus talk about your many interesting trips!
John van der Schaaf, my second supervisor, thank you for being as critical as you are!
You were constantly the one asking questions and pushing me to find the answers. And you were always there to help me find them. Many thanks for all your help and support.
I would like to sincerely thank all the members of the doctorate committee for their
valuable contribution in the final step of my research work, my PhD thesis defence. To Prof. Volker Hessel I would like to express my special gratitude for bringing me into contact with Institut für Mikrotechnik Mainz GmbH at the early stage of my research. Thank you also for all our discussions throughout the years and for sharing a bit of your experience of the scientific world with me.

124 Acknowledgments
This work would not have happened without the greatly appreciated funding from NWO, and without the special contribution from Fraunhofer ICT-IMM, formerly known as Institut für Mikrotechnik Mainz GmbH. For providing the falling film micro reactor and all the technical support special thanks to Dr. Patrick Löb. Thank you for all your help and the confidence you showed in my project. To Christian Hoffman, thank you for answering all my questions! I could not have done it without your technical advice. Finally to Ulrich Krtschil, thank you for the discussion we had in Mainz and for sharing your interesting ideas.
Denise, I cannot imagine SCR without you! You have the answer to every question
(almost!) and you have helped me from day one. Thank you. To the great technicians of SCR thank you for making our experiments work! Special
thanks to Erik for all the help. I have bothered you too many times in the workshop and you always knew how to help me even when I didn’t. To Carlo, Peter and Marlies, thank you for being there whenever I needed you in the lab.
To my lovely officemates, Fernanda and Bruno, I can only say I miss you already!! We
spent four years together sharing our thoughts and fears on the PhD life… and many more. We were lucky to start in a similar time… but many people have come and went during these four years. And many great friendships which I will carry with me forever. You know who you are ;) Thank you SCR people for all the coffee breaks, the drinks, the dinners and for four years full of memories. I am sorry I stopped making cakes… but you have this thesis to blame for it!
My international Eindhoven friends, thank you for making me love this place! And to
my Greek friends… ♥ I just really really love you! Anna, you left Eindhoven too soon! Sofia, Pano, Andrea and Giorgo you are my new family here. Είμαστε συγκάτοικοι στην τρέλα και όχι μόνο!
To my friends in Greece, I miss you always! Charoulita, Katerinaki(!) and Sofaki, thank
you for sticking around. You are in my heart and mind no matter where I am. I promise to come by more often!

Acknowledgments 125
My greatest thanks to my family for loving and supporting me no matter what. Μητερούλα και πατερούλη σας αγαπώ πολύ πολύ και σας ευχαριστώ που με κάνατε επιστήμονα! To my parents, my grandparents, my sisters and my little crazy brother, all my love and thanks for being there for me.
And finally to Dr. Nikolas, my Nikos, thank you for being in my life even when you are not. I owe it all to you, my initial and constant motivation.
Parthena (Nopi) Moschou, Eindhoven, 17-01-2014.


About the author
Parthena (Nopi) Moschou was born on the 6th of November, 1986, in Katerini, Greece. She entered the Chemical Engineering Department of the Aristotle University of Thessaloniki, Greece, in September 2004, with the highest overall mark in the Pan-Hellenic exams of 2004 among all successful applicants. She graduated in 2009, after being awarded a scholarship of excellence from the State Scholarships Foundation. In September 2009 she started her PhD project in the Chemical Reactor Engineering group, at Eindhoven University of Technology, The Netherlands, under the supervision of prof.dr.ir. J.C. Schouten. Her research was focused on the investigation of micro structured devices for continuous separation in pharmaceuticals and fine chemicals industry, and resulted in this thesis, entitled “Evaporation and Crystallization in Micro Flow Systems”.


![[Eastern Lightning] Micro Film "Faithful Till Death"](https://static.fdocuments.us/doc/165x107/55d22932bb61eba61e8b463d/eastern-lightning-micro-film-faithful-till-death.jpg)
![[Eastern Lightning] Micro Film "The Never-quenching Life Power"](https://static.fdocuments.us/doc/165x107/55d311e7bb61ebc6308b47af/eastern-lightning-micro-film-the-never-quenching-life-power.jpg)