EVANS, PITTS, and KRAUS
51
EVANS, PITTS, and z N65-23799 KRAUS ~
Transcript of EVANS, PITTS, and KRAUS
EVANS, PITTS, and
z N 6 5 - 2 3 7 9 9
KRAUS ~
. NASA SP-3016
I By Dallas E. Evans, David E. Pitts, and Gary L. Kraus, Manned Spacecraft Center, Houston, Texas
Scientif; ad Technrcal Information Divzrron 1 9 6 5 NATIONAL AERONAUTICS AND SPACE ADMINISTRATION
Washington, D.C.
Contents
1.0 l3rn0DlJCrION . . . . . . . . . . . . . . . . . . . . . 1
1.1 Purpose . . . . . . . . . . . . . . . . . . . . 1
1.2 Scope . . . . . . . . . . . . . . . . . . . . . 1
2.0 1 ” E X P ~ A R Y S P A c E . . . . . . . . . . . . . . . . . 2
2.1 Xeteoroid Znvirormnt . . . . . . . . . . . . . 2
2.2 Radiation Environment . . . . . . . . . . . . . 3
2.3 G a s Propert ies . . . . . . . . . . . . . . . . 6
2.4 Magnetic f i e l d s . . . . . . . . . . . . . . . . 7
2.6 Solar Radio Noise . . . . . . . . . . . . . . . 10
3.0 NEAR-VENUSSPACE . . . . . . . . . . . . . . . . . . . 11
3.1 Meteoroid Enviroment . . . . . . . . . . . . . 11
3.2 Radiation Environment . . . . . . . . . . . . . 11
3.3 GasProperties . . . . . . . . . . . . . . . . 11
3.4 Magnetic Field . . . . . . . . . . . . . . . . 12
3.5 Radiation Propert ies of the Sun and Venus . . . 12
3.5 S 3 h r Radi3 TIqise . . . . . . . . . . . . . . . 14
2.5 Radiation Propert ies of the Sun (Thermal) . . . 7
4.0 VENUS ATMOSPRZRE PLXD SJRFACE CONDITIORS . . . . . . . . 15
4.1
4.2
4 . J 4.4
4.5 . 6
4.7 4 . 8
Atmospheric Molecular Weight and
Model Atmosphere Structure . . . . . . . . Atmospheric Winds f o r Venus . . . . . . . . Wind Shear . . . . . . . . . . . . . . . . . Clouds i n the Atmosphere . . . . . . . . . M i crane t e oroid Environment . . . . . . . . Magnetic Field of Venus . . . . . . . . . .
Composition . . . . . . . . . . . . . . .
Atmospheric Circulat ion . . . . . . . . . .
. 15
. 15
. 21
* 21
. 21
. 21
. 22
. 22
... 1 1 1
VENUS AND MARS NOMINAL NATURAL ENVIRONMENl
4.9 Ionosphere . . . . . . . . . . . . . . . . . . 4.10 Albedo . . . . . . . . . . . . . . . . . . . . . 4 . 1 1 Surface Features. Terrain. and Composition of
t h e Surface . . . . . . . . . . . . . . . . . 4.12 Planetary S a t e l l i t e s . . . . . . . . . . . . 4.13 Surface Temperatures . . . . . . . . . . . . . 4.14 Construction Parameters for the Model
Atmospheres . . . . . . . . . . . . . . . . . 5.0 NEAR-MARS SPACE . . . . . . . . . . . . . . . . . . . .
5.1 Meteoroid Environment . . . . . . . . . . . . . 5 .2 Radiation Environment . . . . . . . . . . . . . 5.3 Gas Propert ies . . . . . . . . . . . . . . . . 5.4 Magnetic Field . . . . . . . . . . . . . . . . 5.5 Radiation Propert ies of t h e Sun and Mars . . . . 5.6 Solar Radio Noise . . . . . . . . . . . . . . .
6.0 MARS ATMOSPHERE AND SURFACE CONDITIONS . . . . . . . .
Page
22
22
22
23
23
23
25
25
25
25
26 26
28
29
6.1
6.2
6.3 6 . k 6 .5 6.6 6.7 6.8 6.9 6.10
6.11
6.12
Atmospheric Molecular Weight and Composition . . . . . . . . . . . . . . . . .
Model Atmosphere Structure . . . . . . . . . . Atmospheric Winds for Mars . . . . . . . . . . Wind Shear . . . . . . . . . . . . . . . . . . Clouds i n the Atmosphere . . . . . . . . . . . Micrometeoroid Environment . . . . . . . . . . Magnetic Field . . . . . . . . . . . . . . . . Atmospheric Circulat ion . . . . . . . . . . . . Ionosphere . . . . . . . . . . . . . . . . . . Albedo . . . . . . . . . . . . . . . . . . . . Surface Features. Terrain. and Composition of
t h e Surface . . . . . . . . . . . . . . . . . Surface Temperatures . . . . . . . . . . . . .
29
30
35
37
37
38
39
39
39
39
39
41
i v
CONTENTS
6.13 Construction Parameters far the Model Atmospheres . . . . . . . . . . . . . . . .
6.14 Planetary Satellites . . . . . . . . . . . . 7.0 REFERENCES . . . . . . . . . . . . . . . . . . . . .
V
42
42
44
1.0 introduction
1.1 Purpose
The purpose of t h i s document i s t o es tab l i sh numerical values for a nominal natural environment for application i n s tud ies f o r advanced manned planetary m i s s i o n s t o Venus and Mars.
Compilation of the data i n this document is t o prwide a standard environment so tha t various mission and preliminary design s tudies w i l l a l l be based on r e a l i s t i c da ta and have a c m o n basis f o r cmparison of end results.
1.2 scope
It i s not an t ic ipa ted that real hardware design would be based on t h i s nominal enviroment, bu t with periodic re-rision as nex data IECOEK? available, t h i s document would be su f f i c i en t ly accurate and up-to-date t o serve as a hardware design emrironment when the need becames a p p r e n t .
It m u s t be rea l ized that la rge uncer ta in t ies e x i s t i n many o f t h e environmental parameters , but i n those cases, where possible , "present best estimate" plus extreme lower and upper l i m i t values are presented.
The da ta for the n a t u r a l environment have been broken i n t o several
Appropriate references are given sections t o account for a wide va r i e ty of environmental Wctors which m y be needed for study requirements. for the various ' l i t e r a t u r e sources fYw 'which the information was ob- tained. I n those cases where references are not given, the data were generated a t t h e Manned Spwecraf t Center.
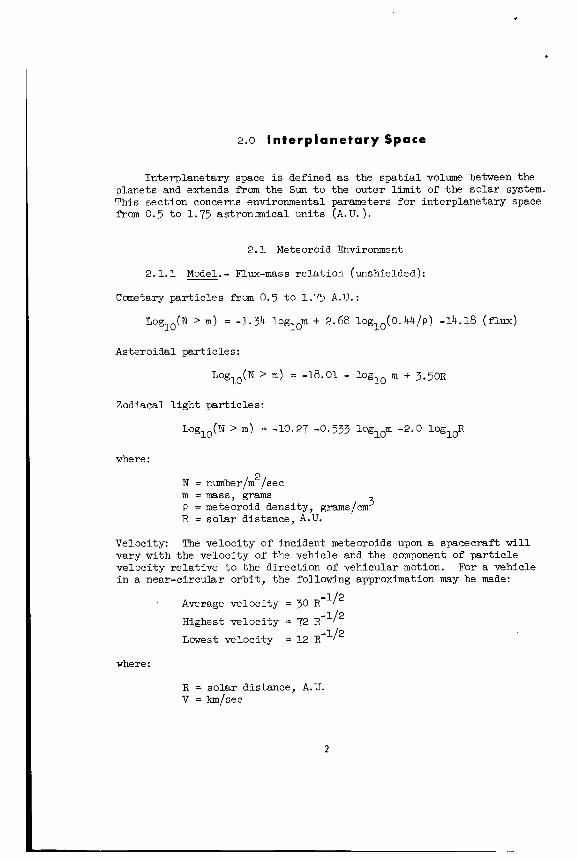
2.0 Interplanetary Space
Interplanetary space i s defined as the s p a t i a l volume between the planets and extends from the Sun t o the outer l i m i t of the so la r system. This sect ion concerns environmental parameters f o r interplanetary space f r o m 0.5 t o 1.75 astronomical un i t s ( A . U . ) .
2 . 1 Meteoroid Environment
2.1.1 m. - Flux-mass r e l a t i o n (unshielded):
Cometary p a r t i c l e s from 0.5 t o 1.75 A.U.:
10 Log ( N > m ) = -1.34 logl$ + 2.68 loglO(O. 44/p) -14.18 ( f lux)
Asteroidal par t ic les :
Zodiacal l i g h t par t ic les :
Log ( N > m ) = -10.27 -0.533 loglorn -2.0 logloR 10
where : n
N = nm%r/mc/sec
3 m = mass, grams P =meteoroid density, grams/m R = s o l a r distance, A.U.
Velocity: The ve loc i ty of incident meteoroids upon a spacecraft will vary with the veloci ty of the vehicle and the component of p a r t i c l e ve loc i ty r e l a t i v e t o the direct ion of vehicular motion. i n a near-circular orb i t , the following approximation may be made:
For a vehicle
-112
-112 Average veloci ty = 30 R
Highest ve loc i ty = 72 R
Lowest veloci ty = 12
where:
R = s o l a r distance, A.U. v = km/sec
2
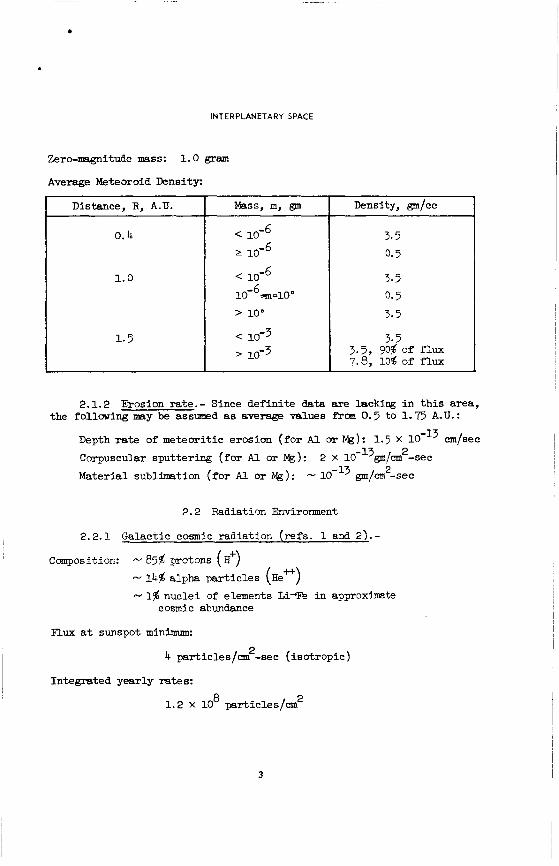
INTERPLANETARY SPACE
Zero-msgnitude mss: 1.0 gram
Average Meteoroid Density:
Distance, R, A.U.
0.4
1.0
1.5
Density, gm/cc + I 0.5
3.5 0.5 3.5
I 3.5
7.8, lo$ of f l u x 5.5, 9% of flux
2.1.2 Erosion rate.- Since de f in i t e d a t a are lacking i n t h i s area,
Depth rate of meteor i t ic erosion ( f o r Al or Mg): 1.5 X lo''' cm/sec
~orpusculsr sput te r ing (for ~l or a): Material sublimation (for Al o r Ng):
the following may be assumed as average values frcm 0.5 to 1.73 A.U.:
2 x 10-''gm/m~-sec 2 - ldU gm/m -sec
2.2 Radiation Environment
2.2.1 Galactic cosmic rad ia t ion (refs. 1 and 21.-
Composition: - 85% protons (H") - 14% alpha pa r t i c l e s (HeH) - 1s nucle i of elements Li-B i n approximte cosmic abundance
Flux a t sunspot minimum:
4 particles/cm2-sec ( i so t ropic)
In tegra ted year ly rates:
8 2 1 .2 x 10 p r t i c l e s / m
3
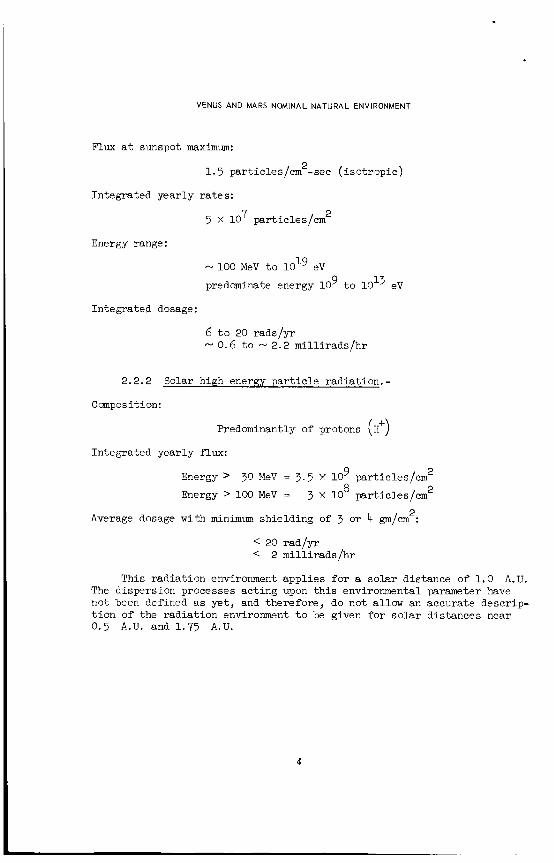
VENUS AND MARS NOMINAL NATURAL ENVIRONMENT
Flux a t sunspot maximum:
1.5 particles/cm2-sec ( i so t ropic)
Integrated year ly ra tes:
7 2 5 x 10 particles/cm
Energy range:
- 100 MeV t o 1019 e V
predominate energy 109 t o 10~3 eV
Integrated dosage:
6 t o 20 rads/yr - 0.6 t o - 2.2 mi l l i rads /hr
2.2.2 Solar high energy p a r t i c l e radiat ion.-
Composition:
fiedominantly of protons (H+)
%ergy > 30 MeTr = 3 . 3 x 10 9 particles/cm2
Integrated year ly flux:
8 2 Energy > 100 MeV = 3 x 10 particles/cm
Average dosage w i t h minimum shielding of 5 o r 4 gm/cm2:
20 rad/yr < 2 mil l i rads/hr
This rad ia t ion environment appl ies fo r a s o l a r dis tance o f 1.0 A.U. The dispersion processes ac t ing upon t h i s environmental parameter have not been defined as yet , and therefore , do not allow an accurate descrip- t i o n of the rad ia t ion environment t o be given f o r s o l a r dis tances near 0.5 A.U. and 1.75 A.U.
4
INTERPLANETARY SPACE
1
E’robability, p Mission
I I 1 length, 0.50 0.10 0.01 0.001
2 - 5.0 x 10⁷ 2.0 x 10⁹ 1.7 10 4 - 2.0 x lo8 4.5 x 10⁹ 3.3 x 10
12 4.5 x 10⁷ 1.3 x 10⁹ 1.5 x 0.0 lolo 20 1.5 x lo8 2.4 x 10⁹ 2.2 10 1.1 x 10
50 7.0 x lo8 5.9 x 10⁹ 3.5 x 101~ 1.6 1011
1.0 109 6.2 x 10⁹ 3.7 lolo 1.6
weeks 2 N, protons/cm
10
10
1.3 X lo7 7.2 X lo8 9.0 x lo9 5.6 x lo1’
11
8
30 3.0 X lo8 3.9 X lo9 3.0 X 10” 1.4 X
40 5.0 X lo8 5.0 X lo9 3.3 X lo1’ 1.5 X 10 11
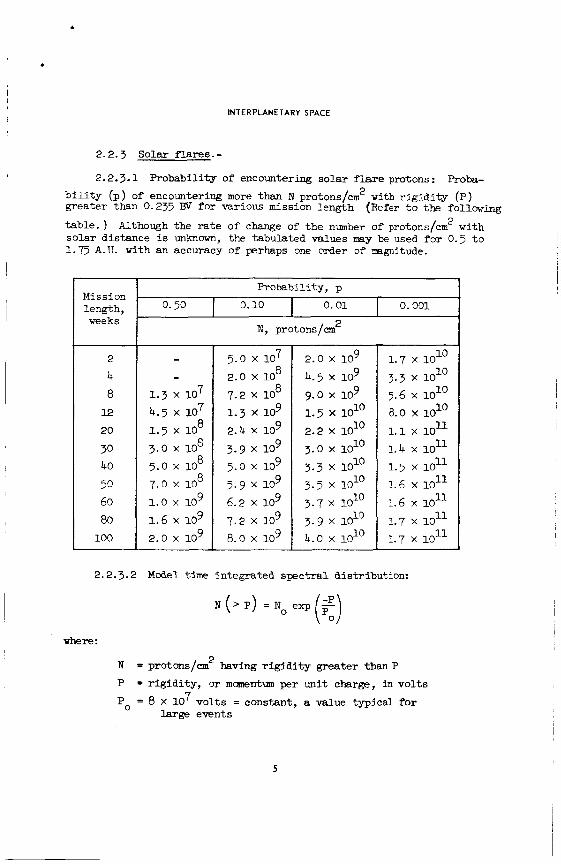
2.2.3 solar flares.-
I
1 I I
I
I
I
2.2.3.1 Probabi l i ty of encountering so la r flare protons: Proba- b i l i t y (p) of encountering more than N protons/cm2 with r i g i d i t y (P) grea te r than 0.235 BV for various mission length
solar distance i s unknown, the tabulated values my be used for 0.5 t o 1.75 A.U. with an accuracy of perhaps one order of mgnitude.
(Refer t o the following t a b l e . ) Although the rate of change of the number of protons/cm 2 w i t h
2.2.3.2 Model time integrated spec t r a l distribution:
(z) N ( > P ) = ~ ~ e x p
2 N = protcms/cm having r i g i d i t y greater than P
P = r i g i d i t y , or momentum per un i t charge, i n v o l t s Po = 8 x 10 7 v o l t s = constant, a value typical f o r
large events
5
VENUS AND MARS NOMINAL NATURAL ENVIRONMENT
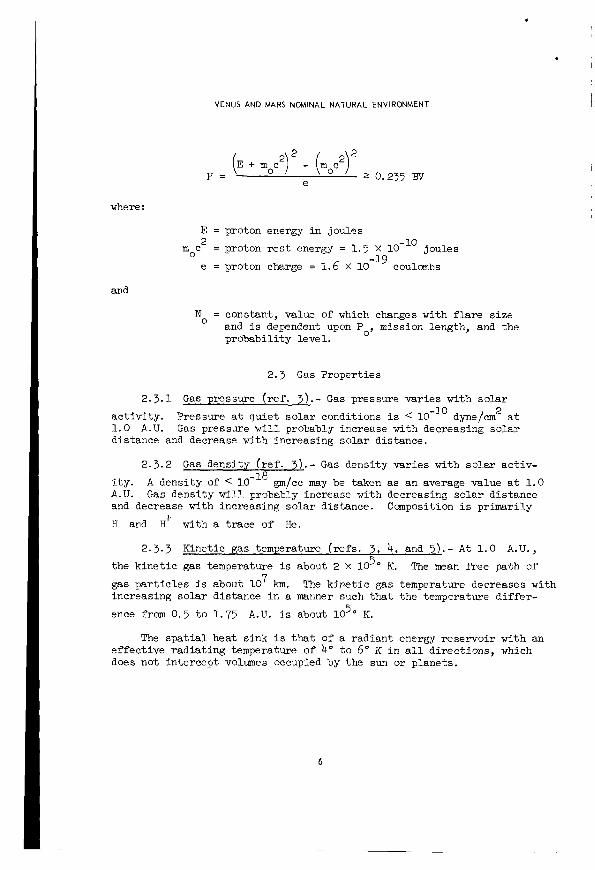
(E + moc2)2 - jm3c2)2 P = 2 0.235 BV e
where:
E = proton energy i n joules
moc2 = proton r e s t energy = 1.3 x IO-'' joules
e = proton charge = 1.6 X coulombs
and
N = constant, value of which changes with f l a r e s ize and i s dependent upon P mission length, and the
0' pro5abilit.y leve l .
2.3 G a s Properties
2 .3 .1 Gas pressure ( r e f . 3).- Gas pressure var ies with so la r
ac t iv i ty . Pressure a t quie t so l a r conditions i s < 10-l' dyne/cm2 a t 1.0 A.U. Gas pressure w i l l probably increase with decreasing so la r distance and decrease with increasing so lar distance.
2.3.2 G a s density ( r e f . 3 ) . - Gas density var ies with so l a r ac t iv-
G a s density w i l l probably increase with decreasing solar distance i t y . A density of < A.U. and decrease with increasing so la r distance.
H and H with a t race of He.
gm/cc may be taken a s an average value a t 1 . 0
Composition i s primarily +
2.3.3 Kinetic gas temperature ( r e f s . 3, 4. and 5J.- A t 1 .0 A.U. ,
the k ine t i c gas temperature is about 2 X loT0 K. The m a n f ree path of
gas pa r t i c l e s is about 10 km. The k ine t i c gas temperature decreases with increasing so lar distance i n a manner such that the temperature d i f f e r -
ence from 0.5 t o 1.75
The s p a t i a l heat sink i s that of a rad ian t energy reservoi r with an
7
A.U. is about lo5' K.
e f fec t ive rad ia t ing temperature of 4" t o 6" K i n a l l d i rec t ions , which does not in te rcept volumes occupied by the sun or planets.
6
INTERPLANETARY SPACE
Solar distance, A.U.
- 0.5 0.6
0.7 0.8 0.9
I 1.0 1.1
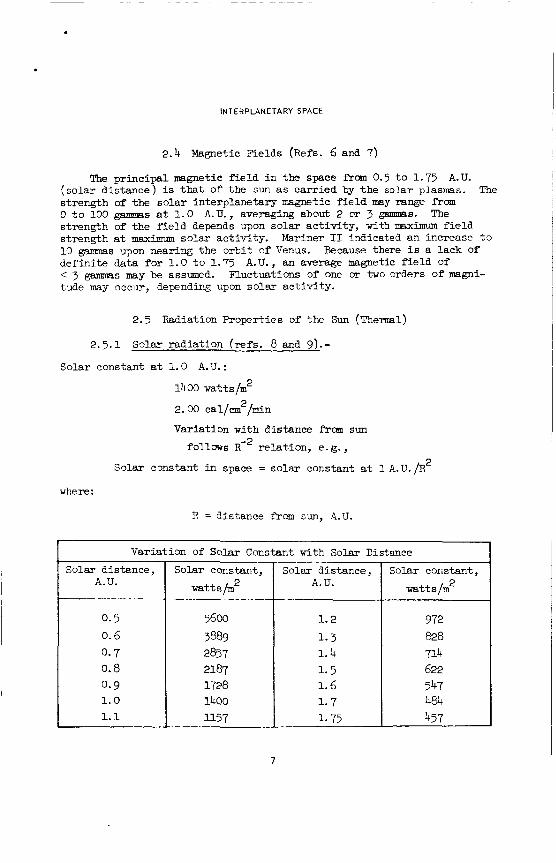
2.4 Magnetic Fields (Refs. 6 and 7)
The pr inc ipa l magnekic f i e l d i n the space f r o m 0.5 t o 1.75 ( so l a r d i s tance) is that of the sun a s ca r r i ed by t h e solar plasmas. s t rength of the so l a r in te rp lane tary magnetic f i e l d may range from 0 t o 100 gamms a t 1.0 A. U., averaging about 2 or 3 &ammas. strength of t he f i e l d depends upon solax ac t iv i ty , w i t h maximum f i e l d s t rength a t maxirmrm solar ac t iv i ty . 10 ganmas upon nearing the o rb i t of Venus. de f in i t e data for 1.0 t o 1.75 < 3 gamrnas may be assmed. tude may occur, depending upon solar ac t iv i ty .
A.U. The
The
Mariner I1 indicated an increase t o
A.U. , an average magnetic f i e l d of Because there i s a lack of
Fluctuations of one m two orders of magni-
Solar constant, Solar distance, Solar constant,
2 A. U. w a t t s / m 2 w a t t s / m
5600 1.2 972 3889 1- 3 828 2857 1.4 714 2187 1.5 622 1728 1.6 547 1400 1.7 484 1157 1-75 557
2.5 Radiation Proper t ies of the Sun ("hemal)
2.5.1 sobr radia t ion (refs. 8 and 91.-
Solar constant a t 1.0 A.U.:
1400 watts/m2 2 2.00 cal/cm /min
Variation with distance f?w sun
follows R - ~ r e l a t ion , e. g.,
Solar constant i n space = solar constant a t 1 A.U./R 2
where:
R = distance from szn, A.U.
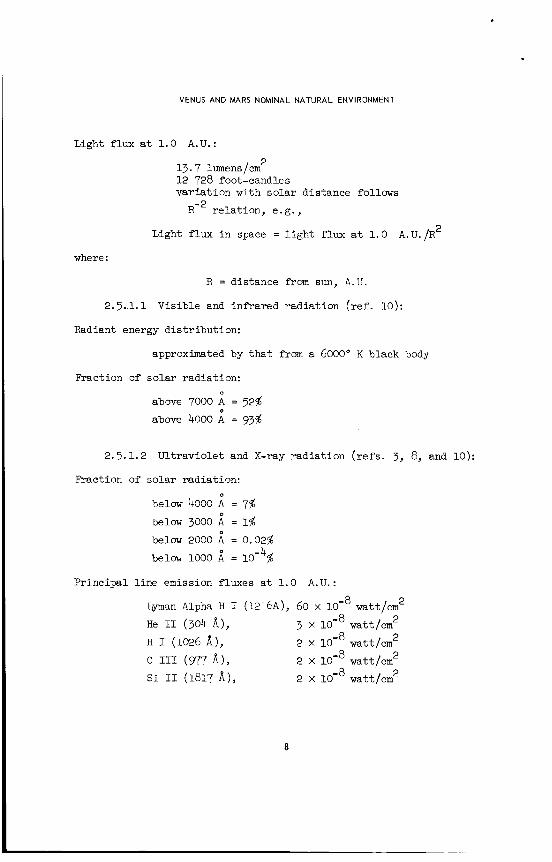
VENUS AND MARS NOMINAL NATURAL ENVIRONMENT
Light f lux a t 1 . 0 A.U. : 2 13.7 lumens/cm
12 728 foot-candles var ia t ion with so la r distance follows
R - ~ re la t ion , e . g . ,
2 Light f lux i n space = l i g h t f lux a t 1 .0 A.U./R
where:
R = distance from sun, A.U.
2.5.1.1 Visible and inf’rared radiat ion ( r e f . 10):
Radiant energy dis t r ibut ion:
approximated by t h a t from a 60000 K black body
Fraction of so la r radiat ion:
above 7000 A = 52%
above 4000 A = 93% 0
2.5.1.2 Ultraviolet and X-ray radiat ion ( r e f s . 3, 8, and 10):
Fraction of solar radiat ion: 0
below 4000 A = 7% below 3000 A = 1% below 2000 = 0.02%
belar 1000 = 10- $
0
4
Principal l i n e emission fluxes a t 1 . 0 A.U.:
*an Alpha H I (=16A) , 60 x lom8 watt/cm 2
He I1 (304 A ) , 3 x watt/cm
H I (1026 A ) , 2 x watt/cm
c 111 (977 A ) , 2 x watt/cm
S i I1 (1817 A ) , 2 x watt/cm
2
2
2
2
8
.
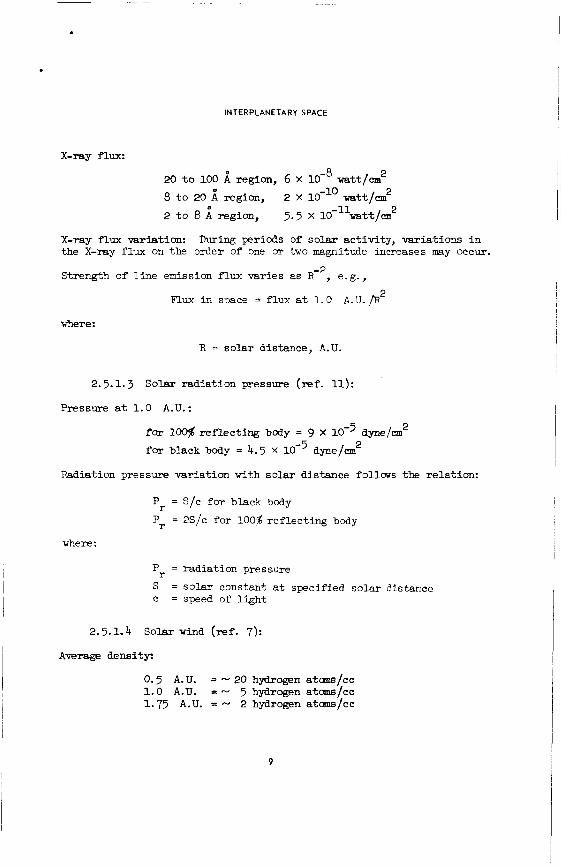
INTERPLANETARY SPACE
x-ray flux: 2 20 t o 100 region, 6 x w a t t / c m
8 t o 20 region, 2 x lo-'' w a t t / c m 2
2 2 to 8 i region, 5.5 x lo-lluatt/cPI
X-ray f lux variation: the X-ray flux on the order of one OT two magnitude increases nay occur.
Strength of l i n e emission flux var ies a s R-2, e.g.,
During periods of solar ac t iv i ty , var ia t ions i n
2 nux i n mace = flux a t 1.0 A.U. /R
where:
R = so la r distance, A.U.
2.5.1.3 Solar rad ia t ion pressure (ref. 11):
Pressure a t 1.0 A.U.:
2 for 100% r e f l ec t ing body = 9 X lo-* dyne/cm
far black body = 4.5 X 2
dyne/cm
Radiation pressure var ia t ion with solar distance follows the re la t ion :
P Pr = 2S/c far loO$ r e f l ec t ing body
= S / c for black body r
where:
P = rad ia t ion pressure
S c = speed of l i g h t
r = solar constant a t specified solar distance
2.5.1.4 Solar wind (ref. 7):
Average density:
0.5 A.U. = - 20 hydrogen a t am/cc 1 .0 A.U. = - 5 hydrogen a t m s / c c 1.75 A.U. = - 2 hydrogen ataans/cc
9
VENUS AND W R S NOMINAL NATURAL ENVIRONMENT
Average flux:
8 2 0 , 5 A.U. = - 8 X 10 hydrogen atoms/cm /see 8 2 1.0 A.U. = - 2 X 10 hydrogen atoms/cm /see
1.75 A.U. = - 10 hydrogen atms/cm /see 8 2
Average ve loc i ty of s o l a r wind:
from 0.5 A.U. t o 1.75 A.U. = 450 t o 500 km/sec
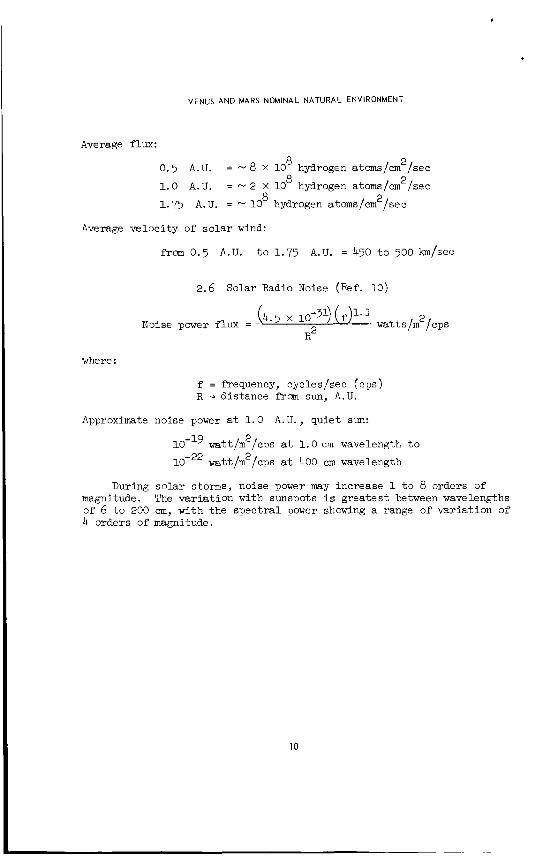
2.6 Solar Radio Noise (Ref. 10)
2 Noise power flux = - (4.5 x 10⁻³¹) ( f ) l . 1 w a t t s / m /cps R2
where:
f = frequency, cycles/sec (cpe) R = distance fYom sun, A.U.
Approximate noise power a t 1 .0 A . U . , qu ie t sun:
2
2 w a t t / m /cps a t 1 .0 cin wavelength t o
w a t t / m /cps a t 400 cm wavelength
During so lar storms, noise power may increase 1 t o 8 orders of magnitude. The var ia t ion with sunspots i s grea tes t between wavelengths of 6 t o 200 cm, with the spec t r a l power showing a range of var ia t ion o f 4 orders of magnitude.
10
3.0 Near-Venus Space
Rear-Venus space is defined a s the region between 180 lun and 20 OOO km above the surface of Venus.
3.1 Meteoroid Envirolrment
3.1.1 =.- See paragraph 2.1.1.
3.1.2 Erosion r a t e . - See paragraph 2.1.2.
3.2 Radiation Environment
Galact ic cosmic radiat ion.- See paragraph 2.2.1.
Solar high energy p a r t i c l e rad ia t ion . - See paragraph 2.2.2.
3.2.1
3.2.2 Some enhancement of t h i s rad ia t ion envirormaent will prorobably occur at the o rb i t of Venus.
3.2.3 Solar flares.- See parapaph 2.2.3.
3.3 Gas Propert ies
The following gas propert ies of near-Venus space were calculated on a theo re t i ca l basis i n the detelmination of the mean Venus model atmosphere. Because of uncer ta in t ies i n the atmospheric parameters,
I sane var ia t ion i n the values may occur.
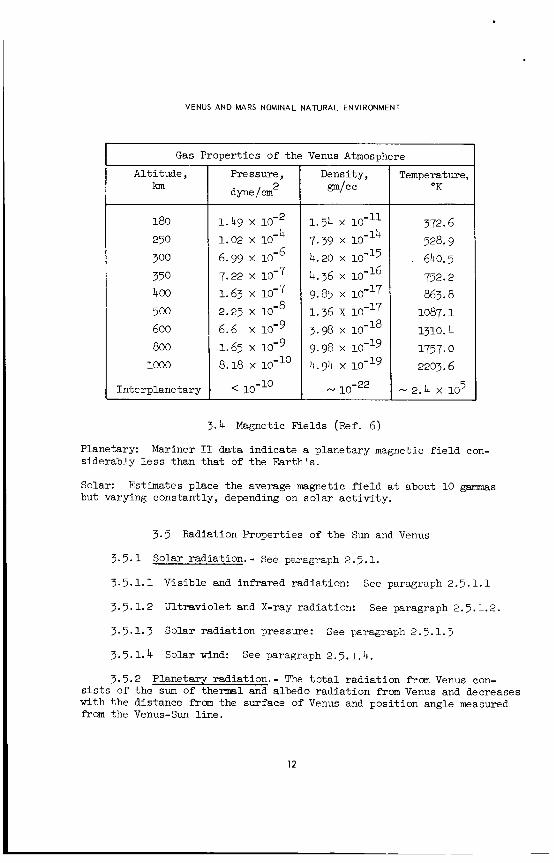
2 3.3.1 Gas pressure.- Gas pressure ranges from 10-2dyne/cm a t 10 2 180 k m a l t i t u d e t o that of xearby space o f 10-
t ab l e i n 3.3.3. dyne/cm . Refer t o the
3.3.2 Gas density.- Gas dens i ty ranges from lO-llgm/cc a t 180 km gm/cc. Composition is primarily ionized - 18 t o t h a t of nearby space 10
gases of the decomposition products of the Venus atmosphere. the tab le i n 3.3.3
Refer t o
3.3.3 Kinetic gas temperature.- The k ine t i c gas temperature i s 3 7 3 O K a t 180 lun a l t i t u d e and w i l l probably increase with increasing a l t i t u d e u n t i l merging wi th- the in te rp lane tary gss which i s a t a k ine t i c
temperature of 2.4 X lo5' K. Refer t o the following table.
11
VENUS AND MARS NOMINAL NATURAL ENVIRONMENT
Altitude, lan
180
250 300 350 400 500 600 800
1000
I Interplanetary
I Gas Properties of the Venus Atmosphere Pressure, dyne / a n 2
1.49 x 1.02 x 10- 6.99 x io-
4 6
7.22 x 10⁻⁷ 1.63 x 10⁻⁷
8
6.6 x iom9
8.18 x
2.25 X 10-
1.65 x 10⁻⁹
< 10-10
Density, W / C C
1.54 x 7.39 x 10- 4.20 x
9.85 x 10-l7 1.36 x 10-l7 3.98 x 10⁻¹⁸
9.98 x 10-l9 4.94 x 10-l9
- 10-22
14
4.36 x
Temperature, OK
372.6 528.9 640.5
863.8 1087.1 1310.4
2203.6
- 2.4 x 10⁵
752.2
1757.0
3.4 Magnetic Fields (Ref. 6)
Planetary: siderably less than that of the Earth's.
Solar: but varying constantly, depending on solar ac t iv i ty .
Mariner IS data indicate a planetary magnetic f i e l d con-
Es t ima tes place the average magnetic f ie ld a t about 10 gammas
3.5 Radiation Properties of the Sun and Venus
Solar radiation. - See paragraph 2.5.1. 3.5.1
3.5.1.1 Visible and infrared radiation: See paragraph 2.5.1.1
3.5.1.2 Ultraviolet and X-ray radiation: See paragraph 2.5.1.2.
3.5.1.3 Solar radiation pressure: See paragraph 2.5.1.3
3.5.1.4 Solar wind: See paragraph 2.5.1.4.
3.5.2 Planetary radiation. - The t o t a l rad ia t ion fYun Venus con- s i s t s o f the sum of thermal and albedo radiation from Venus and decreases w i t h t he distance f im the surface of Venus and posit ion angle measured f r o m t h e Venus-Sun l ine.
12
*
. NEAR-VENUS SPACE
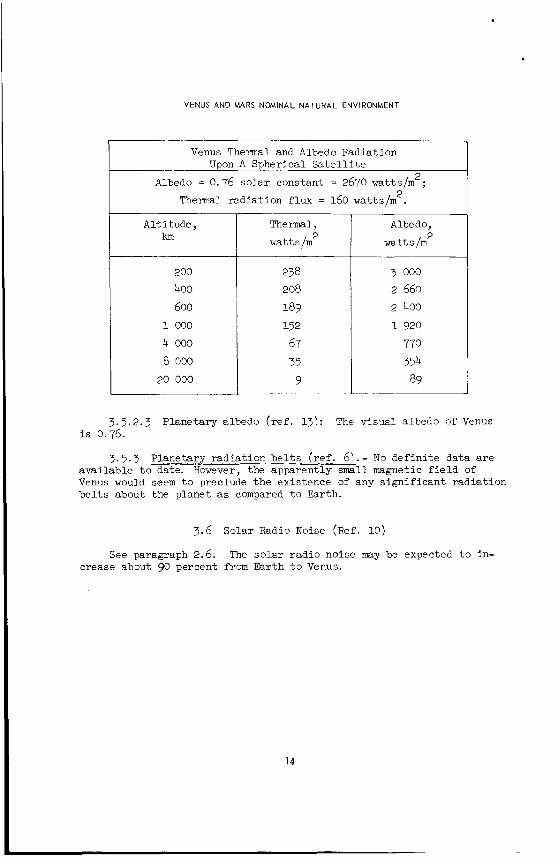
3.5.2.1 Thermal rad ia t ion (ref. 12): Them1 radiation va r i e s
frm - 238 w a t t s / m at 2OQ Bm t o - 9 v a t t s / m 2 at - 2 x 10 km. Dark s ide rad ia t ion i s same as above, although flux i s subject t o question because of t he uncertainty i n planet atmosphere and surface tempera- tures. - 2 t o 10 microns wavelength.
2 4
Thermal rad ia t ion will cons is t predcsninantly of rad ia t ion frm
The thennal rad ia t ion f lux may be found from the general equation:
Q = FA1
where:
Q = thermal rad ia t ion flux upon vehicle F = View fac to r (var ies with a l t i t u d e above the planet
A = cross sec t iona l area of exposed spher ica l surface I = planetary thermal rad ia t ion flux
and vehicle shape)
Refer t o the t ab le i n 3.5.2.2.
3.5.2.2 Albedo rad ia t ion (ref. 12): Albedo radiatjon varies from 2 4 - 3 x 10³ v a t t s / m a t - 200 km t o - 90 vatts/m2 a t - 2 x 10 under
maximum conditions (zero phase angle and normal t o flux). d i s t r ibu t ion of albedo rad ia t ion i s expected t o approximate the solar spectrum. i a t i o n from planet upon spacecraft.
Spectral
Albedo rad ia t ion w i l l contribute - 90 percent of total rad-
No r e l i a b l e determinations of t h e integrated albedo of Venus are ava i lab le a t present. Therefore, values appearing i n t h i s section were based -2pon the essm$lon thet t h e i?tegra+,ed albedo is approximated by the v i sua l albedo. general equation:
The albedo rad ia t ion flux may be found from the
Q = FASa
Where:
Q = albedo rad ia t ion flux upon vehicle F = vi- f ac to r A = cross sec t iona l area of exposed spherical surface S = solar constant at the p lane t a = plane tary albedo
Refer t o the following table.
13
VENUS AND M A R S NOMINAL NATURAL ENVIRONMENT
Venus Thermal and Albedo Radiation Upon A Spherical S a t e l l i t e
Albedo = 0.76 so lar constant = 2670 w a t t s / m 2 ;
Thermal radiat ion flux = 160 w a t t s / m . 2
Alti tude, km
200
400 600
1 000
4 000
8 000 20 000
Thermal, 2 w a t t s /m
238 208
189 152
67 35
9
Albedo, 2 w a t t s / m
3 000
2 660
2 400
1 920
770
354 89
5.5.2.3 Planetary albedo ( r e f . 13): The visual. albedo of Venus i s 0.76.
3.5.3 Planetary rad ia t ion b e l t s ( re f . 61.- No d e f i n i t e data a r e avai lable t o date. However. the a m a r e n t l v small magnetic f i e l d of _ _ L
Venus would seem t o preclude t h e existence of any s igni f icant radiat ion b e l t s about the planet as compared t o Earth.
3.6 Solar Radio Noise ( R e f . 10)
See paragraph 2.6. The s o l a r rad io noise may be expected t o in- crease about 90 percent from Earth t o Venus.
14
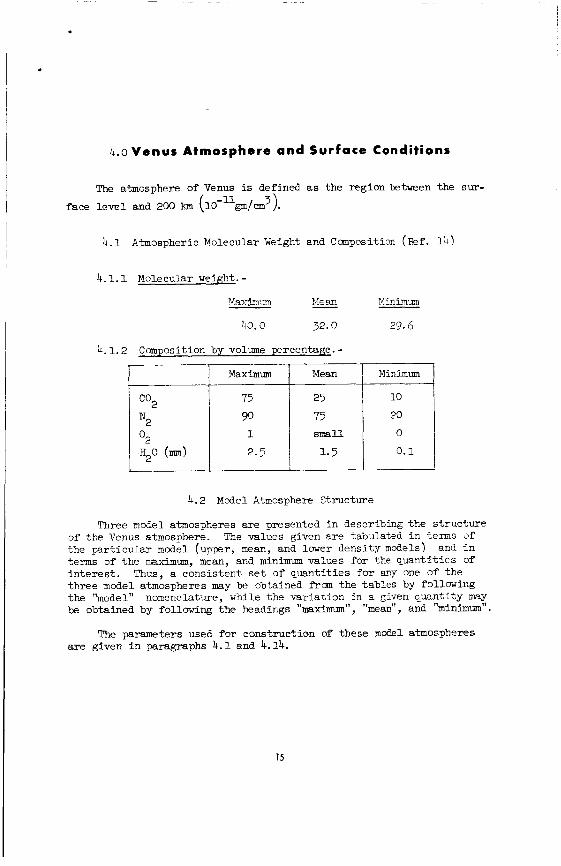
4.0 Venus Atmosphere and Surface C o n d i t i o n s
The atmosphere of Venus is defined as the region between the sur-
Maximum Mean
face l e v e l and 200 - (10-upm/m3).
4 . 1 Atmospheric Molecular Weight and Canposition (Ref .
4 . 1 . 1 Molecular weight.-
Me E?.. W i r i r l i n - 1 . l a X ~ ~
40.0 32. 0 29.6
4 . 1 . 2 Camposition by volume prcentage . - Minimum
c02
N2
O2 H20 (mu)
75 25 10
20 90 75 0 1 smll
2.5 1.5 0.1
14 1
4.2 Model Atmosphere Structure
Three model atmospheres are presented i n describing t h e s t ruc ture of the Venus atnosphere. Tne values given are tabuiated i n terns of the p a r t i c u l a r model (upper, mean, and lower densi ty mdels ) and i n terms of t h e maximm, mean, and minimum values f o r the quant i t ies of i n t e r e s t . th ree model atmospheres may be obtained f'rm the tables by following t h e "model" nomenclature, w h i l e t h e var ia t ion in a given quant i ty may be obtained by following the headings "mximm", "mean", and "minimum".
Thus, a consis tent set of quant i t ies fo r any one of t h e
The parameters used for construction of these model atmospheres are given i n paragraphs 4 . 1 and 4.14.
I5
VENUS AND MARS NOMINAL NATURAL ENVIRONMENT
z, lull
0 5
10 20 30 40 50 75 100 150 200 300 400
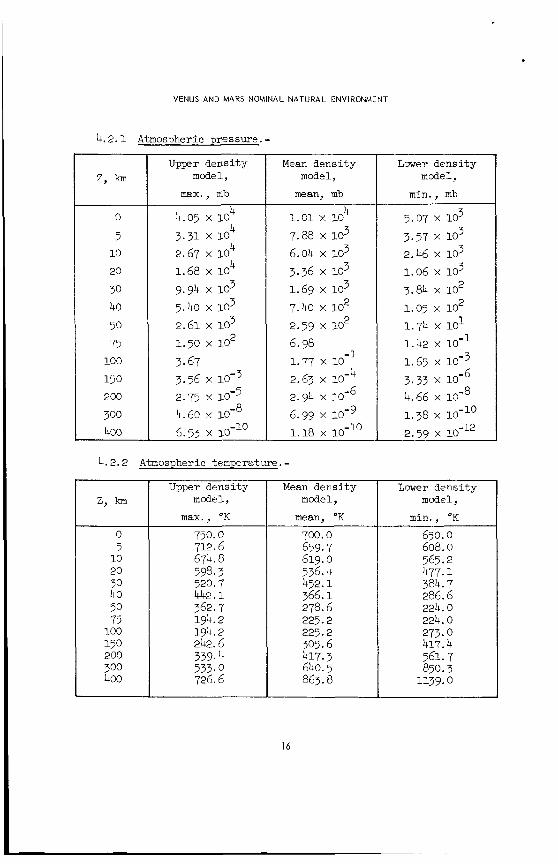
4 .2 .1 Atmospheric pressure. -
Upper densi ty model,
max., OK
750. @ 712.6 674.8 598.3 520.7 442.1 362.7 194.2 194.2 242.6 339.4 533.0 726.6
0
5 10
20
30 40
50 75
100
150 200
300 400
Upper densi ty mode 1,
max., mb
4 4 4 4
4.05 X 10
3.31 X 10 2.67 x 10
1.68 x 10
5.40 X IO3
1.50 X lo2
9.94 103
2.61 x 10³
3.67 3.56 x 10⁻³ 2.75 x 10⁻⁵ 4.60 x 6.53 x io-”
Mean densi ty model,
mean, mb
4 1 .01 x 10
7.88 x lo3
3.36 x lo3 1.69 x lo3 7.40 x I O 2
6.98 1.77 x 10-I 2.63 x io- 2.94 x 10- 6.99 10-9
6.04 x 10³
2.59 X lo2
4 6
1.18 x 10-l’
4.2.2 Atmospheric temperature. - Mean densi ty
model,
mean, “K 700.0 659.7 619. o 536.4 452.1 366.1 278.6
225.2 305.6 417.3 640.5 863.8
225.2
Lower densi ty model,
min., mb
5.07 103 3.57 x 10³ 2.46 x 10³ 1.06 103 3.84 x lo2
1.74 x lo1 1.42 x lo-’
1.05 X lo2
1.65 10-3 3.33 x 10⁻⁶ 4.66 x
1.38 x 2.59 x
Luwer densi ty model,
min., OK 650.0 608.0 565.2 477.1 384.7 286.6 224.0 224.0 273.0 417.4 561.7 850.3
1139.0
16
VENUS ATMOSPHERE AND SURFACE CONDITIONS
Upper dens i ty model,
mx.7 tP/m
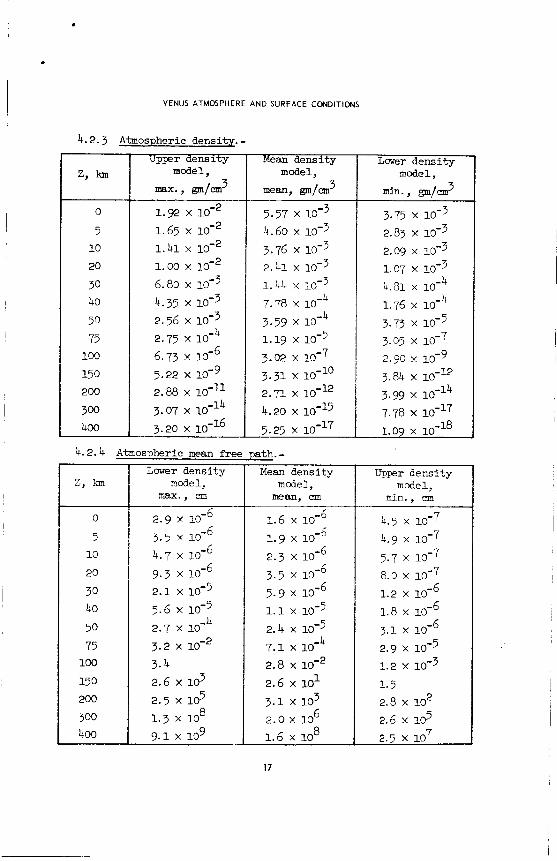
4.2.3 Atmospheric densitx. - Mean density
model, 3 mean7 @/a
0
5 10
20
30 40
50 75 100
150 200
300 400
1.9 x 10⁻²
1.65 x
1 . 4 1 x
1.00 x 6.80 x 10-3
2.56 x 10⁻³ 4.35 x 10⁻³
4 2.75 x 10- 6 6.73 x 10-
5.22 x 10⁻⁹ 2.88 X lo-’’
3.07 x 3.20 x io- l6
4.2.4 A
5.57 x 10⁻³ 4.60 x 10⁻³ 3.76 x 10⁻³ 2.41 x 10⁻³ 1.~4 x 10⁻³
3.59 x 10-
1.19 x 10⁻⁵ 3-02 x 10-7
4 4
7.78 x 10-
3.31 X lo-’’
2.71 X loeu ~~0
5.25 x 10⁻¹⁷
z, lQn
0
5 10
20
30 40
50 75 100
150 200
300 400
m o d e l , max., cm
2.9 x io- 3.5 x 10-
4.7 x 10-
9.3 x 10- 2.1 x 10⁻⁵ 5.6 x 10⁻⁵
5 6 6 6
4 2.7 X 10-
3.2 X
3.4 2.6 x id 2.5 X 1 6
8 1 . 3 x i o 9.1 x 10⁹
Mean density model, mean, em
6 1.6 x io-
2.3 x 10-
3.5 x 10-o
5.9 x 10- 1.1 x 10⁻⁵ 2.4 x 10⁻⁵
1.9 x 10⁻⁶ 6 I
6
4
2.8 x ios2 2.6 x 10’
6 8
7.1 X 10-
3.1 x 10³ 2.0 x 10 1.6 x i o
17
Lower dens i ty model,
min., gm/m 3
3.75 x 10⁻³
2.09 x 10⁻³ 1.07 x 10⁻³ 4.61 x lo- 1.76 x io- 3.73 x 10⁻⁵ 3.05 x 10⁻⁷ 2.90 x 10⁻⁹
3 . 9 x
7.78 x 1 0 - ~ 7
2.33 x
4 4
3.84 x io-12
1.09 X
Upper derisity model,
min. em
4.5 x 10⁻⁷ 4.9 x 10⁻⁷ 5.7 x 10⁻⁷ 8.0 x 10⁻⁷
6 1.2 x 10- 1.8 x
3.1 x io- 6 2.9 x 10⁻⁵ 1.2 x 10⁻³
1.5 2.8 x lo2 2.6 x 10⁵ 2.5 x 10⁷
VENUS AND MARS NOMINAL NATURAL ENVIRONMENT
LTmnny densi ty Mean densi ty model, mode 1,
max., km mean, lan
25.31 20.53 24.08 19.38 22.84 18.21 20.32 15.83 17.74 13.39 15.11 10.88 12.44 8.31 6.71 6.77 6.77 6.83 8.59 9.41 12.20 13.06 19.76 20.70 27.77 28.80
rr-
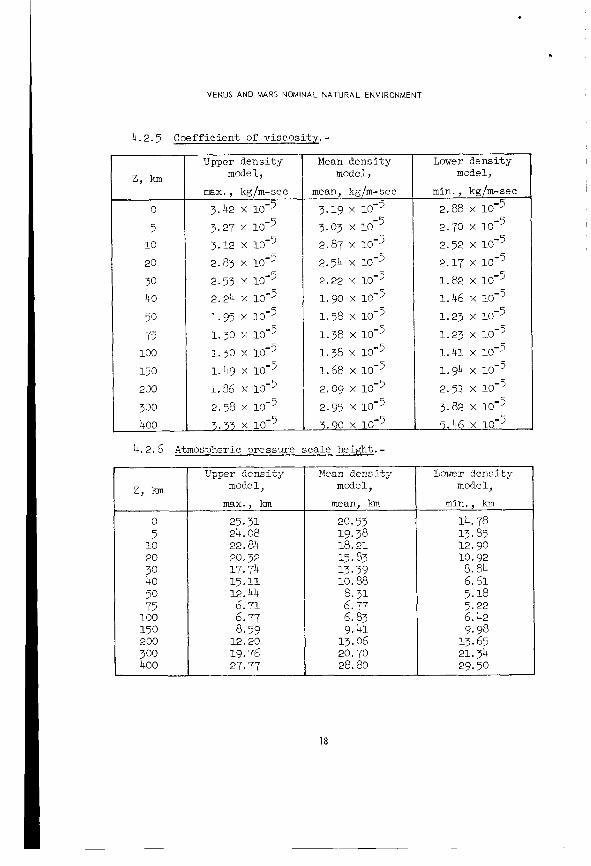
4.2.5 Coefficient of viscosi ty . -
L m r densi ty model,
min., km
14.78 13.85 12.90 10.92 8.84 6.61 5.18 5.22
9.98 13.65 21.34
6.42
29.50
0
5 10
20
30 40 50 75 100
150 200
300 400
Upper densi ty model,
max., kg/m-see
3.42 x 10⁻⁵ 3.27 x 10⁻⁵ 3.12 x 10⁻⁵ 2.83 x 10⁻⁵ 2.53 x 10⁻⁵ 2.24 x 10⁻⁵ 1.95 x 10⁻⁵ 1.30 x 10⁻⁵ 1.30 10-5 1.49 x 10⁻⁵ 1.86 10-5 2.58 x 10⁻⁵ 3.33 x 10⁻⁵
Mean densi ty model,
mean, kg/m-sec
3.19 x 10⁻⁵ 3.03 x 10⁻⁵ 2.87 x 10⁻⁵ 2.54 x 10⁻⁵ 2.22 x 10⁻⁵ 1.90 x 10⁻⁵ 1.58 x 10⁻⁵ 1.38 x 10⁻⁵ 1.38 10-5 1.68 x 10⁻⁵ 2.09 x 10⁻⁵ 2.95 x 10⁻⁵ 3.90 10-5
4.2.6 Atmospheric pressure scale height. -
0 5 10 20 30 40 50 75 100 150 200 300 400
Lmer densi ty model,
min., kg/m-sec
2.70 X lo-' 2.52 X 10"
1.82 X lo-'
2.88 x
2.17 x 10-5
1.46 x 10⁻⁵ 1.23 x 10⁻⁵
1.41 10-5 1.94 x 10⁻⁵ 2.51 x 10⁻⁵ 3.82 x 10⁻⁵ 5.46 x 10⁻⁵
1.23 X lo-?
18
VENUS ATMmPHERE AND SURFACE CONDITIONS
z,
0 5
10 20 30 40 50 75
100 150 200 300 Loo
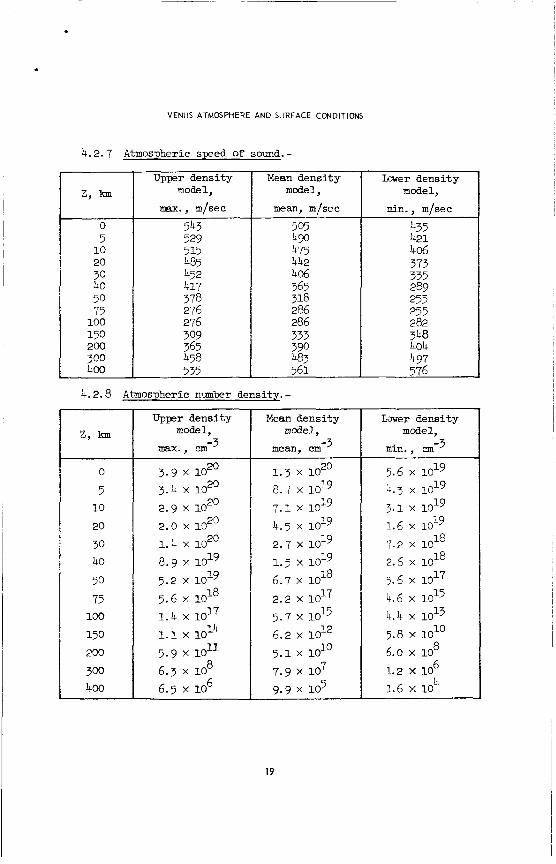
4.2.7 Atmospheric speed of sound. - U p p r dens i ty
model,
w x . , m/sec
543 529 515 485 452 417 378 276 276 309 365 458 535
Mean dens i ty model,
mean, m/sec
505 4 9 475 442 406
4.2.8 Atmospheric number density. -
0
5 10
20
30 40
50 75
100
150 200
300 400
Upper density m o d e l ,
Il!aX., cm -3
3.9 x 10²O 3. h x 1020
20
20 2.9 x i o 2.0 x 1') 1 . 4 x 1 0 2 O
8 .9 x 1 0 ~ 9 5 -2 x 1 0 ~ 9
1 . 4 x 1 0 ~ 7
5.9 x 10¹¹
5.6 x 10l8
1 4 1.1 x 10
8 6
6.3 x i o 6.5 x i o
Mean dens i ty model,
mean, cm -3
1 .3 x 1 0 2 O
8.7 x 1 0 ~ 9 7.1 x 1 0 ~ 9 4.5 x 1 0 ~ 9 2.7 x 1 0 ~ 9 1 .5 x 1 0 ~ 9
18
2.2 x 1 0 ~ 7 5.7 x 1 0 ~ 5
6.7 x 10
6.2 x lox 5 .1 X lolo
7 7.9 x 10
9.9 x 10⁵
LoKer dens i ty model,
min.. mfsec
435 421 406 377 335 289
404 497
Lmer dens i ty model,
rain.. an-3 ~
5.6 x 1 0 ~ 9 4.3 x 1 0 ~ 9 3 .1 x 1 0 ~ 9
18 18
4.6 x 1 0 ~ 5 4.4 x 1 0 ~ 3
19 1.6 x 10
7.2 x 10
2.6 x 10
5.6 x
5.8 x lo1' 6.0 x i o 1.2 x 10
1.6 x i o
8 6 4
19
VENUS AND MARS NOMINAL NATURAL ENVIRONMENT
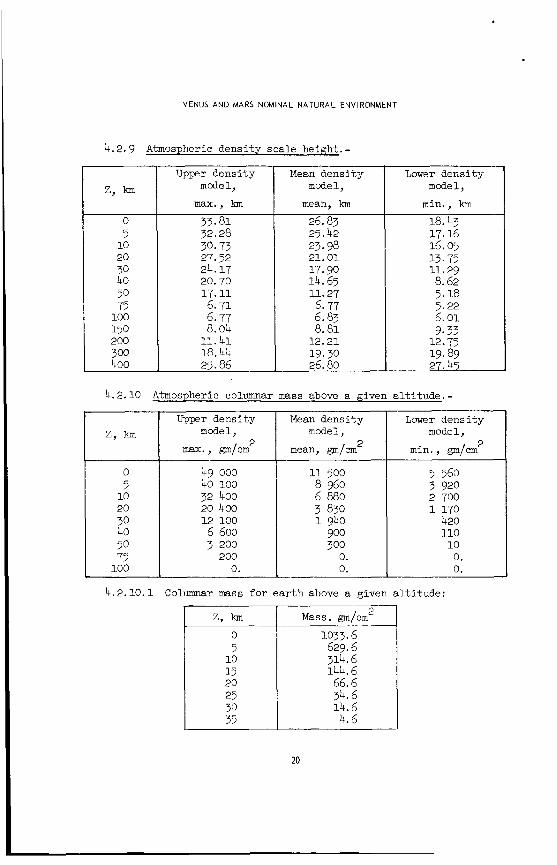
4.2.9 Atmospheric densi ty scale height. -
2,
0 5 10 20 30 40 50 75 100 150 200 300 400
U p p e r densi ty model,
max., km
33.81
30.73 27.52 24.17 20.70 17.11 6.71 6.77 8.04 11.41 18.44 25.86
32.28
Mean dens i ty model,
mean, h
25.42 26.83
23.98 21.01 17.90 14.65 11.27 6.77 6.83 8.81 12.21 19.30 26.80
Lower densi ty model,
min., km
17.16 18.43
16.05
11.29 8.62 5.18 5.22 6.01 9.33 12.75 19.89 27.45
13.75
4.2.10 Atmospheric columnar mass above a given a l t i t u d e . -
0 5 10 20 30 40 50 75 100
Upper densi ty Mean densi ty model, model,
2 max. , gm/cm mean, gm/cm
49 000 40 100 32 400 20 400 12 100 6 600 3 200 200 0.
11 500 8 960 6 880 3 830 1 940 900 300 0. 0.
Lower densi ty model,
2 min., gm/cm
5 560 3 920 2 700 1 170 420 110 10
A
U. n U.
4.2.10.1 Columnar mass f o r e a r t h above a given a l t i t u d e :
2 2, km I Mass, gm/cm
0 1033.6 5 629.6 10 314.6 15 144.6 20 66.6 25 34.6 30 14.6 35 4.6
20
VENUS ATMOSPHERE AND SURFACE CONDITIONS
4.3 Atmospheric Winds f o r Venus
High surface winds are expected; they may be heavlly dust-laden..
4.4 wind shear
No data.
4.5 Clouds i n the Atmosphere (Refs. 6, 15, and 16)
4.5.1 Composition.- Estimates from various atmospheric models include water vapor, i ce c rys ta l s , dust, carbon suboxide polymers, or suspended hydrocarbons.
4.5.2 Height of the clouds.- The top of the clouds i s *om 30 km t o 65 km above the surface of the planet.
4.5.3 Depth of the clouds.- The depth of the clouds i s approxi- mately 10 t o 15 km.
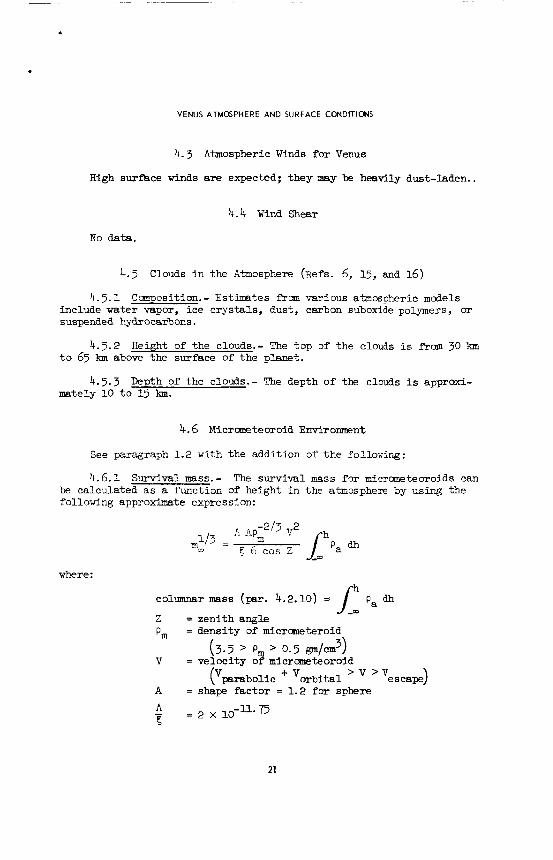
4.6 PiIicrQneteoroid Environment
See paragraph 1.2 with the addition of the following:
4.6.1 sunrival mss. - The survival mass f o r micrometeoroids can be calculated a s a function of height in the atmosphere by using the following approximate expression:
where:
columnar mass (pr. 4.2.10) = J” pa 4=
Z = zenith angle P, = density of micrcaneteroid
(3.5 > P, > 0.5 p / c m 3) V = veloc i ty of micrometeoroid
(vp rabo l i c + vorb i t a l ’ A = shape f ac to r = 1.2 f a sphere
s
’ ‘escape)
L! = 2 x 10-=75
21
VENUS AND MARS NOMINAL NATURAL ENVIRONMENT
4.7 Magnetic Field of Venus (Ref. 6)
Mariner I1 indicates a planetary magnetic f i e l d considerably less than t h a t of the Earth. Measurements of the ro ta t iona l speed of Venus are consis tent with t h i s observation, since very weak magnetic f i e l d s would be produced by speeds of ro ta t ion of 1 week t o 225 days (Venus might even have retrograde ro ta t ion) .
4.8 Atmospheric Circulat ion (Ref. 17)
The slow ro ta t iona l speed w i l l cause the atmospheric f l u i d t o rise near the sub-solar point and subside near the a n t i s o l a r point i n a symmetrical regime. However, a t higher a l t i t u d e s , a symmetric regime similar t o t h a t of a ro ta t ing planet may be predominate ( i . e . , where ascent occurs near the equator and descent occurs near the poles) .
4.9 Ionosphere (Ref. 6 )
Although undetected by Mariner 11, an ionosphere may be assumed t o be present. f ree oxygen.
It w i l l d i f f e r *om the Ear th ' s by having l i t t l e or no
4.10 Albedo
See paragraph 3.5.2.3.
4.11 Surface Features, Terrain, and Canposition of t h e Surface (Refs. 15 and 17)
4 .11 .1 Surface features . - No breaks large enough t o see the surface have ever been seen i n t h e clouds, s o no observational da ta e x i s t . ever , Mariner I1 detected a large region s l i g h t l y cooler than the rest of the disc , which possibly represents the influence of a surface feature .
How-
4 .11.2 Terrain and composition of t h e surface.- Though the surface has never been seen, it i s generally agreed t h a t it i s probably dry, dusty, rocky, and windy. One of the explanations of the high surface temperature on the dark s ide of Venus i s t h a t t h e surface has a very high spec i f ic heat capacity. This has led t o t h e conjecture that the surface consis ts of a layer of l iqu id hydrocarbons or a layer of hydro- carbons f loa t ing on a n ocean of water. However, with surface tempera- t u r e s near 700" K t h e surface i s probably dry and dusty.
22
VENUS ATMOSPHERE AND SURFACE CONDITIONS
4.12 Planetary %tellites
No satellites have been detected.
4-13 Surface Temperatures (Refs. 6, 14, and 15)
Measurements from t h e Earth indicate a surface temperature of about 600" K t o 650" K. ature is wry l i k e l y TOO" * 50" K.
Mariner I1 yielded 700" K. The a c t u a l t e m p e r -
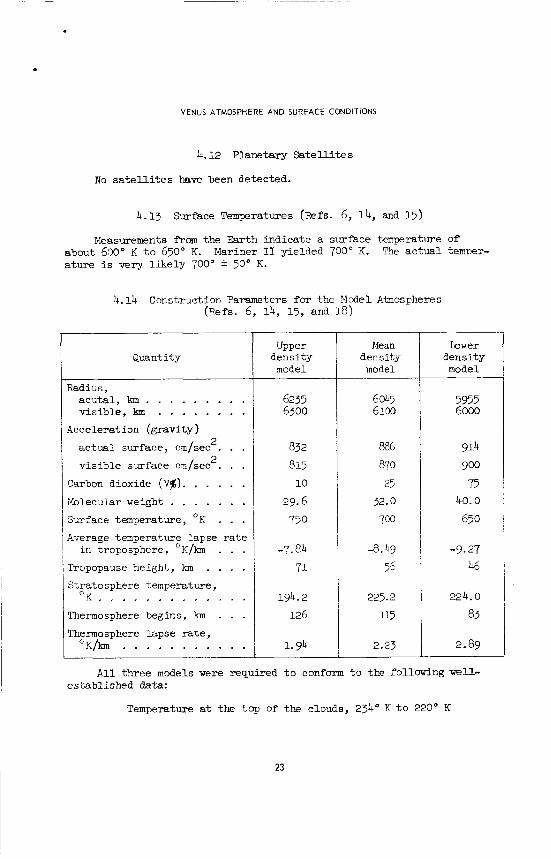
4.14 Construction Faxameters f o r the Model Atmosoheres (Refs. 6, 14, 15, and 18)
~~ ~~~
Quantity
Radius, acu ta l , k m . . . . . . . . . vis ib le , km . . . . . . . .
Acceleration (gravi ty) 2 2
ac tua l surface, cm/sec . . . v i s i b l e surface cx/sec . . .
Carbon dioxide (Vg). . . . . . Molecular weight . . . . . . . Surface temperature, OK . . . Average temperature lapse rate
i n troposphere, "K/km . . . Tropopause height , km . . . .
OK . . . . . . . . . . . . . Thermosphere begins, km . . .
Stratosphere temperature,
Thennosphere lapse rate, " K / h . . . . . . . . . . .
Upper density model
6235 6300
832 815 10
29.6 750
-7.84 71
194.2 126
1.94
Mean density model
6045 6100
886 870 25
32.0 700
-8.49 56
225.2 115
2.23
Lower densi ty model
5955 6000
914 900 75
40.0 650
-9.27 46
224.0
83
2.89
A l l three models were required t o conform t o the following w e l l - establ ished data:
Temperature a t the t a p of the clouds, 234" K t o 220" K
23
VENUS AND MARS NOMINAL NATURAL ENVIRONMENT
Pressure sca le height a t 60 km above the clouds, 6.8 f 0 .1 km
Logarithmic derivative of pressure sca le height - d In H d 2,
a t 60 km above the clouds, 0.010 * 0.002 km"
24
5.0 N e a r - M a r s S p a c e
Near-Mars space i s defined as the region b e k e n 240 Inn and 20 OOO km ab- the surface of Mars.
5.1 Meteoroid Environment
5.1.1 M o d e l . - See paragraph 2.1.1.
5.1.2 Erosion rate.- See p rag raph 2.1.2.
5.2 Radiation Environment
5.2.1
5.2.2
Galactic cosmic radiat ion. - See paragraph 2.2.1.
Solar high eneray p a r t i c l e radiation.- See paragraph 2.2.2. The f lux and energy of t h i s environmental paremeter a t t h e o rb i t of Mars w i l l probably be reduced from that at the Earth.
5.2.3 Solar flares.- See paragraph 2.2.3.
5.3 Gas Properties
The following gas propert ies of near-Mars space were calculated
Because of uncertaint ies i n the atmospheric parameters, on a theo re t i ca l bas i s i n the determination of the ma2 Mars m o d e l atmosphere. some variat ion i n the valces may occ'm.
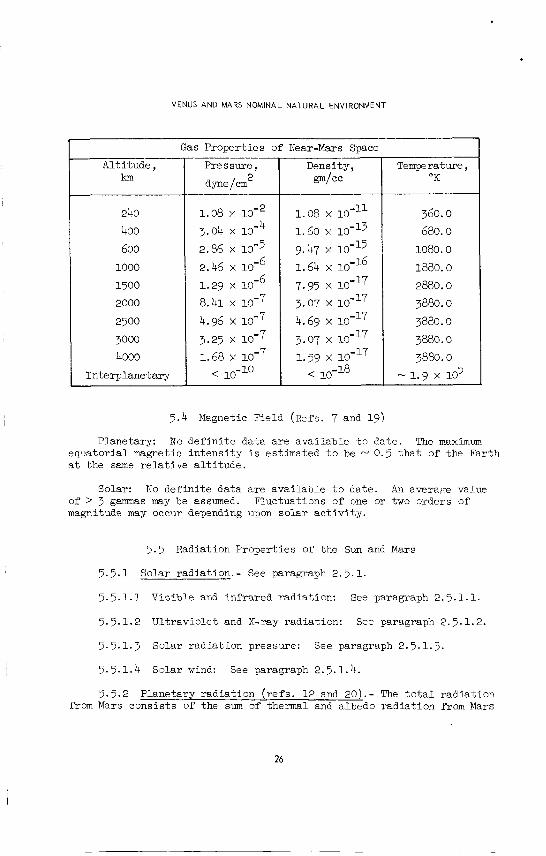
2 5.3.1 Gas pressure.- G a s pressure va r i e s from - ld2 dyne/m a t Refer t o 2 240 km a l t i t u d e t o t h a t of nearby space of < 1 O - l ' dyne/m .
the table i n 5.3.3
5.3.2 Gas density.- Gas density var ies f im - 10"' gm/cc at
240 km a l t i t u d e t o that of nearby space of < the t ab le i n 5.3.3.
gm/cc. Refer t o
5.3.3 Kinetic gas temperature.- The k ine t i c gas temperature i s - 3600 K a t 240 k m a l t i t u d e and w i l l probably increase a l t i t u d e u n t i l merging with the interplanetary gas which is at a kinet ic temperature
of - 1.9 X lo5. K. Refer t o the following table .
25
VENUS AND MARS NOMINAL NATURAL ENVIRONMENT
Gas Propert ies of Near-Mars Space
Alt i tude, km
240
400 600 1000
1500
2000
2500
3000 4000
Interplanetary
Pres sure, 2
dyne/m
1.08 x 4 3.04 x 10-
2.86 x 10'~ 6 2.46 x io- 6 1.29 x io-
8.41 x 10⁻⁷ 4.96 x 10⁻⁷ 3.25 x 10⁻⁷
< 10-10
1.68 x iom7
Density, m / c c
1.08 x 10-l1 1.60 x 10-l3 9.47 x
7.95 x 1 0 - ~ 7 3.07 x 10-l7 4.69 x 10-~7 3.07 x 10-l7 1.59 x 10-l7
< 10-18
1.64 x
Temperature, "K
360. o 680. o 1080. o 1880. o 2880.0
3880. o 3880.0
3880.0 3880. o - 1.9 x 10⁵
5.4 Magnetic Field (Refs. 7 and 19)
Planetary: No d e f i n i t e data a r e avai lable t o date . The maximum equator ia l magnetic in tens i ty i s estimated t o be N 0.5 t h a t of the Earth a t the same r e l a t i v e a l t i t u d e .
Solar: No def in i te data a r e avai lable t o date . An average value of > 3 gannnas may be assumed. Fluctuations of one or two orders of magnitude may occur depending upon so lar a c t i v i t y .
5.5 Radiation Propert ies of the Sun and Mars
5.5.1 Solar radiat ion. - See paragraph 2.5.1.
5.5.1.1 Visible and infrared radiation: See paragraph 2.5.1.1.
5.5.1.2 Ultraviolet and X-ray radiat ion: See paragraph 2.5.1.2.
5.5.1.3 Solar radiat ion pressure: See paragraph 2.5.1.3.
I 5.5.1.4 Solar wind: See paragraph 2.5.1.4.
5 .5 .2 Planetary radiat ion ( r e f s . 12 and 20). - The t o t a l rad ia t ion from Mars consis ts of the sum of thermal and albedo radiat ion from Mars
26
NEAR-MARS SPACE
and decreases with the distance from the surface of Mars and posit ion angle measured frm the Sun-Mars l ine.
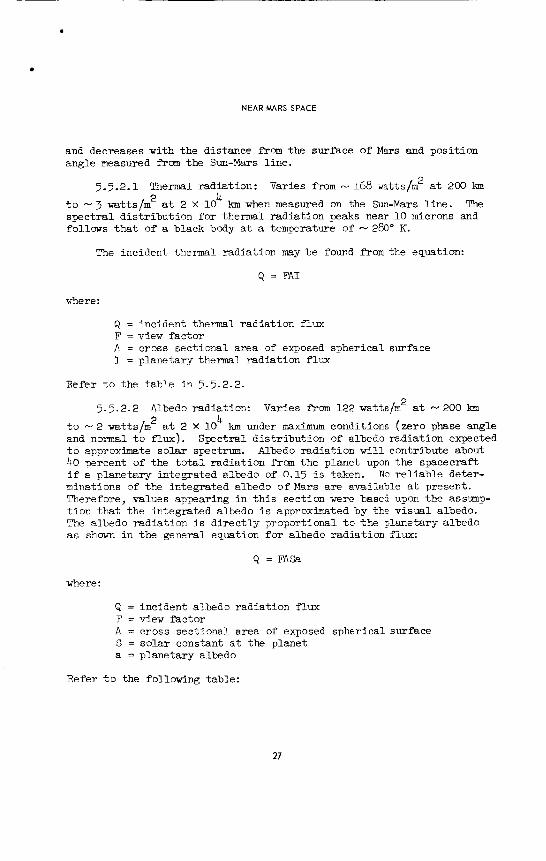
5.5.2.1 Thermal rad ia t ion : var ies from - 168 mtts/m2 a t 200 km
The 2 4 t o - 3 u a t t s / m a t 2 X 10 km when measured on the Sun-Mars l i ne . spec t r a l d i s t r ibu t ion f o r thermal rad ia t ion peaks near 10 microns and follows t h a t of a black body a t a temperature of -280" K.
The incident thermal rad ia t ion m y be found frm the equation:
Q = FA1
where:
Q = incident thermal rad ia t ion flux F = view fac to r A = cross sec t iona l area of exposed spherical surface I = planetary thermal rad ia t ion f lux
Refer t o the t ab le i n 5.5.2.2.
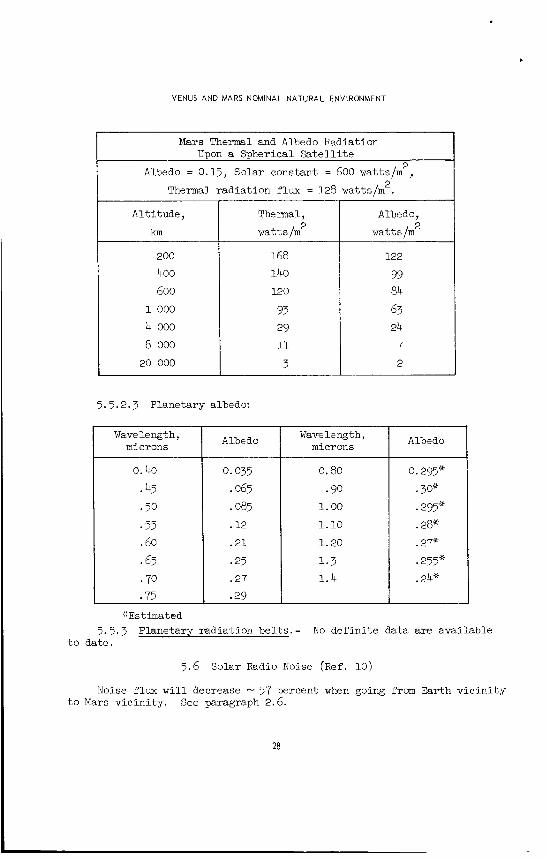
2 5.5.2.2 Albedo radiation: Varies f r o m 122 watts/m a t - 200 lm 2 4 a t 2 x 10 t o - 2 w a t t s / m
and normal t o f l u x ) . t o approximate so la r spectrum. Albedo rad ia t ion w i l l contribute about LO percent of the t o t a l r ad ia t ion from the planet upon the spacecraft i f a planetary integrated albedo of 0.15 i s taken. No r e l i a b l e deter- minations of the integrated albedo of Mars are availa5le a t present. Therefore, values apFar ing i n t h i s section were based upon the assump- t i o n t h a t the integrated albedo i s approximated by the v i sua l albedo. The albedo rad ia t ion is d i r e c t l y oroportional t o t h e planetary albedo a s shown i n the gerieral equation f o r albedo rad ia t ion fiux:
~rm under rnaximm conditions (zero phase angle Spectral d i s t r ibu t ion of albedo rad ia t ion expected
Q = FA%
where :
Q = incident albedo rad ia t ion flux F = view fac to r A = cross sec t iona l a rea of exposed spherical surface S = s o l a r constant a t the planet a = planetary albedo
Refer t o the following table:
27
c
Altitude,
lon
200
VENUS AND MARS NOMINAL NATURAL ENVIRONMENT
Thermal, Albedo, 2 wattslm w a t t s / m 2
168 122 400 600
1 000
4 000 8 000
140 120
93 29 11
99 84 63 24 7
20 000 I 3 I 2
5.5.2.3 Planetary albedo:
Wavelength, microns
0.40
.45
.50
.55
.60
.65
.70
.75
Albedo Wave length, microns
0.035 .065 .085 .12
.21
.25
.27
.29
0.80
.90 1.00
1.10
1.20
1 .3 1.4
Albedo
+Est imated
5.5.3 Planetary radiat ion b e l t s . - No d e f i n i t e data are avai lable t o date.
5.6 Solar Radio Noise (Ref. 10)
Noise flux will decrease - 57 percent when going from Earth v i c i n i t y t o Mars v ic in i ty . See paragraph 2.6.
20
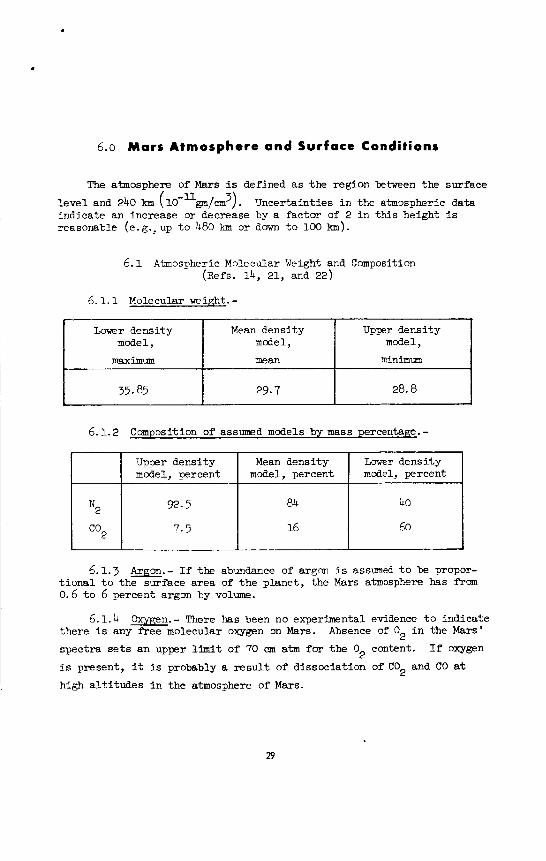
6.0 Mars Atmosphere and Surface Conditions
Upper density Mean density Lower dens i ty model, percent model, percent model, percent
92- 5 84 40
7.5 16 60 N2
c02 -
The atmosphere of Mars is defined as the region between the surface
level and 240 km ( 10-11rn/cm3). ind ica te an increase or decrease by a fac tor of 2 i n this height i s reasonable (e.g., up t o 480 km or dawn t o 100 Ian).
Uncertainties i n the atmospheric data
6.1 Atmospheric Molecular Weight and Composition (Refs. 14, 21, and 22)
6 .1 .1 Molecular weight. - Lower density Mean dens i ty Upper density
model, model, model,
ainimm
35.85
29
VENUS AND MARS NOMINAL NATURAL ENVIRONMENl
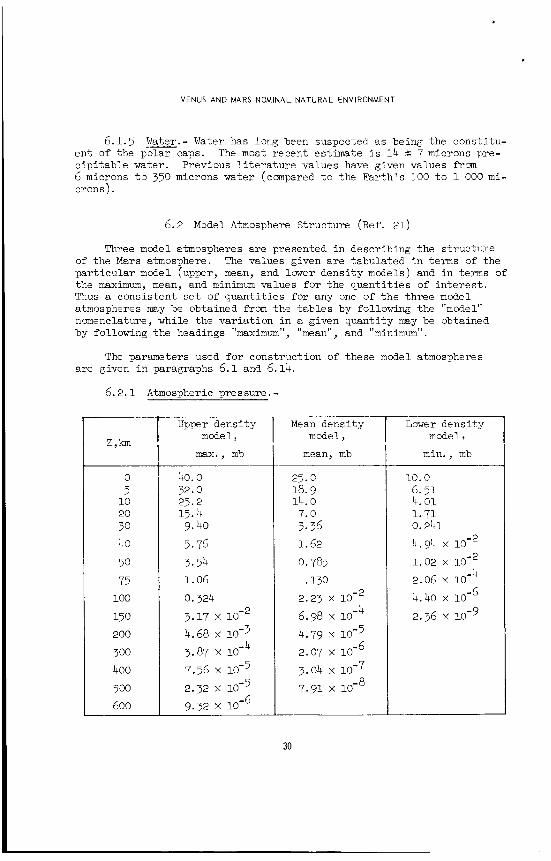
6.1.5 -.- Water has long been suspected as being the consti tu- e n t of the polar caps. c ip i tab le water. Previous l i t e r a t u r e values have given values from 6 microns t o 350 microns water (compared t o the Ear th ' s 100 t o 1 000 m i - crons).
The most recent estimate i s 14 * 7 microns pre-
6 .2 Model Atmosphere Structure (Ref. 21)
Three model atmospheres a r e presented i n describing the s t ruc ture of the Mars atmosphere. The values given a r e tabulated i n terms of the par t icu lar model (upper, mean, and lower densi ty models) and i n terms of the maximum, mean, and minimum values for the quant i t ies of i n t e r e s t . Thus a consis tent s e t of quant i t ies for any one of t h e three model atmospheres may be obtained from t h e t a b l e s by following the "model" nomenclature, while the var ia t ion i n a given quant i ty may be obtained by following the headings "maximum", "mean", and "minimum".
The parameters used for construction of these model atmospheres a re given i n paragraphs 6 .1 and 6.14
6.2 .1 Atmospheric pressure. -
0 5 10 20 30 40 50
75 100
150 200
300 400 500 600
Upper density model,
max., mb
40.0 32.0 25.2 15.4 9.40 5.76 3.54 1.06 0.324 3.17 X 4.68 x iom3
4 3.87 x io-
7.56 x 10⁻⁵ 2.32 x 10⁻⁵ 9.32 X 10- 6
Mean densi ty model,
mean, mb
23.0 18.9 14.0 7.0 3.36 1.62
0.785 .l30
2.23 X 4 6.98 x io-
2.07 x io- 4.79 x 10⁻⁵
3.04 x 10⁻⁷
6
8 7.91 X 10-
Lower densi ty model,
min., mb
19.0 6.51
1.71
4.94 x
1.02 x
2.06 x 10-
4.40 x 10-
4.01
0.241
4 6
2.36 x 10⁻⁹
30
MARS ATMOSPHERE AND SURFACE CaVDlTlWS
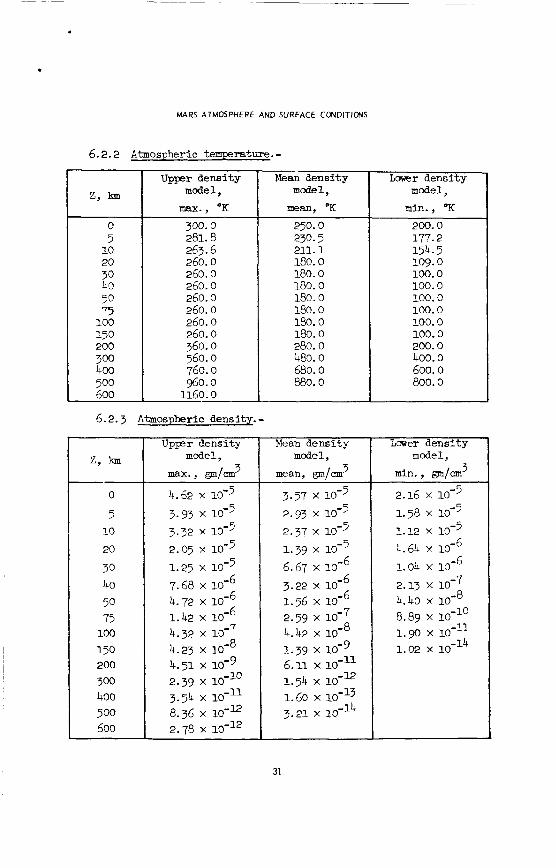
6.2.2 Atmospheric temperature. -
0 5 10 20 30 40 50 75 100 150 200 300 400 500 600
Upper dens i ty m o d e l ,
max., OK 300. o 281.8 263.6 260.0 260.0 260.0 260.0 260.0 260.0 260.0 360. o 560. o 760.0 $0.0 1160.0
6.2.3 Atmospheric density. -
z, --
0
5 10
20
30 40 50 75 100
150 200 300 400 500 600
U p p e r densi ty model,
3 m x - Y g m b
4.62 x 10⁻⁵ 3.93 x 10⁻⁵ 3.32 x 10-
2.05 x 10⁻⁵ 1.25 x 10⁻⁵
5
7.68 x lom6 6 4.72 x io- 6 1.42 x 10'
8 4.23 x io- 4.32 x 10⁻⁷
4.51 x 10⁻⁹ 2.39 x 10-1* 3.54 x 10-11 8.36 x io-* 2.78 x
Mean densi ty model,
mean, OK 230.0 230.5 211.1 180.0 180.0 180.0 180.0 180.0 180.0 180. 0 280.0 480.0 680.0 880.0
Mean dens i ty model,
3 mean, gm/m
3.57 x 10⁻⁵ 2.93 x 10⁻⁵ 2.37 x 10⁻⁵ 1.39 x 10⁻⁵
-
6 5.67 x lo- 6 3.22 x io-
1.56 x lo- 6
8 4.42 x lo-
6.11 x 1.54 x lo-= 1.60 X lo-''
2.59 x
1.39 x 10-9
3.21 IO-l4
Lower densi ty model,
min., "K
200.0 177.2 154.5
100.0 100.0 100.0 100. 0 100.0 100.0 200.0 400.0 600.0 800.0
109. o
Lower densi ty model,
min., gm/cm 3
2.16 x 10⁻⁵ 1.58 x 10⁻⁵ 1.12 x 10⁻⁵ 4.64 x 1.04 x lo- 6 - 2.13 X lo-'' 4.40 x loa8 8.89 x lo-'' 1.9 x 1.02
31
,
VENUS AND MARS NOMINAL NATURAL ENVIRONMENT
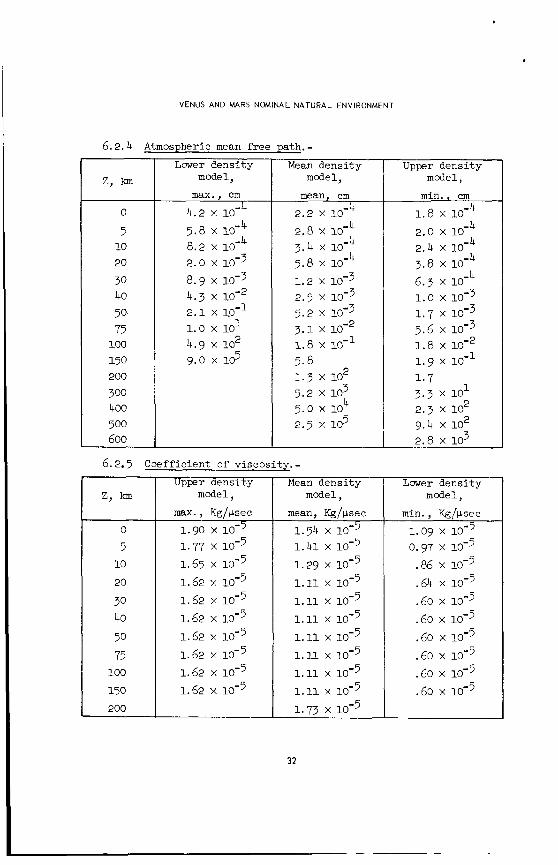
6.2.4 Atmospheric mean fk.ee path. -
0
5 10 20
30 40 50 75 100 150 200 300 400 500 600
Larer densi ty mode 1,
max., cm
4.2 x 5.8 x 10- 8.2 x 10-
2.0 x 10⁻³ 8.9 x 10⁻³ 4.3 x 2.1 x 10-1
4.9 x lo2 9.0 x 10⁵
4 4
1 1.0 x 10
Mean dens i ty model,
mean, cm
2.2 x 10- 2.8 x 10- 3.4 x 5.8 x 10-
1.2 x 10⁻³ 2.5 x 10⁻³ 5.2 x 10⁻³
5.8 1.3 x lo2
2.5 x 10⁵
4 4
4
3.1 x 1.8 x lo-’
5.2 X 10’ 4 5.0 x io
6.2.5 Coefficient of viscosi ty . -
0
5 10
20
30 40 50 75 100
150 200
Upper densi ty model,
max., Kg/psec
1.90 x 10⁻⁵ 1.77 x 10⁻⁵ 1.65 x 10⁻⁵ 1.62 x 10⁻⁵ 1.62 x 10⁻⁵ 1.62 x 10⁻⁵ 1.62 x 10⁻⁵ 1.62 x 10⁻⁵ 1.62 x 10⁻⁵ 1.62 x 10⁻⁵
Mean densi ty model,
mean, Kg/psec
1.54 x lo-’ 1.41 x 10⁻⁵ 1.29 x 10⁻⁵ 1.11 x 10⁻⁵ 1.11 x 10⁻⁵ 1.11 x 10⁻⁵ 1.11 x 10⁻⁵ 1.11 x 10⁻⁵ 1.11 x 10⁻⁵ 1.11 10-5 1.73 x 10⁻⁵
Upper densi ty model,
min. , cm
1.8 x io- 2.0 x 10- 2.4 x 10- 3.8 x io- 6.3 x io-
4 4 4 4 4
1.0 x 10⁻³ 1.7 x 10⁻³ 5.6 x 1.8 x 1.9 X 10-1
1 . 7 3.3 x 10 1
2.3 x lo2 9.4 x lo2 2.8 x 10³
Lower densi ty model,
min., Kgfksec
1.09 x 10⁻⁵ 0.97 x 10⁻⁵
.a x 10-5
.GO x 10-5
.60 x 10-5
.60 x 10-5
.60 x 10-5
.60 x 10-5
.60 x 10-5
.86 x
32
MARS ATMOSPHERE AND SURFACE CONDITIONS
0 5 10 20 30 40 50 75 100 150 200 300 400 500 600
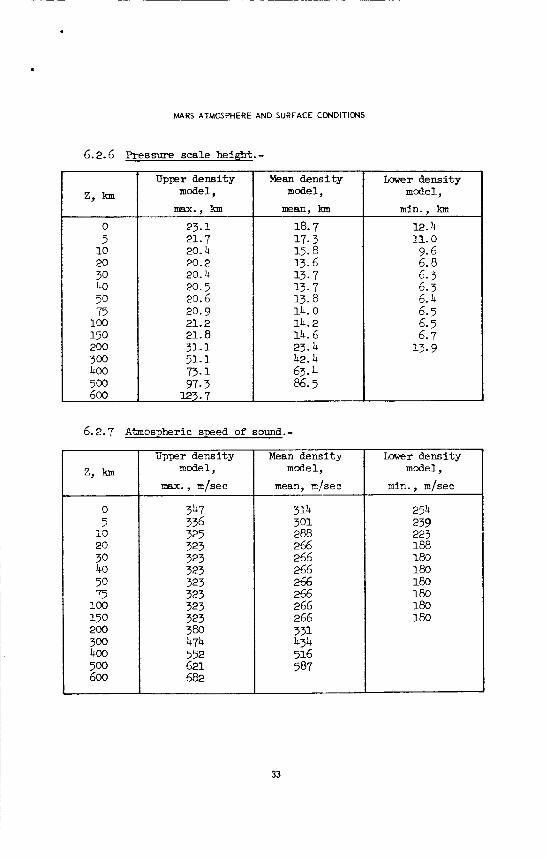
6.2.6 Pressure scale height.-
23.1 21.7 20.4 20.2 20.4 20.5 20.6 20.9 21.2 21.8 31.1 51.1 7-3.1 97- 3 123.7
Upper dens i ty model, z, km
Mean dens i ty model,
Lower densf ty model,
Mem densi ty model,
mean, km
18.7 17.3 15.8 13.6 13.7 13.7 13.8 14.0 14.2 14.6 23.4 42.4 63.4 86.5
6.2.7 Atmospheric speed of sound.-
0 5 io 20 30 40 50 75 100 150 200 300 400 500 600
Upper densi ty model,
max., m/sec
347 336 325 323 323 323 323 323 323 323 380 474 552 621 682
Lower densi ty model,
min., km 12.4 11.0 9.6 6.8 6.3 6.3 6.4 6.5 6.5 6.7 13.9
mean, m/sec 1 314 301 288 266 266 266 266 266 266 266 331 434 516 587
min., m/sec
254 239 223 188 180 180 180 180 180 180
33
VENUS AND MARS NOMINAL NATURAL ENVIRONMENT
Mean dens i ty model,
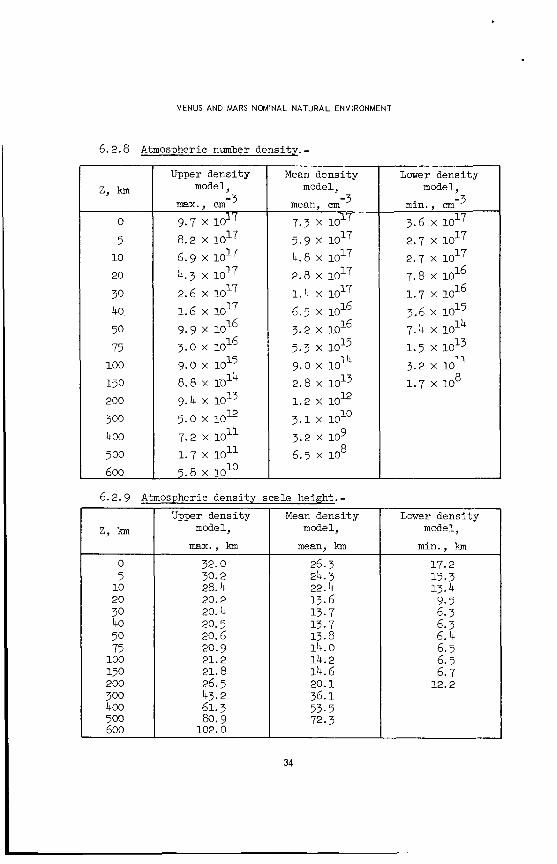
6.2.8 Atmospheric nmber density. -
Lower densi ty model,
0
5 10
20
30 40 50 75 100
150 200
300 400 500 600
Upper densi ty mode 1.
max., cm-3
9.7 x lo1( 8.2 x 10~7 6.9 x 10¹⁷ 4.3 x 10~7 2.6 x 10¹⁷ 1.6 x 10~7
16 9.9 x 10 16 3.0 x io
9. o x 10~5 8.8 x d4 9.4 x l O l 3 5.0 x 1oI2 7.2 x 10¹¹
5.8 x 1o1O 1.7 x
Mean dens i ty model,
mean, em
7.3 x 10
4.8 x 10¹⁷
-3 17
5.9 x 10~7
2.8 x 10~7 1.4 x 10~7 6.5 x 3.2 x io 5.3 x 1 0 ~ 5 9.0 x io 2.8 x 10~3 1.2 x 1oI2
3.2 x 10⁹
16
14
3.1 X lo1'
8 6.5 x io
6.2.9 Atmospheric densi ty scale height. -
0 5 10 20 30 40 50 75 100 150 200 300 400 500 600
Upper densi ty model,
max., km
32.0 30.2 28.4 20.2 20.4 20.5 20.6 20.9 21.2 21.8 26.5
61.3 80.9 102.0
43.2
Lower densi ty model.
-3
3.6 x 10¹⁷ min., cm
2.7 x 10~7 2.7 x 10~7 7.8 x io16
16
3.6 x 10¹⁵ 14 7.4 x 10
1.5 x 10~3 3.2 x 10 1.7 x io
1.7 X 10
11
8
mean, k ~ n I min., k ~ n
26.3
13.6
13.7 13.8 14.0 14.2 14.6 20.1 36.1 53.5 72.3
24.3 22.4
13- 7
17.2 15. Is 13.4 9.5 6.3 6.3 6.4 6.5 6.5 6.7 12.2
34
. MARS ATMOSPHERE AND SURFACE CONDITIONS
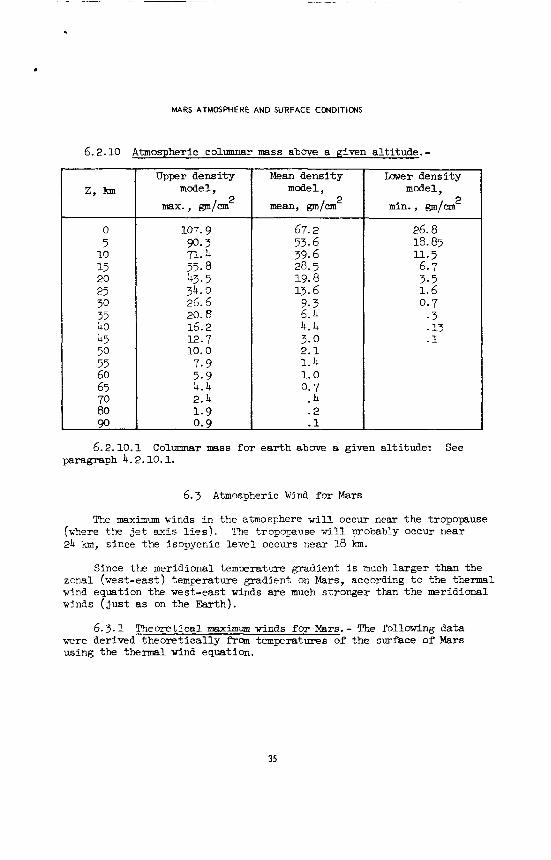
6.2.10 Atmospheric columnar mass above a given a l t i tude . -
0 5
10 15 20 25 30 35 40 45 50 55 60 65 70 80 90
U p p e r dens i ty model,
2 m x - 9 @/.m
107.9 90.3 n. 4 55- 8 43.5
26.6 20.8 16.2 12.7 10.0
7.9 5.9 4.4 2.4 1 - 9 0.9
34.0
Mean dens i ty model,
67.2 53.6 39.6 28.5
13.6 9.3 6.4 4.4 3.0 2.1 1.4 1.0 0.7
.4
.2
19.8
L w r dens i ty model,
2 min., gm/cm
26.8 18.85 11.5 6.7 3.5 1.6 0.7
.3 * 13 -1
6.2.10.1 Columnar mass for ea r th above a given alt i tude: See paragraph 4.2.10.1.
6.3 Atmospheric Wind for Mars
The maximum winds i n the atmosphere w i l l occur near t he tropopause (where tk je t mi-s l ies). 24 lan, since the isopycnic l eve l occurs pear 18 km.
tropnpame vi11 'probably occur near
Since the meridional temperature gradient i s much larger than the zonal (west-east) temperature gradient on Mars, according to the thermal wind equation the west-east winds a re much stronger than the neridicmal winds (just as on the Earth).
6.3.1 Theoretical maximum winds for Mars. - "he following data were derived theo re t i ca l ly fYm temperatures of the surface of Mars using the t h e m 1 wind equation.
35
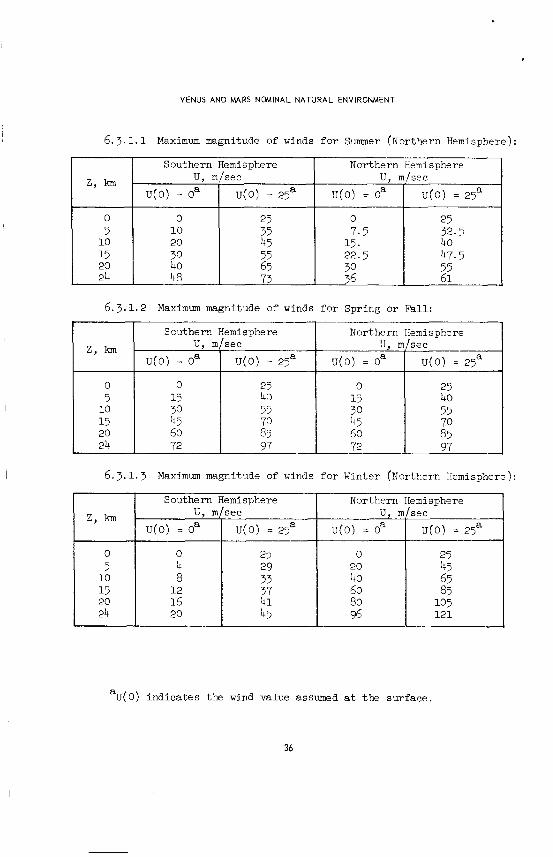
VENUS AND M A R S NOMINAL NATURAL ENVIRONMENT
z, hn
0 5
10 15 20 24
Southern Hemisphere Northern Hemisphere u, m/sec u, m/sec
u(0) = oa U(0) = 25' u(0) = oa U(0) = 25a
0 25 0 25 10 35 7.5 32.5 20 45 15. 40 50 55 22.5 47.5 40 65 30 55 48 73 36 61
6.3.1.2 Maximum magnitude of winds f o r Spring or Fall:
z,
0 5
10 15
24 20
Southern Hemisphere Northern Hemisphere U, m/sec U, m/sec
u(0) = 0" U(0) = 25a u(0) = oa U(0) = 25a
0 25 0 25 15 43 15 40 30 55 30 55 45 70 45 70
72 97 72 97
-
60 85 60 85
z,
0 5
10 15 20 24
% ( O ) indicates the wind value assumed a t the surface.
- Southern Hemisphere Northern Hemisphere
u(0) = 0" U ( 0 ) = 25a u(0) = oa U(0) = 25a
0 25 0 25
u, m/sec U, m/sec
4 29 20 45 a 33 40 65
12 37 60 85 16 41 80 105 20 45 96 121
36
- Southern Hemisphere Northern Hemisphere
- du m/sec - du m/sec dz' km dz' lan
0.8 4
MARS ATMOSPHERE AND SURFACE CONDITIONS
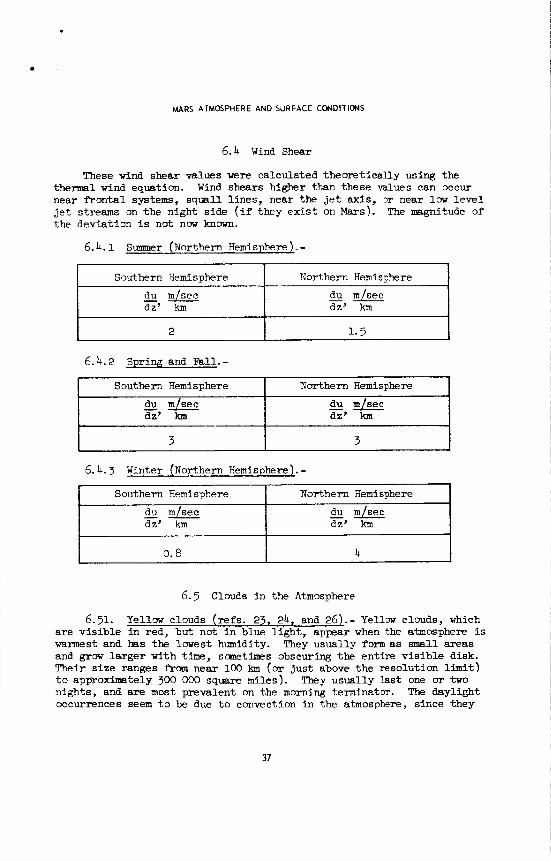
6.4 wind Shear
These wind shear values w e r e calculated theore t ica l ly using the thermal wind equation. near f r o n t a l systems, squa l l l i nes , near the j e t axis, o r near low level j e t streams on the night side ( i f they e x i s t on Mars). The magnitude of the deviation i s not now knm.
Wind shears higher than these values can occur
6.4.1 Summer (Northern Hemisphere ) . -
Southern Hemi sphere Northern Hemisphere
du m/sec du m/sec
6.4.2 Spring and Fall.-
Southern Hemisphere Northern Hemisphere
du m/sec du m/sec
6.4.3 Winter (Northern Hemisphere). -
6.5 Clouds i n the Atmosphere
6.51. Yellow clouds ( r e f s . 23, 24, and 26).- Yellow clouds, which a re v i s i b l e i n red, but not i n blue l igh t , appear when the atmosphere i s warmest and has the lowest humidity. and grow l a rge r with the , sanetimes obscuring the en t i re v i s i b l e disk. Their s i ze ranges from near 100 km (or j u s t abwe the resolution l i m i t ) t o approximately 300 nights, and are most prevalent on the morning terminator. The daylight occurrences seem t o be due t o convection i n the atmosphere, since they
They USUally form a s mall areas
square miles). hey usually l a s t one or two
31
VENUS AND MARS NOMINAL NATURAL ENVIRONMENT
are more predominant near per ihel ion than near aphelion. prevalence of these clouds may indicate the existence of high winds during the night . The p a r t i c l e s composing the yellow clouds have a den-
s i t y near 3 gm/cm3 and a r e 2 t o 5 microns i n s i z e . They occur most frequently below 4 . 8 t o 8.0 km.
The morning
6.5.2 Blue clouds ( re fs . 2 3 , 24, 25, 26 and 27).- Blue clouds, which a r e v i s i b l e i n blue, but vanish i n red l i g h t , appear t o be t h i n “c i r rus l i k e ” clouds. Polar izat ion measurements indicate that they may be composed of transparent droplets near 2 microns i n diameter. Blue clouds a re most prevalent near the morning and evening terminators, and a l s o appear t o have some geographical preference (e .g . , Tharsis, and the polar regions). may occur up t o 100 km i n the atmosphere.
They occur most f requent ly from 15 t o 25 km, and
6.5.3 White clouds ( r e f s . 23, 24, and 28).- White clouds a re v i s i b l e i n both yellow and blue l i g h t . Experimental evidence indicates that the polar izat ion of the white clouds i s i d e n t i c a l with t h a t of i c e c r y s t a l s near 1 micron i n s ize . They occur predominantly over t h e poles and cer- t a i n geographical areas. Afternoon white clouds a r e observed Over the areas of Southern Tharsis, Phoenicis Lacus, and Arsia Silva. They occw a t a l t i t u d e s ranging from 15 t o 25 km and are most prevalent near aphelion. Nix Olympica and the Condor “ranges“ appear t o have pers i s t - e n t clouds of t h i s v a r i e t y nearby.
6.5.4 Blue haze ( r e f s . 23, 24, and 25).- I n blue l i g h t , Mars usually presents a hazy appearance, such t h a t t h e surface d e t a i l i s not v i s ib le . However, near favorable oppositions, c lear ings i n t h i s haze a r e abserved which allow the surface features t o be seen a t wavelengths less than 4500 A. f o r the blue haze. Some of the more r e a l i s t i c theories are:
T o date no s a t i s f a c t o r y explanation has been given
(1) C02 clouds
(2) water-ice clouds
(3) se lec t ive absorbance
( 4 ) sca t te r ing phenomenon
The blue haze i s reported t o occur somewhere between 5 and 200 km.
6.6 Micrometeroid Environment
See paragraph 4.6.
38
MARS ATMOSPHERE AND SURFACE CONDITIONS
6.7 Magnetic Field of Mars
See paragraph 5.4.
6.8 Atmospheric Circulation (Ref. 15)
6.8.1 Early -11 and late Spring. - D u r i n g Fall and Spring the atmospheric f l u i d ascends a t the equator and descends a t the poles. Since angular momentum i s conserved, the f lu id near the surface s p i r a l s away from the pole and the f l u i d near the tropopause s p i r a l s i n toward the pole. This i s known a s the synanetric regime.
6.8.2 Winter.- A s Winter approaches the circulation develops waves with l o w pressure systems being poleward of 45" and high pressure be ing on the equator side of 45". This r e s u l t s i n w e s t winds i n the mid-lati tudes and e a s t winds a t the equator and near the pole. middle and upper troposphere w e s t winds w i l l be predominant f o r both the mid-latitudes and t h e polar regions. l a t i o n regime breaks d m i n t o the symmetric regime l a t e i n Winter or continues t o have these westerly waves u n t i l Spring.
I n the
It i s uncertain i f this circu-
6.8.3 Smmer. - During Smmer there w i l l be a reversed symmetric c i rcu la t ion , t h a t l a t e r develops eas t e r ly waves. predominant i n the middle and upper troposphere f u r the middle and high l a t i t udes .
Ehst winds w i l l be
6.9 Ionosphere (Ref. 30)
Peaks of t he order of 10' electrons/cm3 (or 1/10 that of the F2
region on Earth) a re expected a t a l t i t udes near 480 lan if the atmosphere i s primarily nitrogen. There i s a l s o some indication that the ionosphere i s multilayered with severa l peaks occurring i n the electron concentra- t i on ( i . e . , analagous t o the F1 and F2 layers i n the Earth's ionosphere).
6.10 Albedo
See paragraph 5.5-2.3.
6.11 Surface Features, Terrain, and Composition of the Surface (Refs. 24, 31, 32, 33, and 34)
To t h e naked eye Mars appears reddish yellow, due t o two-thirds of the surface being cwered with "desert l ike" areas. I n a telescope
39
c
VENUS AND MARS NOMINAL NATURAL ENVIRONMENl
it i s possible t o see dark a reas of a grayish green t i n t . These areas a r e cal led "mare" and are more prominent i n the Southern Hemisphere and often appear t o be connected by l i n e s (which are sometimes re fer red t o as "canals").
6.11.1 Surface features . - 6.11.1.1 Southern Hemisphere: The darkest "mare" l i e i n a hand
located p a r a l l e l t o the equator from t h e equator southward t o 30"s. South of t h i s l i e s a band of reddish "desert" that extends t o 55"s. The southern polar cap extends to 60"s a t i t s maximum. Due t o the re- l a t i o n of the tilt of Mars t o the o r b i t a l elements, the Southern H e m i s - phere has a long "cold" winter and a short "hot" summer. This r e s u l t s i n the Southern Hemisphere having a more extensive, and faster melting polar cap than the Borthern Hemisphere.
6.11.1.2 Northern Hemisphere: The Northern Hemisphere i s predom- inant ly deser t l ike , with l i t t l e mare being v i s i b l e . No band l i k e ap- pearance i s v i s i b l e as i n the Southern Hemisphere and i t s polar cap i s not as extensive (65"N).
6.11.2
6.11.2.1 Deserts: These br ight areas are regions t h a t are d r i e r and a t higher e levat ion than the mare. They have an albedo of 0.15 t o 0.20. The possible composition of these a reas may he one of the following:
Terrain and composition of the surface. -
limonite, Fe 0 X H20
volcanic ash r h y o l i t i c f e l s i t e
2 3
Orthoclase Feldspar 20 t o 50% Plagioclase Feldspar 30 t o 20% Quartz 35 t o 25% Ferromagne s ians 15 t o 5%
The p a r t i c l e s ize w i l l probably be very smll ( i . e . , a clay or f ine powder) due t o the wide d iurna l t e m p r a t u r e var ia t ion. so i l s will he almost nonexistent and minerals such as c a l c i t e , gypsum, and hali te may be abundant.
Residual
6.11.2.2 Mountains: The surface r e l i e f on Mars i s general ly be- l ieved t o be small, since no shadows have been observed. I f mountains a r e present, they a r e probably no higher than 2.5 t o 4.7 km. higher areas are infer red t o e x i s t by the pers is tence of snow i n the Spring. They a r e Nix Olympica, Hellas, A r g y r e , and Elysium. The r e l i e f on a large scale i s considered t o be small, with t h e t e r r a i n being smooth
Some
40
MARS ATMOSPHERE AND SURFACE CONDITIONS
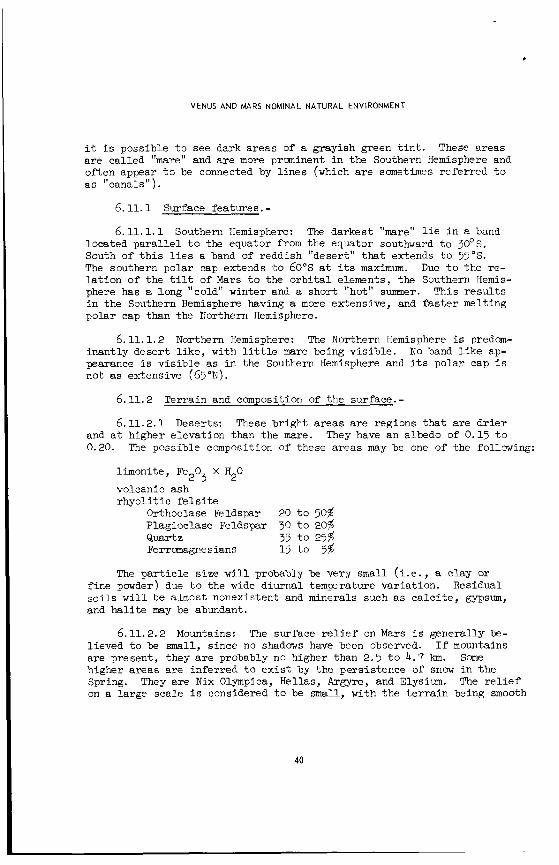
I a t i t ude , aeg
75 s 60 45 30 15 0
15 N 30 45 60
and ro l l ing . orogenic, tectonic, or weathering processes.
However, local s teep s l o p s may be encountered due t o
6.11.2.3 Mare: Mare are consi6ered t o be low, humid ( r e l a t ive ly ) areas on Mars where erosion and weathering a re speeded up when cmpared with the deserts. covered by a "dust s t o m " have long suggested the poss ib i l i ty of p lan t l i fe being the cause. hydrocarbon, carbohydrate, or aldehyde compounds were found t o be i n the spectra of t he mare, but were absent i n the spectra o f the deserts. The cmposi t ion of t h i s region could be the same as t h a t of the deser t s , with the exception t h a t some res idua l s o i l s may be present i n l imited extent. The composition could a l s o be predminantly basalt.
Their dark color and recuperative a b i l i t y after being
Recently the 3.4 t o 3.7 micron bands of the
Average temperature along noon meridian, "K
243 254 264 2 72 273 270 261 250 238 227
6.12 Surface Temperatures (Ref. 35)
6.12.1 Winter (Northern Temisphere). -
6.12.2 Spring (Northern Hemisphere). - I a t i t ude ,
deg
75 s 60 45 30 15 0
15 N 30 45 60
Average temperature along noon meridian, OK
225 239 251 262 270 275 275 272 265 255
41
VENUS AND MARS NOMINAL NATURAL.ENVIRONMEN1
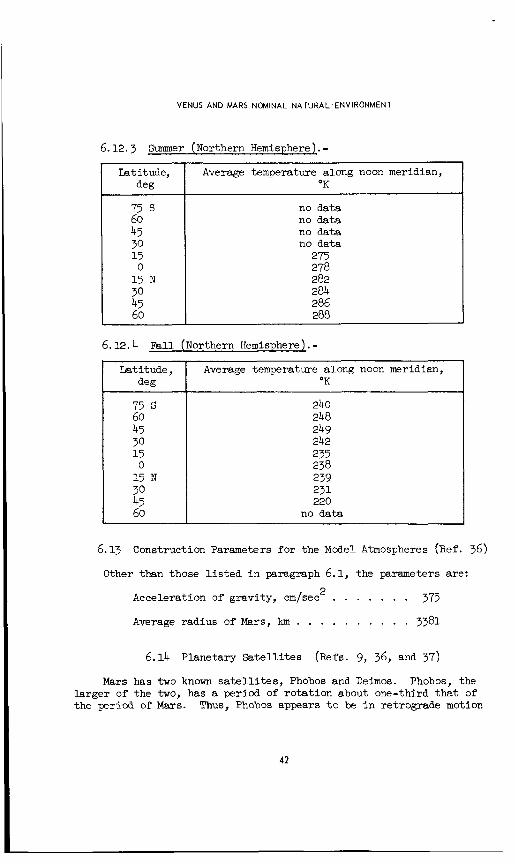
6.12.3 Summer (Northern Hemispherel. - Latitude,
deg
75 s 60 45 30 15 0
15 N 30 45 60
Average temperature along noon meridian, O K
no data no data no data no data
275 278
284 282
286 288
6.12.4 %ll (Northern Hemisphere). - i k t i t ude ,
deg
75 60 45 30 15 0
15 N 30 45 60
Average temperature along noon mr id i an , O K
240 248 249 242 235 238 239 231 220
no data
6.13 Construction Parameters fo r the Model Atmospheres (Ref.
Other than those l i s t e d i n paragraph 6.1, the parameters are:
375 Acceleration of gravity, cm/sec . . . . . . . Average radius of Mars, km . . . . . . . . . . 3381
2
6.14 Planetary S a t e l l i t e s (Refs. 9, 36, and 37)
Mars has two known s a t e l l i t e s , Phobos and Deimos. Phobos, the la rger of the two, has a period of ro ta t ion about one-third t h a t of the period of Mars. Thus, Phobos appears t o be i n retrograde motion
42
MARS ATMOSPHERE AND SURFACE CONDITIONS
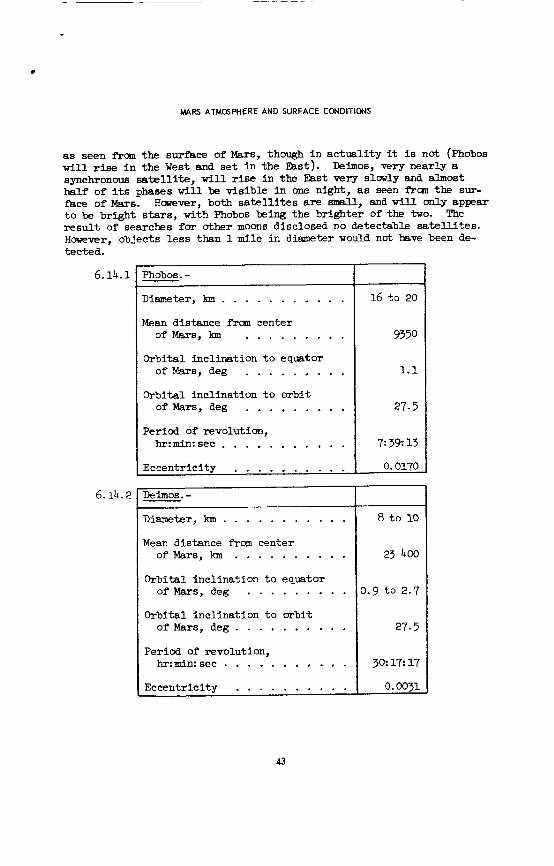
as seen frm the surface of Mars, though i n a c t u a l i t y it is not (Phobos w i l l rise i n the West and s e t in the East). synchronous satellite, w i l l rise i n the East very slowly and almost ha l f of i ts phases xill be v i s ib l e in one night, as seen fran t h e sur- face of Mars. t o be br ight stars, with Phobos being the br ighter of the two. result of searches for other moms disclosed 110 detectable satellites. However, objects l e s s than l m i l e i n diameter would not have been de-
Deimos, very nearly a
Hovever, both satellites are sms11, and w i l l only appear The
tected.
6.14.1
6.14.2
Phobos. - D i a m e t e r , km . . . . . . . . . . . Mean distance frm center
of Mars, km . . . . . . . . .
of Mars, deg . . . . . . . . .
of Mars, deg . . . . . . . . .
hr: min: sec . . . . . . . . . . . Eccent r ic i ty . . . . . . . . . .
Orbi ta l inc l ina t ion t o equator
Orbi ta l inc l ina t ion t o o rb i t
Period of revolution,
Deimos . - D i a m e t e r , km . . . . . . . . . . .
ofMars , knl . . . . . . . . . . Mean distance from center
Orbi ta l inc l ina t ion t o equator of Mars, deg . . . . . . . .
Orbi ta l i nc l ina t ion t o o rb i t of Mars, deg . . . . . . . . . .
Period of revolution, h m i n : sec . . . . . . . . . . .
Eccent r ic i ty . . . . . . . . . .
16 t o 20
9350
1.1
27.5
7: 39: 13
o. 0170
8 t o 10
23 400
0.9 t o 2.7
27.5
30: 17: 17
0.0031
43
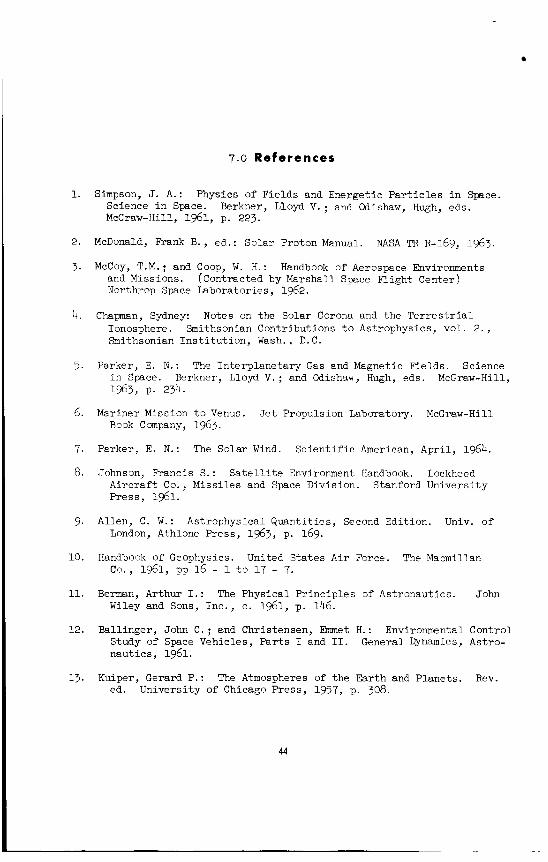
7.0 References
1. Simpson, J. A.: Physics of Fields and Energetic P a r t i c l e s i n Space. Science i n Spice. McGraw-Hill, 1961, p. 223.
Berkner, Lloyd V . ; and C d i s h a w , Hugh, eds.
2. McDonald, Frank B. , ed. : Solar Proton Manual. NASA TR R-169, 1963.
3. McCoy, T.M.; and Coop, W. H.: Handbook of Aerospace Environments and Missions. Northrop Space Laboratories, 1962.
(Contracted by Marshall Space Fl ight Center)
4. Chapman, Sydney: Notes on the Solar Corona and the Terrestrial Ionosphere. Smithsonian Contributions t o Astrophysics, vol . 2 . , Smithsonian I n s t i t u t i o n , Wash. , D. C .
5 . Parker, E. N.: The Interplanetary Gas and Magnetic Fields. Science i n Space. Berkner, Lloyd V. ; and Cdishaw, Hugh, eds. McGraw-Hill, 1963, p. 234.
6.
7.
A.
9.
10.
11.
12.
13.
Mariner Mission t o Venus. J e t Propulsion Laboratory. McGraw-Hill Book Company, 1963.
Parker, E. N . : The Solar Wind. Sc ien t i f ic American, April , 1964.
.Tohnson, Francis S. : S a t e l l i t e Environment Handbook. Lockheed Aircraf t Co., Missiles and Space Division. Stanford University Press , 1961.
Allen, C. W. : Astrophysical Quant i t ies , Second Edition. Univ. of London, Athlone Press, 1963, p. 169.
Handbook of Geophysics. United States A i r Force. The Macmillan CO., 1961, pp 16 - 1 t o 17 - 7.
B e m n , Arthur 1.: The Physical Pr inciples of Astronautics. John Wiley and Sons, Inc. , e. 1961, p. 146.
Ballinger, John C . ; and Christensen, Emmet H. : Environmental Control Study of Space Vehicles, Par t s I and 11. General Dynamics, Astro- naut ics , 1961.
Kuiper, Gerard P.: The Atmospheres of the Earth and Planets. Rev. ed. University of Chicago Press, 1957, p. 308.
44
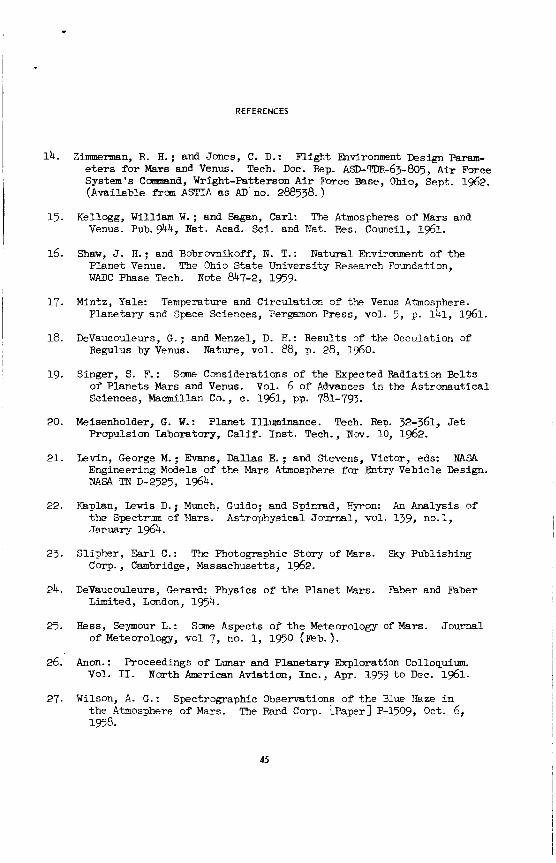
REFERENCES
14. Zimmennan, R . H. ; and Jones, C. D.: Flight Favironment Design param- eters fo r Mars and Venus. Tech. Doc. Rep. ASD-m-63-805, fir Force System's Cormnand, Wright-Patterson A i r Force Base, Ohio, Sept. 1962. (Available from ASTIA a s AD no, 288538.)
15. Kellogg, W i l l i a m W.; and Sagan, C a r l : The Atmospheres of Mars and Venus. Pub.94, N a t . Acad. Sci. and R a t . R e s . Council, 1961.
16. S a w , J. H. ; and Bobrwnikoff, N. T.: Natural Envirmrent of the I
Planet Venus. WADC Phase Tech.
The Ohio S ta te University Research Foundation, mute 847-2, 1959.
17. Mintz, Yale: Temperature and Circulation of the Venus Atmosphere. Planetary and Space Sciences, Pergamon Press, vol. 5 , p. 141, 1961.
18. DeVaucouleurs, G. ; and Menzel, D. H.: Results of the Occulation of Regulus by Venus. Nature, vol. 88, p. 28, 1960.
19. Singer, S. F.: Scane Considerations of' the Expected Radiation Belts of Plenets Mars and Venus. Vol . 6 of Advances i n the Astronautical Sciences, Macmillan Co., c. 1961, pp. 781-793.
20. Meisenholder, G. W.: Planet Illuminance. Tech. Rep. 32-361, J e t Propulsion hbora to ry , C a l i f . Tnst. Tech., A w . 10, 1962.
21. k v i n , George M. ; Evans, Dallas E. ; and Stevens, Victor, eds: NASA Engineering Models of the Mars Atmosphere for Entry Vehicle Design. NASCL T E D-2525, 1964.
22. Kaplan, Lewis D.; Munch, Guido; and Spinrad, tyror,: Pa Analysis of the Spectrum of Mars. Astrophysical Jou rna l , vol. 139, no.1, .Tanuary 1964.
23. Slipher, E a r l C.: The Photographic Story of Mars. Sky Publishing Co-rp., Cambridge, Massachusetts, 1962.
24. DeVaucouleurs, Gerard: Physics of' the Planet Mars. Bber and mber Limited, London, 1954.
25. H e s s , Seymour L.: Soloe Aspects of t h e Meteorology of Mars. Journal of Meteorology, vo l 7, no. 1, 1950 (Feb.).
26. Anon.: Proceedings of ~unar and Planetary Exploration colloquium. North American Aviation, Inc. , Apr. 1959 t o Dec. 1961. VOl. 11.
27. Wilson, A. G.: Spectrographic Observations of the Blue Haze i n the Atmosphere of M a r s . The Rand Corp. [Paper] P-1509, Oct. 6, 198.
45
VENUS AND MARS NOMINAL NATURAL ENVIRONMENT
28. Goddard Space Fl ight Center Contributions t o t h e COSPAR Meeting, NASA TN-G-545, June, 1963.
29. Goody, Richard M . : The Atmosphere of Mars. Weather, vol . 12, 1957.
30. Yanm, G.: Model Calculations of the Martian Upper Atmosphere. Douglas Aircraf t Engineering Paper No. 1164, 1961.
31. Dollf’us, A , : V i s u a l and Photographic Studies of Planets a t P ic du Midi. Planets and S a t e l l i t e s . University of Chicago Press, 1961, pp. 534-571.
Ed. by Kuiper and Middlehurst,
32. Dollfus, Audouin: Photometric Study of the Dark Areas on the Sur- face of the Planet Mars. Comptes Rendus, vo l . 244, 1957, pp. 1458- 1460. (Trans. f r o m the FYench.)
33. Sinton, W i l l i a m M . : Further Evidence of Vegetation on Mars. Science 130 (3384). Nov. 6, 1959.
34. Miyamoto, S.: Erosion on the Surface of Mars. The St ro l l ing Astronomer, vol. 15, no. 1-2, Jan.-Feb., 1961, pp. 23-26.
35. Gifford, Frank, Jr.: me Surface-Temperature Climate of Mars. Astrophysical Journal, vol . 123, Jan. -May, 1956.
36. Schill ing, G. F. : Limiting Model Atmospheres f o r Mars. R-402-JPL, The Rand Corp., Aug. 1962.
37. Kirby, Donna Scott: Sumnaary of Orbi ta l and Physical Data f o r the Planet Mars. m-2567, The Rand Corp., Aug. 1, 1960.
46