Evanescent-Wave Mirrors for Cold Atoms · This thesis studies elastic and inelastic mirrors for...
154
Evanescent-Wave Mirrors for Cold Atoms Dirk Voigt
Transcript of Evanescent-Wave Mirrors for Cold Atoms · This thesis studies elastic and inelastic mirrors for...
Evanescent-Wave Mirrors
for Cold Atoms
Dirk Voigt

ISBN 90-6464-438-1
This thesis studies elastic and inelastic mirrors for atoms,based on the repelling optical potential from an evane-scent wave in the vicinity of a surface. Light scattering by
cold (10 K) rubidium atoms bouncing at normal in-cidence on such mirrors was investigated experimentally.It was observed as sideward radiation pressure exertedon elastically bouncing atoms. Inelastic bounces as aconsequence of optical hyperfine pumping
. The inelastic process could be used as aloading mechanism for low-dimensional optical traps,possibly leading to a low-dimensional quantum gas. Newprospects to reduce light scattering of trapped atoms,using dark states in circularly-polarised evanescent-waves, are discussed.
were alsoobserved

Evanescent-Wave Mirrors
for
Cold Atoms


Evanescent-Wave Mirrors
for
Cold Atoms
ACADEMISCH PROEFSCHRIFT
ter verkrijging van de graad van doctor
aan de Universiteit van Amsterdam,
op gezag van de Rector Magnificus
prof. dr. J.J.M. Franse
ten overstaan van een door het college voor promoties ingestelde
commissie, in het openbaar te verdedigen in de Aula der Universiteit
op maandag 18 december 2000 te 15:00 uur
door
Dirk Voigt
geboren te Tubingen

Promotor: prof. dr. H.B. van Linden van den HeuvellCo-promotor: dr. R.J.C. Spreeuw
Commissie: dr. T.W. Hijmansprof. dr. W. Hogervorstprof. dr. J.A. Schoutenprof. dr. G.V. Shlyapnikovprof. dr. P. van der Stratenprof. dr. J.T.M. Walraven
Faculteit der Natuurwetenschappen, Wiskunde en Informatica
The work described in this thesis was part of the research program of the“Stichting voor Fundamenteel Onderzoek der Materie” (FOM),
which is financially supported by the“Nederlandse Organisatie voor Wetenschappelijk Onderzoek” (NWO),
and was carried out at the
Van der Waals-Zeeman InstituutUniversiteit van Amsterdam
Valckenierstraat 651018 XE Amsterdam
A limited number of copies of this thesis is available at this address.
ISBN 90-6464-438-1

fur meine Eltern
Sieglinde und Edgar


Contents
1 General introduction 9
1.1 Atom optics and laser cooling . . . . . . . . . . . . . . . . . . . . . . 9
1.2 Quantum gases . . . . . . . . . . . . . . . . . . . . . . . . . . . . . . 10
2 A low-dimensional quantum gas by means of dark states 13
2.1 Introduction . . . . . . . . . . . . . . . . . . . . . . . . . . . . . . . . 14
2.2 Evanescent-wave mirrors . . . . . . . . . . . . . . . . . . . . . . . . . 15
2.3 Generic trap loading scheme . . . . . . . . . . . . . . . . . . . . . . . 18
2.4 Loading a low dimensional trap . . . . . . . . . . . . . . . . . . . . . 202.5 Photon scattering . . . . . . . . . . . . . . . . . . . . . . . . . . . . . 24
2.6 Circularly-polarised evanescent waves . . . . . . . . . . . . . . . . . . 26
2.7 Conclusion . . . . . . . . . . . . . . . . . . . . . . . . . . . . . . . . . 30
3 Experimental setup 31
3.1 Overview . . . . . . . . . . . . . . . . . . . . . . . . . . . . . . . . . . 323.2 Atomic species — rubidium . . . . . . . . . . . . . . . . . . . . . . . 32
3.3 Ultra-high vacuum system . . . . . . . . . . . . . . . . . . . . . . . . 33
3.4 Optical access to the UHV system . . . . . . . . . . . . . . . . . . . . 37
3.5 Semiconductor lasers for cooling and trapping . . . . . . . . . . . . . 43
3.6 Real-time experimental control . . . . . . . . . . . . . . . . . . . . . 55
3.7 The magneto-optical trap . . . . . . . . . . . . . . . . . . . . . . . . 58
4 A high-power tapered semiconductor amplifier system 69
4.1 Introduction . . . . . . . . . . . . . . . . . . . . . . . . . . . . . . . . 70
4.2 Amplifier setup . . . . . . . . . . . . . . . . . . . . . . . . . . . . . . 71
4.3 Unseeded operation of the amplifier . . . . . . . . . . . . . . . . . . . 74
4.4 Amplification of a seed beam . . . . . . . . . . . . . . . . . . . . . . . 75
4.5 Spatial and spectral filtering using an optical fibre . . . . . . . . . . . 774.6 Variations of individual gain elements . . . . . . . . . . . . . . . . . . 79
4.7 Far off-resonance dipole potentials with spectral background . . . . . 80
4.8 Conclusions . . . . . . . . . . . . . . . . . . . . . . . . . . . . . . . . 81
5 The evanescent-wave atom mirror 83
5.1 Introduction . . . . . . . . . . . . . . . . . . . . . . . . . . . . . . . . 845.2 Fraction of bouncing atoms . . . . . . . . . . . . . . . . . . . . . . . 84
5.3 Time-of-flight detection of bouncing atoms . . . . . . . . . . . . . . . 88
5.4 Investigation of bouncing atoms . . . . . . . . . . . . . . . . . . . . . 91
5.5 Conclusions . . . . . . . . . . . . . . . . . . . . . . . . . . . . . . . . 96
7

8 CONTENTS
6 Radiation pressure exerted by evanescent waves 976.1 Introduction . . . . . . . . . . . . . . . . . . . . . . . . . . . . . . . . 986.2 Photon scattering by bouncing atoms . . . . . . . . . . . . . . . . . . 986.3 Observation of bouncing atoms . . . . . . . . . . . . . . . . . . . . . 996.4 The observation of radiation pressure . . . . . . . . . . . . . . . . . . 1026.5 Conclusions . . . . . . . . . . . . . . . . . . . . . . . . . . . . . . . . 108
7 Inelastic evanescent-wave mirrors 1097.1 Introduction . . . . . . . . . . . . . . . . . . . . . . . . . . . . . . . . 1107.2 Principle of inelastic evanescent-wave mirrors . . . . . . . . . . . . . . 1117.3 Configuration of the inelastic mirror . . . . . . . . . . . . . . . . . . . 1127.4 Observation of inelastically bouncing atoms . . . . . . . . . . . . . . 1147.5 Conclusions . . . . . . . . . . . . . . . . . . . . . . . . . . . . . . . . 118
A Appendix 119A.1 Useful atom-optical numbers for 87Rb . . . . . . . . . . . . . . . . . . 119A.2 Fresnel coefficients for evanescent waves . . . . . . . . . . . . . . . . . 120A.3 Light forces and scattering rate . . . . . . . . . . . . . . . . . . . . . 121A.4 Analysis of absorption images . . . . . . . . . . . . . . . . . . . . . . 126
References 127
Summary 137
Samenvatting / Zusammenfassung 139
Nawoord 149
Curriculum Vitae / Publications 151

1General introduction
1.1 Atom optics and laser cooling
The motion of neutral atoms can be manipulated by laser light. Similar to opticalelements for light, “atom optical” mirrors, lenses, gratings or beamsplitters can berealised for atomic matter waves [1].
Light forces on atoms are commonly classified as “dipole forces” and “sponta-neous forces” [2]. The dipole force results from the interaction of the electromagneticfield with the induced electric dipole of an atom and can be described by an opticalpotential, also called “light-shift” potential. This corresponds to the refractive indexof a dielectric medium in optics. The spontaneous force is based on the absorptionof photons from a preferential direction, such that the related photon recoils repre-sent the force. Because of the involved spontaneous emission processes this force isdissipative.
Of particular interest are evanescent waves, which can form a mirror for atomsby the induced repelling optical potential. Such a mirror was proposed by Cook andHill [3] and was first demonstrated with an atomic beam at grazing incidence byBalykin et al. [4], and with cold atoms at normal incidence by Kasevich et al. [5].
An evanescent wave occurs when light undergoes total internal reflection, e.g. at aglass surface in vacuum [6,7]. On the dark side, the electric field decays exponentiallyaway from the surface. The property that makes such a wave particularly usefulfor atom optics, as compared to freely propagating beams, is the characteristicdecay length which can be less than the optical wavelength. Atoms are quickly(∼ µs) reflected by a steep potential. Of course, compared to the typical refractiveindex step for, say, a (partially) light transmitting window, an evanescent-wavepotential is relatively smooth: the atomic DeBroglie wavelength ranges usuallybetween 10− 100 nm.
This thesis investigates the light scattering by cold (10 µK) rubidium atoms(87Rb) in the optical potential of an evanescent-wave mirror. The atoms bounce atnormal incidence either elastically or inelastically from such a mirror. In case of anelastic mirror, we observed radiation pressure that is exerted on the atoms by theevanescent wave. Since the evanescent wave propagates only along the glass surface,also the radiation pressure is expected to be directed parallel to the surface (seechapter 6). The inelastic mirror is the consequence of optical hyperfine pumping
9
10 General introduction
of bouncing atoms (see chapter 7). Such a dissipative atom-optical element hasno analogy in optics.
A striking consequence of dissipation is that it allows to cool atoms with laserlight. This was proposed in 1975 by Hansch and Schawlow [8], and by Winelandand Dehmelt [9]. When cooling atoms to a few µK, they are also sufficiently slow(a few cm/s) to be bound in optical traps [10]. In the past years vast progress inlaser cooling and trapping has taken place, see the reviews [11,12] or the 1997 Nobelprize lectures of Chu, Cohen-Tannoudji and Phillips [13–15].
Due to dissipation, the inelastic evanescent-wave mirrors investigated in thisthesis are closely related to reflection cooling of atoms by evanescent waves, whichwas demonstrated by Laryushin et al. [16] and used by Ovchinnikov et al. [17] tocool atoms in a gravito-optical surface trap.
Various fields in fundamental and applied physics take benefit of the achieve-ments in atom optics and laser cooling. Examples are atom-interferometric mea-surements of the gravitational and finestructure constant, spectroscopy of atomsand molecules, cavity quantum electrodynamics (CQED), and ultracold atomic col-lisions [18–26]. Cold atoms are also used to model more complex systems, such asBloch states in solids [27, 28]. Prospected technical applications are atomic clocks,e.g. for navigational systems, atom lithography on the nm-scale, or quantum com-putational devices [29–32].
1.2 Quantum gases
The mentioned applications of cold atoms commonly employ incoherent, thermalsources of atoms. This might be an atomic beam evading from an oven and col-limated by diaphragms, or a cloud of cold atoms from a magneto-optical trap(MOT) [33]. Lasers [34] have triggered and improved many optical techniques sincethe first demonstration by Maiman [35] in 1960. Similarly, an “atom laser” as abright source of coherent matter waves may have a considerable impact on develop-ments in atom optics.
An atom laser requires the creation of “quantum gas” or, a “quantum degen-erate” gas. Quantum degeneracy requires that an ensemble of atoms is sufficientlydense and cold, such that the atomic wavefunctions overlap, i.e. the atomic separa-tion is less than the DeBroglie wavelength Λ ∝√1/T , where T is the temperature.The “phase-space” is the combined space of position and momentum coordinates.The phase-space density of a degenerate gas is thus Φ = nΛ3 1, where n is thespatial density. Equivalently, Φ describes the occupation number of a volume h3
per available quantum state in the phase-space of a system [36], where h is Planck’sconstant. For bosonic atoms (with integer spin quantum number), degeneracy leadsto the formation of a Bose-Einstein condensate (BEC), in which a single quantumstate is macroscopically occupied by indistinguishable atoms.
BEC was predicted already in 1924 [36,37]. It is understood as a consequence ofthe bosonic quantum statistics that is employed instead of the classical Boltzmannstatistics in the case of a degenerate gas. Efforts to achieve BEC in dilute, weakly
1.2 Quantum gases 11
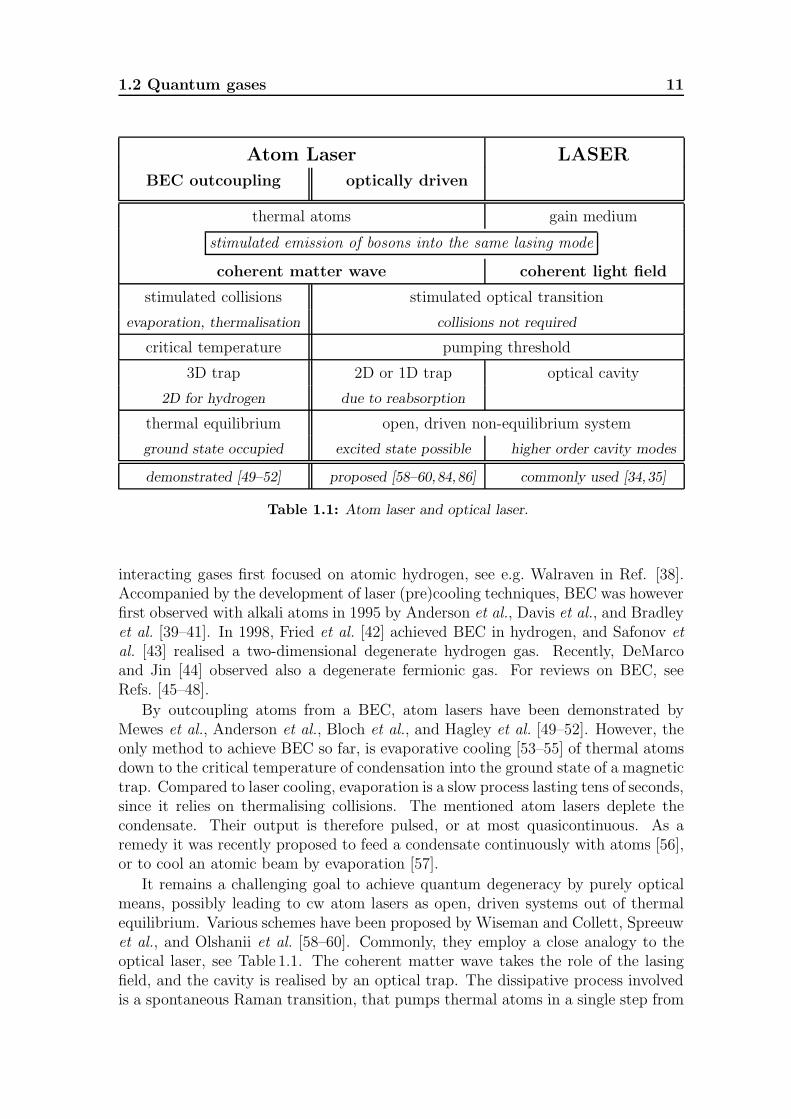
Atom Laser LASER
BEC outcoupling optically driven
thermal atoms gain medium
stimulated emission of bosons into the same lasing mode
coherent matter wave coherent light field
stimulated collisions stimulated optical transition
evaporation, thermalisation collisions not required
critical temperature pumping threshold
3D trap 2D or 1D trap optical cavity
2D for hydrogen due to reabsorption
thermal equilibrium open, driven non-equilibrium system
ground state occupied excited state possible higher order cavity modes
demonstrated [49–52] proposed [58–60,84,86] commonly used [34,35]
Table 1.1: Atom laser and optical laser.
interacting gases first focused on atomic hydrogen, see e.g. Walraven in Ref. [38].Accompanied by the development of laser (pre)cooling techniques, BEC was howeverfirst observed with alkali atoms in 1995 by Anderson et al., Davis et al., and Bradleyet al. [39–41]. In 1998, Fried et al. [42] achieved BEC in hydrogen, and Safonov etal. [43] realised a two-dimensional degenerate hydrogen gas. Recently, DeMarcoand Jin [44] observed also a degenerate fermionic gas. For reviews on BEC, seeRefs. [45–48].
By outcoupling atoms from a BEC, atom lasers have been demonstrated byMewes et al., Anderson et al., Bloch et al., and Hagley et al. [49–52]. However, theonly method to achieve BEC so far, is evaporative cooling [53–55] of thermal atomsdown to the critical temperature of condensation into the ground state of a magnetictrap. Compared to laser cooling, evaporation is a slow process lasting tens of seconds,since it relies on thermalising collisions. The mentioned atom lasers deplete thecondensate. Their output is therefore pulsed, or at most quasicontinuous. As aremedy it was recently proposed to feed a condensate continuously with atoms [56],or to cool an atomic beam by evaporation [57].
It remains a challenging goal to achieve quantum degeneracy by purely opticalmeans, possibly leading to cw atom lasers as open, driven systems out of thermalequilibrium. Various schemes have been proposed by Wiseman and Collett, Spreeuwet al., and Olshanii et al. [58–60]. Commonly, they employ a close analogy to theoptical laser, see Table 1.1. The coherent matter wave takes the role of the lasingfield, and the cavity is realised by an optical trap. The dissipative process involvedis a spontaneous Raman transition, that pumps thermal atoms in a single step from

12 General introduction
a reservoir into the trap. At the onset of degeneracy, i.e. the lasing threshold, thefeeding of the lasing mode becomes a stimulated process, due to the bosonic natureof the atoms. A related type of matter-wave amplification was demonstrated byInouye et al. [61] using samples of condensed atoms from a BEC.
An optical trap loading scheme is independent from collisional properties andmay also work for species with an unsuitably small s-wave scattering length forevaporative cooling, see e.g. Refs. [62, 63].
Optical cooling schemes suffer from heating by reabsorbed photons [64–67] andfrom light-assisted collisional losses [68, 69]. The phase-space density in a MOTwith optical molasses cooling [70,71] is therefore limited to Φ 10−4 [69,72–74]. Abreakthrough was achieved with Raman sideband cooling [75–78] of atoms that weretightly confined at the sites of an optical lattice [79, 80]. Han et al. [78] reportedΦ ≈ 1/30 using this technique. An even larger density of Φ ≈ 0.1 was achieved byIdo et al. [81] with Doppler-cooled strontium atoms using a spin-forbidden opticaltransition. This extremely narrow transition reduces the photon reabsorption.
To overcome the limitations of cooling in a trap, the optical atom laser schemes[58–60] attempt to use a single dissipative trap loading process to bridge the gap inphase space density between a precooled sample and a degenerate sample. Severalspecific schemes were proposed [82–87], which employ a low-dimensional trappinggeometry, such that photons can escape into a large solid angle without reabsorption.In particular, it was proposed [82–84,87] to employ optical pumping of atoms at theirturning point on an evanescent-wave mirror to load a low-dimensional trap in thevicinity of a surface.
Low-dimensional quantum gases are also of conceptual interest for the under-standing of phase transition phenomena [43, 45, 88, 89] such as, e.g., the predictedKosterlitz-Thouless transition in two dimensions [90]. Furthermore a source of coldatoms in the vicinity of a surface may be a valuable tool in the emerging field ofguiding atoms along surfaces (“integrated atom optics”) [91–94].
Gauck et al. [86] demonstrated a first realisation of evanescent-wave trap loadingusing metastable argon atoms. This species suffers, however, from Penning ionisa-tion losses [95,96]. Chapter 2 of this thesis describes our own proposal, extending thetrapping scheme to be applicable also with alkali atoms and, more specifically, with87Rb. “Dark states” in circularly-polarised evanescent-waves are proposed to reducethe scattering rate of trapped atoms by several orders in magnitude. The highly spa-tially selective pumping by an evanescent wave can be matched to a tightly confiningtrap [83]. Understanding and control of photon scattering by bouncing atoms, istherefore necessary to optimise the efficiency and reduce losses of these trap loadingschemes.
In chapter 5, basic properties of our evanescent-wave mirror are characterised,such as the effective mirror surface. Also the influence of the Van der Waals attrac-tion between atoms and glass surface is discussed. The chapters 6 and 7 describedifferent aspects of photon scattering by evanescent waves.

2A low-dimensional quantum gas
by means of dark states in an
inelastic evanescent-wave mirror
An experimental scheme to create a low-dimensional gas of coldatoms is discussed, based on inelastic bouncing of cold atoms onan evanescent-wave mirror. Close to the turning point on the mir-ror, atoms are transferred into an optical dipole trap. This schemecan compress the phase-space density and may ultimately yield anoptically-driven “atom laser”. An important issue is the suppres-sion of photon scattering due to “cross-talk” between the mirrorpotential and the trapping potential. It is proposed that for alkali-metal atoms the photon scattering rate can be suppressed by severalorders of magnitude if the atoms are decoupled from the evanes-cent wave. It is discussed how such dark states can be achieved bymaking use of circularly-polarised evanescent waves.
This chapter is based on the publication
R.J.C. Spreeuw, D. Voigt, B.T. Wolschrijn, and H.B. van Linden van den Heuvell,Phys. Rev. A 61, 053604 (2000).
13
14 A low-dimensional quantum gas by means of dark states
2.1 Introduction
The only route to quantum degeneracy in a dilute atomic gas which has been ex-perimentally successful so far [39–44] is evaporative cooling [53–55]. Other routesto quantum degeneracy, in particular all-optical methods, have been elusive untilnow. Nevertheless it is interesting as well as important to keep exploring alterna-tive methods which do not rely on atomic collisions. Such systems may be heldaway from thermal equilibrium and may therefore constitute a closer matter-waveanalogy to the optical laser, as compared to “atom lasers” based on Bose-Einsteincondensation [49–52]. In addition, the physics will be quite different because a dif-ferent physical, viz. optical, interaction would be used to populate the macroscopicquantum state: the amplification of a coherent matter wave while emitting photons(cf. Ref. [61]).
Several proposals for an optically-driven atom laser have previously been pub-lished. They have in common that a macroscopic quantum state is populated usingan optical Raman transition [58–60]. Note that also atom laser schemes were pro-posed [97–99] which make use of binary atomic collisions, i.e. evaporative cooling.For an overview of the various proposed schemes, see e.g. Ref. [48].
One problem that has been anticipated from the beginning, is heating and traploss caused by reabsorption of the emitted photons [64–66, 68]. Therefore laterproposals [82–85] and current experiments [17, 86] have aimed at a reduced dimen-sionality, based on optical pumping close to a surface. At the same time, there isalso increasing interest in the low-dimensional equivalents of Bose-Einstein conden-sation in cold gases [43]. A trap close to a surface is also very interesting from theviewpoint of cavity QED [25]. The proximity of a dielectric surface can change theradiative properties of an atom [100], and for circularly-polarised evanescent wavesit has been predicted that the radiation pressure (see Chap. 6) is not parallel to thePoynting vector [101].
In this chapter, it is argued that an evanescent-wave mirror is particularly promis-ing for loading a low-dimensional trap close to a surface. Previous work [59, 60] isextended so that it can be applied to the alkali-metal atoms. Since these are favouriteatoms for laser cooling, the application to alkali-metal atoms will make these kindsof experiments more easily accessible. In comparison to previous experiments withmetastable noble gas atoms [86], the alkali metals have the advantage that they donot suffer from Penning ionisation [95,96]. Furthermore, several alkali-metal specieshave been cooled to the Bose-Einstein condensation, which makes them good can-didates to create low-dimensional quantum degeneracy also. The extension to thealkali metals is nontrivial because the splitting between the hyperfine ground statesis not large enough to address them separately with far detuned lasers. The re-sulting “cross-talk” would lead to large photon scattering rates in the trap, as isexplained below. It is proposed to use circularly-polarised evanescent waves and totrap alkali-metal atoms in “dark states”. This allows the detuning to be increasedand the photon scattering rate to be reduced by several orders of magnitude.

2.2 Evanescent-wave mirrors 15
2.2 Evanescent-wave mirrors
As an introductory excursion, this section describes the phenomenon of evanescentwaves and, in particular, the amplitude and polarisation properties of such opticalwaves. Cook and Hill [3] proposed to use an evanescent wave as a mirror for slowneutral atoms, based on the “dipole force”. Evanescent-wave mirrors have sincebecome an important tool in atom optics [1]. They have been demonstrated foratomic beams at grazing incidence [4] and for cold atoms at normal incidence [5].
2.2.1 Evanescent waves
An evanescent wave appears whenever an electromagnetic wave undergoes totalinternal reflection (TIR) at a dielectric interface [6,7]. If we consider such an interfacebetween two dielectrics, a light wave incident on the interface is usually partlyreflected. In “internal” reflection the light is reflecting off the medium with lowerrefractive index, see Fig. 2.1(a). In our experiments this is a glass surface in vacuum.When the angle of incidence, θi, relative to the surface normal exceeds the criticalangle, θc = arcsin(n−1), the reflection coefficient is unity, i.e. all light is reflected.For example, the BK7 glass prism used in our experiments has a refractive indexn = 1.511 for the rubidium lines at 780 nm and 795 nm wavelength. The criticalangle is thus 41.44, or 0.7232 rad. Although no light propagates into the vacuum,TIR gives rise to an electric field in the vacuum close to the glass surface. This“evanescent wave” decays exponentially with the distance from the surface on alength scale of the order of the reduced optical wavelength λ0/2π = 1/k0, wherek0 = ω/c is the vacuum wave number.
The evanescent wave can be understood from Maxwell’s equations with momen-tum conservation along the surface. We consider a monochromatic wave,
E(r, t) =1
2ε E exp[i(k · r− ωLt)] + c.c. , (2.1)
with wave vector k and frequency ωL. The complex polarisation vector is denotedas ε and the field amplitude is E . The z-direction is taken as surface normal andkx is assumed to be the wave-vector component parallel to the surface (ky = 0).Maxwell’s equations, expressed as wave equation for the electric field, require on thevacuum side of the surface:
∇2E =1
c2∂2E
∂t2=⇒ k2x + k2z = k20 . (2.2)
Translational invariance of the surface implies momentum conservation in thex-direction, that is conservation of kx:
kx = k0 n sin θi . (2.3)
In TIR, due to kx > k0, the normal wave-vector component kz is complex imaginary:
kz = i κ , κ = k0√
n2 sin2 θi − 1. (2.4)

16 A low-dimensional quantum gas by means of dark states
The electric field thus decays exponentially away from the surface, E ∝ exp(−κ z).Fig. 2.1(b) shows the decay length ξ(θi) = 1/κ(θi) as a function of the angle θi.
In Fig. 2.1(a), the two fundamental linear polarisation vectors of the incidentwave are assigned as si and pi. In the s, or TE mode, the electric field vector isdirected in the y-direction, perpendicular to the xz-plane of incidence. In the p,or TM mode, the electric field vector is in the plane of incidence. The polarisationvectors of the evanescent wave are assigned as st and pt. From the amplitudes of theincident field, Es,i and Ep,i, the corresponding amplitudes of the evanescent wave, Es,tand Ep,t, are calculated using the same expressions for the Fresnel coefficients as for apropagating wave that would be transmitted trough a dielectric interface. However,the “transmission” angle θt is complex in TIR. The Fresnel transmission coefficientstj for the two polarisation modes, j = s, p = TE,TM, and the polarisationvectors are listed in the Appendix A.2.
The intensity of the incident (and reflected) beam, which propagates insidethe glass substrate, is expressed as Ij,i = (1/2)nε0c |Ej,i|2. An effective “inten-sity” can also be defined at the glass surface (z = 0) for the evanescent wave,Ij,t = (1/2)ε0c |Ej,t|2. The transmittance, i.e. the intensity ratios Tj = Ij,t/Ij,i, areTp = (1/n)t∗ptp (p
∗t · pt) and Ts = (1/n)t∗s ts, for p and s polarisation, respectively.
Note that p∗t · pt > 1 for the p polarisation vector, whereas the corresponding ex-
pression for the s polarisation, s∗t · st = 1, drops out.In our experiments, we use an uncoated right-angle prism. Since the evanescent-
wave angle of incidence is close to the critical angle, the laser beam with intensity ILis almost normally incident on the hypotenuse of the prism. The transmittance intothe prism, TL = Ij,i/IL, is here independent of the polarisation and approximatedfor normal incidence by TL ≈ 4n/(n+ 1)2 = 0.96. The evanescent-wave intensity isthus enhanced above the laser intensity IL by a factor Tj = Ij,t/IL = TLTj:
TTM = TL4n cos2 θi (2n
2 sin2 θi − 1)
cos2 θi + n2(n2 sin2 θi − 1), (2.5)
TTE = TL4n cos2 θin2 − 1
. (2.6)
2.2.2 The evanescent-wave as a mirror for atoms
The evanescent-wave dipole, or “light-shift” potential for a two-level atom at adistance z above the surface can be written as (see AppendixA.3 and Ref. [2]):
Udip(z) = U0 exp(−2κz) , (2.7)
U0 =1
2s0 δ . (2.8)
The maximum potential at the prism surface, U0, is written here in the limit of largelaser detuning, |δ| Γ, and low saturation, s0 1. The saturation parameter isapproximated as
s0 (
Γ
2δ
)2TjILI0
. (2.9)
2.2 Evanescent-wave mirrors 17
(a) (b)
EW
sp
n
p
s
i
t
t
i
i
z
xy
0 10 20 30 40 500
1
2
3
angle i-
c(mrad)
deca
yle
ngth
(
m)
0.6 1.1 1.7 2.3
degrees
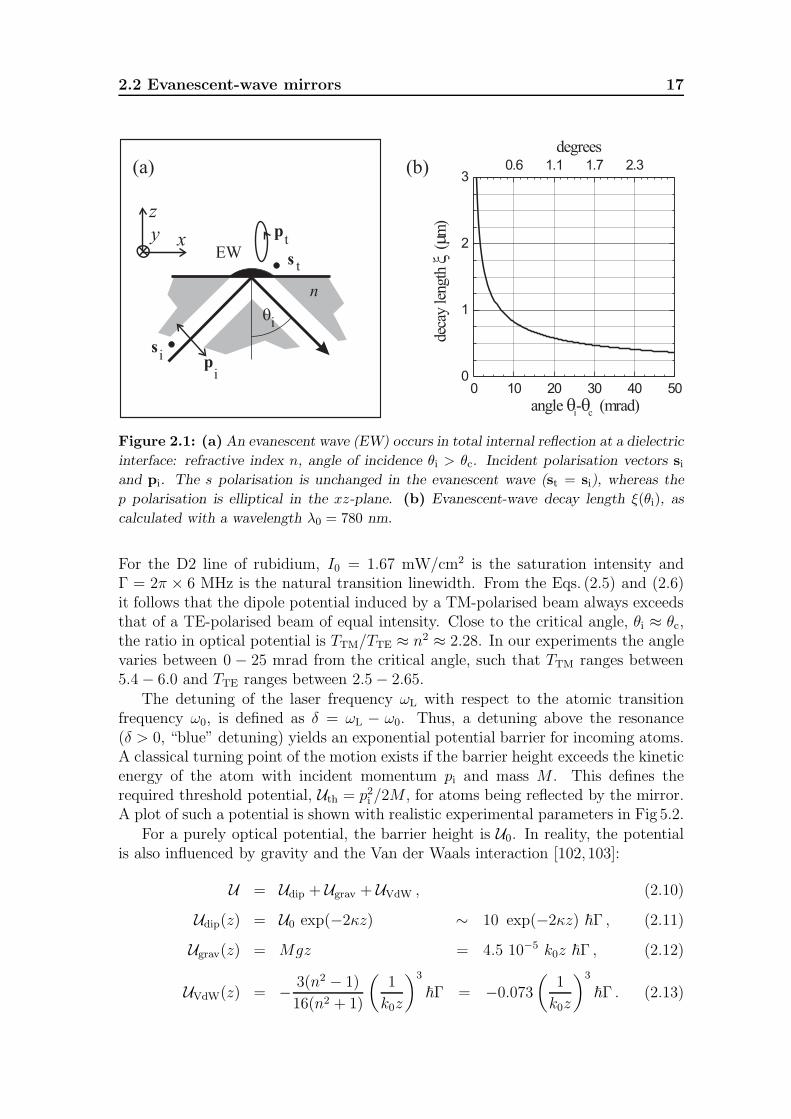
Figure 2.1: (a) An evanescent wave (EW) occurs in total internal reflection at a dielectric
interface: refractive index n, angle of incidence θi > θc. Incident polarisation vectors siand pi. The s polarisation is unchanged in the evanescent wave (st = si), whereas the
p polarisation is elliptical in the xz-plane. (b) Evanescent-wave decay length ξ(θi), ascalculated with a wavelength λ0 = 780 nm.
For the D2 line of rubidium, I0 = 1.67 mW/cm2 is the saturation intensity andΓ = 2π × 6 MHz is the natural transition linewidth. From the Eqs. (2.5) and (2.6)it follows that the dipole potential induced by a TM-polarised beam always exceedsthat of a TE-polarised beam of equal intensity. Close to the critical angle, θi ≈ θc,the ratio in optical potential is TTM/TTE ≈ n2 ≈ 2.28. In our experiments the anglevaries between 0 − 25 mrad from the critical angle, such that TTM ranges between5.4− 6.0 and TTE ranges between 2.5− 2.65.
The detuning of the laser frequency ωL with respect to the atomic transitionfrequency ω0, is defined as δ = ωL − ω0. Thus, a detuning above the resonance(δ > 0, “blue” detuning) yields an exponential potential barrier for incoming atoms.A classical turning point of the motion exists if the barrier height exceeds the kineticenergy of the atom with incident momentum pi and mass M . This defines therequired threshold potential, Uth = p2i /2M , for atoms being reflected by the mirror.A plot of such a potential is shown with realistic experimental parameters in Fig 5.2.
For a purely optical potential, the barrier height is U0. In reality, the potentialis also influenced by gravity and the Van der Waals interaction [102,103]:
U = Udip + Ugrav + UVdW , (2.10)
Udip(z) = U0 exp(−2κz) ∼ 10 exp(−2κz) Γ , (2.11)
Ugrav(z) = Mgz = 4.5 10−5 k0z Γ , (2.12)
UVdW(z) = − 3(n2 − 1)
16(n2 + 1)
(1
k0z
)3Γ = −0.073
(1
k0z
)3Γ . (2.13)

18 A low-dimensional quantum gas by means of dark states
The gravitational potential can be neglected on the length scale of the evanescent-wave decay length. In contrast, the Van der Waals interaction significantly lowersthe potential maximum close to the prism surface. Thus, in combination with theGaussian transverse intensity profile of the evanescent wave, the Van der Waalsinteraction decreases the effective mirror surface on which atoms can bounce. Thiseffect was experimentally investigated previously by Landragin et al. [103] and isdiscussed also in Chap. 5.
2.3 Generic trap loading scheme
2.3.1 An optical trap loaded by a spontaneous Raman
transition
In the following, the generic idea of loading an optical atom trap by an optical(Raman) transition is briefly reviewed. The original proposal described in Ref. [59]is based on a Λ-type configuration of three atomic levels, which are indicated hereby |t〉, |b〉 and |e〉, as shown in Fig. 2.2. The levels |t〉 and |b〉 for “trapping” and“bouncing” state, respectively, are electronic ground (or metastable) states, |e〉 is anelectronically excited state. An optical trap is created for atoms in level |t〉 using theoptical dipole potential induced by a far off-resonance laser (see e.g. Refs. [10,104]).Level |b〉 serves as a reservoir of cold atoms, prepared by laser cooling. The coldatoms are transferred from the reservoir into the trap by a spontaneous Ramantransition |b〉 → |e〉 → |t〉.
The goal is to load a large number of atoms into a single bound state |t, ν〉 of thetrapping potential, where ν is the vibrational quantum number. If the atoms arebosons, the transition probability into state |t, ν〉 should be enhanced by a factor 1+Nν , where Nν is the occupation of the final state |t, ν〉. If the rate at which atoms arepumped from |b〉 to |t〉 exceeds a threshold value, the buildup of atoms in |t, ν〉 shouldrapidly increase. The Raman filling process can thus be stimulated by the matterwave in the trapped final state, leading to matter-wave amplification [61]. Theassociated threshold is reached when, for some bound state |t, ν〉, the unenhancedfilling rate exceeds the unavoidable loss rate. The threshold can be lowered eitherby decreasing the loss rate or by increasing the overlap of wave functions (“Franck-Condon factor”).
Ideally, the energy separation between states |t〉 and |b〉 should be so large thatthey can be addressed separately by different lasers. Examples are alkali-metal atomsor metastable noble gas atoms. The loading scheme has been applied successfullyto load metastable argon atoms into a far off-resonance lattice [105] and into aquasi-two-dimensional planar matter waveguide [86]. The two metastable states ofAr∗ are separated by 42 THz. This chapter focuses on 87Rb atoms, which are usedin our experiments. Here the separation between the two hyperfine ground statesFg = 1, 2 is only δGHF = 6.8 GHz (see Figs. 2.2(b) and 3.7). This requires amodification of the scheme as is discussed below.
2.3 Generic trap loading scheme 19
FORT
1
2
=0
tb
e
(a) (b)
F =1
F =2
F =0,1,2,3
b
e
t
FORTEW
pump
GHF
g
g
e
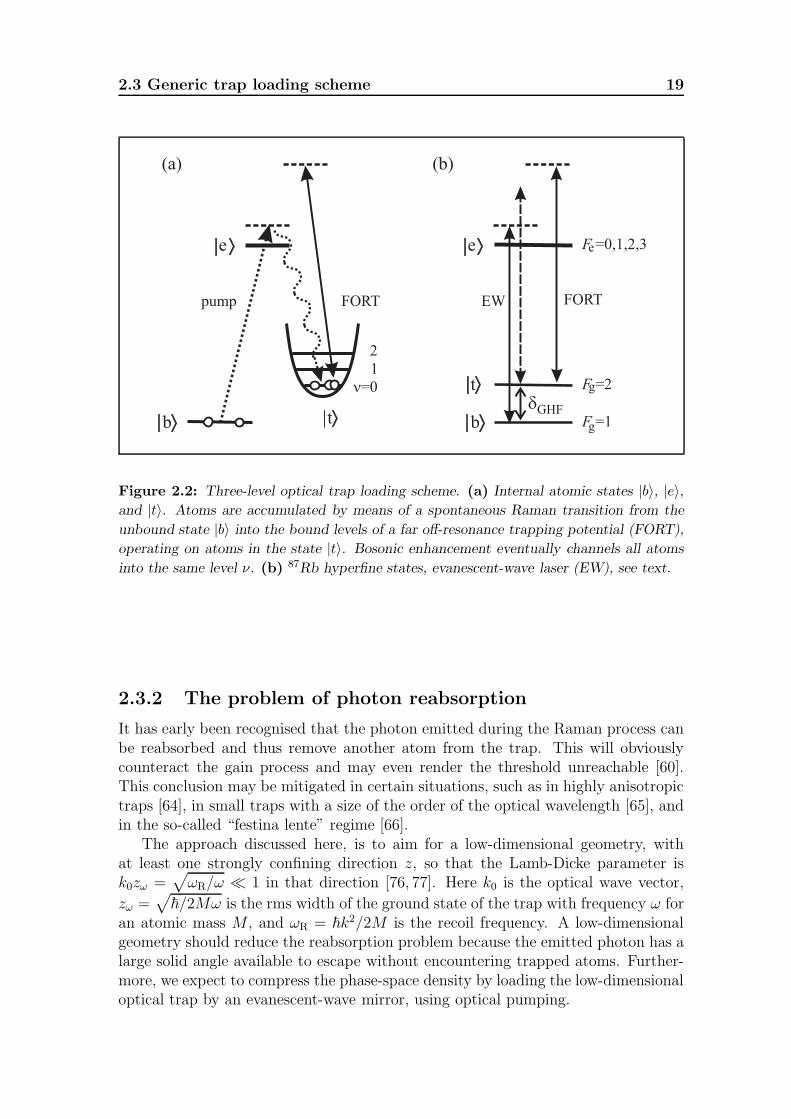
Figure 2.2: Three-level optical trap loading scheme. (a) Internal atomic states |b〉, |e〉,and |t〉. Atoms are accumulated by means of a spontaneous Raman transition from the
unbound state |b〉 into the bound levels of a far off-resonance trapping potential (FORT),
operating on atoms in the state |t〉. Bosonic enhancement eventually channels all atoms
into the same level ν. (b) 87Rb hyperfine states, evanescent-wave laser (EW), see text.
2.3.2 The problem of photon reabsorption
It has early been recognised that the photon emitted during the Raman process canbe reabsorbed and thus remove another atom from the trap. This will obviouslycounteract the gain process and may even render the threshold unreachable [60].This conclusion may be mitigated in certain situations, such as in highly anisotropictraps [64], in small traps with a size of the order of the optical wavelength [65], andin the so-called “festina lente” regime [66].
The approach discussed here, is to aim for a low-dimensional geometry, withat least one strongly confining direction z, so that the Lamb-Dicke parameter isk0zω =
√ωR/ω 1 in that direction [76, 77]. Here k0 is the optical wave vector,
zω =√
/2Mω is the rms width of the ground state of the trap with frequency ω foran atomic mass M , and ωR = k2/2M is the recoil frequency. A low-dimensionalgeometry should reduce the reabsorption problem because the emitted photon has alarge solid angle available to escape without encountering trapped atoms. Further-more, we expect to compress the phase-space density by loading the low-dimensionaloptical trap by an evanescent-wave mirror, using optical pumping.

20 A low-dimensional quantum gas by means of dark states
2.4 Loading a low dimensional trap
2.4.1 Inelastic evanescent-wave mirror
In the following the specific way is discussed in which the generic scheme from abovemay be realised in an experiment. Our implementation is based on an evanescent-wave mirror, using explicitly the level scheme of 87Rb atoms. The role of the states|t〉 and |b〉 is played by the two hyperfine sublevels of the ground state 5s 2S1/2(Fg = 1, 2), which are separated by δGHF = 6.8 GHz. We take the lower level,Fg = 1 as the “bouncing state” |b〉 and the upper level, Fg = 2, as the “trappingstate” |t〉, as illustrated in Fig. 2.2(b).
The considered configuration of laser beams is sketched in Fig. 2.3(a). An evanes-cent wave is generated by total internal reflection of a “bouncer” beam inside aprism. This bouncer is blue with respect to a transition starting from the Fg = 1ground state, with a detuning δ1. A second laser beam, the “trapper” beam, isincident on the prism surface from the vacuum side and is partially reflected fromthe surface. The reflected wave interferes with the incident wave to produce a setof planar fringes, parallel to the prism surface. Note that even with 4% reflectiv-ity of an uncoated glass surface (refractive index n = 1.5), the fringe visibility willbe V = (Imax − Imin)/(Imax + Imin) = 0.38, where Imax and Imin are the intensitymaxima and minima, respectively. Therefore a specific reflection coating may notbe necessary. Note that a possible coating must not inhibit the application of thebouncer beam.
The trapper beam can be either red or blue detuned, the former having theadvantage that it automatically provides also transverse confinement. In Fig. 2.3(b)the situation for blue detuning is sketched, confining the atoms vertically in theintensity minima, but allowing them to move freely in the transverse direction. Weassume that the loss rate due to moving out of the beam is slow compared to otherloss rates, such as that due to photon scattering. Alternatively, one can obtaintransverse confinement by using multiple trapper beams from different directions,which interfere to yield a lattice potential. Similarly, one can create an optical latticeusing multiple bouncer beams (see e.g. Fig. 2.6). Also an additional hollow beammay provide transverse confinement, as reported in Ref. [17].
Cold atoms, in the bouncing state Fg = 1, are dropped onto the prism and areslowed down by the repulsive light-shift potential induced by the bouncer beam [seeFig. 2.3(b)]. If the potential is strong enough, the atoms turn around before theyhit the prism and bounce back up. Thus, an evanescent-wave mirror, or “atomictrampoline” is formed.
We are here interested in interrupting the bouncing atoms halfway during thebounce, near the classical turning point. The interruption can occur when the atomscatters an evanescent-wave photon and makes a Raman transition to the otherhyperfine ground state, Fg = 2. This Raman transition yields a sudden changeof the optical potential, because for an atom in Fg = 2 the detuning is larger byapproximately the ground state hyperfine splitting δGHF. This mechanism has beenused for evanescent-wave reflection cooling [16, 17, 106].

2.4 Loading a low dimensional trap 21
(a) (b)87
trapper(FORT)
bouncer(EW)
Rb
z
pumping
trapping
bouncing
( =1)F
( =2)F
1 MHz
10 MHz
U z h( )/
z
g
g
Figure 2.3: Trap loading using an inelastic evanescent-wave mirror. (a) Geometry of
laser beams, incident on a vacuum-dielectric interface. (b) Corresponding potential curvesfor “bouncing” and “trapping” state for 87Rb (Fg = 1, 2). Cold atoms fall towards the
surface, where they are slowed down by the repulsive potential due to the evanescent
“bouncing” field. Near the turning point atoms undergo a spontaneous Raman transition
and become trapped in the optical potential of a standing “trapping” wave. The ripple
on the evanescent wave represents cross-talk from the standing wave (see text). The tick
mark at one-half the optical wavelength, λ0/2, indicates the typical length scale. The axis
break indicates the hyperfine splitting, δGHF = 6.8 GHz.
In our case, we tailor the potentials so that the bouncer potential dominates forFg = 1 and the trapper for Fg = 2. The atom is thus slowed down by the bouncerand then transferred into the trapping potential.
As long as the probability for undergoing a Raman transition during the bounceis not too large (P 1−e−2, see below), the transition will take place predominantlynear the turning point, for two reasons. First, the atoms spend a relatively long timenear the turning point. Secondly, the intensity of the optical pump (the evanescentwave) is highest in the turning point. The probability that the atoms end up inthe lowest bound state of the trapping potential has been estimated to be on theorder of 10− 20%, albeit for somewhat different geometries [82, 83]. The resultingcompression of a three-dimensional cloud into two dimensions is in fact dissipativeand can therefore increase the phase-space density.

22 A low-dimensional quantum gas by means of dark states
2.4.2 Phase-space compression
In the following, the result of a classical trajectory simulation is discussed, startingfrom the dimensionless phase-space distribution Φ0(z, v) for the vertical motion ofa single atom cooled in optical molasses, shown in Fig. 2.4(a). The vertical velocitycomponent is denoted as v here, and the subscript z in vz is dropped throughoutthis chapter. The phase-space density has been made dimensionless by dividing itby the phase-space density of quantum states. The latter is given by M/h [quantumstates per unit area in the (z, v) space], where h is Planck’s constant. The distribu-tion Φ0(z, v) can be interpreted as the probability that the atom is in an arbitraryquantum state localised around (z, v).
The atom, described by the classical distribution Φ0(z, v), is assumed to enterthe evanescent wave at a velocity vi = pi/M , determined by its velocity in themolasses v0 and the height z0 from which it falls. Inside the evanescent wave theatom moves as a point particle along a phase-space trajectory (z(t), v(t)), governedby the evanescent-wave potential Udip(z) from Eq. (2.7).
Similar to the optical potential, the photon scattering rate Γ′ of a two-level atomin steady-state and at low saturation is proportional to the saturation parameter s0,and can be expressed using Udip(z):
Γ′(z) = Γ′0 exp(−2κz) =
Γ
δUdip(z) , (2.14)
Γ′0 =
1
2s0Γ . (2.15)
Finally, the Raman transition rate is given by
R(z) = R0 exp(−2κz) , (2.16)
R0 = q Γ′0 , (2.17)
where q is the branching ratio, i.e. 1 − q is the probability that photon scatteringleads to a Raman transition. The Raman rate gives the local probability per unittime that the trajectory is interrupted.
The moving atom in the evanescent-wave perceives a time-dependent saturationparameter, s(t) = s0 exp(−2κ z(t)). Assuming that the excited state populationfollows adiabatically, we can integrate the scattering rate along the trajectory toobtain the number of scattered photons,
Nscat =
∫Γ′(t)dt =
Γ
δ
∫ +pi
−pi
( Udip−∂zU
)dp . (2.18)
If neglecting the Van der Waals contribution and gravity in Eq. (2.10), that is for apurely optical potential U ∝ exp(−2κz), this leads to an analytical solution:
Nscat =Γ
δ
piκ
. (2.19)
2.4 Loading a low dimensional trap 23
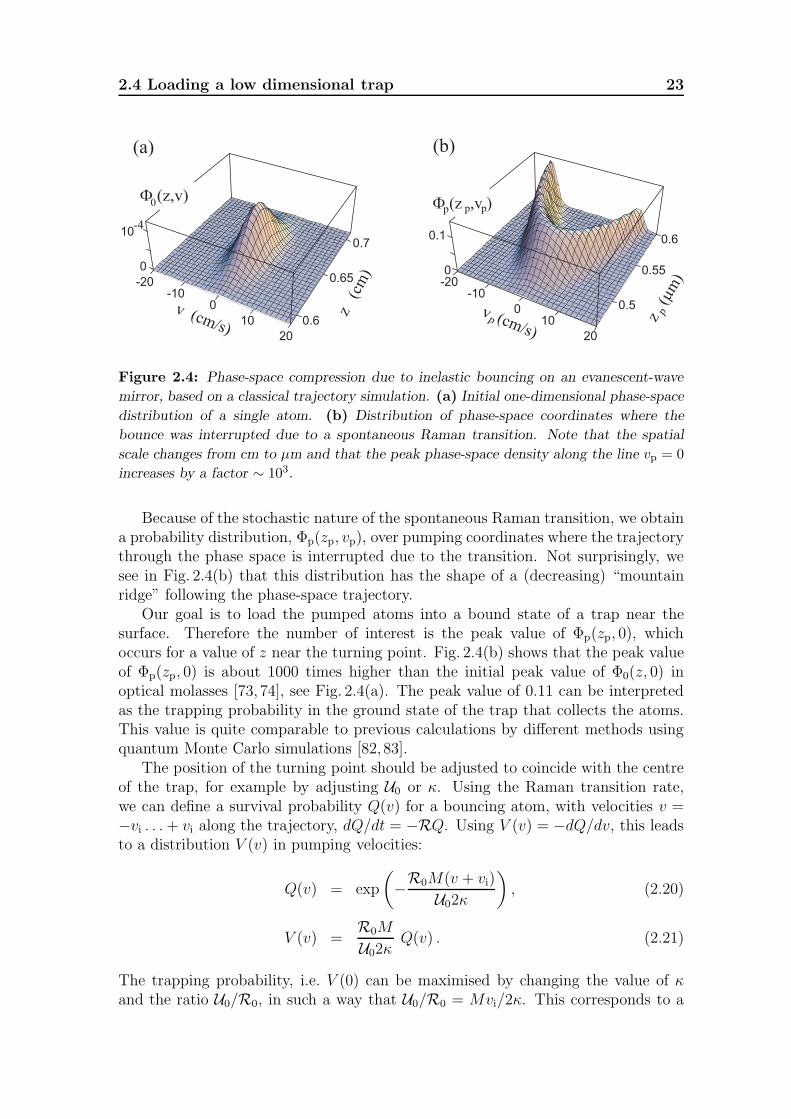
Figure 2.4: Phase-space compression due to inelastic bouncing on an evanescent-wave
mirror, based on a classical trajectory simulation. (a) Initial one-dimensional phase-space
distribution of a single atom. (b) Distribution of phase-space coordinates where the
bounce was interrupted due to a spontaneous Raman transition. Note that the spatial
scale changes from cm to µm and that the peak phase-space density along the line vp = 0increases by a factor ∼ 103.
Because of the stochastic nature of the spontaneous Raman transition, we obtaina probability distribution, Φp(zp, vp), over pumping coordinates where the trajectorythrough the phase space is interrupted due to the transition. Not surprisingly, wesee in Fig. 2.4(b) that this distribution has the shape of a (decreasing) “mountainridge” following the phase-space trajectory.
Our goal is to load the pumped atoms into a bound state of a trap near thesurface. Therefore the number of interest is the peak value of Φp(zp, 0), whichoccurs for a value of z near the turning point. Fig. 2.4(b) shows that the peak valueof Φp(zp, 0) is about 1000 times higher than the initial peak value of Φ0(z, 0) inoptical molasses [73, 74], see Fig. 2.4(a). The peak value of 0.11 can be interpretedas the trapping probability in the ground state of the trap that collects the atoms.This value is quite comparable to previous calculations by different methods usingquantum Monte Carlo simulations [82, 83].
The position of the turning point should be adjusted to coincide with the centreof the trap, for example by adjusting U0 or κ. Using the Raman transition rate,we can define a survival probability Q(v) for a bouncing atom, with velocities v =−vi . . .+ vi along the trajectory, dQ/dt = −RQ. Using V (v) = −dQ/dv, this leadsto a distribution V (v) in pumping velocities:
Q(v) = exp
(−R0M(v + vi)
U02κ)
, (2.20)
V (v) =R0M
U02κ Q(v) . (2.21)
The trapping probability, i.e. V (0) can be maximised by changing the value of κand the ratio U0/R0, in such a way that U0/R0 = Mvi/2κ. This corresponds to a

24 A low-dimensional quantum gas by means of dark states
situation where the probability for reaching the turning point without being opticallypumped is Q(0) = 1/e, or Q(vi) = 1/e2 for completing the bounce. If the pumpingrate is very high, too many atoms are pumped before they reach the turning point.If the pumping rate is very low, too many atoms bounce without being pumpedat all. If the optical pumping is done by the same laser that induces the bouncingpotential, we have U0/R0 = δ/Γq, so that we obtain an optimum value for thedetuning:
δ = qpi2κ
Γ . (2.22)
Experimentally it may be advantageous to use separate lasers for the mirror potentialand for pumping so that this restriction on the detuning does not apply.
Obviously, one should be somewhat careful in assigning quantitative meaning tothe result of this classical simulation. In particular it has to be verified that thedistribution Φp(zp, 0) is broad on the characteristic length scale of the (quantummechanical) atomic wavefunction near the turning point. The latter is determinedby the slope of the bouncing potential near the turning point. With the approxi-mation of a constant slope near the turning point, the corresponding Schrodingerequation is solved by an Airy function with a characteristic width of the first lobe of∼ κ−1(κ/pi)2/3. For the same parameters as used in Fig. 2.4(b) this characteristicwidth is ∼ 22 nm, indeed smaller than the width of Φp(zp, 0), which is ∼ 50 nm.
2.5 Photon scattering
2.5.1 Metastable atoms versus alkali-metal atoms
The level scheme used in the proposal of Ref. [59] was inspired by metastable noblegas or alkaline earth atoms. In those cases two (meta)stable states can usually befound with a large energy separation. This makes it relatively straightforward toseparate the bouncing and trapping processes, as demonstrated experimentally forAr∗ in Ref. [86]. Note however, that Penning ionisation of the metastable speciesconstitutes a severe loss mechanism and has to be taken into account in the regimeof large atomic density [95, 96]. In our scheme those ideas are extended, applyingthem to the typical level scheme of the alkali metals. In this case the separationbetween two stable states is limited to the ground state hyperfine splitting.
Therefore, the issue of photon scattering by atoms that have been transferredinto the trap, is addressed in the following. More specifically, our main concern isscattering of bouncer light. Since, by Eq. (2.14), the rate of scattering light from thetrapping laser is related to the optical potential, Γ′/Udip ∝ 1/δ, it can in principlebe made negligibly small by choosing a large enough detuning. This can be donebecause the trapping potential can be much shallower than the bouncing potentialand therefore need not be F -state specific. (In fact, it will be F -state specific forthe dark states discussed below.) For example, if the atoms are dropped from 6 mmabove the prism, their incident kinetic energy is Ei/kB = 0.6 mK, corresponding
2.5 Photon scattering 25
to a required bouncing potential of Uth/h = 12 MHz. For the trapping potential,on the other hand, a depth of less than 50 µK (1 MHz) should be sufficient, sincemost of the external energy of the atom has been used for climbing the bouncingpotential. For the bouncing state Fg = 1, the trapping potential then appears as asmall ripple superimposed on the bouncing potential.
The scattering of bouncer light is more difficult to avoid. Ideally, the interactionof the atoms with the bouncer should vanish completely as soon as they are trans-ferred into the Fg = 2 state. In reality, the bouncer connects both ground states,Fg = 1 and Fg = 2 to the excited state through a dipole-allowed transition. We canapproach the ideal situation by a proper choice of the bouncer detuning. For thesimplified three-level scheme of Fig. 2.2(b), a limitation is imposed by the groundstate hyperfine splitting δGHF. A good distinction between the Fg = 1 and Fg = 2states is only obtained if the bouncer detuning is small, δ1 δGHF. However, a verysmall detuning is undesirable because it leads to an increased photon scattering rateand thus heating during the bounce and also in the trapped final state.
Typical experimental settings are pi 60 k0 for the momentum of a rubidiumatom falling from a height of about 6 mm, and κ 0.15 k0 for an angle of incidenceθi = θc + 10 mrad. If we operate in the regime qNscat 2 (i.e. until the turningpoint we have qNscat 1) and set q = 0.5, this requires a detuning δ1 100 Γ 2π × 0.6 GHz. After the atom has been transferred into the trapping potential forFg = 2, the detuning of the bouncer will be δ2 = δ1+δGHF 2π×7.4 GHz 1200 Γ.The trapped atoms will then scatter bouncer light at an unacceptably high rate oftypically 5× 10³ s−1.
2.5.2 Dark states
The limitation imposed by the hyperfine splitting, δ1 δGHF, can be overcome bymaking use of dark states, see e.g. Refs. [107, 108]. This requires a more detailedlook at the Zeeman sublevels of the hyperfine ground states. We consider the state|Fg = mg = 2〉 and tune the bouncer laser to the D1 resonance line (795 nm,5s 2S1/2 → 5p 2S1/2), see Fig. 2.5(a). If this light is σ+-polarised, the selection rulesrequire an excited state |Fe = me = 3〉, which is not available in the 5p 2S1/2 manifoldand so |Fg = mg = 2〉 is a dark state with respect to the entire D1 line.
The state selectivity of the interaction with bouncer light no longer depends onthe detuning, but rather on a selection rule. Therefore the bouncer detuning canbe chosen large compared to δGHF. The new limitation on the detuning is the finestructure splitting of the D-lines, 7.2 THz (or 15 nm) for rubidium. This reducesthe photon scattering rate by 3 orders of magnitude. Note that heavier alkali-metal atoms are more favourable in this respect because of the larger fine structuresplitting. The price to be paid is the restriction to two specific Zeeman sublevels|Fg = ±mg = 2〉 and the need for a circularly-polarised evanescent wave.

26 A low-dimensional quantum gas by means of dark states
2.6 Circularly-polarised evanescent waves
In this section, two methods for the generation of evanescent waves with circularpolarisation are described, using either a single bouncer beam or a combination oftwo. The resulting photon scattering rates are also calculated.
2.6.1 Single beam
A circularly-polarised evanescent wave can be obtained using a single incident laserbeam if it has the proper elliptical polarisation, i.e. the proper superposition of TEand TM polarisation. The TE-mode yields an evanescent electric field parallel tothe surface and perpendicular to the plane of incidence. The evanescent field of theTM-mode is elliptically polarised in the plane of incidence, with the long axis of theellipse along the surface normal. This was shown in Fig. 2.1(a).
It is straightforward to calculate the input polarisation that yields circular po-larisation in the evanescent wave. We find that the required ellipticity of the inputpolarisation is the inverse of the refractive index, 1/n. Here the ellipticity is definedas the ratio of the minor and major axes of the ellipse traced out by the electric fieldvector. The orientation φ of the ellipse is defined as the angle of its major axis withrespect to the normal of the xz-plane of incidence, see Fig. 2.5(b). The requiredorientation depends on the angle of incidence:
tanφ = −√
n2 sin2 θi − 1
cos θi. (2.23)
Close to the critical angle this is φ ≈ 0, and the ellipse has its major axis perpen-dicular to the plane of incidence.
Following this prescription, the resulting evanescent wave will be circularly po-larised, with the plane of polarisation perpendicular to the surface. However, theplane of polarisation is not perpendicular to the in-plane component, kx, of thek-vector. Here the evanescent wave differs from a propagating wave, which has itsplane of polarisation always perpendicular to the k-vector (and Poynting vector).For the evanescent wave the plane of circular polarisation is also perpendicular tothe Poynting vector. However, the Poynting vector is not parallel to the in-planek-vector, but tilted sideways by an angle ±χ for σ± polarisation. It is given by
tanχ =√
n2 sin2 θi − 1 = κλ02π
. (2.24)
Close to the critical angle, χ ≈ 0, and the plane of polarisation becomes perpendic-ular to the in-plane wave vector, as it is for propagating waves.
We can estimate the photon scattering rate of an atom in the dark state|Fg = mg = 2〉, residing in the circularly polarised evanescent wave of the bouncerbeam. Ideally, this scattering rate is only due to off-resonance excitation to the5p 2P3/2 manifold (D2 line, 780 nm). Choosing the bouncer detuning at 100 GHz(with respect to the D1 line) yields a scattering rate of Γ′
D2 = 3.5 s−1. In practicethere will also be scattering due to polarisation impurity. For example, assumingthis impurity to be 10−3, we obtain a scattering rate of Γ′
D1,σ− = 10.6 s−1.

2.6 Circularly-polarised evanescent waves 27
(b)(a)
EW
x
y
z
S
glass surface
+
i 0
2
1
2
-1 0 +1
-1 0 +1 +2-2
EW
Fg
m =g1
Fe
-1 0 +1
-1 0 +1 +2-2
Figure 2.5: Dark state in a single-beam of a σ+-circularly-polarised evanescent wave.
(a) Dark state |Fg = mg = +2〉 in σ+-polarised light, tuned above the D1 line of 87Rb.
(b) Glass surface in the xy-plane, evanescent-wave (EW) angle of incidence θi. Elliptical
incident polarisation, rotated by the angle φ with respect to the normal to the xz-plane
of incidence. The thin dashed line indicating 90 − φ is normal to the EW beam and in
the plane of incidence. The Poynting vector S is in the xy-plane, rotated by the angle +χout of the x-direction.
2.6.2 Two crossing TE waves
Alternatively, evanescent waves of circular polarisation can be produced using two(or more) bouncer beams. Two TE polarised evanescent waves, crossed at 90,will produce a polarisation gradient as sketched in Fig. 2.6(a). Lines of circularpolarisation are now produced with the plane of polarisation parallel to the surface.Lines of opposite circular polarisations alternate, with a distance of approximatelyλ0/2
√2 between neighbouring σ+ and σ− lines.
This configuration offers interesting opportunities. The light field can be de-composed into two interleaved standing wave patterns, for σ+ and σ− polarisation,respectively. An atom in the state |Fg = mg = 2〉 is dark with respect to the σ+
standing wave only. However it does interact with the σ− standing wave and there-fore can be trapped in its nodes. The bouncer light will thus play a double role.First it slows the atoms on their way down to the surface. Then, after the atomshave been optically pumped, the bouncer light will transversely confine the atoms.The situation before and after pumping is shown in Fig. 2.6(b,c). We thus expecta 1D lattice of atomic quantum wires with alternating spin states, very much likea surface version of previously demonstrated optical lattices [109,110]. The verticalconfinement in the z-direction can still be achieved by an additional trapping field,

28 A low-dimensional quantum gas by means of dark states
0r/
0.5
0
1
1.50
0.5
11.5
2
10
5
15
0.5
0
1
1.50
0.5
11.5
2
10
5
15
0z/
0r/
0z/
U h/
U h/ 2, 2
1, 0
(a) (b)
(c)
r
Figure 2.6: (a) Generating circularly-polarised evanescent waves by crossing two TE-
polarised waves at a right angle (looking down at the prism surface). The polarisations
and in-plane wave vector components yield a fringe pattern of alternating lines of opposite
circular polarisation. The total intensity is constant across the pattern, since the two TE
polarisations are orthogonal. The optical potential is shown in (b) for an atom incident
in state |Fg,mg〉 = |1, 0〉, and in (c) for a pumped atom in the (locally) dark state |2, 2〉.The potentials are plotted vs. the height z and the transverse r-direction in the xy-plane
(orthogonally crossing the fringe pattern).
see also Fig. 2.3. The transverse lattice structure may allow postcooling of atoms inthe trap by Sisyphus cooling [111, 112] or Raman sideband cooling [75–78].
It is not strictly necessary to cross the evanescent waves at a right angle, but ithas the advantage that the total intensity is constant across the polarisation pattern.The same could also be achieved by using counter-propagating evanescent waves withorthogonal polarisations. For any other angle, the intensity varies spatially so thatthe atoms bounce on a corrugated optical potential. However, even with a uniformintensity, most atoms will experience a corrugated potential, as shown in Fig. 2.7.The potential depends on the local polarisation and on the atom’s magnetic sublevelthrough the Clebsch-Gordan coefficients. Only for the state |Fg = 1, mg = 0〉 isthe dipole potential independent of the polarisation. One could of course preparethe falling atoms in |Fg = 1, mg = 0〉 using optical pumping. The local circularpolarisation σ± will tend to pump the atom into the local dark state |Fg = ±mg = 2〉.However the optical pumping transition then has a branching ratio of only 1/6(using a dedicated resonant pumping beam). By contrast, for an atom starting in|Fg = 1, mg = 1〉, the branching ratio is 1/2. Therefore starting in |Fg = 1, mg = 0〉is conceptually simple, but probably not optimal.
2.6 Circularly-polarised evanescent waves 29
(c)
(d)(b)
(a)
0.5 1.51 2
10
5
15
0.5 1.51 2
10
5
15
0r/
0r/
Uh
/
Uh
/
2, m
1, m
0 1 2 3
4
2
0
8
6
z/ 0
0 1 2 3
0.2
-0.2
0
z/ 0
Uh
/
Uh
/
2, 2
1, 0
2, 2
g
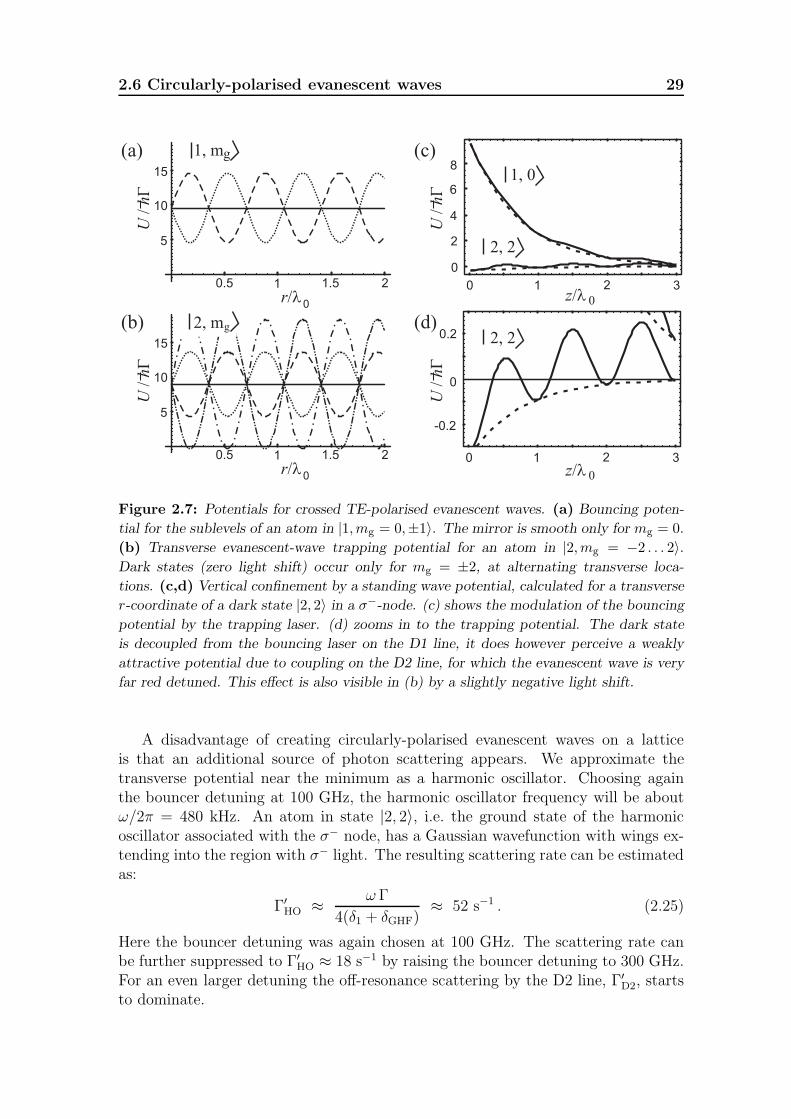
g
Figure 2.7: Potentials for crossed TE-polarised evanescent waves. (a) Bouncing poten-
tial for the sublevels of an atom in |1,mg = 0,±1〉. The mirror is smooth only for mg = 0.(b) Transverse evanescent-wave trapping potential for an atom in |2,mg = −2 . . . 2〉.Dark states (zero light shift) occur only for mg = ±2, at alternating transverse loca-
tions. (c,d) Vertical confinement by a standing wave potential, calculated for a transverse
r-coordinate of a dark state |2, 2〉 in a σ−-node. (c) shows the modulation of the bouncing
potential by the trapping laser. (d) zooms in to the trapping potential. The dark state
is decoupled from the bouncing laser on the D1 line, it does however perceive a weakly
attractive potential due to coupling on the D2 line, for which the evanescent wave is very
far red detuned. This effect is also visible in (b) by a slightly negative light shift.
A disadvantage of creating circularly-polarised evanescent waves on a latticeis that an additional source of photon scattering appears. We approximate thetransverse potential near the minimum as a harmonic oscillator. Choosing againthe bouncer detuning at 100 GHz, the harmonic oscillator frequency will be aboutω/2π = 480 kHz. An atom in state |2, 2〉, i.e. the ground state of the harmonicoscillator associated with the σ− node, has a Gaussian wavefunction with wings ex-tending into the region with σ− light. The resulting scattering rate can be estimatedas:
Γ′HO ≈ ω Γ
4(δ1 + δGHF)≈ 52 s−1 . (2.25)
Here the bouncer detuning was again chosen at 100 GHz. The scattering rate canbe further suppressed to Γ′
HO ≈ 18 s−1 by raising the bouncer detuning to 300 GHz.For an even larger detuning the off-resonance scattering by the D2 line, Γ′
D2, startsto dominate.

30 A low-dimensional quantum gas by means of dark states
2.6.3 Feasibility
One should point out that the examples to produce circularly polarised evanescentwaves are not meant to be exhaustive. Several other methods can be devised, somebeing more experimentally challenging than others.
For the single-beam method the incident beam must be prepared with the correctellipticity as well as the correct orientation. It will probably be difficult to measurethe polarisation of the evanescent wave directly. One should therefore prepare theincident polarisation using well-calibrated optical retarders and using calculatedinitial settings. For example, as an experimental method, the use of reversibilitytheorems for the polarisation of plane waves was discussed in Ref. [113]. The finetuning could then be done, e.g., by optimising the lifetime of the trapped atoms inthe dark state.
For the two-beam method of Fig. 2.6(a) we have assumed for simplicity thatthe two interfering evanescent waves have the same decay length and the sameamplitude. Equal decay lengths for the two waves can be enforced by making useof a dielectric waveguide [114]. Alternatively, one may deliberately give the twobeams a slightly unequal decay length and, at the same time, give the wave withthe shorter decay length a larger amplitude. In this case there will always be oneparticular height above the surface where the two beams have equal amplitude, asrequired for superposing to circular polarisation. This procedure would make thecircular polarisation somewhat self-adjusting. The height where circular polarisationoccurs is tunable by changing the relative intensity of the two beams.
Obviously, the final word on the feasibility can only be given experimentally. Inour ongoing experiments, a variation on Fig. 2.6(a) is pursued, including the justmentioned self-adjusting properties.
2.7 Conclusion
It was discussed that inelastic bouncing on an evanescent-wave mirror is a promisingmethod for achieving high phase-space density in low-dimensional optical traps. Thephase space compression is achieved by means of a spontaneous Raman transition,which is highly spatially selective for atoms near the turning point of the evanescent-wave mirror potential.
Previous work based on the level schemes of metastable noble gas atoms wasextended for application to alkali-metal atoms. This requires suppression of the highphoton scattering rate, resulting from the relatively small ground state hyperfinesplitting of the alkali-metal atoms. It was shown how the photon scattering ratecan be reduced by several orders of magnitude, by trapping the atoms in darkstates. This requires the use of circularly-polarised evanescent waves, which canbe generated by several methods. If built up from multiple beams, the evanescentfield may play a double role, generating a bouncing potential as well as a trappingpotential. This could lead to an array of quantum wires for atoms.
3Experimental setup
A table-top ultra-high vacuum rubidium vapour cell has been built.Optical access to the vacuum system is achieved by use of a rectan-gular glass cell. Two techniques of vacuum sealing of such glass cellsusing either a knife-edged metal gasket or epoxy glue are discussed.In the vapour cell a magneto-optical trap is operated. With addi-tional optical molasses, cooling provides samples of ≈ 107 atoms attemperatures of ≈ 10 µK. Frequency-stabilised diode lasers serveas trapping and cooling light sources. Their output is amplified byinjection-locked single-mode diode lasers or, for high-power appli-cations, tapered semiconductor gain elements. Real-time control ofthe experiment is achieved by a personal computer with an addi-tional digital signal processor. Cold atoms are detected by imagingwith a triggered digital frame-transfer CCD camera system.
31

32 Experimental setup
3.1 Overview
An optical trapping scheme for atoms has to be realised in ultra-high vacuum (UHV)to avoid atom loss due to collisions with room temperature gas. Since the firstdemonstration, the magneto-optical trap (MOT) [33] has become a standard tool inatomic physics. Usually, a MOT provides a cloud of cold atoms after a single loadingcycle. Alternatively, a slow continuous atomic beam is extracted [115, 116]. In ourexperiments, a MOT with subsequent polarisation gradient cooling (PGC) [70] wasused to prepare a cloud of atoms a few mm above an evanescent-wave atom mirror.We have chosen frequency-stabilised diode lasers to provide the various light frequen-cies required for the MOT, PGC, optical pumping, dipole trapping, and probing ofatoms. Such devices are a low-cost and less maintenance demanding alternative toTi:Sapphire laser systems. Their compactness permits to assemble a larger numberof laser sources together with an UHV setup on a single table. The lasers con-sist of external grating diode lasers [117, 118], the output of which is amplified byinjection-locked diode lasers. The laser stabilisation schemes are based on frequency-modulation spectroscopy [119] and “Zeeman polarisation spectroscopy” [120–122].The complexity of the experiments demands real-time computer control of exper-imental parameters. A digital signal processor is in charge of this task. Imagesof atoms bouncing on evanescent-wave mirrors were acquired with a digital CCDcamera system.
In this chapter, the relevant properties of rubidium are discussed and the designof the table-top UHV rubidium vapour cell is described, in which our experimentswere performed. A separate section is dedicated to the delicate issue of connect-ing and sealing glass cuvettes and window substrates to standard CF40 and CF16ConflatTM steel knife-edge flanges. Also an overview of the used laser systems andthe controlling computer hardware is given. In the last section, the MOT is de-scribed. The temperature of atom clouds, achieved by PGC, was determined by atime-of-flight method using falling atom clouds. The characterisation of one partic-ular device, a tapered semiconductor amplifier, is given in Chap. 4.
3.2 Atomic species — rubidium
The experimental choice of an atomic species depends on physical properties in-cluding, (i) appropriate optical transition frequencies and the availability of lasersources operating on these frequencies, (ii) the atomic collisional properties and,(iii) the ease of handling in an UHV system.
(i) Optical transitions.— Optical cooling techniques require well separatedoptical transitions of sufficiently narrow natural linewidth, among which cycling(“closed”) transitions. Methods like PGC or velocity-selective coherent populationtrapping (VSCPT) [107] in “dark states” rely on optical pumping between magneticsublevels or hyperfine states. The hyperfine-split D1 and D2 fine structure lines ofalkali-metal atoms and the optical transitions of metastable noble gas atoms allowthe use of dye lasers and Ti:Sapphire lasers with, wavelengths from the visible to
3.3 Ultra-high vacuum system 33
the near-infrared spectrum. With LNA lasers at 1083 nm also metastable heliumbecame usable [123]. For an overview on common elements for laser cooling, seee.g. Ref. [12].
Well established in atomic physics are meanwhile stabilised diode laser systems,if providing sufficient optical output power together with spectral and spatial beamquality. The availability of the laser diodes is generally determined by commercialapplications, e.g. for CD disk drives (785 nm wavelength), Nd:YAG laser pumpingsources (808 nm), DVD drives (650− 670 nm), or magnetometers for navigationalsystems using helium (1083 nm). Particularly, low-cost high-power laser diodes inthe near infrared make rubidium an attractive choice, due to optical resonances at780 nm and 795 nm wavelength.
(ii) Collisional properties.— In high density applications of cold atoms thes-wave scattering length is an important parameter, e.g. for evaporative coolingand for the properties of a Bose-Einstein condensate. For an overview of scatteringlengths for various atomic species, see Ref. [63]. More specifically 87Rb, due toits suitable positive scattering length (a ≈ 109 a0), may be the most promisingcandidate to reach quantum degeneracy in a purely optical scheme, as envisaged inChap. 2. Therefore we use this isotope in our experiments.
(iii) Handling in UHV.— A reliable and compact technical solution to handlerubidium atoms is a table-top UHV vapour cell setup, in which a MOT can be quicklyand directly loaded from the room temperature vapour [124–126]. Rubidium canbe used at convenient temperatures. For example, the (saturated) rubidium vapourpressure at room temperature is between 10−7−10−6 mbar and the melting point is38.5 C [127]. The natural abundance of the 87Rb isotope is 27.9%, next to 72.1%of 85Rb. Some useful numbers for experiments with rubidium are listed in theAppendixA.1. The hyperfine level structure of the D1 (795 nm) and D2 (780 nm)line is shown in Fig. 3.7.
3.3 Ultra-high vacuum system
3.3.1 Requirements on a rubidium vapour cell
The used vapour cell is an UHV system which maintains a partial rubidium pres-sure of typically 10−8 mbar and a background gas pressure of 10−9 mbar. Inan optical trap, light scattering will dominate the loss of trapped atoms, ratherthan background gas collisions. An experiment involving bouncing atoms from anevanescent-wave mirror typically lasts less than 100 ms, whereas the mean collisiontime of cold atoms with room temperature atoms from the vapour is ∼ 350 ms(mean free path ∼ 100 m). Experiments of longer duration, such as evaporativecooling of atoms towards BEC, require significantly better vacuum ( 10−11 mbar).In these cases differentially pumped “double-MOT” systems [128] or bright beamsof slow rubidium atoms [115,116] are employed to load a MOT in good vacuum witha sufficient number of atoms.

34 Experimental setup
A vapour cell can be economically realised as a small stand-alone system usingmostly commercial components. The very low rubidium consumption reduces main-tenance tasks. For example, using 10 mg of rubidium in a reservoir, the operatingtime is limited by constructional changes on the system rather than by rubidiumdepletion. Due to vibrations, the use of turbo-molecular pumps located on a ta-ble together with stabilised lasers is undesirable. Therefore we employ ion pumps,though these pumps require care for shielding or compensating their stray magneticfields. Usually it is sufficient to place an ion pump far enough away ( 0.5 m) fromthe experimental region. However, this is at the cost of pumping speed and vacuumpressure.
In addition to vacuum specifications, also the optical properties of a vapour cellhave to be considered. Experiments on evanescent-wave atom mirrors as discussedin this thesis, require a prism as the only optical component mounted inside thevacuum system. Nevertheless, optical access from various directions is needed toapply the numerous laser beams. The windows should be of laser optical quality and,if possible, antireflection coated. In the present system, an uncoated rectangularglass cell is used. Beside good optical access, a particular feature of such a cell isthat magnetic field coils can closely approach the region of interest and hence canbe small sized and of low power consumption. Since a glass cell is nonmagnetic,experiments are not perturbed by eddy currents caused by switching field coils.
3.3.2 Vapour cell setup
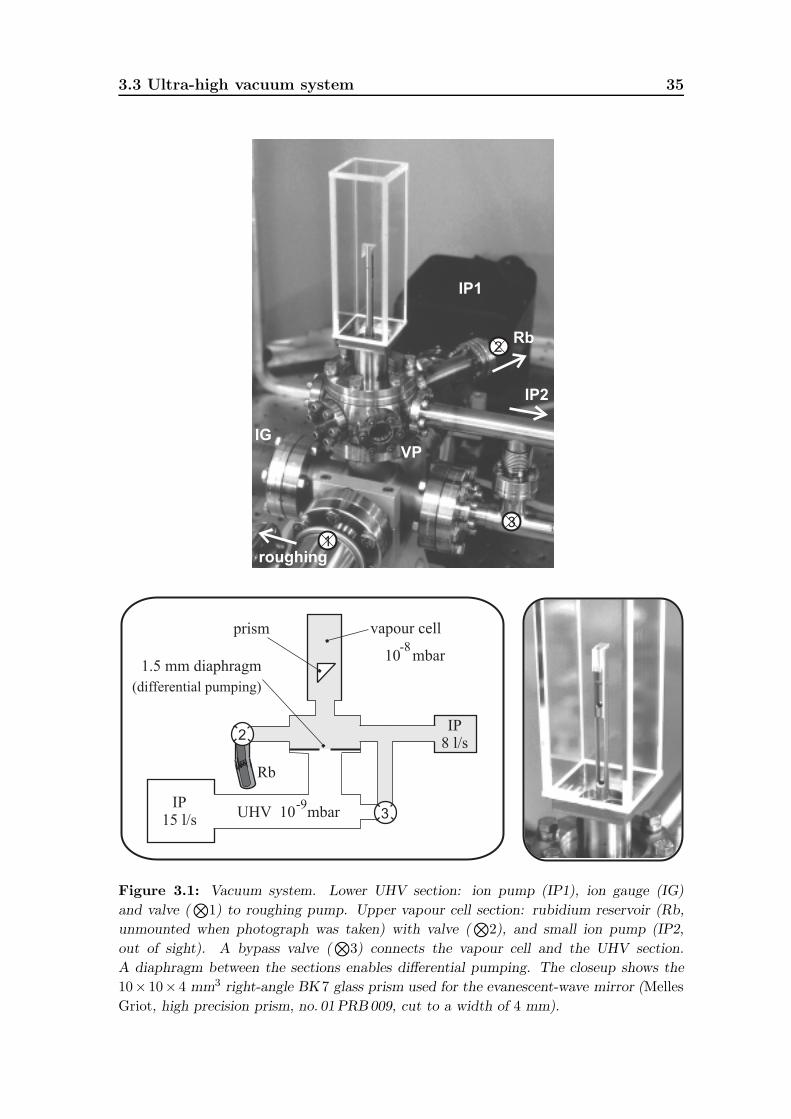
The vacuum system, shown in Fig. 3.1, consists of, (i) a lower UHV chamber, pumpedby a 15 l/s ion pump and, (ii) an upper differentially pumped vapour cell connectedto a glass cuvette and to a rubidium reservoir. The vapour cell is (optionally)pumped by a 8 l/s ion pump. The typical background pressure achieved in thissystem is ≈ 10−9 mbar, after gentle bakeout up to 114 C. The epoxy-glued glasscell used so far, did not allow warmer baking.
(i) UHV section.— The components of the UHV system are grouped in thehorizontal plane at a 5-way CF40 cross. The system is clamped to the opticaltable by aluminium mounts that can be water cooled, in order to protect the lasertable during bakeout. An all-metal sealed valve (Granville-Phillips, gold-seal type204) leads via bellows to a roughing turbo-molecular pump. When the valve isclosed, the system is self-sustaining with an ion pump of 15 l/s (N2) pumping speed(Varian, VacIon Plus 20 StarCell with ferrite magnets). The achieved pressure canbe monitored by an ionisation gauge in a range between 10−12−10−3 mbar (Varian,type UHV-24p). A pressure below 10−9 mbar might be possible by extending thesystem with a titanium sublimation pump or non-evaporative getter materials.
The UHV section is separated from the upper vapour cell section by a blankCF40 copper gasket with a hole of 1.5 mm diameter. Differential pumping reducesthe pumping speed in order to maintain the rubidium pressure in the vapour cellduring experiments.
3.3 Ultra-high vacuum system 35
IP1
roughing
IP2
Rb
IGVP
1
2
3
Rb
IP8 l/s
vapour cellprism
IP15 l/s
10 mbar-8
1.5 mm diaphragm
(differential pumping)
UHV 10 mbar-9
2
3
Figure 3.1: Vacuum system. Lower UHV section: ion pump (IP1), ion gauge (IG)
and valve (⊗1) to roughing pump. Upper vapour cell section: rubidium reservoir (Rb,
unmounted when photograph was taken) with valve (⊗2), and small ion pump (IP2,
out of sight). A bypass valve (⊗3) connects the vapour cell and the UHV section.
A diaphragm between the sections enables differential pumping. The closeup shows the
10× 10× 4 mm3 right-angle BK 7 glass prism used for the evanescent-wave mirror (MellesGriot, high precision prism, no. 01PRB009, cut to a width of 4 mm).

36 Experimental setup
For pumping down from atmospheric pressure and during bakeout, an all-metalCF 16 valve (Vacuum Generators, type ZCR20R) is opened in a bypass from the5-way cross to the vapour cell. The strong magnets of the ion pump are approxi-mately 35 cm away from the prism. The ion pump manual specifies a stray magneticfield of 1.5 G at a distance 15 cm from the pump.
(ii) Vapour cell section.— A hexagonal section with six CF16 ports is mountedon top of the UHV section. It interconnects the cuvette, the rubidium reservoir andthe pumping bypass. In addition, an in-line pair of custom-made optical viewportsis mounted, that provides optical access for, e.g., time-of-flight diagnostics of fallingatoms (if no prism is mounted). The horizontal tube of the bypass leads 40 cm awayto a small 8 l/s ion pump (Varian, VacIon with AlNiCo magnet). If necessary forstray field minimization and if the pump is not in use, the magnet can be removed.Together with the bypass, this pump assists in stabilising the rubidium vapourpressure or to reduce background gas pressure, respectively.
The rubidium reservoir is connected to the vapour cell by a short spacer tubeand an all-metal valve. It consists of a flexible tube with a short intermediate bel-lows section. Before evacuating the system, a small cylindrical quartz ampule wasinserted, containing a few milligram rubidium. When the final roughing pressure≈ 10−6 mbar was established after bakeout, the ampule was broken by bending thebellows. When the pressure settled again, the system was sealed off from the rough-ing line and further pumped down by the ion pump. Commercial standard rubidiumampules can be used in the setup (Aldrich Chemical, 2 g, no. 38,599-9). However,a few milligram suffices to keep the system operable for years. For constructionalchanges, the reservoir can stay evacuated for a short time, avoiding a replacementof the ampule. Hence it is more economical (and more safely) to distil only a smallamount of rubidium into custom reservoir ampules.
In case the ampule breaks too neatly, it might be necessary to keep the bellowsbent to increase the rubidium diffusion out of the ampule. The reservoir is wrappedwith a heating cord. When preparing experiments, the reservoir is gently baked withopen valve until the desired vapour pressure in the cuvette is reached. (The saturatedrubidium vapour pressure is, e.g., ≈ 10−5 mbar at 60C.) It can be monitoredby observing the fluorescence from a laser beam tuned to an optical resonance ofrubidium. After cooling down the reservoir, the valve is kept open and adjusted tomaintain a constant vapour pressure. Due to the differential pumping, the vapourpressure decays with a time constant of ∼ 30 min if the reservoir is closed. Beforeinserting the differential pumping hole this was less than 5 min. It is difficult toestimate the rubidium diffusion and pumping speed for two reasons: First, thesystem has many bends and apertures. Second, rubidium is strongly sticking tosurfaces. Since the surface-to-volume ratio is large, there is a delay of several hoursin vapour pressure build-up when charging the system for the first time. One hasto avoid saturating the entire system and, particularly, the cuvette by a rubidiumdroplet that slowly “creeps” through the system.

3.4 Optical access to the UHV system 37
It is worth mentioning two alternative techniques of charging a vapour cell withrubidium, taking less constructional and machining efforts: (i) commercial single-use quench-seal copper tubes as containment for the rubidium ampule and, (ii) asaturated dispenser compound that releases rubidium when heated by an electricalcurrent (SAES Getters, type Rb/NF/3.4/12FT10+10, 2.6 mg yield). The latter hasthe advantage that it offers cw and pulsed operation with short time constants ∼min,and may charge the vacuum system only locally with rubidium. A disadvantage arethe electrical UHV feedthroughs and the limited rubidium load.
3.4 Optical access to the UHV system
In cooling and trapping experiments, laser-beam wavefronts must not be distortedby the UHV viewports. Also (stress-induced) birefringence of the viewports is unde-sirable, since it might perturb polarisation sensitive applications such as polarisationgradient cooling or “dark state” trapping. Furthermore, the vacuum sealing has towithstand common bakeout temperatures above 200 C. Commercial viewports areusually costly and have clear apertures that are significantly smaller than the Conflatflange counterpart. In order to achieve optical quality access from many directions,we have chosen a rectangular cuvette.
The first choice material was fused silica (“quartz glass”). It is available as laser-optical plate elements, that are welded in a baking process using glass weld powderat the connecting faces. The surface flatness is preserved locally in this process.A disadvantage is that no inside antireflection (AR) coating can be applied. Apre-applied coating would be destroyed during welding, and the elongated geometrymakes the application of an UHV compatible coating after welding impossible.
Such cuvettes are usually supplied with a “graded-seal” transition, with whichthe mismatch in the thermal expansion of the fused silica cuvette and an Invar steelflange is compensated. The graded seal consists of a succession of tubular segmentsthat change gradually in composition from fused silica to Pyrex glass. Unfortunately,the minimal length of the graded seal is > 10 cm, which may degrade the UHV inthe cuvette. For our vacuum system, we have therefore extended an earlier reportedwindow sealing technique [129] to seal a cuvette directly to a CF40 flange.
In the following, our application of this technique to CF16 viewports is discussed,and the CF40 scheme is refined using spring-loaded knife-edge seals, that reducestress on the glass substrate. Finally, a less complex preliminary solution basedon an epoxy-glued “Optical Glass” cuvette is presented. Note that this cuvette,despite of modest bakeout temperatures, allowed for sufficient UHV to perform allexperiments reported in this thesis (see also the photographs in Fig 3.1).
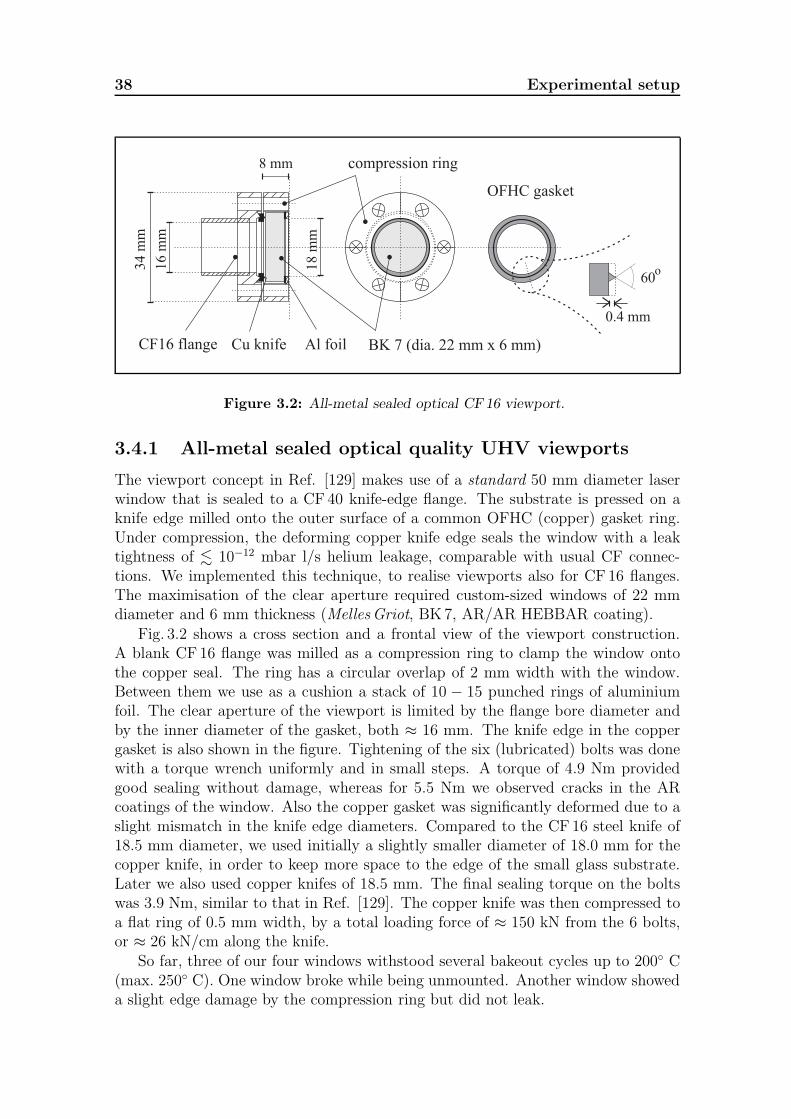
38 Experimental setup
CF16 flange
16
mm
60
0.4 mm
34
mm
BK 7 (dia. 22 mm x 6 mm)
8 mm
Al foilCu knife
18
mm
OFHC gasket
o
compression ring
Figure 3.2: All-metal sealed optical CF16 viewport.
3.4.1 All-metal sealed optical quality UHV viewports
The viewport concept in Ref. [129] makes use of a standard 50 mm diameter laserwindow that is sealed to a CF40 knife-edge flange. The substrate is pressed on aknife edge milled onto the outer surface of a common OFHC (copper) gasket ring.Under compression, the deforming copper knife edge seals the window with a leaktightness of 10−12 mbar l/s helium leakage, comparable with usual CF connec-tions. We implemented this technique, to realise viewports also for CF 16 flanges.The maximisation of the clear aperture required custom-sized windows of 22 mmdiameter and 6 mm thickness (MellesGriot, BK7, AR/AR HEBBAR coating).
Fig. 3.2 shows a cross section and a frontal view of the viewport construction.A blank CF16 flange was milled as a compression ring to clamp the window ontothe copper seal. The ring has a circular overlap of 2 mm width with the window.Between them we use as a cushion a stack of 10 − 15 punched rings of aluminiumfoil. The clear aperture of the viewport is limited by the flange bore diameter andby the inner diameter of the gasket, both ≈ 16 mm. The knife edge in the coppergasket is also shown in the figure. Tightening of the six (lubricated) bolts was donewith a torque wrench uniformly and in small steps. A torque of 4.9 Nm providedgood sealing without damage, whereas for 5.5 Nm we observed cracks in the ARcoatings of the window. Also the copper gasket was significantly deformed due to aslight mismatch in the knife edge diameters. Compared to the CF16 steel knife of18.5 mm diameter, we used initially a slightly smaller diameter of 18.0 mm for thecopper knife, in order to keep more space to the edge of the small glass substrate.Later we also used copper knifes of 18.5 mm. The final sealing torque on the boltswas 3.9 Nm, similar to that in Ref. [129]. The copper knife was then compressed toa flat ring of 0.5 mm width, by a total loading force of ≈ 150 kN from the 6 bolts,or ≈ 26 kN/cm along the knife.
So far, three of our four windows withstood several bakeout cycles up to 200 C(max. 250 C). One window broke while being unmounted. Another window showeda slight edge damage by the compression ring but did not leak.

3.4 Optical access to the UHV system 39
3.4.2 All-metal sealed fused silica cell
The knife-edged Conflat seal.— In a first attempt, we adapted the knife-edged CF40 gasket of the viewports also to a cuvette. Fused silica cuvettes weremanufactured by Optiglass (England) and supplied by Starna Analytical Accessoires(Austria). They were made from 4 mm thick plates with a square outside widthof 30 mm and lengths of 100 mm and 150 mm. The material is Spectrosil B fromThermal Syndicate. The cuvettes were molded each on a 15 mm thick ring disksubstrate of 50 mm outer and 22 mm inner diameter. Particularly the lower (sealing)disk surface was polished.
Thus, the disk resembled a 50 mm dia. (CF 40) fused silica window. Here, theknife edge milled onto the copper gasket had a diameter of 42 mm, like a CF40steel knife. For a window, we achieved a good seal with a torque of 5 Nm on each ofthe 6 flange bolts, corresponding with 173 kN total load (13 kN/cm). Nevertheless,the disk-mounted cuvette did not withstand the compression clamp. Before vacuumsealing was achieved, the disk cracked at the corners of the cuvette, when the torqueat the bolts was increased to about 3.4 Nm.
Therefore it seemed necessary to realise a seal using considerably less loadingforce on the disk than with an OFHC gasket. A possibility might be a softer gasket,e.g. made from nickel. However, nickel is ferromagnetic and therefore undesirableclose to the experimental region.
The Helicoflex∆ spring-loaded seal.— With the single-side knife-edged gas-ket, most of the compression was needed to deform the bulk gasket material bythe CF steel knife. Therefore, a double knife-edged gasket between two flat sur-faces promised a stress reduction. A commercial solution is the Helicoflex∆ gas-ket (Le Carbone-Lorraine, type HNV200∆ (DN25), spring Nimonic 90, lining alu-minium/Inconel 600) [130]. The gasket consists of a toroidal lining made fromthe sealing material. It has tiny knife edges milled on the top and bottom cir-cumference. Inside, as an elastic core, the torus contains a helical spring. Thisspring provides a homogenous compression all around the sealing circumference andavoids (torsion) stress on the sealed UHV components. A cross section of the Heli-coflex ∆ gasket is shown in Fig. 3.3 (not to scale). The helium leakage is specifiedas < 10−10 mbar l/s [130].
In the present setup, we have chosen an aluminium lining. Apart from the lowcosts, it offers advantageous properties in sealing our particular glass substrates.Aluminium is a ductile material: the knife edge is consumed under compression andrequires less loading force compared to a nonductile material. Among other ductilematerials like silver or copper, aluminium gaskets require less loading force, whereasthe specified final compression is even larger. Note the distinction made here between“(linear) loading force” and ”compression”. The former is derived from appliedtorques when tightening flange bolts, the latter describes the visible geometricaldeformation of the toroidal gasket and the knife edges. A large compression of thegasket promises accurate control during the sealing procedure. Aluminium gasketsrequire a Vickers hardness of the sealing surfaces of 65 only, in contrast to minimal

40 Experimental setup
Quartz cuvette
compression nut
sliding ring
cushion ring
compression ring(stationary)
Helicoflex
polished surface
lath milled surface
fine thread
CF 40 knife edge
hexagonal section
side view
top view
30 mm Al lining
spring
Figure 3.3: All-metal UHV sealed fused silica cell.
100 − 120 for silver and copper. A disadvantage may be the maximum bakeouttemperature of 280C, which is, however, still above the attempted rating for ourcuvettes. For detailed requirements on machining and finish of the sealed surfaces,see Ref. [130]. As an alternative to the Helicoflex gasket, also a metal wire sealmight offer a solution. However, common wires from gold need significantly moreloading force and, the softer indium does not allow larger bakeout temperaturesthan the epoxy-glued connection, discussed below.
Fig. 3.3(a) shows a cross section and a top view of the sealed cuvette. Thiscorresponds to the most recent construction. In order to provide a flat sealingsurface, our workshop machined a CF40 adapter to be connected to the hexagonalvapour cell section. This adapter accepts the Helicoflex gasket. The base of thecuvette assembly consists of a 50 mm diameter quartz disk of 20 mm thickness. Inaddition, between this disk and the rectangular cell, there is an intermediate quartzring of 10 mm thickness, the outer diameter of which matches the 30 mm crosssection of the cell. This assembly was clamped onto the Helicoflex by a combinationof a stationary compression ring and a single compression nut, with a fine thread of72 mm diameter and a pitch of 1.2 mm/turn. A thin ring of annealed aluminiumforms a cushion between the compression ring and the quartz disk. A similar cushion,lubricated with MoS paste, serves as a sliding ring between compression ring and nut.
The 10 mm spacer ring was inserted to avoid focused stress at the cell corners.Standard DN25 Helicoflex∆ gaskets were used. The inner and outer diametersare 30.4 mm and 40.2 mm, respectively. The torus cross section is 4.8 mm, witha nominal linear sealing load of 245 N/cm and a nominal compression of 0.9 mm.The load required to achieve sealing should thus be 100 times smaller than with theCF-sealed windows which were described in the previous section. The diameter of

3.4 Optical access to the UHV system 41
the knife edges is 35.2 mm. The larger inner diameter of the compression ring causestorsion stress in the quartz disk. Note that the choice of the standard DN25 gasketwas motivated earlier by modifying an existing CF40 flange rather than machininga custom adapter to the vapour cell section.
The final construction was tested while mounted directly on top of the inlet ofthe turbo-molecular pump. Sealing was achieved with a compression of 0.49 mm(55% of the nominal one). The pressure reading from a Penning detector indicated4.0 × 10−8 mbar before bakeout. After a bakeout cycle up to 230C, the pressuresettled at 1.8×10⁻⁸ mbar, the same as when operating the terminated pump alone.Our “consumption” of numerous gaskets reflects their quality. Under visual inspec-tion both used and freshly unpacked gaskets occasionally showed tiny scratches ormaterial faults in the aluminium knife-edges. In these cases sealing of the cuvettewas not achieved within the nominal compression. It is strongly recommended toconsume as many gaskets as necessary until sealing is achieved within the nominalcompression. In fact, a glance at the catalogues [130] indicates that these gasketsare originally designed to seal reactor vessels rather than atomic vapour cells.
The actual two-disk cuvette was motivated by an unsuccessful attempt to use thesingle-disk construction with a Helicoflex∆ gasket. The 15 mm thick single disk wasclamped on the gasket by 6 bolts of a modified CF40 flange, similar to the viewportconstruction. After sealing was achieved, the system was gently baked at 70C.Having cooled down slowly and after some hours of settling at room temperature, acrack at one of the cuvette’s corners occurred, similar to the crack with the previouslyused CF gasket. The reason was probably that the compression clamp finally madea considerable wedge with the flange counterpart. The bolts had been tightenedevenly by observing the applied torque. This suggests that either the spring loadof the gasket was not constant along the circumference, or the torque readingsof the wrench were not reliable due to variable bolt friction. This is the reasonwhy we finally used a single screw terminal to control the compression rather thancontrolling the linear load by individual bolts. Nevertheless, the latter concept hasbeen successfully realised by Dieckmann et al. [131], including bakeout above 250 C.

42 Experimental setup
Glass cuvette
TorrSeal(epoxy glue)
stainless steel(304)
weld
CF 40knife edge
side view top view
42 mm
Figure 3.4: UHV sealing of an epoxy-glued glass cell.
3.4.3 Epoxy-glued glass cell
We started experiments with an improvised glass cell, which we glued to a stain-less steel rectangular platform, see Fig. 3.4. The low-vapour pressure epoxy resinwas TorrSeal (Varian) which allows pressures down to 10−9 mbar and bakeouttemperatures up to 120 C. The glass cuvette is a standard “Large Cell” fromHELLMA (Germany) and made from “Optical Glass” (B 270-Superwite crone glass,from DESAG). The outside dimensions are 130×42×42 mm3 with a wall thicknessof 4 mm.
The figure shows the rectangular stainless steel platform, that was welded toa tubular CF 40 flange. The epoxy resin forms a seam of triangular cross sectionalong the bottom face of the cuvette. Thus, direct and polluting contact of the resinwith the vacuum is kept small. The triangular steel edge is supported by a thinrim of steel. This proved to be necessary in order to allow the seal to relax fromstress after bakeout. The resin seemed to soften at bakeout temperatures and torelax stress that has been induced by the thermal expansion mismatch of steel andglass. When cooling down after bakeout the resin hardens too quickly. In a firstconstruction without any significant elasticity, this resin property caused the glassto break at several locations at the epoxy seam, some hours after cooling down tworoom temperature.
The ultimate pressure of 10−9 mbar was reached after bakeout of the system,during which we kept the resin temperature below 115 C. In fact, this pressurewas permissible for the experiments reported in this thesis. Thus, the glued cellproofed to be a low-cost, reliable concept, maybe even simpler and more robustthan a cuvette that is assembled from loose glass plates as reported in Ref. [132].Of course, it was not possible to apply an optical AR coating to the inner surfaces,neither did we apply any coating at the outside.

3.5 Semiconductor lasers for cooling and trapping 43
3.5 Semiconductor lasers for cooling and trapping
3.5.1 Requirements
There are three essential specifications of a laser system for atom-optical exper-iments, (i) frequency stability, (ii) optical output power and, (iii) beam quality,which are briefly discussed here, followed by a detailed description of our frequencystabilised diode lasers and injection-locked diode lasers.
(i) Frequency stability.— The laser linewidth must be smaller than the atomictransition linewidth. The frequency should also be stable on this scale. Using ru-bidium (Γ/2π = 6.0 MHz), this requirement is usually fulfilled with common lasersources. Frequency drift stability within 1 MHz is achieved by “locking” the laserto an atomic resonance using feedback from a reference spectroscopy signal [133].Magneto-optical trapping and polarisation gradient cooling typically demand a laserdetuning from the atomic resonance of a few times the transition linewidth Γ. Con-tinuous and fast detuning control is achieved by frequency shifting acousto-opticalmodulators (AOM). Passive drift stability of the laser source is desirable when largedetuning (δ Γ) is necessary and suitable references for locking are not available,e.g., when working with far off-resonance dipole potentials. In some applications alsothe spectral background has to be considered. In Chap. 4, the amplified spontaneousemission background (ASE) of a tapered amplifier system (TA) is discussed.
(ii) Output power.— In applications with near-resonance light, laser intensitiesof a few times the saturation intensity are usually sufficient, e.g. I0 = 1.67 mW/cm2
for the rubidium D2 line. A laser output of 15 mW allows operating a rubidiumMOTwith beam waists 5 mm. Much more power is usually needed to realise opticaldipole potentials. The trapping scheme envisaged in Chap. 2 requires intensities∼ 106 I0. In this case, laser power constitutes the limiting factor to the spatialextension of the trapping potential.
(iii) Beam quality.— Most applications demand good beam quality and a welldefined polarisation. For this reason single-mode optical fibres are used as spatialfilters. In case of the TA system, such a fibre also provides spectral filtering of ASEbackground in the amplifier output.
3.5.2 Compact external grating diode lasers
A single-transverse-mode laser diode emits a diffraction-limited, elliptical beam.The emission linewidth of such a laser is typically several tens of MHz. The emittedcentre frequency is determined by both the internal cavity formed by the reflectivewaveguide facets and the spectral gain profile. Between “mode hops”, it can becontinuously tuned by means of operating temperature and injection current.
The most common technique to narrow the linewidth of a diode laser to below100 kHz is optical feedback by the first diffraction order from a grating, see Fig. 3.5(“external grating diode laser”, EGDL). The grating establishes an external cavity,while the specular reflection is coupled out. Simultaneous control of the grating angle
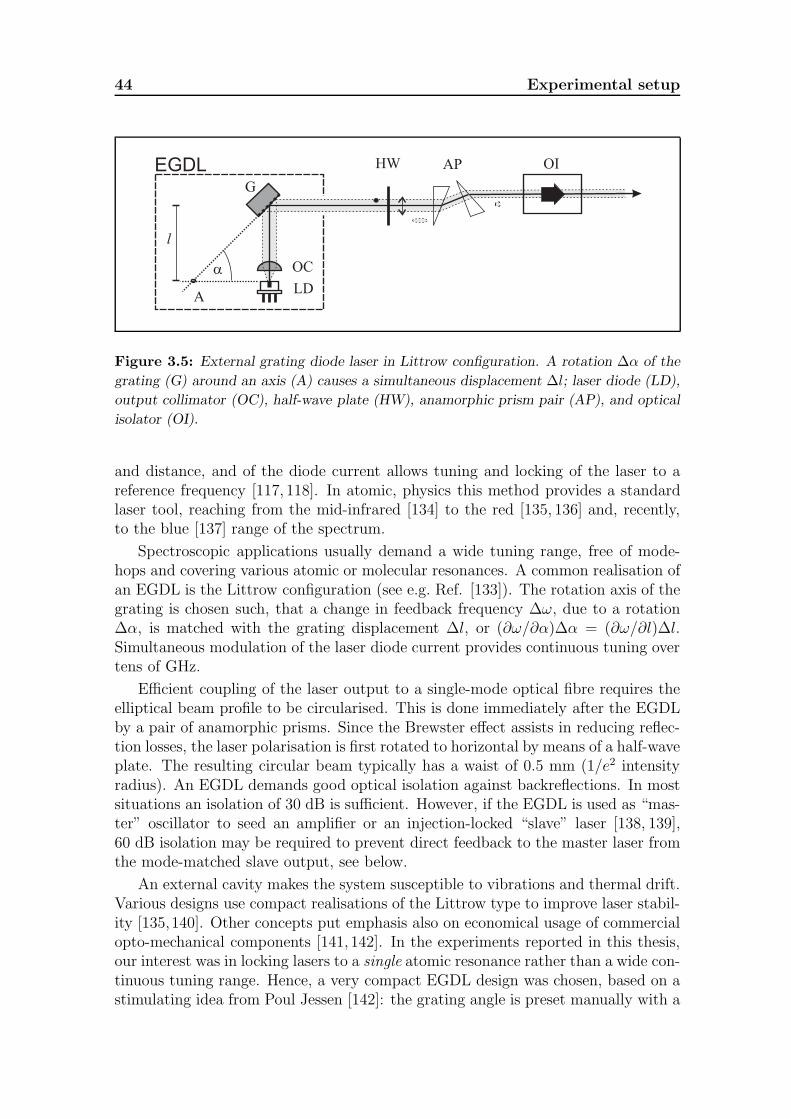
44 Experimental setup
OIAP
LD
HW
A
OC
EGDL
l
G
Figure 3.5: External grating diode laser in Littrow configuration. A rotation ∆α of the
grating (G) around an axis (A) causes a simultaneous displacement ∆l; laser diode (LD),
output collimator (OC), half-wave plate (HW), anamorphic prism pair (AP), and optical
isolator (OI).
and distance, and of the diode current allows tuning and locking of the laser to areference frequency [117, 118]. In atomic, physics this method provides a standardlaser tool, reaching from the mid-infrared [134] to the red [135, 136] and, recently,to the blue [137] range of the spectrum.
Spectroscopic applications usually demand a wide tuning range, free of mode-hops and covering various atomic or molecular resonances. A common realisation ofan EGDL is the Littrow configuration (see e.g. Ref. [133]). The rotation axis of thegrating is chosen such, that a change in feedback frequency ∆ω, due to a rotation∆α, is matched with the grating displacement ∆l, or (∂ω/∂α)∆α = (∂ω/∂l)∆l.Simultaneous modulation of the laser diode current provides continuous tuning overtens of GHz.
Efficient coupling of the laser output to a single-mode optical fibre requires theelliptical beam profile to be circularised. This is done immediately after the EGDLby a pair of anamorphic prisms. Since the Brewster effect assists in reducing reflec-tion losses, the laser polarisation is first rotated to horizontal by means of a half-waveplate. The resulting circular beam typically has a waist of 0.5 mm (1/e2 intensityradius). An EGDL demands good optical isolation against backreflections. In mostsituations an isolation of 30 dB is sufficient. However, if the EGDL is used as “mas-ter” oscillator to seed an amplifier or an injection-locked “slave” laser [138, 139],60 dB isolation may be required to prevent direct feedback to the master laser fromthe mode-matched slave output, see below.
An external cavity makes the system susceptible to vibrations and thermal drift.Various designs use compact realisations of the Littrow type to improve laser stabil-ity [135,140]. Other concepts put emphasis also on economical usage of commercialopto-mechanical components [141, 142]. In the experiments reported in this thesis,our interest was in locking lasers to a single atomic resonance rather than a wide con-tinuous tuning range. Hence, a very compact EGDL design was chosen, based on astimulating idea from Poul Jessen [142]: the grating angle is preset manually with a

3.5 Semiconductor lasers for cooling and trapping 45
grating glue
mountingring
low voltagePZT stack
travel 0.5 mmd
d’’d’
Two-stage flexure gear
action 70 m
d = 2.6 d’ = 7.0 d’’
Grating mount
laser beam
collimationlens tube
horizontalflexure
grating PZTvertical tilt(coarse)
horizontal tiltfine gear
horizontal tiltcoarse
vertical flexure
heatingresistor
clamp(lens tube)
1 cm
Figure 3.6: Compact external grating diode laser.
resolution ∼ 100 MHz and kept fixed in experiments. Fine adjustment is performedby tuning the grating distance from the laser facet with a piezo actuator (PZT).
The construction of the laser head is shown in Fig. 3.6. A laser diode (TO-5window package, 9 mm dia.) is mounted in a collimation lens tube (ThorLabs,type LT230B, f = 4.5 mm, N.A.=0.55). The beam can thus conveniently be colli-mated before the lens tube is mounted in the laser head. A gold coated holographicgrating with 1800 lines/mm provides feedback to the laser diode (Carl Zeiss Jena,no. 263232-9451-325, 10× 10× 6 mm3). The feedback angle for 780 nm and 795 nmwavelength is α = 44.6 and 45.7, respectively. In a similar construction also grat-ings with 1200 lines/mm were used (Zeiss, no. 263232-9052-825). The feedback anglewas there ≈ 19. However, these gratings provided significantly less output power.

46 Experimental setup
Both collimation package and grating are integrated in a single, milled blockfrom copper-bronze. The rotational degrees of freedom for the grating are providedby a flexure construction. Adjustment of optical feedback (coarse vertical tilt) isachieved with a small screw using an Allan key. The feedback wavelength (hori-zontal tilt α) is coarsely set with a screw also at the flexure mount, whereas fineadjustment is achieved using an additional double-stage flexure gear. Not shown inthe drawing is an AD590 temperature sensor, attached to the base of the laser head,close to a Peltier thermo-electric cooler (TEC). The small volume of the laser headallows relatively fast temperature control and provides good thermal drift stabilityto the external cavity. In particular, the flexure grating mount has better thermalconductance than a comparable spring-loaded construction using ball-bearings. Thechoice of copper-bronze (7% Sn) is a compromise between thermal and elastic prop-erties [140]. The typical passive stability of this system is ∼ 100 MHz per hour andlimited by both thermal drift and drift of the PZT.
The laser head is mounted via the TEC on a brass heatsink that can be wa-ter cooled and also includes a compartment for laser current modulation circuitry.Vibrations from the optical table are damped by a polymer sheet underneath theheatsink (Edmund Scientific, Sorbothane) The laser head is shielded from surround-ing airflow and from electro-magnetic noise by a metallised cap. This cap allowsaccess to the fine adjustment gear.
The flexure gear.— In the drawing of the double-stage gear, the concentricpairs of large and small circles indicate the motion of parts from the gear, or thetranslations d −→ d′ and d′ −→ d′′, respectively. The total translation is 7:1. Asingle turn of the screw (d = 0.5 mm) results in a travel of d′′ = 70 µm. The lengthchange of the external cavity is ∆l ≈ 0.3 d′′, or 20 µm per turn of the screw. Thefrequency change of the cavity is ≈ 20 GHz/µm. (With a cavity length of ≈ 20 mm,the free spectral range is FSR≈ 7.5 GHz.) This resolution is sufficient to allowsmooth manual presetting of the laser frequency. Essential is, that the user touchesan actuator fixed to the bulk of the laser head rather than to the vibrationallysensitive grating holder.
The PZT stack actuator.— The grating is directly glued to a polymer-moldedlow-voltage PZT stack actuator (Piezomechanik, bare actuator type PSt 150/7/7,travel 7 µm for 150 V). The length or frequency tuning of the cavity is given by≈ 30 nm/V, or ≈ 0.6 MHz/mV, respectively. The only moving mass is that of thegrating. This allows a faster response when tuning the cavity length as comparedwith a rotational grating mount. A prestressed PZT device in a tubular steel casehas also been tested (PSt 150/5/7VS10), in first instance promising a more linearresponse. Unfortunately, the weight of the horizontally mounted grating bent thePZT. This resulted in friction with the steel case, causing an unreliable actuatorresponse [Pickelmann, Piezomechanik, private communication].

3.5 Semiconductor lasers for cooling and trapping 47
5p P2
1/2 362
5s S2
1/2 3036 MHz
5p P2
3/2121
6329
F
( =26.2 ns)1
2
2
2
3
3
3
4
( =27.7 ns)
Rb (I=5/2)85 Lasers
812
6835 MHz
267
157
72
D1
(79
5.0
nm
)D
2(7
80
.2n
m)
F
1
1
1
2
2
2
3
0
Rb (I=3/2)87
3
1
56
7
2
4
Figure 3.7: Hyperfine structure of rubidium [143,144].
(i) Near resonance cooling, probing and hyperfine pumping:beam line Fg → Fe detuning fibre output(1) D2 2 → 3 0− (±8) Γ 0− 500 µW probing on cycling transition(2) D2 2 → 2 0− (±8) Γ 0− 500 µW hyperfine depumping to Fg = 1(3) D2 2 → 3 (−10)− 0Γ 20 mW MOT, molasses cooling(4) D1 1 → 2 resonant 10 mW hyperfine repumping to Fg = 2
(ii) Far off-resonance dipole potentials:(5) D1 1 → 2 ±2 nm 120 mW inelastic EW mirror,
dark state trapping(6) D2 2 → 3 ±2 nm 200 mW elastic EW mirror,
atom guiding, trapping(7) D2 1 → 2 ±2 nm 200 mW inelastic EW mirror
Table 3.1: Laser frequencies used in experiments with 87Rb.

48 Experimental setup
3.5.3 The laser park for atom-optical experiments
An experiment with rubidium requires various frequency-stabilised laser sourcestuned to specific optical resonances of the considered isotope, here 87Rb. Fig. 3.7shows the hyperfine energy levels of the rubidium D1 and D2 line. The opticaltransitions, labelled (1)−(7), indicate the corresponding laser frequencies in oursetup of diode laser systems. The specific usage of the lasers is listed in Table 3.1.An overview of this setup is given in Fig. 3.8. It is specified essentially by twogroups of lasers, (i) EGDL’s tuned close to a rubidium resonance, some of which areamplified by an “injection-locked” laser diode, and (ii) high-power tapered amplifiersused far off-resonance (see Chap. 4).
(i) Cooling, probing and optical hyperfine pumping.— The laser frequen-cies of the beams (1)− (3) are derived from an EGDL that is stabilised by feedbackfrom a frequency modulation (FM) spectroscopy on rubidium. The EGDL servesas a master oscillator for an injection-locked slave diode laser (ILDL), providingthe trapping and cooling light of beam (3). The laser diodes used for the EGDL’swere 60 mW single-spatial and -frequency mode laser diodes with a specified wave-length close to the D1 or D2 line (Hitachi, HL 7851G98, selected 781 − 785 nm;Mitsubishi, ML64114R, selected 788 − 793 nm). Recently also an 80 mW devicebecame available (Sanyo, DL-7140-001, specified 785 nm).
The optical output power of our EGDL’s ranges between 5 − 30 mW after theisolator, depending on the used laser diode. A small fraction (∼ 0.5 mW) is splitoff to be used for spectroscopy. The lasing frequency mode of both master andslave can be permanently monitored by an optical spectrum analyser. The seedingbeam from the master laser was inserted into the slave’s beam path by means of theaccessible output polariser of a 30 dB optical isolator (Gsanger, single-stage typeFR780). Perturbing feedback from the slave to the master is thus prevented by thisisolator, in addition to the 60 dB isolator directly after the EGDL. Mode matchingof master and slave was achieved using identical beam collimation and circularisingoptics, see Fig. 3.5. If optimally aligned, a seeding input of 100 µW was sufficient toprovide a stable locking range over > 10 Γ, as required to load a MOT and performmolasses cooling.
Fast and continuous frequency control of the beams (1)− (3) was achieved usingacousto-optic modulators (AOM) in double-pass, see below. For the beams (1) and(2), the AOM also serves as a power modulator and a shutter.
Figure 3.8: The system of stabilised lasers and amplifiers (previous page). Injection-
locked diode laser (ILDL), tapered amplifier (TA), half-wave plates (HW), optical spec-
trum analysers (SA), grating spectrometer (GS) and wavelength meter (WM). The fre-
quency modulation (FM) and Zeeman polarisation (ZS) spectroscopy schemes are indicates
symbolically (Rb). Frequency shifting AOM’s in double-pass are explained in detail below:
lens (L), quarter-wave plate (QW), diaphragm (D), and mirror (M). The laser frequency
ωL is shifted by twice the RF frequency of the acoustic wave, ωRF.
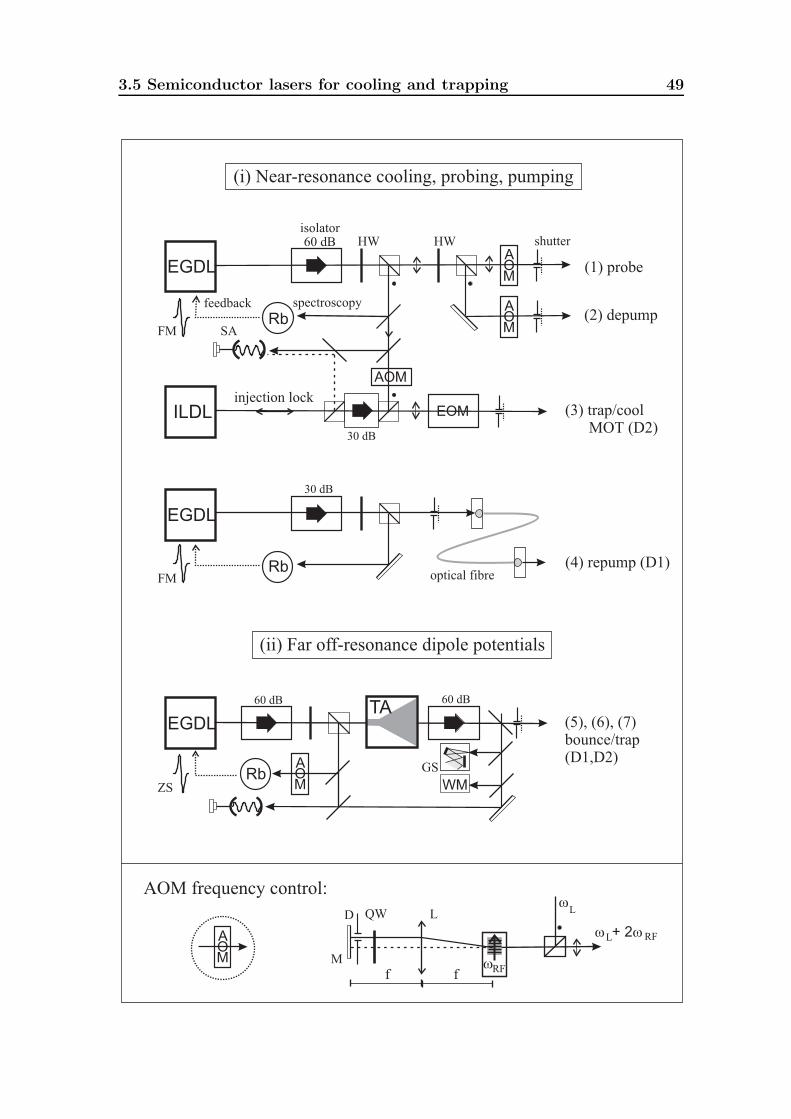
3.5 Semiconductor lasers for cooling and trapping 49
(2) depump
(5), (6), (7)bounce/trap(D1,D2)
(1) probe
(3)MOTtrap/cool
(D2)
(4) repump (D1)
EGDL
RbA
MO
TA
WM
60 dB 60 dB
EGDL
Rboptical fibre
EGDL
Rb
AOM
A
MO
EOM
A
MO
ILDL
isolator
spectroscopyfeedback
shutter
injection lock
30 dB
60 dB
30 dB
HW HW
SA
(ii) Far off-resonance dipole potentials
(i) ooling, probing, pumpingNear-resonance c
GS
AOM frequency control:
A
MO
QW
+ 2
D
f f
L
M
RFL
L
RF
FM
FM
ZS

50 Experimental setup
The EGDL of beam (4) provides hyperfine repumping light to transfer atomsfrom Fg = 1 to Fg = 2, mainly for operating the MOT and cooling but also forspecific probing techniques, see Chap. 7.
All beams were coupled to single-mode optical fibres, as indicated for beam(4). Coupling efficiencies were achieved, ranging between 70− 85% for circularisedbeams of single-mode laser diodes, using compact fibre coupling ports, designed forbeam input diameters between 0.9−1.8 mm (OFR, type PAF-X-5-780). These portswere used with standard fibre patchcords with angle-polished fibre connectors (typeFC/APC). This avoids etalon effects from reflections at the fibre facets. The fibreswere not polarisation conserving. However, twisting the fibres in loops and fixingthem to the optical table provided arbitrary polarisation control of the output beam.
(ii) Far off-resonance dipole potentials.— High power output up to 200 mWfrom a single-mode fibre is achieved in two systems using tapered semiconductoramplifiers (TA). Only one scheme is sketched in Fig. 3.8. One system provides beam(5), the other provides the beams (6) and (7). The gain elements are each seeded bya well isolated EGDL. A detailed characterisation of these systems is given in thenext chapter.
For near-resonance applications, the EGDL can be frequency stabilised by a Zee-man polarisation spectroscopy (ZS). A tunable frequency offset between ±500 MHzfrom the referenced atomic resonance is achieved using an AOM. For larger detun-ings, the EGDL remains unlocked and the frequency can be monitored by meansof an optical spectrum analyser, a wavelength meter (Coherent, WaveMate), or agrating spectrometer (Ocean Optics, PC2000).
Laser frequency tuning by acousto-optical modulators.— Laser frequenciesare shifted using acousto-optic modulators in double-pass, also shown in Fig. 3.8.A lens (L) of focal length f (between 10− 20 cm) and a mirror (M) form a foldedtelescope. After the first passage of the AOM, the Bragg-deflected beam is retro-reflected and collimated again before passing the AOM a second time. All lightbut the selected diffraction order is blocked by a diaphragm (D). The polarisationof the retro-reflected beam has been turned by 90, passing twice a quarter-waveplate. The light is coupled out by a polarising beam splitter cube. Using Braggdeflection in the first diffraction order, the light undergoes a net frequency shiftof twice the RF modulation frequency ωRF, with no net deflection or frequencydependent displacement. This property is particularly important when shifting thefrequency of the master laser in an injection-locking scheme or when coupling lightto an optical fibre. Both cases require excellent directional beam stability.
A typical double-pass efficiency is 50% in first diffraction order. Higher orders arenot practical due to their low efficiency. Our modulators have PbMoO4 crystals andaccept random polarisation [A.A. Opto-Electronique, type AA.SP.200/B100/A0.5-ir (ωRF = 200 ± 50 MHz) and AA.MP.25-IR (110±30 MHz); Isomet, type 1205C(80±15 MHz)]. It is recommended to use linear polarisations only, since birefrin-gence of the crystal together with varying RF load may lead to severe thermal driftin the diffracted beam power.

3.5 Semiconductor lasers for cooling and trapping 51
In the laser setup of Fig. 3.8(i), AOM’s are used to derive the required frequenciesfrom the master laser that is locked to the (bf) cross-over spectroscopy signal of theFg = 2 −→ Fe = 1, 3 transitions, see Fig. 3.9. The cross-over is centred betweenthese transitions. Hence, a blue shift of 212 MHz realises the resonant probe (1) onthe cycling transition Fg = 2 −→ Fe = 3, using an AOM with 110 MHz specifiedcentre frequency. By a red shift of 133 MHz, the depumping beam (2) on the opentransition Fg = 2 −→ Fe = 2 is realised. The injection-locked slave is supplied witha shifted seed beam, thus saving power from the slave for the experiment. Usingan AOM with 80 MHz centre frequency, beam (4) is thus tuned 0− 10 Γ to the redof the Fg = 2 −→ Fe = 3 transition. The collimation of the (astigmatic) masterlaser beam was optimised for mode-matching the slave laser. This resulted in poorbeam quality and thus poor AOM efficiencies in beam (1) and (2). In a later stage, asecond injection-locked slave laser supplied these beams with more power and betterbeam quality.
When using an AOM as a switch or power modulator, “leakage” into the selecteddiffraction order reduces the extinction to typically 1 : 1000. Therefore we use alsomechanical shutters. Power modulation with an extinction of 1 : 200 is obtained forbeam (3) by an electro-optical modulator. [Gsanger, type LM0202 5WIR, aperture3× 3 mm2. We use also a version of the LM0202 5WIR with 5× 5 mm2 aperture.]
3.5.4 Laser frequency stabilisation
The lasers were locked to rubidium resonances using Doppler-free saturation spec-troscopy [133]. Rubidium is commonly used as a saturated vapour in spectroscopycells at room temperature. Most spectroscopy schemes provide absorptive signals(“dips”), resolving the natural transition linewidth Γ. It is necessary to derive adispersive signal with a zero-crossing as feedback to the laser. Three common tech-niques are:
• Frequency modulation (FM) of the laser creates RF sidebands [119]. A dis-persive signal is obtained by mixing the spectroscopy signal with the local RFoscillator and adjusting the phase.
• Zeeman spectroscopy employs nondegenerate magnetic sublevels. “Disper-sion” signals are electronically generated from oppositely frequency-shiftedabsorptive signals of orthogonal polarisations [120–122].
• Polarisation spectroscopy [133,145] probes the dispersion of the atomic speciesrather than the absorption, and a feedback signal is directly obtained. This canalso be used in passive schemes, relying on purely optical feedback [146,147].
FM spectroscopy has an intrinsically large bandwidth providing fast feedback tothe laser, with good distinction between neighbouring optical transitions. However,this technique is relatively complex due to RF electronics. More important, the FMsidebands imprinted onto the laser output may perturb the laser application. (Thiscould be avoided by using an EOM to modulate only the light used for spectroscopy.)

52 Experimental setup
We employ the FM technique therefore as a robust locking scheme for less sensitivetasks, such as the MOT, optical pumping or probing atoms. Zeeman spectroscopyis less demanding in electronics and optics equipment. We use it, with the far off-resonance lasers, were the moderate accuracy of the artificially dispersive lockingsignal is not an issue. In the following, a brief description of both methods is given.
Frequency modulation spectroscopy.— The FM scheme is shown in Fig. 3.9.The optical part is based on Doppler-free saturation spectroscopy: Light is splitoff from the output of an EGDL and sent in a first pass through a spectroscopycell with rubidium vapour. If resonant within the Doppler-broadened absorptionprofiles, rubidium optical transitions are saturated. When the laser scans acrossa resonance, the retro-reflected beam probes these transitions. The Doppler effectcancels out on a resonance and an absorptive signal with a width ∼ Γ is recorded.Optimal retro-reflection, i.e. Doppler cancelling is achieved using a quarter-waveplate and a polarising beam splitter cube.
A dispersive signal is achieved by modulation of the diode laser current, I, witha local oscillator radio frequency, here ωRF = 40 MHz. This results in frequencysidebands, ωL ± ωRF, next to the laser carrier, ωL, shown in the inset of the figure.Both sidebands beat with the carrier. If no spectral atomic feature is covered byany of these laser frequencies, the net beating cancels out, due to the opposite phaseof the sidebands. The photodetector then receives no signal ∝ ωRF. However, ifone of the frequencies probes a resonance, the beating is out of balance and thephotodetector detects an RF signal. (The detector is supplied with a RF bandpassfilter.) By amplification of this signal, adjusting the phase, and mixing with a localoscillator, the dispersive (low frequency) signal for the laser lock is obtained and fedback to both, laser current and grating actuator. The grating feedback tackles downslow drifts of the laser using a longer integration time constant than the intrinsicallyfast current feedback.
Two exemplary FM spectra are plotted in the figure. For the (f) transition alsothe sidebands are resolved. Typical for this type of Doppler-free spectroscopy isthe occurrence of so-called “cross-over” resonances, given the Doppler broadenedabsorption profiles of several resonances overlap. This is the case with room tem-perature rubidium vapour. The cross-over resonance of two transitions is located atthe average transition frequency. (The spectra in the figure show that the overlapof the Doppler profiles is larger for the D2 line.) In our laser setup we locked theEGDL for the beams (1)−(3) to the (bf) cross-over.
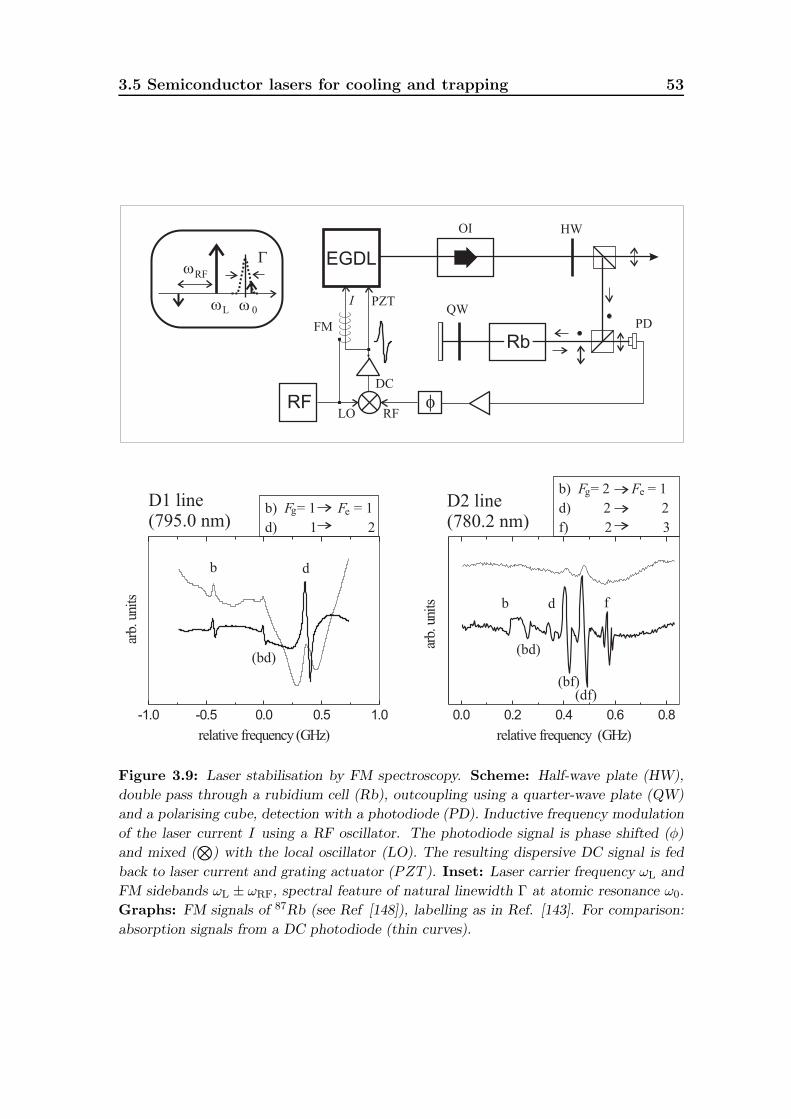
3.5 Semiconductor lasers for cooling and trapping 53
RF
0L
RF
EGDL
RF
DC
LO
PZTI
FM
Rb
QW
HWOI
PD
-1.0 -0.5 0.0 0.5 1.0
relative frequency (GHz)
arb.
units
0.0 0.2 0.4 0.6 0.8
arb.
units
relative frequency (GHz)
(bd)
D1 line(795.0 nm)
D2 line(780.2 nm)
b) = 1 = 1
d) 1 2
F F
b) = 2 = 1
d) 2 2
f) 2 3
F F
b
(bd)
b
d
d f
(df)(bf)
g e
g e
Figure 3.9: Laser stabilisation by FM spectroscopy. Scheme: Half-wave plate (HW),
double pass through a rubidium cell (Rb), outcoupling using a quarter-wave plate (QW)
and a polarising cube, detection with a photodiode (PD). Inductive frequency modulation
of the laser current I using a RF oscillator. The photodiode signal is phase shifted (φ)
and mixed (⊗
) with the local oscillator (LO). The resulting dispersive DC signal is fed
back to laser current and grating actuator (PZT ). Inset: Laser carrier frequency ωL and
FM sidebands ωL ± ωRF, spectral feature of natural linewidth Γ at atomic resonance ω0.
Graphs: FM signals of 87Rb (see Ref [148]), labelling as in Ref. [143]. For comparison:
absorption signals from a DC photodiode (thin curves).

54 Experimental setup
F = 1
F = 10
+1
m = 0
(a)
(b) (c)
+
-
+
-
QW
Rb -
B
PB
+
-
- +
-1
-1
+1
- +
-+-
o
gg
e
Figure 3.10: Laser stabilisation by Zeeman spectroscopy. (a) Doppler-free saturation
spectroscopy: rubidium cell (Rb) with axial magnetic field (B), quarter-wave plate (QW),
polarising beam splitter cube, and photodetectors for σ± polarisation. (b) Exemplary
Zeeman shift of magnetic sublevels: the resonance is blue (red) shifted for σ+ (σ−) po-
larised light. (c) Zeeman-shifted resonances of both circular polarisations. The dispersive
signal obtained by subtraction.
Zeeman spectroscopy.— The scheme for this method is shown in Fig. 3.10 (seealso Ref [148]). It uses the decomposition of linearly polarised light into circularpolarisations, σ±. In Doppler-free saturation spectroscopy, rubidium vapour is madebirefringent by using the Zeeman shift of magnetic sublevels in an axial, homoge-neous magnetic field. Therefore, the orthogonal circular polarisations encounteroppositely shifted resonances. Both polarisations are detected independently usinga combination of a quarter-wave plate and a polarising cube as an analyser for thecircular polarisation basis. A dispersive laser-lock signal is obtained electronically.This method requires an optical transition scheme with different g-factors, i.e. dif-ferent Zeeman shifts in the ground and excited state sublevels. For example, for theD1-line Fg = 1 −→ Fe = 1 transition this are gg = 9/4 and ge = 3/2, respectively.

3.6 Real-time experimental control 55
3.6 Real-time experimental control
An atom-optical experiment constitutes a series of processes in quick succession,demanding real-time application of analogue and digital control signals. Data ac-quisition (DAQ) also requires precise triggering with µs-resolution. A typical exper-imental sequence consists of loading a MOT, cooling atoms in optical molasses, re-leasing them for bouncing on an evanescent-wave mirror and, finally, imaging themwith a CCD camera. Laser beams must be switched on time scales of typically0.1 ms. We employ a common personal computer (PC), that operates LabVIEWunder WindowsNT, to do both real-time control and data acquisition. This providesa flexible system with various software-controlled input and output channels. It canbe configured for arbitrary time sequences. These tasks are performed by severalhardware extension cards. In particular, a self-sustaining digital signal processor(DSP) performs the real-time control of digital output (trigger) channels, thus cir-cumventing perturbing interrupts of the PC processor. Table 3.2 gives an overviewon the various hardware components.
PC platform and DAQ hardware.— The system is based on a PC with Pen-tium II processor. An analogue output board (AT-AO-10) controls the modulationof AOM and EOM drivers. A general purpose DAQ board (MIO-16E-4) providesanalogue inputs, which are used, e.g., to acquire photodetector signals for time-of-flight measurements. This board has additionally two waveform output channelsand two general purpose counters. Therefore, it is also used as a versatile functionand pulse generator. Two more slots of the PC are occupied by the DSP (DIO-128)and by the interface (ST-138) of a digital camera system.
The fluorescence of trapped atoms is permanently monitored by several analoguevideo cameras. These cheap surveillance cameras (Conrad Electronic) have no near-infrared blocking filters and are thus sensitive to the rubidium fluorescence. Thevideo signals can be recorded by a framegrabber (FlashBus), e.g., for beam profilingtasks or assisting laser beam alignment in the UHV vapour cell. A grating spec-trometer (PC2000) allows monitoring laser wavelengths. The framegrabber and thespectrometer are operated by a second PC.
Digital signal processor and LabVIEW user interface.— The main task ofthe DSP is to provide precise timing during the experiments. In a screen interface,the user fills in a time schedule of the experimental events. This record containsthe possibly altered status of digital and analogue output ports for a given event,including the time of the event with 1 µs resolution for the DSP timer. Using aLabVIEW driver, the DSP loads the time table and the digital output record intoits on-board memory. The analogue output record is buffered in the PC’s memoryand handed over on request to the FIFO-buffered analogue output board by theDMA (“direct memory access”) controller. All input and output channels are ex-perimentally accessible through a front-end connector panel. One digital output ofthe DSP supplies a hardware event-update trigger to the analogue output board.Other digital outputs provide modulation signals for AOM/EOM drivers, magnetic

56 Experimental setup
field coil current supplies and mechanical shutter drivers. CCD image capture andinput of photodetector signals are triggered similarly. The DSP works independentlyfrom the PC. Thus, other LabVIEW routines can be used on the PC to acquire mea-surement data. The LabVIEW interface for the experiments discussed in this thesiswas programmed in a simple and effective way, mainly using exemplary routinesfrom the DSP driver library. Meanwhile, we use a commercially available programthat has been developed by H. Alberda (AMOLF Institute, Amsterdam) and is veryconvenient in use, including also DAQ functions.
CCD digital camera imaging system.— An imaging system for (cold) atomsmust have an accurate image capture trigger and a well defined exposure time.Mechanical shutters are usually too slow. Therefore we use a frame-transfer system(Princeton Instruments). Half of the CCD array is covered by a mask. After anexposure, the image is shifted within 1.6 ms under the mask to be shielded againstfurther illumination and is read out. After shifting, the CCD is ready for anotherimage capture. If masking a larger area of the sensor (1024× 512 pixels in total),an even faster sequence of more than two image frames, although smaller in size,can be captured (cf. Refs. [149, 150]). An advantage of the frame transfer for ourexperiments is, that the sensitive area can be kept “clean” (unexposed) by means ofcontinuous line shifting, until ∼ 2 ms before an image capture. This is particularlyimportant, if an image is taken only a few ms after a strong (saturating) illuminationsource, e.g. an evanescent-wave, has been switched off.
Other important CCD specification are the spectral sensitivity, the pixel size, thepixel filling ratio, the pixel well depth (electron capacity), and the noise properties(dark current). These specifications are discussed in Ref. [151]. We may expect astrong background illumination while imaging optically trapped atoms. Therefore,the well depth of the pixels must be sufficiently deep ( 105 electron charges) toavoid saturation, and the resolution of signal digitisation should be at least 10 bits.It is also this expected background illumination why we don’t use an intensifiedimaging system.
There exist also “interline transfer” systems, which have read-out registers be-tween adjacent pixel lines. This allows for even faster cleaning, shuttering and readout. However, the pixel filling ratio and the well depth of these CCD’s are low.
We use our CCD system with either a commercial 50 mm camera objective tocapture fluorescence images of bouncing atoms (see Chap. 6) or with a relay telescopeto do absorption imaging (see Chap. 7).
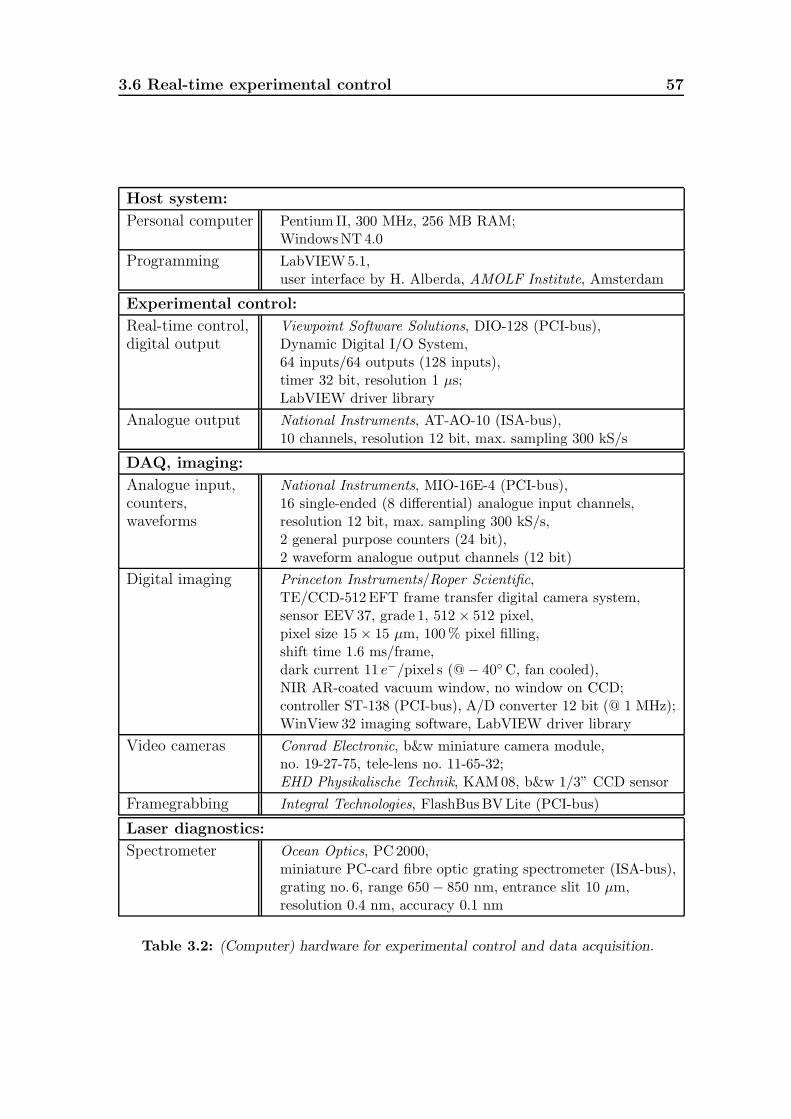
3.6 Real-time experimental control 57
Host system:
Personal computer Pentium II, 300 MHz, 256 MB RAM;WindowsNT4.0
Programming LabVIEW5.1,user interface by H. Alberda, AMOLF Institute, Amsterdam
Experimental control:
Real-time control,digital output
Viewpoint Software Solutions, DIO-128 (PCI-bus),Dynamic Digital I/O System,64 inputs/64 outputs (128 inputs),timer 32 bit, resolution 1 µs;LabVIEW driver library
Analogue output National Instruments, AT-AO-10 (ISA-bus),10 channels, resolution 12 bit, max. sampling 300 kS/s
DAQ, imaging:
Analogue input,counters,waveforms
National Instruments, MIO-16E-4 (PCI-bus),16 single-ended (8 differential) analogue input channels,resolution 12 bit, max. sampling 300 kS/s,2 general purpose counters (24 bit),2 waveform analogue output channels (12 bit)
Digital imaging Princeton Instruments/Roper Scientific,TE/CCD-512EFT frame transfer digital camera system,sensor EEV37, grade 1, 512 × 512 pixel,pixel size 15× 15 µm, 100% pixel filling,shift time 1.6 ms/frame,dark current 11 e−/pixel s (@− 40 C, fan cooled),NIR AR-coated vacuum window, no window on CCD;controller ST-138 (PCI-bus), A/D converter 12 bit (@ 1 MHz);WinView 32 imaging software, LabVIEW driver library
Video cameras Conrad Electronic, b&w miniature camera module,no. 19-27-75, tele-lens no. 11-65-32;EHD Physikalische Technik, KAM08, b&w 1/3” CCD sensor
Framegrabbing Integral Technologies, FlashBusBVLite (PCI-bus)
Laser diagnostics:
Spectrometer Ocean Optics, PC 2000,miniature PC-card fibre optic grating spectrometer (ISA-bus),grating no. 6, range 650 − 850 nm, entrance slit 10 µm,resolution 0.4 nm, accuracy 0.1 nm
Table 3.2: (Computer) hardware for experimental control and data acquisition.
58 Experimental setup
3.7 The magneto-optical trap
3.7.1 Trapping principle and molasses cooling
Since the first demonstration [33], the magneto-optical trap and optical molassescooling have been topic of numerous experimental and theoretical investigations.For detailed information see, e.g., Refs. [11, 12, 70, 71]. Particular work on vapour-cell configurations has been reported in Refs. [124–126,132].
The MOT is based on the spontaneous light force [2,152,153], i.e. the transfer ofphoton recoil momenta, k0, to atoms, where k0 = 2π/λ0 is the vacuum wave vectorof near-resonance laser light. The configuration of the light field is chosen such thatthis momentum transfer occurs with a preferential direction and in a succession ofabsorption and spontaneous emission cycles. A central trapping force is establishedin combination with a (velocity dependent) friction force that cools the atoms toa temperature close to the “Doppler limit”, TD = Γ/2kB. For rubidium, with atransition linewidth Γ/2π = 6.1 MHz, this limit is TD = 146 µK.
Sub-Doppler cooling schemes, such as polarisation gradient cooling in opticalmolasses, provide temperatures close the “recoil limit”, TR = (k0)
2/MkB. Withthe rubidium mass M = 87 amu, this is TR = 361 nK. The corresponding photonrecoil velocity is vrec = 5.88 mm/s. (Some additional, useful numbers for rubidiumare listed in the Appendix A.1).
Fig. 3.11(a) shows the principle of the MOT in a one-dimensional scheme. Forconvenience, a Jg = 0 −→ Je = 1 transition scheme is considered. In a magneticfield of constant gradient, B(z) = b z, the excited state sublevels, me = 0,±1,are Zeeman-shifted in a position dependent way by ωZ(z,me) = mege(µB/) b z. Forsimplicity, we assume a Lande factor ge = 1. The counter-propagating laser beamsare red detuned, δ = ωL − ω0 < 0. The circular polarisations are assigned withrespect to the z-axis, which is the atomic quantisation axis. The σ+-beam thattravels to the right carries + angular momentum, the σ−-beam that travels to theleft carries −. However, when defining the polarisation state with respect to thepropagation direction, and following the notation of Ref. [7], both beams are “left-circularly” polarised (L): An observer facing the source sees the electric field vectorin a counter-clockwise rotation. The Zeeman shift brings the red detuned light inresonance with the appropriate transition to a sublevel me, such that the atom ispushed towards z = 0. This establishes a central trapping force.
The cooling effect in the MOT configuration is based on the Doppler shift ofthe atomic resonance, ωD(v) = −k0v. Due to the red laser detuning, moving atomsare shifted into resonance with the counter-propagating laser (ωD > 0). Hence, amoving atom preferentially absorbs decelerating photons. This mechanism is called“Doppler cooling”. Note that it is effective also in the presence of the magneticfield gradient, thus enabling a combined spontaneous trapping and cooling force F .This force can be written in terms of the scattering rate of an atom in the beamstravelling to the right (F+) and to the left (F−), as shown in Fig. 3.11(a):
F(z, v) = F+(z, v) + F−(z, v) , (3.1)

3.7 The magneto-optical trap 59
(a) (b)
4 cm
I-I
70o
zJ = 0
J =1
m = 0
m =+1
m = -1L
+ -
m = -1m = +1
z
y
x
B b z=
B1
B3
B2
( )L ( )L
R
R
R
L
R
L
g
e
e
e
e
e
e
Figure 3.11: The magneto-optical trap. (a) Simplified 1D two-level scheme with a red
detuned laser, δ = ωL − ω0 < 0. Trapping: The sublevels are Zeeman-shifted in a
magnetic field gradient. An atom at a position z, preferentially absorbs resonant light
that pushes the atom towards z = 0. Doppler cooling: An atom preferentially absorbs
counter-propagating light that is Doppler-shifted into resonance. (b) 3D configuration of
three counter-propagating beam pairs, B1, B2, and B3 in the vapour cell. The mutual
angle of B2 and B3 in the yz-plane is 70. The opposing currents, ±I, in the coils generate
a quadrupole field gradient. The polarisation notation of right (R) and left (L) circular
light visualises the symmetries of the configuration.
F±(z, v) = ±k0Γ
2
ILI0
1
4δ2±(z, v)Γ2
+ 1 +ILI0
. (3.2)
Here, I0 is the saturation intensity for the atomic species, and δ±(z, v) is the effectivedetuning including Zeeman and Doppler shift:
δ±(z, v) = δ ∓ µB
bz ± k0v . (3.3)
Usually, a detuning of |δ| ∼ Γ is applied and the magnetic field gradient isb ∼ 10 G/cm.
In order to achieve temperatures close to the recoil temperature, we apply PGCin “σ+σ−” optical molasses. Comprehensive descriptions of the cooling process canbe found in [11,12,70]. This technique is particularly useful here: when the magneticfield is switched off, the MOT laser configuration just results in the required “σ+σ−”polarisation scheme. Only laser intensities and detunings have to be adapted whilstswitching. Note that there is no trapping force in the PGC configuration.
60 Experimental setup
3.7.2 Experimental configuration
The 3-dimensional realisation of the MOT scheme is shown in Fig. 3.11(b). Weuse one horizontal (B1) and two diagonal (B2, B3) pairs of counter-propagating,circularly polarised, collimated laser beams. The horizontal x-direction is the axisof cylindrical symmetry of the magnetic field. The mutual angle of B2 and B3 inthe yz-plane is 70. This allows beam waists up to 5 mm (1/e2 intensity radius)without significant clipping of the beams by the prism, given a MOT height largerthan ∼ 5 mm. In the following, before turning to the experimental performance ofthe MOT, (i) the optical setup and, (ii) the magnetic field coils are described.
(i) Optical setup.— The optical components for the MOT were arranged in away to maintain access to the vapour cell for other optics. A schematic top viewis shown in Fig. 3.12. The beam pairs B1, B2, and B3 are derived from a singleGaussian beam from a single-mode optical fibre. The fibre output was collimatedto a waist of 4 mm by two achromatic lens doublets, L1 (f = 50 mm, dia. 30 mm)and L2 (f = 300 mm, dia. 40 mm). The lens diameters were chosen large enoughto avoid diffraction fringes in the collimated beam. Two polarising cubes split offsubsequently 1/3 and 1/2 of the power, thus preparing three beams of equal power.The linear polarisation for the splitting is adjusted by polarisation-controlling fibreloops (PCL) and a half-wave plate (HW). Optionally, a polariser is used directly afterthe fibre to keep the splitting ratio constant, despite thermal polarisation drifts ofthe fibre output. The cubes steer the beams B2 and B3 upwards at an angle of35 with the optical table. The beams are then horizontally directed towards theupper mirrors (UM) of the trapping setup, shown in the photograph. These mirrorssteer the beams downwards through the vapour cell under the same angle, 35. Thepurpose of this construction is to use the (dielectric) mirrors exclusively either withnormal or 45 incidence. Care was also taken to have only light in purely linear TEor TM polarisation being reflected under 45 incidence. This secures the polarisationof the reflected light to stay linear. Beam B1 passes the cell horizontally. Beforepassing the cell, all beams become circularly polarised by quarter-wave plates (QW).In retro-reflection, the initial helicity in each beam is restored by a second QW plate.The iris diaphragm (ID) before the beam splitters facilitates initial spatial alignmentof the MOT beams by means of observing the fluorescence of the narrowed beamsin the rubidium vapour cell. A repumping laser (RL) is coupled in by the secondcube and is superposed with the the trapping beams B2 and B3.
The present retro-reflection concept suffers from an imbalance in the laser inten-sities, causing an imbalance in the light forces, for two reasons. First, the cloud ofcold atoms in the MOT is optically dense. Hence, each retro-reflected beam carriesa shadow in the centre. Particularly in molasses cooling this may increase the finaltemperature. To avoid this effect, six independent beams of equal intensity could beused. However, this requires more optical components and twice the laser power. Asimpler solution is to apply a slight directional misalignment of the retro-reflectedbeams, in order to keep the cloud of atoms mostly out of the shadows.
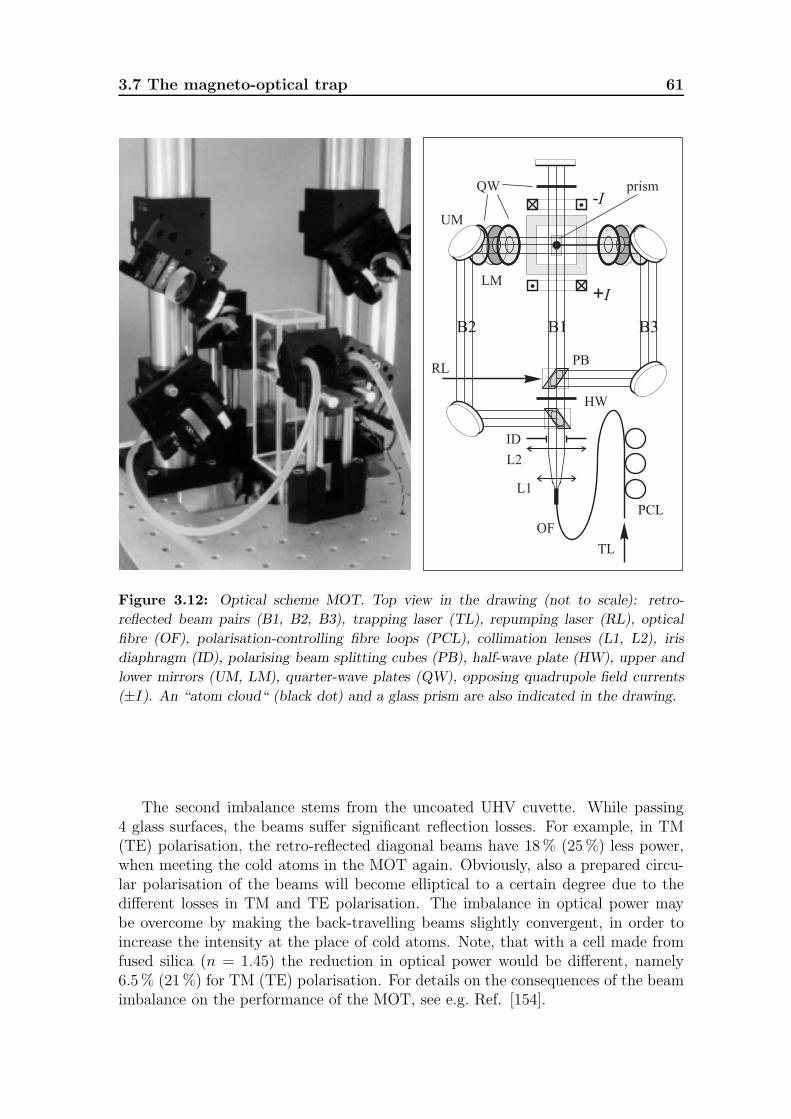
3.7 The magneto-optical trap 61
QW-I
+I
PB
OF
L1
L2
ID
HW
UM
LM
RL
TL
B2 B1
prism
PCL
B3
Figure 3.12: Optical scheme MOT. Top view in the drawing (not to scale): retro-
reflected beam pairs (B1, B2, B3), trapping laser (TL), repumping laser (RL), optical
fibre (OF), polarisation-controlling fibre loops (PCL), collimation lenses (L1, L2), iris
diaphragm (ID), polarising beam splitting cubes (PB), half-wave plate (HW), upper and
lower mirrors (UM, LM), quarter-wave plates (QW), opposing quadrupole field currents
(±I). An “atom cloud“ (black dot) and a glass prism are also indicated in the drawing.
The second imbalance stems from the uncoated UHV cuvette. While passing4 glass surfaces, the beams suffer significant reflection losses. For example, in TM(TE) polarisation, the retro-reflected diagonal beams have 18% (25%) less power,when meeting the cold atoms in the MOT again. Obviously, also a prepared circu-lar polarisation of the beams will become elliptical to a certain degree due to thedifferent losses in TM and TE polarisation. The imbalance in optical power maybe overcome by making the back-travelling beams slightly convergent, in order toincrease the intensity at the place of cold atoms. Note, that with a cell made fromfused silica (n = 1.45) the reduction in optical power would be different, namely6.5% (21%) for TM (TE) polarisation. For details on the consequences of the beamimbalance on the performance of the MOT, see e.g. Ref. [154].

62 Experimental setup
(ii) Magnetic field coils.— The magnetic quadrupole field gradient is providedby a pair of coils, placed in-axis with the horizontal trapping beam, B3. The currents,±I, oppose each other. This results in a magnetic field that increases approximatelylinearly with the distance from the centre. Along the symmetry axis, r = (x, 0, 0),and close to the centre, the field is given by:
B(r) = b x , (3.4)
b = µ0N I3R2d
(R2 + d2)52
x , (3.5)
where N = 25 is the number of turns per coil, made from 0.8 mm dia. copper wire.The wire is stacked in a square grid pattern such that the (average) coil radius isR = 17 mm. The distance between the coils is 2d = 57 mm, being limited by thecuvette of 42 mm width. The resulting field gradient along in the x-direction iscalculated to be |b(I)| = I × 1.9 G/cmA. The coils with an estimated inductionof each ∼ 25 µH can be switched off by a power MOSFET (IRF530) within 20 µs.After switching, the induction current is dissipated by a 4.7 Ω bypass resistor. TheMOSFET switch was chosen with a breakdown voltage of 100 V to manage theinduction voltage peak ∼ 50 V without damage. Also visible in the photograph ofFig. 3.12 are connections for coolant flow through the coil mounts. However, sinceour MOT was not operated continuously over a longer period and the current usuallywas I 10 A, no cooling has been required so far.
The source-free character of the magnetic field, ∇ · B = 0, results in a fieldgradient twice as large along the symmetry x-axis as compared to the orthogonalyz-plane. Also the non-orthogonal crossing angle of the trapping beams in this planetogether with intensity imbalances results in a reduced vertical trapping force. Thismay have caused the observed vertically elongated MOT shape of approximately 1:2aspect ratio.
In order to compensate the earth magnetic field, usually ∼ 0.5 G, and otherstray fields at the location of the MOT, we mounted a cage-like frame of three coilpairs around the setup: 2 rectangular pairs (60 cm wide, 80 cm high) and 1 circularpair for the vertical axis (dia. 85 cm). Each pair consists of 80 turns of 0.8 mm dia.copper wires. The applied current ranged between ±400 mA, thus compensatingindeed fields ∼ 0.5 G.
3.7.3 Loading the MOT
The trapping light of the MOT is tuned 1.5 Γ to the red of the Fg = 2 −→ Fe = 3cycling transition of the 87Rb D2-line (see Fig. 3.7). The atoms are trapped in theFg = 2 ground state. Atoms that are off-resonantly excited to Fe = 1, 2 andthus optically pumped into the Fg = 1 ground state, are transferred back by therepumping laser, which is in resonance with the D1-line (Fg = 1 −→ Fe = 2).Typically, a power of 15 mW is distributed among the three trapping beam pairs.The intensity in the trap centre is ∼ 30 I0.
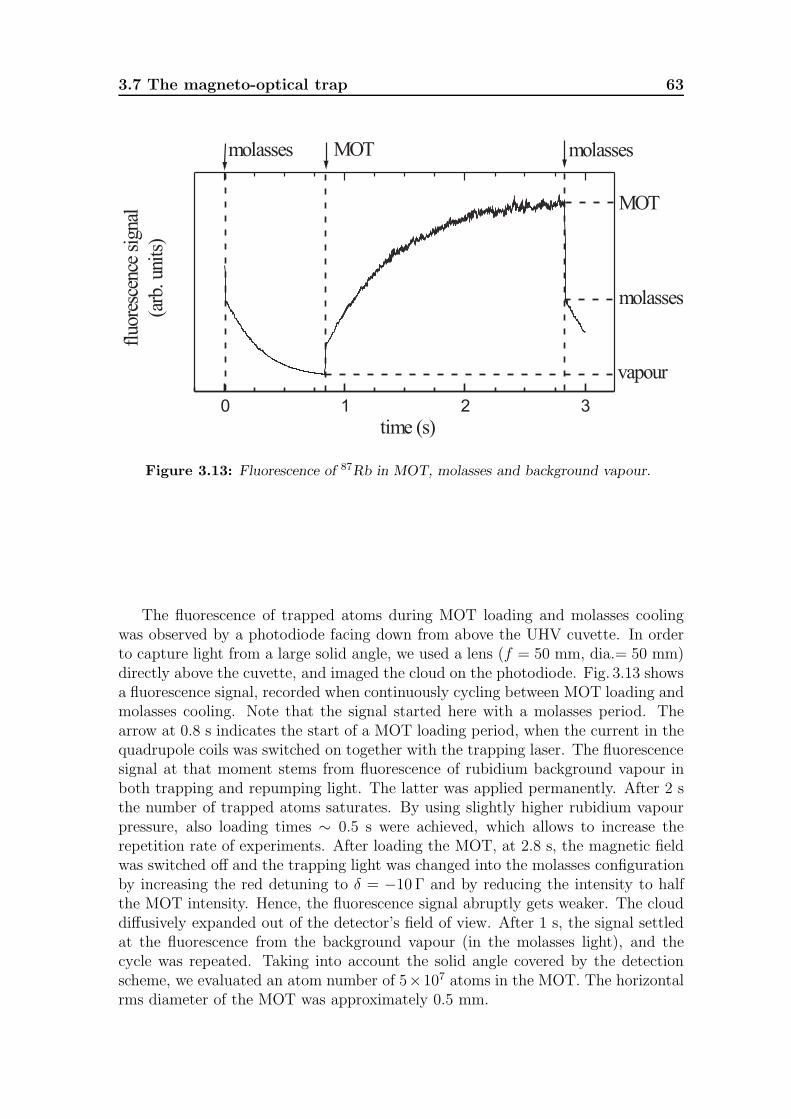
3.7 The magneto-optical trap 63
0 1 2 3
vapour
MOT
molasses
molassesMOTmolassesfl
uore
scen
cesi
gnal
(arb
.uni
ts)
time (s)
Figure 3.13: Fluorescence of 87Rb in MOT, molasses and background vapour.
The fluorescence of trapped atoms during MOT loading and molasses coolingwas observed by a photodiode facing down from above the UHV cuvette. In orderto capture light from a large solid angle, we used a lens (f = 50 mm, dia.= 50 mm)directly above the cuvette, and imaged the cloud on the photodiode. Fig. 3.13 showsa fluorescence signal, recorded when continuously cycling between MOT loading andmolasses cooling. Note that the signal started here with a molasses period. Thearrow at 0.8 s indicates the start of a MOT loading period, when the current in thequadrupole coils was switched on together with the trapping laser. The fluorescencesignal at that moment stems from fluorescence of rubidium background vapour inboth trapping and repumping light. The latter was applied permanently. After 2 sthe number of trapped atoms saturates. By using slightly higher rubidium vapourpressure, also loading times ∼ 0.5 s were achieved, which allows to increase therepetition rate of experiments. After loading the MOT, at 2.8 s, the magnetic fieldwas switched off and the trapping light was changed into the molasses configurationby increasing the red detuning to δ = −10 Γ and by reducing the intensity to halfthe MOT intensity. Hence, the fluorescence signal abruptly gets weaker. The clouddiffusively expanded out of the detector’s field of view. After 1 s, the signal settledat the fluorescence from the background vapour (in the molasses light), and thecycle was repeated. Taking into account the solid angle covered by the detectionscheme, we evaluated an atom number of 5×10⁷ atoms in the MOT. The horizontalrms diameter of the MOT was approximately 0.5 mm.
64 Experimental setup
3.7.4 Time-of-flight temperature measurement
In early experiments on laser cooling, the temperature of cold atom clouds wasinvestigated by a “release & recapture” technique [155], with which the coolinglight is switched off for a short ballistic expansion period of the released cloud afterthat only atoms in reach of the cooling light are recaptured and detected. Thetemperature is derived from the recaptured atom fraction. This method has beensucceeded by the more accurate time-of-flight technique (TOF) [156], which weused also in our experiments. Various other techniques have been reported so far,e.g. using recoil-induced resonances [157] or imaging of ballistically expanding atomclouds [39].
The TOF technique makes also use of the ballistical expansion. During molassescooling, the equilibrium temperature is established after a few ms. In order torelease an atom cloud, we shutter the cooling laser mechanically after typically 4 msof cooling. A significantly longer cooling time might lead to unfortunate diffusiveatom loss. The falling atoms pass a thin sheet of resonant probe light below, andwell separated from the cooling region. Either the fluorescence or the absorption isrecorded as a function of time, see e.g. Fig. 5.2(a). The temperature is obtained byfitting a thermal Maxwell-Boltzmann velocity distribution to the recorded signal.
If the initial cloud size is known only approximately, the TOF method requiresa fall height sufficiently large to make the cloud size negligible with respect to thethermal expansion during the fall time. In our setup, we can drop the atoms overa distance of 5 mm, which is sufficient to determine the temperature within 15%accuracy. The TOF method is also a simple way to investigate atoms bouncing onan atom mirror, see Chap. 5.
Fig. 3.14(a) shows TOF signals for two distinct height settings of the flat probebeam, 1.2 mm and 4.3 mm below the MOT. The origin of the time axis is the timewhen the mechanical shutter of the cooling light was closed. The signals were againrecorded in fluorescence by means of a photodiode from above the vacuum cuvette,similar to the signal shown in Fig. 3.13. The probe had a waist of 0.4 mm verticaland 1.4 mm horizontal (1/e2 radius). It was tuned close to resonance with theFg = 2 −→ Fe = 3 transition of the 87Rb D2-line.
For the fluorescence technique to be efficient also with small quantities of atoms,the probe must saturate the optical transition. In a travelling-wave probe beam, theatoms would be quickly accelerated by the recoils from absorbed photons. The atomsare therefore Doppler-shifted out of resonance and lost for longer recording of theTOF signal. In order to achieve a longer interaction time per atom, the probe wasused in retro-reflection as a standing wave. The flat, horizontal probing section wasformed by a cylindrical telescope with the focus of two cylindrical lenses (f = 75 mm)located below the MOT. An additional measure to enhance the interaction time wasto choose a small red probe detuning ∼ Γ, which converts the probe beam into a1D molasses cooling configuration.

3.7 The magneto-optical trap 65
0 10 20 30 40 50
(b)(a)
prob
efl
uore
scen
ce(a
rb.u
.)
time (ms)
0 1 2 3 4 50
2
4
6
()
fitted
fall
heig
ht(m
m)
relative probe height (mm)
6
7
8
9
10
()
fitted
tem
pera
ture
(K
)
Figure 3.14: Time-of-flight temperature measurement. (a) Fluorescence signals with
probe beam 1.2 mm () and 4.3 mm (•) below the MOT. Solid lines are fits to a Maxwell-
Boltzmann distribution. (b) Systematics of the temperature fit for various probe settings:
fitted fall height vs. (relative) probe setting (, with linear fit); fitted temperatures (•).
The fit of the distribution of an expanding and gravitationally accelerating cloudto the TOF signals assumes an Gaussian initial phase-space distribution in thevertical direction, Φ0(z0, v0, t0), that corresponds to the optical molasses temperature[cf. Fig. 2.4(a)]:
Φ0(z0, v0, t0) =1
2πσzσvexp
[−1
2(
(z0σz
)2+
(v0
σv(T )
)2)
], (3.6)
σv(T ) =
√kBT
M. (3.7)
The temperature is represented by the rms velocity spread σv. The initial rmsradius of the cloud is σz. As atoms fall, the time-evolution of the distribution canbe written by using transformed coordinates:
z = z0 + v0t +1
2gt2 , v = v0 + gt , (3.8)∫∫
dzdvΦ(z, v, t) =
∫∫dz0dv0Φ0(z0, v0, t0) ≡ 1 . (3.9)
When the probe beam is approximated by a square intensity profile of thickness dand centred at the height zp, the signal recorded from atoms that pass the probesection is
s(v, t) =
∫ zp+d/2
zp−d/2
Φ(z, v, t) dz Φ(zp, v, t) d . (3.10)

66 Experimental setup
Integration over the velocity distribution leads to the TOF signal:
S(t) =
∫ +∞
−∞s(v, t) dv (3.11)
1√2π σ(t)
d exp (− 1
2σ2(t)
(1
2gt2 − zp
)2) , (3.12)
σ(t) =√
σ2z + σ2v(T )t2 . (3.13)
The TOF signal is thus described by a Gaussian distribution, the rms width ofwhich is growing in time. If zp, σz, and d are known, the temperature T in σv(T ) isthe only parameter to fit the recorded signals to. Alternatively, zp and σz can alsobe treated as fit parameters. Note that d appears as an overall amplitude scalingfactor.
Fig. 3.14(b) shows temperature and fall height as obtained when fitting T , zp,σz and the signal amplitude for various relative experimental probe height settings.The statistical errors in the temperatures are also shown. The statistical errors inthe heights are small and not shown. Accurate knowledge of the fall height is notrequired to obtain a reliable temperature. This can be tested by fixing the heightwith a slightly different value and fitting again with the temperature as the only fitparameter. We find that the shift in the fitted temperature remains within the errormargins.
The temperature fits suggest a small statistical error, T = 8.5(1) µK. However,the uncertainty in the initial size of the molasses, σz, causes a systematic error. Usingσz also as a fit parameter resulted in σz 0.55 mm. However, images recorded witha CCD camera suggested a value of 0.25 mm. When the σz = 0.25 mm was usedas a fixed parameter, the temperature fitted to 12 µK, since the contributionof thermal expansion in the expression S(t) was increased. It is obvious that asystematic error in σz is more severe for small fall heights, for which a falling cloudhas little time to expand before being probed.
3.7.5 Molasses cooling and magnetic field compensation
The equilibrium temperature that is achieved in polarisation gradient cooling is ex-pected to scale ∝ IL/δ with the intensity and detuning of the cooling light [70].In order to optimize the cooling process experimentally, we performed TOF tem-perature measurements for various settings of the cooling laser. Fig. 3.15(a) showsTOF signals that were recorded for various red detunings ranging from 1.2− 8.3 Γ(see also Ref. [158]). In Fig. 3.15(b), the fitted temperatures are plotted vs. the in-verse detuning. The inverse dependence on the detuning seems to be approximatelyfulfilled with our cooling setup. The linear dependence on the intensity, however,indicates an offset, see Fig. 3.15(c).

3.7 The magneto-optical trap 67
0 20 40 60 80
(c)
(b)(a)
119 K
40 K
103 K
81 K
66 K
57 K
47 K
40 K
prob
efl
uore
scen
ce(a
rb.u
.)
time (ms)
-1.0 -0.8 -0.6 -0.4 -0.2 00
50
100
tem
pera
ture
(K
)
1/detuning /
0 1 2 3 4 50
25
50
tem
pera
ture
(K
)
molasses intensity I/I0
Figure 3.15: (a) TOF signals after 4 ms of molasses cooling, laser detuning ranging from
1.2 − 8.3Γ (top-down), Maxwell-Boltzmann distribution fitted to the 40 µK signal (solid
curve). (b) Fitted temperature vs. inverse detuning. The temperatures were relatively
large, because stray magnetic fields were not compensated. (c) Temperature vs. laser
intensity per cooling beam, in units of the saturation intensity, I0 = 1.67 mW/cm2.
The lowest temperatures are achieved in molasses cooling when earth and otherstray magnetic fields are compensated on the mG level. Note that the signals shownin Fig. 3.15 were recorded before any field compensation measure. Hence, the finaltemperatures were relatively high. The experimental region inside the UHV cell isnot accessible for external field probes. In situ, one may investigate field dependentspectral properties of the atomic species using, e.g., electro-magnetically inducedtransparency (EIT) [159], i.e. the Hanle level-crossing effect [160]. Although thesetechniques are sensitive on the µG level, they require additional laser sources. Asa simpler probe, we use the measured molasses temperature to optimize the fieldcompensation [71], thus achieving temperatures as low as shown in Fig. 3.14. Ex-perimentally, it proved to be also sufficient to observe the diffusion of atoms duringmolasses cooling and to maximize the diffusion time constant by means of the fieldcompensation coils, see Fig. 3.13.

68 Experimental setup

4A high-power tapered
semiconductor amplifier system
A laser amplifier system has been characterised which provides upto 200 mW output at 780 nm wavelength after a single-mode opticalfibre. The system is based on a tapered semiconductor gain elementthat amplifies the output of a narrow-linewidth diode laser. Gainand saturation are discussed as a function of operating tempera-ture and injection current. The spectral properties of the amplifierwere investigated with a grating spectrometer. Amplified sponta-neous emission (ASE) was observed as a spectral background witha full width half maximum of 4 nm. The ASE background was sup-pressed to below the detection limit of the spectrometer by a properchoice of operating current and temperature, and by sending thelight through a single-mode optical fibre. The final ASE spectraldensity was less than 0.1 nW/MHz, i.e. less than 0.2% of the op-tical power. Related to a rubidium optical transition linewidth ofΓ/2π = 6 MHz, this gives a background suppression of better than−82 dB. An indication of the beam quality is provided by the fi-bre coupling efficiency up to 59%. The application of the amplifiersystem as a laser source for atom optical experiments is discussed.
This chapter is based on the preprint
D. Voigt, E.C. Schilder, R.J.C. Spreeuw, and H.B. van Linden van den Heuvell,arXiv:physics/0004043, accepted for publication in Appl. Phys. B.
69
70 A high-power tapered semiconductor amplifier system
4.1 Introduction
The techniques of laser cooling and trapping of neutral atoms require stable, narrow-linewidth and frequency-tunable laser sources [11, 12]. Commonly used systems forthe near-infrared wavelengths are based on external grating diode lasers (EGDL)[117]. Optical feedback from a grating narrows the linewidth to less than 1 MHz andprovides tunability. High-power single-transverse-mode diode lasers can provide upto 80 mW optical output at wavelengths below 800 nm. In this power range, diodelasers thus provide a less costly alternative to Ti:Sapphire lasers. If more poweris required, the output of an EGDL can be amplified. Presently, there are threecommon techniques based on semiconductor gain elements: (i) Injection-locking ofa single-mode laser diode [138,139] by seeding light from an EGDL results typicallyin 60− 80 mW optical power at 780 nm wavelength. (ii) Amplification in a double-pass through a broad-area emitting diode laser (BAL) [161–167]. This yields anoptical output of typically 150 mW after spatial filtering. A disadvantage is therelatively low gain of 10− 15, requiring high seed input power. The BAL gain canbe improved using phase conjugating mirrors in the seed incoupling setup [168].(iii) Travelling-wave amplification in a semiconductor gain element with a taperedwaveguide, a “tapered amplifier” (TA) [163, 169–171]. Compared to a BAL thisyields higher gain and higher power after spatial filtering. This approach requiresmuch lower input and a less complex optical setup than a BAL. However, a TA gainelement is considerably more expensive.
We have investigated a TA system that amplifies the narrow-linewidth seed beamof an EGDL and provides up to 200 mW optical output from a single-mode opticalfibre. With the tapered gain element, characterised in this chapter, the systemoperates on the D2 (5S1/2 −→ 5P3/2) line of rubidium at a wavelength of 780 nm,see Fig. 3.7. Another gain element of the same type but with a different centrewavelength is used on the D1 (5S1/2 −→ 5P1/2) line at 795 nm. The input facetof the tapered gain element has the typical width (≈ 5 µm) of a low power single-transverse-mode diode laser. A seeding beam is amplified in a single pass andexpanded laterally by the taper to a width of typically 100− 200 µm such that thelight intensity at the output facet is kept below the damage threshold and the beamremains diffraction limited (see e.g. Ref. [169]). The output power can thus be muchlarger than from a single-mode waveguide.
In previous work, TAs have been used as sources for frequency-doubling andpumping solid state lasers [172]. Apart from the achievable output power, frequencytunability of the narrow-linewidth output [173], simultaneous multifrequency genera-tion [174], and spatial mode properties, including coupling to optical fibres [175–177]have been addressed.
In this chapter the broadband spectral properties of the TA are discussed. Wehave minimized the background due to ASE in the gain element by adjusting theoperating conditions of the amplifier, i.e. temperature, injection current and seedinput power. We have also investigated the coupling efficiency of the TA outputto a single-mode optical fibre, and have found that the latter acts both as a spatialand as a spectral filter. The properties of three gain elements of the same type are

4.2 Amplifier setup 71
side view
top view
OCIC CLTA
EGDL
OF
TA
SA
GS
OICLOI
Figure 4.1: Setup of the tapered amplifier system. Seed laser (EGDL), tapered gain ele-
ment (TA), 60 dB optical isolators (OI), single-mode optical fibre (OF), optical spectrum
analyser (SA) and grating spectrometer (GS). A top and side view of the gain element is
shown with input and output collimators (IC,OC). A cylindrical lens (CL) compensates
astigmatism (not to scale).
compared. Atom optical applications usually require good suppression of spectralbackground. For example, in far off-resonance optical dipole traps [10], scatteringof resonant light from the background causes heating and atom loss. Consequencesof ASE background in such schemes are also discussed in this chapter.
4.2 Amplifier setup
The amplifier system consists of a seed laser, the output of which is amplified ina single pass by the tapered gain element, as shown in Fig. 4.1. The TA output iscoupled to a single-mode optical fibre (OFR, type PAF-X-5-780 fibre port, inputbeam dia. 0.9−1.8 mm). The seed laser is an EGDL with a linewidth of less than1 MHz. It operates by a 60 mW single-mode laser diode (Hitachi, HL 7851G98)and provides 28 mW to seed the amplifier at 780 nm wavelength. Coupling of theseeding beam to the amplifier was realised by mode-matching the seed laser withthe backward travelling beam emitted by the TA. The divergence angles from theseed laser emission and the backward directed TA emission are similar. Hence, suffi-cient mode-matching was obtained using identical collimation lenses for both (Thor-Labs, C 230TM-B, f = 4.5 mm, N.A.=0.55). Additional mode shaping, e.g. with

72 A high-power tapered semiconductor amplifier system
anamorphic prism pairs, was not necessary. An optical isolator with 60 dB isolationprotects the stabilised seed laser from feedback by the mode-matched beam of theamplifier (Gsanger Optoelektronik, type DLI 1). The 5 mm aperture of the isolatoris sufficiently large not to clip the elliptical seed beam.
The TA was a SDL8630E (Spectra Diode Laboratories, ser.no. TD310). Accord-ing to the manufacturer’s data sheet, the output power ranged between 0.5−0.55 Wwithin a wavelength tuning range of 787− 797 nm, at an operating temperature of21C. The beam quality parameter is typically specified as M2 < 1.4 [178]. TheTA should be protected from any reflected light, because it will be amplified in thebackward direction and may destroy the amplifier’s entrance facet. Hence, the out-put collimator has a large numerical aperture (ThorLabs, C 330TM-B, f = 3.1 mm,N.A.=0.68) and the beam is sent through a second 60 dB optical isolator (Gsanger,FR 788TS). The plane of the tapered gain element is vertically oriented, so thatdiffraction yields a large horizontal divergence. The beam is then collimated simi-larly to the seed input, but yields a focus in the vertical plane. A cylindrical lens(Melles Griot, no. 01 LQC006/076, f = 100 mm) compensates the astigmatism ofthe beam, so that the beam can couple to a single-mode optical fibre. The astigma-tism correction is shown in Fig. 4.1 (see also Ref [158]).
There is a considerable loss in optical power due to the isolator transmission.Taking also into account small reflection losses on the lens surfaces, we estimatedthe useful output power to be 78% of the power emitted by the TA facet. In theremainder of this chapter, all quoted powers are as measured with a calibrated powermeter behind the optical isolator (Newport, meter 840-C, detector 818-ST, calibrationmodule 818-CM). The narrow spectral line of the seed laser and amplifier outputwas monitored by an optical spectrum analyser with 1 GHz free spectral range andwith 50 MHz resolution. The amplifier’s broad spectral background was analysedusing a grating spectrometer with a resolution of 0.27 nm. Also the output of thesingle-mode fibre was recorded with the spectrometer.
The amplifier was provided as an open heat sink device, see Fig. 4.2. We mountedit on a water cooled base and stabilised it to the desired operating temperaturewithin a few mK by a 40 W thermo-electric cooler. Thermal isolation from theambient air and electromagnetic shielding were provided by a metal housing. Whenoperating the amplifier at temperatures below the dew point, we flushed the con-tainment with dry nitrogen. It is necessary to have a compact, stable mountingof the gain element and collimators. We mounted the collimators in a commer-cial xy-flexure mount to allow for lateral lens adjustment (New Focus, 9051M fibrelauncher). The axial z-adjustment was done by two translation stages (Newport,type UMR3.5, travel 5 mm). All adjustments, except that of the z-direction of theoutput collimator, are accessible from outside. This proved to be very convenientfor mode-matching the seed beam and also for compensating beam displacement ofthe TA output when changing temperature or current.
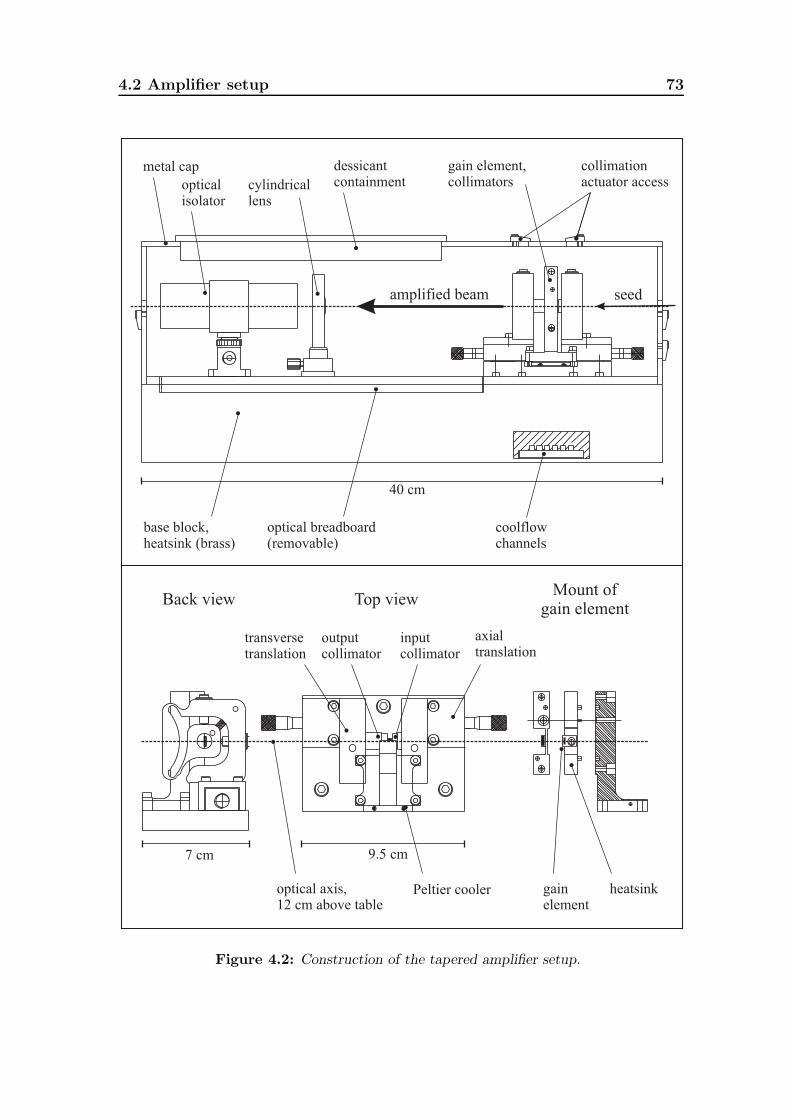
4.2 Amplifier setup 73
40 cm
dessicantcontainmentoptical
isolatorcylindricallens
collimationactuator access
coolflowchannels
gain element,collimators
base block,heatsink (brass)
metal cap
optical breadboard(removable)
amplified beam seed
gainelement
axialtranslation
transversetranslation
heatsink
Top view
Peltier cooler
outputcollimator
inputcollimator
optical axis,12 cm above table
9.5 cm7 cm
Back viewMount of
gain element
Figure 4.2: Construction of the tapered amplifier setup.

74 A high-power tapered semiconductor amplifier system
5 10 15
50
100
150
pow
er(m
W)
temperature (0C)
780 790 800
0
10
20
30
160C
130C
100C
50C
spec
tral
dens
ity
(mW
/nm
)
wavelength (nm)
5 10 15
786
788
790
temperature (0C)
wav
elen
gth
(nm
)
(a) (b)
(c)
Figure 4.3: Temperature dependence of the unseeded amplifier at 1.2 A injection current.
(a) spectra, (b) centre wavelength, (c) output power after optical isolator. Solid lines
indicate linear fits.
4.3 Unseeded operation of the amplifier
When the TA receives no seed input, it operates as a laser diode. Thus, when theinjection current, ITA, is increased from zero, the optical output power indicates thelasing threshold [see Fig. 4.4(a,b)]. Generally, both the operating wavelength andthe optical power of a laser diode depend on the temperature. These propertiesare shown in Fig. 4.3. The emission spectrum of the lasing gain element is almostGaussian shaped, with a width of 4 nm (1/e2 intensity). It appears as a backgroundof ASE also in the spectra when operating the gain element as an amplifier (seebelow). The oscillatory structures on the spectra are artifacts of the spectrometer.In the fitted Gaussian spectra, we evaluated the centre wavelength at each temper-ature setting. It increases with temperature with a slope of 0.28 nm/K, typical forsemiconductor lasers.
The temperature dependence of the output power is shown in Fig. 4.3(c). Weoperated the TA within the specifications of the manufacturer’s data sheet thatrecommends to keep the optical power at the output facet below 550 mW. As thetemperature increases, the conversion efficiency (mW/A) decreases and the thresh-old current increases. This can be seen in Fig. 4.4(a,b) (open symbols) where theoptical output power P is plotted vs. the current ITA for two temperature settings.The threshold current of the unseeded TA increases from 0.78 A (5C) to 0.86 A(14C). From the slopes above threshold, we find that the conversion efficiencydecreases from 0.7 W/A (5 C) to 0.5 W/A (14 C). In order to measure the un-perturbed output of the unseeded TA, one has to prevent light emitted from the

4.4 Amplification of a seed beam 75
0.4 0.6 0.8 1.0 1.2
0
150
300
ITA
(A)
no seed1.5 mW5.3 mW seed
P(m
W)
0 5 100
100
200
300
(b) T = 50C
(a) T = 140C (c) T = 14
0C
ITA
= 1.2 A
1.3 A
1.0 A
0.9 A
0.8 A
P(m
W)
Pseed
(mW)0.4 0.6 0.8 1.0 1.2
0
150
3001.7 mWno seed
8.6 mW
ITA
(A)
P(m
W)
Figure 4.4: Amplifier output vs. injection current and seed power. Lasing thresholds for
the unseeded amplifier are 0.86 A (14 C) and 0.78 A (5 C), indicated by dashed lines.
entrance facet from being reflected. Even a very weak reflection, e.g. from a powermeter, would be amplified in the forward direction. For the unseeded TA, we alsomeasured the light propagating backward from the amplifier’s entrance facet. Itreaches typically a power of 10 − 25 mW for injection currents from 1 − 1.4 A.Hence, a good isolation of the seeding laser is necessary.
4.4 Amplification of a seed beam
Amplification of a seed beam is evident in the output power of the TA. In Fig.4.4(a,b), the output power for different values of the seed power, Pseed, is plotted fortwo temperature settings. For the larger seed inputs of 8.6 mW and 5.3 mW, respec-tively, the amplifier was well saturated. The saturation is evident from Fig. 4.4(c)where Pseed was varied for injection currents from 0.8−1.3 A. With Pseed ≈ 4 mW thedevice appeared to be saturated for all current settings. For Pseed between 2−4 mW,the amplification ranged from 70− 140, e.g. 320 mW output with 4 mW seed.
The spectral properties of the TA and in particular the suppression of ASE back-ground are discussed in the following. Fig. 4.5 shows the power spectral density ofthe TA output before an optical fibre for 16C and 5 C operating temperature. Inboth cases the amplifier was saturated with 28 mW seed input. For comparison alsothe corresponding spectra of the unseeded amplifier are shown. In saturation, thebroad ASE background is distinguished from a narrow peak of the amplified seed sig-nal. The width of the peak is given by the bandwidth of the spectrometer, 0.27 nm

76 A high-power tapered semiconductor amplifier system
775 780 785 790 795
-10
0
10
20
30
ASE = 5.6 %
= 72 dB
P = 323 mW
(a) T = 160C
dBm
/nm
wavelength (nm)775 780 785 790 795
-10
0
10
20
30
ASE = 1.4 %
= 77 dB
P = 410 mW
(b) T = 50C
dBm
/nm
wavelength (nm)
Figure 4.5: Spectrum of the amplifier output (before the fibre). The seed power was
28 mW, the injection current 1.2 A. Dashed curves are for unseeded operation. ASE is
the background fraction of the total optical power P and ε is the ASE suppression for the
power spectral density in units of mW/Γ (see text).
FWHM. Note that for the characterisation of the TA system, a different spectrom-eter was used than the PC-card spectrometer mentioned in Chap. 3. The linear dy-namic range of the photomultiplier tube (PMT) which was used as a detector withthe grating spectrometer, did not cover the entire dynamic range of 40 dB. Therefore,we used a calibrated neutral density filter (CASIX, type NDG0100) when recordingthe large signal of the locked laser line. A filter transmission of 6.0% (780 nm) and5.1% (795 nm) was measured and linearly interpolated between these wavelengths.The small gap in the right slope of the peak in Fig. 4.5(b) (at 10 dBm/nm) indicateswhere the signal recorded with the filter was joined to the ASE spectrum recordedwithout the filter. Within the dynamic range where it was used, we verified thatthe response of the PMT was linear to within 1%. By means of an optical spectrumanalyser and Doppler-free spectroscopy on rubidium, we could also verify that theamplified beam was spectrally narrow, comparable to that of the EGDL.
The influence of the operating temperature is obvious first from the increasedoutput power at lower temperature: 323 mW (16C) and 410 mW (5C), respec-tively. Second, both the peak level and total amount of ASE background are bettersuppressed at lower temperature. We attribute this to the shift of the gain profileof the TA toward the seed wavelength of 780 nm at a lower temperature [179]. Thefraction of ASE background in the TA output is obtained by integrating the powerspectral densities in Fig. 4.5, yielding 5.6% (16C) and 1.4% (5 C), respectively.
More than the total ASE fraction, the important figure for atom-optical appli-cations is the fraction of ASE within the natural linewidth of the atomic transitionused. We define this ratio ε by comparing the power in the peak with the ASE powerin a bandwidth given by a typical atomic natural linewidth, e.g. Γ/2π = 6 MHz

4.5 Spatial and spectral filtering using an optical fibre 77
for rubidium. At 16C, the ASE peak value of +2.5 dBm/nm is then reexpressedas 22 nW/Γ, or 7.9 nW/Γ at 5C, respectively. With 323 mW in the narrow line,this leads to a suppression ratio ε = −72 dB, or −77 dB with 410 mW, respectively.By an appropriate choice of the operating temperature one can thus optimize thespectral properties of the TA output. Even better suppression is achieved using anoptical fibre as a spectral filter.
4.5 Spatial and spectral filtering by an optical fibre
For many applications, laser beam quality is an important property. A convenientmethod to obtain spatial filtering is to send the light through a single-mode opticalfibre. An additional advantage of the fibre is a decoupling of the optical alignmentbetween different parts of the experimental setup. Here, the coupling efficiency isdiscussed and the spectrum of the transmitted light is compared with the spectrumbefore the fibre. We observe that spatial filtering by the fibre is accompanied byspectral filtering. Evidently, the contribution of ASE in the TA beam is spatiallydistinguishable from the amplified seed signal.
The spatial mode properties of the saturated TA output were slightly differentfor different injection currents. Fig. 4.6(a,b) represents the fibre transmission vs. thecurrent. The fibre coupling had been optimized for a current of 1 A and the TA wassaturated. A maximum transmission of 46% was achieved. For comparison, with anunamplified EGDL, after circularising the beam using an anamorphic prism pair, atypical fibre transmission of 75% was obtained. The slope in the transmission curveis probably due to a beam displacement caused by the current-dependent thermalload of the gain element. Such a displacement was also observed when the operatingtemperature was changed. With the fibre coupling thus optimized, light from theunseeded TA had less transmission than the amplified seed signal. Fig. 4.6(c,d)shows for a fixed current of 1 A that the fibre transmission was almost independentof the seed input power, i.e. the beam shape did not change.
Also the light after the fibre was analysed using the grating spectrometer for anoperating temperature of 5 C, see Fig. 4.7(a). For the saturated amplifier a spectralASE background cannot be distinguished after the fibre, since the peak is identicalwith the spectrometer response function. (This response function was obtained byrecording the spectrum of the narrow-linewidth EGDL laser. A similar response wasalso obtained using a HeNe laser.) Thus, we can only assign an upper limit of 0.2%for the ASE contribution. The suppression ratio is ε < −82 dB, with an ASE levelof less than −12.5 dBm/nm= 0.7 nW/Γ. This should be compared to the value ofε = −77 dB before the fibre, as in Fig. 4.5(b) for 5 C. For comparison, at 16C wefound an ASE suppression of −76 dBm after the fibre.
The ASE background depends also on the degree of amplifier saturation, asshown in Fig. 4.7(b). The ASE fraction is plotted vs. seed power for light before andafter the fibre. It decreases quickly as the TA saturates. From the spectra acquiredbefore the fibre ( ), it is evident that the increase of seed power into the saturatedregime suppresses the ASE.

78 A high-power tapered semiconductor amplifier system
0.6 0.8 1.0 1.2
0.00
0.25
0.50
tran
smis
sion
ITA
(A)0 10 20 30
0.46
0.47
tran
smis
sion
Pseed
(mW)
0 10 20 300
200
400
Pseed
(mW)
P(m
W)
0.6 0.8 1.0 1.2
0
200
400
ITA
(A)
P(m
W)
(a) (c)
(d)(b)
fibre infibre in
out
out
seeded
no seed
Figure 4.6: Transmission through a single-mode optical fibre. (a) Fibre input () and
output () with 28 mW seed, and without seed ( ); (b) fibre transmission with (•)and without () seed; (c) fibre input () and output () as a function of the seed power;
(d) corresponding fibre transmission.
775 780 785 790
-10
0
10
20
30
(a) T = 50C
< 82 dB
fiber out fiber in
no seed
dBm
/nm
wavelength (nm)
0 1 2 3 15 30
0.0
0.5
1.0
(b)
5oC
16oC
back
grou
ndfr
action
Pseed
(mW)
Figure 4.7: Spectral filtering by a single-mode optical fibre. (a) Saturation with 28 mW
seed power at 1.2 A current, 130 mW power after the fibre, 410 mW before. ASE back-
ground is not distinguishable from the spectrometer response function after the fibre.
(b) The ASE fraction depends on the saturation: fibre input ( ) and output () at
1.2 A current. For comparison: fibre input with 1.45 A current (•).

4.6 Variations of individual gain elements 79
Optimal ASE suppression required a careful alignment of the mode-matched seedinput, i.e. optimization of the TA saturation, whereas achieving maximum outputpower was less critical. It is also obvious from the figure, that larger gain of the TAwith larger operating current improved the output spectrum (•).
Summarising the results of Sec. 4.4 and 4.5, the spectral properties of the TA canbe optimized by choosing an appropriate operating temperature, spectral filteringwith an optical fibre and saturation of the gain element.
4.6 Variations of individual gain elements
We compared the TD310 gain element with two other gain elements of the sametype (SDL8630E). One gain element (ser. no. TD430, 777 nm) was used in thesetup described above. A second (ser. no. TD387, 790 nm) was implemented in acommercial TA system (TUI Optics, TA100) and operated on both the D2 and theD1 transition of rubidium at 780 nm and 795 nm, respectively.
For the different gain elements, we found considerable differences in their beamquality and consequently their fibre coupling efficiency. Whereas TD310 and TD387showed a dominant double-lobed mode structure in the far field and permitted only afibre transmission of 46%, the TD430 beam showed a less pronounced lobe structure.Fig. 4.8 gives an impression of the collimated TD430 beam profile, as imaged witha CCD video camera. Fibre coupling was achieved using the output collimator andthe cylindrical lens to shape a “circular”, though slightly converging beam at thelocation of the fibre port. With this gain element, we could couple 59% to thefibre and obtained 200 mW after the fibre, with an ASE suppression of better than−84 dB. Note that already at its first usage, the TD310 displayed a shadow in thenear field of its amplified output beam. After approximately 100 hours of operationthe gain element quickly degraded and became inoperable.
The amplification properties also showed striking differences among the gainelements. TD430 has similar saturation properties as TD310. For example, whenseeded by a master oscillator, optimal spectral purity of the output was achievedwhen also the (amplified) output power was at maximum. In contrast, TD387operates as a laser oscillator rather than an amplifier, yielding saturated outputpower already without seed. Although the coatings of our gain elements were notspecified by the manufacturer, the difference in behaviour suggests that TD387may have a larger reflectivity on the entrance facet, see e.g. Ref. [180]. Hence, theTD387 requires (permanent) monitoring by a spectrometer in order to optimize
Figure 4.8: Far field beam profile of the TD410 gain element.

80 A high-power tapered semiconductor amplifier system
seed incoupling and ASE suppression. The current of the TD387 cannot be tunedcontinuously, because it shows discrete “locking-ranges”, resembling the injection-locking behaviour of single-mode diode lasers.
4.7 Far off-resonance dipole potentials with
spectral background
In this section the consequences of a broad spectral ASE background for light scat-tering in optical dipole traps are estimated. A background that covers atomic reso-nances leads to extra resonant scattering. Usually the detuning δ for a dipole trapis chosen as large as possible, given the available laser intensity IL. The reason isthat off-resonance scattering scales as Γ′
OR ∝ IL/δ2 at low saturation and large de-
tuning, whereas the dipole potential is only inversely proportional to the detuning,Udip ∝ IL/δ (see e.g. Ref. [2] and Appendix A.3).
In the presence of resonant background the total scattering rate of the atoms is
Γ′ = Γ′OR + Γ′
R , (4.1)
where Γ′R represents the resonant scattering. For a fixed depth of the optical dipole
potential this results in a maximum useful laser detuning, δmax, at which the scat-tering rate of the atoms, Γ′, is minimized. With low atomic saturation by a weakspectral background, we can write
Γ′R ≈ Γ
π
4
εILI0
. (4.2)
The saturation intensity is, e.g., I0 = 1.67 mW/cm2 for the D2-line of rubidium.Hence, with the restriction of a fixed potential Udip, the two scattering contributionsscale as Γ′
OR ∝ 1/δ and Γ′R ∝ δ, respectively. This results in the optimum detuning
and minimum scattering rate,
δmax = ±Γ/√2πε , (4.3)
Γ′ = 2√2πε Udip/ . (4.4)
As an example we consider atoms cooled to a temperature of a few µK in opticalmolasses and require an optical potential depth of Udip/h ≈ 1 MHz. If the allowablescattering rate is, e.g. Γmax < 100 s−1, this yields a required background suppressionε < −110 dB and an optimum detuning δmax ≈ 760 GHz. Such a small backgroundcontribution is of course beyond the resolution of our spectrometric data, with whichwe observed at best an upper limit of 0.7 nW/Γ ASE spectral power, for a total powerof 200 mW. This corresponds to a background suppression of ε < −84 dB. With adetuning of 760 GHz, the spatial extension of the optical potential is restricted toless than 250 µm width.
In principle, one could make use of the resonant photon scattering rate, Γ′R,
as an experimental tool to investigate the ASE properties of a laser source. Morespecifically, Γ′
R appears as an additional source of heating and loss of atoms trappedin a far off-resonance optical dipole trap.

4.8 Conclusions 81
4.8 Conclusions
We have investigated a tapered semiconductor amplifier system, that provides 150−200 mW narrow linewidth output from a single-mode optical fibre, where the fibretransmission is up to 59%, depending on the actual gain element in use. The systemrequires less than 5 mW seed input to saturate with an amplification up to 140 atthis seed level. The output of the amplifier includes a broad spectral backgroundof amplified spontaneous emission. We have found three means of reducing thisbackground: (i) Choosing the operating temperature such that the gain profile ofthe amplifier is shifted toward the amplified wavelength, (ii) filtering the outputbeam spectrally with a single-mode optical fibre, and (iii) saturating the amplifierwith sufficient seed input power. With these measures, the ASE background is belowthe resolution of our spectrometer. That is, the ASE fraction is less than 0.2% of theoptical power in the beam and the peak level is less than 0.1 nW/MHz. Relatingthe power spectral density of the background to the natural transition linewidthof rubidium (Γ/2π = 6 MHz), the ASE suppression is better than −82 dB. Theatom-optical application of such an amplifier system with far off-resonance dipolepotentials was discussed. A broad ASE background implies here an optimum laserdetuning with which light scattering by atoms is minimized. A tapered amplifiersystem may be a lower-cost alternative to a Ti:Sapphire laser. The available single-transverse-mode optical power and spectral properties are similar to those of broad-area semiconductor laser amplifiers.

82 A high-power tapered semiconductor amplifier system

5The evanescent-wave atom mirror
Cold atoms (10 µK) from a vapour-cell magneto-optical trap wereused to study elastic, normal-incidence bouncing on an evanescent-wave mirror. Bouncing atoms were released 6 mm above the mir-ror and were detected by a time-of-flight technique. The fractionof bouncing atoms depends on the effective mirror surface in re-lation to the size of the ballistically expanding atom cloud. Thisfraction was investigated as a function of optical power, laser de-tuning, evanescent-wave polarisation, and cloud temperature. Theobserved bouncing fractions up to 8% were in agreement with cal-culated predictions, necessarily including the contribution of theVan der Waals interaction to the mirror potential.
83
84 The evanescent-wave atom mirror
5.1 Introduction
The operating principle of an evanescent-wave mirror for atoms [3–5] and loadingof an optical surface trap by an inelastic mirror were discussed in Chap. 2. As anintermediate step towards this goal, we first studied an elastic mirror. Bouncingatoms from a falling cloud of cold atoms were detected by a time-of-flight (TOF)probing technique. We used the TOF method to investigate the bouncing fractionof atoms from the cloud. This fraction is determined by the effective mirror surfacewhich is to be compared with the size of the ballistically expanding atom cloud.In the course of this chapter, TOF experiments with elastically bouncing atomsare presented. We investigated the fraction of atoms bouncing on the mirror asa function of power, detuning and polarisation of the evanescent-wave, i.e. as afunction of the effective mirror surface. Also the temperature of the falling atomcloud was varied. Finally, the dependence on the evanescent-wave decay length willbe discussed.
5.2 Fraction of bouncing atoms
5.2.1 Effective mirror surface
The potential of the evanescent-wave mirror, U = Udip + Ugrav + UVdW, is describedby the optical dipole potential, the gravitational potential and the Van der Waalsinteraction, see Chap. 2. The z-direction was here chosen as the vertical direction,and the xz-plane as the plane of incidence for the evanescent-wave laser, havingthe evanescent-wave propagating in the x-direction along a horizontal glass surface(remind Fig. 2.1, or see Fig. 5.2).
The fraction η of bouncing atoms from a falling cloud depends on both theeffective surface of the evanescent-wave mirror and the spatial extension of the cloud.The bouncing threshold is given by the kinetic energy of the incident atoms, Uth =p2i /2M . Within the transverse Gaussian profile of the dipole potential, the effectivemirror surface is enclosed by the circumference at which Uth equals the maximumin the total potential U . Beyond this circumference, atoms slip across the potentialmaximum (if existing), hit the prism and are lost by heating or sticking to thesurface. For a purely optical potential, this would be the circumference, where thepotential at the prism surface equals Uth.

5.2 Fraction of bouncing atoms 85
If we take a Gaussian laser beam power PL and waist w0 for the evanescent-wave,the intensity is given by
IL(r′) = IL(0) exp (−2r′2
w20
) , IL(0) =2PLπw2
0
, (5.1)
where r′ is the transverse distance from the beam centre.
The optical potential of the mirror can be written in Cartesian and polar coor-dinates (x = r cosφ, y = r sin φ, z):
Udip(x, y, z) = U0 exp (−2
(x2
(χw0)2+
y2
w20
)− 2κz) , (5.2)
= U0 exp (−2r2
w20
(cos2 φ
χ2+ sin2 φ
)− 2κz) , (5.3)
In this notation, U0 ≈ (Γ2/8δ)TjIL/I0 is the maximum optical light shift in thecentre of the mirror at the glass surface. For geometrical reasons, the evanescent-wave waist is stretched in the x-direction by a factor χ = 1/cos θi, compared withthe waist w0 of the used laser beam. In our configuration this factor is 1.334,as calculated for an evanescent-wave angle of incidence close to the critical angle,θc = 41.43.
In the hypothetical case of a purely optical potential, i.e. neglecting the Van derWaals interaction, the threshold circumference Rth(φ) can be calculated analyticallyby the condition:
Uth = Udip(Rth(φ), φ, 0) . (5.4)
This leads to
Rth(φ) = R0
(cos2 φ
χ2+ sin2 φ
)− 12
, (5.5)
R0 = w0
√1
2ln
(U0Uth
)∝
√ln
(TjILδ
). (5.6)
Here, R0 is the threshold as it would occur for a circular evanescent wave (χ = 0).
In a more realistic calculation, taking into account also the Van der Waals in-teraction, Rth(φ) can be found as follows. One first solves numerically, for the valuezmax, where U(r, φ, zmax) has its maximum as a function of z. The value of Rth(φ)is found by solving also numerically
Uth = U(Rth(φ), φ, zmax) . (5.7)

86 The evanescent-wave atom mirror
x (mm)
y(m
m)
1.0
1.0
0.5
0.5
Figure 5.1: Effective surface of the evanescent-wave mirror with Van der Waals interac-
tion (dark shading) and without (short-dashed line). The rms width, σi = 1.13 mm, of
the bouncing cloud (light shading) corresponds with a temperature of 10 µK and a fall
height 6.2 mm. The TE-polarised laser is chosen, with 15 mW power, 200Γ detuning and
a waist w0 = 335 µm (dotted line). The angle of incidence is θi = θc + 8.7 mrad.
5.2.2 Ballistic spreading and bouncing fraction
Having introduced the effective mirror surface, the ballistic spreading of the thermalatom cloud and the bouncing fraction are addressed in the following. If we assumea Gaussian phase-space distribution of the initial cloud, after molasses cooling toa temperature T = 10(2) µK [see Fig. 2.4(a)], the normalised spatial distribution,Fi(r), of the atoms reaching the mirror at time ti can be written as:
Fi(r) =1
2πσ2iexp (− r2
2σ2i) ,
∫ ∞
0
2πFi(r) r dr = 1 , (5.8)
σi =√
σ20 + (σvti)2 , (5.9)
σv =
√kBT
M. (5.10)
In our experiment, the rms velocity spread is σv 3 cm/s. The spatial extension ofthe molasses cloud is estimated as σ0 = 0.25(5) mm. Thus, when reaching the prismafter a fall of 35.5 ms, the cloud has expanded to a rms radius σi = 1.13(15) mm.
The bouncing fraction is calculated by integrating the transverse atom distribu-tion over the effective mirror surface:
η =
∫ 2π
0
dφ
∫ Rth(φ)
0
Fi(r) r dr . (5.11)

5.2 Fraction of bouncing atoms 87
For a circular evanescent-wave, Rth(φ) = R0, the bouncing fraction can be expressedanalytically:
η0 = 1− exp (− R20
2σ2i) = 1−
( U0Uth
)−(w0
2σi
)2. (5.12)
For a cloud that is large compared to the effective mirror surface, σi Rth, thedensity Fi(r) is approximately constant within this area. The bouncing fraction isthen proportional to the effective surface, so that η ∝ ln(IL/δ). In Fig. 5.1, the sizeof the atom cloud, evanescent-wave and effective mirror surface are shown. Thelatter is shown with and without Van der Waals interaction. The chosen parametersrepresent typical experimental parameter settings. The fall height of z0 = 6.2 mmcorresponds to a bouncing threshold Uth = 2.2 Γ (Γ/2π = 6.1 MHz for the rubid-ium D2 line). The calculated bouncing fraction is η = 0.9% with Van der Waalsinteraction, or 1.7% when neglecting it.
5.2.3 Optimizing the bouncing fraction
Obviously, by increasing the laser power for a given laser waist w0, the effectivemirror surface increases. This means that the turning point in the centre of themirror moves further and further away from the surface. However, this would be in-efficient use of laser power from the perspective of optimising the bouncing fraction.Increasing the waist will yield a larger effective mirror surface. We can optimise ηby keeping the mirror potential above threshold across the largest area permitted bythe laser power. In principle, since Udip ∝ IL/δ, the detuning could also be varied.However, the detuning also determines the rate of light scattering by atoms duringa bounce so that it is usually kept fixed.
If the Van der Waals interaction is neglected and assuming a transversely circularevanescent wave, the waist optimisation can be done analytically. Starting fromEq. (5.6), we substitute Eqs. (5.1), (2.8) and (2.9), and express R0 as a function ofw0, with PL and δ as parameters in place of U0. The optimum waist, wmax, is thenfound for the optimum threshold radius, Rmax, as:
wmax =√2Rmax , Rmax =
√TjPL8πI0
Γ2
δ
1
eUth . (5.13)
Note that πw2max ∝ PL, as one expects, and the optimum optical potential at the
prism surface is Umax = eUth. The maximum bouncing fraction depends of courseon the extension of the atom cloud, e.g. with Eq. (5.12) for a circular mirror this is:
ηmax = 1− exp (−(
wmax
2σi
)2) . (5.14)
In the course of this chapter, a numeric example of ηmax will be briefly discussed,related to our experimental results.
88 The evanescent-wave atom mirror
5.3 Time-of-flight detection of bouncing atoms
5.3.1 Mirror configuration
In Fig. 5.2(a) the configuration of the evanescent-wave mirror is shown schematically.The evanescent wave is centred at the 10 × 4 mm2 sized horizontal surface of aright-angle glass prism (Melles Griot, no. 01PRB009). Atoms were collected ina magneto-optical trap (MOT), located 6.2 mm above the prism surface. Aftermolasses cooling, this provided a sample of ∼ 107 atoms at 10(2) µK temperature.The polarisation of the evanescent-wave laser beam was chosen with respect to theplane of incidence as either TE or TM. The angle of incidence, θi− θc, was adjustedwithin 0− 40 mrad using a telescope as described in the next chapter, see Fig. 6.1.
In order to perform time-of-flight temperature measurements, a flat, horizontal,near-resonance absorption probe beam (AP) intersected the trajectory of fallingand bouncing atoms. The probe transmission was recorded by a photodiode (PD).The waist of the probe was 0.4 mm vertical and 1.4 mm horizontal (1/e2 intensityradius). The probe was tuned 8 Γ below the D2-line transition Fg = 2 −→ Fe = 3of 87Rb (see Fig. 3.7). The optical power in the UHV cell was 0.1 µW, so thatthe maximum probe intensity was 0.1 mW/cm2, well below the saturation intensityI0 = 1.67 mW/cm2, as required for absorption probing, i.e. the saturation parameterwas s0 = 2.5× 10⁻⁴ 1. In order to distinguish the TOF signal of bouncing atomsclearly from that of falling atoms, the probe was used in a higher position (1.6 mmbelow the MOT) than that used for the temperature measurement in Chap. 3.
As a laser source for the the evanescent wave, an injection-locked single modelaser diode (Hitachi, HL 7851G98) was used, which provided 30 mW power after asingle-mode optical fibre. It was seeded by an external grating diode laser, lockedto the D2-line transition Fg = 2 −→ Fe = 3. The blue detuning of the evanescentwave was adjusted by frequency shifting the seed laser beam with an acousto-opticmodulator. For large detuning, δ/2π > 200 MHz, we unlocked the seed laser andset its frequency manually, according to the reading of an optical spectrum analyserwith 1 GHz free spectral range.
The evanescent-wave laser beam was collimated with a waist w0 = 335(7) µmat the mirror location. Threefold reflection losses at the walls of the vapour celland the prism entrance surface reduced the available optical power. For an angleof incidence close to the critical angle θc, this loss was 25% and 5% for TE andTM polarisation, respectively. For TE polarisation the loss was dominated by thereflections at the cell walls, whereas for TM polarisation, the angle of incidence wasclose to the Brewster angle. Note that the Brewster effect allowed us to keep a TM-polarised evanescent wave permanently switched on. For TE polarisation it had tobe off before and after the bounce. Otherwise, second-order reflections from the cellwalls pushed away falling and rising atoms. In the following, all powers are givenin mW, as measured in the laser beam before entering the UHV cell. Note that afused silica cuvette (see Chap. 3) has the subtle advantage of a lower refractive index(n = 1.45), i.e. less reflections, compared with the glass cell (n = 1.51) used here.

5.3 Time-of-flight detection of bouncing atoms 89
(a) (b)
z
xy
MOT
AP
EW
TM
PD
surface distance z/0
U ( = 0)m
U
z ( m)
pote
nti
al/
Uh
Uh
/(M
Hz)
0 0.5
0.5
1.0
1.0 1.500
0
1
2
3
4
6
18
12
24
Uth
dip
( = 0)m
( = 1)m ±
( = 2)m ±g
g
g
g
Figure 5.2: Evanescent-wave configuration and mirror potential. (a) Time-of-flight de-
tection by a probe beam. (b) Mirror potential U for sublevels mg = 0 . . . ± 2, opticalpotential Udip for mg = 0, bouncing threshold Uth = p2i /2M for an incident atom of mo-
mentum pi. For parameters of the TE-polarised evanescent-wave see text and Fig. 5.4.
5.3.2 Mirror parameters
Atoms were released from the MOT in the Fg = 2 ground state. The centre-of-mass of the cloud reaches the mirror after ti = 35.5 ms, 6.2 mm below. Duringthat time, gravity accelerates the atoms to a velocity of vi = 35 cm/s, or 59 vrec inunits of the photon recoil velocity (vrec = 5.88 mm/s). Hence, the mirror potentialhas to exceed a bouncing threshold Uth = 2.2 Γ. The mirror potential U(x, y, z)is determined by the available laser power PL, the applied detuning δ, and theevanescent-wave decay length ξ(θi). Such a potential is plotted in Fig. 5.2(b) for thecentre of the mirror (x = y = 0). The TE-polarised evanescent-wave was assumedto have 15 mW power and 200 Γ detuning. The decay length was ξ = 0.89 µmfor an angle of θi = θc + 8.7 mrad. The reduction of the potential maximum bythe Van der Waals interaction, compared with a purely optical potential Udip, isalso shown. In addition, due to the Clebsch-Gordan coefficients, the mg-sublevels ofthe Fg = 2 ground state experience different light shifts. Plotted in the figure arethe eigenvalues of the atom-light dipole interaction (including the Van der Waalsinteraction). In general, the corresponding eigenstates are linear superpositions ofthe sublevels. This is due to the possible longitudinal polarisation component ofthe evanescent-wave causing the evanescent wave to be elliptically polarised (seeAppendix A.2). However, in a purely TE-polarised evanescent wave, the eigenstatescan be identified by the sublevels.

90 The evanescent-wave atom mirror
(a) (b)
0 20 40 60
0.85
0.90
0.95
1.00
(x10)
prob
etr
ansm
issi
on
time (ms)
0 20 40 60 80 100 120
0.85
0.90
0.95
1.00
fall fall again (x10)rise
(x10)
prob
etr
ansm
issi
on
time (ms)
Figure 5.3: Time-of-flight signals from bouncing atoms. (a) Absorption signals in the
probe beam for a fall height of 4.1 mm; vertical dashed lines indicate the time when the
probe was switched on. (b) Signals for a fall height of 4.8 mm and for two different heights
of the probe beam, 3 mm (solid curve) and 4 mm (dashed) above the prism.
A relatively large evanescent-wave decay length ∼ λ0 is desired in our experi-ments, in order to match an optical trapping potential and to adjust the rate ofoptical pumping by the evanescent-wave (see Chap. 2). The influence of the Van derWaals interaction on the mirror is small here. The Van der Waals contribution wastherefore investigated using a smaller decay length, see Ref. [103].
5.3.3 Time-of-flight signals
Similar to the TOF signal of falling atoms, also signals from rising atoms after abounce can be recorded by the probe absorption. The probe is destructive since lightscattering accelerates and heats the atoms. Hence, in the experiments, the probewas switched on after the average bouncing time ti, when most atoms that reach theeffective mirror surface were reflected. Fig. 5.3(a) shows typical TOF signals fromfalling atoms, rising atoms, and atoms that fall back again. For clarity, the latter twosignals were magnified ×10. The sequence of falling and rising atoms can be usedto determine the bouncing time ti, and thus the fall height of the atoms. However,it then has to be clear, that the atoms were not launched with a vertical velocitycomponent, e.g. due to imbalanced radiation pressure in the preceding molassescooling. We therefore took also images of the MOT−prism configuration with ourCCD camera. For the experiments discussed in the following, this confirmed a fallheight of z0 = 6.2(4) mm, different to the heights in Fig. 5.3. Since the probe wasapplied at a relatively large height, it cut into the molasses cloud, causing a non-zero absorption at t = 0. As a cross-check, two signals for a different height of theprobe beam are shown in Fig. 5.3(b). The signature of the bounce is found in thesymmetrical temporal shift of corresponding signals from falling and rising atoms.

5.4 Investigation of bouncing atoms 91
0.1 10
5
10
Detuning /:
27
38
120
200
287
boun
cing
frac
tion
(%)
power/detuning (mW/)
5 50
optical potential U0/ h
Uth
Figure 5.4: Bouncing fraction vs. evanescent-wave power and detuning: TE-polarisation,
power between 0−28 mW, detuning in units of Γ = 2π×6 MHz, angle θi = θc+8.7 mrad,
laser waist w0 = 335 µm. Predictions with (solid line) and without (dashed) Van der
Waals interaction. The (optical) threshold potential is indicated by an arrow.
The bouncing signals are quantitatively discussed in the next section. Note thatthe signal of atoms falling down again after ∼ 90 ms, is weaker than for the risingatoms. Scattering of evanescent-wave photons during a bounce causes heating, andalso radiation pressure, see Chap. 6. Hence, the probe beam of limited width mayhave covered only part of the meanwhile spread and transversely moving atoms whenrecording late TOF signals.
5.4 Investigation of bouncing atoms
5.4.1 Optical power and detuning of the evanescent wave
From TOF absorption signals, as shown in Fig. 5.3, the fraction of bouncing atomsis obtained by evaluating the ratio of the integral signals for rising and falling atoms.The dependence of the bouncing fraction on the strength of the optical potential isshown in Fig. 5.4. Here, for various evanescent-wave detunings, the power was alsovaried. Since the effective mirror surface was relatively small compared to the size ofthe atom cloud, the approximately logarithmic dependence, η ∝ lnPL/δ, is clearlyobserved. Theoretical predictions are shown for a purely optical potential (dashedline) and including the Van der Waals interaction (solid line). Both predictionswere calculated without any adjustable fit parameter and take into account alsothe differences in optical potential for the various magnetic sublevels (see Fig. 5.2).The bouncing fraction was averaged over the calculated values for the sublevels,assuming an unpolarised atomic sample.

92 The evanescent-wave atom mirror
(a) (b)
0.01 0.1 10
2
4
6
8
10
(various detunings)
TM
TE
boun
cefr
action
(%)
power/detuning (mW/) surface distance z/0
z ( m)
pote
nti
al/
Uh
Uh
/(M
Hz)
0 0.5 1.0
0.5 1.0 1.500
5
10
15
60
0
30
90
Uth
TE
TM
Figure 5.5: TM- and TE-polarised mirror. (a) Measured bouncing fractions and predic-
tions with (solid lines) and without (dashed) Van der Waals interaction. (b)Mirror poten-
tials for the Fg = 2 eigenstates in the centre of the mirror, as calculated for PL = 15 mW
and δ = 200 Γ; bouncing threshold Uth. Optical potentials are indicated as thick lines.
The extrapolation to zero bouncing fraction yields the bouncing threshold. Ifthere were no Van der Waals interaction, this threshold would be the incident kineticenergy of the atoms, Uth = 2.2 Γ. The data clearly show that the Van der Waalsinteraction must be taken into account. For a more quantitative investigation ofthis phenomenon, see the work previously reported by Landragin et al. [103] andrecent experimental and theoretical work, based on an evanescent-wave mirror as aninterferometrical scheme [181–183]. In those experiments the evanescent-wave decaylength was chosen considerably shorter (ξ < λ0) than in our mirror configuration,thus providing better sensitivity to the surface potential. In a plot like Fig. 5.4,the separation of the two predictions is then larger. The ultimate goal of theseexperiments is to reveal QED retardation effects as described by the Casimir-Polderpotential ∝ 1/z4 [102, 184]. The power-laws of both Van der Waals and Casimir-Polder potential have also been probed using the deflection of an atomic beampassing through a micro cavity [185, 186], and using a torsion pendulum [187].
Our predicted curves for the bouncing fraction have an uncertainty of ±15%.This is mainly due to uncertainties in the initial cloud temperature and size. Bycomparison, uncertainties in laser power, beam waist, detuning, and fall height weresmall and can be neglected. Note that the prediction with Van der Waals interactionis also subject to uncertainty of the evanescent-wave decay length, which becomeslarge close to the critical angle, also due to the diffraction-limited beam collimation.

5.4 Investigation of bouncing atoms 93
It should be noted that our detection method under-estimated the fraction ofbouncing atoms. If the probe was placed too high, it cut into the optical molasses.If the probe was too low, it cut into the fast part of the bouncing signal. Ourprobe position of 3 mm above the prism was a compromise. Also, a horizontalmisalignment of the MOT with respect to the mirror or, equivalently, launchingof the atoms with a horizontal velocity causes atoms to miss the mirror. Hence,systematically a lower than expected bouncing fraction may have been observed.
For convenience, and to be sure of sufficient intensity with our limited laser powerof 30 mW, we restricted the optical potentials to detunings between 30− 200 Γ. Wedid not optimize the laser waist to the optimum value from Eq. (5.13), which wouldhave been wmax ≈ 1−3 mm, resulting in a bouncing fraction of ηmax ≈ 20−80%. Inexperiments that require much larger detuning ∼ 17000 Γ (100 GHz) due to photonscattering rates, more power is necessary, e.g. 150 mW from a tapered amplifiersystem. The optimal laser waist is then wmax ∼ 200 µm, resulting in a bouncingfraction of ηmax ∼ 0.8%. Therefore it may be necessary to guide the atoms down tothe mirror, in order to prevent the cloud from ballistic expansion and to keep thebouncing fraction up.
5.4.2 Polarisation of the evanescent wave
The effective mirror surface is larger for the TE-polarised wave as compared withthe TM wave. This is because of the larger intensity enhancement factor, Tj, seeEqs. (2.5) and (2.6). Figure 5.5(b) shows a typical set of potentials that contributeto the mirror. Note, that in the case of TM polarisation, there are five differenteigenvalues of the optical light shift. In the configuration considered here, withθi = θc + 8.7 mrad, the optical potential ratio is UTM/UTE = TTM/TTE = 2.2 n2.This is shown in Fig. 5.5(a), where the bouncing fraction for both polarisations isplotted vs. the laser parameters. The vertical error bars are the statistical errors fromGaussian fits which were performed, as an approximation of the Maxwell-Boltzmanndistribution, to obtain the integrated TOF signal. The horizontal separation of thetwo curves gives the ratio in optical potential. Note, that also the difference inreflection loss for light passing the UHV cell and entering the prism has to betaken into account. With a loss of 4.9% and 24.7% for TM and TE polarisation,respectively, this leads to a curve separation of 1.3n2 = 2.9.
The two data points for large PL/δ setting, that clearly do not match the pre-diction, we assign to an accidental systematic effect. It did not occur for the datafrom Fig. 5.4, taken with similar parameters. Possibly, the atoms were released witha larger temperature than previously measured (see below). There are, however, ef-fects that can reduce the bouncing fraction for small detuning. Radiation pressure,which is investigated in Chap. 6, can cause some atoms to drift out of the detectionrange of the probe. Also loss of atoms by optical hyperfine pumping into Fg = 1has to be considered. An estimate for this pumping loss is given in Chap. 6. It wasalso discussed by Landragin, see Ref. [188].

94 The evanescent-wave atom mirror
0 5 10 15 20 250
5
10
0.580.670.821.17
decay length (m)
boun
cing
frac
tion
(%)
angle i-
c(mrad)
0 0.05 0.10 0.15 0.20 0.250
5
10
20 6.7 510 4
temperature T (K)
boun
cing
frac
tion
(%)
1/T (1/K)
(a) (b)
Figure 5.6: Ballistic spread and decay length: TM-polarised evanescent-wave with PL =28 mW and δ = 113 Γ. (a) Bouncing fraction as a function of temperature and predictions
with (solid line) and without (dashed line) Van der Waals interaction, for θi = θc+3.9mrad.
(b) Bouncing fraction for various angles. Vertical dashed lines indicate the (almost)
diffraction-limited collimation of the evanescent-wave laser. The solid curve for θi > θc is
the prediction with the Van der Waals interaction, the dashed horizontal line without.
5.4.3 Ballistic spreading of the falling atom cloud
The fraction of bouncing atoms is related to the size of the ballistically expandingcloud when it hits the mirror. This was investigated by adjusting the equilibriumtemperature of the cloud during molasses cooling, before releasing it. For this pur-pose, the red detuning of the cooling laser was varied between 4.5 − 12.5 Γ. Thetemperature for each detuning was determined by fitting a Maxwell-Boltzmann dis-tribution to the TOF signal of falling atoms (cf. Fig. 3.15). The resulting bouncingfractions are shown in Fig. 5.6(a). Again, the predictions were calculated withoutadjustable parameters. The influence of the Van der Waals interaction is small here,due to the relatively large decay length, ξ = 1.32 µm. Between 6−20 µK, when mo-lasses cooling worked reliably, the data are in good agreement with the prediction.Temperatures of 6 µK and 20 µK result in rms cloud radii at the prism surface of0.9 mm and 1.6 mm, respectively. When trying to achieve lower temperatures bylarger molasses detuning, the cooling forces may have been too weak, such that im-balances caused horizontal drift of the falling atoms. (The error margins concerningthe measured temperature were estimated by ±20%.)
The approximate 1/T dependence of the bouncing fraction is valid only for largertemperatures. In the limit of very low temperatures, the fraction “saturates” at avalue that is determined by the initial width of the Gaussian atom cloud. In ourconfiguration, this would be a fraction of 77% with and 80% without Van der Waalsinteractions.
5.4 Investigation of bouncing atoms 95
5.4.4 Bouncing fraction vs. decay length
Measurements with varied decay length are shown in Fig. 5.6(b). The angle θi wasvaried from below the critical angle up to 25 mrad above, using an optical alignmentscheme that will be explained in detail in the next chapter. Close to the criticalangle, θi ≈ θc, the bouncing fraction dropped off. This did not occur abruptlydue to the nonzero divergence of the laser beam, which caused a spreading in theangle of incidence θi and in the decay parameter κ(θi). We measured a far-fieldhalf-angle divergence of ∆θi 1 mrad for the collimated beam, which was close tothe diffraction limit for a Gaussian beam of waist w0 = 335 µm:
∆θdif =λ0πw0
= 0.74 mrad . (5.15)
For details on the angle calibration, see in the next chapter. Note that, howeverthe waist was located at the prism surface to have a plane wave incident at theglass-vacuum interface, the diffraction limit causes a spread in the evanescent-wavedecay parameter, κ. Below the critical angle, θi θc, there is no total internalreflection (TIR) except for a small fraction of the beam power. This produces asmall bouncing signal in this regime. Similarly, above the critical angle, θi θc,some light is transmitted. Thus, the bouncing signal is also smaller than for largerangles with pure TIR. Another effect, that reduces the observed bouncing fractionfor angles close to θc, may be radiation pressure as mentioned above.
A measurement with κ as an experimentally adjustable parameter may offera way of investigating the intrinsic scaling of the atom-surface interaction, e.g.,the 1/z3 or 1/z4 behaviour of the Van der Waals or Casimir-Polder interaction,respectively. By means of κ, the surface distance of the turning point of bouncingatoms can be adjusted (cf. the atomic beam experiments in Ref. [185]).
A predicted curve for the bouncing fraction including the Van der Waals inter-action is shown in the figure. The (asymptotical) value for θi −→ θc equals theprediction without Van der Waals interaction, which is independent of κ, i.e. con-stant over the whole range of angles (dashed curve). Obviously, within the usedrange of angles, the measurements were not sensitive enough to distinguish betweenthe predicted curves. The scatter in the observed bouncing fractions may be duethe lack of a more accurate TOF reference signal of the falling atoms. However,the statistical errors of the fits to the bouncing signals were small. These statisticalerrors are shown in the figure.
The sensitivity to the variation with the angle may be improved by an extensionof the angle range. The optical access in the setup allowed us to increase the angleonly up to 25 mrad. This was not a principal limitation of the setup and has beenimproved meanwhile. However, the decay length approaches a minimum value of110 nm and, for large angles, the variation in the bouncing fraction is negligible.An improvement towards a smaller decay length may be the use of a prism withlarger refractive index. For example with SF 11 (n = 1.76), the decay length dropsto 86 nm and the variation in the bouncing fraction should be larger.

96 The evanescent-wave atom mirror
5.5 Conclusions
Cold atoms that bounce elastically and in normal incidence on an evanescent-wavemirror were detected by time-of-flight measurements. These measurements confirmthe expected properties of the mirror potential in terms of the observed number ofbouncing atoms as a fraction of the amount of atoms that were initially releasedon the mirror. We observed bouncing fractions up to 8%, which is limited by theballistic spread of the atoms in relation to the effective mirror surface. We variedthe effective surface by means of the laser detuning and power, and adjusted thetemperature of the released atom cloud between 6 − 20 µK. The measurementsclearly show the significance of the Van der Waals atom–surface interaction andconfirm the calculation using no adjustable parameters. The measurements werenot sufficiently sensitive to reveal properties of the Van der Waals interaction inmore detail.
We observed larger bouncing fractions with a TM-polarised mirror than witha TE-polarised mirror, using the same laser power. This is in agreement with acalculation based on the Fresnel coefficients, which show that the evanescent-waveoptical potential in the TM mode is larger by a factor ≈ 2.9 compared to the TEmode.
When tuning the evanescent wave angle of incidence through the critical angle,we could observe a small bouncing fraction also for angles below the critical an-gle. This is due to the diffraction limited collimation of the laser beam. With thelaser power available, the optimization of the effective mirror surface may resultin a considerably larger bouncing fraction 20%. However, our goal are exper-iments with much larger detuning (see Chap. 2), which requires a relatively smallevanescent-wave spot.
6Radiation pressure
exerted by evanescent waves
Radiation pressure, that is exerted on cold rubidium atoms whilebouncing on an evanescent-wave atom mirror, was directly ob-served. It was analysed by imaging the motion of the atoms af-ter the bounce. The number of absorbed photons was measuredfor laser detunings ranging from 190 MHz to 1.4 GHz and forevanescent-wave angles from 0.9 mrad to 24 mrad above the criticalangle of total internal reflection. Depending on these settings, ve-locity changes parallel with the mirror surface were observed, rang-ing from 1 to 18 cm/s. This corresponds with 2 to 31 photon recoilsper atom. These results were independent of the evanescent-waveoptical power.
This chapter is based on the publication
D. Voigt, B.T. Wolschrijn, R. Jansen, N. Bhattacharya, R.J.C. Spreeuw,and H.B. van Linden van den Heuvell, Phys. Rev. A 61, 063412 (2000).
97

98 Radiation pressure exerted by evanescent waves
6.1 Introduction
Most experimental work on evanescent-wave mirrors so far, has been concentratedon the reflective properties [4,5], i.e. the change of the atomic motion perpendicularto the surface [189]. This is dominated by the dipole force due to the strong gradientof the electric field amplitude. In this chapter, measurement of the force parallel tothe surface are presented. It was mentioned already in the original proposal of anevanescent-wave mirror, Ref. [3], that there should be such a force. The propagatingcomponent of the wave vector leads to a spontaneous scattering force, “radiationpressure” [152, 153]. To our knowledge, we presented the first direct observation ofradiation pressure exerted by evanescent waves on cold atoms. Previously, a forceparallel to the surface was observed for micrometer-sized dielectric spheres moving inan evanescent-wave [190]. The basic phenomenon of radiation pressure, the photonrecoil momentum, was mentioned already in 1917 by Einstein, in his work on thequantisation of the electro-magnetic field [191]. It was first observed experimentallyin 1933 by Frisch [192], by means of the deflection of an atomic beam with freelypropagating light. In 1976, it was proposed by Roosen and Imbert to use also abeam deflection to probe the radiation pressure of an evanescent wave [193].
In our experiment, we observed the trajectory of a cloud of cold rubidium atomsbouncing on a horizontal evanescent-wave mirror. The radiation pressure appearedas a change in horizontal velocity during the bounce. We studied the average numberof scattered photons per atom as a function of the detuning and angle of incidenceof the evanescent wave. The latter varies the “steepness” of the optical potential.
It was discussed in Chap. 2, that due to its short extension at the order of theoptical wavelength, λ0, an evanescent-wave mirror constitutes a promising tool forloading low-dimensional optical atom traps in the vicinity of a dielectric surface[82,83,86,87]. It is this application which drives our interest in experimental controlof the photon scattering of bouncing atoms.
In the following section, this scattering is discussed as a source of radiationpressure by the evanescent wave. Section 6.3 describes the actual experimental con-figuration and the imaging method used to observe bouncing atoms. Section 6.4investigates the radiation pressure in dependence on the angle of incidence and thelaser detuning, including a discussion of several systematic errors.
6.2 Photon scattering by bouncing atoms
In Chap. 2, the phenomenon of an evanescent wave was introduced. By total internalreflection of a laser beam, that is incident in the xz-plane, the evanescent wave wasestablished in the horizontal xy-plane at the vacuum side of a glass surface, seeFigs. 2.1 and 6.1. The wave vector of the evanescent wave, k = (kx, 0, iκ), wasfound with a propagating component along the surface, kx = k0n sin θi > k0, wherek0 = 2π/λ0 is the vacuum wavenumber, n is the refractive index, and θi is the angle ofincidence. The optical dipole potential of the atom mirror, Udip(z) = U0 exp(−2κz),is realised by choosing a blue laser detuning with respect to an atomic resonance
6.3 Observation of bouncing atoms 99
and using the exponentially decaying field amplitude that is due to the imaginary
wave vector component perpendicular to the surface, κ(θi) = k0√
n2 sin2 θi − 1. Thedecay length was defined as ξ(θi) = 1/κ(θi).
The number of scattered photons per bounce, Nscat = Γpi/δκ, was obtained inEq. (2.19) by integrating the scattering rate of an atom along the vertical bouncingtrajectory (z(t), v(t)). Note, that Nscat is independent of U0, i.e., an atom climbs theexponential mirror potential up to the turning point, no matter what the maximumoptical potential at the glass surface is. The “steepness” of the optical potential isdetermined by κ. The steeper the potential, the shorter the time an atom spendsin the light field and the smaller Nscat. This behaviour is shown schematically inFig. 6.3 for two different angles θi.
We expect that an absorbed photon gives a recoil momentum to the atom,
prec = kx x , (6.1)
which is directed along the propagating component of the evanescent wave. This wasdiscussed, e.g. in Ref. [193]. Experimentally, we observed this effect by the alteredhorizontal velocity of atom clouds after the bounce. The spontaneous emission ofphotons during the scattering cycles leads also to heating of the cloud and thus tothermal expansion [194, 195]. Note, that the expression (6.1) is valid exactly onlyfor a TE-polarised evanescent-wave. In TM polarisation, the wave is ellipticallypolarised and both the Poynting vector and the radiation pressure may be directedaway from the propagation direction of the wave [101,193]. However, with the angleof incidence close to the critical angle θc also the TM wave is nearly linearly polarisedand the expression (6.1) may be used.
In principle, Nscat is changed if other than optical forces are present. For example,the Van der Waals attraction, that was neglected in the derivation of Eq. (2.19),tends to “soften” the potential and thus to increase Nscat. We investigated thisnumerically and found it to be below the resolution of our detection method.
6.3 Observation of bouncing atoms
The radiation pressure experiment was performed using the same optical config-uration of the evanescent-wave mirror as with the bouncing fraction experimentsdescribed in the previous chapter. Also the laser systems were identical. In orderto investigate radiation pressure as a function of detuning δ in a range as large aspossible with the present laser power of 28 mW, we used a TM-polarised evanescentwave. In the previous chapter it was verified by means of the bouncing fraction,that this polarisation yields a stronger dipole potential than a TE-polarised beamof the same power, see also Eqs. (2.5) and (2.6).
Two particular differences with the former setup were, however, (i) the specificuse of an optical scheme to reproducibly adjust the evanescent-wave angle of inci-dence and, (ii) imaging of bouncing atoms instead of recording time-of-flight signals,see Fig. 6.1. A minor difference was that the magneto-optical trap (MOT) was op-erated at slightly larger height (6.6 mm) above the prism surface.

100 Radiation pressure exerted by evanescent waves
(a) (b)
z
xy
MOT
EWTM
CCDFP
M
EW
nL2L1
ff
2f
a
O
S
F
ii
Figure 6.1: (a) Evanescent-wave mirror with fluorescence imaging. Magneto-optical
trap (MOT), 6.6 mm above a prism, TM-polarised evanescent-wave beam (EW), cam-
era facing in the y-direction (CCD), resonant fluorescence probe beam from above (FP).
(b) Confocal relay telescope for adjusting the angle of incidence θi. The lenses L1 and
L2 have equal focal length, f = 75 mm. The “object” spot (O) is imaged to the fixed
evanescent wave-spot (S). A translation of L1 by a distance ∆a changes the angle of
incidence by ∆θi. M is a steering mirror, F is the focal plane in the telescope.
(i) Angle adjustment.— Our intention was to probe the number of scatteredphotons, Nscat ∝ ξ(θi)/δ, as a function of decay length and detuning. Therefore itwas desirable to adjust the evanescent-wave angle θi in a well defined manner withpreserved calibration. In particular, a displacement of the evanescent-wave spotdue to the angle adjustment was not admissible. Such a displacement leads to asystematic error in our measurements, see Section 6.4.2.
The optical setup with which we adjusted the evanescent-wave angle is shownin Fig. 6.1(b). The basic idea is to image an (hypothetical) object (O) in the laserbeam (EW) to a fixed spot (S) at the prism surface, where the evanescent wave is es-tablished. The laser beam emerged from a single-mode optical fibre, was collimatedand directed through a relay telescope to the prism. The angle of incidence, θi, wascontrolled by the vertical displacement ∆a of the first telescope lens, L1. This lensdirects the beam, whereas the second lens, L2, images it to S. A displacement ∆aleads to a variation in θi, given by:
∆θi =∆a
nf. (6.2)
The refractive index n occurs here by Snel’s law for the beam entering the prism.Due to the 2f lens spacing the beam is again collimated at the evanescent-wavelocation, with a minimum waist of 335 µm at the spot S (1/e2 intensity radius).The focal length of both lenses (30 mm dia.) was f = 75 mm, which allowed forangles up to 25 mrad beyond θc. When using larger lenses (40 mm dia., f = 80 mm),also angles up to 50 mrad were possible.

6.3 Observation of bouncing atoms 101
Figure 6.2: Fluorescence images of a bouncing atom cloud. The first image was taken
5 ms after releasing the atoms from the MOT. The contour of the right-angle prism (width
10 mm) and the direction of the EW laser beam are indicated in the first frame. For
comparison the horizontal placement of the MOT is also indicated in the frame (vertical
dashed line).
(ii) Imaging.— Compared with time-of-flight methods, the strength of imagingcold atoms lays in its potential of resolving possible horizontal motion of bouncingatom clouds. More specifically, changes in the horizontal motion are considered inthis chapter. (Also the mutual alignment of the MOT and the evanescent-wave wasfacilitated using such images.)
Atoms that have bounced on the evanescent-wave mirror were detected by in-duced fluorescence from a pulsed probe beam in resonance with the Fg = 2 −→Fe = 3 transition of the D2 line. The probe beam had a diameter of 10 mm andwas directed vertically downward. The fluorescence was recorded from the side bya digital frame-transfer CCD camera (Princeton Instruments) with a commercialobjective of 50 mm focal length. The integration time was chosen between 0.1 msand 1 ms, and was matched to the duration of the probe pulse. Each camera imageconsisted of 400×400 pixels, that were hardware-binned on the CCD array in groupsof four pixels. The field of view was 10× 10 mm2 with a spatial resolution of 51 µmper pixel. With 15 µm pixel width, this corresponded to a magnification of 0.6.
A typical timing sequence of the experiment was as follows. The MOT wasloaded from the background vapour during 1 s. After 4 ms of polarisation gradientcooling in optical molasses the atoms were released in the Fg = 2 ground state byclosing a shutter in the cooling laser beams. The image capture was triggered witha variable time delay after releasing the atoms. During the entire sequence, theevanescent-wave laser was permanently on. In addition, a permanent repumping

102 Radiation pressure exerted by evanescent waves
beam counteracted optical pumping of the probed atoms to the Fg = 1 groundstate. We observed no significant influence on the performance of the evanescent-wave mirror by the repumping light.
We measured the trajectories of bouncing atoms by taking a series of imageswith incremental time delays. A typical series with increments of 10 ms between theimages is shown in Fig. 6.2. Our detection destroys the atom cloud, so a new samplewas prepared for each image. The exposure time was 0.5 ms. Each image has beenaveraged over 10 shots. The image at 35 ms shows the cloud just before the averagebouncing time, ti = 36.7 ms, that corresponds to the fall height of 6.6 mm. In laterframes we see the atom cloud bouncing up from the surface. Close to the prism, thefast vertical motion caused blurring of the image. Another cause of vertical blur ismotion due to radiation pressure by the probe pulse. The horizontal motion of theclouds was not affected by the probe. We checked this by comparing with imagestaken with considerably shorter probe pulses of 0.1 ms duration.
6.4 The observation of radiation pressure
6.4.1 Results
Radiation pressure in the evanescent wave was observed by analysing the horizontalmotion of the clouds. From the camera images, we determined the centre-of-mass(COM) position of the clouds to about ±1 pixel accuracy. Such COM trajectoriesare shown in Fig. 6.3(b) for various angle settings of the evanescent-wave. We seeclearly, that a steep optical potential, i.e. a small decay length, causes less radiationpressure than a shallow potential. For further quantitative investigation, in Fig. 6.4,the horizontal position was plotted vs. the time elapsed since release. We find thatthe horizontal motion is uniform before and after the bounce. The horizontal velocitychanges suddenly during the bounce as a consequence of scattering evanescent-wavephotons. The change in velocity is obtained from a linear fit.
In Fig. 6.5, it is shown how the radiation pressure depends on the laser detuningδ and on the angle of incidence θi. The fitted horizontal velocity change has beenexpressed in units of the evanescent-wave photon recoil, prec = k0n sin θi, withk0/M = 5.88 mm/s and n sin θi ranging between 1 and 1.03.
In Fig. 6.5(a), the detuning was varied from 188 − 1400 MHz, or 31 − 233 Γ.Two sets of data are shown, taken for two different angles, θi = θc + 0.9 mrad andθc + 15.2 mrad. This corresponds to a decay length of ξ(θi) = 2.8 µm and 0.67 µm,respectively. We find that the number of scattered photons is inversely proportionalto δ, as expected. The predictions based on Eq. (2.19) are indicated in the figure(solid lines).
In Fig. 6.5(b), the detuning was kept fixed at 44 Γ and the angle of incidence wasvaried between 0.9 mrad and 24.0 mrad above the critical angle θc. This leads to avariation of ξ (θi) from 2.8 µm to 0.53 µm. Here also, we find a linear dependenceon ξ (θi). The observed radiation pressure ranges from 2 to 31 photon recoils peratom. Note, that we separate this subtle effect from the faster vertical motion, inwhich atoms enter the optical potential with a momentum of pi 63 prec.

6.4 The observation of radiation pressure 103
(a) (b)
0 1 2 3
0
2
4
6
8
vert
ical
Z(m
m)
horizontal X (mm)
steep
shallow
U(z)U(z)
z
U(z)U(z)
2Mpi2
EW
i
Figure 6.3: Radiation pressure as a function of mirror steepness. (a) A large evanescent-
wave angle θi causes a steep potential, U(z). The incident atom momentum, pi = 63 prec(vi = 37 cm/s), corresponds with a fall height of 6.6 mm. A bouncing atoms spends more
time in a shallow potential, therefore scattering more photons. (b) Cloud trajectories
of bouncing atoms observed by camera images for various angle settings. The symbols
correspond with those of Fig. 6.4. The dashed arrow indicates increasing mirror steepness.
30 40 50 60 70
0
1
2
3
4
time (ms)
X(m
m)
30 40 50 60 70
0
1
2
3
4
time (ms)
X(m
m)
(a) (b)
=1.87 m
=0.67 m
Figure 6.4: Horizontal motion of bouncing atom clouds. The centre of mass position
is plotted vs. time since release. Bouncing occurred at 36.7 ms (vertical dashed line).
(a) The evanescent-wave decay length was varied as ξ(θi)/λ0 = 2.40, 1.32, 1.01, 0.86,0.76, 0.68, from large to small velocity change. The detuning was 44 Γ and the power
was 19 mW. (b) Comparison of two values of evanescent-wave power, 19 mW (, •) and10.5 mW (, ). The detuning was 31 Γ and the evanescent-wave decay lengths were
1.87 µm (2.40λ0) and 0.67 µm (0.86λ0). Solid lines indicate linear fits.

104 Radiation pressure exerted by evanescent waves
0 0.01 0.02 0.030
10
20
30
detuning /
phot
onre
coils
Nsc
at
0 1 2 30
10
20
30
decay length (m)
phot
onre
coils
Nsc
at
(a) (b)
Figure 6.5: Radiation pressure on bouncing atoms expressed as number of absorbed
photons, Nscat. (a) Detuning δ varied for ξ = 2.8 µm () and 0.67 µm (•). (b) evanescent-wave decay length ξ varied for δ = 44 Γ. The laser power was 19 mW. The thin solid line is
a linear fit through the first four data points. Theoretical predictions due to Eq.(2.19): two-
level atom (thick solid lines), rubidium excited-state hyperfine structure and saturation
taken into account (dashed lines).
In Fig. 6.4(b), we compare trajectories for 19(1) mW and 10.5(5) mW power inthe evanescent wave. As expected from Eq. (2.19), there is no significant differencein horizontal motion. For a decay length of ξ = 2.8 µm both power settings lead toessentially the same radiation pressure, that is 25(3) scattered photons for 19 mWand 23(2) photons for 10.5 mW. The corresponding observations for 0.67 µm decaylength were 13(2) and 11(1) photons, respectively.
In the previous chapter it was discussed how the optical power determines theeffective mirror surface and thus the fraction of bouncing atoms. Here this wasalso visible in the horizontal width of imaged atom clouds. For a given evanescentwave power, there is an upper limit for the detuning, above which no bouncing canoccur. For the data in Fig. 6.5(a), this threshold is calculated as δth = 6.5 GHzfor ξ = 0.67 µm and 8.1 GHz for ξ = 2.8 µm. The difference in the thresholddetuning is due to the Van der Waals interaction. With our laser power, Eq. (2.19)thus predicts for our mirror a minimal (average) number of 0.25 scattered photonsper atom. A second threshold condition, for fixed detuning, is indeed given by theVan der Waals interaction, which yields a lower limit for the minimally useful decaylength ξ. For Fig. 6.5(b) this lower limit is calculated as ξth = 116 nm, i.e. for anangle θth = θc + 0.59 rad.

6.4 The observation of radiation pressure 105
6.4.2 Systematic errors and discussion
According to Eq. (2.19), the radiation pressure should be inversely proportional toboth δ and κ(θi). As shown in Fig. 6.5, we find deviations from this expectationin our experiment, particularly in the κ-dependence. A linear fit to the data forξ < 1 µm, extrapolates to an offset of approximately 3 photon recoils in the limitξ → 0 [thin solid line in Fig. 6.5(b)]. The vertical error bars on the data includestatistical and systematic errors in the velocity determination from the cloud tra-jectories. In the following, several possible systematic errors are discussed, namely(i) the geometric alignment, (ii) the evanescent-wave angle calibration and collima-tion, (iii) diffusely scattered light, (iv) the Van der Waals atom-surface interaction,(v) excited hyperfine state contributions to the optical potential, and (vi) saturationeffects.
(i) Alignment.— Geometrical misalignments give rise to systematic errors in theradiation pressure measurements. For example, a tilt of the prism causes a horizontalvelocity change even for specularly reflected atoms. We checked the prism alignmentand found it tilted by 12(5) mrad from horizontal. This corresponds to an offset of1.5(6) recoils on Nscat. In addition, the atoms were “launched” from the MOT witha small initial horizontal velocity, which we found to correspond to less than ±0.4recoils for all our data.
From Fig. 6.4, we see that the extrapolated trajectories at the bouncing time tido not start from the horizontal position before the bounce. We attribute this to ahorizontal misalignment of the MOT with respect to the evanescent-wave spot. Ob-viously, there is a small displacement of the evanescent-wave at the prism surface,when adjusting θi by means of the lens L1, see Fig. 6.1(b). Since the finite-sizedevanescent-wave mirror reflects only part of the thermally expanding atom cloud,such a displacement selects a nonzero horizontal velocity for bouncing atoms. Wecorrected for those alignment effects in the radiation pressure data of Fig. 6.5. Forsmall radiation pressure values, the systematic error due to alignment is the domi-nant contribution to the vertical error bar.
(ii) Beam angle and collimation.— We checked the beam collimation andfound it nearly diffraction-limited with a half-angle divergence of less than 1 mrad.The calibration of the critical angle setting was done by monitoring the power trans-mitted through the prism surface, while tuning the angle θi from below to above θc,see Fig. 6.6. We determined θi − θc within ±0.2 mrad. For the radiation pressuredata (Fig. 6.5), the uncertainty in the evanescent-wave angle with respect to thecritical angle is expressed by the horizontal error bars. Close to the critical angle,the decay length ξ(θi) diverges, and thus the error bar on ξ becomes very large. Alsothe diffraction-limited divergence of the evanescent-wave beam becomes significant.It causes part of the optical power to propagate into the vacuum. In addition, theoptical potential is governed by a whole distribution of decay lengths. Thus, themodel of a simple exponential optical potential ∝ exp (−2κz) might not be validand contribute to the disagreement of our data with the prediction by Eq. (2.19).For larger angles, i.e. ξ(θi) < 1 µm, the effect of the beam divergence is negligible.This we could verify by numerical analysis.
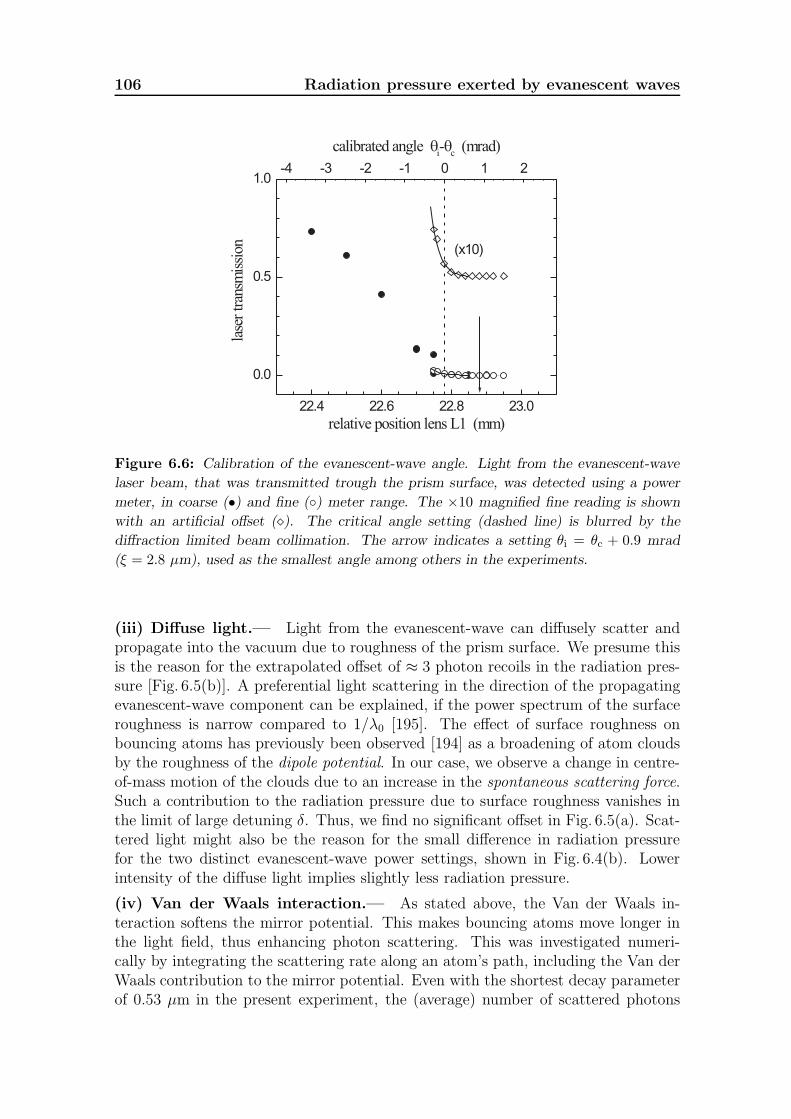
106 Radiation pressure exerted by evanescent waves
22.4 22.6 22.8 23.0
0.0
0.5
1.0
(x10)la
ser
tran
smis
sion
relative position lens L1 (mm)
-4 -3 -2 -1 0 1 2
calibrated angle i-
c(mrad)
Figure 6.6: Calibration of the evanescent-wave angle. Light from the evanescent-wave
laser beam, that was transmitted trough the prism surface, was detected using a power
meter, in coarse (•) and fine () meter range. The ×10 magnified fine reading is shown
with an artificial offset (). The critical angle setting (dashed line) is blurred by the
diffraction limited beam collimation. The arrow indicates a setting θi = θc + 0.9 mrad
(ξ = 2.8 µm), used as the smallest angle among others in the experiments.
(iii) Diffuse light.— Light from the evanescent-wave can diffusely scatter andpropagate into the vacuum due to roughness of the prism surface. We presume thisis the reason for the extrapolated offset of ≈ 3 photon recoils in the radiation pres-sure [Fig. 6.5(b)]. A preferential light scattering in the direction of the propagatingevanescent-wave component can be explained, if the power spectrum of the surfaceroughness is narrow compared to 1/λ0 [195]. The effect of surface roughness onbouncing atoms has previously been observed [194] as a broadening of atom cloudsby the roughness of the dipole potential. In our case, we observe a change in centre-of-mass motion of the clouds due to an increase in the spontaneous scattering force.Such a contribution to the radiation pressure due to surface roughness vanishes inthe limit of large detuning δ. Thus, we find no significant offset in Fig. 6.5(a). Scat-tered light might also be the reason for the small difference in radiation pressurefor the two distinct evanescent-wave power settings, shown in Fig. 6.4(b). Lowerintensity of the diffuse light implies slightly less radiation pressure.
(iv) Van der Waals interaction.— As stated above, the Van der Waals in-teraction softens the mirror potential. This makes bouncing atoms move longer inthe light field, thus enhancing photon scattering. This was investigated numeri-cally by integrating the scattering rate along an atom’s path, including the Van derWaals contribution to the mirror potential. Even with the shortest decay parameterof 0.53 µm in the present experiment, the (average) number of scattered photons
6.4 The observation of radiation pressure 107
would increase only about 0.8% compared with Eq. (2.19). This was not resolvedexperimentally. For example, with a detuning of 1 GHz and 2.5 mW power, an en-hancement from Nscat = 1.09 to a value of 1.13 due to the Van der Waals interactionis calculated for a decay length of 370 nm (θi = θc + 49.5 mrad).
However, this result was obtained by averaging the scattered photons over theeffective mirror surface. At the edges of this surface, that is at the bouncing thresh-old circumference, Rth(φ) from Eq. (5.7), the turning point of a bouncing atomapproaches the maximum of the mirror potential. Therefore the calculated numberof scattered photons is large, i.e., it diverges for an atom at exactly the thresholdcircumference.
(v) Excited hyperfine state contributions.— In the two-level model, the scat-tering rate was expressed in the dipole potential as Γ′ = (Γ/δ)Udip. This is nolonger true if we take into account the excited state manifold Fe = 0, 1, 2, 3 of87Rb. All levels except Fe = 0 contribute to the mirror potential and the scatteringrate. Due to hyperfine pumping to Fg = 1, part of the atoms are lost, such that alower net radiation pressure results. Nevertheless, we observed no influence of thepermanently present repumping laser on the number of scattered photons, probablybecause it did not saturate the repumping transition, Fg = 1 −→ Fe = 2.
Assuming a predominantly linear polarisation of the TM-polarised evanescent-wave with θi ≈ θc, we can define a hyperfine correction, βHF, to the number ofscattered photons, NHF = βHFNscat (cf. Appendix A.3):
βHF =δ235
∑mg
+1∑j′=−1
(∑Fe
d22,Fe〈2, mg, 1, 0|Fe, mg〉〈2, mg − j′, 1, j′|Fe, mg〉
δ2,Fe
)2
∑Fe
(d2,Fe 〈2, mg, 1, 0|Fe, mg〉)2δ2,Fe
.(6.3)
This correction averages over equally occupied ground state sublevels mg. Thenumerator is proportional to the partial photon scattering rate which leaves theatom in the same ground level, Fg = 2. Note that the scattering amplitudes throughdifferent intermediate Fe states are first added coherently, then squared [196]. Thedetuning for each level is assigned as δ2,Fe . The summation over j′ accounts for thethree possible polarisations emitted in the scattering process. The denominator isproportional to the light shift, adding contributions from all excited Fe levels. Withan evanescent-wave detuning of δ2,3 = 44Γ, the correction results in a number ofNHF scattered photons typically 9% lower than expected for a two-level atom.
(vi) Saturation effects.— In order to investigate the influence of saturation onthe number of scattered photons, we solved the optical Bloch equations numericallyfor the steady-state excited state population, σ
(st)ee , see AppendixA.3. A bouncing
atom encounters the evanescent wave as a light pulse with a typical duration between3 and 10 µs. This is short compared to the natural excited state lifetime, τ = 26 ns.The steady-state assumption is thus justified.

108 Radiation pressure exerted by evanescent waves
The temporal variation of the Rabi frequency ΩR(t) is expressed using the verticalbouncing trajectory, vz(t) = vi tanh (κvit):
ζ(t) =1
κln (cosh(κvit)) . (6.4)
Since the potential at the turning point is the maximum potential encountered bythe atom, we have deliberately chosen the turning point as the origin, ζ = 0, of atransformed height coordinate, ζ ≡ z − (lnU0/Ui)/2κ. The Rabi frequency is thengiven as a function of ζ , as ΩR(ζ) = ΩR(0) exp(−κ ζ), or as function of t:
ΩR(t) = ΩR(0)1
cosh(κvit)= 2
√δ Ui
sech(κvit) . (6.5)
We can thus integrate the time-dependent scattering rate, Γ′(t) = Γ σ(st)ee (t), for
a bouncing atom [cf. Eq. (A.16)]. With an evanescent-wave detuning of 44 Γ, wefind approximately 7% fewer scattered photons compared with the unsaturatedexpression of Eq. (2.19). Note, that the bounces occur sufficiently slowly to preserveadiabaticity. In Fig. 6.5, we show predicted curves, corrected for hyperfine structureand saturation (dashed solid lines).
6.5 Conclusions
We have directly observed radiation pressure that was exerted on rubidium atomswhile bouncing on an evanescent-wave atom mirror. We did so by analysing thebouncing trajectories. The radiation pressure was directed parallel to the propa-gating component of the evanescent wave, that is, parallel to the glass surface. Weobserved 2−31 photon recoils per atom per bounce and found the radiation pressureto be independent of the optical power in the evanescent wave, as expected from theexponential character of the evanescent wave.
The inverse proportionality to both the evanescent-wave detuning and the angleof incidence is in reasonable agreement with a simple two-level-atom calculation,using steady-state expressions in the limit of low saturation for the evanescent-waveoptical potential and the photon scattering rate. The agreement improved when alsothe excited state hyperfine structure and saturation effects were taken into account.The measured number of photon recoils as a function of the evanescent-wave decaylength indicates an offset of approximately 3 recoils in the limit of a very steepevanescent-wave potential. We assume, that this is due to light that is diffuselyscattered due to roughness of the prism surface but retains a preferential forwarddirection parallel with the evanescent-wave propagating component.
With improved resolution, it should be possible to resolve the discrete natureof the number of photon recoils and also their magnitude, kx > k0 [197]. Ourtechnique could also be used to observe quantum-electrodynamic effects for atomsin the vicinity of a surface, such as radiation pressure in the xy-plane but out of thex-direction of the propagating evanescent-wave component [101].

7Inelastic evanescent-wave mirrors
Inelastic bouncing of cold (10 µK) rubidium atoms from anevanescent-wave mirror was observed by tuning the evanescent-wave laser close to an open optical transition. The number ofphotons that were off-resonantly scattered by a bouncing atomwas 1. The resulting optical hyperfine pumping by the evanescentwave causes dissipation. Atoms that undergo a change in hyperfineground state jump off the mirror with reduced kinetic energy. In-elastic mirrors for 87Rb were realised on both fine structure lines,D1 and D2. Cold atom clouds were released from 6 mm above themirror and both elastically and inelastically bouncing atoms weredetected by absorption imaging. The observed inelastic bouncingheight ranged between 0.5 − 1.1 mm. The optical pumping effi-ciency, was adjusted between 30 − 100 % by varying the laser de-tuning. Using absorption imaging also the velocity distribution ofinelastically bouncing atoms was investigated.
109

110 Inelastic evanescent-wave mirrors
7.1 Introduction
Evanescent-wave mirrors for atoms [3–5] are usually designed to preserve the co-herence and to provide specular reflection of atomic matter waves [194, 195]. Thisrequires the amount of photons scattered by the bouncing atoms to be low within thetypical bouncing time scale of 3−10 µs, i.e. the scattering rate should be 106 s−1.Since this rate varies as ∝ 1/δ with the detuning, evanescent-wave mirrors are com-monly realised with large blue detuning.
In experiments that allow for a few scattered photons, evanescent waves arepreferentially tuned to optical cycling (“closed”) transitions. This avoids atom lossby change of hyperfine state. To observe radiation pressure by several scatteredphotons, we therefore used the closed Fg = 2 −→ Fe = 3 transition on the D2 line ofrubidium, see Chap. 6. On the other hand, in various applications photon scatteringby bouncing atoms on an open transition is an essential part of the physical processunder investigation. Examples are:
(i) loading schemes for a low-dimensional optical trap [82–84,86,87], as discussedin Chap. 2. A spontaneous optical Raman transition provides a dissipative, phase-space compressing mechanism to transfer atoms into the trap. This results in anaccumulation of atoms that are decoupled from the mirror potential in a layer closeto the surface. Also a two-dimensional magnetic waveguide for cold atoms using anoptical loading mechanism has been proposed [85].
(ii) Spontaneous Raman transitions are essential for reflection cooling of atomsby an evanescent-wave [16, 17, 106]. A single inelastic bounce can be consideredas a fundamental “Sisyphus” process [106], in analogy with polarisation gradientcooling [70]. Net cooling is achieved by multiple inelastic bouncing. Reflectioncooling is not restricted to evanescent-wave mirrors. It has also been demonstratedin a gravito-optical trap, where cooling occurred by reflections at a hollow, conicallyshaped dipole trapping potential [198].
(iii) Diffraction of cold atoms by an evanescent-wave grating should also be men-tioned at this place. It represents an atom-optical tool, e.g. as beam splitting mech-anism for atom interferometers. It was first demonstrated using atomic beams atgrazing incidence [199] and later with cold atoms at normal incidence [200]. Stim-ulated Raman transitions between magnetic or hyperfine sublevels are inherent tothe diffraction process [201].
We have realised inelastic mirrors on both the D1 (795 nm) and D2 (780 nm)rubidium fine structure lines, see Fig. 3.7. Our particular interest is in the D1 line,since the hyperfine structure, Fg = Fe = 1, 2, allows to prepare dark, far off-resonance optical trapping potentials, see Chap. 2. Note that there is no hyperfinecycling transition on the D1 line, so that (purely) elastic bouncing was not possibleusing this line with our moderate evanescent-wave detunings.
We observed bouncing atoms directly with an absorption imaging technique thatallowed us to trace the evolution of the atomic density after the bounce. We thusobserved the inelastic bouncing height, in contrast to the time-of-flight detection thatwas employed in earlier experiments by Desbiolles et al. [106]. The bouncing height,velocity distribution and inelastic transfer efficiency are discussed qualitatively.

7.2 Principle of inelastic evanescent-wave mirrors 111
F =1
F =2
MOT
DP (RP) OP
height z / 0
pote
nti
al/
Uh
U2
U1
6 4 2 00
2
4
0
2
0z = 6 mm
g
g
inelasticheight
Figure 7.1: The inelastic evanescent-wave mirror. Hyperfine ground state poten-
tials U1,2 (thick curves), bouncing threshold (dashed horizontal line), optical wavelength
λ0 = 780 nm, and transition linewidth Γ = 2π × 6.0 MHz. Atoms are released from a
height z0 and depumped (DP) into Fg = 1. Optical pumping (OP) transfers a fraction
of the atoms back into Fg = 2, causing inelastic bouncing. Elastically bouncing atoms
remain in Fg = 1. Atoms are exclusively detected in Fg = 2. Atoms in Fg = 1 can be
repumped (RP) to be also detected.
7.2 Principle of inelastic evanescent-wave mirrors
Inelastic bouncing from an evanescent-wave mirror occurs when bouncing atomsdissipate potential energy, which they have acquired from their kinetic energy byclimbing the mirror potential. The spontaneous process involved, is optical pumpingeither by the evanescent wave of the mirror or by an additional near-resonanceevanescent pumping field [86]. If no additional light is provided, optical pumpingcan only occur when the mirror laser is tuned to an open optical transition. Workingwith 87Rb, this is realised with atoms falling down in the Fg = 1 ground state. Usinga mirror on the D1 line, the evanescent wave is applied with a detuning δ1 abovethe Fg = 1 −→ Fe = 2 transition. Atoms are off-resonantly excited to Fe = 1, 2by the evanescent wave and decay into Fg = 2. The laser detuning relative to theFg = 2 −→ Fe = 2 transition will be denoted as δ2 in the following. The samenotation holds for an inelastic mirror on the D2 line, since there is no dipole-allowedtransition from Fg = 1 to the Fe = 3 excited state.
The bouncing process is illustrated in Fig. 7.1. Similar to the experiments dis-cussed in the previous chapters, a sample of cold atoms (≈ 10 µK) is released in theFg = 2 ground state, 6 mm above the evanescent-wave mirror. A depumping pulse,in resonance with the open Fg = 2 −→ Fe = 2 transition, transfers all falling atomsinto Fg = 1. The potentials, U1,2, are shown in the figure [see also Eq. (2.10)]. Close

112 Inelastic evanescent-wave mirrors
to the mirror, the figure is scaled in units of the optical wavelength, λ0 = 780 nmfor the D2 line. The potential in that region is determined by the evanescent-wavedipole potential and the Van der Waals interaction. The broken axis between thepotential curves represents the separation by the ground state hyperfine splitting,δGHF = 1139 Γ. The turning point of the atoms is determined by the initial gravita-tional potential, here Ugrav(z0) = Mgz0 = 2.1 Γ. (In Chap. 5, this potential was dis-cussed as the bouncing threshold Uth, when varying the mirror parameters.) Opticalpumping by the evanescent wave transfers a fraction of the bouncing atoms back intoFg = 2. Since δ1 δGHF, the detuning for atoms in Fg = 2 is δ2 = δ1 + δGHF δ1.Therefore the potential ratio is β = U2/U1 ≈ δ1/δ2 1. Pumped atoms end upin a lower potential and bounce inelastically, whereas atoms that remain in Fg = 1can complete the bounce elastically. Atoms in Fg = 2 are detected by an absorptionprobe on the Fg = 2 −→ Fe = 3 cycling transition. Elastically bouncing atoms inFg = 1 are detected by first repumping them into Fg = 2.
The calculated potentials in the figure are valid for the centre of the mirror(x = y = 0) and correspond to the evanescent-wave parameters of the bouncingsequence shown in Fig. 7.3. Note that U2 is below the threshold. Hence, most ofthe atoms that are pumped while on their way towards the surface hit the glass, areheated and lost.
7.3 Configuration of the inelastic mirror
The configuration shown in Fig. 7.2(a) is similar to that of the elastic mirror inFig. 6.1, with a few modifications. The hypotenuse of the right-angle prism is usedto couple in the additional depumping beam from below. Bouncing atoms are nowobserved by absorption imaging. For investigating low atomic densities this is moresensitive than fluorescence imaging, especially when a relatively strong backgroundis present [151]. In particular, there may be a considerable background illuminationin the imaging field-of-view by evanescent light that is diffusely scattered due toroughness of the prism surface. The imaging scheme is illustrated in Fig. 7.2(b). Thecollimated absorption probe is directed through the sample of falling or bouncingatoms, the shadow of which is imaged on the CCD camera by a relay telescope(L1 and L2, Melles Griot, glass doublets, no. 06 LAI 011/076, dia. 30 mm). In thepresent experiments, unity magnification was chosen. Hence, atoms were imagedwith a resolution of 15 µm, equal to the CCD pixel size. A different magnificationis possible by introducing a microscope objective between CCD and lens L2. Formore details on this setup, see Ref. [202].
The main function of the relay telescope is to translate the image to a moreaccessible place. It has the additional advantage that it allows the insertion of abeam stop or a phase plate in the focal plane of the telescope, with the purposeof dark field imaging or phase contrast imaging, respectively [7]. In the presentexperiments, the atomic density was too low for the use of imaging techniques thatare nondestructive to the atomic sample [149, 150]. For a discussion of the varioustechniques see, e.g., Ref. [47].

7.3 Configuration of the inelastic mirror 113
(a) (b)
z
xy
MOT
EW
TM
CCD
DP
AP
CCDS
AP
prism
L1 L2
100 mm 200 mm 100 mm
Figure 7.2: Configuration of the inelastic mirror. (a) Falling atoms from a MOT are
depumped (DP) into Fg = 1. Inelastically bouncing atoms are detected in Fg = 2 by an
absorption probe (AP). A repumping beam (not shown) optionally transfers elastically
bouncing atoms into the detectable Fg = 2 state. (b) Absorption imaging: A collimated
probe beam is directed through the atomic sample (S) onto the CCD detector. The sample
is imaged by a relay telescope of unity magnification. The focal length of the achromatic
lenses (L1,L2) is 100 mm.
The probe had a waist of approximately 5 mm (1/e2 intensity radius), witha power of ∼ 100 µW. The frequency was chosen in resonance with the cyclingtransition Fg = 2 −→ Fe = 3 on the D2 line. The saturation parameter wass0 0.2. The probe exposure time τex was chosen between 20 − 70 µs, so that anatom scatters ≈ 200 photons. Longer exposure is not useful since ∼ 400 photonrecoils from the probe are sufficient to Doppler-shift the atom out of resonance(400 k0vrec ≈ Γ/2). Furthermore the image would be blurred by atomic motion.The maximum velocity in the experiments, vi ≈ 60 vrec, together with an imagingresolution of 15 µm allows a maximum exposure time of τex ∼ 40 µs. In order toachieve quantitatively accurate absorption data, one should keep s0 1.
114 Inelastic evanescent-wave mirrors
7.4 Observation of inelastically bouncing atoms
7.4.1 Inelastic bouncing height
In the experiments discussed here, an inelastic mirror was first realised with theevanescent field on the open transition Fg = 1 −→ Fe = 2 of the D2 line of 87Rb.The evanescent-wave was TM-polarised with a waist of 0.5 mm (1/e2) and 26 mWpower from an injection-locked single-mode diode laser. The angle of incidence wasvaried between 1.8 mrad and 18 mrad beyond the critical angle and the detuning δ1between 70 Γ and 230 Γ.
A sample of ∼ 107 atoms was loaded within 2 s in the MOT, followed by 5 msof molasses cooling to a temperature of 10 µK. A typical image sequence displayinginelastic bounces is shown in Fig. 7.3 for an angle of θi = θc+1.8 mrad (decay length2.5 λ0) and a detuning of δ1 = 150 Γ. Due to the destructive character of the probe,each frame was taken in a new realisation of the experiment. The time indicated foreach frame is the time elapsed since shuttering the cooling light. Sequence (a) showsthe falling and expanding thermal cloud. The irregular shape of the cloud in thefirst frame, taken immediately after release, may be a consequence of imbalancedmolasses cooling forces. Some saturated CCD pixels appear as white spots.
In order to observe inelastic bounces, 4 − 27 ms after releasing the cloud, thedepumping laser was switched on for about 2 ms. The upward directed radiationpressure of the depumping beam transfers a few photon recoils to the atoms. Thisreduces the incident velocity vi at the mirror by approximately 3%. The continuedimage sequence, (b), with inelastically bouncing atoms starts at 35 ms, when thecloud centre-of-mass hits the mirror. In the following frames, the bouncing cloudleaves the mirror and reaches its maximum height of 0.8 mm at t ≈ 47 ms. This was14% of the MOT height z0 and in reasonable agreement with the potential ratioβ ≈ δ1/δ2 = 0.12.
The transfer of atoms into Fg = 2 preferentially occurs while atoms are near theturning point, where a relatively long time is spent in a region of a strong opticalfield. Hence, we can indeed expect a well established peak in the vertical columndensity of inelastically bouncing atoms, as it is obvious from the sequence shown. Inaddition, a tail of atoms is visible, stretching out to a height expected for elasticallybouncing atoms only. This tail is caused by atoms, that were transferred into Fg = 2either before reaching the turning point or after having partly reaccelerated off themirror potential. The bouncing dynamics, together with the stochastic nature ofoptical pumping, thus cause a broad redistribution in atomic velocities. The velocitydistribution translates into the imaged spatial distribution after 10− 20 ms of freeflight.
The background visible in the images is due to imperfections of the detectionsetup. The observed density of bouncing atoms is significantly lower than that of thefalling atoms. (This is partly due to the projection on the image plane.) Thereforethe image contrast was enhanced in the sequence (b) by reducing the gray scaledisplay range by an order in magnitude. Hence, the background appeared in theseimages. The white region at the former location of the MOT is an artifact, possibly

7.4 Observation of inelastically bouncing atoms 115
(a)
35 ms 39 ms 43 ms 47 ms 51 ms 55 ms
0 ms 15 ms 19 ms 23 ms 27 ms 31 ms
(b)
Figure 7.3: Time sequence of inelastically bouncing atoms. (a) Atoms fall from the
MOT (in the Fg = 1 state). Gray scale indicates atomic density. The field of view is 8 mm
in height, and the prism surface is indicated by a horizontal dotted line. The first frame
was taken immediately after switching off the molasses cooling light. Subsequent frames
each represent a new realisation of the experiment. After 35 ms the cloud centre-of-mass
hits the prism. (b) Inelastically bouncing atoms were detected in Fg = 2.
due to a memory-effect of the CCD array, caused by the intense illumination frommolasses cooling light, several 10 ms before an image capture. Interference fringesand circular patterns stem from the probe laser and were due to reflections at theuncoated UHV cell and due to diffraction from dust particles. Each absorptionimage was the result of three image captures, taken shortly after each other. First,the atoms were probed. A second frame was similarly taken without loading theMOT as a zero-absorption reference. From both images the background illuminationwas subtracted, as captured by the third frame without using the probe pulse.Division of signal and reference image results in the absorption image. The noiselevel in the atomic signals was reduced by averaging 5 realisations for each image.In principle, no fringes should occur, unless the reflecting optical surfaces move inthe time between recording the signal image and the reference image. Accumulatingmore realisations may be a remedy to average out drifting fringe patterns.

116 Inelastic evanescent-wave mirrors
7.4.2 Atom density and transfer efficiency
An inelastic mirror on the D1 line (795 nm) of 87Rb was realised using the taperedamplifier system with the TD387 gain element as a laser source for the evanescent-wave, see Chap. 4. Due to the larger available power of 73 mW, as compared tothe injection-locked diode laser, the mirror could be established with a larger laserwaist of 0.8 mm (1/e2). The laser was again TM-polarised. The detuning was70 − 300 Γ above the Fg = 1 −→ Fe = 2 resonance, and the angle was θi = θc +16.6 mrad, which resulted in a decay length of 0.82 λ0 (0.65 µm). This atom mirrorwas used to investigate the efficiency of transferring bouncing atoms into Fg = 2 as afunction of evanescent-wave detuning and decay length. A detailed study includinga numerical analysis will be presented elsewhere, see Refs. [202,203]. In this section,the experimental results are discussed.
Density of bouncing atoms.— In order to quantitatively investigate bouncingatoms, we converted the absorption images into the corresponding atomic columndensity distributions in the xz-plane (see AppendixA.4). The 2D gray-scale den-sity plots of Fig. 7.4 represent column densities. In the left image only inelasticallybouncing atoms (N2) were detected. In the right image repumping light was suppliedbefore detection, so that all atoms were detected (N1+N2). In these measurements,the evanescent-wave detuning was δ1 = 200 Γ and the images were averaged over 10experimental runs. The vertical 1D (linear) density ρz(z) was obtained by summinglines of the 2D image for different values of x. In Fig. 7.4(a) also the density of elas-tically bouncing atoms is shown, as derived from the combined signal in Fig. 7.4(b).The linear densities were normalised to the atom numbers, N1 and N2, by integrat-ing the column density distributions and using the resonant rubidium absorptioncross section σ0 = 3λ20/2π, see AppendixA.4. Our absorption probe was linearly π-polarised and we assumed that the atoms were randomly distributed over the Fg = 2ground state magnetic sublevels mg = 0 . . .± 2. The absorption cross section wastherefore averaged over these mg-levels using the Clebsch-Gordan coefficients for theFg = 2 −→ Fe = 3 transition and the reduced dipole matrix element, here d2,3 = 1:
σ =1
5σ0d
22,3
∑mg
〈2, mg, 1, 0|3, mg〉2 =7
15σ0 = 13.5× 10⁻¹⁰ cm2 . (7.1)
Whereas the column density represents the measured quantity, the physically in-teresting quantity is the 3D spatial density, ρ(r) = ρx(x)ρy(y)ρz(z). It is shownas ρ(0, 0, z) by an alternative density scaling in Fig. 7.4 and was calculated underthe assumption that the horizontal distributions were Gaussians. Due to the aspectratio, χ ≈ 1.3, of the elliptical effective mirror surface, the rms width of the cloudin the x-direction is wider by a factor χ compared to the y-direction.
The asymmetrical vertical distribution, ρz(z), originates from the distribution ofvelocities at which atoms leave the surface. It is evident from the peaked structure,that there is a strong preference for atoms to be pumped when they are slow, i.e.close to the turning point on the mirror. For a hypothetic monochromatic sample(without spreading in vi), the distribution would be sharply edged, since the turning
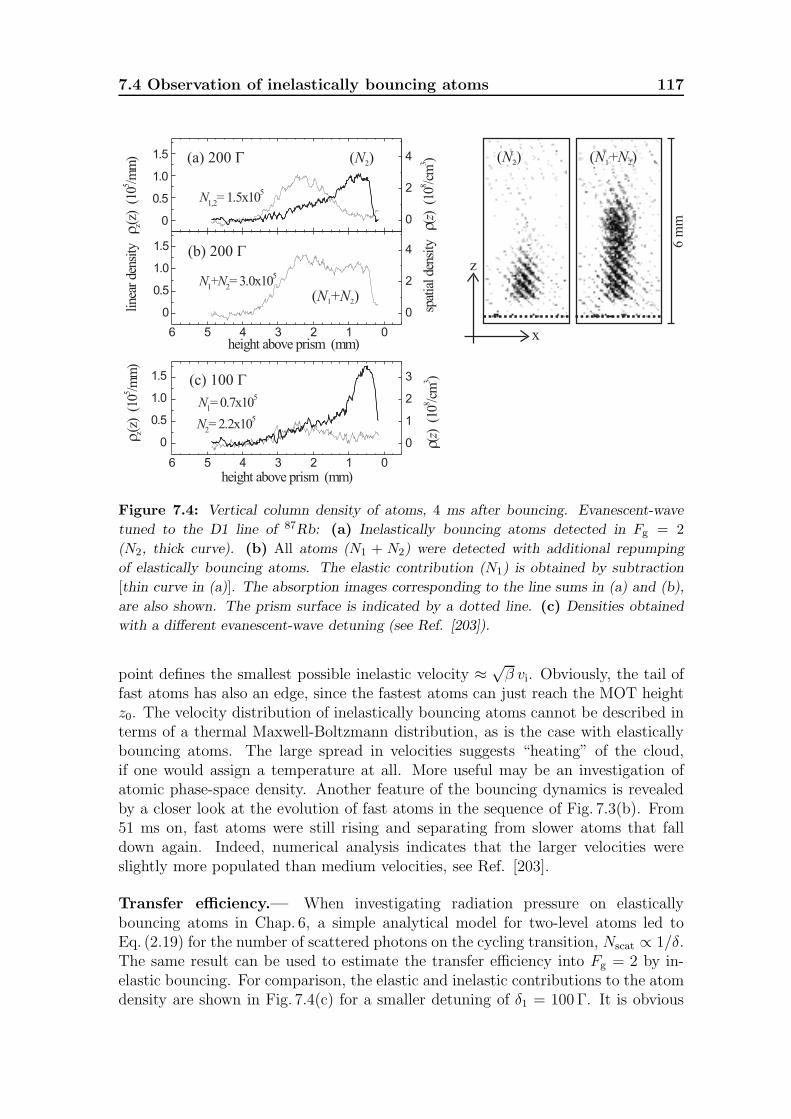
7.4 Observation of inelastically bouncing atoms 117
6 5 4 3 2 1 0
0
0.5
1.0
1.5
N1= 0.7x10
5
N2= 2.2x10
5
z(z)
(105 /m
m)
height above prism (mm)
N1+N
2= 3.0x10
5
0
0.5
1.0
1.5
N1,2
= 1.5x10⁵
line
arde
nsity
z(z)
(105 /m
m)
6 5 4 3 2 1 0
0
0.5
1.0
1.5
height above prism (mm)
0
2
4
spat
ialde
nsity
(z)
(108 /c
m3 )
0
2
4
0
1
2
3
(z)
(108 /c
m3 )(c) 100
(a) 200
(b) 200
( )N2
( + )N N1 2
6m
m
( )N2 ( + )N N1 2
x
z
Figure 7.4: Vertical column density of atoms, 4 ms after bouncing. Evanescent-wave
tuned to the D1 line of 87Rb: (a) Inelastically bouncing atoms detected in Fg = 2(N2, thick curve). (b) All atoms (N1 + N2) were detected with additional repumping
of elastically bouncing atoms. The elastic contribution (N1) is obtained by subtraction
[thin curve in (a)]. The absorption images corresponding to the line sums in (a) and (b),
are also shown. The prism surface is indicated by a dotted line. (c) Densities obtained
with a different evanescent-wave detuning (see Ref. [203]).
point defines the smallest possible inelastic velocity ≈ √β vi. Obviously, the tail of
fast atoms has also an edge, since the fastest atoms can just reach the MOT heightz0. The velocity distribution of inelastically bouncing atoms cannot be described interms of a thermal Maxwell-Boltzmann distribution, as is the case with elasticallybouncing atoms. The large spread in velocities suggests “heating” of the cloud,if one would assign a temperature at all. More useful may be an investigation ofatomic phase-space density. Another feature of the bouncing dynamics is revealedby a closer look at the evolution of fast atoms in the sequence of Fig. 7.3(b). From51 ms on, fast atoms were still rising and separating from slower atoms that falldown again. Indeed, numerical analysis indicates that the larger velocities wereslightly more populated than medium velocities, see Ref. [203].
Transfer efficiency.— When investigating radiation pressure on elasticallybouncing atoms in Chap. 6, a simple analytical model for two-level atoms led toEq. (2.19) for the number of scattered photons on the cycling transition, Nscat ∝ 1/δ.The same result can be used to estimate the transfer efficiency into Fg = 2 by in-elastic bouncing. For comparison, the elastic and inelastic contributions to the atomdensity are shown in Fig. 7.4(c) for a smaller detuning of δ1 = 100 Γ. It is obvious

118 Inelastic evanescent-wave mirrors
that a larger fraction of atoms were pumped, namely 80% of the atoms ended upin Fg = 2, compared to 50% for 200 Γ, so that less atoms completed the bounceelastically. Note that, although the peak linear density in Fg = 2 is larger for 100 Γ,the peak spatial density is similar to that for 200 Γ. This is due to the larger effec-tive mirror surface, i.e. a larger bouncing fraction for smaller detuning (see Chap. 5).The 3D density is therefore distributed broader in the lateral directions for smallerdetuning. The transfer efficiency can be estimated as
N2
N1 +N2= 1− qNscat , (7.2)
where q ≈ 0.5 is the branching ratio to the ground states, defined as the fraction thatgoes into Fg = 2 (cf. Ref [16]). Thus with Nscat, we can expect an efficiency of 37%and 60% using a detuning of 200 Γ and 100 Γ, respectively. A more adequate modelshould include the excited state hyperfine structure, using expressions similar to thatof Eq. (6.3) for the radiation pressure hyperfine correction βHF. Also depumping ofatoms back into Fg = 1 has to be considered, see Ref. [202].
Finally, note that due to the lack of any cycling transition on the D1 line, elasticbouncing with a larger number of scattered photons, Nscat 1, as presented withthe radiation pressure investigations of Chap. 6 is not possible. Of course, in thelimit of large detuning, δ1,2 δGHF, all atoms bounce elastically (β → 1). However,also the radiation pressure is then negligible.
7.5 Conclusions
Inelastic mirrors for cold rubidium atoms were realised using evanescent-wave opticalpotentials tuned near an open optical transitions of the D1 (795 nm) or D2 (780 nm)line of 87Rb, thus introducing spontaneous Raman transitions between hyperfineground states. Bouncing atom clouds were directly observed by absorption imaging.The evolution of the peak atomic density reveals the inelasticity of the reflectionon the mirror, e.g. loss of kinetic energy ranging between 81− 92%. The dynamicsof the internal state transfer of bouncing atoms causes a broadened non-thermalatomic velocity distribution, that is observed as a tail of fast atoms in absorptionimages of bouncing atoms. This suggests that, although the observed single inelasticbounce represents a fundamental step of a “Sisyphus” reflection cooling mechanism,it involves heating (and thus a reduction in phase-space density). Only a successionof multiple bounces leads to a net cooling effect and, finally, establishes a thermalbarometric density distribution of atoms at a temperature lower than the initialone [17]. Note that in the proposed low-dimensional trapping scheme of Chap. 2the phase-space density already piles up by a single bouncing process. This isdue to spatially selective pumping in combination with a trapping potential thataccumulates atoms in the vicinity of the surface. Further experimental investigationswhich are in progress, have to show whether pumping by the evanescent-wave mirroralone, can be used to efficiently optimise a trap loading scheme. For the envisagedvery far detuned evanescent waves it may be necessary to introduce an additionalnear-resonance evanescent-wave contribution in order to adjust optical scatteringrates.

AAppendix
A.1 Useful atom-optical numbers for 87Rb
Spectroscopy: [143,144]D1 line λ0 (5s 2S1/2 → 5p 2P1/2) 795.0 nm
natural lifetime τ ≡ 1/Γ 27.70(4) nsnatural linewidth Γ/2π 5.75 MHz
saturation intensity I0 ≡ πhcΓ/3λ30 1.49 mW/cm2
D2 line λ0 (5s 2S1/2 → 5p 2P3/2) 780.2 nmτ 26.24(4) ns
Γ/2π 6.07 MHzI0 1.67 mW/cm2
Laser cooling (D2 line):Doppler temperature TD ≡ Γ/2kB 146 µK
Doppler capture velocity Γ/kL 4.7 m/styp. Doppler velocity vD ≡√2kBTD/M 16.7 cm/s
recoil temperature TR ≡ (kL)2/MkB= 2ER/kB 361 nK
recoil velocity vR ≡ kL/M 5.88 mm/srecoil frequency ωR ≡ ER/ = k2L/2M 2π × 3.77 kHz
thermal DeBroglie Λ ≡ h/√2πMkBT 15.5 nm (TD)
wavelength 312 nm (TR)Gravitation: Mg/kB 1.03 mK/cm
Mg/h 21.4 MHz/cmMg/µB 15.3 G/cm
Atomic collisions: [63] a2,2 (s-wave scattering, 109(10) a0a1,−1 length aF,m) 106(6) a0
General constants: h/kB 48.0 µK/MHzkB/h 20.8 kHz/µKµB/h 1.40 MHz/GµB/kB 67.2 µK/G
0.67 K/Tg 0.98 (cm/s)/ms
119

120 Appendix
A.2 Fresnel coefficients for evanescent waves
Fresnel coefficients are usually derived for the (complex) reflection and transmissioncoefficient of light incident with an angle θi < θc at a dielectric interface, where theinternal reflection is not total [6, 7]. However, these formulas can also be used fortotal internal reflection (TIR), θi > θc, i.e. with a complex “transmission angle”.Snel’s law, sin θt = n sin θi > 1, then is written as
cos θt = i√
n2 sin2 θi − 1 . (A.1)
The wave vectors and polarisations maintain their common form using the complexangle θt. The wave vectors are
ki = nk0 (sin θi, 0, cos θi) , (A.2)
kt = k0 (sin θt, 0, cos θt) . (A.3)
The polarisations are
si = st = (0, 1, 0) , (A.4)
pi = (− cos θi, 0, sin θi) , (A.5)
pt = (− cos θt, 0, sin θt) . (A.6)
Note that pt is not normalised in the usual way, p∗t ·pt = 1. Instead, it obeys the
normalisation pt·pt = 1. The reflection and transmission coefficients also keep thecommon form,
rs =n cos θi − cos θtn cos θi + cos θt
=n cos θi − i
√n2 sin2 θi − 1
n cos θi + i√
n2 sin2 θi − 1, (A.7)
ts =2n cos θi
n cos θi + cos θt=
2n cos θi
n cos θi + i√
n2 sin2 θi − 1, (A.8)
rp =cos θi − n cos θtcos θi + n cos θt
=cos θi − i n
√n2 sin2 θi − 1
cos θi + i n√
n2 sin2 θi − 1, (A.9)
tp =2n cos θi
cos θi + n cos θt=
2n cos θi
cos θi + i n√
n2 sin2 θi − 1. (A.10)
However the transmission occurs into the evanescent wave, ts and tp are proportion-ality factors between the incident and the evanescent field amplitude. Indeed wefind |rs,p| = 1.

A.3 Light forces and scattering rate 121
A.3 Light forces and scattering rate
A.3.1 Two-level atoms
A detailed description of the atom-light interaction can be found, e.g., in Ref. [2].We assume an atom with a ground state |g〉 and an excited state |e〉 of lifetimeτ = 1/Γ, where Γ is the natural transition linewidth, e.g. with Γ/2π = 6.1 MHz forthe rubidium D2 line. The states are separated by ω0, and the detuning of a laserfrequency ωL is defined as δ = ωL−ω0. A useful expression in the description of theatom-light coupling is the Rabi frequency for a given laser intensity IL:
ΩR = Γ
√IL2I0
. (A.11)
It describes the resonant (δ = 0) cycling frequency between the ground and excitedstate population. The saturation intensity is defined as I0 = πhcΓ/3λ30, with theoptical wavelength λ0.
Scattering rate and spontaneous force.— The atomic scattering rate is ob-tained by solving the “Optical Bloch Equations” (OBE). These describe the evo-lution of the density operator σ of an atom coupled to the light field. We obtainthe OBE’s for the Bloch vector, (u, v, w), by the elimination of the fast evolution∝ exp(iωLt) of the laser oscillation in the “rotating-wave approximation”, and usingthe transform σge, σeg, σgg, σee = σge exp (−iωLt), σeg exp (iωLt), σgg, σee:
u =1
2(σge + σeg) , u = δ v − Γ
2u , (A.12)
v =1
2i(σge − σeg) , v = −δ u− ΩRw − Γ
2v , (A.13)
w =1
2(σee − σgg) , w = ΩRv − Γw − Γ
2. (A.14)
The component w describes half the population inversion between the atomic states.A useful notation is also the saturation parameter:
s0 =1
2
Ω2R
δ2 +(Γ2
)2 =1
1 +(2δΓ
)2 ILI0
. (A.15)
As a steady-state solution for the scattering rate Γ′, i.e. the excited state populationσ(st)ee , we find:
Γ′ = Γ σ(st)ee =Γ
2
s01 + s0
=Γ
2
1
1 +(2δΓ
)2+ IL
I0
ILI0
. (A.16)
The recoil, kL, from absorbed photons causes radiation pressure or, the “sponta-neous light force”, Fsp = kLΓ
′. This force saturates for s0 1 as Fsp = kLΓ/2.

122 Appendix
Far off-resonance dipole potentials.— In the limit of large detuning,|δ| Γ, we can approximate the saturation parameter by s0 ≈ (Γ/2δ)2IL/I0. If also|δ| ΩR, the eigenstates of the atom-light interaction approach the uncoupledstates, |g〉 and |e〉, and the coupling to the field effectively causes a “light shift” ofthese states or, a “dipole potential”. If in this limit also the saturation parameteris small, s0 1, the (ground state) light shift and the scattering rate are given as:
1
Udip ≈ 1
2s0δ ≈ Ω2
R
4δ=
Γ2
8δ
ILI0
, (A.17)
Γ′ ≈ 1
2s0Γ ≈ Ω2
RΓ
4δ2=
Γ3
8δ2ILI0
. (A.18)
The ratio of light shift and scattering rate is now simply Udip/Γ′ ≈ δ/Γ. Sincethe light shift is usually spatially varying, its gradient represents the “dipole force”,Fdip(r) = −∇Udip(r).
A.3.2 Multilevel atoms — rubidium hyperfine structure
In the interaction of a multilevel atom with a laser field, the polarisation state ofthe light has to be considered together with the coupling strengths of the variousoptical transitions between atomic sublevels. For example, the D2 line of 87Rb isa Jg = 1/2 −→ Je = 3/2 transition. The coupling to the nuclear spin, I = 3/2,results in the hyperfine structure with the ground and excited states Fg = 1, 2and Fe = 0, 1, 2, 3, respectively, shown in Fig. 3.7.
Spherical polarisation basis.— The expression (A.11) for the Rabi frequencyhas its origin in the coupling of the atomic dipole moment to the electric field,written as E = (1/2)εE exp (−iωt) + c.c.:
ΩR = 2d · ε E
. (A.19)
The matrix element of the dipole operator D is here d = 〈g|D|e〉, the electric fieldamplitude is E , and the field polarisation is given by the unit vector ε.
It may be useful to work in a spherical basis ε−, ε0, ε+, that is defined in thecartesian basis x, y, z as:
ε− =1√2
1
0−i
, ε0 =
0
10
, ε+ =
1√2
−1
0−i
. (A.20)
These basis vectors describe σ−, π, and σ+-polarised light with respect to the de-liberately chosen y-direction. The dipole operator can now be expressed in thespherical basis, Dj = D · εj, where j = 0,±1.
A.3 Light forces and scattering rate 123
Reduced dipole matrix elements.— Writing ground and exited state of arubidium atom as |Fg, mg〉 and |Fe, me〉, the Wigner-Eckart theorem is applied tofactorise the dipole matrix element:
〈Fg, mg|Dj|Fe, me〉 = 〈Fg|D|Fe〉 〈Fe, me, 1, j|Fg, mg〉 . (A.21)
The first term is the “reduced dipole matrix element”, DFg,Fe. It is independent ofthe atomic orientation, i.e. polarisation and sublevel structure. The second term is aClebsch-Gordan coefficient, describing the coupling of the sublevels to the sphericalpolarisation component j of the light field.
The reduced matrix elements are calculated starting from the matrix elementD2,3 for the closed transition of the rubidium D2 line, which is equivalent to thereduced matrix element of a two-level atom. This can be expressed using theEqs. (A.11), (A.19), the saturation intensity, and the relation IL = (1/2)ε0c|E|2:
D2,3 =
√Γ
3ε0λ308π2
= 2.53× 10⁻²⁹ Cm . (A.22)
The reduced matrix elements of the other hyperfine transitions are calculated by
DFg,Fe = D2,3 (−1)Fg+Je+I+1√
(2Je + 1)(2Fg + 1)
Fg Fe 1Je Jg I
6j
, (A.23)
dFg,Fe =DFg,Fe
D2,3. (A.24)
where dFg,Fe is a dimensionless expression relative to the closed transition. TheRacah “6j” symbol and the Clebsch-Gordan coefficients can be calculated, usinge.g. the Mathematica software package (Wolfram Research).
Light-shift Hamiltonian for rubidium.— In order to calculate the light-shiftHamiltonian for a given polarisation ε, it is useful to define a “reduced light-shiftHamiltonian” Λ(Fg, Fe, ε) with matrix elements Λmg,m′
g(Fg, Fe, ε), which result from
the angular part of Eq. (A.21), see e.g. Ref. [79].
We therefore define a tensor C(Fg, Fe) with the Clebsch-Gordan coefficients aselements, Cme,mg,j(Fg, Fe) = 〈Fg, mg, 1, j|Fe, me〉. The elements of the polarisabilitytensor A(Fg, Fe) are therewith defined as:
Aj′,m′g,mg,j(Fg, Fe) =
∑me
Cme,mg,j(Fg, Fe) Cme,m′g,j′(Fg, Fe) . (A.25)
They describe the coupling to the light field in terms of an excitation of an atomfrom |Fg, mg〉 to |Fe, me + j〉 by the component εj of the polarisation ε, followed bya (stimulated) deexcitation to |Fg, m′
g = mg + j − j′〉 by the component εj′ .

124 Appendix
The reduced light-shift Hamiltonian is now defined in the spherical polarisationbasis as:
Λ(Fg, Fe, ε) = ε† · A(Fg, Fe) · ε . (A.26)
In low-saturation and for large detuning, the light-shift Hamiltonian for a rubidiumatom in the ground state Fg can be written similarly to the 2-level expression ofEq. (A.17):
UFg = Γ2
8
ILI0
∑Fe
d2Fg,FeΛ(Fg, Fe, ε)
δFg,Fe
. (A.27)
This expression has to be calculated for both the D1 and the D2 line, summing overF(D1)e = 1, 2 and F
(D2)e = 0, 1, 2, 3, respectively. Also the reduced dipole matrix
elements have to be calculated for both lines. The total light shift is obtained asU (tot)Fg
= U (D1)Fg
+ U (D2)Fg
. However, either the detunings δ(D1)Fg,Fe
or δ(D2)Fg,Fe
are usuallysmall compared to the splitting of 7.2 THz (or 15 nm) between the D-lines. Thuscalculating the dominant contribution may be sufficient.
A.3.3 Transition matrix elements for 87Rb
D1
30
10
15
20
+2+2
+2
-2
-2
+1
+1
+1
+1
0
0
0
0
-1
-1
-1
-1
5
30
55
15 15
15
10
20
105
5
5
5
30
30
15
1515
15
15
15
15 15
20
10
F = 1
F = 2
5
5
5 5
5
20
g
g
Figure A.1: Transition matrix elements of the D1 line: 60 (d(D1)Fg ,FeCme,mg,j(Fg, Fe))2.
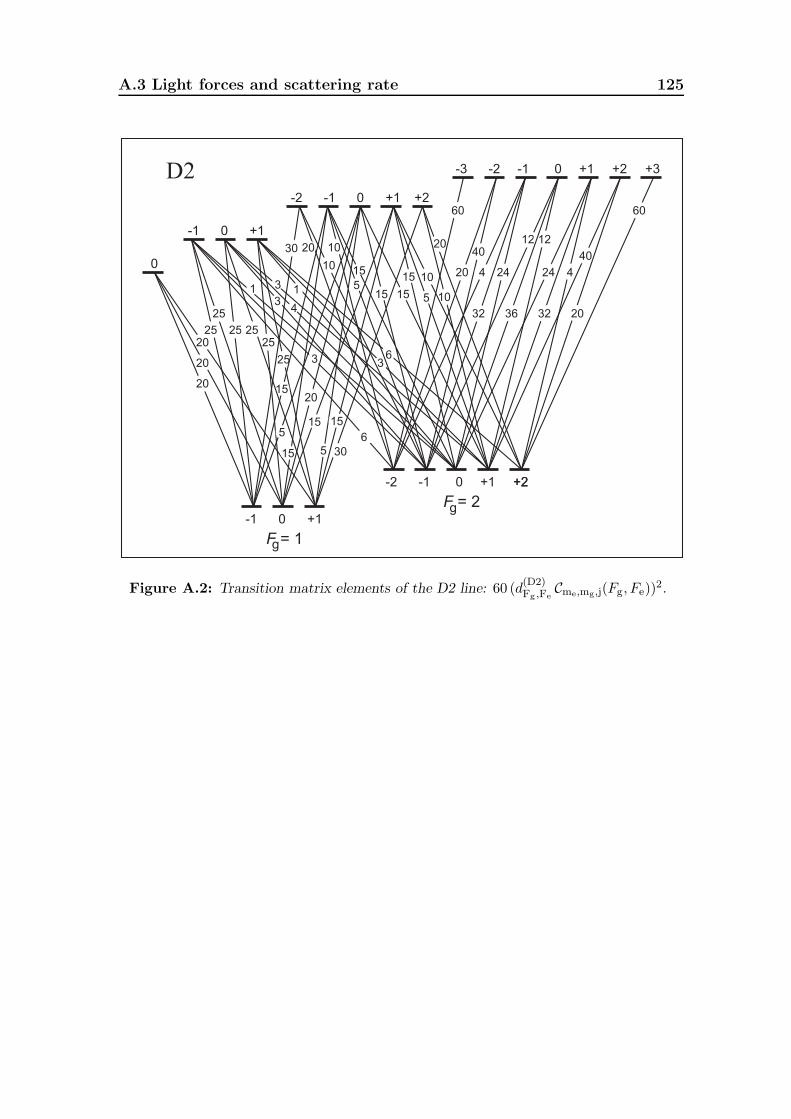
A.3 Light forces and scattering rate 125
6
60
20
1210
3
20
424
12
4
40
20
24
36 3232
20
20
+2+2
+2
+2
-2
-2
-2
0
+1
+1
+1
+1
+1
0
0
0
0
0
-1
-1
-1
-1
-1
+3-3
25
6
25
252525
11
3 3
3
10
20
4
40
20
60
105
5
5
5
30
30
15
1515
15
15
15
15 15
20
25
10
F = 1
F = 2
D2
g
g
Figure A.2: Transition matrix elements of the D2 line: 60 (d(D2)Fg ,FeCme,mg,j(Fg, Fe))2.
126 Appendix
A.4 Analysis of absorption images
Due to the vertical symmetry axis of our mirror configuration, a factorised spatialdensity of N atoms is assumed,
ρ(r) = Nρx(x)ρy(y)ρz(z) , N =
∫∫∫ρ(r)dr3 , (A.28)
ρx(x) =1√2π σx
exp
(− x2
2σ2x
), (A.29)
ρy(y) similarly with σy =σxχ
. (A.30)
The absorption measurements project the distributions onto the xz-plane, whileintegrating in the y-direction (the line-of-sight). The coordinates in the xz-planecan be defined as r′ = (x, z). An absorption image, A(r′) = Id(r
′)/IL(r′), is theratio of the detected probe laser intensity, Id(r
′), and the incident intensity, IL(r′).
For a coordinate r′ in the detection plane, the absorption law is written as:
dI(r)
dy= −ρ(r) σ(δ) I(r) , (A.31)
σ(δ) =3λ202π
1
1 + 4(
δΓ
)2 . (A.32)
Here, σ(δ) is the detuning dependent absorption cross section for unity Clebsch-Gordan coefficients [34]. By integration along the y-direction, the relation betweenthe absorption image, A(r′), and the atomic density is found in the xz-projection:
D(r′) = − lnA(r′) = Nσ(δ) ρx(x)ρz(z) . (A.33)
From the image data, a line sum along x can be formed, which leads to the verticalatomic density, ρz(z):
L(z) =
∫ +∞
−∞lnA(r′) dz = Nσ(δ) ρz(z) . (A.34)
The projected density, D(r′), allows to read out the horizontal Gaussian width, σx.Hence, by the Eqs. (A.29) and (A.30), the 3D density from Eq. (A.28) is known.
References
[1] C.S. Adams, M. Sigel, and J. Mlynek, Atom optics, Phys. Rep. 240, 143 (1994).[2] C.N. Cohen-Tannoudji, J. Dupont-Roc, and G. Grynberg, Atom-Photon Interactions
(Wiley, New York, 1992).[3] R.J. Cook and R.K. Hill, An electromagnetic mirror for neutral atoms,
Opt. Comm. 43, 258 (1982).[4] V.I. Balykin, V.S. Letokhov, Yu.B. Ovchinnikov, and A.I. Sidorov,
Reflection of an atomic beam from a gradient of an optical field,Pis’ma Zh. Eksp. Teor. Fiz. 45, 282 (1987) [JETP Lett. 45, 353 (1987)].
[5] M.A. Kasevich, D.S. Weiss, and S. Chu, Normal-incidence reflection of slow atomsfrom an optical evanescent wave, Opt. Lett. 15, 607 (1990).
[6] M. Born and E. Wolf, Principles of Optics (Cambridge University Press, 1999).[7] E. Hecht, Optics (Addison-Wesley, 1987).[8] T.W. Hansch and A.L. Schawlow, Cooling of gases by laser radiation,
Opt. Comm. 13, 68 (1975).[9] D. Wineland and H. Dehmelt, Proposed 1014δν < ν laser fluorescence spectroscopy
on Tl+ mono-ion oscillator III, Bull. Am. Phys. Soc. 20, 637 (1975).[10] R. Grimm, M. Weidemuller, and Yu.B. Ovchinnikov, Optical dipole traps for neutral
atoms, Adv. At. Mol. Opt. Phys. 42, 95 (2000).[11] H. Metcalf and P. van der Straten, Cooling and trapping of neutral atoms,
Phys. Rep. 244, 203 (1994).[12] C.S. Adams, and E. Riis, Laser cooling and trapping of neutral atoms,
Prog. Quant. Electr. 21, 1 (1997).[13] S. Chu, The manipulation of neutral particles, Rev. Mod. Phys. 70, 685 (1998).[14] C.N. Cohen-Tannoudji, Manipulating atoms with photons, ibid., p. 707.[15] W.D. Phillips, Laser cooling and trapping of neutral atoms, ibid., p. 721.[16] D.V. Laryushin, Yu.B. Ovchinnikov, V.I. Balykin, and V.S. Letokhov,
Reflection cooling of sodium atoms in an evanescent light wave,Opt. Comm. 135, 138 (1997). [Pis’ma Zh. Eksp. Teor. Fiz. 62, 102 (1995).]
[17] Yu.B. Ovchinnikov, I. Manek, and R. Grimm, Surface trap for Cs atoms based onevanescent-wave cooling, Phys. Rev. Lett. 79, 2225 (1997).
[18] P. Berman, ed., Atom interferometry (Academic Press, 1997).[19] M.J. Snadden, J.M. McGuirk, P. Bouyer, K.G. Haritos, and M.A. Kasevich,
Measurement of the earth’s gravity gradient with an atom interferometer-based gravitygradiometer, Phys. Rev. Lett. 81, 971 (1998).
[20] A. Peters, K.Y. Chung and S. Chu, Measurement of gravitational acceleration bydropping atoms, Nature 400, 849 (1999).
[21] D.S. Weiss, B.C. Young, and S. Chu, Precision measurement of the photon recoil ofan atom using atom interferometry, Phys. Rev. Lett. 70, 2706 (1993).
[22] R. Blatt, J. Eschner, D. Leibfried, and F. Schmidt-Kaler, eds., Laser spectroscopyXIV (World Scientific, Singapore, 1999).
127

128 References
[23] J.T. Bahns, P.L. Gould, and W.C. Stwalley, Formation of cold (T ≤ 1 K) molecules,Ad. At. Mol. Opt. Phys. 42, 171 (2000).
[24] R. Wynar, R.S. Freeland, D.J. Han, C. Ryu, and D.J. Heinzen, Molecules in a Bose-Einstein condensate, Science 287, 1016 (2000).
[25] P.R. Berman, ed., Cavity quantum electrodynamics, supplement to Adv. At. Mol.Opt. Phys. (Academic Press, 1994).
[26] J. Weiner, V.S. Bagnato, S. Zilio, and P.S. Julienne, Experiments and theory in coldand ultracold collisions, Rev. Mod. Phys. 71, 1 (1999).
[27] Q.Niu, X.-G. Zhao, G.A.Georgakis, and M.G.Raizen, Atomic Landau-Zener tunnel-ling and Wannier-Stark ladders in optical potentials, Phys.Rev. Lett.76, 4504 (1996).
[28] M.B. Dahan, E. Peik, J. Reichel, Y. Castin, and C. Salomon, Bloch oscillations ofatoms in an optical potential, Phys. Rev. Lett. 76, 4508 (1996).
[29] P. Laurent, P. Lemonde, G. Santarelli, M. Abgrall, J. Kitching, Y. Sortais, S. Bize,M. Santos, C. Nicolas, S. Zhang, G. Schehr, A. Clairon, A. Mann, A. Luiten,S. Chang, and C. Salomon, Cold atom clocks on earth and in space, in Ref. [22].
[30] G. Timp, R.E. Behringer, D.M. Tennant, J.E. Cunningham, M. Prentiss, andK.K. Berggren, Using light as a lens for submicron, neutral-atom lithography,Phys. Rev. Lett. 69, 1636 (1992).
[31] B. Brezger, T. Schulze, P.O. Schmidt, R. Mertens, T. Pfau, and J. Mlynek, Polari-sation gradient light masks in atom lithography, Europhys. Lett. 46, 148 (1999).
[32] C.H. Bennett and D. DiVincenzo, Quantum information and computation,Nature 404, 247 (2000).
[33] E.L. Raab, M. Prentiss, A. Cable, S. Chu, and D.E. Pritchard, Trapping of neutralsodium atoms with radiation pressure, Phys. Rev. Lett. 59, 2631 (1987).
[34] A.E. Siegman, Lasers, (University Science Books, Mill Valley, CA, 1986).[35] T.H. Maiman, Stimulated optical radiation in ruby, Nature 187, 493 (1960).[36] S. Bose, Plancks Gesetz und Lichtquantenhypothese, Z. Phys. 26, 178 (1924).[37] A. Einstein, Sitzber. Kgl. Preuss. Akad. Wiss. 261 (1924).[38] J.T.M. Walraven, Atomic hydrogen in magnetostatic traps, in Proceedings of the
SUSSP44 conference on Quantum dynamics of simple systems, ed. by G.-L. Oppo,S.M. Barnett, E. Riis, and M. Wilkinson (IOP, Bristol, 1996).
[39] M.H. Anderson, J.R. Ensher, M.R. Matthews, C.E. Wieman, and E.A. Cornell,Observation of Bose-Einstein condensation in a dilute atomic vapour,Science 269, 198 (1995).
[40] K.B. Davis, M.-O. Mewes, M.R. Andrews, N.J. van Druten, D.S. Durfee,D.M. Kurn, and W. Ketterle, Bose-Einstein condensation in a gas of sodium atoms,Phys. Rev. Lett. 75, 3969 (1995).
[41] C.C. Bradley, C.A. Sackett, and R.G. Hulet, Bose-Einstein condensation of lithium:observation of limited condensate number, Phys. Rev. Lett. 78, 985 (1997). [See alsoC.C. Bradley et al., Phys. Rev. Lett. 75, 1687 (1995).]
[42] D.G. Fried, T.C. Killian, L. Willmann, D. Landhuis, S.C. Moss, D. Kleppner,and Thomas J. Greytak, Bose-Einstein condensation of atomic hydrogen,Phys. Rev. Lett. 81, 3811 (1998).
[43] A.I. Safonov, S.A. Vasilyev, I.S. Yasnikov, I.I. Lukashevich, and S. Jaakkola,Observation of quasicondensate in two-dimensional atomic hydrogen,Phys. Rev. Lett. 81, 4545 (1998).
References 129
[44] B. DeMarco and D.S. Jin, Onset of Fermi degeneracy in a trapped atomic gas,Science 285, 1703 (1999).
[45] A. Griffin, D. Snoke, and S. Stringari, eds., Bose-Einstein condensation (CambridgeUniversity Press, 1995).
[46] F. Dalfovo, S. Giorgini, L.P. Pitaevskii, and S. Stringari, Theory of Bose-Einsteincondensation in trapped gases, Rev. Mod. Phys. 71, 463 (1999).
[47] M. Inguscio, S. Stringari, and C. Wieman, eds., Bose-Einstein condensation in atomicgases, Proc. of the Int. School of Physics “Enrico Fermi” (IOS, Amsterdam, 1999).
[48] A.S. Parkins and D.F. Walls, The physics of trapped dilute-gas Bose-Einsteincondensates, Phys. Rep. 303, 1 (1998).
[49] M.-O. Mewes, M.R. Andrews, D.M. Kurn, D.S. Durfee, C.G. Townsend, andW. Ketterle, Output coupler for Bose-Einstein condensed atoms, Phys. Rev. Lett. 78,582 (1997).
[50] B.P. Anderson and M.A. Kasevich, Macroscopic quantum interference from atomictunnel arrays, Science 282, 1686 (1998).
[51] I. Bloch, T.W. Hansch, and T. Esslinger, Atom laser with a cw output coupler,Phys. Rev. Lett. 82, 3008 (1999).
[52] E.W. Hagley, L. Deng, M. Kozuma, J. Wen, K. Helmerson, S.L. Rolston, and W.D.Phillips, A well-collimated quasi-continuous atom laser, Science 283, 1706 (1999).
[53] H.F. Hess, Evaporative cooling of magnetically trapped and compressed spin-polarisedhydrogen, Phys. Rev. B 34, 3476 (1986).
[54] O.J. Luiten, M.W. Reynolds, and J.T.M. Walraven, Kinetic theory of the evaporativecooling of a trapped gas, Phys. Rev. A 53, 381 (1996).
[55] W. Ketterle and N.J. van Druten, Evaporative cooling of trapped atoms,Adv. At. Mol. Opt. Phys. 37, 181 (1996).
[56] S. Bhongale and M. Holland, Loading a continuous-wave atom laser by optical pump-ing techniques, Phys. Rev. A 62, 043604 (2000).
[57] E. Mandonnet, A. Minguzzi, R. Dum, I. Carusotto, Y. Castin, and J. Dalibard,Evaporative cooling of an atomic beam, Eur. J. Phys. D 10, 18 (2000).
[58] H. Wiseman and M. Collett, An atom laser based on dark-state cooling,Phys. Lett. A 202, 246 (1995).
[59] R.J.C. Spreeuw, T. Pfau, U. Janicke, and M. Wilkens, Laser-like scheme for atomicmatter waves, Europhys. Lett. 32, 469 (1995).
[60] M. Olshanii, Y. Castin, and J. Dalibard, A model for an atom laser, in Laser Spec-troscopy XII, eds. M. Inguscio, M. Allegrini, and A. Sasso (World Scientific, 1996).
[61] S. Inouye, T. Pfau, S. Gupta, A.P. Chikkatur, A. Gorlitz, D.E. Pritchard, andW. Ket-terle, Phase-coherent amplification of atomic matter waves, Nature 402, 641 (1999).
[62] J. Dalibard, Collisional dynamics of ultra-cold atomic gases, in Ref. [47].[63] D.J. Heinzen, Ultracold atomic interactions, in Ref. [47].[64] Y. Castin, J.I. Cirac, and M. Lewenstein, Reabsorption of light by trapped atoms,
Phys. Rev. Lett. 80, 5305 (1998).[65] U. Janicke and M. Wilkens, Prospects of matter wave amplification in the presence
of a single photon, Europhys. Lett. 35, 561 (1996).[66] J.I. Cirac, M. Lewenstein, and P. Zoller, Collective laser cooling of trapped atoms,
Europhys. Lett. 35, 647 (1996).

130 References
[67] D.W. Sesko, T.G. Walker, and C.E. Wieman, Behaviour of neutral atoms in a spon-taneous force trap, J. Opt. Soc. Am. B 8, 946 (1991).
[68] T.W. Hijmans, G.V. Shlyapnikov, and A.L. Burin, Influence of radiative interatomiccollisions on dark-state cooling, Phys. Rev. A 54, 4332 (1996).
[69] M.H. Anderson, W. Petrich, J.R. Ensher, and E. Cornell, Reduction of light-assisted collisional loss rate from a low-pressure vapour-cell trap, Phys. Rev. A 50,R3597 (1994).
[70] J. Dalibard and C. Cohen-Tannoudji, Laser cooling below the Doppler limit by po-larisation gradients: simple theoretical models, in Laser cooling and trapping, ed. byS. Chu and C. Wieman, J. Opt. Soc. Am. B 6 special issue (1989), p. 2023.
[71] P.D. Lett, W.D. Phillips, S.L. Rolston, C.E. Tanner, R.N. Watts, and C.I. Westbrook,Optical molasses, ibid., p. 2084.
[72] W. Ketterle, K.B. Davis, M.A. Joffe, A. Martin, and D.E. Pritchard, High densities ofcold atoms in a dark spontaneous-force optical trap, Phys. Rev. Lett. 70, 2253 (1993).
[73] M. Drewsen, Ph. Laurent, A. Nadir, G. Santarelli, A. Clairon, Y. Castin, D. Grison,and C. Salomon, Investigation of sub-Doppler cooling effects in a cesium magneto-optical trap, Appl. Phys. B 59, 283 (1994).
[74] C.G. Townsend, N.H. Edwards, C.J. Cooper, K.P. Zetie, C.J. Foot, A.M. Steane,P. Szriftgiser, H. Perrin, and J. Dalibard, Phase-space density in the magneto-opticaltrap, Phys. Rev. A 52, 1423 (1995).
[75] S.E. Hamann, D.L. Haycock, G. Klose, P.H. Pax, I.H. Deutsch, and P.S. Jessen,Resolved-sideband Raman cooling to the ground state of an optical lattice,Phys. Rev. Lett. 80, 4149 (1998).
[76] I. Bouchoule, H. Perrin, A. Kuhn, M. Morinaga, and C. Salomon, Neutral atomsprepared in Fock states of a one-dimensional harmonic potential, Phys. Rev. A 59,R8 (1999).
[77] A.J. Kerman, V. Vuletic, C. Chin, and S. Chu, Beyond optical molasses: 3D Ramansideband cooling of atomic cesium to high phase-space density, Phys. Rev. Lett. 84,439 (2000).
[78] D.-J. Han, S. Wolf, S. Oliver, C. McCormick, M.T. DePue, and D.S. Weiss,3D Raman sideband cooling of cesium atoms at high density, Phys. Rev. Lett.85, 724 (2000).
[79] P.S. Jessen and I.H. Deutsch, Optical lattices, Adv. At. Mol. Opt. Phys. 37, 95 (1996).[80] L. Guidoni and P. Verkerk, Optical lattices: cold atoms ordered by light (Ph.D.
tutorial), J. Opt. B.: Quant. Semiclass. Opt. 1, R23 (1999).[81] T. Ido, Y. Isoya, and H. Katori, Optical-dipole trapping of Sr atoms at a high phase-
space density, Phys. Rev. A 61, 061403(R) (2000).[82] P. Desbiolles and J. Dalibard, Loading atoms in a bi-dimensional light trap,
Opt. Comm. 132, 540 (1996).[83] W.L. Power, T. Pfau, and M. Wilkens, Loading atoms into a surface trap: simulations
of an experimental scheme, Opt. Comm. 143, 125 (1997).[84] T. Pfau and J. Mlynek, A 2D quantum gas of laser cooled atoms, OSA Trends Optics
Photonics Series 7, 33 (1997).[85] E.A. Hinds, M.G. Boshier, and I.G. Hughes, Magnetic waveguide for trapping cold
atom gases in two dimensions, Phys. Rev. Lett. 80, 645 (1998).

References 131
[86] H. Gauck, M. Hartl, D. Schneble, H. Schnitzler, T. Pfau, and J. Mlynek, Quasi-2D gasof laser cooled atoms in a planar matter waveguide, Phys.Rev. Lett.81, 5298 (1998).
[87] R.J.C. Spreeuw, D. Voigt, B.T. Wolschrijn, and H.B. van Linden van den Heuvell,Creating a low-dimensional quantum gas using dark states in an inelastic evanescent-wave mirror, Phys. Rev. A 61, 053604 (2000).
[88] V. Bagnato, D. Kleppner, Bose-Einstein condensation in low-dimensional traps,Phys. Rev. A 44, 7439 (1991).
[89] D.S. Petrov, M. Holzmann, and G.V. Shlyapnikov, Bose-Einstein condensation inquasi 2D trapped gases, Phys. Rev. Lett. 84 2551 (2000).
[90] J.M. Kosterlitz and D.J. Thouless, Ordering, metastability and phase transitions intwo-dimensional systems, J. Phys. C 6, 1181 (1973).
[91] D. Muller, D.Z. Anderson, R.J. Grow, P.D.D. Schwindt, and E.A. Cornell, Guidingneutral atoms around curves with lithographically patterned current-carrying wires,Phys. Rev. Lett. 83, 5194 (1999).
[92] N.H. Dekker, C.S. Lee, V. Lorent, J.H. Thywissen, S.P. Smith, M. Drndic,R.M. Westervelt, and M. Prentiss, Guiding neutral atoms on a chip, Phys. Rev. Lett.84, 1124 (2000).
[93] J. Reichel, W. Hansel, and T.W. Hansch, Atomic micromanipulation with magneticsurface traps, Phys. Rev. Lett. 83, 3398 (1999).
[94] R. Folman, P. Kruger, D. Cassettari, B. Hessmo, T. Maier, and J. Schmiedmayer,Controlling cold atoms using nanofabricated surfaces: atom chips, Phys. Rev. Lett.84, 4749 (2000).
[95] A. Browaeys, J. Poupard, A. Robert, S. Nowak, W. Rooijakkers, E. Arimondo,L. Marcassa, D. Boiron, C.I. Westbrook, and A. Aspect, Two body loss rate in amagneto-optical trap of metastable He, Eur. Phys. J. D 8, 199 (2000).
[96] N. Herschbach, P.J.J. Tol, W. Hogervorst, and W. Vassen, Suppression of Penningionisation by spin polarisation of cold He 2 3S atoms, Phys. Rev. A 61, 050702(R)(2000).
[97] H. Wiseman, A. Martins, and D. Walls, An atom laser based on evaporative cooling,Quant. Semiclass. Opt. 8, 737 (1996).
[98] A.M. Guzman, M. Moore, and P. Meystre, Theory of a coherent atomic-beamgenerator, Phys. Rev. A 53, 977 (1996).
[99] M. Holland, K. Burnett, C. Gardiner, J.I. Cirac, and P. Zoller, Theory of an atomlaser, Phys. Rev. A 54, R1757 (1996).
[100] J.-Y. Courtois, J.-M. Courty, and J.C. Mertz, Internal dynamics of multilevel atomsnear a vacuum-dielectric interface, Phys. Rev. A 53, 1862 (1996).
[101] C. Henkel and J.-Y. Courtois, Recoil and momentum diffusion of an atom close toa vacuum-dielectric interface, Eur. Phys. J. D 3, 129 (1998).
[102] L. Spruch, Retarded, or Casimir, long-range potentials, Physics Today, November1986, p. 37.
[103] A. Landragin, J.-Y. Courtois, G. Labeyrie, N. Vansteenkiste, C.I. Westbrook,and A. Aspect, Measurement of the Van der Waals force in an atomic mirror,Phys. Rev. Lett. 77, 1464 (1996).
[104] J.D. Miller, R.A. Cline, D.J. Heinzen, Far-off-resonance optical trapping of atoms,Phys. Rev. A 47, R4567 (1993).
132 References
[105] T. Muller-Seydlitz, M. Hartl, B. Brezger, H. Hansel, C. Keller, A. Schnetz,R.J.C. Spreeuw, T. Pfau, and J. Mlynek, Atoms in the lowest motional band of athree-dimensional optical lattice, Phys. Rev. Lett. 78, 1038 (1997).
[106] P. Desbiolles, M. Arndt, P. Szriftgiser, and J. Dalibard, Elementary Sisyphus processclose to a dielectric, Phys. Rev. A 54, 4292 (1996).
[107] A. Aspect, E. Arimondo, R. Kaiser, N. Vansteenkiste, and C. Cohen-Tannoudji,Laser cooling below the one-photon recoil energy by velocity-selective coherent popu-lation trapping, Phys. Rev. Lett. 61, 826 (1988).
[108] J. Lawall, S. Kulin, B. Saubamea, N. Bigelow, M. Leduc, and C. Cohen-Tannoudji,Three-dimensional laser cooling of helium beyond the single-photon recoil limit,Phys. Rev. Lett. 75, 4195 (1995).
[109] P.S. Jessen, C. Gerz, P.D. Lett, W.D. Phillips, S.L. Rolston, R.J.C. Spreeuw,and C.I. Westbrook, Observation of quantized motion of Rb in an optical field,Phys. Rev. Lett. 69, 49 (1992).
[110] P. Verkerk, B. Lounis, C. Salomon, C. Cohen-Tannoudji, J.-Y. Courtois, andG. Grynberg, Dynamics and spatial order of cold cesium atoms in a periodic opticalpotential, Phys. Rev. Lett. 68, 3861 (1992).
[111] D. Boiron, A. Michaud, J.M. Fournier, L. Simard, M. Sprenger, G. Grynberg,and C. Salomon, Cold and dense cesium clouds in far-detuned dipole traps,Phys. Rev. A 57, R4106 (1998).
[112] S. Friebel, R. Scheunemann, J. Walz, T.W. Hansch, and M. Weitz, Laser cooling ina CO2-laser optical lattice, Appl. Phys. B 67, 699 (1998).
[113] N. Vansteenkiste, P. Vignolo, and A. Aspect, Optical reversibility theorems forpolarisation; application to remote control of polarisation, J. Opt. Soc. Am. A 10,2240 (1993).
[114] W. Seifert, R. Kaiser, A. Aspect, and J. Mlynek, Reflection of atoms from a dielectricwave guide, Opt. Comm. 111, 566 (1994).
[115] Z.T. Lu, K.L. Corwin, M.J. Renn, M.H. Anderson, E.A. Cornell, and C.E. Wieman,Low-velocity intense source of atoms from a magneto-optical trap, Phys. Rev. Lett.77, 3331 (1996).
[116] K. Dieckmann, R.J.C. Spreeuw, M. Weidemuller, and J.T.M. Walraven, Two-dimen-sional magneto-optical trap as a source of slow atoms, Phys. Rev. A 58, 3891 (1998).
[117] C.E. Wieman and L. Hollberg, Using diode lasers for atomic physics,Rev. Sci. Instr. 62, 1 (1991).
[118] K.B. MacAdam, A. Steinbach, and C. Wieman, A narrow-band tunable diode lasersystem with grating feedback and a saturated absorption spectrometer for Cs and Rb,Am. J. Phys. 60, 1098 (1992).
[119] G.C. Bjorklund, M.D. Levenson, W. Lenth, and C. Ortiz, Frequency modulation(FM) spectroscopy, Appl. Phys. B 32, 145 (1983).
[120] B. Cheron, H. Gilles, J. Havel, O. Moreau, and H. Sorel, Laser frequency stabilizationusing Zeeman effect, J. Phys. III, 4, 401 (1994).
[121] K.L. Corwin, Z.-T. Lu, C.F. Hand, R.J. Epstein, and C.E. Wieman, Frequency-stabilised diode laser with the Zeeman shift in an atomic vapour, Appl. Opt. 37, 3295(1998).
[122] M. Gertsvolf and M. Rosenbluh, Injection locking of a diode laser locked to a Zeemanfrequency stabilised laser oscillator, Opt. Comm. 170, 269 (1999).

References 133
[123] C.S. Adams, J. Vorberg, and J. Mlynek, Single-frequency operation of a diode-pumped lanthanum-neodymium-hexaaluminate laser by using a twisted-mode cavity,Opt. Lett. 18, 420 (1993).
[124] C. Monroe, W. Swann, H. Robinson, and C. Wieman, Very cold trapped atoms in avapour cell, Phys. Rev. Lett. 65, 1571 (1990).
[125] K. Lindquist, M. Stephens, and C. Wieman, Experimental and theoretical study ofthe vapour-cell Zeeman optical trap, Phys. Rev. A 46, 4082 (1992).
[126] H. Ludvigsen, A. Aijala, A. Pietilainen, H. Talvitie, and E. Ikonen, Laser cooling ofrubidium atoms in a vapour cell, Physica Scripta 49, 424 (1994).
[127] CRC Handbook of Chemistry and Physics, 73rd edition, (CRC Press, 1992).[128] C.J. Myatt, N.R. Newbury, R.W. Ghrist, S. Loutzenhiser, and C.E. Wieman,
Multiply loaded magneto-optical trap, Opt. Lett. 21, 290 (1996).[129] A. Noble and M. Kasevich, UHV optical window seal to ConflatTM knife edge,
Rev. Sci. Instr. 65, 3042 (1994).[130] Le Carbone-Lorraine, Cefilac Etancheıte, catalogues Helicoflex high performance
sealing and Seals for ultra-high vacuum and cryogenics (Saint-Etienne, France).[131] K. Dieckmann et al., AMOLF Institute, Amsterdam, private communication.[132] C. Wieman, G. Flowers, and S. Gilbert, Inexpensive laser cooling and trapping ex-
periment for undergraduate laboratories, Am. J. Phys. 63, 317 (1995).[133] W. Demtroder, Laser spectroscopy (Springer, Heidelberg, 1996).[134] M. Murtz, J.S. Wells, L. Hollberg, T. Zibrova, and N. Mackie, Extended-cavity
grating-tuned operation of mid-infrared InAsSb diode lasers, Appl. Phys. B 66, 277(1998).
[135] L. Ricci, M. Weidemuller, T. Esslinger, A. Hemmerich, C. Zimmermann, V. Vuletic,W. Konig, and T.W. Hansch, A compact grating-stabilised diode laser system foratomic physics, Opt. Comm. 117, 541 (1995).
[136] T. Hof, D. Fick, H.J. Jansch, Application of diode lasers as a spectroscopic tool at670 nm, Opt. Comm. 124, 283 (1996).
[137] H. Leinen, D. Glaßner, H. Metcalf, R. Wynands, D. Haubrich, and D. Meschede,GaN blue diode lasers: a spectroscopist’s view, Appl. Phys. B 70, 567 (2000).
[138] G.R. Hadley, Injection locking of diode lasers, IEEE J. Quant. Electr. 22, 419 (1986).[139] P. Spano, S. Piazzolla, and M. Tamburrini, Frequency and intensity noise in
injection-locked semiconductor lasers: theory and experiment, IEEE J. Quant. Electr.22, 427 (1986).
[140] S. Wolf, Entwicklung und Charakterisierung eines frequenzstabilen Diodenlasers,diploma thesis, Universitat Konstanz (1994, unpublished).
[141] A.S. Arnold, J.S. Wilson, and M.G. Boshier, A simple extended-cavity diode laser,Rev. Sci. Instr. 69, 1236 (1998).
[142] P. Jessen, private communication.[143] G.P. Barwood, P. Gill, and W.R.C. Rowley, Frequency measurements on optically
narrowed Rb-stabilised laser diodes at 780 nm and 795 nm, Appl. Phys. B 53, 142(1991).
[144] U. Volz and H. Schmoranzer, Precision lifetime measurement on alkali atoms andon helium by beam-gas-laser spectroscopy, Physica Scripta T65, 48 (1996).
[145] T.W. Hansch and B. Couillaud, Laser frequency stabilisation by polarisation spec-troscopy of a reflecting reference cavity, Opt. Comm. 35, 441 (1980).
134 References
[146] W.D. Lee and J.C. Campbell, Narrow-linewidth frequency stabilizedAlxGa1−xAs/GaAs laser, Appl. Phys. B 60, 1544 (1992).
[147] Z.D. Liu, D. Bloch, and M. Ducloy, Absolute active frequency locking of a diode laserwith optical feedback generated by Doppler-free collinear polarisation spectroscopy,Appl. Phys. B 65, 274 (1994).
[148] S.J.H. Petra, Development of frequency stabilised laser diodes for building a magneto-optical trap, diploma thesis, Universiteit van Amsterdam (1998, unpublished).
[149] M.R. Andrews, M.-O. Mewes, N.J. van Druten, D.S. Durfee, D.M. Kurn, andW. Ketterle, Direct, non-destructive observation of a Bose condensate, Science 273,84 (1996).
[150] C.C. Bradley, C.A. Sackett, and R.G. Hulet, Analysis of in situ images of Bose-Einstein condensates of lithium, Phys. Rev. A 55, 3951 (1997).
[151] R.J.C. Spreeuw, Absorption imaging of cold 2D atoms, unpublished.[152] R.J. Cook, Theory of resonance-radiation pressure, Phys. Rev. A 22, 1078 (1980).[153] J.P. Gordon and A. Ashkin, Motion of atoms in a radiation trap,
Phys. Rev. A 21,1606 (1980).[154] A.M. Steane, M. Chowdhury, and C.J. Foot, Radiation force in the magneto-optical
trap, J. Opt. Soc. Am. B 9, 2142 (1992).[155] S. Chu, L. Hollberg, J.E. Bjorkholm, A. Cable, and A. Ashkin, Three-dimen-
sional viscous confinement and cooling of atoms by resonance radiation pressure,Phys. Rev. Lett. 55, 48 (1985).
[156] P.D. Lett, R.N. Watts, C.I. Westbrook, and W.D. Phillips, Observation of atomslaser cooled below the Doppler limit, Phys. Rev. Lett. 61, 169 (1988).
[157] D.R. Meacher, D. Boiron, H. Metcalf, C. Salomon, and G. Grynberg, Method forvelocimetry of cold atoms, Phys. Rev. A 50, R1992 (1994).
[158] E.C. Schilder, An atomic trampoline, diploma thesis, Universiteit van Amsterdam(1999, unpublished).
[159] R. Wynands and A. Nagel, Precision spectroscopy with coherent dark states,Appl. Phys. B 68, 1 (1999).
[160] W. Hanle, Uber magnetische Beeinflussung der Polarisation der Resonanz-fluoreszenz, Z. Phys. 30, 93 (1924).
[161] G.L. Abbas, S. Yang, V.W.S. Chan, and J.G. Fujimoto, Injection behaviour andmodelling of 100 mW broad area diode lasers, IEEE J. Quant. Electr. 24, 609 (1988).
[162] L. Goldberg and M.K. Chun, Injection locking characteristics of a 1 W broad stripelaser diode, Appl. Phys. Lett. 53, 1900 (1988).
[163] L. Goldberg, D. Mehuys, M.R. Surette, and D.C. Hall, High-power, near-diffraction-limited large-area travelling-wave semiconductor amplifiers, IEEE J. Quant. Electr.29, 2028 (1993).
[164] A.C. Fey-den Boer, H.C.W. Beijerinck, and K.A.H. van Leeuwen, High-power broad-area diode lasers for laser cooling, Appl. Phys. B 64, 415 (1997).
[165] E. Gehrig, B. Beier, K.-J. Boller, and R. Wallenstein, Experimental characterisationand numerical modelling of an AlGaAs oscillator broad area double pass amplifiersystem, Appl. Phys. B 66, 287 (1998).
[166] M. Praeger, V. Vuletic, T. Fischer, T.W. Hansch, and C. Zimmermann, A broademitter diode laser system for lithium spectroscopy, Appl. Phys. B 67, 163 (1998).
References 135
[167] I. Shvarchuck, K. Dieckmann, M. Zielonkowski, and J.T.M. Walraven,Broad-area diode laser system for a rubidium Bose-Einstein condensation experiment,Appl. Phys. B 71, 475 (2000).
[168] K. Iida, H. Horiuchi, O. Matoba, T. Omatsu, T. Shimura, and K. Kuroda,Injection locking of broad-area diode laser through a double phase-conjugate mirror,Opt. Comm. 146, 6 (1998).
[169] J.N. Walpole, Semiconductor amplifiers and lasers with tapered gain regions,Opt. Quant. Electr. 28, 623 (1996).
[170] J.N. Walpole, E.S. Kintzer, S.R. Chinn, C.A. Wang, and L.J. Missaggia, High-powerstrained-layer InGaAs/AlGaAs tapered travelling wave amplifier, Appl. Phys. Lett.61, 740 (1992).
[171] D. Mehuys, D.F. Welch, and L. Goldberg, 2.0 W cw, diffraction-limited taperedamplifier with diode injection, Electr. Lett. 28, 1944 (1992).
[172] C. Zimmermann, J. Walz, and T.W. Hansch, Solid-state laser source for(anti)hydrogen spectroscopy, Hyperfine Interactions 100, 145 (1996).
[173] D. Wandt, M. Laschek, F. v. Alvensleben, A. Tunnermann, and H. Welling, Con-tinuously tunable 0.5 W single-frequency diode laser source, Opt. Comm. 148, 261(1998).
[174] G. Ferrari, M.-O. Mewes, F. Schreck, and C. Salomon, High-power multiple-frequency narrow-linewidth laser source based on a semiconductor tapered amplifier,Opt. Lett. 24, 151 (1999).
[175] J.C. Livas, S.R. Chinn, E.S. Kintzer, J.N. Walpole, C.A. Wang, and L.J. Missaggia,Single-mode optical fibre coupling of high-power tapered gain region devices,IEEE Phot. Techn. Lett. 6, 422 (1994).
[176] Z.L. Liau, J.N. Walpole, D.E. Mull, C.L. Dennis, and L.J. Missaggia,Accurate fabrication of anamorphic microlenses and efficient collimation of taperedunstable-resonator diode lasers, Appl. Phys. Lett. 64, 3368 (1994).
[177] Z.L. Liau, J.N. Walpole, J.C. Livas, E.S. Kintzer, D.E. Mull, L.J. Missaggia, andW.F. DiNatale, Fabrication of two-sided anamorphic microlenses and direct couplingof tapered high-power diode laser to single-mode fibre, IEEE Phot. Techn. Lett. 7,1315 (1995).
[178] Spectra Diode Laboratories, Product Catalog (San Jose, Ca., 1996).[179] W.W. Chow and R.R. Craig, Amplified spontaneous emission effects in semiconduc-
tor laser amplifiers, IEEE. J. Quant. Electr. 26, 1363 (1990).[180] E.S. Kintzer, J.N. Walpole, S.R. Chinn, C.A. Wang, and L.J. Missaggia,
High-power, strained-layer amplifiers and lasers with tapered gain regions,IEEE Phot. Techn. Lett. 5, 605 (1993).
[181] L. Cognet, V. Savalli, G.Zs.K. Horvath, D. Holleville, R. Marani, N. Westbrook,C.I. Westbrook, and A. Aspect, Atomic interference in grazing incidence diffractionfrom an evanescent wave mirror, Phys. Rev. Lett. 81, 5044 (1998).
[182] R. Marani, L. Cognet, V. Savalli, N. Westbrook, C.I. Westbrook, and A. Aspect,Using atomic interference to probe atom-surface interactions, Phys. Rev. A 61,053402 (2000).
[183] M. Gorlicki, S. Feron, V. Lorent, and M. Ducloy, Interferometric approaches toatom-surface Van der Waals interactions in atomic mirrors, Phys. Rev. A 61, 013603(2000).

136 References
[184] H.B.G. Casimir and D. Polder, The influence of retardation on the London-Van derWaals forces, Phys. Rev. 73, 360 (1948).
[185] V. Sandoghdar, C.I. Sukenik, E.A. Hinds, and S. Haroche, Direct measurement ofthe Van der Waals interaction between an atom and its images in a micron-sizedcavity, Phys. Rev. Lett. 68, 3432 (1992).
[186] C.I. Sukenik, M.G. Boshier, D. Cho, V. Sandoghdar, and E.A. Hinds, Measurementof the Casimir-Polder force, Phys. Rev. Lett. 70, 560 (1993).
[187] S.K. Lamoreaux, Demonstration of the Casimir force in the 0.6 to 6 µm range,Phys. Rev. Lett. 78, 5 (1997).
[188] A. Landragin, Reflexion d’atomes sur un miroir a onde evanescente: mesure de laforce de van der Waals et diffraction atomique, thesis (Universite de Paris XI, Orsay,1997).
[189] W. Seifert, C.S. Adams, V.I. Balykin, C. Heine, Yu. Ovchinnikov, and J. Mlynek,Reflection of metastable argon atoms from an evanescent wave, Phys. Rev. A 49,3814 (1994).
[190] S. Kawata and T. Sugiura,Movement of micrometer-sized particles in the evanescentfield of a laser beam, Opt. Lett. 17, 772 (1992).
[191] A. Einstein, Zur Quantentheorie der Strahlung, Phys. Zeitschr. 18, 121 (1917).[192] O.R. Frisch, Nachweis des Einsteinschen Strahlungsruckstoßes, Z. Phys. 86, 42
(1933).[193] G. Roosen and C. Imbert, Etude de la pression de radiation de l’onde evanescente
par absorption de lumiere resonnante, Opt. Comm. 18, 247 (1976).[194] A. Landragin, G. Labeyrie, C. Henkel, R. Kaiser, N. Vansteenkiste,
C.I. Westbrook, and A. Aspect, Specular versus diffuse reflection of atoms from anevanescent-wave mirror, Opt. Lett. 21, 1591 (1996).
[195] C. Henkel, K. Mølmer, R. Kaiser, N. Vansteenkiste, C.I. Westbrook, and A. Aspect,Diffuse atomic reflection at a rough mirror, Phys. Rev. A 55, 1160 (1997).
[196] R.A. Cline, J.D. Miller, M.R. Matthews, and D.J. Heinzen, Spin relaxation of opti-cally trapped atoms by light scattering, Opt. Lett. 19, 207 (1994).
[197] T. Matsudo, Y. Takahara, H. Hori, and T. Sakurai, Pseudomomentum trans-fer from evanescent waves to atoms measured by saturated absorption spectroscopy,Opt. Comm. 145, 64 (1998).
[198] Yu.B. Ovchinnikov, I. Manek, A.I. Sidorov, G. Wasik, and R. Grimm, Gravito-opticalatom trap based on a conical hollow beam, Europhys. Lett. 43, 510 (1998).
[199] M. Christ, A. Scholz, M. Schiffer, R. Deutschmann, and W. Ertmer, Diffrac-tion and reflection of a slow metastable neon beam by an evanescent light grating,Opt. Comm. 107, 211 (1994).
[200] A. Landragin, L. Cognet, G.Zs.K. Horvath, C.I. Westbrook, N. Westbrook, andA. Aspect, A reflection grating for atoms at normal incidence, Europhys. Lett. 39,485 (1997).
[201] C. Henkel, H. Wallis, N. Westbrook, C.I. Westbrook, A. Aspect, K. Sengstock, andW. Ertmer, Theory of atomic diffraction from evanescent waves, Appl. Phys. B 69,277 (1999).
[202] R. Jansen, Elastic and inelastic bouncing of rubidium atoms on an evanescent-wavepotential, diploma thesis, Universiteit van Amsterdam (2000, unpublished).
[203] B.T. Wolschrijn et al., to be published.

Summary
In atom optics, atomic matter wave are manipulated using, e.g., mirrors or lenses, inanalogy to light optics. Of particular interest are evanescent-wave (EW) mirrors foratoms. This is because of the short characteristic length, of the order of the opticalwavelength, at which a reflecting optical potential can be realised by an EW. Thisthesis is about our studies of photon scattering by cold (10 µK) rubidium atomsthat bounce vertically on an EW mirror. Depending on the mirror configuration,we observed elastically and inelastically bouncing atoms. In the elastic case photonscattering leads to radiation pressure. The inelastic mirror is a consequence ofoptical hyperfine pumping of the atoms. It has no counterpart in light optics.
Understanding of scattering is important for our envisaged application of theinelastic mirror to load a low-dimensional optical dipole trap. The concept is tooptically pump bouncing atoms with high spatial selectivity close to the turningpoint on the mirror. A spontaneous Raman transition transfers atoms into thetrap. Dissipation allows the phase-space density to increase, possibly leading toa low-dimensional quantum degenerate gas by purely optical means. Ultimately acontinuously operating “atom laser” might be realised, as a bright source of coherentmatter waves. Being an open system out of thermal equilibrium, it would be in closeanalogy to an optical laser.
In chapter 2, previous work on EW trap loading schemes with metastable noblegas atoms is extended to alkali atoms and, specifically, to 87Rb. Heating of atomsby scattered photons is a severe loss mechanism in optical traps. The proposed low-dimensional trap allows spontaneously emitted photons to escape into a large solidangle without being reabsorbed. Due to the relatively small ground state hyperfinesplitting of the alkali atoms, addressing of these states separately with bouncing andtrapping potentials is difficult. As a solution the use of “dark states” is proposed. Itis shown that the light scattering rate can be reduced by several orders, to 20 s−1
per atom. This requires the use of a circularly-polarised EW. It is discussed how torealise such a field using either a single beam or multiple beams. In the latter case,the EW may provide both a bouncing and a trapping potential, which aligns theatoms in parallel horizontal lines close to the surface.
Experiments were performed using a magneto-optical trap (MOT) with molassescooling as a source of ≈ 107 cold atoms. The MOT is operated in an ultra-high vac-uum (UHV) rubidium vapour cell. Optical access was achieved using a rectangularglass cuvette. The various laser frequencies were provided by a system of stabiliseddiode lasers, if necessary amplified by injection-locked diode lasers or travelling-wave tapered semiconductor amplifiers (TA). An overview of the setup is given inchapter 3, including a detailed description of our UHV sealing techniques for glasscuvettes using either knife-edged metal gaskets or an epoxy resin.
137
138 Summary
Chapter 4 is dedicated to the characterisation of our TA systems, which provide150−200 mW power after single-mode optical fibres, with fibre coupling efficienciesup to 59%. The relevance of broad spectral background due to amplified sponta-neous emission (ASE) for the application with far-off resonance dipole potentials isdiscussed. Related to the rubidium optical transition linewidth of Γ/2π = 6 MHz,we observed an ASE suppression of better than −82 dB.
In chapter 5, the efficiency of the EW mirror is investigated using a time-of-flightdetection of bouncing atoms. Atom clouds were released from the MOT, 6 mmabove the mirror. We observed bouncing fractions up to 9%. These fractions resultfrom the relation between the effective mirror surface and the ballistic expansionof falling atom clouds. At a temperature of 10 µK, the rms width of the cloudwas approximately 1 mm at the mirror, twice as large as in the MOT. The limitedeffective mirror surface was due to the transverse Gaussian intensity profile of theEW laser beam. The bouncing fraction was investigated as a function of laser power,detuning and polarisation. Also the temperature of the released cloud was variedbetween 6− 20 µK. The measurements clearly show the significance of the Van derWaals atom-surface interaction that reduces the effective mirror surface.
In chapter 6, radiation pressure is studied, which is exerted on bouncing atoms.An EW does not propagate away from the surface. It propagates, however, alongthe surface. Therefore the radiation pressure is directed parallel to the surface.Using fluorescence imaging with a camera, we studied this radiation pressure interms of the horizontal velocity change of bouncing atoms. We observed 2 − 31photon recoils per bounce, and found the radiation pressure to be independent ofthe EW power, as expected from the exponential shape of the mirror potential. Asimplifying two-level atom calculation for the number of scattered photons revealsan inverse proportionality to both laser detuning and EW decay parameter. Thisis in agreement with our observations. However, for steep EW potentials, in whichatoms bounce very quickly within ≈ 1 µs and scatter only few photons, we observean excess scattering of approximately 3 recoils. We assume that this is due todiffusely scattered light by the roughness of the prism surface.
Bouncing occurred elastically when the EW was tuned to a “closed” optical tran-sition. Despite of scattering photons, atoms then follow a single optical potential.In chapter 7, inelastic bouncing is investigated using an “open” transition, such thatoptical hyperfine pumping by the EW could transfer atoms into the different hyper-fine ground state. The optical potential in this final state is lower. Bouncing atomsdissipate ≈ 90% of their potential energy on the mirror. Using absorption imaging,we directly observed the density distribution of inelastically bouncing atom clouds.The high spatial selectivity of the pumping mechanism is revealed by a pronouncedpeak density for atoms that dissipate the maximum possible amount of energy. Abroad (non-thermal) tail of faster atoms represents atoms being pumped furtheraway from the turning point. By adjusting the laser detuning, we observed theinelasticity ranging between 81 − 92%. This type of a single inelastic bounce canbe interpreted as the fundamental step of a “Sisyphus” reflection cooling technique.Due to the relatively large fall height (6 mm) a single reflection leads, however, toheating. Multiple reflections would be necessary to achieve a net cooling.

Samenvatting
Met laserlicht kunnen krachten op neutrale atomen worden uitgeoefend. Met dezekrachten kunnen de atomen worden gemanipuleerd, en worden afgekoeld, d.w.z.afgeremd. Sinds Dehmelt, Hansch, Schawlow en Wineland in 1975 de eerste voor-stellen voor laserkoeling deden, werd de “atoomoptica” met vele technieken verrijkt.Zo werd onder andere de Nobelprijs voor natuurkunde in 1997 uitgereikt aan Chu,Cohen-Tannoudji en Phillips voor hun bijdragen aan dit vakgebied.
Analoog aan de elektromagnetische lichtgolf in de optica kan de atomaire mate-riegolf in de atoomoptica beınvloed worden met spiegels, lenzen, tralies en straal-delers. Dit maakt het mogelijk om bijvoorbeeld uiterst nauwkeurige atoominter-ferometrische experimenten uit te voeren, zoals het meten van de fijnstructuur-constante. Met lasergekoelde atomen kunnen ook zeer precieze atoomklokken wor-den gerealiseerd, die bijvoorbeeld in de satellietnavigatie toegepast kunnen worden.In de atoomlithografie kunnen structuren op de schaal van een nanometer aange-bracht worden.
Waar in de optica lasers veelvuldig gebruikt worden als intensieve, goed gebun-delde en vooral monochromatische (coherente) lichtbronnen, wordt in de atoom-optica tot dusver gewerkt met relatief zwakke “atomaire gloeilampen”. In het een-voudigste geval betreft het een straal atomen die uit een oven ontsnapt en metbehulp van een serie diafragma’s wordt gecollimeerd. Desalniettemin bestaan ervoorstellen voor het realiseren van een bron van coherente materiegolven, een zoge-naamde “atoomlaser”.
Atoomoptische componenten bestaan meestal uit laserlicht van welbepaalde in-tensiteit, polarisatie en frequentie. In dit proefschrift worden spiegels voor rubidium-atomen (isotoop 87
37Rb) beschreven, waarbij de bewegingsrichting van de atomen dooreen repulsieve “evanescente” lichtgolf elastisch wordt omgekeerd. In het bijzonderwordt de lichtverstrooiing aan de atomen onderzocht. Deze verstrooiing is een dis-sipatief proces waardoor het mogelijk wordt dat atomen ook inelastisch gereflecteerdworden. Hiervoor bestaat in de lichtoptica geen analogie.
Zoals Gauck en collega’s in Konstanz hebben laten zien, kan de inelastischereflectie ook “volledig inelastisch” gemaakt worden, oftewel de atomen kunnen ineen tweedimensionale optische val aan het spiegeloppervlak worden geaccumuleerd.Als deze val efficient genoeg geladen kan worden moet het in principe mogelijkzijn een laagdimensionaal quantumgas te verkrijgen, vergelijkbaar met het Bose-Einstein condensaat in drie dimensies. De faseovergang van een thermisch gas naarhet condensaat wordt in twee dimensies vervangen door de tot dusver nog nietwaargenomen Kosterlitz-Thouless overgang.
139
140 Samenvatting / Zusammenfassung
Voorafgaande aan de beschrijving van onze experimenten wordt hier het principevan een evanescente spiegel voor atomen toegelicht.
Een evanescente lichtgolf ontstaat, als licht volledig wordt gereflecteerd aan degrensvlak tussen twee dielektrische media. In onze experimenten gaat het om eenhorizontaal glasoppervlak in vacuum. In het vacuum boven het glasoppervlak vin-den wij een lichtgolf die parallel aan het oppervlak propageert. In tegenstellingtot de horizontale golfvectorcomponent is de verticale component imaginair. Datbetekent dat de elektrische veldsterkte exponentieel afneemt met de afstand tot hetoppervlak. De karakteristieke afvallengte is van de orde van de gebruikte optischegolflengte, bijvoorbeeld 780 nm voor rubidiumatomen. Hoe verder de invalshoek vanhet licht voorbij de kritische hoek voor totale reflectie wordt ingesteld, hoe korterde afvallengte wordt.
De krachten die een lichtgolf, bijvoorbeeld een evanescent veld, op een atoom kanuitoefenen, worden in het algemeen ingedeeld in twee categorien, namelijk “spontanekrachten” en “dipoolkrachten”.
De spontane kracht is gebaseerd op herhaalde absorptie en spontane emissie vanfotonen. De frequentie van de lichtgolf moet hiervoor afgestemd zijn op een optischeresonantie van de atomen, of tenminste niet ver daarvan af. Omdat in de regeleen gerichte laserstraal gebruikt wordt, zijn de terugstoten die de atomen door deabsorptie van fotonen krijgen ook gericht, zodat er een netto kracht resulteert. Dezekracht wordt ook wel “stralingsdruk” genoemd. De emissie van fotonen is spontaanen gemiddeld ongericht. Zodoende is deze kracht dissipatief en kan gebruikt wordenvoor het koelen van atomen. Ze leidt echter ook tot diffusie.
De dipoolkracht daarentegen is een conservatieve kracht en kan door een “opti-sche potentiaal” worden beschreven. Deze potentiaal ontstaat door de wisselwerkingtussen het elektrische veld van het licht en de geınduceerde elektrische dipool-momenten van de atomen. De dipoolkracht heeft een dispersief karakter: als delichtfrequentie kleiner is dan die van de atomaire overgang (rood verstemd) wor-den de atomen aangetrokken, als de frequentie groter is (blauw verstemd) worden zejuist afgestoten. Om ook daadwerkelijk een konservatieve kracht te verkrijgen, is hetnodig om de frequentieverstemming groot te kiezen, zodat absorptie (stralingsdruk)geen rol speelt.
Een ver naar het blauw verstemd evanescent lichtveld vormt dus een potentiaal-barriere voor atomen. Als de kinetische energie van de invallende atomen kleineris dan de hoogte van het maximum van deze barriere zullen de atomen van rich-ting omkeren. Zo wordt het evanescente veld een spiegel of een “trampoline” vooratomen.
In onze experimenten wordt om te beginnen een 1 mm grote koude wolk vanca. 100 miljoen rubidiumatomen ingevangen in een magneto-optische val. De wolkheeft een temperatuur van 10 µK boven het absolute nulpunt van −273.15 C. Bijdeze temperatuur hebben de atomen een snelheid van enkele centimeter per seconde.Ter vergelijking: de snelheid bij kamertemperatuur bedraagt enkele honderden meterper seconde. De atomen worden losgelaten uit de magneto-optische val en vallenvanaf een hoogte van ongeveer 5 tot 7 mm op de spiegel. Tijdens de val expandeertde wolk ballistisch en wordt in doorsnede verdubbeld. Het intensiteitsprofiel van

Samenvatting / Zusammenfassung 141
het evanescente veld is gaussvormig, en zo ook het effektieve spiegeloppervlak. Ditoppervlak wordt begrenst door de contour waar de minimale barrierehoogte nog netbereikt wordt. In het algemeen wordt slechts een deel van de wolk gereflecteerd.
Deze spiegelefficientie hebben wij onderzocht als functie van de temperatuur deratomen en van de laserparameters. Het effektieve spiegeloppervlak wordt bepaalddoor het vermogen van de laser, de frequentieverstemming en de polarisatie. Metons evanescente veld bereikten wij spiegelefficienties tot 8%, in overeenstemmingmet voorspellende berekeningen. We nemen waar dat de aantrekkende Van derWaalskracht tussen de atomen en het glas de optische potentiaal verlaagt waardoorhet effektieve spiegeloppervlak significant kleiner wordt.
De stralingsdruk van het evanescente veld kan onderzocht worden door de be-weging van de atomen met een camera te registreren. Deze druk wordt veroorzaaktdoor de voortplanting van de lichtgolf langs het glasoppervlak. De terugstoten vande fotonen zorgen alleen voor verandering van de snelheid van de atomen in dezerichting, evenwijdig aan het oppervlak. Een enkele terugstoot geeft een snelheids-verandering van 6 mm/s. In het experiment nemen wij horizontale snelheidsver-anderingen van de gereflecteerde atomen waar van 1 tot 18 cm/s, overeenkomendmet de absorptie van 2 tot 31 fotonen. De verticale snelheid na een val van 6.6 mmbedraagt 36 cm/s.
Rubidium heeft een hyperfijnstructuur met twee grondtoestanden en meerdereoptisch aangeslagen toestanden. Desalniettemin kunnen de waarnemingen kwali-tatief verklaard worden met behulp van een eenvoudig model met slechts een grond-toestand en een aangeslagen toestand. Er werd namelijk een “gesloten” overgangaangeslagen zodat de atomen na ca. 30 ns weer in de oorspronkelijke hyperfijn-toestand terugvielen en dezelfde potentiaalcurve in het evanescente veld konden vol-gen. Hiermee is de aaname van het tweeniveausysteem gerechtvaardigd. Het gemid-delde aantal opgenomen terugstoten per atoom is evenredig aan de afvallengte vanhet veld en aan de snelheid van de atomen. In een steile potentiaal zullen de atomensnel omkeren zodat ze weinig tijd hebben om fotonen te absorberen. Afhankelijkvan de ingestelde afvallengte duurt de reflectie 3 tot 10 µs. Een langzaam atoomdringt minder diep in het evanescente veld door als een snel atoom en heeft dus ookminder tijd nodig om om te keren. Daarnaast is het aantal geabsorbeerde fotonenomgekeerd evenredig met de blauwverstemming van de laser. Het aantal is daaren-tegen niet afhankelijk van de laserintensiteit. Dit hangt samen met het exponentieleverloop van de optische potentiaal, waardoor het atoom steeds eenzelfde traject totzijn omkeerpunt aflegt onafhankelijk van hoever het nog is tot het maximum.
We hebben de hyperfijnstructuur van het rubidium gebruikt om ook inelasti-sche reflectie te kunnen waarnemen. Hiervoor stemden we de frequentie van hetevanescente veld af op een “open” optische overgang. Een atoom kan dan vanuitgrondtoestand |1〉 via een aangeslagen toestand en spontane emissie worden over-gepompt naar de andere hyperfijngrondtoestand |2〉. In toestand |2〉 is de hoogte vande potentiaalbarriere voor het atoom echter nog maar 10% van de oorspronkelijkewaarde omdat de blauwverstemming ten opzichte van de overgang vanuit toestand|2〉 tien keer zo groot is. Door het spontaan emitteren van een foton dissipeert hetatoom ca. 90% van zijn potentiele energie zodat het na deze inelastische reflectie nog
142 Samenvatting / Zusammenfassung
maar 10% van zijn oorspronkelijke hoogte kan bereiken. Opnamen met de cameralaten deze inelastische beweging van het zwaartepunt van de gereflecteerde wolk vanatomen duidelijk zien. De waarschijnlijkheid voor het overpompen is het grootstals een atoom zich vlakbij het omkeerpunt bevindt, waar zijn snelheid het kleinstis en de lichtintensiteit het grootst. Daar is bovendien het energieverlies dat bijoverpompen optreedt het grootst. Op grond van deze sterke ruimtelijke selectiviteitworden de meeste atomen dan ook maximaal inelastisch gereflecteerd.
Dankzij deze selectiviteit kan een inelastische spiegel gebruikt worden om atomendie eerst in een relatief grote magneto-optische val geprepareerd worden, efficient teconcentreren in een dunne tweedimensionale optische val dicht boven het glasopper-vlak. Voor dit invangen moet aan de potentiaal van toestand (2) een potentiaalputtoegevoegd worden waarin de overgepompte atomen kunnen worden gebonden. Eenbelangrijke consequentie van het dissipatieve karakter van de optische pompover-gang is, dat de dichtheid van de atomen in zo’n val —bij gelijke temperatuur—enkele orden van grootte meer kan bedragen dan de oorspronkelijke dichtheid in demagneto-optische val. Bij voldoende ladingsefficientie moet het dan ook mogelijkzijn om met behulp van een eenmalig optisch proces, zonder verdere afkoeling, eenlaagdimensionaal quantumgas te verkrijgen. Dit wordt hieronder besproken.
We spreken van een quantumgas als de dichtheid van het gas zo hoog is en detemperatuur zo laag, dat de golffuncties van de atomen elkaar overlappen. (Bijvoor-beeld: de DeBroglie golflengte van rubidium is bij 10 µK ongeveer 60 nm.) In ditgeval moet voor de beschrijving van de atomen de klassieke Boltzmann statistiekvervangen worden door de quantumstatistiek van niet onderscheidbare bosonen offermionen. In het geval van bosonen, zoals rubidium (8737Rb) met zijn heeltallige spin,ontstaat bij een temperatuur lager dan een kritische waarde het in 1924 reeds voor-spelde Bose-Einstein condensaat. In het condensaat bevindt zich een macroscopischaantal atomen in een enkele toestand. Experimenteel werd zo’n condensaat pas in1995 aangetoond door Anderson en medewerkers uit Boulder.
Het is tot dusver niet gelukt deze quantumontaarding enkel door middel van op-tisch koelen te bereiken. Dit is te wijten aan de spontaan geemitteerde fotonen dievoor de koeling essentieel zijn. Omdat deze fotonen telkens opnieuw geabsorbeerdworden, wordt de te bereiken temperatuur gelimiteerd door de terugstoten. In eenmagneto-optische val kan men zo slechts een gemiddelde atomaire afstand bereikendie ongeveer honderd keer groter is dan de DeBroglie golflengte. Een condensaatwerd daarom tot nu toe altijd verkregen door gebruik te maken van verdampings-koelen in een magnetische val. Bij deze koelmethode ontsnappen voortdurend desnelste atomen uit de val waardoor een klein restant van enkele duizenden tot miljoe-nen atomen kan afkoelen tot het condensatiepunt.
Een inelastische atoomspiegel zou mogelijkerwijs de kloof tussen de dichtheid inde magneto-optische val en die van een quantumgas kunnen overbruggen. Dankzijde tweedimensionale geometrie zouden spontaan geemitteerde fotonen bovendienprobleemloos kunnen ontsnappen. Het laden van de optische val kan in principe ookcontinu plaatsvinden. Op deze manier zou een continue atoomlaser als open systeemkunnen bestaan, qua concept vergelijkbaar met de lichtlaser: de voorgekoelde ther-mische atomen dienen als versterkend medium en de optische val vormt de trilholte

Samenvatting / Zusammenfassung 143
voor materiegolven. Door optisch pompen worden atomen toegevoegd aan de reso-nante modes van deze trilholte. Dit proces is optisch gezien weliswaar spontaan,maar wordt door de bosonenstatistiek van de atomen gestimuleerd. De tot dusvergeconstrueerde atoomlasers zijn gebaseerd op het weglekken van atomen uit eenmet behulp van verdampingskoelen geproduceerd condensaat en zijn op hun bestquasicontinu.
Een atoomlaser zou vergelijkbare vooruitgang in de precisie van atoomoptischeexperimenten kunnen opleveren als de ontwikkeling van de lichtlaser. Sinds dezein 1960 voor het eerst door Maiman werd geconstrueerd is hij zelfs in het dagelijksleven doorgedrongen. Zo zijn de bij onze experimenten gebruikte halfgeleiderlaserseigenlijk bedoeld voor CD spelers.
Samengevat levert dit proefschrift een experimentele bijdrage aan de atoomopticavan evanescente spiegels voor koude atomen. De lichtverstrooiing van atomen in hetevanescente veld werd onderzocht voor zowel elastische als inelastische spiegels. Methet oog op alkaliatomen, en 87Rb in het bijzonder, werd een concept ontwikkeld omatomen met gebruik van de inelastische spiegel in een laagdimensionale val over tebrengen.

Zusammenfassung
Mit Laserlicht lassen sich Krafte auf neutrale Atome ausuben, mit welchen diesemanipuliert, vor allem aber auch gekuhlt, beziehungsweise abgebremst werden kon-nen. Ausgehend von den ersten Vorschlagen zur Laserkuhlung von Dehmelt, Hansch,Schawlow und Wineland, 1975, wurde die “Atomoptik” in den letzten Jahren umviele Techniken bereichert. Unter anderem wurde 1997 der Physik-Nobelpreis anChu, Cohen-Tannoudji und Phillips fur ihre Beitrage zu diesem Fachgebiet verliehen.
In Analogie zur elektromagnetischen Lichtwelle wird in der Atomoptik die ato-mare Materiewelle mittels Spiegeln, Linsen, Beugungsgittern und Strahlteilern beein-flußt. Dies ermoglicht beispielsweise hochprazise atominterferometrische Experi-mente, wie zur Bestimmung der Feinstrukturkonstanten. Mit lasergekuhlten Atomenlassen sich auch sehr genaue Atomuhren verwirklichen, die in satellitengestutztenNavigationssystemen eingesetzt werden konnten. Eine Erganzung zur Lichtoptikfindet sich in der Atomlithographie mit dem Schreiben von Strukturen auf Nano-meterskala.
Wahrend in der Optik vielfach Laser als intensive, gut gebundelte und vor allemmonochromatische (koharente) Lichtquellen Verwendung finden, wird in der Atom-optik bislang mit relativ schwachen “atomaren Gluhlampen” gearbeitet. Im ein-fachsten Fall ist dies ein durch eine Serie von Diaphragmen kollimierter Strahl vonAtomen, der aus einem Ofen entweicht. Es gibt allerdings Ansatze zur Verwirk-lichung koharenter Materiewellenquellen, sogenannten “Atomlasern”.
Das “Substrat” atomoptischer Komponenten ist zumeist Laserlicht von genaufestgelegter Intensitat, Polarisation und Lichtfrequenz. Die vorliegende Dissertationbefaßt sich mit Spiegeln fur Rubidiumatome (Isotop 87
37Rb), bei denen ein repulsives“evaneszentes” Lichtfeld fur die elastische Bewegungsumkehr der Atome sorgt. Ins-besondere wird die Lichtstreuung der Atome im evaneszenten Feld untersucht. Dieseermoglicht es als dissipativer Prozeß, Atome auch inelastisch zu reflektieren. Hierfurbesteht keine Analogie mit lichtoptischen Spiegeln.
Wie von Gauck und Kollegen in Konstanz demonstriert, ist es auch moglich,die inelastische Reflexion “vollstandig inelastisch” zu gestalten, sprich, die Atomein einer zweidimensionalen optischen Falle an der Spiegeloberflache anzusammeln.Bei hinreichender Effizienz dieses Transfers in die Falle sollte es prinzipiell moglichsein, ein niedrigdimensionales Quantengas zu erzielen, vergleichbar mit dem Bose-Einstein Kondensat in drei Dimensionen. Dem Phasenubergang vom thermischenGas zum Kondensat beim Unterschreiten einer kritischen Temperatur entsprichtin zwei Dimensionen beispielsweise der bislang noch nicht beobachtete Kosterlitz-Thouless-Ubergang.
144
Samenvatting / Zusammenfassung 145
Vor der Beschreibung unserer Experimente wird im folgenden zunachst das Funk-tionsprinzip eines evaneszenten Atomspiegels erlautert.
Ein evaneszentes Lichtfeld entsteht, wenn Licht an der Grenzschicht zweier dielek-trischer Medien, vom optisch dichteren Medium aus, vollstandig reflektiert wird.In unseren Experimenten geschieht dies an einer horizontalen Glasoberflache imVakuum. Auf der Vakuumseite findet sich ein Lichtfeld, das in Richtung parallelzur Oberflache propagiert. Im Gegensatz zur horizontalen Komponente des Wellen-vektors ist die vertikale Komponente komplex imaginar. Dadurch nimmt die elek-trische Feldstarke mit zunehmendem Abstand von der Oberflache exponentiell ab.Die charakteristische Abfallange des Feldes ist von der Großenordnung der verwen-deten optischen Wellenlange, zum Beispiel 780 nm fur Rubidiumatome. Je weiterder Lichteinfallswinkel den kritischen Winkel der Totalreflexion uberschreitet, destokurzer wird diese Abfallange.
Krafte, die ein Lichtfeld — auch ein evaneszentes — auf Atome ausuben kann,werden im allgemeinen in zwei Kategorien eingeteilt, “spontane Krafte” und “Dipol-krafte”.
Die spontane Kraft basiert auf der wiederholten Absorption und Spontanemissionvon Photonen eines Lichtfeldes, dessen Frequenz auf eine optische Resonanz derAtome abgestimmt, zumindest aber nicht weit davon verstimmt ist. Da die Ab-sorption in aller Regel aus einem gerichteten Laserstrahl erfolgt, sind auch die vomAtom aufgenommenen Photonenruckstoße gerichtet und resultieren in einer Kraft,auch “Strahlungsdruck” genannt. Die Emission der Photonen erfolgt spontan undist im Mittel ungerichtet. Daher ist diese Lichtkraft dissipativ und kann zum Kuhlenverwendet werden. Sie fuhrt aber auch zur Diffusion der Atome.
Die Dipolkraft ist hingegen eine konservative Kraft und kann durch ein “optischesPotential” beschrieben werden. Dieses Potential resultiert aus der Wechselwirkungdes induzierten atomaren elektrischen Dipolmoments mit dem elektrischen Feld. DieDipolkraft ist dispersiv. Das heißt, sie ist attraktiv, wenn die Lichtfrequenz kleinerals die atomare Resonanz ist (Rotverstimmung) und repulsiv im Falle einer großerenFrequenz (Blauverstimmung). Um experimentell tatsachlich eine konservative Kraftzu erzielen, wahlt man eine große Verstimmung. Damit wird die Lichtabsorption,beziehungsweise die spontane Kraft weitgehend unterdruckt.
Ein weit blauverstimmtes evaneszentes Lichtfeld stellt demnach eine Potential-barriere fur Atome dar. Wenn die kinetische Energie eines einfallenden Atoms diemaximale Hohe dieser Barriere nicht uberschreitet, wird die Bewegungsrichtungumgekehrt. Das evaneszente Feld ist dann ein “Spiegel” oder auch ein “Trampolin”fur Atome.
Im Experiment praparieren wir zunachst in einer magneto-optischen Falle eineca. 1 mm durchmessende kalte Rubidiumwolke von etwa 100 Millionen Atomen. DieTemperatur der Wolke ist 10 µK, dicht am Temperaturnullpunkt von −273.15C.Dieser Temperatur entspricht eine mittlere Geschwindigkeit der Atome von wenigencm/s, im Vergleich zu einigen 100 m/s bei Raumtemperatur. (Die magneto-optischeFalle, das Vakuumsystem und die verwendeten Laser werden in den Kapiteln 3 und 4dieser Dissertation im Detail beschrieben.)

146 Samenvatting / Zusammenfassung
Die Rubidiumatome werden aus 5−7 mm Hohe aus der magneto-optischen Falleauf den Atomspiegel fallen gelassen. Wahrend des freien Falls expandiert die Wolkeballistisch und verdoppelt dabei ihren Durchmesser. Da das evaneszente Feld einhorizontal gaußformiges Intensitatsprofil aufweist, ist die effektive Spiegeloberflachedurch das fur eine Reflexion der Atome minimal notwendige optische Potential be-grenzt, und es wird im allgemeinen nur ein Teil der Atome aus der Wolke tatsachlichreflektiert.
Dies haben wir als Spiegeleffizienz in Abhangigkeit der Laserparameter und derTemperatur der Atome untersucht (Kapitel 5). Laserleistung, -verstimmung und-polarisation geben die effektive Spiegeloberflache vor. Mit unserem evaneszentenFeld erreichten wir Spiegeleffizienzen bis zu 8%, in Ubereinstimmung mit berech-neten Vorhersagen. Es zeigte sich, daß die attraktive Van der Waals-Wechselwirkungzwischen Atomen und Glassubstrat das optische Potential erniedrigt und dadurchdie effektive Spiegelflache signifikant verringert.
Der Strahlungsdruck des evaneszenten Feldes laßt sich untersuchen, wenn mandie Bewegung der reflektierten Atome mit einer Kamera beobachtet (Kapitel 6).Die Ursache des Strahlungsdrucks ist die Propagation der Lichtwelle entlang derGlasoberflache. Die Ruckstoße absorbierter Photonen andern die mittlere Geschwin-digkeit der Atome allein in dieser Richtung parallel zur Oberflache. Ein einzel-ner Photonenruckstoß andert die Geschwindikeit um 6 mm/s. Im Experimentbeobachteten wir an reflektierten Atomen seitliche Geschwindigkeiten von 1 cm/sbis zu 18 cm/s, entsprechend 2 bis 31 Ruckstoßen. Im Vergleich dazu betragt dievertikale Geschwindigkeit nach einem Fall aus 6.6 mm Hohe 36 cm/s,
Ein vereinfachendes Modell fur ein Zweiniveau-Atom kann diese Beobachtungenqualitativ erklaren, trotz der tatsachlichen Hyperfeinstruktur der Rubidiumatomemit zwei Grund- und mehreren Anregungszustanden. Die Atome wurden auf einem“geschlossenen” Ubergang optisch angeregt, so daß sie nach jeweils ca. 30 ns wiederin den ursprunglichen Grundzustand zuruck gelangten und weitgehend ungestortein und derselben Potentialkurve im evaneszenten Feld folgten. Dies rechtfertigtdie Vereinfachung auf nur zwei Zustande. Es zeigt sich, daß die gemittelte Zahlder pro Atom aufgenommenen Ruckstoße proportional zur Abfallange des Feldesund zur Geschwindigkeit der Atome ist. Auf einer steilen Potentialbarriere vollziehtsich die Bewegungsumkehr sehr schnell, und ein Atom kann nur wenige Photonenabsorbieren. Je nach eingestellter Abfallange dauert die Reflexion nur 3 − 10 µs.Ein langsameres Atom dringt zudem weniger tief in das evaneszente Feld ein alsein schnelleres Atom und benotigt weniger Zeit fur die Reflexion. Im ubrigen istdie Zahl der absorbierten Photonen umgekehrt proportional zur Laserverstimmung.Sie hangt aber nicht von der Laserintensitat ab. Dies resultiert aus dem exponen-tiellen Verlauf des optischen Potentials, in dem ein Atom unabhangig vom moglicher-weise geanderten Potentialmaximum stets in gleicher Weise zu seinem Umkehrpunktgelangt.
Die Hyperfeinstruktur des Rubidiums haben wir genutzt, um auch inelasti-sche Reflexionen zu beobachten, indem wir das evaneszente Feld bezuglich eines“offenen” optischen Ubergangs abstimmten (Kapitel 7). Ein vom Ausgangszu-stand |1〉 angeregtes Atom kann dann mittels “optischen Pumpens” spontan in
Samenvatting / Zusammenfassung 147
den anderen Hyperfeingrundzustand |2〉 ubergehen. Im Zustand |2〉 besitzt diePotentialbarriere fur das Atom jedoch nur 10% der ursprunglichen Hohe, weil dieFrequenzverstimmung bezuglich der Resonanzen im Zustand |2〉 ungefahr zehnfachgroßer ist. Durch das spontan emittierte Photon “dissipiert” das umgepumpteAtom ca. 90% seiner potentiellen Energie und erreicht nach dieser inelastischenReflexion nur noch 10% der Fallhohe. Kamera-Aufnahmen der reflektierten Atomezeigen in der Schwerpunktsbewegung der Wolke die Inelastizitat des Spiegels. DieWahrscheinlichkeit fur optisches Pumpen ist am großten, wahrend ein Atom sich— beinahe im Stillstand — in großer Lichtintensitat nahe dem Umkehrpunkt befin-det. Dort ist zudem die inelastische Energieabnahme am großten. Die meistenAtome finden sich aufgrund der starken raumlichen Selektivitat des Pumpvorgangsmaximal abgebremst.
Dank dieser Selektivitat kann ein inelastischer Spiegel genutzt werden, um Ato-me, die zunachst in einer relativ ausgedehnten magneto-optischen Falle prapariertwurden, effizient in einer sehr dunnen, zweidimensionalen optischen Falle dicht beider Glasoberflache anzusammeln (Kapitel 2). Dem Potential fur Atome im in-elastisch reflektierten Endzustand |2〉 muß hierzu ein “Potentialtopf”, die optischeFalle, aufgepragt werden. In dieser werden die umgepumpten Atome gebunden. Einewichtige Konsequenz aus dem dissipativen Charakter des Pumpvorgangs ist, daßdie Dichte der so angesammelten Atome die ursprungliche Dichte in der magneto-optischen Falle — bei gleichbleibender Temperatur — ummehrere Großenordnungenubersteigen kann. Bei hinreichender Transfereffizienz in die Falle sollte es moglichsein, in einem einzigen, optisch spontanen Vorgang und ohne weiteres Nachkuhlenein niedrigdimensionales “Quantengas” zu erzeugen. Dies wird im Folgenden ab-schließend erlautert.
Ein Quantengas liegt vor, wenn bei hinreichend großer Dichte und niedrigerTemperatur die Wellenfunktionen der Atome einander uberlappen. (Bei 10 µKTemperatur ist die DeBroglie-Wellenlange fur Rubidium beispielsweise 60 nm.) Indiesem Fall muß man in der Beschreibung der Atome von der klassischen Boltzmann-Statistik zur Quantenstatistik nicht unterscheidbarer Bosonen oder Fermionen uber-gehen. Fur Bosonen, 8737Rb ist mit ganzzahligem Spin ein solches, formt sich beimUnterschreiten einer kritischen Temperatur das schon 1924 vorhergesagte Bose-Einstein Kondensat. Im Kondensat findet sich eine große Zahl von Atomen ineinem einzigen, makroskopisch besetzten Zustand, einem beinahe mit bloßem Augesichtbaren Quantenobjekt. Erstmals gelang der experimentelle Nachweis in einematomaren Gas Anderson und Kollegen, 1995, in Boulder.
Mit optischen Kuhlverfahren ist es bislang nicht gelungen, ein Quantenengaszu erzeugen. Das Problem liegt an den fur die Dissipation essentiellen spontanemittierten Photonen. Deren Ruckstoße und auch die Wiederabsorption durchumgebende Atome limitieren die erreichbare Temperatur. In einer magneto-opti-schen Falle erreicht man beispielsweise einen mittleren Atomabstand entsprechendder 100-fachen DeBroglie-Wellenlange. Kondensate wurden deshalb generell durchVerdampfungskuhlen in einer magnetischen Falle erzeugt, wobei die schnellstenAtome aus der Falle entschnappen, “verdampfen”, und so ein kleiner Rest von eini-gen Tausend bis Millionen Atomen bis zur Kondensation abkuhlt.
148 Samenvatting / Zusammenfassung
Ein inelastischer Atomspiegel konnte die Dichtheitslucke von der magneto-opti-schen Falle zum Quantengas uberspannen. Dank der zweidimensionalen Geometriekonnen spontane Photonen zudem schadlos entweichen. Das Laden der optischenFalle kann prinzipiell auch kontinuierlich erfolgen. Auf diese Weise ist in konzep-tioneller Analogie zum Lichtlaser ein kontinuierlicher Atomlaser als offenes Systemdenkbar: Als Verstarkungsmedium dienen (vorgekuhlte) thermische Atome, unddie optische Falle formt den Materiewellenresonator. Optisches Pumpen fuhrt denResonatormoden Atome zu. Dieser Prozeß ist zwar optisch spontan, wird aberdurch die Quantenstatistik der Atome bosonisch stimuliert. Bislang demonstrierteAtomlaser basieren auf dem “Auslaufen” von Atomen aus einem einmalig durchVerdampfungskuhlen in einer Magnetfalle erzeugten Kondensat und sind bestenfallsquasikontinuierlich.
Ein Atomlaser konnte in der Prazision atomoptischer Experimente vergleichbareFortschritte bringen wie die Entwicklung des Lichtlasers, der 1960 erstmals vonMaiman demonstriert wurde und inzwischen bis ins Alltagsleben vorgedrungen ist.CD-Spieler enthalten beispielsweise eine vergleichbare Laserdiode, wie wir sie zumKuhlen unserer Atome verwenden.
Zusammenfassend liefert die vorliegende Dissertation einen experimentellen Bei-trag zur Atomoptik mit evaneszenten Spiegeln fur kalte Atome. Es wurde dieLichtverstreuung von Atomen im evaneszenten Feld sowohl fur elastische wie inelasti-sche Spiegel untersucht. Mit Blick auf Alkali-Atome, 87Rb im besonderen, wurdeunter Nutzung des inelastischen Spiegels ein Konzept entwickelt, um Atome unterminimalen Verlusten in eine niedrigdimensionale optische Falle zu transferieren.

Nawoord
Op deze plaats wil ik graag alle mensen van harte bedanken die mij tijdens delaatste jaren bij het werk en in prive altijd hebben aangemoedigd en geholpen. Eenonderzoek zoals in dit boek beschreven is al gauw te complex om door een enkelepromovendus te kunnen worden uitgevoerd. Zo wil ik vooral mijn promotoren Benvan Linden van den Heuvell en Robert Spreeuw bedanken voor hun vertrouwenwaarmee zij mij, in 1995, in een volstrekt kale experimenteerkamer het onderzoeklieten beginnen. Stefan Petra kwam er al gauw bij als eerste stagestudent, gevolgddoor Esther Schilder, Rik Jansen en nu Aaldert van Amerongen, samen met mijncollega promovendi Bas Wolschrijn, Ronald Cornelussen, en onze postdoc NandiniBhattacharya. Frederik de Jong zat er al aan het laseren zonder inversie en hadaltijd goed advies waar en bij wie je moet wezen. Cor Snoek wist altijd ergens eenoud apparaat met tandwielen erin te vinden waartegen menig nieuw apparaat hetzou moeten afleggen. Maar het leukst waren zijn verhalen erbij, uit het verleden vanhet laboratorium. Jullie allen bedankt voor de goede samenwerking en de geduldmet de lasertjes.
Mijn begeleiders Ben en Robert waren letterlijk altijd gereed voor enthousiastoverleg en advies. Robert wist op elk experimenteel en natuurkundig probleem eenmogelijke oplossing. Hij keerde elke formule en elk apparaat binnenste buiten omtot de kern van de zaak door te dringen.
Ben kun je zo een probleem van welke makelij dan ook naar het hoofd gooien, hetwordt onmiddellijk naar Mathematica vertaald en het antwoord komt meteen terug,zij het vaak wat impliciet. Maar dit maakte de navolgende uitleg des te leuker envergrootte het inzicht in het probleem.
Een experiment werkt niet zonder apparatuur. Daarom een dank aan al de col-lega’s die in de werkplaatsen hun vakkennis zo enthousiast hebben ingebracht. Florisvan der Woude, Willem van Aartsen, Fred van Anrooij, Martin Bijlsma en JeroenJacobs hebben ons met van alles voorzien, van “kikkers” tot de allerfijnste mechani-ca zoals Floris’ stokpaardje, de gleufscharnieren. Soms kwamen zij weliswaar dewanhoop nabij als ik weer eens niet begreep dat een centimeter duizend honderdstemillimeter bevat en geen een meer of minder.
Alof Wassink, Johan te Winkel, Flip de Leeuw, Edwin Baaij en Theo vanLieshout hebben ons vanuit de elektronica afdeling voorzien van alles wat er tussende millivolten en kilovolten kan gebeuren. In het kort, elektronica die werkt!
Brengen scherven geluk? Bij het vermijden ervan hebben Bert Zwart, EddyInoeng en Michiel Groeneveld ons met hun vaardigheden in de glasbewerking zeergeholpen.
Niets werkt meer zonder computers. Als u dit proefschrift leest, is dit het bewijsdat ze tot het laatste moment van mijn onderzoek ook daadwerkelijk werkten. Dit iste danken aan de inzet van Derk Bouhuijs en Marc Brugman van de systeemgroep.
149
Ze worden niet eens boos als je ’s avonds nog met een probleem van “eigen schuld”komt opdagen. Nee, ze lossen het zelfs op ook! Eerder kregen we ook al veel hulpvan Henk Pot, Jaap Berkhout, Paul Langemeier en Thijs Post.
Apparatuur wil ook besteld worden, waarbij we vooral veel steun kregen vanIrma Brouwer, Dick Jensen, Andries Porsius, Ineke Baaij, en Jenne Zondervan. Inhet bijzonder wil ik Mariet Bos bedanken, die geduldig achter elk probleem rondmijn status als promotiebursaal is aangegaan.
Natuurlijk was er ook interactie met collega’s van buiten onze groep. In hetbijzonder wil ik Kai Dieckmann, Igor Shvarchuk, Matthias Weidemuller en MartinZielonkowski danken, met wie we menig idee en onderdeel hebben geruild tijdenshet opbouwen van onze experimenten. Ook de ontmoetingen tijdens het “quantum-collectief” met onder andere Pepijn Pinkse, Allard Mosk, Peter Fedichev, TomHijmans, Pavel Bushev, Merrit Reynolds, Jook Walraven, Gora Shlyapnikov, PaulTol, Norbert Herschbach, Wim Vassen en Wim Hogervorst, had ik niet willenmissen. Net zo min als de gezellige sfeer rond de koffietafel met Lotty Gillieron,Ton Raassen, Peter Uylings, Arnold Donszelmann, Jørgen Hansen, Gilles Verbock-haven, Ton Schuitemaker, Charlie Alderhout en Ronald Winter. Voor mij warende doorgenomen gespreksonderwerpen hier ook een eerste verkenning van de Ned-erlandse samenleving. Er waren nog vele anderen, die het werken aan het Van derWaals Zeeman Instituut zo leuk maakten, om met Erik-Paul, Heidi, Huib, Klaas,Allan, Marc, Eline, Gijs, Frank en Mischa maar enkele namen te noemen.
Tot slot moest ook nog dit boek geschreven worden. Voor het geduldig en heel ergconstructief becommentarieren van telkens weer nieuwe versies van het manuscriptwil ik aan Robert en Ben en aan Jante Salverda mijn dank uitspreken. Robertleverde met een publicatie de grondslag van hoofstuk twee. De technische tekenin-gen zijn als vereenvoudigde versies afkomstig van de ontwerpen van Floris van derWoude. Aan Bas Wolschrijn zijn de leuke plaatjes van inelastisch stuiterende atomenin hoofdstuk 7 te danken, en de leesbaarheid van de Nederlandse samenvatting komtdoor Jantes vertaalkunsten.
Ook was er leven buiten de experimenteerkamer: Hier mochte ich vor allemJante fur ihre Geduld und Unterstutzung danken, die sie stets fur mich und meineunplanbaren Vorhaben, wie “Windsurfen gehen, wenn Wind ist”, aufbringt. WennWind war, bekam ich tatkraftige Unterstutzung von Arnd, bei der Suche nach deneinzig wahren, koharenten, hollandischen Materiewellen.
Meinen Eltern, Sieglinde und Edgar, gilt hier schließlich der großte Dank. Ohnesie hatte ich meinen Weg bis zur Promotion in Amsterdam so nicht gehen konnen.
150

Curriculum Vitae
Dirk Voigtgeboren 23 Mei 1969 te Tubingen (Duitsland)
In 1988 deed ik Abitur (eindexamen) aan het Thomas-Mann gymnasium te Lubeck.Na voldaan te hebben aan de Duitse dienstplicht begon ik in oktober 1989 de studienatuurkunde aan de Rheinisch-Westphalische Technische Hochschule (RWTH), deuniversiteit te Aken. In 1991 legde ik de examens van het Vordiplom af en begonik met de Hauptstudium. Naast de verplichte vakken zoals theoretische en experi-mentele fysica volgde ik als keuzevakken lasertechniek, atoom- en molecuulfysica envaste stoffysica. Hiernaast begeleidde ik als studentassistent studenten bij werkcol-leges van het vak experimentele fysica.
Voor de 12 maanden durende Diplomarbeit (stage) koos ik voor het vakgebiedquantumoptica. In de groep van prof. dr. J. Mlynek aan de Universitat Konstanzwerkte ik mee aan atoom-optische experimenten met bundels van metastabiele he-lium atomen. In het bijzonder hield ik me bezig met een techniek van coherentaanslaan van deze atomen om een verstrengeld atoom−foton paar te verkrijgen.In Juni 1995 verkreeg ik aan de RWTH het diploma natuurkunde met het titelDiplom-Physiker.
In November 1995 begon ik in het Van der Waals-Zeeman Instituut aan deUniversiteit van Amsterdam als “promotiebursaal met bijbaan” onder leiding vanprof. dr. H.B. van Linden van den Heuvell en dr. R.J.C. Spreeuw een promotie-onderzoek aan spiegels van evanescent licht voor koude atomen. In het beginhield het experimentele gedeelte vooral het opzetten van diodelaser-, vacuum- encomputerapparatuur in. De resultaten van het onderzoek staan beschreven in ditproefschrift. De “bijbaan” omvatte het begeleiden van studenten gedurende hetatoomfysica practicum en tijdens het verrichten van hun stage in onze groep.
Tijdens mijn promotieonderzoek volgde ik in 1998 de Enrico Fermi zomerschoolBose-Einstein condensation in atomic gases te Varenna (Italie). Daarnaast bezochtik een aantal conferenties met mondelinge presentaties of posterbijdragen: in 1999de 14e internationale conferentie voor laserspectroscopie (ICOLS99) te Innsbruck,in 2000 de 17e int. conf. voor atoomfysica (ICAP2000) te Florence, en de jaar-lijkse vergaderingen van de sectie atoomfysica en quantumelektronica van de Neder-landse Natuurkundige Vereniging en van de sectie quantumoptica van de DeutschePhysikalische Gesellschaft.
151
Publications
• C.R. Ekstrom, C. Kurtsiefer, D. Voigt, O. Dross, T. Pfau, and J. Mlynek,Coherent excitation of a He∗ beam observed in atomic momentum distributions,Opt. Comm. 123, 505 (1996).
• C. Kurtsiefer, O. Dross, D. Voigt, C.R. Ekstrom, T. Pfau, and J. Mlynek,Observations of correlated atom-photon pairs on the single particle level,Phys. Rev. A 55, R2539 (1997).
• R.J.C. Spreeuw, D. Voigt, B.T. Wolschrijn, and H.B. van Linden van denHeuvell, Creating a low-dimensional quantum gas using dark states in an in-elastic evanescent-wave mirror, Phys. Rev. A 61, 053604 (2000).
• D. Voigt, B.T. Wolschrijn, R. Jansen, N. Bhattacharya, R.J.C. Spreeuw, andH.B. van Linden van den Heuvell, Observation of radiation pressure exertedby evanescent waves, Phys. Rev. A 61, 063412 (2000).
• D. Voigt, E.C. Schilder, R.J.C. Spreeuw, and H.B. van Linden van den Heuvell,Characterisation of a high-power tapered semiconductor amplifier system,accepted for publication in Appl. Phys. B [preprint arXiv:physics/0004043].
• D. Voigt, B.T. Wolschrijn, R.A. Cornelussen, R. Jansen, N. Bhattacharya,H.B. van Linden van den Heuvell, and R.J.C. Spreeuw, Elastic and inelasticevanescent-wave mirrors for cold atoms, to be published in Comptes Rendusde l’Academie des Sciences [preprint arXiv:physics/0011005].
152


![University of Electro-Communications - Ridged atomic mirrors ...dima/PAPERS/nanoscope.pdfof light fields [3], evanescent optical wave [4–6] or static electric or magnetic fields](https://static.fdocuments.us/doc/165x107/611a1846968b9e2d485fc96e/university-of-electro-communications-ridged-atomic-mirrors-dimapapers-of.jpg)