EVALUATION REPORT School District Student Transportation
81
OFFICE OF THE LEGISLATIVE AUDITOR STATE OF MINNESOTA EVALUATION REPORT School District Student Transportation JANUARY 2008 PROGRAM EVALUATION DIVISION Centennial Building – Suite 140 658 Cedar Street – St. Paul, MN 55155 Telephone: 651-296-4708 ● Fax: 651-296-4712 E-mail: [email protected] ● Web Site: http://www.auditor.leg.state.mn.us Through Minnesota Relay: 1-800-627-3529 or 7-1-1 O L A
Transcript of EVALUATION REPORT School District Student Transportation

OFFICE OF THE LEGISLATIVE AUDITOR STATE OF MINNESOTA
EVALUATION REPORT
School District Student Transportation JANUARY 2008
PROGRAM EVALUATION DIVISION Centennial Building – Suite 140 658 Cedar Street – St. Paul, MN 55155 Telephone: 651-296-4708 ● Fax: 651-296-4712 E-mail: [email protected] ● Web Site: http://www.auditor.leg.state.mn.us Through Minnesota Relay: 1-800-627-3529 or 7-1-1
O L A

Program Evaluation Division The Program Evaluation Division was created within the Office of the Legislative Auditor (OLA) in 1975. The division’s mission, as set forth in law, is to determine the degree to which state agencies and programs are accomplishing their goals and objectives and utilizing resources efficiently. Topics for evaluations are approved by the Legislative Audit Commission (LAC), which has equal representation from the House and Senate and the two major political parties. However, evaluations by the office are independently researched by the Legislative Auditor’s professional staff, and reports are issued without prior review by the commission or any other legislators. Findings, conclusions, and recommendations do not necessarily reflect the views of the LAC or any of its members. A list of recent evaluations is on the last page of this report. A more complete list is available at OLA's web site (www.auditor.leg.state.mn.us), as are copies of evaluation reports. The Office of the Legislative Auditor also includes a Financial Audit Division, which annually conducts an audit of the state’s financial statements, an audit of federal funds administered by the state, and approximately 40 audits of individual state agencies, boards, and commissions. The division also investigates allegations of improper actions by state officials and employees.
Evaluation Staff James Nobles, Legislative Auditor Joel Alter Valerie Bombach David Chein Christina Connelly Jody Hauer Daniel Jacobson David Kirchner Carrie Meyerhoff Deborah Parker Junod Katie Piehl Judith Randall Jo Vos John Yunker To obtain a copy of this document in an accessible format (electronic ASCII text, Braille, large print, or audio) please call 651-296-4708. People with hearing or speech disabilities may call us through Minnesota Relay by dialing 7-1-1 or 1-800-627-3529. All OLA reports are available at our web site: http://www.auditor.leg.state.mn.us If you have comments about our work, or you want to suggest an audit, investigation, or evaluation, please contact us at 651-296-4708 or by e-mail at [email protected]
Printed on Recycled Paper

Room 140 Centennial Building, 658 Cedar Street, St. Paul, Minnesota 55155-1603 • Tel: 651-296-4708 • Fax: 651-296-4712 E-mail: [email protected] • Web Site: www.auditor.leg.state.mn.us • Through Minnesota Relay: 1-800-627-3529 or 7-1-1
OFFICE OF THE LEGISLATIVE AUDITOR STATE OF MINNESOTA • James Nobles, Legislative Auditor January 2008 Members of the Legislative Audit Commission: During the 2005-06 school year, school districts spent approximately $446 million to transport hundreds of thousands of students to and from various school activities. It is a complex function that requires strong management and constant concern for safety. We found wide variation in performance among districts—from excellent to poor—and several deficiencies in the way the Minnesota Department of Public Safety (DPS) manages its school bus safety responsibilities. As a result, we make several recommendations related to management and safety. To improve school districts’ management of student transportation, we recommend that the Minnesota Department of Education develop, and school districts follow, best management practices. To improve safety, we recommend that DPS improve its bus inspection data systems and conduct more safety inspections that include drivers as well as buses. We also recommend that the Legislature increase the qualifications required for drivers of smaller vehicles used to transport students and require DPS to review a sample of driver files during their annual vehicle inspections. This report was researched and written by Judy Randall (project manager), Katie Piehl, and Sarah Roberts. The departments of Education and Public Safety cooperated fully with our evaluation. Sincerely, James Nobles Legislative Auditor
O L A

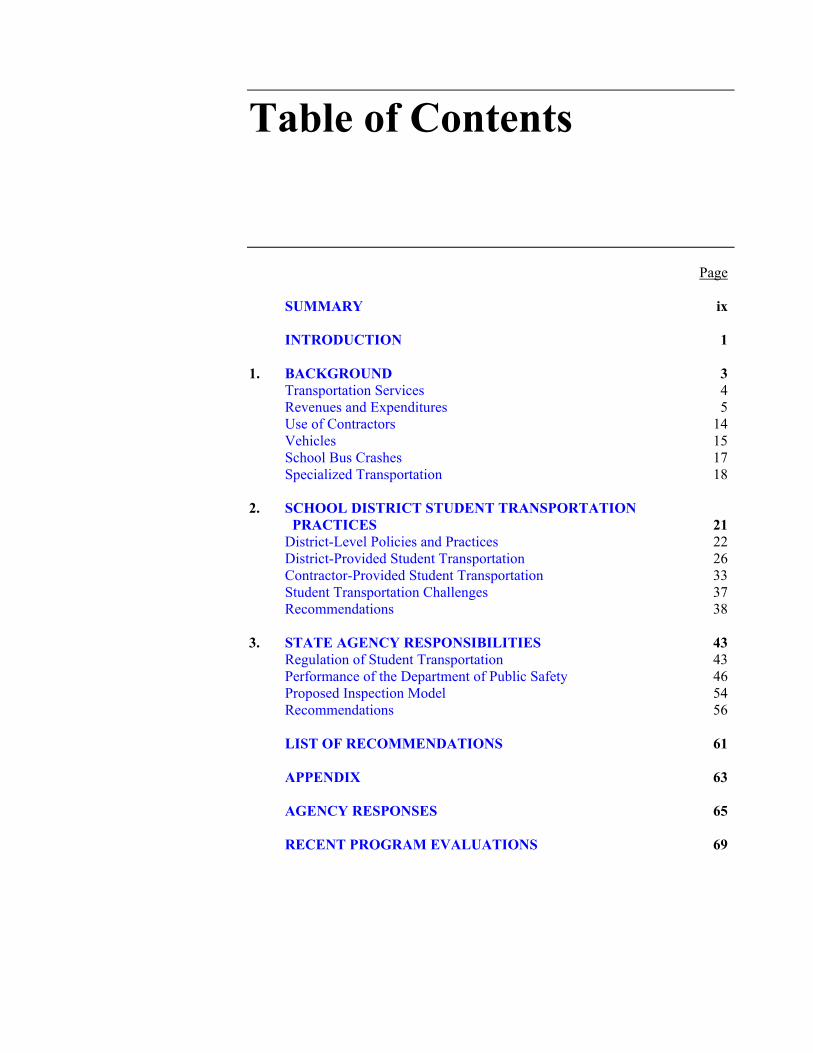
Table of Contents
Page SUMMARY ix INTRODUCTION 1 1. BACKGROUND 3 Transportation Services 4 Revenues and Expenditures 5 Use of Contractors 14 Vehicles 15 School Bus Crashes 17 Specialized Transportation 18 2. SCHOOL DISTRICT STUDENT TRANSPORTATION PRACTICES 21 District-Level Policies and Practices 22 District-Provided Student Transportation 26 Contractor-Provided Student Transportation 33 Student Transportation Challenges 37 Recommendations 38 3. STATE AGENCY RESPONSIBILITIES 43 Regulation of Student Transportation 43 Performance of the Department of Public Safety 46 Proposed Inspection Model 54 Recommendations 56 LIST OF RECOMMENDATIONS 61 APPENDIX 63 AGENCY RESPONSES 65 RECENT PROGRAM EVALUATIONS 69


List of Tables and Figures
Tables Page 1.1 Types of Student Transportation Revenues 6 1.2 Difference Between Revenues and Expenditures as a Percentage of
Revenues, by Provider of Student Transportation, 1997 to 2006 10 1.3 Difference Between Revenues and Expenditures as a Percentage of
Revenues, by Size and Location of School District, 1997 to 2006 12 1.4 School Districts in the Twin Cities Area with More Than 5,000
Enrolled Students that Collected Fees for Transportation, 2006 14 1.5 Student Transportation Vehicle Types 16 2.1 District-Level Best Practices for Student Transportation 23 2.2 School Bus Driver Qualification Requirements 27 2.3 Best Practices for School Districts that Provide Student
Transportation 29 2.4 Best Practices for School Districts that Contract for Student
Transportation 34 3.1 School Bus Inspections, Violations, Point Deductions, and
Out-of-Service Decisions, 2002 to 2007 49 3.2 Percentage of School Bus Inspection Violations by Point Value
and Year, 2002 to 2007 50 3.3 School Bus Inspections by Out-of-Service Designation and Points
Deducted, 2006 and 2007 51 Figures 1.1 Transportation Expenditures and Estimated Revenues, Fiscal Years
1996 to 2006 8 A.1 School District Site Visit Locations 64


Summary
Major Findings: ● Minnesota school districts spent
$446 million on student transportation in the 2005-06 school year (pp. 8-9).
● School districts’ transportation management practices range from excellent to poor (pp. 22-37).
● Most school districts verify that their school bus drivers are qualified but some do not (p. 28).
● School districts do not provide sufficient oversight of drivers of “type III” vehicles (cars, station wagons, and vans) (p. 31).
● Some districts follow best practices in contracting for transportation services, but others fall far short (pp. 33-37).
● The Department of Public Safety has several significant deficiencies in the way it manages its school bus safety responsibilities (pp. 47-54).
● The Department of Public Safety provides minimal oversight of school bus drivers (p. 51).
● The Department of Public Safety’s school bus inspection data system is of limited use to inspectors and supervisors, and data are incomplete and inconsistent (p. 53).
Recommendations: ● The Department of Education
should develop, distribute, and ensure compliance with school district student transportation best practices (p. 39).
● The Department of Education should provide transportation contracting guidelines and a model transportation contract for school districts (p. 39).
● School districts should follow student transportation best practices and contract guidelines to ensure adequate oversight of student transportation (p. 40).
● The Legislature should require additional qualifications for drivers of type III vehicles (p. 41).
● The Department of Public Safety should improve student transportation safety by: (1) ensuring that its inspectors provide consistent and thorough school bus inspections and (2) conducting more inspections that include bus drivers (p. 56).
● The Legislature should require the Department of Public Safety to review a sample of driver files during its annual student transportation vehicle inspections (p. 57).
Improvements are needed in student transportation management and safety practices.

x SCHOOL DISTRICT STUDENT TRANSPORTATION
Report Summary During the 2005-06 school year, Minnesota school districts spent almost $446 million on student transportation, including bus driver salaries, vehicle maintenance, and contracts with private carriers who provide student transportation for many school districts in the state.
Beginning in 1997, the Legislature changed how it funds student transportation. Prior to fiscal year 1997, school districts received dedicated funding for student transportation. Starting with the 1996-97 school year, most transportation funding was rolled into school districts’ general education revenues. As a result, transportation funding is now included in districts’ general operating budget, and districts have increased discretion as to how they use these funds. According to school district staff, some school districts have delayed bus purchases, extended student walk distances, and expanded fees for transportation as a result of these funding changes.
School districts vary significantly in how they provide, manage, and oversee student transportation. While many school districts do an excellent job, others do not ensure that school bus drivers are qualified or adequately oversee the contractors who provide transportation for their district. Additionally, we found that there are deficiencies in how the Department of Public Safety (DPS), the state agency responsible for school transportation safety in Minnesota, manages its school bus safety responsibilities.
This report makes several recommendations to improve student transportation. We set forth student transportation best practices for school districts to follow and recommend that
the Department of Education (MDE) develop additional best practices and a model contract. We also recommend that DPS provide more consistent school bus inspections and increase its oversight of bus drivers.
Some school districts adequately oversee their student transportation operations but others do not.
To learn more about how school districts manage their student transportation, we conducted a survey of all school districts in the state. Almost 95 percent of school districts responded to our questionnaire regarding student transportation policies, driver oversight, and vehicle maintenance. To get a more in-depth view of student transportation, we also visited 34 school districts, including districts in the Twin Cities area and districts across the state, such as La Crescent-Hokah, Pipestone, Roseau, and St. Louis County.
Most of the school districts we visited that directly provided student transportation had complied with the law that requires districts to annually verify that their drivers were qualified to drive a school bus. Many school districts verified their drivers’ licenses more frequently. For example, the Windom School District reviews its school bus drivers’ motor vehicle records twice a year; Eden Prairie reviews its school bus drivers’ records at least four times each year.
In contrast, two school districts we visited did not verify their drivers’ licenses, and staff in one district said they “try” to verify drivers’ licenses annually but had no record of doing so. Three additional districts responded in our questionnaire that they do not verify their drivers’ licenses. Because these districts do not verify the validity of their school
School districts and the state have important student transportation responsibilities.

SUMMARY xi
bus drivers’ licenses, they do not know whether their drivers are qualified to drive a school bus.
A few districts we visited also did not adequately oversee the drug and alcohol tests required for their drivers. Three districts we visited either did not receive the results of their drivers’ drug and alcohol tests or did not conduct required pre-employment tests.
School districts’ contracting practices varied significantly.
Through our site visits, we found that school districts’ contracts with their private carriers differed substantially. For example, the St. Paul School District had a nearly 200-page contract with detailed specifications, while another district had no written contract; a third district had a one-page contract that only contained payment rates. Without a written contract or performance specifications, school districts have little leverage to ensure adequate service.
School districts’ oversight of private contractors ranged from excellent to inadequate. For example, one superintendent who manages his district’s student transportation said he had “no clue” as to who his district’s school bus drivers were or their backgrounds; a superintendent from another district said part of why the district contracts for transportation is to have one less thing to worry about. Fifteen of the 24 districts we visited that used a contractor for student transportation did not ensure that their contractor annually verified its drivers’ licenses. In contrast, five districts we visited either received copies of their contractors’ motor vehicle record reviews or reviewed the driver files directly.
In addition, 19 of the 24 school districts we visited that used contractors did not verify that the drivers were subject to random drug and alcohol tests, nor did they learn of the test results. One district said that if they trusted the contractor to transport their students, they could probably trust the contractor to conduct the substance abuse tests. In contrast, the New Ulm School District requires its contractor to provide an annual summary outlining its drivers’ drug and alcohol test results. The summary includes the number of drivers in the testing pool, the number of tests conducted, and the test results.
There are few requirements for drivers of type III vehicles.
According to responses to our questionnaire, more than three-fourths of districts own at least one type III vehicle. Among these school districts, 80 percent said they used type III vehicles for special education transportation, 84 percent said they used these vehicles for special activities, and 22 percent said they used them for regular transportation.
In contrast to traditional school bus drivers, there are few requirements for drivers of type III vehicles. Unlike school bus drivers, type III drivers are not required to have a school bus endorsement, pass a biennial physical, undergo a background check, receive annual training, or submit to testing for controlled substances. Drivers of type III vehicles are only required to have a valid class D license, the standard license needed to drive a car.
School districts need additional guidance regarding student transportation.
Many school districts are confused about their student transportation responsibilities. For example, some
Some districts that use private student transportation carriers do not have written contracts.
Many districts do not ensure their private contractors verify that drivers are properly licensed and tested for drug and alcohol use.

xii SCHOOL DISTRICT STUDENT TRANSPORTATION
districts misinterpret rules regarding homeless student transportation; others incorrectly calculate the distance between students’ homes and schools. Staff from several districts we visited said it would be helpful to have a model contract to know what topics they should consider when entering into a student transportation contract.
MDE provides some assistance to school districts regarding student transportation. The department holds monthly meetings to discuss a variety of issues related to student transportation. MDE also provides information to districts regarding their obligations for transporting nonpublic, charter school, open enrollment, and homeless students. Nevertheless, as evidenced through our site visits and responses to our questionnaire, many school district transportation staff do not fully understand their obligations.
There are several shortcomings in the Department of Public Safety’s management of its school bus safety program.
In Minnesota, DPS is the primary state agency responsible for school transportation safety. By law, DPS is required to annually inspect all student transportation vehicles. DPS may also conduct unannounced inspections at any time, which may include the driver.
During the annual inspections, DPS identifies violations and, depending on their number and severity, may put a bus “out of service” until all violations are corrected. On average, about 18 percent of DPS inspections resulted in some violations; 5 percent resulted in a vehicle being put out of service.
However, we found several problems with how DPS manages its school bus safety responsibilities. For example,
the school bus inspection data collected by the department indicated that almost 25 percent of the vehicles that should have been put out of service (and therefore not allowed to be driven until all violations were corrected) were not recorded as out of service. DPS officials could not demonstrate whether this is simply a data error or if buses were not put out of service as required by law.
Some school district staff with whom we met indicated that school buses were not put out of service as required. According to staff from one district we visited, the district had a bus with a significant violation that should have resulted in the bus being put out of service. According to district staff however, the inspector simply told the district personnel to fix the defect. The inspector did not put the bus out of service (as required by law) nor did he reinspect the vehicle to ensure that the problem had been fixed.
Finally, not all school bus inspectors ensure that carriers (school districts that provide transportation or private contractors) are providing sufficient driver oversight. For example, all school bus carriers are required by law to annually verify the validity of their drivers’ licenses and ensure that their drivers are qualified to drive a bus. However, as noted above, we found some school districts that do not do this. DPS personnel said that while some school bus inspectors review carriers’ driver files to ensure that they are following the law, others do not. Although DPS has the authority to review these files, Minnesota statutes do not require the department to do so.
DPS and school districts have not provided sufficient oversight of school bus drivers.
The Department of Public Safety does not adequately document actions that result from bus inspections.

Introduction
tudent transportation is an important school district function; almost 700,000 students were eligible for student transportation in the 2005-06 school year.
In that year, school districts spent $446 million on student transportation, including school bus drivers’ salaries, vehicle maintenance, and contracts with private carriers who provide student transportation for many school districts across the state.
Both the departments of Education and Public Safety play a role in school district student transportation. The Minnesota Department of Education (MDE) is responsible for collecting and reporting student transportation usage and expenditure data. The State Patrol in the Department of Public Safety (DPS) is responsible for overseeing school transportation safety. By law, DPS is required to inspect all student transportation vehicles annually. The department also oversees student transportation carriers (school districts and nonpublic schools that provide student transportation and private contractors) and drivers.
Beginning in fiscal year 1997, the Legislature significantly changed how it funded student transportation.1 Prior to 1997, school districts received dedicated funding for transportation. Starting in the 1996-97 school year, most student transportation funding was rolled into school districts’ general education revenues. School districts no longer receive dedicated funding for regular transportation and are given more discretion as to how they use these funds. As a result of this funding change and budget pressures, some school districts have extended student walk distances, delayed bus purchases, and expanded fees for student transportation.
In April 2007, the Legislative Audit Commission directed the Office of the Legislative Auditor to evaluate school district student transportation. We addressed the following questions:
• What are the recent trends in student transportation funding, contracting, and vehicle characteristics?
• How well do school districts manage their student transportation needs?
• Are state efforts to ensure the safety of student transportation effective?
1 Fiscal year 1997 runs from July 1, 1996, through June 30, 1997. Throughout this report, with the exception of Chapter 3, years or fiscal years refer to the corresponding school years. For example, “fiscal year 1997” and “1997” refer to the 1996-97 school year.
S

2 SCHOOL DISTRICT STUDENT TRANSPORTATION
To answer these questions, we relied on several sources of information. We obtained and analyzed data from MDE to learn about school districts’ transportation revenues and expenditures and how these have changed over the past 11 years. We also spoke with department and legislative staff who were familiar with these funding changes and their impact.
We surveyed all school districts in the state to learn more about each district’s transportation policies and practices; staff from almost 95 percent of school districts responded to our questionnaire. To learn about districts’ practices in more depth, we conducted site visits of 34 school districts across the state. We selected school districts to visit based on a number of criteria, including student enrollment and location, whether the district used a contractor or provided transportation services directly, and the district’s transportation expenditures per pupil. School districts we visited were located across the state and included the Anoka-Hennepin, La Crescent-Hokah, Pipestone, Roseau, South St. Paul, and St. Louis County school districts. Finally, we spoke with members of the Minnesota Association for Pupil Transportation, representatives from the Minnesota School Bus Operators’ Association, and a group of school bus drivers.
To learn more about DPS’s role in student transportation, we obtained and analyzed the department’s school bus inspection databases from 2002 through the present. We also interviewed State Patrol staff responsible for school bus inspections and observed some school bus inspections. Finally, we reviewed federal and state laws regarding student transportation.
This report is divided into three chapters. Chapter 1 provides an overview of school district student transportation in the state and discusses the trends in student transportation over the past 11 years, including changes in revenues and expenditures, contracting, vehicles, school bus crashes, and specialized transportation. Chapter 2 discusses how school districts manage their student transportation operations. In this chapter we compare school districts’ actual practices to student transportation best practices. Finally, Chapter 3 discusses how well the state ensures school bus safety. In this chapter, we particularly focus on the role DPS plays in ensuring that school buses and drivers are safe and comply with the law. Chapters 2 and 3 contain recommendations directed to the Legislature, the departments of Education and Public Safety, and school districts. The Appendix at the back of the report lists the school districts that we visited as part of our evaluation.

Background
SUMMARY
In fiscal year 1997, funding for regular student transportation changed from a dedicated funding stream to being included in school districts’ general education revenues. School district transportation revenues and expenditures have increased since this change was implemented, although special education transportation accounts for much of this growth. School districts’ use of private contractors has remained relatively constant over the past 11 years. The number of bus crashes has declined since 2000; however, school districts’ fleets have gotten older and carriers are using more, and smaller, vehicles to transport students.
tudent transportation is a fundamental school district responsibility. While most of the transportation operating details are left to school districts, the
Legislature has set forth some basic requirements that all districts must follow. Minnesota statutes outline what transportation services school districts must provide and which students districts must transport. Statutes also outline the state funding for student transportation, which changed significantly in the mid-1990s.
In this chapter, we address the following questions:
• What transportation services must school districts provide? Who provides the transportation, and what students are eligible for services?
• What changes has the Legislature made to student transportation funding policies since 1996? How have student transportation revenues and expenditures changed since 1996?
• To what extent do school districts contract for student transportation and how has this changed over time? How have the age and number of school buses and school bus crashes changed over time?
To address these questions, we reviewed Minnesota statutes regarding student transportation funding and school district responsibilities. We also met with staff from the Minnesota Department of Education (MDE) and the Legislature to discuss the history of student transportation and its funding. We analyzed data school districts report to MDE regarding revenues, expenditures, vehicles, and miles traveled. We analyzed data from the Department of Public Safety (DPS) to evaluate trends regarding vehicle age and school bus crashes. In addition, we
S
1

4 SCHOOL DISTRICT STUDENT TRANSPORTATION
surveyed all school district transportation directors and conducted site visits of 34 school districts across the state.1
TRANSPORTATION SERVICES By law, school districts are required to provide or arrange free transportation for resident students who live two miles or more from school.2 School districts must also provide or arrange free transportation for certain students, such as special education students who require special transportation to attend school as defined in their individual education plan, students placed in care and treatment, or homeless students who lived in the district at the time they became homeless. If requested, public school districts must also provide or arrange transportation for charter and nonpublic schools. When this transportation is provided by a school district, the district controls the scheduling of routes and the manner and method of transportation.
Many districts choose to provide additional transportation services to students beyond what is required by law. With the exception of students requiring special accommodations, school districts are not required to provide transportation to students who live within two miles of school. Nevertheless, many school districts do transport these students, although districts may charge fees for this transportation. Districts may choose to transport students who reside outside of their district boundaries but open enroll into the district.3 School districts may also choose to provide transportation for field trips, extracurricular activities, special programs at different school sites, after-school activities, and for students who experience hazards walking to school.
Districts may define “hazards” that exist within the walk distance of their schools and provide transportation or adult crossing guards for students who encounter hazards when walking to school.4 A hazardous walking condition exists when it is not safe for students to walk to school based on the types of roads that students must cross, the speed of traffic on those roads, the age of the students, and other factors as determined by the local school district. Examples of hazardous walking conditions include crossing active railroad tracks or a busy street or walking through a high-crime area.
School districts may provide student transportation directly or use a contractor to provide such services. In the 2005-06 school year, 45 percent of districts used a contractor to provide at least half of their student transportation. Many districts choose to contract for certain types of transportation services but provide other types directly. For example, the Carlton School District provides most of its
1 As used in this report, “school districts” are independent school districts in Minnesota. We did not include charter or nonpublic schools in our evaluation. 2 Minnesota Statutes 2007, 123B.88, subd. 1. 3 Minnesota Statutes 2007, 123B.88. 4 Minnesota Statutes 2007, 123B.88, subd. 3a. A school district’s walk distance is the distance from school within which the district does not provide free transportation.
School districts must provide or arrange free transportation for students who live two miles or more from school.
School districts may provide transportation directly or use a private contractor.

BACKGROUND 5
transportation itself; however, the district contracts with a local school bus company to provide some of its special education student transportation. Other districts choose to contract for most of their transportation services but directly provide certain types of transportation. For example, the Jordan School District has a contractor provide its regular to- and from-school transportation but provides all of its special education transportation itself.
REVENUES AND EXPENDITURES Prior to 1997, school districts received dedicated funding for student transportation services.5 In an effort to create more flexible spending for districts and promote efficient use of resources, the 1995 Legislature rolled most dedicated transportation funding into school districts’ general funds; this shift in transportation funding took effect in fiscal year 1997. In this section, we further discuss these funding changes and analyze how state transportation revenues and expenditures have changed since the mid-1990s. We also discuss the extent to which school districts charge fees for certain transportation services and how this has changed in the past 11 years.
Funding Changes In 1996 and earlier, school districts received “categorical” (dedicated) student transportation funding based in part on districts’ actual student transportation expenditures. State funding for student transportation changed significantly in fiscal year 1997. Instead of being provided to school districts as categorical funding, about two-thirds of transportation revenues were rolled into districts’ general education revenues. School districts could then use this funding for any program—it was no longer restricted to transportation purposes. Table 1.1 shows the types of transportation revenues that are part of school districts’ general education revenues and those that are considered dedicated funding. About one-third of transportation funding, such as that for special education and desegregation student transportation, has remained categorical. The state pays for some categorical programs, for example special education transportation, on a reimbursement-basis; the state pays for others, such as nonpublic student transportation, based on a formula that estimates districts’ expenditures.6
Prior to the funding change, MDE calculated that Twin Cities-area school districts spent, on average, $170 per pupil unit on regular student transportation.7 Based on this calculation, when the Legislature rolled student transportation revenues into districts’ general education funds in 1997, MDE increased all districts’ general education revenues by $170 per pupil. After this roll-in, MDE 5 Fiscal year 1997 runs from July 1, 1996, through June 30, 1997. Throughout this chapter, years or fiscal years refer to the corresponding school years. For example, “fiscal year 1997” and “1997” are used to refer to the 1996-97 school year. 6 In recent years, special education transportation reimbursements have not fully covered expenditures. 7 This calculation did not include the cost for certain types of transportation that remained categorical after the funding change, such as special education transportation.
Beginning in fiscal year 1997, most transportation revenues became part of school districts’ general funds and were no longer restricted to transportation purposes.

6 SCHOOL DISTRICT STUDENT TRANSPORTATION
Table 1.1: Types of Student Transportation Revenues
General Education Revenues
Regular Transportation Estimated as 4.85 percent of general education revenuesTransportation Sparsity Aid Allocated based on student density; not all districts
receive this revenue Transportation Transition Aid Allocated to districts that received less transportation
funding following the 1997 funding changesa
Dedicated Transportation Revenues
Enrollment Options Districts are reimbursed for the costs of transporting students from low income families for postsecondary enrollment options and open enrollment.
Integration Revenue This is estimated as the amount of integration revenue funding that districts use for transportation.
Interdistrict Desegregation Districts are reimbursed for the costs of transportation between districts for desegregation transportation.
Nonpublic This is estimated based on student transportation counts and districts’ regular to- and from-school transportation expenditures.
Special Education Districts are reimbursed for special education transportation costs on a two-year lag. This revenue includes funding for transportation of traditional special education students and other students, such as those who experience homelessness, attend care and treatment programs, or need special transportation accommodations but do not have individual education plans.b
NOTES: General education revenues are revenues that are part of districts’ general funds; this funding is not specifically restricted to transportation. Dedicated revenues can only be used for specified types of expenditures and are directly reimbursed based on either reported expenditures or estimated costs. a Transition revenue was converted to referendum funding in 2003; MDE estimates a percentage of the referendum as transportation transition revenue for 2003 to 2006. b The 2007 Legislature made changes to special education funding effective in fiscal year 2008. These changes eliminated the two-year lag for special education reimbursements.
SOURCES: Office of the Legislative Auditor and Minnesota Department of Education financial data.
estimated that school districts’ regular student transportation funding ($170 per pupil) was 4.85 percent of general education revenues. MDE continues to estimate student transportation revenues as 4.85 percent of general education revenues, a method we adopted for this evaluation.
Because sparsely populated school districts generally had higher per pupil transportation expenditures than Twin Cities-area districts, many districts received transportation sparsity aid in addition to the $170 per pupil increase in general fund revenues. Transportation sparsity revenue increases as districts’ student population density decreases. Also, to ease the shift from dedicated transportation funding to general education revenues, school districts that would have lost revenue due to the funding shift received transportation transition aid.

BACKGROUND 7
The state provided transition revenue to qualifying districts until 2003 when this fund was converted to local referendum revenue as part of larger school district funding changes.
Some transportation levy authority also was rolled into general education revenues as part of the $170 per pupil funding increase. In fiscal year 1997, school districts’ vehicle depreciation funds, bus purchase levy authority, and “hazard” levies were rolled into districts’ general education revenues.8 Prior to 1997, districts were required to annually set aside, into a bus depreciation reserve account, 12.5 percent of a school bus’s original purchase price until it was fully amortized.9 School districts were expected to use this revenue to purchase a new vehicle. If a school district did not have sufficient funds in its vehicle depreciation account to purchase a new vehicle, the district could use funds generated through its bus purchase levy. The hazard levy gave school districts the ability to levy for dedicated funds to provide transportation for students facing hazardous walking conditions.10
From 1996 through 1999, the Legislature provided school district transportation safety aid in the amount of $1.50 per pupil or $500, whichever was greater. This aid could be used for safety-specific spending such as safety training for drivers or students or enhancements of vehicle safety equipment like stop-arm crossing gates on buses. School districts received more than $1 million in transportation safety aid each year between 1996 and 1999. The Legislature eliminated this revenue stream in 2000.
In the 2001 special session, the Legislature changed the law to allow districts to charge fees for regular transportation of students who live within two miles of school.11 As mentioned earlier, school districts could already charge fees for certain types of transportation services, such as postsecondary enrollment options, extracurricular activities, and open enrollment transportation.12 The 2001 legislation, however, allowed districts to more broadly charge students fees for regular transportation to and from school.
Revenues and Expenditures Trends We analyzed how total transportation revenues and expenditures have changed over the past 11 years and found that:
8 Other levy authority that was rolled into general education revenues included the contract service transportation levy, late activity transportation levy, and postsecondary levy. 9 The depreciation of type III vehicles was calculated at 20 percent per year over five years. 10 The “hazard” levy was also called the “excess” transportation levy. Transportation of some students that lived within two miles of school was considered “excess” transportation. This included students who experienced hazardous walking conditions, secondary students that resided one to two miles from school, or students that districts chose to transport based on their transportation policy. 11 Minnesota Laws First Special Session 2001, chapter 6, art. 1, sec. 6. 12 Minnesota Statutes 2007, 123B.36, subd. 1.
Beginning in 2001, school districts were allowed to charge fees to transport students who lived within two miles of school.
8 SCHOOL DISTRICT STUDENT TRANSPORTATION
• Transportation revenues and expenditures have increased over time,
mostly due to the increase in special education transportation.
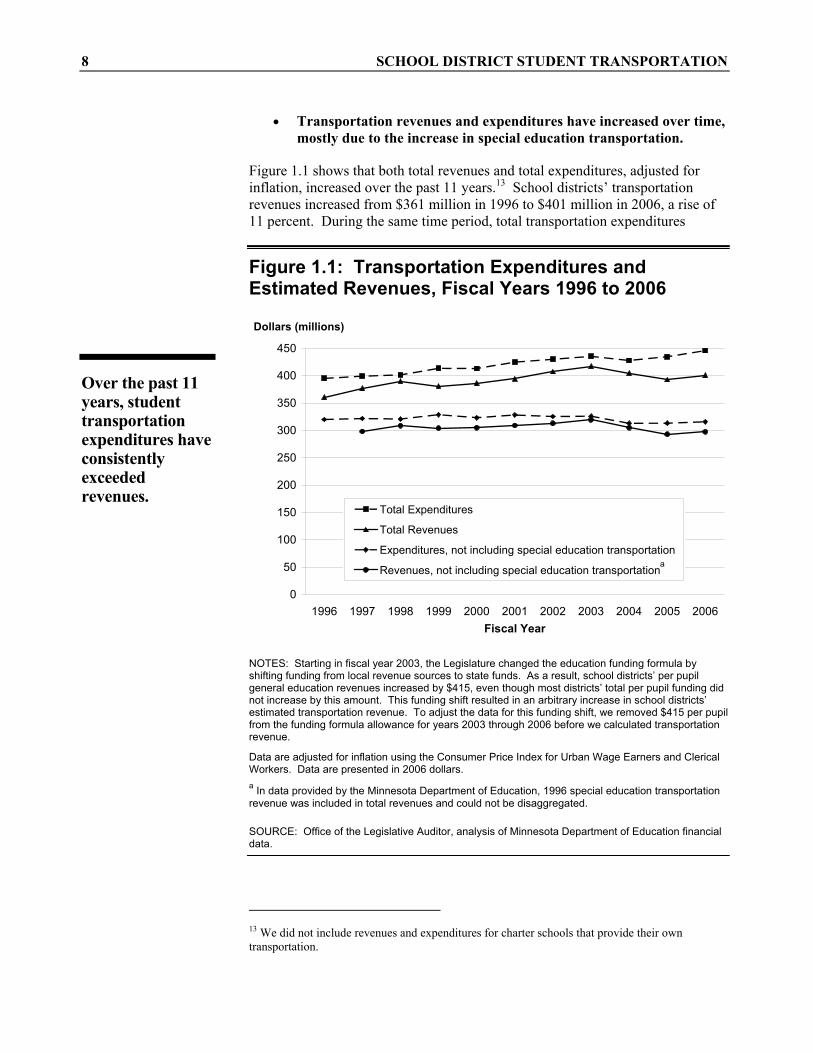
Figure 1.1 shows that both total revenues and total expenditures, adjusted for inflation, increased over the past 11 years.13 School districts’ transportation revenues increased from $361 million in 1996 to $401 million in 2006, a rise of 11 percent. During the same time period, total transportation expenditures
Figure 1.1: Transportation Expenditures and Estimated Revenues, Fiscal Years 1996 to 2006
0
50
100
150
200
250
300
350
400
450
1996 1997 1998 1999 2000 2001 2002 2003 2004 2005 2006Fiscal Year
Dollars (millions)
Total Expenditures
Total Revenues
Expenditures, not including special education transportation
Revenues, not including special education transportationa
NOTES: Starting in fiscal year 2003, the Legislature changed the education funding formula by shifting funding from local revenue sources to state funds. As a result, school districts’ per pupil general education revenues increased by $415, even though most districts’ total per pupil funding did not increase by this amount. This funding shift resulted in an arbitrary increase in school districts’ estimated transportation revenue. To adjust the data for this funding shift, we removed $415 per pupil from the funding formula allowance for years 2003 through 2006 before we calculated transportation revenue.
Data are adjusted for inflation using the Consumer Price Index for Urban Wage Earners and Clerical Workers. Data are presented in 2006 dollars. a In data provided by the Minnesota Department of Education, 1996 special education transportation revenue was included in total revenues and could not be disaggregated.
SOURCE: Office of the Legislative Auditor, analysis of Minnesota Department of Education financial data.
13 We did not include revenues and expenditures for charter schools that provide their own transportation.
Over the past 11 years, student transportation expenditures have consistently exceeded revenues.

BACKGROUND 9
increased by close to 13 percent; districts spent almost $395 million on transportation in 1996 and close to $446 million in 2006.14 As previously outlined in Table 1.1, we estimated transportation revenues as 4.85 percent of general education revenues and did not include fee revenues in our calculations. Expenditures include all expenditures districts reported to MDE as transportation expenditures, including those that are ineligible for state funding, such as field trip transportation expenditures.15
Special education transportation comprises the largest portion of dedicated transportation revenues and is the second highest transportation expenditure behind regular student transportation. Special education transportation has become a larger share of total transportation revenues and expenditures since 1997.16 Both special education transportation revenue and expenditures have increased over the past 10 years; however, expenditures have increased at a faster rate. Funding for special education transportation increased by 31 percent from 1997 to 2006, while expenditures increased by almost 68 percent.
Excluding special education transportation revenue and expenditures, transportation funding has remained steady over time and expenditures have decreased. Figure 1.1 shows that estimated transportation revenues remained steady and expenditures decreased by just under 2 percent between 1997 and 2006, when special education transportation is excluded.
Difference Between Revenues and Expenditures Under the current funding structure, when transportation revenues exceed expenditures, school districts may use the additional revenues for any purpose. However, when transportation expenditures exceed revenues, school districts must supplement student transportation with general education revenues. Because of its potential impact on districts’ general education revenues, we analyzed the difference between transportation revenues and expenditures for the state as a whole and at the district level.
We found that:
• Student transportation expenditures consistently exceed revenues; this difference is larger for certain types of districts.
As Figure 1.1 shows, total transportation expenditures consistently exceeded estimated revenues between 1996 and 2006. In 1996, the difference between revenues and expenditures was about $34 million; in 2006, the difference was $45 million. From 1996 to 2006, 61 to 80 percent of districts had transportation expenditures that exceeded revenues. 14 Data are adjusted for inflation using the Consumer Price Index for Urban Wage Earners and Clerical Workers. Data are presented in 2006 dollars. 15 In 2006, almost $46 million in transportation expenditures were ineligible for state funding. 16 In data provided by MDE, 1996 special education transportation revenue was included in total revenues and could not be disaggregated.
Revenue and expenditures for special education transportation have increased significantly since 1997.
10 SCHOOL DISTRICT STUDENT TRANSPORTATION
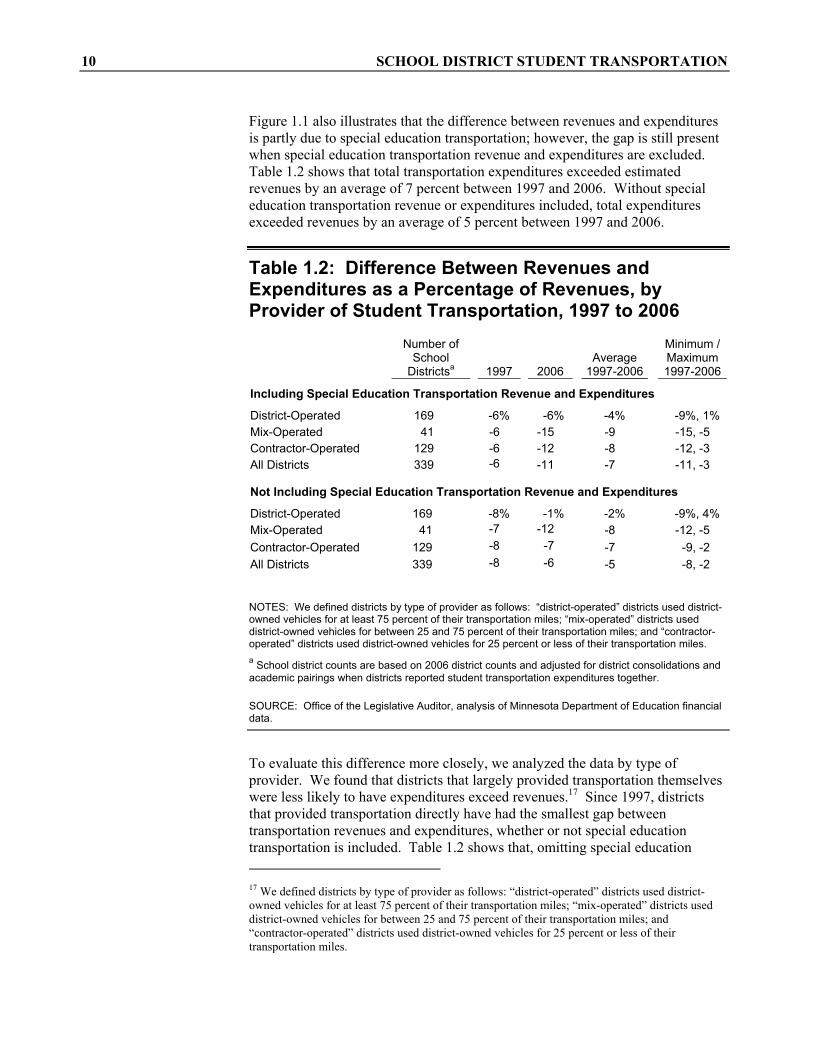
Figure 1.1 also illustrates that the difference between revenues and expenditures is partly due to special education transportation; however, the gap is still present when special education transportation revenue and expenditures are excluded. Table 1.2 shows that total transportation expenditures exceeded estimated revenues by an average of 7 percent between 1997 and 2006. Without special education transportation revenue or expenditures included, total expenditures exceeded revenues by an average of 5 percent between 1997 and 2006.
Table 1.2: Difference Between Revenues and Expenditures as a Percentage of Revenues, by Provider of Student Transportation, 1997 to 2006
Number of School
Districtsa 1997 2006 Average
1997-2006
Minimum / Maximum 1997-2006
Including Special Education Transportation Revenue and Expenditures
District-Operated 169 -6% -6% -4% -9%, 1% Mix-Operated 41 -6 -15 -9 -15, -5 Contractor-Operated 129 -6 -12 -8 -12, -3 All Districts 339 -6 -11 -7 -11, -3
Not Including Special Education Transportation Revenue and Expenditures
District-Operated 169 -8% -1% -2% -9%, 4% Mix-Operated 41 -7 -12 -8 -12, -5 Contractor-Operated 129 -8 -7 -7 -9, -2 All Districts 339 -8 -6 -5 -8, -2
NOTES: We defined districts by type of provider as follows: “district-operated” districts used district-owned vehicles for at least 75 percent of their transportation miles; “mix-operated” districts used district-owned vehicles for between 25 and 75 percent of their transportation miles; and “contractor-operated” districts used district-owned vehicles for 25 percent or less of their transportation miles. a School district counts are based on 2006 district counts and adjusted for district consolidations and academic pairings when districts reported student transportation expenditures together.
SOURCE: Office of the Legislative Auditor, analysis of Minnesota Department of Education financial data.
To evaluate this difference more closely, we analyzed the data by type of provider. We found that districts that largely provided transportation themselves were less likely to have expenditures exceed revenues.17 Since 1997, districts that provided transportation directly have had the smallest gap between transportation revenues and expenditures, whether or not special education transportation is included. Table 1.2 shows that, omitting special education 17 We defined districts by type of provider as follows: “district-operated” districts used district-owned vehicles for at least 75 percent of their transportation miles; “mix-operated” districts used district-owned vehicles for between 25 and 75 percent of their transportation miles; and “contractor-operated” districts used district-owned vehicles for 25 percent or less of their transportation miles.

BACKGROUND 11
transportation, districts that directly provided their own transportation had expenditures that exceeded revenues by an average of only 2 percent. However, contractor-operated and “mix-operated” districts, those with both contractor- and district-operated services, had expenditures that exceeded revenues by an average of 7 and 8 percent of their revenues, respectively.
We also analyzed revenues and expenditures data by the size and location of school districts. The percentage difference between revenues and expenditures is smallest for small Twin Cities-area school districts and large outstate districts.18 Table 1.3 shows that Twin Cities-area districts with less than 5,000 enrolled students and outstate districts with more than 2,000 students had expenditures that exceeded revenues by 1 and 5 percent, respectively, from 1997 to 2006. In contrast, small outstate districts with enrollments of less than 1,000 students had expenditures that exceeded revenues by 11 percent or more. When special education transportation revenue and expenditures are excluded, the variation by size and location is more apparent. For example, after omitting special education transportation, transportation revenues often exceeded expenditures for small Twin Cities-area districts. Table 1.3 also shows that small outstate districts continue to have a large percentage difference between revenues and expenditures, even when special education transportation is excluded.
The differences between districts’ transportation revenues and expenditures are often the result of local choices. As stated earlier, a purpose of the 1997 funding change was to give school districts more flexibility to provide student transportation services that fit the needs of their district. For example, to promote participation in extracurricular activities, the South Koochiching School District provides free busing for all students that take part in after-school activities; staff we spoke with said access to activities is particularly important for this geographically large and sparse school district. Another district had previously provided student transportation directly; the superintendent had managed many transportation-related issues, such as routing, dispatching, and handling parents’ concerns. The district switched to contractor-operated transportation and the school board voted to continue to use a private contractor, even though providing transportation through the district was less expensive. Additionally, many districts choose to provide transportation for students that live within two miles of school even though this is not required.
Fee Revenue Minnesota statutes authorize school districts to charge fees to transport students to postsecondary enrollment options; extracurricular activities; and the district borders, if nonresident students open enroll in the district.19 School districts may
18 Throughout the remainder of this report, “Twin Cities-area school districts” refers to districts in the seven-county Twin Cities metropolitan area, excluding the Minneapolis and St. Paul school districts. 19 Minnesota Statutes 2007, 123B.36, subd. 1.
School district policy and management choices have a significant impact on transportation expenditures.

12 SCHOOL DISTRICT STUDENT TRANSPORTATION
Table 1.3: Difference Between Revenues and Expenditures as a Percentage of Revenues, by Size and Location of School District, 1997 to 2006
Number of School Districtsa 1997 2006
Average 1997-2006
Minimum / Maximum 1997-2006
Including Special Education Transportation Revenue and Expenditures
Minneapolis and St. Paul 2 -6% -14% -8% -15%, -2% Twin Cities Area, 5,000 or
more students 28 -2 -14 -7 -14, -1 Twin Cities Area, less than
5,000 students 18 -4 1 -1 -9, 2 Outstate Minnesota, 2,000
or more students 50 -6 -7 -5 -8, 1 Outstate Minnesota, 1,000
to 1,999 students 79 -8 -9 -8 -11, -4 Outstate Minnesota, 500 to
999 students 82 -11 -15 -11 -15, -7 Outstate Minnesota, less
than 500 students 80 -15 -17 -12 -17, -4
Not Including Special Education Transportation Revenue and Expenditures
Minneapolis and St. Paul 2 -8% -9% -7% -11%, -2% Twin Cities Area, 5,000 or
more students 28 -4 -8 -4 -10, 1 Twin Cities Area, less than
5,000 students 18 -5 12 3 -7, 12 Outstate Minnesota, 2,000
or more students 50 -7 -2 -3 -7, 4 Outstate Minnesota, 1,000
to 1,999 students 79 -10 -6 -7 -11, -2 Outstate Minnesota, 500 to
999 students 82 -13 -14 -11 -14, -8 Outstate Minnesota, less
than 500 students 80 -18 -15 -12 -18, -6
NOTE: “Twin Cities Area” refers to school districts in the seven-county Twin Cities metropolitan area, excluding Minneapolis and St. Paul. a School district counts are based on 2006 district counts and adjusted for district consolidations and academic pairings when districts reported student transportation expenditures together.
SOURCE: Office of the Legislative Auditor, analysis of Minnesota Department of Education financial data.
BACKGROUND 13
also charge fees to transport students who live within two miles of their schools.20 Based on our analysis of MDE fee data, we found that:
• Between 1996 and 2006, student transportation fee revenue increased significantly. Most of this increase is attributable to a small number of Twin Cities-area school districts.
Fee revenue increased from just over $325,000 in 1996 to more than $2.6 million in 2006. In particular, transportation fee revenue almost doubled from 2001 to 2002 and more than tripled from 2002 to 2003. This increase in fee revenue is due, in large part, to the 2001 legislative change that allowed school districts to charge fees to transport students that live within two miles of school.21
Most of the increase in fee revenue is attributable to a few large suburban school districts in the Twin Cities area. In spring 2002, the Anoka-Hennepin School District first collected fees from students living within two miles of school, accounting for more than $280,000 of the $382,000 increase statewide in total fee revenue between 2001 and 2002. Between 2002 and 2003, student transportation fee revenue more than tripled. Again, school districts in the Twin Cities area with more than 5,000 enrolled students accounted for much of this increase; these districts received 85 percent of the total transportation fee revenue in 2003. Anoka-Hennepin collected close to $1 million and Mounds View collected more than $300,000 in transportation fees.
Twin Cities-area school districts with more than 5,000 students consistently accounted for more than 80 percent of the transportation fee revenue received statewide from 2003 to 2006. The number of districts in this group that collected transportation fees increased in 2002 and again in 2006. In 2006, 13 of the 28 school districts in this group reported that they collected transportation fees. Table 1.4 details those 13 districts, the amount of fees they collected, and the percentage of statewide transportation fee revenue they received. Anoka-Hennepin and Mounds View together accounted for almost half of all transportation fee revenue collected in Minnesota in 2006.
MDE staff caution that the transportation fee data may not be reliable because this revenue is not consistently reported by school districts. Some districts report athletic, transportation, and other fees together, while others report them separately. Additionally, we learned through our questionnaire, interviews, and site visits that some school districts collect fees to transport students, but the fees are not reflected in the data. For example, the Bloomington School District collects fees to transport students who live within two miles of school, but it did not report any transportation fee revenue from 1996 to 2006. Similarly, South St. Paul did not report any transportation fee revenue to MDE, although it has a transportation fee program. This district authorizes its contractor to manage its fee-for-service program; students pay the contractor, rather than the district, for transportation services.
20 Minnesota Statutes 2007, 123B.36, subd. 1. 21 Laws of Minnesota First Special Session 2001, chapter 6, art. 1, sec. 6.
Statewide, revenue from transportation fees increased to more than $2.6 million in 2006.

14 SCHOOL DISTRICT STUDENT TRANSPORTATION
Table 1.4: School Districts in the Twin Cities Area with More Than 5,000 Enrolled Students that Collected Fees for Transportation, 2006
School District Transportation Fee Revenue (thousands)
Percentage of Total Transportation Fees Collected Statewide
Anoka-Hennepin $ 895 33.7% Mounds View 329 12.4 Eden Prairie 269 10.1 Minnetonka 254 9.6 South Washington County 170 6.4 White Bear Lake 124 4.7 Stillwater 76 2.9 Roseville 68 2.5 Rosemount-Apple Valley-Eagan 39 1.5 Robbinsdale 26 1.0 West St. Paul-Mendota Heights 15 0.5 Edina 9 0.3 Centennial 1 0.0 Total $2,274 85.8%
NOTES: School districts do not consistently report fee revenue to MDE. The remaining 14 percent in fee revenue is distributed among a large number of districts throughout the state. Amounts above do not sum due to rounding.
SOURCE: Office of the Legislative Auditor, analysis of Minnesota Department of Education financial data.
USE OF CONTRACTORS Minnesota statutes allow districts to directly provide student transportation or to contract with private carriers to provide this service.22 Some districts have chosen to provide all of their student transportation themselves; others use contractors for some, often specialized, transportation services (for example, extracurricular or special education transportation); and some contract for all of their transportation services. Each year, all school districts must report to MDE the number of student transportation miles, routes, or hours that were provided by the district and its contractors. We used this data as an indication of the extent to which districts use private contractors for student transportation.
We found that:
• Since 1996, school districts have not significantly changed their reliance on private contractors to provide student transportation.
22 Minnesota Statutes 2007, 123B.52, subd. 3.

BACKGROUND 15
School districts reported to MDE that contractors provided about 58 percent of the student transportation miles driven in 1996; in 2005, contractors drove about 59 percent of the school bus miles.23 Additionally, between 1996 and 2006, the number of districts using contractors for at least half of their transportation increased by just 4 percent, from 148 school districts to 154.
In contrast to smaller school districts, districts in the Twin Cities area and large outstate districts have been more likely to use contractors to provide student transportation. Each year between 1996 and 2006, more than 61 percent of the larger districts have used contractors to provide at least half of their student transportation; less than 47 percent of smaller outstate districts used contractors to provide student transportation.
VEHICLES School districts and private contractors use a variety of vehicles to transport students. Vehicle “types” are defined in Minnesota law; vehicle types C and D are generally larger vehicles, and vehicle types A, B, and III are typically smaller.24 Table 1.5 describes the types of student transportation vehicles used in Minnesota.
Before the 1997 funding changes, districts that provided transportation services directly could utilize the bus depreciation reserve account and bus purchase levy to purchase new vehicles. School districts were required to set aside an amount equal to 12.5 percent of a school bus’s purchase price each year (until it was fully amortized) into the bus depreciation reserve account.25 A district could use the funds held in its bus depreciation reserve account to purchase new vehicles. If the district did not have enough money in the reserve account, the district could use the bus purchase levy to make up the difference.
When transportation funding was rolled into districts’ general funds, the shift included the balance on the bus depreciation account and the bus purchase levy.26 Because funds had been set aside on an eight-year bus depreciation cycle, some districts used eight years as a guideline for replacing vehicles; however, statutes
23 In 2006, school districts were allowed to report school bus use by miles, routes, or hours. As a result, 2006 school bus miles were not representative of all districts’ school bus use and were not included in this analysis. 24 Minnesota Statutes 2007, 169.01, subd 6. 25 As noted earlier, the depreciation of type III vehicles was calculated at 20 percent per year over five years. 26 There is no longer a state-required reserve account for new bus purchase savings; however, districts can set aside funds for bus purchases as part of their own budgeting practices.
School districts and private contractors use a variety of vehicles for student transportation.

16 SCHOOL DISTRICT STUDENT TRANSPORTATION
Table 1.5: Student Transportation Vehicle Types
Vehicle Type Vehicle Description
A Small school buses with van-like front sections that can carry more than ten passengers.
B Small school buses with a “stripped chassis” that can carry more than ten passengers; type B buses look like delivery trucks.
C Large traditional school buses with the engine ahead of the front windshield and the entrance door behind the front wheels.
D Large school buses with the engine behind the windshield and the entrance door ahead of the front wheels; type D buses look like transit buses.
III
Cars, station wagons, vans, or small buses designed to transport ten or fewer passengers, including the driver. These vehicles may not be “outwardly equipped and identified as a school bus” and must weigh 10,000 pounds or less.a
a Minnesota Statutes 2007, 169.01, subd. 6.
SOURCES: Office of the Legislative Auditor and Minnesota Department of Education.
do not set a maximum age for type A, B, C, and D vehicles.27 Minnesota statutes require type III vehicles to be replaced after 12 years.28
We analyzed whether funding changes affected vehicle age or the types of vehicles carriers use to transport students, and we found that:
• Student transportation fleets are aging, and carriers are using more small vehicles for student transportation.
Both the average age of vehicles and the maximum age of vehicles in use have increased since 2002. Based on vehicle information from DPS, the average age of all student transportation vehicles increased from just over six years in 2002 to
27 The only requirement in law on maximum vehicle age for types A, B, C, and D vehicles states that vehicles must be manufactured after 1977. In 1977, the National Highway Traffic Safety Administration (NHTSA) significantly changed the design of school buses to make them safer. Minnesota Statutes 2007, 169.4502, subd. 3. 28 Minnesota Statutes 2007, 169.454, subd. 2. Prior to 2003, type III vehicles were to be replaced every 10 years.
The average and maximum ages of student transportation vehicles have increased since 2002.

BACKGROUND 17
almost eight years in 2007. The average vehicle age increased by almost a full year between 2002 and 2003 and has increased steadily, though more slowly, since then. In 2002 the oldest vehicle used for student transportation was 23 years old; by 2007, the oldest vehicle was 30 years old.
In addition to analyzing DPS data, we asked school district personnel about their vehicles. According to responses to our questionnaire, approximately 46 percent of school districts that owned their own vehicles indicated their average fleet age had increased over the past ten years; 16 percent indicated their average fleet age had decreased during the same time period. Some districts we spoke with during our site visits said the maximum age of their vehicles has increased. For example, the Eden Prairie School District changed its vehicle age policy four years ago and increased its maximum vehicle age to 16 years for all buses used to regularly transport students. Staff from the Russell-Tyler-Ruthton School District said they have increased the maximum allowable vehicle age for their contractors, partly due to the funding changes of the mid-1990s.
Districts and contractors are using more small vehicles to transport students than they have previously.29 While the total number of vehicles used for student transportation increased by 13 percent between 1996 and 2006, the number of small buses increased by 47 percent. In 1996, carriers used about 2,800 small vehicles; in 2006, they used closer to 4,200. More specifically, carriers are using more type III vehicles. In 2006, carriers used about 1,200 more type III vehicles to transport students than in 1996. Private contractors, in particular, more than doubled the number of type III vehicles they used between 1996 and 2006.
SCHOOL BUS CRASHES According to the National Highway Traffic Safety Administration (NHTSA), students are safer riding in school buses than riding in cars. In a study on school bus crashes, NHTSA said that students are close to eight times safer in buses than in cars.30
We analyzed the change in the number of school bus crashes in Minnesota from 2000 to 2006.31 Additionally, we reviewed statistics on the fatalities from these crashes and the contributing factors. Based on this analysis we found that:
• The total number of bus crashes declined by 30 percent between 2000 and 2006.
As reported by DPS, the total number of Minnesota school bus crashes consistently decreased between 2000 and 2006 from 890 crashes to 625, a decline of almost 30 percent. A small number of these crashes resulted in 29 Small vehicles include type A and B buses and type III vehicles. 30 National Highway Traffic Safety Administration, Report to Congress School Bus Safety: Crashworthiness Research (2002), p. V. 31 An accident is counted as a school bus crash if at least one school bus was physically involved; crashes included in this analysis were reported to DPS. Crash statistics for 2003 are not available.
School districts and private contractors are using more type III vehicles (cars, station wagons, and vans) to transport students.

18 SCHOOL DISTRICT STUDENT TRANSPORTATION
fatalities. Between 2000 and 2006, there was an average of 3.6 fatalities each year related to school bus crashes in Minnesota. In 2006, there was one fatality attributed to a school bus crash; in 2005, seven fatalities were attributed to school bus crashes.
The extent to which bus driver error, school bus vehicle malfunction, other driver or vehicle error, and other factors contributed to school bus crashes remained steady over the six-year period.32 Bus driver error comprises about one-third of the contributing factors in bus crashes, while school bus vehicle malfunction is about 2 to 3 percent of contributing factors in crashes. The other driver’s error or vehicle malfunction consistently make up more than half of the contributing factors in bus crashes in Minnesota. Other factors, such as poor weather conditions, are about 11 percent of the contributing factors.
SPECIALIZED TRANSPORTATION Student transportation has evolved as new programming opportunities for students have created demand for more specialized transportation. “Specialized” transportation includes student transportation other than regular to- and from-school transportation, such as transportation for special education or homeless students or to sites outside of the districts, such as to care and treatment facilities. Specialized transportation can be more expensive and more difficult to coordinate because it often requires travel beyond district or attendance area borders, specialized equipment, or individualized transportation services. For example, students may travel to care and treatment programs offered in another city, open enroll into a different district, or receive special education services outside of their district because their own district does not have available programs. Students may also require specialized equipment, such as wheelchair lifts and car seats. Additionally, carriers may have to use a dedicated vehicle to transport a single student to a special program.
Based on our analysis of MDE data and our school district site visits, we found that:
• Student transportation resources are increasingly used for specialized student transportation.
Between 1996 and 2005, the total miles traveled for specialized services increased from 21 to 30 percent of all student transportation miles.33 While special education transportation comprised the bulk of the increase in specialized transportation miles, desegregation/integration and open enrollment miles also increased as a percentage of total student transportation miles during this time
32 In the data we analyzed, a crash could have more than one contributing factor. 33 Data on miles are not available in 2006 because districts can now report data to MDE by miles, routes, or hours.
Specialized transportation is often more expensive and difficult to coordinate.
BACKGROUND 19
period.34 At the same time, regular to- and from-school transportation miles decreased as a percentage of total transportation miles from 58 to 52 percent.
Many of these specialized services are reimbursed by the state on a cost-basis. Over time, the costs of these services have increased as a percentage of total transportation expenditures. As mentioned earlier in this chapter and illustrated in Figure 1.1, special education transportation helps explain the increase in total transportation expenditures in the state from $395 million to $446 million between 1996 and 2006. In 1997, spending for special education transportation was 19 percent of total transportation expenditures or $77 million; in 2006, it was close to 29 percent ($130 million). During the same time period, regular to- and from-school transportation expenditures decreased as a percentage of total transportation spending from about 53 percent to under 48 percent of total transportation expenditures.35
Another indication of the increased use of specialized transportation is the number and types of vehicles carriers use to transport students. According to MDE data, more vehicles are being used to transport students; statewide, the student-to-vehicle ratio has decreased. In 1996, there were 76.2 students to every vehicle, and in 2006 there were 67.5 students to every vehicle. Part of this decrease is because carriers own more small vehicles. Most notably, the number of type III vehicles has increased by about 1,200 since 1996. In our survey of school district transportation directors, 78 percent of respondents said they owned at least one type III vehicle in 2007. Among these school districts, 80 percent said they used type III vehicles for special education transportation, 84 percent said they used these vehicles for special activities, and 22 percent said they used them for regular transportation.
School district staff also indicated that student transportation has become more specialized and complex. District officials noted that special education, English as a second language, desegregation and integration, and care and treatment programs, as well as homeless student transportation, make transportation planning more complex today than in the past. One Twin Cities-area transportation director said coordinating the routes for these special services is difficult. Because of the complexity in special education transportation routing, staff in her district plan all of these routes by hand, even though they use routing software for regular to- and from-school transportation. Other district officials we spoke with, including some in outstate Minnesota, said open enrollment transportation has increased and is inefficient to provide. One staff member from an outstate school district we visited said that school buses from neighboring districts pass each other as they travel to pick up students who open enroll into their districts.
34 Transportation of students who experience homelessness was included as special education transportation until 2006. 35 In 1997, regular to- and from-school transportation expenditures were $215 million; in 2006, these expenditures were $212 million.
According to school district staff, student transportation has become more difficult to manage.


School District Student Transportation Practices
SUMMARY
Measured against best practices, school districts’ student transportation practices range from excellent to poor. For example, many school districts ensure that their bus drivers are qualified to drive a school bus but others do not. Similarly, some school districts provide significant oversight of their student transportation contractors while others provide little or no oversight. In addition, requirements for drivers of smaller student transportation vehicles (type III vehicles) are not sufficient and should be strengthened in law.
chool district student transportation is largely a local function. How school districts provide transportation services depends on a host of local factors,
including the size and geography of the district; the number and location of students; and local district policies regarding student walk distances and ride times, transportation fees, and hazardous walking conditions.
This chapter discusses school districts’ student transportation practices and specifically addresses the following question:
• What are best practices for school district student transportation and to what extent do school districts follow them?
To answer this question, we surveyed all 339 public school districts in Minnesota.1 Of the 339 districts surveyed, 320 of the districts (almost 95 percent) responded to our questionnaire. Through the questionnaire, we asked school districts about their contracting practices, the age of their vehicles, and their drivers’ qualifications; whether the district charged fees for transportation; and how they determined their routes, among other things.
We also conducted site visits of 34 school districts, including districts in the Twin Cities metropolitan area and districts across the state, such as La Crescent-Hokah, Pipestone, Roseau, and St. Louis County public school districts. The Appendix lists all of the school districts we visited. We selected these school districts using a number of criteria, including the enrollment and location of the district, whether the district provided student transportation directly or used a contractor, and the district’s transportation expenditures per student.
1 For purposes of this evaluation, we excluded charter schools and Franconia and Prinsburg, the state’s two “common” school districts.
S
2

22 SCHOOL DISTRICT STUDENT TRANSPORTATION
In addition to our school district questionnaire and site visits, we reviewed the national literature to identify student transportation best practices and interviewed staff from the departments of Education and Public Safety. We also reviewed school district transportation audits conducted by the Minnesota Department of Education (MDE) between 2001 and 2006. Additionally, we met with several interest groups, including the Minnesota Association for Pupil Transportation and the Minnesota School Bus Operators’ Association. Finally, we reviewed federal and state laws regarding student transportation.
We found that:
• School districts vary significantly in how they provide, manage, and oversee student transportation.
School districts had different student transportation policies and contract practices, varied oversight of school bus drivers, and different requirements regarding vehicle age and driver training. Some of the variation we found is appropriate. For example, districts with large geographic areas and small enrollment necessarily provide transportation differently than more densely-populated urban districts. Similarly, a district that directly provides student transportation manages its transportation differently than a district that contracts for the service. Some of the variation we found was the result of district choices regarding student transportation policies and practices; some school districts chose to provide significant oversight of their contractor, while others did not. Some of the variation we found was due to misunderstandings or indifference by district personnel regarding their student transportation responsibilities.
The remainder of this chapter discusses these differences in more detail. The chapter begins with a discussion of student transportation best practices that apply to all school districts. This is followed first by an evaluation of districts that provide their student transportation directly and then by an evaluation of districts that contract for their student transportation. The chapter concludes with recommendations for the Legislature, the Department of Education, and school districts.
DISTRICT-LEVEL POLICIES AND PRACTICES Some aspects of student transportation are relevant for all school districts, whether they provide transportation directly or contract for services. In Table 2.1 we present district-level student transportation best practices that apply to all school districts. These practices are largely based on guidelines developed by other states, notably Florida, Idaho, and Texas. The practices presented in the table address district-level policies regarding student transportation; they are less focused on the specific practices of a district’s transportation division. Subsequent tables presented later in this chapter provide detailed best practices more directly related to student transportation operations.
School districts’ student transportation practices vary due to local needs, district choices, and differing staff attitudes toward student transportation issues.

SCHOOL DISTRICT STUDENT TRANSPORTATION PRACTICES 23
Table 2.1: District-Level Best Practices for Student Transportation
School District Transportation Policy
• The district has a written transportation policy. • The district’s policy defines students eligible for transportation
and lists fees the district may charge for transportation. • The district’s transportation policy establishes maximum
student ride times. • The district’s policy outlines driver qualification requirements
and consequences for not meeting them.
District Planning • The district annually evaluates routes, bus stops, and school start times for potential cost savings and improved effectiveness.
• The district periodically reviews student distance from school and how it is determined.
• The district periodically reviews the benefits and costs of contracting for some or all of its transportation services and presents findings to the school board as needed.
SOURCES: Office of the Legislative Auditor; Florida Office of Program Policy Analysis and Government Accountability, Best Practices With Their Associated Indicator: Student Transportation, June 2002, http://www.oppaga.state.fl.us/reports/pdf/trans_indicators2002.pdf, accessed April 13, 2007; Idaho Department of Education, Idaho School Transportation Best Practices, November 2005, http://www.sde.state.id.us/Transportation/docs/RegandRules/BestPractices.pdf, accessed April 24, 2007; Texas Comptroller of Public Accounts, Texas School Performance Review Audit Protocol for Transportation, http://www.window.state.tx.us/tspr/protocol/transport.html, accessed May 22, 2007; and Texas Comptroller of Public Accounts, Texas School Performance Review Audit Protocol: Purchasing and Warehousing, http://www.window.state.tx.us/tspr/protocol/purchase.html, accessed June 4, 2007.
District Policies As outlined in Table 2.1, all school districts should have a written student transportation policy that identifies which students are eligible for transportation, lists fees the district charges for transportation, establishes maximum student ride times, and sets minimum driver qualifications.2 Districts’ decisions regarding the first three of these issues are discussed below. We discuss driver qualification policies later in this chapter.
Eligibility and Fees
As discussed in Chapter 1, school districts must provide free transportation for students who live two miles or more from school. At their discretion, however, school districts may provide transportation for students who live less than two miles from school and may choose whether to charge fees for this service. More
2 Minnesota Statutes 2007, 123B.91, subd. 1, requires all school districts to develop and implement a comprehensive written policy governing pupil transportation safety.
District-level best practices apply to all school districts.

24 SCHOOL DISTRICT STUDENT TRANSPORTATION
than 90 percent of the respondents to our questionnaire indicated that their district provided transportation for students living within two miles of their school during the 2006-07 school year. Most of the districts that do not provide transportation within two miles of school are located in outstate Minnesota.
Among the school districts we visited, student walk distances—the distance from school within which a district does not provide free transportation—generally ranged from one to two miles; some districts provided transportation for all students. Many districts have different walk distances depending on students’ grade levels. For example, the South St. Paul School District has a one-mile walk distance for elementary students and a two-mile walk distance for secondary students. The Thief River Falls School District transports all students in kindergarten through fifth grade and has a one-mile walk distance for all other students.
In the 2006-07 school year, few school districts charged fees for student transportation. As discussed in Chapter 1, school districts may charge fees for transportation provided to students who live within two miles of school. Only 14 of the 320 respondents to our questionnaire said that their school district charged students a fee for this transportation.3 School districts charge different amounts in fees for student transportation. For example, in the 2007-08 school year, the Mounds View School District charged $200 per student for transportation within two miles of school; the Minnetonka School District charged $100 per student. Some school districts implement a maximum family rate; districts also offer free or reduced-priced busing for qualifying students. School district staff we spoke with indicated that the fees their districts charge for student transportation do not fully cover the cost of providing the service.
Student Ride Time
Student ride time refers to how long students are on a school bus during their regular route to and from school. Not quite half (44 percent) of the school district staff that responded to our questionnaire indicated their school district had guidelines regarding a maximum student ride time. Among school districts that established a maximum ride time, most set it at one hour, although districts’ maximum student ride times ranged from 30 minutes to more than two hours.
School districts we visited reflected this range in student ride time; however, given the geographic differences between school districts, the variation in student ride time makes sense. The St. Louis County School District, a geographically large and sparsely populated district, has a maximum student ride time of two hours; most students ride between one and two hours to and from school. In contrast, the Minneapolis School District has a maximum student ride time of one hour, but the district tries to place as many students as possible on routes that
3 According to responses to our questionnaire, the following school districts charged fees in the 2006-07 school year for student transportation provided within two miles of school: Anoka-Hennepin, Bloomington, Blue Earth, Eden Prairie, Minnetonka, Mounds View, Osakis, Osseo, Parkers Prairie, Richfield, Rochester, Roseville, Stillwater, and Wheaton.
Few school districts charge fees for student transportation.

SCHOOL DISTRICT STUDENT TRANSPORTATION PRACTICES 25
are less than 20 minutes. Minneapolis staff thought the average student ride time for students in their district is about 30 minutes.
District Planning As outlined in Table 2.1, school districts should periodically review their student transportation operations. This review should address district-level transportation issues such as the use of private contractors and be part of districts’ regular planning processes.
School districts should evaluate their school start times, routes, and bus stop locations on a regular basis to determine whether changes would increase efficiency. Some school districts we visited, such as Minneapolis, St. Paul, and Anoka-Hennepin, establish their school start times based on transportation needs. Other school districts we visited have only one or two schools; staggering start times would not result in a more efficient transportation operation. However, some school districts we visited may be able to improve the efficiency of their transportation department if they adjusted school start times to reflect transportation considerations. As school districts’ needs change, school start times should be re-evaluated to ensure efficient transportation operations. School district staff should also consider the effect on transportation when they create or change policies regarding school and program start times.
School districts should also periodically review student distance from school and ensure that it is being determined correctly. According to MDE, student distance from school should be measured using the shortest route over surface roads. The department reviews how school districts calculate this distance as part of the 12 school district transportation audits it conducts each year.
While most school districts we visited followed the department’s guidelines regarding walk distances, some districts used other methods. In line with MDE's suggestions, some school districts, such as Minnetonka and Anoka-Hennepin, used bus routing software to determine student distance from school. Staff from other districts we visited, such as St. Louis County and Roseau, drove between students’ homes and their schools to measure the distance. Staff in other districts we visited said they “just know the community” and know which students are eligible for transportation. However, staff from a few districts we visited thought they were required to calculate student distance from school “as the crow flies,” which is not correct and is contrary to advice provided by MDE.
Finally, as Table 2.1 indicates, school districts should periodically review the benefits and costs of contracting for some or all of their transportation services. Some of the school districts we visited have evaluated their use of contractors. For example, the Anoka-Hennepin School District compared the costs and benefits associated with contracting for student transportation to the estimated costs and benefits of providing the services directly and determined that it was more cost-effective for the district to continue using a contractor. The Bloomington School District conducted a similar analysis and determined that it would be more cost-effective to switch from contractor- to district-provided student transportation, which it did in 1999. Regardless of the final outcome,
Some districts establish school start times based on transportation needs.

26 SCHOOL DISTRICT STUDENT TRANSPORTATION
school districts would benefit from periodically reviewing their student transportation needs and evaluating the most cost-effective way to meet them.
DISTRICT-PROVIDED STUDENT TRANSPORTATION Beyond the district-level student transportation policies discussed above, school district transportation responsibilities differ depending on whether the district provides transportation directly or relies on a private contractor to provide the service. In this section, we discuss district-operated student transportation, including relevant best practices and the extent to which school districts apply them. The next section will focus on school districts’ responsibilities when a private contractor provides the services.
Driver Qualifications As discussed in Chapter 1, carriers use several different types of vehicles for student transportation: traditional school buses (types A, B, C, and D); activities buses (type A buses used for transportation other than to and from school); and type III vehicles (cars, station wagons, and other small vehicles that transport ten or fewer passengers, including the driver).4 In this section, we first outline the different legal requirements for drivers of these vehicles. We then discuss the extent to which school districts ensure that these driver qualification requirements are met.
Legal Requirements
Table 2.2 outlines the requirements for traditional school bus drivers, activities bus drivers (when the driver does not hold a commercial driver’s license), and drivers of type III vehicles. By law, drivers must have a school bus endorsement on their commercial driver’s licenses to be eligible to drive most school buses in Minnesota.5 Under federal and state laws, a driver must pass written, driving, and physical examinations to qualify for a school bus endorsement.6 In addition, the Minnesota Department of Public Safety (DPS) conducts a background check on all school bus endorsement applicants. State law outlines “disqualifying offenses,” which, if part of an applicant’s criminal history, disqualify the applicant from receiving an endorsement.7 Drivers must renew their school bus endorsements every four years by passing a renewal written exam and background check; they must undergo and pass a physical examination at least
4 In this report, “carrier” is used to mean either a school district or a private company that provides student transportation. 5 Minnesota Statutes 2007, 171.321, subd. 1. 6 Minnesota Statutes 2007, 171.321, subds. 1-2; Minnesota Rules 2007, 7414.0300, 7414.1100, and 7414.1400; and 49 CFR sec. 383.123 (2006). 7 Disqualifying offenses include felony convictions and convictions related to substance abuse or criminal sexual conduct. Minnesota Statutes 2007, 171.3215, subd. 3.
Requirements for school bus drivers depend on the type of vehicle used and the type of transportation provided.

SCHOOL DISTRICT STUDENT TRANSPORTATION PRACTICES 27
Table 2.2: School Bus Driver Qualification Requirements
Drivers of Type A, B, C, and D Vehiclesa
Drivers of Type A “Activities” Busesb
Drivers of Type III Vehiclesc
Commercial driver’s license with school bus endorsement required Yes No No
Must pass a written exam every four years to renew school bus endorsement Yes No No
Must undergo pre-employment testing for controlled substances Yes No No
Must be subject to reasonable suspicion, post-accident, and random testing for controlled substances Yes No No
Must undergo a background check every four years and not have been convicted of certain criminal offenses
Yes Yesd No
Must undergo and pass a physical examination at least every two years Yes Yes No
Must not be convicted of certain motor vehicle violations Yes Yes No
Must receive relevant training each year or pass an assessmente Yes Yes No
Valid driver’s license required Yes Yes Yes
a Type A, B, C, and D vehicles are yellow school buses of different sizes and models. b An activities bus is a type A bus used for purposes other than to- and from-school transportation. c A type III vehicle is a car, station wagon, van, or small bus designed to transport ten or fewer passengers, including the driver. These vehicles must not be outwardly equipped and identified as a school bus and must weigh 10,000 pounds or less. d School teachers who drive activities buses undergo background checks as part of their initial employment; background checks for these drivers are not repeated every four years. See Minnesota Statutes 2007, 171.02, subd. 2a(e). e Drivers of type A, B, C, and D vehicles must pass an assessment based on driver competencies outlined in state law. After the initial year of being assessed for these competencies, these drivers may receive at least eight hours of training in lieu of the assessment. Drivers of type A activities buses are required to attend annual training; however, there are no specifications regarding the number of training hours these drivers must receive.
SOURCES: Office of the Legislative Auditor; Minnesota Statutes 2007, 169.01, subd. 6; 171.02, subd. 2a; 171.321; and 171.3215, subd. 3; and 49 CFR secs. 382.305, 383.123, and 391.15 (2006).
every two years. Prior to driving for a carrier, a school bus driver must undergo testing for controlled substances and receive a “negative” test result.
By law, school bus carriers have oversight responsibility for the drivers they employ. Carriers must annually verify the validity of their drivers’ licenses. The presence of certain motor vehicle violations, such as being convicted of operating a motor vehicle under the influence of a controlled substance, results in
http://www.fmcsa.dot.gov/rules-regulations/administration/fmcsr/fmcsrguidedetails.asp?regulation=382

28 SCHOOL DISTRICT STUDENT TRANSPORTATION
the suspension of a driver’s school bus endorsement.8 School bus carriers must also conduct random drug and alcohol tests of a sample of their school bus-endorsed drivers each year and annually provide school bus driver training.9
Unlike most school bus drivers, “activities” bus drivers are not required to have a school bus endorsement. However, drivers of these vehicles must receive annual driver training and certification, undergo and pass a physical examination at least every two years, and undergo and pass a background check; criminal disqualifying offenses that apply to school bus drivers also apply to activities bus drivers.10
Drivers of type III vehicles are also not required to have a school bus endorsement. Unlike activities bus drivers, however, type III drivers are not required to receive annual driver training, pass biennial physical exams, or pass a background check. Similar to activities bus drivers, type III drivers are not required to pass written or driving exams or submit to controlled substance tests. Type III drivers are required only to have a valid class D driver’s license (the standard license needed to drive a car). Carriers are required to ensure that type III drivers have valid class D driver’s licenses. Under state law, criminal disqualifying offenses that apply to school bus drivers do not apply to type III drivers.
District School Bus Drivers
Table 2.3 presents best practices for school districts that directly provide at least a portion of their student transportation. This table represents best practices we observed through our site visits of school districts located across the state. For the most part, the legal requirements regarding school bus drivers form the basis for the driver qualifications best practices outlined in Table 2.3. Specifically, school districts should (1) annually verify that their drivers are qualified to drive their vehicles, (2) conduct driver substance abuse tests as required by law, and (3) annually provide driver training related to the six driver competencies outlined in state law.11 Based on our site visits and school district questionnaire, we found that:
• Most school districts verify that their school bus drivers are qualified but some do not.
8 Minnesota Statutes 2007, 171.321, subd. 5. Carriers may verify their drivers’ licenses by reviewing motor vehicle records. Motor vehicle records are documents that provide a list of violations, suspensions, and other details about a driver’s motor vehicle history. The records also list a driver’s endorsements, including a school bus endorsement. 9 Ibid. and 49 CFR sec. 382.305 (2006). 10 Minnesota Statutes 2007, 171.02, subd. 2a. 11 As outlined in Minnesota Statutes 2007, 171.321, subd. 4(b), the six competencies are: “(1) safely operate the type of school bus the driver will be driving; (2) understand student behavior, including issues relating to students with disabilities; (3) encourage orderly conduct of students on the bus and handle incidents of misconduct appropriately; (4) know and understand relevant laws, rules of the road, and local school bus safety policies; (5) handle emergency situations; and (6) safely load and unload students.”
Drivers of activities buses and type III vehicles are not required to have a school bus endorsement.
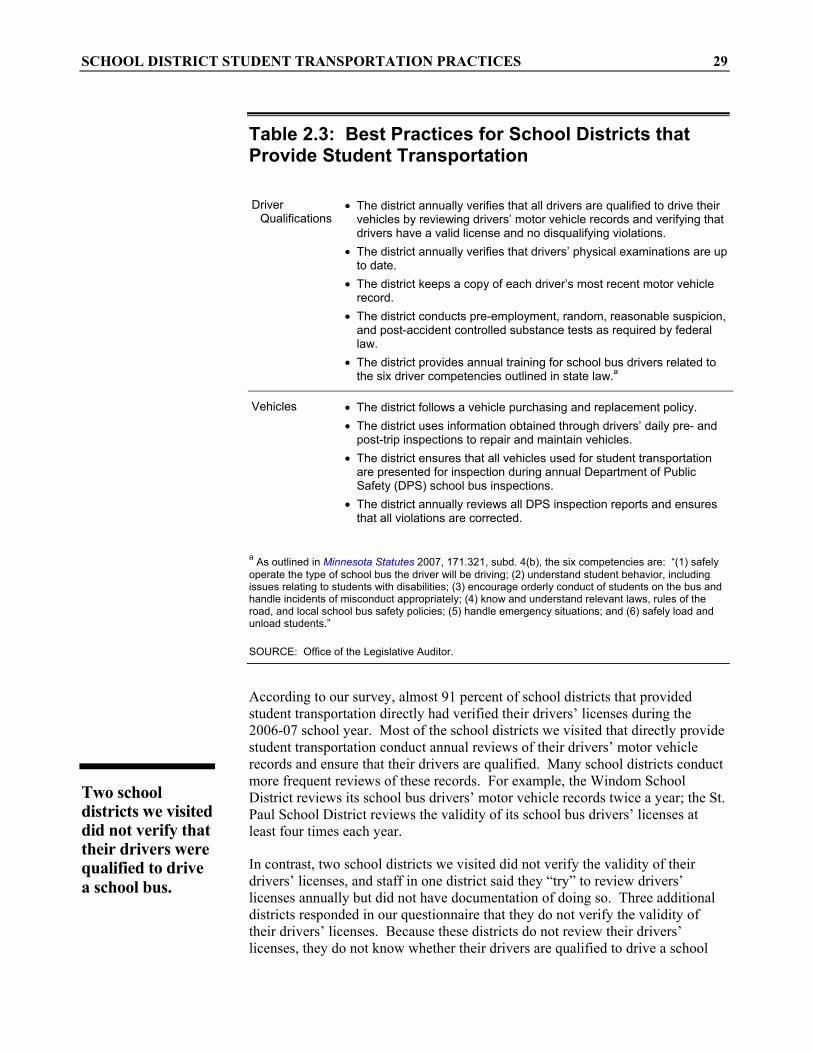
SCHOOL DISTRICT STUDENT TRANSPORTATION PRACTICES 29
Table 2.3: Best Practices for School Districts that Provide Student Transportation
Driver Qualifications
• The district annually verifies that all drivers are qualified to drive their vehicles by reviewing drivers’ motor vehicle records and verifying that drivers have a valid license and no disqualifying violations.
• The district annually verifies that drivers’ physical examinations are up to date.
• The district keeps a copy of each driver’s most recent motor vehicle record.
• The district conducts pre-employment, random, reasonable suspicion, and post-accident controlled substance tests as required by federal law.
• The district provides annual training for school bus drivers related to the six driver competencies outlined in state law.a
Vehicles • The district follows a vehicle purchasing and replacement policy. • The district uses information obtained through drivers’ daily pre- and
post-trip inspections to repair and maintain vehicles. • The district ensures that all vehicles used for student transportation
are presented for inspection during annual Department of Public Safety (DPS) school bus inspections.
• The district annually reviews all DPS inspection reports and ensures that all violations are corrected.
a As outlined in Minnesota Statutes 2007, 171.321, subd. 4(b), the six competencies are: “(1) safely operate the type of school bus the driver will be driving; (2) understand student behavior, including issues relating to students with disabilities; (3) encourage orderly conduct of students on the bus and handle incidents of misconduct appropriately; (4) know and understand relevant laws, rules of the road, and local school bus safety policies; (5) handle emergency situations; and (6) safely load and unload students.”
SOURCE: Office of the Legislative Auditor.
According to our survey, almost 91 percent of school districts that provided student transportation directly had verified their drivers’ licenses during the 2006-07 school year. Most of the school districts we visited that directly provide student transportation conduct annual reviews of their drivers’ motor vehicle records and ensure that their drivers are qualified. Many school districts conduct more frequent reviews of these records. For example, the Windom School District reviews its school bus drivers’ motor vehicle records twice a year; the St. Paul School District reviews the validity of its school bus drivers’ licenses at least four times each year.
In contrast, two school districts we visited did not verify the validity of their drivers’ licenses, and staff in one district said they “try” to review drivers’ licenses annually but did not have documentation of doing so. Three additional districts responded in our questionnaire that they do not verify the validity of their drivers’ licenses. Because these districts do not review their drivers’ licenses, they do not know whether their drivers are qualified to drive a school
Two school districts we visited did not verify that their drivers were qualified to drive a school bus.

30 SCHOOL DISTRICT STUDENT TRANSPORTATION
bus. Without reviewing school bus drivers’ motor vehicle records, school districts do not know whether their drivers have current school bus endorsements and up-to-date physical examination certificates, or whether they have recently been convicted of disqualifying motor vehicle violations.
A few districts we visited also did not adequately oversee the drug and alcohol tests required for their drivers. Most school districts we visited that directly provided student transportation contract for their drivers’ drug and alcohol tests and receive individual test results as well as a report summarizing all tests conducted. However, three districts we visited either did not receive the results of their drivers’ drug tests or did not conduct required pre-employment drug tests of their drivers. As a result, these districts do not know whether their drivers have tested positive for controlled substances and, therefore, whether they are qualified to drive a school bus.
By law, school bus drivers must have training or experience that allows them to meet the six driver competencies outlined in Minnesota statutes, including how to safely operate a school bus, safely load and unload students, and handle emergency situations. Carriers must annually evaluate drivers for these six competencies or, in lieu of an annual assessment (and after the initial year of being assessed for these competencies), drivers must attend at least eight hours of in-service training. Carriers are required to keep a record of either the in-service training each driver received or each driver’s assessment for the current period.
Most of the districts we visited satisfied at least one of these requirements and either annually evaluated their drivers or required their drivers to receive at least eight hours of training; many districts did both. For example, the Bloomington and Eden Prairie school districts both require their drivers to receive more than eight hours of training and annually evaluate their drivers to ensure knowledge of the six competencies outlined in law. In contrast, four school districts we visited had not conducted driver evaluations within the past year and did not require their drivers to receive at least eight hours of training. One of these districts had no driver training requirements.
District Type III Drivers
In 2006, school districts used almost 1,300 type III vehicles to provide student transportation. As with other school bus drivers, school districts are required to ensure that their type III drivers are qualified to drive their vehicles. Unlike other school bus drivers however, drivers of type III vehicles are not required to have a school bus endorsement; pass written, driving, or physical exams; submit to controlled substance testing; or undergo annual training or evaluation. We found that:
School bus drivers must pass an assessment or receive training annually.
District Highlight: In addition to the annual driver training, the Eden Prairie School District provides remedial training for bus drivers who have been in accidents or who have been observed practicing undesirable driving techniques.

SCHOOL DISTRICT STUDENT TRANSPORTATION PRACTICES 31
• School districts do not provide sufficient oversight of type III
drivers.
Not all school districts we visited verify the validity of their type III drivers’ licenses, even though this is required by law. As discussed above, type III drivers are only required to have a valid class D driver’s license. This means that when an employer annually reviews its type III driver’s licenses, it is only required to verify that its type III drivers have valid class D drivers’ licenses, the standard driver’s license required for operating a vehicle. Three of the districts we visited do not verify their type III drivers’ licenses, although staff from one of these districts thought it would be a good practice to start.
Perhaps because of the importance of type III drivers’ responsibilities—many times transporting students to and from school just like traditional school bus drivers—some districts require their type III drivers to have a school bus endorsement even though it is not required by law. Based on the responses to our questionnaire, 8 percent of the districts that reported owning a type III vehicle required these drivers to have a school bus endorsement; one of the districts we visited required its type III drivers to have a school bus endorsement. In contrast, staff from several districts we visited said it would be difficult for them to require their type III drivers to have school bus endorsements. Staff from three districts we visited said requiring their type III drivers to have endorsements would make it difficult to hire drivers. Staff from two other districts said it would be expensive to include type III drivers in the district’s drug testing pool (as would be required if the drivers had a school bus endorsement).
In lieu of a school bus endorsement, some school districts we visited required their type III drivers to satisfy other requirements. For example, the Rochester School District requires its type III drivers to have biennial physicals and be subject to substance abuse tests. The St. Louis County School District also requires its type III drivers to be subject to random drug and alcohol tests and take part in annual driver training.
Vehicles As outlined in Table 2.3, school districts should follow a vehicle purchasing and replacement policy that indicates when and how buses should be replaced. Districts should also use information obtained through drivers’ pre- and post-trip inspections to repair and maintain vehicles. Through our questionnaire and school district site visits, we found that:
• Some school districts proactively manage and maintain their school bus fleets but others do not.
According to our survey, only 7 percent of school districts that own school buses have a written school bus replacement policy. More than 20 percent of the
Type III drivers are only required to have a valid class D driver’s license.
Only a small number of school districts have a written school bus replacement policy.
District Highlight: The Greenbush-Middle River School District requires its type III drivers to have biennial physical exams and attend annual training.

32 SCHOOL DISTRICT STUDENT TRANSPORTATION
districts that own buses reported using vehicles that were more than 15 years old for their regular routes during the 2006-07 school year. Four of these districts used vehicles more than 20 years old; the oldest vehicle reported being used on a regular basis was 25 years old. Only four of the districts we visited indicated that their district had a maximum age for its district-owned vehicles. The maximum vehicle age for these four districts ranged from 5 to 16 years old.
Having a maximum vehicle age, however, may be less important than the extent to which districts monitor the condition of their fleet. That being said, districts differed in how they manage vehicle maintenance and repairs. For example, staff from the Bloomington School District showed us an electronic database they use to track each vehicle’s miles, fuel usage, and maintenance needs. District staff use this information to proactively repair and maintain their vehicles. In contrast, three of the districts we visited do not keep any maintenance logs for their vehicles. Instead, these districts have buses repaired as needed and rely on their mechanics’ repair bills to track maintenance performed on the vehicles.
By law, school bus drivers are required to conduct pre-trip inspections of their school buses.12 Through these daily inspections, drivers must ensure that their vehicle’s brakes, tires, windshield wipers, and stop-arm, among other things, are in good working order. Staff from several districts we visited said the pre-trip inspections help them to adequately maintain their vehicles. Bus drivers for the Windom School District record any issues they find with their vehicle on the pre-trip inspection report. The district’s mechanic uses these reports to identify and correct vehicle maintenance issues. Similarly, staff in the Ada-Borup School District use information recorded on the pre-trip inspection reports to maintain vehicles throughout the school year.
Another aspect of vehicle oversight involves the annual school bus inspections conducted by DPS. As discussed further in Chapter 3, all vehicles used for student transportation must be inspected annually by the Minnesota State Patrol in DPS. During these inspections, State Patrol school bus inspectors examine the vehicles and ensure that they comply with safety standards. Carriers are responsible for presenting all vehicles to be inspected; DPS personnel do not know which vehicles each carrier owns and, therefore, does not know which vehicles are due for inspection. Although districts must have all of their vehicles inspected annually, one district we visited had not had its type III vehicles inspected during the past year. As a result, this district does not know if these vehicles are in compliance with student transportation vehicle standards.
12 Minnesota Rules 2007, chapter 7470.1300.
One district we visited had not had its type III vehicles inspected during the past year.
District Highlight: The St. Louis County School District requires all drivers to maintain a pre-trip inspection log and maintenance record in each vehicle. All of the vehicle’s pre-trip inspection and maintenance information is recorded on this document and supervisors, drivers, and maintenance staff can review a vehicle’s history at any time.

SCHOOL DISTRICT STUDENT TRANSPORTATION PRACTICES 33
CONTRACTOR-PROVIDED STUDENT TRANSPORTATION In the 2005-06 school year, 45 percent of school districts used a private contractor to provide at least half of their student transportation. Some districts relied completely on private contractors while others used private contractors for particular routes or types of services. School districts that contract for student transportation face different challenges than those districts that provide transportation directly. Districts that contract for student transportation typically do not directly oversee school buses or their drivers, but they must manage the student transportation contract itself, as well as other aspects of student transportation. Table 2.4 outlines best practices for school districts that contract for their student transportation. These best practices are further discussed below.
Student Transportation Contracts As outlined in Table 2.4, school districts that contract for student transportation have many responsibilities regarding the contracting process and the contract itself. For example, school districts that contract should regularly allow new carriers to compete for their student transportation contract; have a written and signed contract that outlines requirements regarding driver qualifications, vehicle age, and contractor performance; and regularly evaluate the performance of their student transportation contractor. Through our school district site visits and questionnaire, we found that:
• School districts’ contracting practices range from excellent to poor.
According to responses to our questionnaire, most school districts that contracted for transportation services in the 2006-07 school year requested proposals from private contractors within the last four years. However, staff from two districts indicated their districts have never requested proposals from contractors, and staff from ten districts were not sure when their transportation contracts were last opened. Staff from one district we visited indicated that the district has never opened its contract for bids or quotations—the district has used the same contractor to provide its regular to- and from-school transportation since the 1970s. Another district we visited has never solicited proposals for its special education transportation contract (the district directly provides its regular to- and from-school transportation). Staff in this school district said that a neighboring district uses the same contractor and believes it is a good company. District staff took this as a sufficient endorsement of the private contractor to award them the contract without soliciting competitive quotations or bids.
Through our site visits, we found that school districts’ contracts with their carriers differed substantially. For example, one school district had a nearly 200-page contract with detailed specifications, while another district had no written contract; a third district had a one-page contract that only contained payment rates. Some of the districts we visited did not have written contracts with carriers who provided special types of transportation, such as desegregation or special
In 2006, 45 percent of school districts used a private contractor to provide at least half of their student transportation.
Some school districts have never opened their student transportation contract for bids or quotations.

34 SCHOOL DISTRICT STUDENT TRANSPORTATION
Table 2.4: Best Practices for School Districts that Contract for Student Transportation
Contract • The district opens its student transportation contract to new carriers regularly, at least every four years.
• The district uses a competitive bid or quotation process to choose a provider.
• The district regularly compares its rates with neighboring districts. • The district has a written and signed contract with each of the private
contractors it uses to provide student transportation. • The contract outlines requirements regarding driver qualifications,
vehicle age, and contractor performance. • The district regularly measures contractor performance. • The contractor annually provides proof of insurance.
Driver Qualifications
• The contractor annually provides a list of all drivers providing transportation for the district.
• The contractor annually provides a copy of all drivers’ motor vehicle records. The records must demonstrate that the drivers are qualified to drive their vehicles. District staff should review these records.
• The contractor annually provides a summary of the drivers’ substance abuse tests required by federal law. The summary information should include the number of drivers in the testing pool, the number of tests conducted each year, and the test results. The contractor must certify the results.
• The contractor certifies to the district that it has provided annual driver training, as required by law.
Vehicles • The contractor annually provides a list of vehicles used for the district’s student transportation. The list should include the make and model year of all vehicles used. District staff should verify that the vehicles meet all requirements outlined in the contract.
• The contractor provides copies of all Department of Public Safety vehicle inspection records for vehicles used in the district. District staff should review the inspection records and ensure that all violations are corrected.
• The contractor provides a summary of its inspection results across all districts it serves, allowing districts to examine this data when considering whether to retain the contractor.
SOURCE: Office of the Legislative Auditor.
education transportation, although they had extensive contracts with the carriers who provided the districts’ regular to- and from-school transportation. Through its transportation audits, MDE has also found instances where school districts do not have written contracts with their carriers. Without a written contract or performance specifications, school districts have little leverage to guarantee adequate service.
Some school districts do not have written contracts with their private carriers.

SCHOOL DISTRICT STUDENT TRANSPORTATION PRACTICES 35
In our site visits, we found that some school district staff responsible for managing their district’s student transportation were not familiar with the terms of their district’s transportation contracts. For example, some district transportation staff did not know whether their district’s contract required driver training or set a maximum vehicle age for their contractor’s vehicles. In addition to not knowing the details of their contract, staff from some school districts said they do not verify that the contractor is complying with the terms of the contract. One staff person said that the district and contractor act as “two different companies.” The staff person did not think it was necessary for the district to ensure compliance with the contract because it is in the contractor’s best interest to follow the contract guidelines and comply with the law.
Contractor School Bus Drivers When a private contractor provides student transportation for a district, the contractor is responsible for complying with the driver qualification requirements outlined earlier in this chapter. These requirements are also often included directly or referenced in school districts’ contracts with their carriers. While the contracting school district does not have direct responsibility for complying with the driver qualification requirements, it is responsible for ensuring compliance with the contract.
As outlined in Table 2.4, school districts that contract for student transportation have important oversight responsibilities regarding their contractors’ drivers. Specifically, school district staff should (1) annually obtain a list of the drivers providing transportation for the district, (2) annually verify the validity of the drivers’ licenses, and (3) receive and review a summary of the contractors’ substance abuse test results. Based on our site visits of school districts, we found that:
• Many school districts we visited do not ensure that their contractors are fulfilling their driver oversight requirements.
For example, one superintendent who manages his district’s student transportation said he had “no clue” as to who his district’s school bus drivers were or their backgrounds; a superintendent from another district said part of why the district contracts for transportation is to have one less thing to worry about. Fifteen of the 24 districts we visited that used a contractor for at least part of their student transportation did not ensure that their contractors annually verified their drivers’ licenses. In contrast, five districts we visited either received copies of their contract drivers’ motor vehicle records or visited their contractors’ terminals to review the driver files directly. Three other districts verified the validity of drivers’ licenses on behalf of their contractors. However,
Many school districts do not ensure their private contractors verify that drivers are properly licensed and tested for drug and alcohol use.
District Highlight: The St. Paul School District has a comprehensive student transportation contract and contracting process. The district opens its contract to new providers annually and requires all contractors to agree to extensive contract specifications and bid on specific bus routes designed by district staff.

36 SCHOOL DISTRICT STUDENT TRANSPORTATION
staff in one of these districts did not know how to review drivers’ motor vehicle records to determine whether a driver was qualified to drive a school bus.
In addition, 19 of the 24 school districts we visited that used contractors for at least part of their student transportation did not verify that the contractors’ drivers were appropriately subject to random drug and alcohol tests, nor did they learn of the test results. Staff in one district commented that if they trusted the contractor to transport their students, they could probably trust the contractor to conduct the substance abuse tests. In contrast, the New Ulm School District required its contractor to provide an annual summary outlining its drivers’ drug and alcohol test results. The summary includes the number of drivers in the testing pool, the number of tests conducted, and the test results. The testing summary is signed by the contractor. One other school district we visited received copies of the drug and alcohol test results for its contractors’ drivers.
Vehicles When a school district contracts for student transportation, its ability to manage the vehicles used is limited. Nevertheless, Table 2.4 identifies some vehicle-related best practices school districts should employ. These practices include reviewing a list of vehicles the contractor uses to ensure that the contractor is following conditions in the contract (such as maximum vehicle age and miles) and reviewing school bus inspection reports to ensure that violations are corrected and vehicles are safe to use for student transportation. Through our site visits, we found that:
• Few of the school districts we visited monitor the age or condition of their contractors’ vehicles.
As discussed previously, school districts’ contracts for student transportation should outline requirements regarding vehicle age. According to our questionnaire, only about 30 percent of school districts that contracted for transportation services in the 2006-07 school year set a maximum age for their contractors’ school buses. Most of these districts required their contractors to use buses no more than 10 to 15 years old. However, two districts required their contractor to use buses no more than 7 years old and, one district set a maximum vehicle age of 30 years for its private contractor. Very few districts established maximum mileage amounts for their contractors’ buses.
Several of the school districts we visited did not have requirements regarding the age of the vehicles used by their contractors. Staff from one school district said the district relies on the state and federal requirements regarding vehicle condition rather than imposing maximum vehicle age requirements. Staff from another district said they rely on the DPS inspections to determine whether a vehicle is in adequate condition; vehicle age is less important than whether a vehicle passes its annual inspection.
District Highlight: The South Koochiching School District receives and maintains copies of all substance abuse test results for its contractors’ drivers.

SCHOOL DISTRICT STUDENT TRANSPORTATION PRACTICES 37
However, only 4 of the 24 school districts we visited that contracted for student transportation reviewed their contractors’ school bus inspection reports. Because DPS school bus inspection information is not publicly available, school districts that contract for student transportation must rely on their contractors to notify them of any problems. As a result, if school districts do not receive the inspection report information from their contractor, they do not know if the contractor has had problems in its DPS inspections.
STUDENT TRANSPORTATION CHALLENGES As noted previously, school district student transportation is a local operation that depends greatly on each district’s circumstances regarding student enrollment, geography, and local decisions. Some district staff with whom we met thought that student transportation did not pose any challenges. They felt their operations worked well, did not exceed their district’s transportation budget, and were relatively easy to manage. Staff from other districts, however, said they faced significant student transportation challenges. We found that:
• Many school district staff said that specialized student transportation, such as nonpublic, special education, and homeless student transportation, poses the largest challenge to student transportation operations.
As discussed in Chapter 1, specialized student transportation is often more difficult and expensive to provide because it is individualized, students are dispersed across a larger area, and destinations can be outside of the district. When this transportation is required, such as for nonpublic, special education, or homeless students, school districts have less flexibility in the extent to which they provide the services. For example, staff from one school district indicated that while the district is required to provide nonpublic school transportation, it is not adequately reimbursed for the costs associated with this service. Analysis conducted by the district demonstrated that nonpublic student transportation costs more per pupil than the district’s transportation for its neighborhood and districtwide schools.
Challenges due to special education transportation are often the result of special education divisions within school districts not coordinating with their transportation divisions when arranging off-site special education services. Transportation staff from several districts we visited indicated that the transportation division has limited ability to influence special education program start times or locations. As a result, special education transportation is often not provided in the most efficient manner possible. Additionally, special education
Few of the school districts we visited review their contractors’ school bus inspection reports.
District Highlight: The New Ulm School District requires its contractor to submit a list of the vehicles it will use to provide student transportation for the district. School district staff also review the contractor’s reports from DPS’s annual vehicle inspections.

38 SCHOOL DISTRICT STUDENT TRANSPORTATION
drivers often need supplementary training and special equipment or vehicles, which adds to the cost and challenge of providing this transportation.
Homeless student transportation also poses significant challenges for some school districts. Staff from several districts we visited did not understand their obligations under the federal McKinney-Vento Act regarding homeless student transportation. This act requires school districts to provide transportation for homeless students who originally attended school in their district for the duration of their homelessness, which could extend beyond one school year.13 Several district staff with whom we met said the rules regarding homeless student transportation are not clear. Some district staff thought the district was only obligated to provide homeless student transportation through the end of the school year or did not know the duration of the district’s obligation.
In addition to confusion about district responsibilities regarding homeless student transportation, staff from three of the largest school districts in Minnesota, Minneapolis, St. Paul, and Osseo, said that it is difficult and costly to provide. For example, a district might be required to transport a student who currently lives 20 miles or more from the school district. To provide this transportation, a school district would likely have to dedicate a vehicle to transport this student. St. Paul staff noted that the district received more than 800 requests last year for homeless student transportation. Minneapolis School District staff provided us with analysis that indicates the district spent more than $9,000 to transport each homeless student during the 2006-07 school year. In comparison, Minneapolis spent an average of $719 per student on all transportation services during the same time period.
MDE provides some guidance to school districts regarding student transportation. The department holds monthly meetings where members of the student transportation industry—student transportation directors, private contractors, and others—come together to discuss a variety of issues related to student transportation. The department also provides information to districts regarding their responsibilities for transporting nonpublic, charter school, open enrollment, and homeless students. Nevertheless, our site visits and questionnaire indicated that many school district transportation staff do not fully understand their obligations.
RECOMMENDATIONS As discussed throughout this chapter, school districts vary in how well they manage their student transportation. We found that some school districts do an excellent job providing or overseeing student transportation while others do not perform adequately. Based on our evaluation of school districts’ student transportation practices, we make the following recommendations.
13 42 U.S.Code, sec. 11431, subtitle B, sec. 722 (g) (3) (2007); and Minnesota Statutes 2007, 127A.47, subd. 2.
Homeless student transportation poses significant challenges for some school districts.

SCHOOL DISTRICT STUDENT TRANSPORTATION PRACTICES 39
Develop and Distribute Best Practices for School Districts
RECOMMENDATION
The Minnesota Department of Education should develop, distribute, and ensure compliance with school district student transportation best practices. The best practices should outline required and recommended practices for school districts that directly provide or contract for student transportation.
As discussed throughout this chapter, many school districts we visited do not understand their student transportation responsibilities. Some school districts do not understand their homeless student obligations under the McKinney-Vento Act, while others do not correctly calculate student distance from school. To help school districts better understand their responsibilities, MDE should develop and distribute student transportation best practices. MDE could use the best practices outlined in Tables 2.1, 2.3, and 2.4 in this report as a starting point.
Additionally, MDE should ensure that school districts follow these best practices. MDE auditors should include these practices as part of their review when they conduct school district transportation audits each year.
Provide Contracting Guidelines
RECOMMENDATION
The Minnesota Department of Education should provide transportation contracting guidelines and a model transportation contract for school districts.
As discussed earlier in this chapter, school districts’ contracting practices range from excellent to poor. The lack of consistency across districts is notable. Staff from several school districts we visited said it would be helpful to have a model contract to know what topics they should consider when entering into a student transportation contract. Given the differences in contracts we observed and the differences in expertise among school district staff, we agree.
While districts’ contracts will necessarily vary depending on services obtained and payment structure, there are some issues that all contracts should address. MDE should develop a contract template that provides suggested contract language for the following topics: (1) services to be provided; (2) required driver qualifications, including any standards that exceed the state’s standards; (3) driver responsibilities and operating rules; (4) vehicle standards, including age, mileage, and condition of the vehicle; (5) required reports, including those related to DPS inspections and school bus crashes; and (6) performance measures.

40 SCHOOL DISTRICT STUDENT TRANSPORTATION
Regardless of how districts ultimately construct their contracts, district staff responsible for drafting and entering into the contract should consider all relevant provisions. A model contract and contracting guidelines would help districts improve their contracts with, and oversight of, private student transportation contractors.
Implement Student Transportation Best Practices
RECOMMENDATION
School districts should follow the best practices presented in this report and best practices and contract guidelines developed by the Minnesota Department of Education to ensure adequate oversight of student transportation.
The school district student transportation best practices presented in this chapter outline practices that school districts should implement. As discussed earlier, Table 2.1 presents district-level practices that are applicable to all school districts. These practices outline what districts’ student transportation policies should address, such as which students are eligible for transportation and what fees the district charges. The practices in Table 2.1 also encourage school districts to regularly evaluate their transportation practices, routes, bus stops, and whether it makes sense to contract for transportation services. Collectively, these practices will help school districts to more effectively and consistently manage their student transportation.
Tables 2.3 and 2.4 identify more specific practices targeted to districts that either provide student transportation directly or contract for these services. For example, Table 2.3 outlines how school districts that provide student transportation directly should manage their vehicles and ensure that their drivers are qualified. Table 2.4 addresses how school districts should select a private contractor and manage the contract. The practices outlined in Tables 2.3 and 2.4 are currently implemented by some of the school districts we visited. During our visits, school district staff demonstrated that these practices are feasible and worthwhile. Following these practices would help improve the level of oversight school districts provide for their student transportation operations, whether the services are provided directly or by a private contractor.
School districts should also follow student transportation best practices and contract guidelines developed by MDE in response to the recommendations above. As discussed earlier, MDE should ensure compliance with these practices through its annual school district transportation audits.

SCHOOL DISTRICT STUDENT TRANSPORTATION PRACTICES 41
Require Additional Driver Qualifications
RECOMMENDATION
The Legislature should require student transportation carriers to hold regular type III drivers to the same standards as activities bus drivers.
The Legislature should require type III drivers to:
1. attend annual training related to student transportation and
2. pass biennial physical examinations.
The Legislature should require employers of type III drivers to:
1. conduct background checks of type III drivers,
2. annually verify and validate type III drivers’ licenses, and
3. apply the same disqualifying criminal offenses and motor vehicle violations that are in place for school bus drivers to type III drivers.
Additionally, the Legislature should require drivers of activities buses and type III vehicles to be subject to pre-employment, random, reasonable suspicion, and post-accident testing for controlled substances.
As discussed in Chapter 1, the number of type III vehicles used for student transportation has increased by about 1,200 since 1996. Similar to drivers of traditional school buses, drivers of type III vehicles are responsible for transporting students. However, Minnesota statutes do not require type III drivers to meet the same driver qualifications. As noted previously and outlined in Table 2.2, type III drivers are currently only required to have a valid class D driver’s license, the same qualification required for people driving their own personal vehicles. Because type III drivers are responsible for safely transporting students, we think there should be higher standards.
To implement this recommendation, the Legislature should amend Minnesota Statutes 171.02, subd. 2a, to require student transportation carriers to apply the same qualification requirements for type A “activities” bus drivers to type III drivers employed by a school district or private contractor. Under this recommendation, drivers of type III vehicles would not be required to have a school bus endorsement, as is required for drivers of traditional school buses. However, type III drivers would be subject to many of the same requirements as other school bus drivers, such as annual training, biennial physicals, and not having any disqualifying criminal offenses or motor vehicle violations on their record. With this change, type III drivers would not have to pass written or driving exams related to school buses.
Additionally, we think that all drivers employed by a school district or private contractor should be subject to testing for controlled substances. Testing for

42 SCHOOL DISTRICT STUDENT TRANSPORTATION
these drivers could parallel the testing requirements currently in place for drivers of traditional school buses. We think it is important to increase the requirements for type III and activities bus drivers because, like drivers of traditional school buses, they are responsible for transporting students.

State Agency
Responsibilities
SUMMARY
Student transportation is regulated by a patchwork of complicated federal and state laws and rules. The Minnesota Department of Public Safety is the state agency with primary responsibility for student transportation safety, but there are several significant deficiencies in the way the department manages those responsibilities. The department’s school bus inspection data are inadequate, and it provides only minimal oversight of school bus drivers. The department’s proposal to shift the focus of school bus inspections from scheduled annual inspections to targeted unannounced inspections of underperforming carriers has little support among school districts and could not be effectively managed with the department’s current data system.
innesota is one of the few states in which law enforcement, in addition to the state education agency, plays a significant role in overseeing student
transportation. This chapter discusses the role of various state and federal agencies responsible for student transportation and evaluates whether the Department of Public Safety, the agency with the most responsibility, is fulfilling its obligations. Specifically, this chapter addresses the following questions:
• Which state agencies oversee student transportation and what are their responsibilities?
• How well does the state ensure student transportation safety?
To answer these questions, we analyzed school bus inspection data from the Department of Public Safety (DPS). We also interviewed DPS, Minnesota Department of Education (MDE), and U.S. Department of Transportation (USDOT) staff, as well as other interested parties. We reviewed federal and state laws pertaining to student transportation and surveyed all school districts in the state. Finally, we conducted site visits of 34 school districts across the state. Through these site visits we discussed districts’ transportation needs and challenges, transportation-related responsibilities, and staff opinions regarding DPS school bus inspections, among other things.
REGULATION OF STUDENT TRANSPORTATION When managing student transportation programs, carriers (school districts that provide student transportation and private contractors) must comply with a number of laws and regulations. In addition to rules regarding driver training and qualifications (as discussed in Chapter 2), there are rules regarding vehicle
M
3

44 SCHOOL DISTRICT STUDENT TRANSPORTATION
maintenance and standards. Some regulations depend on whether a school district or private contractor provides the transportation and whether the vehicle crosses state lines. In studying these regulations, we found that:
• Student transportation is regulated by a patchwork of complicated federal and state laws and rules.
Federal and state regulations delegate different portions of student transportation oversight to USDOT, DPS, and MDE. The following sections discuss the role played by each of these agencies.
U.S. Department of Transportation At the federal level, commercial motor vehicles and carriers are subject to USDOT’s Federal Motor Carrier Safety Regulations (FMCSRs).1 USDOT defines commercial motor vehicles as vehicles used to transport 8 or more passengers for compensation or 15 or more passengers not for compensation or vehicles weighing more than 10,000 pounds. While they generally surpass these weight and passenger limits, school buses are only treated as commercial motor vehicles under special circumstances, such as when private contractors use school buses to transport paying passengers across state lines. School buses are usually exempt from the bulk of the FMCSRs, which cover most aspects of commercial transportation including vehicle standards, driver oversight, and passenger carrier regulations. Federal law, however, grants USDOT authority over commercial vehicle drivers, including school bus drivers, in the areas of substance abuse testing and school bus endorsements.2
With regard to testing for controlled substances, FMCSRs require that all drivers undergo pre-employment screening, post-accident testing, and testing when the employer has reason to suspect that a driver has used drugs or alcohol within four hours of beginning a route. Carriers are also required to conduct random drug testing on at least 50 percent of their drivers and random alcohol testing on at least 10 percent of their drivers every year. Random drug and alcohol tests must be unannounced and spread throughout the calendar year.
The FMCSRs also outline the different types of commercial drivers’ licenses (CDLs) and endorsements (such as school bus endorsements), as well as the standards states must use when granting them, including recommended content of their written and road tests. The FMCSRs outline “driver disqualifications,” motor vehicle violations that can result in the suspension of CDLs and school bus endorsements. These include operating a commercial vehicle without the proper license and failing to observe railroad crossing protocol while driving a commercial vehicle, among other things. CDLs can also be suspended when a driver commits certain moving violations in any vehicle, including driving under the influence of drugs or alcohol, leaving the scene of an accident, and speeding excessively. When a school bus-endorsed driver is convicted of a driver 1 49 CFR sec. 390.3 (2006). 2 49 CFR secs. 382 and 383 (2006).
The U.S. Department of Transportation has limited authority over school buses.

STATE AGENCY RESPONSIBILITIES 45
disqualification violation, his or her CDL can be suspended for 60 days or more, depending on the nature of the violation and whether it is a first or second offense. In some instances, drivers can permanently lose their CDLs and school bus endorsements.
While USDOT has the authority to oversee controlled substance testing of drivers and the issuing of commercial drivers’ licenses, the agency only conducts about 150 reviews of Minnesota passenger carriers (of which student transportation carriers are a subset) per year. When it audits school bus carriers, USDOT only has the authority to review drug and alcohol testing records. While the agency can oversee school bus endorsements, it does not have the right to examine whether carriers have verified their drivers’ licenses. Because school bus carriers are exempt from most of the FMCSRs, USDOT has little authority over school transportation vehicles or the training and evaluation of school bus drivers. Therefore, much of the oversight of student transportation carriers falls to the state.
Minnesota Department of Public Safety Under state law, DPS has primary responsibility for school transportation safety. DPS issues commercial drivers’ licenses and school bus endorsements to qualified applicants. In addition to the federally determined disqualifying moving violations discussed above, Minnesota law sets forth a series of disqualifying criminal offenses. An applicant will not be granted a school bus endorsement if he or she has been convicted of a felony, drug charges, or a variety of misdemeanors including criminal sexual conduct. Applicants will also be denied endorsements if they have been convicted of four moving violations within the previous three years or driving while intoxicated within the past five years.3
By law, the State Patrol in DPS must annually inspect every school bus to “ascertain whether its construction, design, equipment, and color comply with all provisions of the law.”4 During the scheduled annual inspections, department inspectors give every vehicle a decal indicating whether it passed, temporarily passed, or failed inspection. The State Patrol may also conduct random, unannounced inspections of any school bus in Minnesota. Inspectors are authorized to make unannounced visits to a carrier’s garage or anywhere else a vehicle is kept while not in operation in order to determine its compliance with state vehicle standards.5
If a driver is present during an unannounced inspection, DPS staff may include the driver in the inspection and verify things such as the driver’s seatbelt usage, that pre-trip inspection forms are completed, and that the driver is carrying a
3 Minnesota Statutes 2007, 171.3215, subd. 3. 4 Minnesota Statutes 2007, 169.451, subd. 1. 5 Minnesota Statutes 2007, 169.451, subd. 5; and Minnesota Rules 2007, chapter 7470.0500, subp. 2.
DPS is the state agency with primary responsibility for school transportation safety in Minnesota.
46 SCHOOL DISTRICT STUDENT TRANSPORTATION
valid driver’s license with the correct endorsements.6 If an inspector feels that a driver’s behavior or physical condition endangers the students on the vehicle, DPS has the authority to “fail” that driver. For example, a driver who did not wear required corrective lenses would be put “out of service.” The inspector would issue a citation to the driver and the carrier would have to provide another driver to complete the route.
Finally, as part of its responsibility for school transportation safety, DPS has the authority, but is not required, to review carriers’ driver qualification files. As discussed in Chapter 2, carriers must oversee their drivers by (1) annually verifying the validity of their drivers’ licenses, and (2) providing training and maintaining documentation indicating that the drivers have met the state’s school bus driver training and assessment requirements.7 Carriers must also annually conduct random substance abuse testing on a specific percentage of their drivers. During their annual inspection visits, DPS staff can examine the training and assessment records and driver’s license reviews that carriers are supposed to maintain for each driver, as well as evidence of the carrier’s random substance abuse testing program.
Minnesota Department of Education The Minnesota Department of Education oversees school districts’ student and financial reporting, including reporting related to transportation.8 The department conducts approximately 12 school district transportation audits each year, during which department staff verify that school districts are complying with reporting regulations. MDE is also responsible for assisting school districts in developing and implementing their student transportation policies. The department, however, has no direct oversight authority over those policies or districts’ compliance with school bus safety requirements.
The remainder of this chapter discusses DPS’s role in greater detail and the extent to which it is fulfilling its responsibilities, as well as the department’s proposed changes to the school bus inspection model. The chapter concludes with recommendations for both DPS and the Legislature.
PERFORMANCE OF THE DEPARTMENT OF PUBLIC SAFETY As mentioned previously, Minnesota statutes give DPS “primary responsibility for school transportation safety.”9 That responsibility includes assisting in the
6 As discussed in Chapter 2, Minnesota Rules 2007, chapter 7470.1300, requires that prior to driving a route, the driver or “other designated person” conducts a daily pre-trip inspection of the school bus. A record of this inspection must be kept inside the vehicle during operation. 7 Minnesota Statutes 2007, 171.321, subds. 4(c) and 5. 8 Minnesota Statutes 2007, 123B.92, subd. 5(d). 9 Minnesota Statutes 2007, 169.435, subd. 1.
DPS may, but is not required to, review the qualification files of people who drive student transportation vehicles.

STATE AGENCY RESPONSIBILITIES 47
development and interpretation of student transportation-related laws and policies, developing model school bus driver training programs and assessments, overseeing driver qualifications, devising a point system for use during annual school bus inspections, and conducting the inspections themselves. We think these specific requirements give DPS an overall responsibility to provide leadership in school transportation safety. However, we found that:
• The Department of Public Safety has several significant deficiencies in the way it manages its school bus safety responsibilities.
A combination of inadequate data systems and limited resources has hampered DPS’s ability to provide sufficient oversight of school bus safety. For example, DPS does not have reliable data regarding its decisions to put vehicles “out of service” due to significant inspection violations. Additionally, the department provides minimal oversight of school bus drivers—either directly or by ensuring that carriers are overseeing their drivers. Finally, DPS has inconsistent and incomplete inspection data that do not allow department officials to see or analyze trends regarding school bus inspections. The following sections discuss these issues in greater detail.
School Bus Inspections DPS’s largest ongoing school bus safety obligation is to annually inspect every vehicle used for student transportation in Minnesota. School bus inspections, whether scheduled or random, are intended to ensure that vehicles used for student transportation are safe and meet all required legal standards. Based on available data, the State Patrol conducts about 14,000 school bus inspections each year, most of which are scheduled annual inspections.10 Since 2002, 88 percent of the inspections conducted by DPS have been annual inspections, 4 percent have been random, and 8 percent have been reinspections of vehicles that failed or received “temporary passes” during their scheduled annual inspections.
During a vehicle’s required annual inspection, DPS school bus inspectors are responsible for detecting and recording all violations. Minnesota rules set forth a point system which assigns weights to violations according to their impact on the vehicle’s safety. According to Minnesota rules, school buses start with a score of 100 and inspectors deduct specific point values in accordance with the violations they identify.11 Vehicles earning a score between 96 and 100 pass automatically, while those earning between 80 and 95 points receive a “temporary pass.”12 Carriers may continue using a bus with a temporary pass but must repair all defects and complete an inspection sheet certifying repairs within 14 days. School buses that lose more than 20 points are put “out of service” and cannot be 10 All data presented in this chapter are organized by calendar year. Data are missing for 2005 and we have only incomplete data for 2002 and 2007. All data presented in this chapter refer to vehicles owned by school districts and their contractors. We excluded all vehicles owned by private schools, charter schools, churches, and health or behavioral treatment programs. 11 Minnesota Rules 2007, chapter 7470.0600, subp. 1. 12 Minnesota Rules 2007, chapter 7470.0600, subps. 2-3.
DPS must annually inspect every student transportation vehicle in Minnesota.

48 SCHOOL DISTRICT STUDENT TRANSPORTATION
used to transport students until they have been fixed and the carrier certifies that the defects have been corrected.13
When a vehicle receives a temporary pass or rejection sticker during an annual inspection, the vehicle must be repaired and the repairs certified by the carrier. Once this is done, the vehicle may be used for student transportation, “pending reinspection and certification of the bus by a trooper.”14 While this implies that the vehicle should be reinspected eventually, some inspectors told us that they do not have time to conduct reinspections. One inspector we interviewed mentioned a recent inspection in which he had given several buses temporary passes due to clouded window panes in their windshields, doors, and front windows. Rather than reinspect the vehicles himself, the inspector relied on the carrier’s certification that the window panes had been fixed. Although the carrier returned the required paperwork indicating that it had addressed the violations, drivers from the company called the inspector to report that the windows had not been repaired or replaced. The inspector believed the situation merited another inspection but, at the time of our interview, had not revisited the carrier.
Every inspection results in an examination report listing all of the violations found on a given vehicle. DPS inspectors give this report to the carrier that owns the vehicle, but the information is not available publicly. School districts that contract for their student transportation services do not receive the results of their private contractors’ vehicle inspections unless the contractor provides them with copies.
Between 2002 and 2007, DPS inspectors identified violations in an average of 18 percent of the school bus inspections.15 During that same period, an average of 5 percent of the inspections the department conducted resulted in a vehicle being put out of service for having accumulated more than 20 points worth of deductions. For each year of available data, Table 3.1 shows the percentage of inspections in which DPS staff recorded violations and marked vehicles out of service, as well as the average number of points deducted per vehicle with at least one violation. During the period in question, vehicles with violations lost an average of almost 14 points per inspection.
Table 3.2 shows the number of violations recorded during inspections, grouped by point values. Point value groupings reflect whether an individual violation can put a vehicle in temporary or out-of-service status. The table demonstrates that the distribution of the different types of violations has remained relatively stable since 2002.
13 Minnesota Rules 2007, chapter 7470.0600, subp. 4. 14 Minnesota Rules 2006, chapter 7470.0600, subp. 3. 15 Data are missing for 2005 and we have only incomplete data for 2002 and 2007. Driver-only inspections and violations (which appear in the 2006 and 2007 data, but not the 2002 to 2004 data) have been excluded from the analysis in this section.
According to DPS data, on average, its inspectors identified violations in 18 percent of school bus inspections.
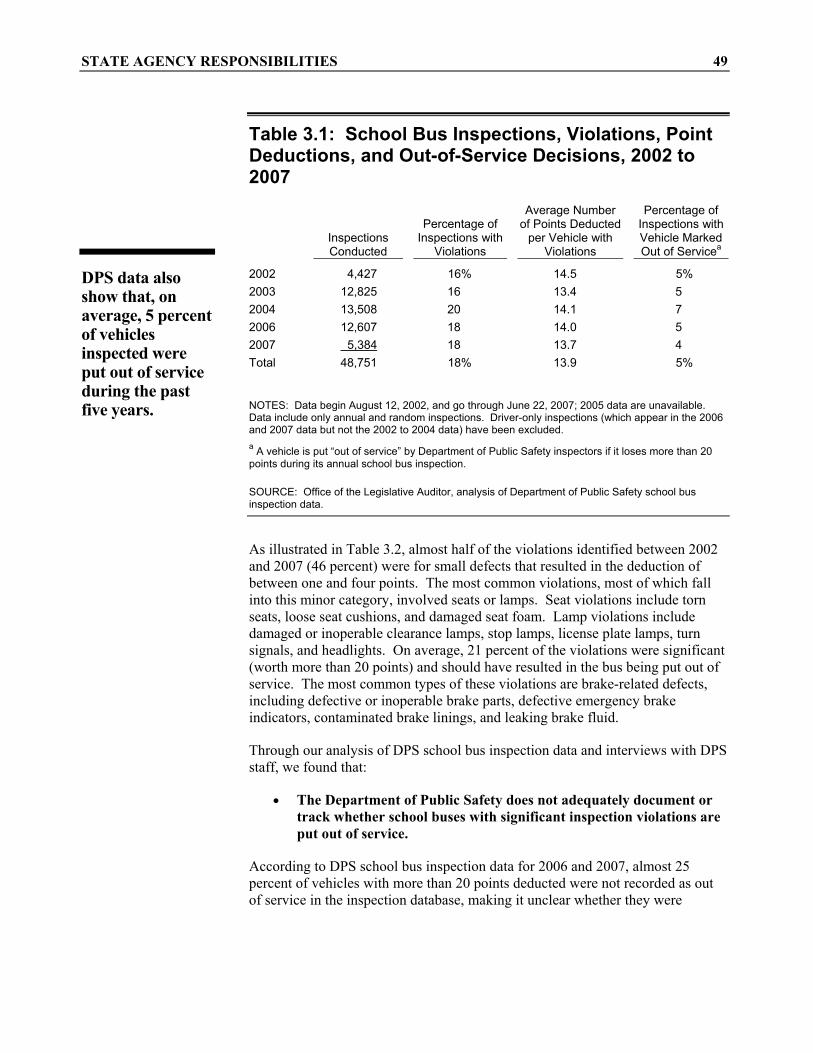
STATE AGENCY RESPONSIBILITIES 49
Table 3.1: School Bus Inspections, Violations, Point Deductions, and Out-of-Service Decisions, 2002 to 2007
Inspections Conducted
Percentage of Inspections with
Violations
Average Number of Points Deducted
per Vehicle with Violations
Percentage of Inspections with Vehicle Marked Out of Servicea
2002 4,427 16% 14.5 5% 2003 12,825 16 13.4 5 2004 13,508 20 14.1 7 2006 12,607 18 14.0 5 2007 5,384 18 13.7 4 Total 48,751 18% 13.9 5%
NOTES: Data begin August 12, 2002, and go through June 22, 2007; 2005 data are unavailable. Data include only annual and random inspections. Driver-only inspections (which appear in the 2006 and 2007 data but not the 2002 to 2004 data) have been excluded. a A vehicle is put “out of service” by Department of Public Safety inspectors if it loses more than 20 points during its annual school bus inspection.
SOURCE: Office of the Legislative Auditor, analysis of Department of Public Safety school bus inspection data.
As illustrated in Table 3.2, almost half of the violations identified between 2002 and 2007 (46 percent) were for small defects that resulted in the deduction of between one and four points. The most common violations, most of which fall into this minor category, involved seats or lamps. Seat violations include torn seats, loose seat cushions, and damaged seat foam. Lamp violations include damaged or inoperable clearance lamps, stop lamps, license plate lamps, turn signals, and headlights. On average, 21 percent of the violations were significant (worth more than 20 points) and should have resulted in the bus being put out of service. The most common types of these violations are brake-related defects, including defective or inoperable brake parts, defective emergency brake indicators, contaminated brake linings, and leaking brake fluid.
Through our analysis of DPS school bus inspection data and interviews with DPS staff, we found that:
• The Department of Public Safety does not adequately document or track whether school buses with significant inspection violations are put out of service.
According to DPS school bus inspection data for 2006 and 2007, almost 25 percent of vehicles with more than 20 points deducted were not recorded as out of service in the inspection database, making it unclear whether they were
DPS data also show that, on average, 5 percent of vehicles inspected were put out of service during the past five years.

50 SCHOOL DISTRICT STUDENT TRANSPORTATION
Table 3.2: Percentage of School Bus Inspection Violations by Point Value and Year, 2002 to 2007
Number of Violations
1-4 Points Deducted
5-20 Points Deducted
More Than 20 Points Deducted Total
2002 1,213 43% 35% 23% 100% 2003 3,706 49 32 19 100 2004 4,564 46 32 22 100 2006 3,806 41 36 22 100 2007 1,748 51 29 19 100 Total 15,008 46% 33% 21% 100%
NOTES: Violations worth between one and four points are relatively minor and cannot, by themselves, result in a temporary pass or out-of-service designation for a vehicle. Violations worth between 5 and 20 points are somewhat more serious and automatically put a vehicle in temporary status, requiring certification of repairs pending reinspection. Violations worth more than 20 points are significant. These defects compromise the safety of the school bus and result in an automatic out-of-service designation for the vehicle.
Data begin August 12, 2002, and go through June 22, 2007; 2005 data are unavailable. Data include only violations for which point values are available. Violations recorded during driver-only inspections (which appear in the 2006 and 2007 data but not the 2002 to 2004 data) have been excluded.
An inspection could result in more than one violation. Therefore, the number of violations above does not represent the number of inspections with violations. Percentages above may not sum due to rounding.
SOURCE: Office of the Legislative Auditor, analysis of Department of Public Safety school bus inspection data.
actually put out of service as required by law.16 Table 3.3 shows the number of school bus inspections resulting in out-of-service decisions by the number of points deducted. From January 1, 2006, through June 22, 2007, school bus inspectors deducted more than 20 points from 1,040 student transportation vehicles. Of these vehicles, 252 were not recorded as out of service in the department’s school bus inspection database. DPS officials could not demonstrate whether this is simply a data error or if buses were not put out of service as required by law. In addition, DPS inspectors recorded 24 school buses as out of service even though their inspection records indicated they had deducted 20 points or fewer during the inspection. Once again, DPS officials are unable to demonstrate whether this is a data error or if vehicles were put out of service without cause.
According to DPS officials, when an inspection results in more than 20 points deducted, the inspector puts the vehicle out of service. DPS officials stated that the out-of-service designation in their database does not necessarily reflect
16 When completing an inspection report, inspectors list the violation and the number of points deducted in a “Violation Description” field. There is a separate data field in which the inspector designates the vehicle “OOS Y” (out of service) or “OOS N” (not out of service). In these cases, the sum of the points deducted exceeded 20, but the inspectors marked the vehicles not out of service.
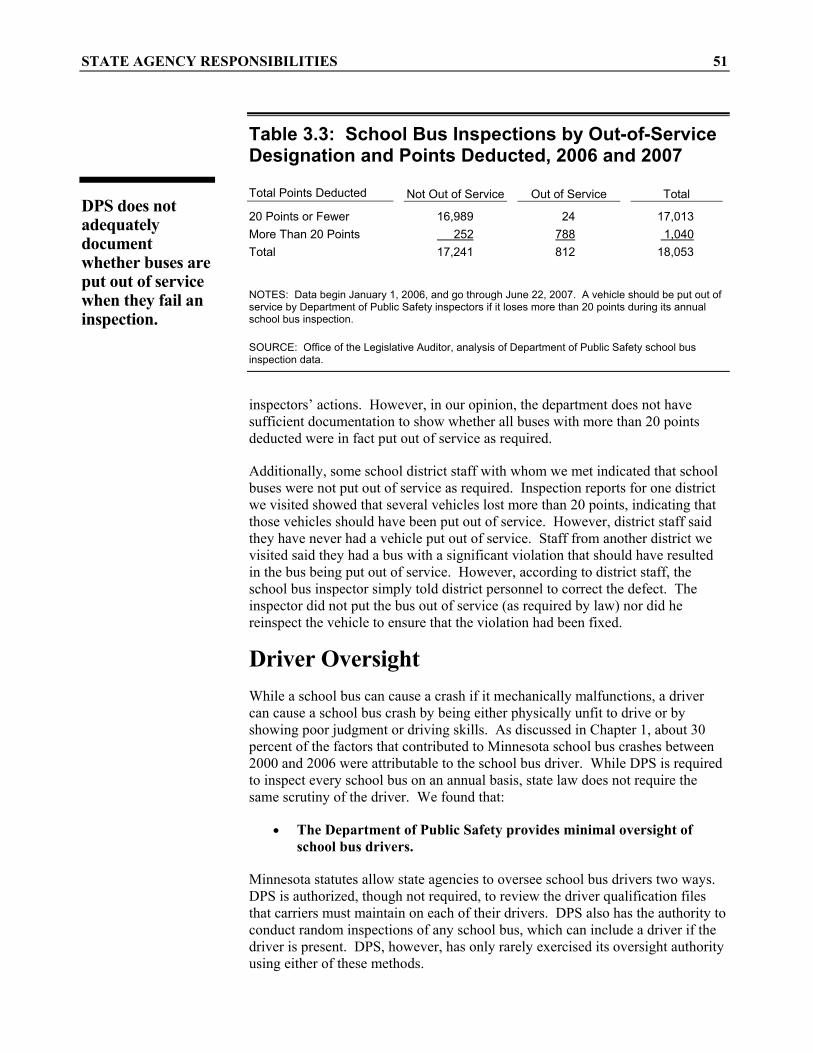
STATE AGENCY RESPONSIBILITIES 51
Table 3.3: School Bus Inspections by Out-of-Service Designation and Points Deducted, 2006 and 2007
Total Points Deducted Not Out of Service Out of Service Total
20 Points or Fewer 16,989 24 17,013 More Than 20 Points 252 788 1,040 Total 17,241 812 18,053
NOTES: Data begin January 1, 2006, and go through June 22, 2007. A vehicle should be put out of service by Department of Public Safety inspectors if it loses more than 20 points during its annual school bus inspection.
SOURCE: Office of the Legislative Auditor, analysis of Department of Public Safety school bus inspection data.
inspectors’ actions. However, in our opinion, the department does not have sufficient documentation to show whether all buses with more than 20 points deducted were in fact put out of service as required.
Additionally, some school district staff with whom we met indicated that school buses were not put out of service as required. Inspection reports for one district we visited showed that several vehicles lost more than 20 points, indicating that those vehicles should have been put out of service. However, district staff said they have never had a vehicle put out of service. Staff from another district we visited said they had a bus with a significant violation that should have resulted in the bus being put out of service. However, according to district staff, the school bus inspector simply told district personnel to correct the defect. The inspector did not put the bus out of service (as required by law) nor did he reinspect the vehicle to ensure that the violation had been fixed.
Driver Oversight While a school bus can cause a crash if it mechanically malfunctions, a driver can cause a school bus crash by being either physically unfit to drive or by showing poor judgment or driving skills. As discussed in Chapter 1, about 30 percent of the factors that contributed to Minnesota school bus crashes between 2000 and 2006 were attributable to the school bus driver. While DPS is required to inspect every school bus on an annual basis, state law does not require the same scrutiny of the driver. We found that:
• The Department of Public Safety provides minimal oversight of school bus drivers.
Minnesota statutes allow state agencies to oversee school bus drivers two ways. DPS is authorized, though not required, to review the driver qualification files that carriers must maintain on each of their drivers. DPS also has the authority to conduct random inspections of any school bus, which can include a driver if the driver is present. DPS, however, has only rarely exercised its oversight authority using either of these methods.
DPS does not adequately document whether buses are put out of service when they fail an inspection.

52 SCHOOL DISTRICT STUDENT TRANSPORTATION
As part of their annual school bus inspections, some DPS inspectors review a sample of driver files maintained by the carrier. Through this review, inspectors look for documentation of driver training or assessment and verification of drivers’ licenses. If they have time, some inspectors review motor vehicle records directly to verify that drivers’ school bus endorsements are valid and that they are otherwise qualified to drive a school bus. However, many inspectors do not review any driver files, and some told us they do not have time to do so. In addition, while federal law gives DPS inspectors the authority to review drug and alcohol testing records, they often choose not to because such records are kept under lock and key or at a different location from the driver files.17
As mentioned previously, most of the inspections (88 percent) recorded by DPS have been scheduled, annual inspections. While inspectors examine the vehicles during these annual visits, they do not evaluate the driver. State law also grants DPS the authority to conduct random inspections of any school bus. When random inspections occur outside of the terminal, DPS has the opportunity to inspect the driver as well as the vehicle. In 2006 and 2007, DPS recorded 591 inspections that included the bus driver, which represent only 3 percent of all inspections documented during this time period.18 Almost one-quarter of these inspections (137) resulted in driver violations, including drivers carrying expired drivers’ licenses, failing to wear seatbelts, and not completing the required pre-trip vehicle inspections.
Despite the fact that DPS has legal authority to review driver files and conduct random driver inspections, it concentrates its student transportation safety resources on annual vehicle inspections. DPS staff indicated this is largely due to time constraints. State Patrol resources devoted to school bus and motor coach activities have decreased in recent years. The division’s resources have gone from 13.5 full-time equivalent positions in 2000 to 10.8 full-time equivalents in November 2007.19 One inspector said that he used to review driver files as part of the inspection process but no longer has time to do so. DPS officials said they would like inspectors to conduct more unannounced and driver inspections, but that their time is too limited because of their annual vehicle inspection obligations. Since the law requires the State Patrol to annually inspect every school bus in the state, but does not specifically require DPS to inspect drivers or review driver files, inspectors facing time constraints prioritize vehicle inspections above driver oversight.
School Bus Inspection Data Since 2002, DPS has used three separate computer systems to collect school bus inspection data. These systems collect different data in different formats. Data from one system (for 2005) are incomplete and only available in hard copy. 17 49 CFR sec. 382.405(d) (2006). 18 School bus inspection data from 2002 to 2004 do not provide information on driver inspections. According to DPS officials, inspectors do not currently record all driver-only inspections. 19 These full-time equivalents represent 11 inspectors and 1 inspector supervisor dedicated to school bus safety.
Only 3 percent of school bus inspections in 2006 and 2007 examined whether the school bus driver was complying with driver-related requirements.

STATE AGENCY RESPONSIBILITIES 53
Through our interviews with DPS staff and our analysis of the available school bus inspection data, we found that:
• The Department of Public Safety’s school bus inspection data system is of limited use to inspectors and supervisors. In addition, the data are incomplete and inconsistent.
DPS has used its current data system, adapted from a federal program designed for recording commercial trucking inspections, since January 1, 2006; the data entered into this program reside on the federal system and on inspectors’ laptops. Some inspectors, however, do not have the expertise to access data from previous inspections and, as a result, are unable to enforce certain portions of the law. According to Minnesota rules, buses that lose a total of four points during the annual vehicle examination pass inspection but are supposed to be put out of service during the next scheduled inspection if the violations have not been addressed.20 Because some inspectors do not know how to access past inspection records, they do not know whether the one- and two-point violations they identify during a given inspection have appeared for the first time or have gone unaddressed from a previous visit.
Besides the inability of some DPS inspectors to access historical data in the field, the system only allows for limited analysis from department headquarters. While there are some data fields that DPS staff can query independently, there are others that they can access only by calling and requesting the data from the system’s federal administrators. Other types of information cannot be queried at all. DPS staff can find the violation detail for a given inspection by referring to an individual inspection report, but the data system does not allow for comprehensive analysis of inspection violations or points deducted. Because the system does not include standardized violation descriptions, DPS staff are unable to analyze the prevalence of different types of violations over time. Since the system does not separately record the points deducted on an inspection, DPS cannot conduct point-based analysis to determine whether buses are appropriately put out of service.21
Beyond the limitations of the data system itself, DPS inspectors enter data into the system inconsistently, resulting in unreliable data and further limiting the types of analysis the department can perform. We discuss some of these problems in more depth below.
Out-of-service results. As mentioned previously, inspection data indicate that more than 20 points were deducted from 252 vehicles that were not recorded as out of service in the inspection database and may not have been put out of service, as required by law. While the violation descriptions and point values listed on the inspection report demonstrate whether a vehicle should have been
20 Minnesota Rules 2007, chapter 7470.0600, subp. 2. 21 Our office was able to conduct analysis of violations and point deductions only after manually transferring violation detail from individual inspection reports into the school bus inspection database.
DPS’s inspection data have significant limitations.

54 SCHOOL DISTRICT STUDENT TRANSPORTATION
put out of service, the out-of-service designation in the database provides the only evidence that a vehicle actually was put out of service. DPS officials do not know whether these discrepancies reflect data errors or inspector inconsistencies.
Reinspection data. According to DPS officials, school bus inspectors are not supposed to enter reinspection findings as separate inspection records in the database. However, we found several vehicles in the database that were inspected more than once during the same day or week, likely indicating that the inspector recorded a reinspection.22 Incorrect coding of this sort may bias analysis of other data, making it appear as though DPS conducted more annual inspections than it did, or that an artificially high number of vehicles passed inspection with no violations.23 Furthermore, because DPS does not systematically collect reinspection data, the department is unable to analyze information regarding the number or results of these follow-up inspections.
Point values. The data reveal that inspectors record point values in an inconsistent manner. For example, when recording violation information for a vehicle with three torn seats (worth two points each) some inspectors enter the complete violation description three separate times, whereas others condense the description into something like “seat condition (2 pts) x3.” This inconsistency makes analysis of violation numbers unreliable. The number of violations that appears in the dataset comes from the number of individual inspection items entered into the inspection report. In the first example above, the data would show the vehicle as having three violations, while the vehicle in the second example would only appear to have one violation.
PROPOSED INSPECTION MODEL During the 2007 legislative session, DPS supported House and Senate bills that would remove responsibility for the annual school bus inspections from the State Patrol.24 While the legislation would have required that school buses still undergo annual inspections, it would have allowed these inspections to be conducted by other certified inspectors, including mechanics employed by school districts and private contractors. This proposed inspection model would more closely follow how other commercial vehicles in Minnesota are inspected. DPS personnel have stated that in lieu of the scheduled annual inspections, they would conduct more unannounced inspections that include school bus drivers. DPS would use school bus inspection data to target these unannounced inspections. However, in working with DPS data and interviewing department staff, we found that:
22 For the purposes of our data analysis, we recoded any second inspection recorded within 14 days of an initial annual inspection as a reinspection. 23 For a vehicle to pass reinspection, all previously identified violations must be properly addressed. During a reinspection, inspectors do not conduct a full school bus inspection, they only verify that previously identified violations have been corrected. As a result, no points should be deducted during a reinspection. 24 2007 Legislative Session, House File 2048 and Senate File 1944.
DPS has supported a change in Minnesota’s approach to school bus inspections.

STATE AGENCY RESPONSIBILITIES 55
• The Department of Public Safety does not currently have adequate
data or resources to effectively target unannounced school bus inspections.
Additionally, through our school district site visits and questionnaire we found that:
• Most school district staff oppose changes to the current school bus inspection model.
The preceding section regarding the department’s data demonstrates that DPS does not have complete or accurate data on which to base its selection of carriers for unannounced inspections. The out-of-service designations and total violation numbers that the department would use to identify under-performing carriers are not reliable. Also, without the capacity to analyze violation detail or point deductions, DPS is unable to target carriers with disproportionate numbers of significant violations.
The State Patrol does not currently have resources or expertise to adequately analyze and use data to target random inspections. As mentioned previously, the State Patrol’s full-time equivalent positions devoted to school bus activities have decreased since 2000. While there is one staff person capable of querying the federal inspection database, the department currently does not have personnel with the expertise to analyze the data in a meaningful way.
In addition, DPS does not have school district support for its proposed inspection model. In general, school district staff are satisfied with the current structure of the department’s school bus inspections. Almost 90 percent of the school district staff who responded to our questionnaire think the annual school bus inspections conducted by DPS are useful. In our site visits and other interviews, some school district staff said they viewed annual inspections as opportunities for their mechanics to learn about maintenance advances and changes in vehicle standards. Similarly, 71 percent of survey respondents think DPS’s unannounced school bus inspections are useful. Several districts we visited reported that unannounced inspections keep their mechanics and drivers “on their toes.”
Most survey respondents (67 percent) did not think carriers should conduct or contract for their own annual school bus inspections in lieu of the DPS inspections. Our site visits revealed that some school district staff, particularly in outstate areas, are concerned that local mechanics would not be willing to accept the perceived liability associated with school bus inspections and that it would be difficult to find qualified inspectors to conduct annual inspections.25 Under the proposed legislation, carriers with mechanics would be able to conduct their own inspections as long as the mechanics were properly certified. Some district personnel suggested that carriers inspecting their own vehicles would constitute a conflict of interest. Some staff expressed the concern that carriers would cut corners if they conducted their own inspections and many said that they 25 Contrary to the belief of some school district staff, the current school bus inspection system does not remove liability from the carrier.
School district staff are satisfied with the current approach to school bus inspections.
56 SCHOOL DISTRICT STUDENT TRANSPORTATION
appreciated having their vehicles evaluated by an outside inspector who is impartial, knowledgeable, and possesses regulatory power.
RECOMMENDATIONS As discussed throughout this chapter, DPS should improve its oversight of student transportation. Based on our evaluation, we make the following recommendations.
Improve and Increase Inspections
RECOMMENDATION
The Department of Public Safety should improve student transportation safety by:
1. ensuring that its inspectors provide consistent and thorough school bus inspections,
2. ensuring that all inspectors follow the department’s rules, and
3. conducting more inspections that include bus drivers.
DPS inspectors have not consistently applied relevant Minnesota rules in their school bus inspections. Nearly 25 percent of vehicles that should have failed inspection during the past two years have not been marked out of service in the DPS inspection database. If these buses were allowed to operate despite having lost more than 20 points during an annual inspection, then DPS is not fulfilling its responsibilities.
In order to guarantee vehicle safety, DPS should ensure that its inspectors are familiar with and consistently implementing department rules and procedures during their vehicle inspections. All buses that lose more than 20 points should be put out of service, and all vehicles that lose 5 points or more should be reinspected or certified that violations have been corrected. These standards should be applied fairly and consistently by all inspectors.
As discussed earlier, only 3 percent of DPS’s recorded 2006 and 2007 inspections included drivers. Nearly one-quarter of these resulted in violations, as opposed to 18 percent of vehicle-only inspections. In order to reduce the chance of school bus accidents resulting from human error, DPS should increase the number of driver inspections it conducts each year.
The number of full-time equivalent positions dedicated to school bus activities has declined in recent years, making expanded inspection goals difficult to achieve. Implementing this recommendation may require additional resources dedicated to school transportation safety.

STATE AGENCY RESPONSIBILITIES 57
Require Increased Carrier Oversight
RECOMMENDATION
The Legislature should require the Department of Public Safety to review a sample of driver files during its annual student transportation vehicle inspections.
Minnesota law requires student transportation carriers, whether school districts or private contractors, to verify that their drivers are properly licensed and to either evaluate their drivers or ensure that they have received eight hours of school bus driver training on an annual basis. Federal law requires that carriers perform pre-employment drug and alcohol screening on all drivers as well as randomly test a sample of their drivers each year. Carriers must keep records proving that their drivers are qualified in each of these areas. Through our site visits we learned that the condition of school districts’ driver files varied widely, and that some district personnel do not know how to verify that their drivers are qualified.
In order to ensure that carriers properly verify their drivers’ qualifications, we recommend that the Legislature require DPS to examine carriers’ driver files in conjunction with their scheduled annual vehicle inspections. It is the transportation carrier’s responsibility to oversee its drivers and ensure that they are properly qualified. No state or federal agency, however, ensures that carriers understand and properly fulfill these obligations. USDOT has the authority to oversee drug and alcohol testing and school bus endorsements, but it reviews only a small portion of school bus carriers and lacks authority to view carriers’ driver training files or annual driver’s license verifications. While DPS has the authority to review carriers’ complete driver files, school bus inspectors do not currently examine driver qualification files with any consistency. Instead, inspectors have focused on their annual vehicle inspections, which they are required by law to conduct.
The Legislature should amend Minnesota Statutes 169.451, subd. 1, to require the Minnesota State Patrol to annually examine a sample of each carrier’s driver files. Inspectors should specifically look for evidence that, within the past year, the drivers either passed an evaluation or attended eight hours of training and that the carrier has verified the validity of its drivers’ licenses. Inspectors should also look for evidence that the carrier is fulfilling its driver drug and alcohol testing requirements.
If student transportation carriers know that their driver files will be reviewed by the State Patrol on an annual basis, they will have an incentive to maintain proper driver records. DPS can also use the driver file reviews as an opportunity to educate carriers that are not properly fulfilling their driver oversight responsibilities.

58 SCHOOL DISTRICT STUDENT TRANSPORTATION
Improve Inspection Data
RECOMMENDATION
The Department of Public Safety should improve its school bus inspection data system to ensure consistency and allow for more robust use of the data.
As discussed previously in this chapter, DPS’s data system, which was originally designed to record the results of commercial trucking inspections, is not well suited for school bus inspections and does not allow department staff to analyze aggregated data on violation types or points deducted during inspections. The data system itself prevents DPS from conducting meaningful analysis, as the data reside in a federal database and can only be queried in a limited capacity. The integrity of the department’s data is further compromised when inspectors record school bus inspection results inconsistently. For example, inspectors inconsistently assign out-of-service designations to vehicles that have lost more than 20 points, vary in how they record violations and assign points, and inconsistently record reinspections.
DPS had hoped to begin using inspection data to target carriers for unannounced inspections. The current system, however, does not allow inspectors or supervisors to easily analyze inspection data by carrier. DPS also cannot use its current data to verify that inspections are being conducted properly.
In order to make better use of its inspection data, DPS should consider implementing a different data system. This system should be tailored to school bus inspections and should allow for the collection of all the data that DPS needs to evaluate its own performance and that of student transportation carriers. At a minimum, the system should allow DPS staff to systematically analyze violation types, total point deductions, and out-of-service rates. DPS inspectors should be instructed on the proper use of the data system the department chooses, and their inspection records should be periodically evaluated for correct data entry practices.
If DPS’s data system allows for historical analysis and inspectors use the data system appropriately and consistently, inspectors will eventually be able to target underperforming carriers for unannounced inspections.
Publicly Post Vehicle Out-of-Service Rates
RECOMMENDATION
The Department of Public Safety should post student transportation carriers’ vehicle out-of-service rates on its web site.
Under the current inspection model, an out-of-service designation has no lasting repercussions. If a carrier corrects a vehicle’s violations and the vehicle is

STATE AGENCY RESPONSIBILITIES 59
reinspected immediately, a vehicle would receive its inspection certificate without ever missing a route, and no one outside of the garage would know that a carrier’s vehicle had “failed” the inspection.
Having out-of-service information provided publicly might encourage carriers to improve their performance on the DPS inspections. Additionally, posting out-of-service rates on a public web site would help school districts that contract for student transportation services evaluate the performance of their existing and potential contractors. It would allow them to take vehicle safety into account when writing, entering into, and renewing contracts with private student transportation carriers. At a minimum, DPS should automatically provide school districts with copies of their contractors’ school bus inspection reports so that districts can verify that their contractors’ vehicles meet the standards specified in their student transportation contracts.


List of Recommendations
• The Minnesota Department of Education should develop, distribute, and ensure compliance with school district student transportation best practices. The best practices should outline required and recommended practices for school districts that directly provide or contract for student transportation (p. 39).
• The Minnesota Department of Education should provide transportation contracting guidelines and a model transportation contract for school districts (p. 39).
• School districts should follow the best practices presented in this report and best practices and contract guidelines developed by the Minnesota Department of Education to ensure adequate oversight of student transportation (p. 40).
• The Legislature should require student transportation carriers to hold regular type III drivers to the same standards as activities bus drivers.
The Legislature should require type III drivers to:
1. attend annual training related to student transportation and
2. pass biennial physical examinations.
The Legislature should require employers of type III drivers to:
1. conduct background checks of type III drivers,
2. annually verify and validate type III drivers’ licenses, and
3. apply the same disqualifying criminal offenses and motor vehicle violations that are in place for school bus drivers to type III drivers.
Additionally, the Legislature should require drivers of activities buses and type III vehicles to be subject to pre-employment, random, reasonable suspicion, and post-accident testing for controlled substances (p. 41).

62 SCHOOL DISTRICT STUDENT TRANSPORTATION
• The Department of Public Safety should improve student transportation safety
by:
1. ensuring that its inspectors provide consistent and thorough school bus inspections,
2. ensuring that all inspectors follow the department’s rules, and
3. conducting more inspections that include bus drivers (p. 56).
• The Legislature should require the Department of Public Safety to review a sample of driver files during its annual student transportation vehicle inspections (p. 57).
• The Department of Public Safety should improve its school bus inspection data system to ensure consistency and allow for more robust use of the data (p. 58).
• The Department of Public Safety should post student transportation carriers’ vehicle out-of-service rates on its web site (p. 58).

School District Site Visits
APPENDIX
Ada-Borup Public School District Annandale Public School District Anoka-Hennepin Public School District Balaton Public School District Belle Plaine Public School District Bloomington Public School District Carlton Public School District Eden Prairie Public School District Greenbush-Middle River School District Jordan Public School District La Crescent-Hokah School District Lac Qui Parle Valley School District Le Center Public School District Minneapolis Public School District Minneota Public School District Minnetonka Public School District Mounds View Public School District Nashwauk-Keewatin School District New Ulm Public School District Norwood Public School District/Central Public Schools Osseo Public School District Pipestone Area School District Rochester Public School District Roseau Public School District Ruthton-Tyler-Russell/ RTR Public Schools South Koochiching School District South St. Paul Public School District St. Louis County School District St. Paul Public School District Thief River Falls School District United South Central School District Waseca Public School District Westonka Public School District Windom Public School District

64 SCHOOL DISTRICT STUDENT TRANSPORTATION
Figure A.1: School District Site Visit Locations
La Crescent-HokahLa Crescent-HokahLa Crescent-HokahLa Crescent-HokahLa Crescent-HokahLa Crescent-HokahLa Crescent-HokahLa Crescent-HokahLa Crescent-Hokah
Eden PrairieBloomington
Mounds View
Anoka-Hennepin
St. Louis CountySt. Louis CountySt. Louis CountySt. Louis CountySt. Louis CountySt. Louis CountySt. Louis CountySt. Louis CountySt. Louis County
Ruthton-Ty ler-Russell
Belle PlaineBelle PlaineBelle PlaineBelle PlaineBelle PlaineBelle PlaineBelle PlaineBelle PlaineBelle PlaineMinneotaMinneotaMinneotaMinneotaMinneotaMinneotaMinneotaMinneotaMinneota
BalatonBalatonBalatonBalatonBalatonBalatonBalatonBalatonBalaton
Carlton
New UlmNew UlmNew UlmNew UlmNew UlmNew UlmNew UlmNew UlmNew Ulm
Le CenterLe CenterLe CenterLe CenterLe CenterLe CenterLe CenterLe CenterLe Center
WindomWindomWindomWindomWindomWindomWindomWindomWindom
JordanJordanJordanJordanJordanJordanJordanJordanJordan
Pipestone AreaPipestone AreaPipestone AreaPipestone AreaPipestone AreaPipestone AreaPipestone AreaPipestone AreaPipestone AreaUnited South CentralUnited South CentralUnited South CentralUnited South CentralUnited South CentralUnited South CentralUnited South CentralUnited South CentralUnited South Central
WasecaWasecaWasecaWasecaWasecaWasecaWasecaWasecaWaseca
Lac Qui Parle ValleyLac Qui Parle ValleyLac Qui Parle ValleyLac Qui Parle ValleyLac Qui Parle ValleyLac Qui Parle ValleyLac Qui Parle ValleyLac Qui Parle ValleyLac Qui Parle Valley
AnnandaleAnnandaleAnnandaleAnnandaleAnnandaleAnnandaleAnnandaleAnnandaleAnnandale
Greenbush-Greenbush-Greenbush-Greenbush-Greenbush-Greenbush-Greenbush-Greenbush-Greenbush-Middle Riv erMiddle Riv erMiddle Riv erMiddle Riv erMiddle Riv erMiddle Riv erMiddle Riv erMiddle Riv erMiddle Riv er
Thief Riv er FallsThief Riv er FallsThief Riv er FallsThief Riv er FallsThief Riv er FallsThief Riv er FallsThief Riv er FallsThief Riv er FallsThief Riv er Falls
South KoochichingSouth KoochichingSouth KoochichingSouth KoochichingSouth KoochichingSouth KoochichingSouth KoochichingSouth KoochichingSouth Koochiching
Nashwauk-Nashwauk-Nashwauk-Nashwauk-Nashwauk-Nashwauk-Nashwauk-Nashwauk-Nashwauk-KeewatinKeewatinKeewatinKeewatinKeewatinKeewatinKeewatinKeewatinKeewatin
WestonkaWestonkaWestonkaWestonkaWestonkaWestonkaWestonkaWestonkaWestonkaMinneapolisMinneapolisMinneapolisMinneapolisMinneapolisMinneapolisMinneapolisMinneapolisMinneapolis
NorwoodNorwoodNorwoodNorwoodNorwoodNorwoodNorwoodNorwoodNorwood
MinnetonkaMinnetonkaMinnetonkaMinnetonkaMinnetonkaMinnetonkaMinnetonkaMinnetonkaMinnetonka South St. PaulSouth St. PaulSouth St. PaulSouth St. PaulSouth St. PaulSouth St. PaulSouth St. PaulSouth St. PaulSouth St. Paul
St. PaulSt. PaulSt. PaulSt. PaulSt. PaulSt. PaulSt. PaulSt. PaulSt. Paul
OsseoOsseoOsseoOsseoOsseoOsseoOsseoOsseoOsseo
RochesterRochesterRochesterRochesterRochesterRochesterRochesterRochesterRochester
RoseauRoseauRoseauRoseauRoseauRoseauRoseauRoseauRoseau
Ada-BorupAda-BorupAda-BorupAda-BorupAda-BorupAda-BorupAda-BorupAda-BorupAda-Borup
SOURCE: Office of the Legislative Auditor.

EQUAL OPPORTUNITY EMPLOYER
Office of the Commissioner 445 Minnesota Street � Suite 1000 � Saint Paul, Minnesota 55101-5100 Phone: 651.201.7160 � Fax: 651.297.5728 � TTY: 651.282.6555 www.dps.state.mn.us
MINNESOTA DEPARTMENT OF PUBLIC SAFETY
January 16, 2008 James Nobles Legislative Auditor Room 140 Centennial Building 658 Cedar Street St. Paul, MN 55155-1603 Dear Mr. Nobles: I have received your final program evaluation draft relating to School District Student Transportation. Our department recognizes and appreciates the extensive and thorough process your office conducted in evaluating the School Bus Safety Program. The department realizes through your findings and recommendations, that there is significant room for improving elements of the school bus safety program. Even at this time, the Pupil Transportation Safety Director has implemented additional safety activities in response to your recommendations. The Department of Public Safety remains committed to the safe transportation of children to and from school, and school related activities. If you have any questions please feel free to contact Captain Ken Urquhart, who serves as the Pupil Transportation Safety Director for the department at (651) 405-6180. Sincerely, Michael Campion, Commissioner c: Colonel Mark Dunaski
id11557953 pdfMachine by Broadgun Software - a great PDF writer! - a great PDF creator! - http://www.pdfmachine.com http://www.broadgun.com


January 16, 2008 Mr. James Nobles Office of the Legislative Auditor Room 140 Centennial Building 658 Cedar Street St. Paul, Minnesota 55155 Dear Mr. Nobles: Thank you for the Office of the Legislative Auditor’s (OLA) report on “School District Student Transportation”. The Minnesota Department of Education (MDE) appreciates the thorough review of the student transportation program and finances by OLA staff during the development of this report. Pages 39 and 40 of the report include three recommendations relating to MDE. We are pleased to state that MDE supports all three recommendations and looks forward to implementing them. The following represents MDE’s specific responses to each of these three recommendations: Recommendation #1 The Minnesota Department of Education should develop, distribute, and ensure compliance with school district student transportation best practices. The best practices should outline required and recommended practices for school districts that directly provide or contract for student transportation. MDE agrees with this recommendation. In consultation with school districts, school bus contractors, and other interested parties, MDE will develop materials explaining school district student transportation best practices, and will disseminate these materials through direct e-mail to school districts and charter schools, postings on the MDE web site, and workshop / conference presentations. MDE will also work to ensure compliance with these best practices by including selected best practice indicators in the review process when school district transportation audits are conducted each year, and by posting audit findings to the MDE web site.

Minnesota Department of Education Response to OLA Report on School District Student Transportation Page 2 Recommendation #2 The Minnesota Department of Education should provide transportation contracting guidelines and a model transportation contract for school districts. MDE agrees with this recommendation. In consultation with school districts, school bus contractors, and other interested parties, MDE will develop transportation contracting guidelines and a model transportation contract for school districts, and will disseminate these materials through direct e-mail to school districts and charter schools, postings on the MDE web site, and workshop / conference presentations. Recommendation #3 School districts should follow the best practices presented in this report and best practices and contract guidelines developed by the Minnesota Department of Education to ensure adequate oversight of student transportation. MDE supports this recommendation, and will work to ensure compliance by disseminating information, providing training, including selected best practice indicators in the review process when school district transportation audits are conducted each year, and by posting audit findings to the MDE web site. Again, we thank you for the hard work of the OLA’s staff in researching the student transportation program and writing this report. Please contact Dr. Tom Melcher, Program Finance Director, at (651)582-8828 if you should have any questions. Sincerely,
Alice Seagren Commissioner Cc: Chas Anderson, Deputy Commissioner Tom Melcher, Program Finance Director Tammy McGlone, Administrative Services Director

Recent Program Evaluations Forthcoming Evaluations “Green Acres” and Agricultural Land Preservation Programs, February 2008 JOBZ Program, February 2008 Financial Management of Health Care Programs,
February 2008 State Highways and Bridges, February 2008 Charter Schools, June 2008 Agriculture Pesticide Regulation, March 2006 Animal Feedlot Regulation, January 1999 Criminal Justice Substance Abuse Treatment, February 2006 Community Supervision of Sex Offenders, January 2005 CriMNet, March 2004 Chronic Offenders, February 2001 District Courts, January 2001 Education, K-12, and Preschool School District Student Transportation, January 2008 School District Integration Revenue, November 2005 No Child Left Behind, February/March 2004 Charter School Financial Accountability, June 2003 Teacher Recruitment and Retention: Summary of Major Studies, March 2002 Early Childhood Education Programs, January 2001 School District Finances, February 2000 Education, Postsecondary Compensation at the University of Minnesota, February 2004 Higher Education Tuition Reciprocity, September 2003 The MnSCU Merger, August 2000 Environment and Natural Resources Watershed Management, January 2007 State-Funded Trails for Motorized Recreation, January 2003 Water Quality: Permitting and Compliance Monitoring, January 2002 Minnesota Pollution Control Agency Funding, January 2002 Recycling and Waste Reduction, January 2002 State Park Management, January 2000 Counties’ Use of Administrative Penalties for Solid and Hazardous Waste Violations, February 1999 Metropolitan Mosquito Control District, January 1999 Financial Institutions, Insurance, and Regulated Industries Liquor Regulation, March 2006 Energy Conservation Improvement Program, January 2005 Directory of Regulated Occupations in Minnesota, February 1999 Occupational Regulation, February 1999
Government Operations County Veterans Service Offices, January 2008 Pensions for Volunteer Firefighters, January 2007 Postemployment Benefits for Public Employees, January 2007 State Grants to Nonprofit Organizations, January 2007 Tax Compliance, March 2006 Professional/Technical Contracting, January 2003 State Employee Health Insurance, February 2002 State Archaeologist, April 2001 State Employee Compensation, February 2000 State Mandates on Local Governments, January 2000 Health Nursing Home Inspections, February 2005 Minnesota Care, January 2003 Insurance for Behavioral Health Care, February 2001 Human Services Human Services Administration, January 2007 Public Health Care Eligibility Determination for Noncitizens, April 2006 Substance Abuse Treatment, February 2006 Child Support Enforcement, February 2006 Child Care Reimbursement Rates, January 2005 Medicaid Home and Community-Based Waiver Services for Persons with Mental Retardation or Related Conditions, February 2004 Controlling Improper Payments in the Medicaid Assistance Program, August 2003 Economic Status of Welfare Recipients, January 2002 Juvenile Out-of-Home Placement, January 1999 Housing and Local Government Preserving Housing: A Best Practices Review, April 2003 Managing Local Government Computer Systems: A Best Practices Review, April 2002 Local E-Government: A Best Practices Review, April 2002 Affordable Housing, January 2001 Preventive Maintenance for Local Government Buildings: A Best Practices Review, April 2000 Jobs, Training, and Labor Misclassification of Employees as Independent
Contractors, November 2007 Prevailing Wages, January 2007 Workforce Development Services, February 2005 Financing Unemployment Insurance, January 2002 Miscellaneous Economic Impact of Immigrants, May 2006 Gambling Regulation and Oversight, January 2005 Minnesota State Lottery, February 2004 Transportation Metropolitan Airports Commission, January 2003 Transit Services, February 1998
Evaluation reports can be obtained free of charge from the Legislative Auditor’s Office, Program Evaluation Division, Room 140 Centennial Building, 658 Cedar Street, Saint Paul, Minnesota 55155, 651-296-4708. Full text versions of recent reports are also available at the OLA web site: http://www.auditor.leg.state.mn.us