Evaluation Report New Jersey Offshore Wind Solicitation #2
209
May 25, 2021 Public Version Page 1 Evaluation Report New Jersey Offshore Wind Solicitation #2 prepared for The New Jersey Board of Public Utilities May 25, 2021 Public Version
Transcript of Evaluation Report New Jersey Offshore Wind Solicitation #2

May 25, 2021
Public Version Page 1
Evaluation Report
New Jersey Offshore Wind Solicitation #2
prepared for
The New Jersey Board of Public Utilities
May 25, 2021
Public Version

May 25, 2021
Public Version Page 2
Limitation on Liability This report has been prepared for the New Jersey Board of Public Utilities (“Board”) for the sole purpose of evaluating the applications submitted in response to the Board’s Offshore Wind Solicitation. Findings contained herein depend on the assumptions identified in our report. While Levitan & Associates, Inc. (“LAI”) believes these assumptions to be reasonable, there is no assurance that any specific set of assumptions will actually be encountered. LAI gives no assurances except those explicitly set forth herein.

May 25, 2021
Public Version Page i
TABLEOFCONTENTS
Table of Contents ........................................................................................................................................... i
Executive Summary ....................................................................................................................................... 1
Background ............................................................................................................................................... 1
Submitted Applications ............................................................................................................................. 1
Evaluation Results ..................................................................................................................................... 2
OREC Purchase Price and Ratepayer Impact ........................................................................................ 4
Economic Impacts and Strength of Guarantees for Economic Impacts ............................................... 4
Environmental and Fisheries Impacts ................................................................................................... 5
Likelihood of Successful Commercial Operation .................................................................................. 6
Portfolio Evaluation .............................................................................................................................. 6
Strengths, Weaknesses, Opportunities and Threats ............................................................................... 11
1 Overview of Applications and Project Alternatives .............................................................................. 13
1.1 Atlantic Shores ............................................................................................................................ 16
1.2 Ocean Wind 2 .............................................................................................................................. 19
2 OREC Purchase Price and Ratepayer Impacts ...................................................................................... 23
2.1 Levelized OREC Purchase Price ................................................................................................... 25
2.1.1 Transmission System Upgrade Cost Uncertainty and Reconciliation ................................. 26
2.1.1.1 Atlantic Shores ................................................................................................................ 28
2.1.1.2 Ocean Wind 2 .................................................................................................................. 36
2.2 Net OREC Cost ............................................................................................................................. 39
2.2.1 Market Price Projections ..................................................................................................... 39
2.2.1.1 Energy Price Projection ................................................................................................... 39
2.2.1.2 Capacity Price Projection ................................................................................................ 43
2.2.1.3 New Jersey Class I REC Price Projection .......................................................................... 44
2.2.2 Present Value of Net OREC Cost ......................................................................................... 44
2.2.3 Levelized Net OREC Cost ..................................................................................................... 46
2.3 Ratepayer Impacts ...................................................................................................................... 47
2.4 Comparison to First New Jersey Solicitation and Other States .................................................. 49
3 Economic Impacts and Strength of Guarantees for Economic Impacts ............................................... 51
3.1 EEW Phase 2 Factory Development ............................................................................................ 55
3.1.1 Atlantic Shores .................................................................................................................... 59
3.1.2 Ocean Wind 2 ...................................................................................................................... 60
3.2 Other Economic Development Plan Activities ............................................................................ 62
3.2.1 Workforce and Community Development Initiatives ......................................................... 62
3.2.1.1 Atlantic Shores Initiatives ................................................................................................ 63
3.2.1.2 Ocean Wind 2 Other Initiatives ....................................................................................... 64
3.2.2 Economic Development Plan Phases .................................................................................. 65
3.2.2.1 Wind Turbine Generator Manufacturing Facilities ......................................................... 66
3.2.2.2 Union Engagement for Project Construction .................................................................. 67
3.2.2.3 Operation and Maintenance Facilities ............................................................................ 67

May 25, 2021
Public Version Page ii
3.2.2.4 Decommissioning ............................................................................................................ 68
3.3 Guaranteed Direct Economic Development Effects ................................................................... 68
3.3.1 Comparative Evaluation ...................................................................................................... 68
3.3.2 Atlantic Shores .................................................................................................................... 74
3.3.3 Ocean Wind 2 ...................................................................................................................... 76
3.4 LAI Evaluation of Expected In‐State Economic Development Effects ......................................... 77
3.5 Applicant‐Provided IMPLAN Inputs and Results ......................................................................... 86
3.5.1 Estimated In‐State Direct Spending .................................................................................... 86
3.5.2 Estimated Direct Jobs Created ............................................................................................ 88
3.5.3 Applicant‐Provided IMPLAN Results ................................................................................... 89
3.5.4 Comparison of Applicant‐Provided IMPLAN Results .......................................................... 91
4 Environmental and Fisheries Impacts .................................................................................................. 93
4.1 Regional Air Quality Impacts ....................................................................................................... 94
4.1.1 Direct Emissions .................................................................................................................. 94
4.1.2 Avoided Emissions .............................................................................................................. 95
4.1.3 Monetization of Net Emissions Impacts ............................................................................. 96
4.1.4 Emissions Accounting .......................................................................................................... 99
4.1.4.1 Atlantic Shores .............................................................................................................. 100
4.1.4.2 Ocean Wind 2 ................................................................................................................ 101
4.2 Environmental and Fisheries Protection and Permitting Plans ................................................ 101
4.2.1 Feasibility and Strength of Environmental Protection Plan .............................................. 101
4.2.1.1 Atlantic Shores .............................................................................................................. 102
4.2.1.2 Ocean Wind 2 ................................................................................................................ 104
4.2.2 Feasibility and Strength of Fisheries Protection Plan ....................................................... 105
4.2.2.1 Atlantic Shores .............................................................................................................. 106
4.2.2.2 Ocean Wind 2 ................................................................................................................ 107
4.2.3 Completeness of Permitting Plan and Reasonableness of Timelines and Milestones ..... 108
4.2.3.1 Atlantic Shores .............................................................................................................. 109
4.2.3.2 Ocean Wind 2 ................................................................................................................ 109
4.2.4 Permit Status and Potential Obstacles to Obtaining Permits ........................................... 109
4.2.4.1 Atlantic Shores .............................................................................................................. 110
4.2.4.2 Ocean Wind 2 ................................................................................................................ 111
4.2.5 POI Future‐Proofing .......................................................................................................... 111
4.2.5.1 Atlantic Shores .............................................................................................................. 112
4.2.5.2 Ocean Wind 2 ................................................................................................................ 113
4.3 Summary of Qualitative Scoring ............................................................................................... 113
5 Likelihood of Successful Commercial Operation ................................................................................ 114
5.1 Project Design ........................................................................................................................... 115
5.1.1 Wind Turbine Generator Suitability .................................................................................. 115
5.1.1.1 Atlantic Shores .............................................................................................................. 115
5.1.1.2 Ocean Wind 2 ................................................................................................................ 116
5.1.2 Foundation Suitability ....................................................................................................... 117
5.1.2.1 Atlantic Shores .............................................................................................................. 117

May 25, 2021
Public Version Page iii
5.1.2.2 Ocean Wind 2 ................................................................................................................ 118
5.1.3 Inter‐array and Export Cables Suitability .......................................................................... 118
5.1.3.1 Atlantic Shores .............................................................................................................. 118
5.1.3.2 Ocean Wind 2 ................................................................................................................ 119
5.1.4 Offshore Substations Suitability ........................................................................................ 119
5.1.4.1 Atlantic Shores .............................................................................................................. 119
5.1.4.2 Ocean Wind 2 ................................................................................................................ 120
5.1.5 Storage and Innovative Technologies ............................................................................... 120
5.1.5.1 Atlantic Shores .............................................................................................................. 121
5.1.5.2 Ocean Wind 2 ................................................................................................................ 121
5.2 Transmission ............................................................................................................................. 122
5.2.1 Interconnection Plan ......................................................................................................... 122
5.2.1.1 Atlantic Shores .............................................................................................................. 123
5.2.1.2 Ocean Wind 2 ................................................................................................................ 125
5.2.2 Site Control of Onshore Locations .................................................................................... 126
5.2.2.1 Atlantic Shores .............................................................................................................. 127
5.2.2.2 Ocean Wind 2 ................................................................................................................ 127
5.3 Ports and Infrastructure Development ..................................................................................... 127
5.3.1 Construction Phase Ports and Infrastructure Development ............................................. 128
5.3.1.1 Atlantic Shores .............................................................................................................. 129
5.3.1.2 Ocean Wind 2 ................................................................................................................ 130
5.3.2 Operations Phase O&M Facilities and Related Logistics ................................................... 131
5.3.2.1 Atlantic Shores .............................................................................................................. 131
5.3.2.2 Ocean Wind 2 ................................................................................................................ 132
5.4 Experience ................................................................................................................................. 132
5.4.1 Developer Offshore Wind Experience .............................................................................. 132
5.4.1.1 Atlantic Shores .............................................................................................................. 133
5.4.1.2 Ocean Wind 2 ................................................................................................................ 134
5.4.2 Key Personnel Offshore Wind Experience ........................................................................ 134
5.4.2.1 Atlantic Shores .............................................................................................................. 135
5.4.2.2 Ocean Wind 2 ................................................................................................................ 136
5.5 Suppliers and Labor ................................................................................................................... 137
5.5.1 Supplier Arrangements ..................................................................................................... 137
5.5.1.1 Atlantic Shores .............................................................................................................. 138
5.5.1.2 Ocean Wind 2 ................................................................................................................ 139
5.5.2 EPC Contractor and Union Engagement ........................................................................... 139
5.5.2.1 Atlantic Shores .............................................................................................................. 140
5.5.2.2 Ocean Wind 2 ................................................................................................................ 140
5.5.3 Training Programs and University Partnerships ............................................................... 140
5.5.3.1 Atlantic Shores .............................................................................................................. 141
5.5.3.2 Ocean Wind 2 ................................................................................................................ 141
5.6 Financial Strength and Financing Plan ...................................................................................... 142
5.6.1 Ownership and Financial Strength .................................................................................... 142
5.6.1.1 Atlantic Shores .............................................................................................................. 142

May 25, 2021
Public Version Page iv
5.6.1.2 Ocean Wind 2 ................................................................................................................ 144
5.6.2 Financing Plan ................................................................................................................... 144
5.6.2.1 Atlantic Shores .............................................................................................................. 145
5.6.2.2 Ocean Wind 2 ................................................................................................................ 146
5.7 Default Risk ............................................................................................................................... 146
5.8 Summary of Qualitative Scoring ............................................................................................... 147
6 Cost‐Benefit Analysis .......................................................................................................................... 149
7 Project Ranking ................................................................................................................................... 153
7.1 OREC Purchase Price and Ratepayer Impacts ........................................................................... 153
7.2 Economic Impacts and Strength of Guarantees for Economic Impacts ................................... 154
7.3 Environmental and Fisheries Impacts ....................................................................................... 155
7.4 Likelihood of Successful Commercial Operation....................................................................... 156
7.5 Consolidated Scores .................................................................................................................. 157
8 Portfolio Evaluation ............................................................................................................................ 159
8.1 Cost‐Benefit Analysis ................................................................................................................ 159
8.2 Preliminary Portfolio Evaluation with Aggregate Project Scores .............................................. 162
8.3 Final Portfolio Evaluation with Additional Diversification Criteria ........................................... 170
8.3.1 Economic Development Diversification ............................................................................ 171
8.3.2 Technology Diversification ................................................................................................ 171
8.3.3 Applicant Diversification ................................................................................................... 172
8.4 Strengths, Weaknesses, Opportunities, and Threats ................................................................ 172
Appendix A: LAI Commodity Price Forecasting Models and Key Assumptions and Data
Appendix B: Levelized Net OREC Cost Calculation
Appendix C: Input‐Output Model Description and Assumptions

May 25, 2021
Public Version Page v
TABLEOFFIGURES
Figure 1. Project Scores ................................................................................................................................. 3
Figure 2. Scores for Selected Portfolios ........................................................................................................ 8
Figure 3. Present Value of Selected Portfolios .............................................................................................. 9
Figure 4. Unitized Cost of Selected Portfolios ............................................................................................ 10
Figure 5. NJ Residential Electric Bill Impact for Selected Portfolios ........................................................... 11
Figure 6. WTG Layouts for Atlantic Shores Projects ................................................................................... 17
Figure 7. Atlantic Shores Export Cable Route and Port Facilities ................................................................ 18
Figure 8. WTG Layout for Ocean Wind 2 Projects ...................................................................................... 20
Figure 9. Ocean Wind 2 Export Cable Route ............................................................................................... 21
Figure 10. Ocean Wind 2 Port Facilities ...................................................................................................... 22
Figure 11. Levelized Net OREC Cost ............................................................................................................ 23
Figure 12. Energy Price Projections ............................................................................................................ 40
Figure 13. ACE Energy Price Projection Benchmark ................................................................................... 41
Figure 14. PSEG Energy Price Projection Benchmark ................................................................................. 41
Figure 15. JCPL Energy Price Projection Benchmark ................................................................................... 42
Figure 16. RECO Energy Price Projection Benchmark ................................................................................. 42
Figure 17. Capacity Price Projection, ........................................................................................................... 43
Figure 18. New Jersey Class I REC Price Projection Benchmark ................................................................. 44
Figure 19. Present Value of Net OREC Cost ................................................................................................ 45
Figure 20. Levelized Net OREC Cost ............................................................................................................ 47
Figure 21. Unitized Levelized Economic Impacts ........................................................................................ 51
Figure 22. Applicant‐Provided Expected Allocation Shares of In‐State Direct Spending ............................ 88
Figure 23. Total Raw Environmental and Fisheries Impacts Scores ............................................................ 93
Figure 24. Present Value of Net Emissions Benefit ..................................................................................... 98
Figure 25. Levelized Net Emissions Benefit ................................................................................................ 99
Figure 26. Total Raw Likelihood of Successful Commercial Operation Scores ......................................... 114
Figure 27. Project Benefit‐to‐Cost Ratios ................................................................................................. 152
Figure 28. OREC Purchase Price and Ratepayer Impacts Scores .............................................................. 154
Figure 29. Economic Impacts and Strength of Guarantees Scores ........................................................... 155
Figure 30. Environmental and Fisheries Impacts Scores .......................................................................... 156
Figure 31. Likelihood of Successful Commercial Operation Scores .......................................................... 157
Figure 32. Project Scores ........................................................................................................................... 158
Figure 33. Portfolio Benefit and Cost Present Value ................................................................................ 160
Figure 34. Portfolio Benefit‐Cost Ratios .................................................................................................... 161
Figure 35. Incremental Benefits and Costs of Portfolios Relative to *BC/ /EC* ............................ 162
Figure 36. Portfolio Scores ........................................................................................................................ 163
Figure 37. Project and Portfolio Scores Relative to Capacity .................................................................... 164
Figure 38. PVNOC Relative to Capacity ..................................................................................................... 165
Figure 39. LNOC Relative to Capacity ........................................................................................................ 165
Figure 40. Total Spend Comparison by Portfolio ...................................................................................... 166
Figure 41. Unit OREC Cost Comparison by Portfolio ................................................................................. 167
Figure 42. Total Spend Comparison by Portfolio Relative to *BC/ /EC* ........................................ 168
Figure 43. Unit OREC Cost Comparison by Portfolio Relative to *BC/ /EC* ................................... 168
Figure 44. Retail Rate Impact by Portfolio – All NJ EDC Load ................................................................... 169

May 25, 2021
Public Version Page vi
Figure 45. NJ Residential Electric Bill Impact by Portfolio ........................................................................ 170
Figure 46. SWOT for Atlantic Shores *BC/ /EC* ......................................................... 173
Figure 47. SWOT for Ocean Wind 2 Projects A and B ............................................................................... 174
Figure 48. Incremental SWOT for *BC/ /EC* 175
Figure 49. Incremental SWOT for Atlantic Shores Project C and Ocean Wind 2 Project A or B ............... 176

May 25, 2021
Public Version Page vii
TABLEOFTABLES
Table 1. Summary of Key Project Characteristics ......................................................................................... 2
Table 2. OREC Purchase Price Summary ....................................................................................................... 4
Table 3. Project Sizes and Production ......................................................................................................... 14
Table 4. Project Configurations ................................................................................................................... 15
Table 5. Project Costs .................................................................................................................................. 16
Table 6. OREC Purchase Price Summary ..................................................................................................... 25
Table 7. Applicant TSUC Inputs ................................................................................................................... 27
Table 8. TSUC Calculation Results ............................................................................................................... 27
Table 9. Project Combinations of Queue Positions .................................................................................... 28
Table 10. PJM SIS Costs for Atlantic Shores’ Queue Positions .................................................................... 29
Table 11. Atlantic Shores P50 and P90 TSUC Estimates ............................................................................. 30
Table 12. *BC/ /EC* ........................................ 34
Table 13. *BC/ /EC* ........................................................... 34
Table 14. *BC/ /EC* ...................................................................... 35
Table 15. *BC/ /EC* ............................................ 35
Table 16. Ocean Wind 2’s P50 and P90 TSUC Estimates ............................................................................ 37
Table 17. Other PJM Queue Positions at *BC/ /EC* ............................ 37
Table 18. Ocean Wind 2 BAFO P50 and P90 TSUC for Smithburg 500 kV .................................................. 38
Table 19. LAI’s Evaluation TSUC Estimates for Smithburg 500 kV .............................................................. 39
Table 20. Project Zonal and Nodal Points of Interconnection .................................................................... 40
Table 21. Present Value of Net OREC Cost ................................................................................................. 45
Table 22. Levelized Net OREC Cost ............................................................................................................. 46
Table 23. Retail Rate Impacts ...................................................................................................................... 48
Table 24. Levelized Pricing Comparison ...................................................................................................... 49
Table 25. Discount‐weighting Factors by Economic Effects Category and Guarantee ............................... 54
Table 26. *BC/ /EC* ............................................................ 57
Table 27. ASOW *BC/ /EC* ................................................................................. 60
Table 28. *BC/ /EC* ...................................................... 61
Table 29. *BC/ /EC* .................................................. 61
Table 30. Workforce and Community Development Initiatives ................................................................. 63
Table 31. In‐State Spending and Jobs Key Drivers and Commitment Type ................................................ 69
Table 32. Expected and Guaranteed In‐State Spending by Applicant and Project ..................................... 71
Table 33. Expected and Guaranteed In‐State Jobs by Applicant and Project ............................................. 73
Table 34. Ocean Wind 2 Matrix of Guarantees and Compensation ........................................................... 77
Table 35. Modeled Lifetime Expected NJ GDP Effects ................................................................................ 79
Table 36. Discount‐weighted Lifetime Expected NJ GDP Effects ................................................................ 80
Table 37. PV of Discount‐weighted Lifetime Expected NJ GDP Effects ...................................................... 81
Table 38. PV of Discount‐weighted Lifetime Expected NJ GDP Effects per Unit Capacity ......................... 82
Table 39. Modeled Lifetime Expected NJ Employment Effects .................................................................. 83
Table 40. Discount‐weighted Lifetime Expected NJ Employment Effects .................................................. 84
Table 41. PV of Discount‐weighted Lifetime Expected NJ Employment Effects ......................................... 85
Table 42. PV of Discount‐weighted Lifetime Expected NJ Employment Effects ......................................... 86
Table 43. Applicant‐Provided Expected In‐State Direct Spending .............................................................. 87
Table 44. Applicant‐Provided Expected Direct Jobs ................................................................................... 89

May 25, 2021
Public Version Page viii
Table 45. Lifetime Direct, Indirect and Induced Employment Impacts for Atlantic Shores Projects ......... 89
Table 46. Atlantic Shores Lifetime Increased In‐State Activity by Project .................................................. 90
Table 47. Atlantic Shores Total (Direct, Indirect, Induced) GDP Effects by Project and Phase .................. 90
Table 48. Ocean Wind 2 Lifetime Economic Effects of In‐State Spending by Project ................................ 91
Table 49. Applicant‐Provided IMPLAN Employment Effects ...................................................................... 91
Table 50. Applicant‐Provided IMPLAN GDP Effects .................................................................................... 92
Table 51. Average Annual Direct Emissions by Proposed Project by Phase ............................................... 95
Table 52. Average Annual Avoided Emissions by Proposed Project ........................................................... 96
Table 53. Emissions Accounting Evaluation Criteria ................................................................................. 100
Table 54. Emissions Accounting Ratings ................................................................................................... 100
Table 55. Feasibility and Strength of Environmental Protection Plan Evaluation Criteria ....................... 102
Table 56. Feasibility and Strength of Environmental Protection Plan Ratings ......................................... 102
Table 57. Feasibility and Strength of Fisheries Protection Plan Evaluation Criteria ................................. 106
Table 58. Feasibility and Strength of Fisheries Protection Plan Ratings ................................................... 106
Table 59. Completeness of Permitting Plan and Reasonableness of Timelines and Milestones Evaluation
Criteria ...................................................................................................................................................... 109
Table 60. Completeness of Permitting Plan and Reasonableness of Timelines and Milestones Ratings . 109
Table 61. Permit Status and Potential Obstacles to Obtaining Permits Evaluation Criteria ..................... 110
Table 62. Permit Status and Potential Obstacles to Obtaining Permits Ratings ....................................... 110
Table 63. POI Future‐Proofing Evaluation Criteria .................................................................................... 112
Table 64. POI Future‐Proofing Ratings ...................................................................................................... 112
Table 65. Environmental and Fisheries Impacts Weighting Factors and Total Scores ............................. 113
Table 66. Wind Turbine Generator Suitability Evaluation Criteria ........................................................... 115
Table 67. Wind Turbine Generator Suitability Ratings ............................................................................. 115
Table 68. Foundation Suitability Evaluation Criteria ................................................................................ 117
Table 69. Foundation Suitability Ratings .................................................................................................. 117
Table 70. Inter‐array and Export Cables Suitability Evaluation Criteria .................................................... 118
Table 71. Inter‐array and Export Cables Suitability Ratings ...................................................................... 118
Table 72. Offshore Substations Suitability Evaluation Criteria ................................................................. 119
Table 73. Offshore Substations Suitability Ratings ................................................................................... 119
Table 74. Storage and Innovative Technologies Evaluation Criteria ........................................................ 120
Table 75. Storage and Innovative Technologies Ratings .......................................................................... 121
Table 76. Interconnection Plan Evaluation Criteria .................................................................................. 122
Table 77. Interconnection Plan Ratings .................................................................................................... 123
Table 78. Interconnection Work Completion Dates Relative to Project CODs ......................................... 124
Table 79. Site Control of Onshore Locations Evaluation Criteria .............................................................. 126
Table 80. Site Control of Onshore Locations Ratings ................................................................................ 126
Table 81. Construction Phase Ports and Infrastructure Development Evaluation Criteria ...................... 128
Table 82. Construction Phase Ports and Infrastructure Development Ratings ........................................ 129
Table 83. Operations Phase O&M Facilities and Related Logistics Evaluation Criteria ............................ 131
Table 84. Operations Phase O&M Facilities and Related Logistics Ratings .............................................. 131
Table 85. Developer Offshore Wind Experience Evaluation Criteria ........................................................ 133
Table 86. Developer Offshore Wind Experience Ratings .......................................................................... 133
Table 87. Ørsted Offshore Wind projects in the U.S. ................................................................................ 134
Table 88. Key Personnel Offshore Wind Experience Evaluation Criteria .................................................. 134
Table 89. Key Personnel Offshore Wind Experience Ratings .................................................................... 135

May 25, 2021
Public Version Page ix
Table 90. Supplier Arrangements Evaluation Criteria ............................................................................... 137
Table 91. Supplier Arrangements Ratings ................................................................................................. 138
Table 92. EPC Contractor and Union Engagement Evaluation Criteria ..................................................... 139
Table 93. EPC Contractor and Union Engagement Ratings ....................................................................... 140
Table 94. Training Programs and University Partnerships Evaluation Criteria ......................................... 141
Table 95. Training Programs and University Partnerships Ratings ........................................................... 141
Table 96. Ownership and Financial Strength Evaluation Criteria ............................................................. 142
Table 97. Ownership and Financial Strength Ratings ............................................................................... 142
Table 98. Financing Plan Evaluation Criteria ............................................................................................. 144
Table 99. Financing Plan Ratings ............................................................................................................... 145
Table 100. Other Project Default Risk Factors Evaluation Criteria ........................................................... 147
Table 101. Other Project Default Risk Factors Ratings ............................................................................. 147
Table 102. Likelihood of Successful Commercial Operation Weighting Factors and Total Scores ........... 148
Table 103. CBA Components ..................................................................................................................... 149
Table 104. Expected Cost‐Benefit Analysis Comparison ........................................................................... 151
Table 105. OREC Purchase Price and Ratepayer Impacts Scores .............................................................. 153
Table 106. Economic Impacts and Strength of Guarantees for Economic Impacts Scores ...................... 154
Table 107. Environmental and Fisheries Impacts Scores .......................................................................... 155
Table 108. Likelihood of Successful Commercial Operation Scores ......................................................... 156
Table 109. Expected Portfolio Cost‐Benefit Analysis Comparison ............................................................ 159

May 25, 2021
Public Version Page x
GLOSSARY
ShortFormNames
Atlantic Shores or ASOW: Atlantic Shores Offshore Wind 1, LLC
Board: New Jersey Board of Public Utilities
EDF: Électricité de France S.A.
EDFR Offshore: EDF‐RE Offshore Development, LLC
EDF Renewables: EDF Renewables, Inc.
*BC/ /EC*
Shell: Royal Dutch Shell
Shell New Energies US LLC
Ocean Wind 2 or OW2: Ocean Wind II, LLC
Ørsted: Ørsted A/S
Solicitation Guidance Document or SGD: New Jersey Offshore Wind, Solicitation #2, Solicitation Guidance
Document, Application Submission for Proposed Offshore Wind Facilities
AcronymsandAbbreviations*BC//EC*
BAFO Best and Final Offer EIA Energy Information Administration
BCR Benefit‐cost ratio EO92 Executive Order No. 92
Board Board of Public Utilities EPP Environmental Protection Plan
BOEM Bureau of Ocean Energy Management FPP Fisheries Protection Plan
BPU Board of Public Utilities FTE Full‐time equivalent
BRA Base Residual Auction
BSTSUC Buyer share of TSUC GDP Gross domestic product
CBA Cost‐benefit analysis GE General Electric
CIR Capacity Interconnection Right GWh Gigawatt hour
CO2 Carbon dioxide HDD Horizontal directional drilling
COD Commercial Operation Date HVAC High voltage alternating current
COP Construction and Operations Plan HVDC High voltage direct current
CQ1 Clarifying Questions Set 1 ITC Investment Tax Credit
CQ2 Clarifying Questions Set 2 kV Kilovolt
DA Day Ahead kW Kilowatt
E&P Exploration and production LAI Levitan & Associates, Inc.
ECO Education and Community Outreach LDA Local Deliverability Area
EDC Electric distribution company LNOC Levelized net OREC cost

May 25, 2021
Public Version Page xi
LOPP Levelized OREC Purchase Price
LOI Letter of Intent
MVOW MHI Vestas Offshore Wind RT Real Time
MW Megawatt SAA State Agreement Approach
MWh Megawatt hour SAP Site Assessment Plan
NABTU North America's Building Trades Union SCC Social Cost of Carbon
NJ SHARES New Jersey Shares, Inc. SIS System Impact Study
NJDEP New Jersey Department of
Environmental Protection
SJI South Jersey Industries
NJWP New Jersey Wind Port SO2 Sulfur dioxide
NOx Nitrogen oxides SSTSUC Seller share of TSUC
NPV Net present value ST Short tons
NZEB Net zero energy building SWOT Strengths, weaknesses, opportunities,
and threats OREC Offshore Wind Renewable Energy
Certificate TP Transition piece
PDA Preliminary Development Agreement TSD Technical Support Document
PM2.5 Particulate matter ≤2.5 micron TSUC Transmission system upgrade cost
POI Point of interconnection TSUCPA TSUC price adder
PTC Production Tax Credit WTG Wind turbine generator
PVNOC Present value of net OREC cost
PVOPP Present value of OREC Purchase Price

May 25, 2021
Public Version Page 1
EXECUTIVE SUMMARY
Background
On November 19, 2019, Governor Phil Murphy signed Executive Order No. 92 (“EO92”), increasing the
State’s offshore wind energy generation goal from 3,500 MW by 2030 to 7,500 MW by 2035. To
implement Governor Murphy’s vision of making New Jersey a leading hub of offshore wind development
and to meet the State’s aggressive clean energy goals, the Board of Public Utilities (“BPU” or “Board”)
initiated this second round of offshore wind procurements by issuing the New Jersey Offshore Wind,
Solicitation #2, Solicitation Guidance Document, Application Submission for Proposed Offshore Wind
Facilities (“Solicitation Guidance Document” or “SGD”) on September 10, 2020, soliciting Applications to
secure Offshore Wind Renewable Energy Certificates (“ORECs”) targeting 1,200 MW to 2,400 MW of
offshore wind capacity.
Per N.J.A.C. 14:8‐6.5(a)(12), if the pricing proposal satisfies the cost‐benefit standards set forth in the
statute and the Board’s regulations, the Board may approve the Application subject to the Application
satisfying other required conditions. Per N.J.A.C. 14:8‐6.3(c), the Board may approve, conditionally
approve, or deny an application for ORECs. In this solicitation, Board Staff and LAI applied the following
weighting criteria in our evaluation of relative merit among rival Applicants and project options: 50% OREC
Purchase Price and Ratepayer Impacts; 20% Economic Impacts and Strength of Guarantees for Economic
Impacts; 20% Environmental and Fisheries Impacts; and 10% Likelihood of Successful Commercial
Operation. The Board may also reflect in its evaluation the additional benefit of having a diversity of
selected Applicants, technology alternatives, economic benefits and guarantees as well as other
qualitative considerations that help sustain a workably competitive market in future offshore wind
procurement rounds.
SubmittedApplications
The Application submission deadline was December 10, 2020. The BPU received Applications from two Applicants: Atlantic Shores Offshore Wind 1, LLC (“Atlantic Shores” or “ASOW”) and Ocean Wind II, LLC (“Ocean Wind 2” or “OW2”). Atlantic Shores is a joint venture between EDF‐RE Offshore Development, LLC (“EDFR Offshore”), which is indirectly owned by EDF Renewables, Inc. (“EDF Renewables”), and Shell New Energies US LLC (“Shell New Energies”). Ocean Wind 2 is a subsidiary of Ørsted A/S (“Ørsted”). The Projects of each Applicant are mutually exclusive.
Atlantic Shores submitted four Projects *BC/ /EC* Project capacities are *
/EC* 1,510 MW (Project C) *BC/ /EC* Projects C *BC/ /EC* include an MHI Vestas nacelle assembly facility at the New Jersey Wind Port (“NJWP”), *BC/ /EC* Projects *BC/ /EC* C, *BC/ /EC* include a pilot green hydrogen plant with a *BC/ /EC* 10 MW
capacity for Projects C *BC/ /EC*
Ocean Wind 2 submitted two Projects (OW2 A and OW2 B), each with a capacity of 1,148 MW. The OW2 Projects are differentiated only by the inclusion of a General Electric (“GE”) nacelle assembly facility at the NJWP in OW2 B.

May 25, 2021
Public Version Page 2
Table 1. Summary of Key Project Characteristics *BC//EC*
Atlantic Shores Ocean Wind 2
C A B
BOEM Lease Area OCS‐A‐0499 OCS‐A 0498
Nameplate Capacity (MW) 1,509.6 1,148.0
Number of Installation Phases 2 3
Final Phase Commercial Operation Date 4/ /28 1/ /29
WTG Distance from Shore (miles) 10.5 13.8
Wind Turbine Model MHI Vestas V236 GE Haliade‐
X
WTG Nameplate (MW) 13.6 14.0
Number of WTG Units 111 82
Foundation Technology Monopile + Transition Piece Monopile
Number of Offshore Substations
Export Cable Technology HVDC
Point(s) of Interconnection Cardiff Smithburg
Export Cable Length (miles) 32 >100
Number of Export Cable Circuits
Expected WTG Capacity Factor (net of losses)
Supply Chain Localization in NJ
Monopile Manufacturing EEW EEW
Nacelle Assembly Vestas GE
Energy Innovation Pilot
Hydrogen Production
from Offshore Wind Energy
Electric Drayage Trucks at Port of NY and NJ
Both ASOW and OW2 intend to source monopiles from a planned EEW Phase 2 manufacturing facility at
Paulsboro. However, Atlantic Shores may need to supplement in‐State monopile production with
externally sourced monopiles from Europe if its Project C *BC/ /EC* is selected with an OW2 project
due to the factory’s production capacity.
EvaluationResults
As an initial screening step, LAI first confirmed that all Project submissions from each Applicant have a
benefit‐cost ratio (“BCR”) above 1.0, the required threshold to support an OREC award under the Offshore
Wind Economic Development Act. Monetizing avoided emissions, particularly CO2, results in all Project
submissions having a BCR greater than the required threshold.
LAI’s evaluation is based on the six criteria set forth in Section 4 of the SGD. LAI performed quantitative
analysis of the Applicants’ OREC Purchase Prices and ratepayer impacts, including transmission system

May 25, 2021
Public Version Page 3
upgrade costs allocable to New Jersey ratepayers. Additional quantitative analysis was performed
regarding the economic impacts and the strength of guarantees for economic impacts. Qualitative analysis
of environmental and fisheries impacts and of the likelihood of successful commercial operation was also
performed.
LAI first evaluated the individual Projects on a stand‐alone basis using the four weighted categories defined in the SGD. Figure 1 illustrates the category scores for each Project. *BC/
/EC*
Figure 1. Project Scores *BC//EC*
Had a somewhat different “yardstick” been used for the derivation of the OREC Purchase Price and Ratepayer Impact category, resultant Project scores would have been more tightly distributed, but the relative ranking would not change, all other things being the same. Hence, quantification of Project scores provides useful data on the overall relative Project merit which consolidates all four categories. Project scores should not be misconstrued as governing the selection process, however.

May 25, 2021
Public Version Page 4
OREC Purchase Price and Ratepayer Impact
The Applicants’ OREC prices are reasonable in relation to other recent projects in New Jersey’s Round 1
solicitation and other offshore wind procurements along the Atlantic Seaboard. While only two Applicants
participated in the Board’s Round 2 solicitation, the results of the procurement appear reasonable.
*BC
/EC* Table 2 reports the respective OREC
Purchase Prices and associated LNOCs. The levelized OREC Purchase Price (“LOPP”) and LNOC values are
inclusive of estimated transmission system upgrade costs (“TSUC”). The nominal LOPP and LNOC values
include inflation and are levelized over the 20‐year OREC term.
Table 2. OREC Purchase Price Summary *BC//EC*
Atlantic Shores Ocean Wind 2
C A B
First Energy Year 2028 2029
First Energy Year OREC
Purchase Price ($/MWh) $86.62 $82.71 $84.03
Escalation Rate 2.5% 2.00%
LOPP w/TSUCPA ($/MWh)
Revenue Credits ($/MWh)
LNOC ($/MWh) $58.81 $40.75 $42.30
The difference between OW2 A and OW2 B is relatively small and is explained by OW2’s contingent
guarantee covering a potential GE nacelle assembly plant at the NJWP. *BC
/EC*
In conducting this solicitation, of particular concern is safeguarding ratepayer interests through realization
of the value of federal tax incentives attributable to the extension of the Investment Tax Credit (“ITC”)
after the Applicants submitted their bids in December 2020. LAI is satisfied that the OREC Purchase Prices
from both Applicants reflect good ratepayer value regarding the pass through of federal tax benefits. The
OREC Purchase Price and Ratepayer Impacts analysis is presented in Section 2.
Economic Impacts and Strength of Guarantees for Economic Impacts
Certain components of OW2’s economic benefits and guarantees are significantly less robust than those
of ASOW. In contrast, ASOW’s Application contained comprehensive technical information covering its
economic benefits, including firm in‐State spending and jobs guarantees to mitigate various uncertainty
factors. Both Applicants have identified opportunities to support environmental justice. Both Applicants
also satisfactorily defined innovative pilot programs oriented around the Garden State’s long‐term
decarbonization objectives.
With respect to economic development impacts, *BC

May 25, 2021
Public Version Page 5
/EC*
Both Applicants offer substantial amounts of funding and grant commitments for economic development
initiatives in education, research and innovative technologies, workforce development training, and other
community programs.
With respect to the strength of guarantees for economic impacts, OW2 ’s minimum guaranteed spend
through three years after the commercial operation date is somewhat larger than the comparably‐sized
ASOW B’s guaranteed spend. When compared between ASOW and OW2, OW2’s minimum guaranteed
spend commitment is riskier due to contingencies around use of the NJWP to support a GE nacelle
assembly plant. *BC/ /EC* If
OW2 does not meet its minimum spend guarantee, it will make up the difference through additional
contributions to a fund for education and workforce development in New Jersey disadvantaged
communities. ASOW would first make deficiency contributions to a proposed workforce development
fund up to a cap, and any excess deficiency would be compensated by a reduction in OREC pricing.
ASOW does not make a jobs guarantee for the development and construction phases. However,
comparing ASOW’s direct in‐State expenditures to OW2’s expected in‐State activities and spending during
those phases suggests that the number of in‐State development and construction phase jobs for ASOW
would be smaller than the jobs expected by OW2. ASOW guarantees O&M jobs for the 20‐year OREC term
while OW2’s commitment extends through the first three years after the final Commercial Operation Date
(“COD”). *BC
EC* ASOW imposes a
workforce development fund penalty on itself for any jobs deficiency after every fifth year of operation.
In contrast, OW2 imposes no penalty. Instead, its jobs guarantee is used to decrease its spend guarantee
if the number of jobs is exceeded. If the number of jobs is not met, there is no penalty to OW2.
*BC/ /EC* Nuances
about economic development impacts and each Applicant’s respective spending and jobs guarantees are
discussed in detail in Section 3.
Environmental and Fisheries Impacts
The feasibility and strength of the Environmental Protection Plans (“EPPs”) was reviewed in detail by NJ
DEP and LAI. ASOW’s EPP reasonably characterizes the environmental resources and habitats and includes
sufficiently detailed descriptions of potential impacts, based on site‐specific data and available published
studies. The transmission export cables to the Cardiff *BC/ /EC* points of interconnection
(“POIs”) would have total lengths of 32 *BC/ /EC* miles, respectively, and would be *BC/
/EC* NJ DEP reports that some residents of Long Beach
Island have voiced concerns about the visual impact of the Project, revealing some community opposition
at this initial development stage, *BC/
/EC* In LAI’s experience, community opposition to offshore wind projects in
the initial development phase is not uncommon, but does not necessarily create permit obstacles or
otherwise adversely affect prospects for commercial success. NJ DEP and LAI assess that OW2’s EPP
reasonably characterizes the environmental resources and habitats and includes generic descriptions of
potential impacts and mitigation options, but it is based primarily on desk‐top studies and field data
obtained through preparation of the Construction and Operations Plan (“COP”) for OW1. The transmission
export cable to the Smithburg POI on PJM’s high voltage backbone system would have a total length of
more than 100 miles *BC/ /EC* The export cable is proposed to be High Voltage Direct Current

May 25, 2021
Public Version Page 6
(“HVDC”), standard technology for long distance marine crossings, which would require fewer separate
circuits and cable trenches than HVAC. The length of the offshore segments of the OW2 cable would be
longer than any other export cables considered in the New Jersey offshore wind program. From both an
operational and economic standpoint, this is not considered a noteworthy risk because long HVDC export
cables have established a record of superior performance and availability elsewhere. If, for whatever
reason, a transmission outage was to occur that interrupts or reduces the delivery of ORECs, there would
be commensurate adjustments in total OREC payments.
ASOW’s Fisheries Protection Plan (“FPP”) is comprehensive. It covers both recreational and commercial
fishing interests. There is, however, a significant density of fishing activity in the lease area. *BC/
/EC* OW2’s FPP is
detailed and comprehensive, and demonstrates a good understanding of potential adverse impacts to
commercial and recreational fishing over the lease area, which has a lower density of fishing activity
compared to ASOW. The analysis of the environmental and fisheries impacts is presented in Section 4.
Likelihood of Successful Commercial Operation
Both Ocean Wind 2 and Atlantic Shores are backed by global energy companies with strong balance
sheets. Both have demonstrated willingness to provide parent guarantees, if necessary, to third party debt
lenders, as well as the financial tolerance to internalize project risk regarding the array of uncertainty
factors associated with project development. Each company has demonstrated the management
expertise needed to facilitate successful commercial development. Identification of components and
suppliers follows industry standards but does not preclude changes if technology progress merits design
modifications. Importantly, such changes will not trigger an OREC price increase but would likely
necessitate Board approval of any material change in technology. However, Board approval is based on
the technology and logistics submitted for this evaluation. ASOW’s joint venture participants have
demonstrated a global commitment to offshore wind. Ørsted’s record of performance in global offshore
markets portends commercial success in New Jersey. *BC/
/EC*
Both Applicants are highly likely to successfully develop their respective Projects as there are no known
environmental permit obstacles that constitute fatal flaws or structural weaknesses on the Applicants’
respective balance sheets that would undermine capital formation. OW2’s anticipated use of HVDC
transmission technology and sub‐sea cable length to landfall represent significant permitting challenges,
but do not rise to the level of risk that would likely impede timely project commercialization. Each
Applicant likely has sufficient influence to reinforce their respective supply chains, as needed, to meet
scheduled milestones. The various Project aspects affecting Likelihood of Successful Commercial
Operation are addressed in Section 5.
Portfolio Evaluation
For the portfolio analysis, in addition to looking at the individual Project submissions, LAI tested the price, economic benefits, and costs attributable to the potential selection of portfolios that include a Project from each Applicant. However, a portfolio cannot include two projects from either Applicant because their own projects are mutually exclusive. Depending on the Projects included, a portfolio solution has the potential to position New Jersey favorably to achieve greater manufacturing capability to support both New Jersey’s and neighboring states’ offshore wind procurement goals, while conferring valuable employment and environmental justice benefits.

May 25, 2021
Public Version Page 7
Along with price and quantity considerations, potential award portfolios that include a Project from each Applicant may be worthwhile to the extent that they (in no particular order): (1) diversify the risk of successful commercial project completion; (2) strengthen New Jersey’s likelihood of success as a regional manufacturing center; (3) incorporate alternative construction methods and/or technology; (4) provide economic benefits to communities around different ports and manufacturing facilities; (5) diversify transmission, including usage of multiple POIs; and, (6) heighten competition in future offshore wind procurement rounds.
During the evaluation, Board Staff stated that 2,400 MW does not represent a “hard” cap on a portfolio of offshore wind OREC awards on this solicitation. Therefore, in addition to the individual Projects from each Applicant within the target quantity range, the portfolio analysis also focused on combining Atlantic Shores *BC/ /EC* Project C with an OW2 Project. These combinations yield portfolios with *BC/ /EC* 2,658 MW of capacity, about *BC/ /EC* 111% of the initial 2,400 MW offshore wind procurement target, *BC/
EC*
All evaluated portfolios have BCRs above the required 1.0 threshold. In relation to a stand‐alone award to
the project with the highest BCR *BC/ /EC* the BCR for a portfolio consisting of OW2 A with
either ASOW *BC/ /EC* C is lower, but each BCR remains well above 1.0. Despite the decrease in the
BCR, a combination portfolio including either ASOW *BC/ /EC* C can be justified by the diverse
portfolio benefits listed above. In considering the prospect of a portfolio that is greater than the capacity
associated with a stand‐alone *BC/ /EC* the change in BCR is helpful in gauging the
incremental value of buying more or less offshore wind in Round 2. Notably, the change in the BCR for
different Project combinations is not dispositive so long as the threshold criterion is met.
A portfolio comprised of Atlantic Shores Project *BC/ /EC* C and an OW2 Project will result in increased ratepayer cost relative to either Project individually due to the larger capacity. However, a portfolio consisting of two Projects would present substantial economic, environmental, and strategic benefits at an inflection point for New Jersey as targeted offshore wind resource additions rapidly increase along the Atlantic seaboard. Awarding more capacity now would result in faster progress toward the 7,500 MW goal, including earlier incurrence of rate impacts. Awarding less capacity now may delay the incremental rate impacts, but they would nonetheless be incurred in subsequent procurement rounds. The difference in present value cost burden is not analyzed in this evaluation.
*BC
EC* Examination of each portfolio’s total
score is helpful as a comparison tool, but is not intended to be definitive in determining a Project or
Projects for selection. Moreover, small differences in total point scores can be challenging to interpret
and therefore represent soft metrics the Board may review in considering how best to proceed.

May 25, 2021
Public Version Page 8
Figure 2. Scores for Selected Portfolios *BC//EC*
In terms of overall cost, the present value of the 20‐year OREC Purchase Price (“PVOPP”) for OW2 A is
$2.96 billion, as shown in Figure 3. This represents a present value of net OREC cost (“PVNOC”) of $1.21
billion. Like metrics for OW2 B are insignificantly higher. *BC
EC* The PVOPP and PVNOC or ASOW C
are $4.22 billion and $2.18 billion, respectively. *BC
/EC*
When ASOW C is considered with OW2 A or OW2 B *BC/ /EC*
like metrics increase to $7.22 billion and $3.44 billion, respectively.

May 25, 2021
Public Version Page 9
Figure 3. Present Value of Selected Portfolios *BC//EC*
The unit OREC Cost Comparison for individual Projects and selected portfolios are presented in Figure 4.
They are expressed on a levelized $/MWh basis (nominal dollars) based on the 20‐year OREC term
following each Project’s commercial operation date. As noted above, for OW2 A the LOPP is $99.10/MWh
and the LNOC is $40.75/MWh. Like metrics for OW2 B are insignificantly higher. However, corresponding
LOPP and LNOC values for ASOW *BC/ /EC* C are much higher. *BC
/EC*

May 25, 2021
Public Version Page 10
Figure 4. Unitized Cost of Selected Portfolios *BC//EC*
The price and ratepayer impacts also represent good value in relation to leading commercial benchmarks,
including recent OREC awards in the public domain, New Jersey’s Round 1 OREC award to Ocean Wind 1,
and the average residential ratepayer impact, adjusted for economic benefits and underlying guarantees.
For background, the average residential ratepayer impact in the Round 1 procurement that resulted in
the selection of Ocean Wind 1 was $1.46 per month (levelized 2019 $). The average residential rate
increase ascribable to the selection of one OREC award to OW2 is $1.24/month or $1.28/ month (levelized
2021 $) for Projects A and B, respectively, about a 15% decline from Round 1. Consistent with the
calculation method used in Round 1, the average residential bill impact is levelized over 20 years,
expressed in current‐year (2021) dollars and reflects the expected value of revenue credits derived from
the sale of energy, capacity and avoided Tier 1 REC purchases. The results of this analysis are shown in
Figure 5. Ratepayer impact is driven by both portfolio size and OREC price.

May 25, 2021
Public Version Page 11
Figure 5. NJ Residential Electric Bill Impact for Selected Portfolios *BC//EC*
Ratepayer impacts for an award to a single Project of approximately 1,200 MW compare favorably to the
Round 1 ratepayer impacts. Higher capacity awards would have greater ratepayer impacts once the
Projects are in service in 2027 or 2028. LAI notes that such a comparison is of limited relevance due to the
benefits associated with a material increase in capacity, including earlier progress toward Governor
Murphy’s 7,500 MW goal, as well as different expected economic development benefits and guarantees.
In the portfolio analysis, LAI has not attempted to weigh the relative importance of the six SGD evaluation
criteria beyond the weights applied in the Board’s evaluation framework. LAI has performed analysis to
inform a Board decision. In the final analysis, the Board will determine what constitutes best value for
New Jersey.
Strengths,Weaknesses,OpportunitiesandThreats
Atlantic Shores’ strengths include a relatively firm design and firm economic development benefit
guarantees. The ASOW Joint Venture partners have less experience than Ørsted in developing larger‐scale
offshore wind projects, *BC/
/EC* ASOW Projects C *BC/
/EC* have an existing commercial arrangement for an alliance with MHI Vestas to establish a WTG
nacelle assembly facility in New Jersey, preferably at the NJWP. *BC/
/EC* An ASOW award will also heighten competition
in future procurement rounds. *BC

May 25, 2021
Public Version Page 12
EC* ASOW’s pilot hydrogen project
in South Jersey for Projects *BC/ /EC* C, *BC/ /EC* is an added plus.
OW2 has many strengths attributable to Ørsted’s global experience developing and operating large‐scale
offshore wind projects, its strong balance sheet and commitment to on‐balance sheet financing, and its
comparatively farther distance to shore. OW2’s 500 kV POI at Smithburg is a strength, based on the robust
transmission system capability on PJM’s backbone system. Supporting documentation for the Smithburg
POI, the long offshore cable length and lack of route specificity to landfall, and the conditional
expenditures guarantee are comparative weaknesses, but do not constitute formidable commercial
hindrances. While OW2 B offers the opportunity to further build New Jersey’s offshore wind industry with
establishment of a GE nacelle assembly facility, its realization is contingent on timely completion of the
NJWP as the site for the GE facility and GE’s satisfaction with an offered parcel lease. Ørsted’s ongoing
partnership with EEW represents an opportunity that will help New Jersey position itself to manufacture
monopiles for New Jersey offshore wind projects and for projects in other states. The pilot electric vehicle
program for heavy‐duty trucks used in and around the Port of Newark/Elizabeth is an added plus.
For a portfolio including one Project from each Applicant, a primary threat is a delay in completion of the
NJWP. A completion delay would have adverse consequences for the project benefits and costs of both
Applicants. *BC/
/EC* An opportunity of a split
award for the portfolios that include one or two nacelle facilities is that the NJWP may become more of a
hub for nacelle component manufacturing nearby. A split award has the added strength of diversification
of the locations of economic activity, developers, suppliers, and points of interconnection. This added
strength of diversification incorporates heightened environmental justice goals as well as innovative pilot
programs in synchrony with New Jersey’s decarbonization objectives.

May 25, 2021
Public Version Page 13
1 OVERVIEWOFAPPLICATIONSANDPROJECTALTERNATIVES
On November 19, 2019, Governor Phil Murphy signed EO92, increasing the State’s offshore wind energy
generation goal from 3,500 MW of capacity by 2030 to 7,500 MW of capacity by 2035.1 Governor Murphy
found that expanding the offshore wind goal will ensure that the State can “meet the State’s goals of 50
percent renewable energy by 2030 and 100 percent clean energy by 2050, in addition to creating a
significant number of good‐paying jobs.”2
To implement Governor Murphy’s vision of making New Jersey a leading hub of offshore wind
development and to meet the State’s aggressive clean energy goals, the BPU issued the SGD on September
10, 2020, soliciting Applications to secure ORECs targeting 1,200 MW to 2,400 MW of offshore wind
capacity.3,4
The Application submission deadline was December 10, 2020. The BPU received Applications from two
Applicants: Atlantic Shores and Ocean Wind 2.5 ASOW submitted four Project options and OW2 submitted
two Project options, which are summarized at a high level in the following three tables.
1 https://nj.gov/infobank/eo/056murphy/pdf/EO‐92.pdf 2 EO92, p.3. 3 https://njoffshorewind.com/solicitation‐documents/Final‐Solicitation‐Guidance‐Document‐with‐attachments.pdf 4 The Board reserved the right to select less than 1,200 MW or more than 2,400 MW, if circumstances warrant. 5 ASOW is a joint venture between EDFR Offshore and Shell New Energies. OW2 is sponsored wholly by Ørsted Offshore North America

May 25, 2021
Public Version Page 14
Table 3. Project Sizes and Production6 *BC//EC*
Atlantic Shores Ocean Wind 2
C A B
BOEM Lease Area OCS‐A‐0499 OCS‐A 0498
Nameplate Capacity (MW) 1,509.6 1,148.0
Capacity Phase‐in by Start Date
Phase 1 COD 9/ /27 8/ /28
Phase 1 Capacity (MW) 761.6 392.0
Phase 2 COD 4/ /28 10/ /28
Phase 2 Capacity (MW) 748.0 378.0
Phase 3 COD ‐‐ 1/ /29
Phase 3 Capacity (MW) ‐‐ 378.0
Expected Annual Generation (GWh)
Expected WTG Capacity Factor
Expected Annual Delivered Energy (GWh)
Expected WTG Capacity Factor (net of losses)
Annual OREC Allowance (GWh) 6,181 5,0348
OREC Allowance / Expected Delivered Energy
Expected Total OREC Production (GWh)
Initial Eligible PJM Capacity Factor9
Summer Period Peak Hours Capacity Factor12
6 Unless otherwise noted, values in this table are sourced from the Project Summary tab of each Project’s Application Form. 7 *BC/
/EC* 8 BAFO Cover Letter p. 2. 9 Once operational, a resource’s qualified capacity factor is calculated as the average of the previous three years. 10 ASOW Application p. 137, response to CQ1 #24b. 11 *BC
EC* 12 Values are calculated from 12x24 matrices of expected generation as submitted in the Application Forms.

May 25, 2021
Public Version Page 15
Table 4. Project Configurations13 *BC//EC*
Atlantic Shores Ocean Wind 2
C Ref.14 A B Ref.15
Mean Wind Speed (m/s) p. 107 p. 3‐8
Hub Height for Wind Speed (m) p. 110 p. 3‐8
WTG Hub Height (m) p. 110 p. 3‐5
Average Water Depth (m) p. 52 26.4 CQ2 #1
WTG Distance from Shore (miles) 10.5 CQ1 #1 13.8 p. 2‐23
Wind Turbine Model MHI Vestas V236‐13.6 MW p. 72 GE Haliade‐X p. 2‐1
WTG Nameplate (MW) 13.6 p.72 14.017 p. 2‐5
Number of WTG Units 111 p.40 82 p. 2‐5
Foundation Technology Monopile + Transition Piece p.50 Monopile p. 2‐5
Inter‐array Cable Voltage (kV) 66 p. 57 66 p. 2‐9
Inter‐array Cable Length (miles) p. 59 p. 2‐10
Number of Offshore Substations p. 68 p. 2‐13
POI(s) Cardiff p. 317 Smithburg18 CQ2 #20
Export Cable Technology p. 57 HVDC p. 2‐8
Offshore Export Cable Length (miles)
20 p. 59 >100
p. 12‐4, Calc.
Onshore Export Cable Length (miles)
12 p. 59 ~20
p. 12‐6, CQ1 #56
Number of Export Cable Circuits p. 59 p. 2‐9
Export Cable Voltage (kV) p. 57 320 p. 2‐9, p. 12‐4
Expected Operational Life (years) 30 p. xii 30 p. ES‐3
13 *BC/
/EC* 14 Entries showing only a page number are referencing the ASOW Application narrative. 15 Entries showing only a page number are referencing the OW2 Application narrative. 16 MLLW: Mean Lower Low Water 17 *BC/
/EC* Application p. 2‐5. 18 In its Application, Ocean Wind 2 stated that the primary POI would be at Deans, with alternative POIs at Smithburg, Sewaren, Meadow Road, and Oceanview (OW2 Application p. 12‐3). *BC/
/EC*
19 *BC/
EC*

May 25, 2021
Public Version Page 16
Table 5. Project Costs20 (nominal $) *BC//EC*
Atlantic Shores Ocean Wind 221
C Ref. A B Ref.
Development Cost ($MM) App. 4‐1 Att. 4.5
Unitized Development Cost ($/kW) App. 4‐1 Calc.
Capital Cost ($MM) App. 4‐1 Att. 4.5
Export Cable Cost ($MM) App. 4‐1 Att. 4.5
Unitized Capital Cost ($/kW) App. 4‐1 Calc.
Operating Cost ($MM)22 App. 4‐1 & Calc.
Att. 4.5
Decommissioning Cost ($MM)23 App. 4‐1 Att. 4.5
Total Cost ($MM) Calc Calc.
LCOE over OREC Period ($/MWh) App. 4‐1 p. 4‐4
Levelized OREC Purchase Price ($/MWh)24
Calc. Calc.
Levelized Net OREC Cost ($/MWh) $58.81 Calc. $40.75 $42.30 Calc.
1.1 AtlanticShores
Effective on August 13, 2019, the Bureau of Ocean Energy Management (“BOEM”) assigned the Federal
OCS Renewable Energy Lease OCS‐A 0499 to Atlantic Shores. The lease area was previously assigned to
EDF Renewables Development, Inc., an Atlantic Shores parent company. The lease area boundary that is
closest to shore is located approximately 9 miles off the coast of New Jersey, between Atlantic City and
Barnegat Light. *BC/
/EC* Each is based on using MHI Vestas V236‐13.6 MW WTGs mounted on monopile
foundations with a hub height of 143 meters.25 66 kV inter‐array cables will connect strings of WTGs to
*BC/ /EC* The offshore WTG layouts of the
Atlantic Shores Projects are shown in Figure 6.
20 “Calc.” in the reference column indicates that the value was calculated by LAI. 21 *BC/
/EC* 22 Total operating costs are reported over the Project lifetime. *BC/
/EC* 23 *BC/ /EC* 24 Includes Transmission System Upgrade Cost Price Adder (see Section 2.1.1). 25 *BC
/EC*

May 25, 2021
Public Version Page 17
Figure 6. WTG Layouts for Atlantic Shores Projects26 *BC//EC*
Depending on the Project, the initial commercial operation date is expected to be September *BC/
/EC* 2027. *BC/
/EC* The first phase of Projects C *BC/ /EC* would have a capacity of 761.6 MW, with a
second 748 MW phase entering service in April 2028. *BC/
/EC* would have a POI at Cardiff. *BC/
/EC*
26 ASOW Application p. 40.

May 25, 2021
Public Version Page 18
Figure 7. Atlantic Shores Export Cable Route and Port Facilities27 *BC//EC*
The target burial depth for the subsea cables is six feet.28 Horizontal directional drilling will be used to
bring the offshore cable to landfall while minimizing impact to the beach ecosystem.29 Projects *BC/ /EC*
C, *BC/ /EC* will include *BC/ /EC* of extra *BC/ /EC* conduit capacity at Cardiff.
*BC/ /EC* to minimize
future beach crossings.30 Atlantic Shores has three queue positions at Cardiff (AE2‐020, AE2‐021, and AE2‐
022) *BC
/EC*
Marshalling and staging will be conducted at the NJWP.32 NJWP will also host an MHI Vestas nacelle
assembly facility (for Projects C *BC/ /EC* Atlantic
Shores plans to utilize monopile foundations fabricated at an expansion of EEW’s manufacturing facility
27 ASOW Application p. 47. 28 ASOW Application pp. 86‐87, response to CQ1 #3. 29 ASOW Application p. 266. 30 ASOW Application p. 347. 31 ASOW Application p. 322. 32 ASOW Application pp. 96, 307. *BC/
/EC* 33 ASOW Application pp. 170‐171. *BC
EC*

May 25, 2021
Public Version Page 19
at Paulsboro.34 Atlantic City will serve as the operations and maintenance port.35 For Projects *BC/ /EC*
C, *BC/ /EC* Atlantic Shores also proposes to implement a pilot electrolyzer plant in collaboration
with South Jersey Industries (”SJI”) to produce green hydrogen in Cardiff, New Jersey, a production
process that will utilize dedicated output from the offshore wind facility to produce hydrogen used by
SJI.36
1.2 OceanWind2
Ocean Wind 2 will be located in BOEM Lease Area OCS‐A 0498. The lease area is currently owned by Ocean
Wind, LLC, an affiliate of the Ocean Wind 2. Ocean Wind, LLC is working to assign a portion of the Lease
Area, including the area where Ocean Wind 2 will be located, to Ørsted North America Inc., an affiliate of
both Ocean Wind, LLC and Ocean Wind 2. If Ocean Wind 2 receives an award in this solicitation, Ørsted
North America Inc. will assign the relevant portion of the lease area to Ocean Wind 2.37 The turbine closest
to shore in the Ocean Wind 2 WTG array will be located 13.8 miles off the coast of Atlantic City. Ocean
Wind 2’s two Projects have the same configuration and are distinguished by the associated economic
benefits package. Project B adds a nacelle assembly facility at the NJWP. The Ocean Wind 2 Projects are
based on the use of the GE Haliade‐X WTG platform. The initial design basis involves eighty‐two 14.0 MW
WTGs mounted on monopile foundations, *BC/
/EC*
66 kV inter‐array cables will connect strings of WTGs to the offshore substation/converter station. The
WTG layout for the Ocean Wind 2 Projects is shown in Figure 8.
34 ASOW Application p. 50. Atlantic Shores has developed alternate monopile supply arrangements in the case that EEW is not able to deliver the needed capacity or to meet the target schedule. The alternate selected supplier for monopiles is Bladt Industries, with monopiles manufactured in Denmark. *BC/
EC* ASOW Application pp. 55‐57. 35 ASOW Application p. 97. 36 ASOW Application pp. 97‐102. 37 OW2 Application p. 1‐13. *BC/
EC*

May 25, 2021
Public Version Page 20
Figure 8. WTG Layout for Ocean Wind 2 Projects38 *BC//EC*
The Ocean Wind 2 Projects are planned to be constructed in three phases. The first phase has a capacity
of 392 MW and an August 2028 COD. The second and third phases each have a capacity of 378 MW, and
CODs of October 2028 and January 2029, respectively. The primary POI is at Smithburg, *BC/
/EC* The export cable routes to the primary *BC/ /EC* are
shown in Figure 9. From the offshore substation, power will be transmitted via HVDC cable at 320 kV to
the onshore substation. Ocean Wind 2 has chosen to use HVDC technology for the export cable because
of the distance between the offshore and onshore substations – *BC/
/EC*
38 OW2 Attachment 2.1 p. 2.

May 25, 2021
Public Version Page 21
Figure 9. Ocean Wind 2 Export Cable Route39 *BC//EC*

May 25, 2021
Public Version Page 22
The target burial depth for the subsea cables is approximately five to seven feet.40 Horizontal directional
drilling will be used for the cable landfall.41 *BC/
/EC*
OW2 proposes to conduct WTG marshalling out of the NJWP.43 For Project B only, a GE nacelle assembly
facility is also proposed to be constructed at the NJWP.44 Both Project options involve an expansion of
EEW’s monopile manufacturing capability at Paulsboro, and increased capacity out of the O&M facility in
Atlantic City that will also be utilized for Ocean Wind 1.45 The locations of these port facilities relative to
the lease area are shown in Figure 10. Ocean Wind 2 has also proposed to support the deployment of
zero‐emission Class 8 freight transport trucks, including the development of an electric truck depot facility
at the Port of Newark/Elizabeth.46
Figure 10. Ocean Wind 2 Port Facilities47
39 OW2 Attachment to response CQ2 #20. 40 *BC/
/EC* (Response to CQ1 #7). 41 OW2 Application p. 2‐48. 42 OW2 Application p. 12‐3. At the Feasibility Study phase, PJM allows an interconnection request to include a secondary (alternate) POI which is studied together with the primary POI. This queue position was originally associated with Deans as a primary point of interconnection and Smithburg as the secondary point of interconnection. OW2 reported at the interview that it would maintain the same queue position *BC/
/EC* Interview transcript p. 103. 43 OW2 Application p. 8‐12. *BC/ /EC* 44 OW2 Application p. 8‐9. 45 OW2 Application p. 2‐24. 46 OW2 Application pp. 8‐21 to 8‐24. 47 OW2 Application p. 2‐24.

May 25, 2021
Public Version Page 23
2 ORECPURCHASEPRICEANDRATEPAYERIMPACTS
Highlights
Project LNOCs, which are the basis for assigning points in this category, are shown in Figure 11.OW2 A has the lowest LNOC and is insignificantly lower than OW2 B. *BC/
/EC*
Figure 11. Levelized Net OREC Cost *BC//EC*
The OREC Purchase Prices have been adjusted for TSUC uncertainty. While ASOW’s TSUCestimates are well‐documented, expected transmission costs expressed on a risk‐adjusted basisare comparatively high on a unitized basis. In contrast, OW2 has not provided any documentationto support the proposed TSUC under conservative assumptions at the Smithburg POI. On apreliminary basis, the Smithburg POI is likely robust, that is, able to accommodate the injection of1,148 MW without unpleasant financial surprises years from now.
The Round 2 solicitation resulted in competitive pressure on both Applicants to bid aggressivelyfor the sake of a Board approved OREC award. OW2 pricing is significantly lower than OW1, alsoresulting in a significantly lower PVNOC. Average monthly residential ratepayer impacts for OW2are lower than OW1. Moreover, economic benefits and associated guarantees are significantlygreater and more robust than OW1.
The OREC Purchase Price is defined at N.J.A.C. 14:8‐6.1 and 6.5(a)(12) as the price in $/MWh paid for a
Qualified Offshore Wind Project. The OREC Purchase Price reflects the all‐in costs of the Project, i.e., total
Project capital and operating costs offset by any State or Federal tax or production credits and any other
subsidies or grants. The OREC Purchase Price is paid per MWh for delivered energy. N.J.A.C. 14:8‐
$58.81
$40.75$42.30
$0
$10
$20
$30
$40
$50
$60
$70
$80
AS OW C OW2 A OW2 B
Levelized Net OREC
Cost (Nominal $/M
Wh)

May 25, 2021
Public Version Page 24
6.5(a)(12)(iii) and (vii) require Applicants to submit an OREC Pricing Schedule with a fixed OREC price and
expected energy output for each Energy Year of the proposed 20‐year term of the Board Order.48
Applicants were allowed to propose a phased commercial operation schedule. Each phase of a multi‐
phase project will have a distinct 20‐year term based on the phase’s Commercial Operation Date. A single
price and expected energy output series will apply to each phase. This may result in price and output
series longer than 20 years, based on the time between the Commercial Operation Date of the first phase
and the Commercial Operation Date of the last phase. The OREC Purchase Price may be the same each
year over the 20‐year term(s), or it may increase each year subject to a fixed escalation rate equal to or
less than 3%.
The OREC purchase price was evaluated in terms of the nominal LOPP and nominal LNOC. The LOPP is
derived from the OREC Purchase Price Schedule and expected OREC deliveries and represents the total
value of the ORECs. The LNOC is derived from the OREC Purchase Price Schedule, expected OREC
deliveries, and revenue credits that reflect the expected value of energy, capacity, and ancillary services
in the wholesale market, as well as the avoided cost of Class 1 RECs.49 The LNOC represents the expected
net price paid by New Jersey ratepayers, expressed on a nominal dollar basis, that is, including inflation.
Applicants were required to submit an All‐In OREC Purchase Price for each Energy Year, expressed in
nominal $/OREC.50 Applicants were also required to designate parameters to determine the Buyer’s share
of final PJM TSUC, which is described in more detail in Section 2.1.1 below. The TSUC mechanism provides
the Applicant with the opportunity to define the amount of transmission interconnection risk the
Applicant is willing to internalize in its OREC Purchase Price versus the amount to be allocated to
ratepayers based on the actual TSUC determined by PJM. The OREC purchase price calculations are
summarized in Table 6. The LOPP is stated in nominal $/MWh, with the TSUC Price Adder (“TSUCPA”) as
determined based on LAI’s TSUC estimates, which are described in Section 2.1.1. While mindful of the
Applicants’ TSUC estimates, LAI has relied on its own assessment of system upgrade costs consistent with
the PJM transmission system planning process to derive each Applicant’s TSUCPA for evaluation purposes.
The LNOC is expressed in nominal $/MWh, and includes the effect of the revenue credits, as discussed
further in Section 2.2.
48 LAI evaluated the capacity factor and energy production profiles submitted by each Applicant based on the supporting data submitted and other information that is available to LAI. 49 LNOC is the level nominal cost per MWh that, when multiplied by the proposed OREC quantities for each Energy Year of the proposed 20‐year term, yields a steam of dollar amounts which has the same present value as the series of Energy Year net costs of the same quantities of ORECs. Using the nominal discount rate of 7%, this present value equivalence reflects the OREC Purchase Price Schedule, including the revenue credits attributable to the estimated market value of energy and capacity, as well as the avoided REC costs. 50 Per N.J.A.C. 14:6‐6.1, an Energy Year is the 12‐month period from June 1 through May 31 and is to be numbered according to the calendar year in which it ends.

May 25, 2021
Public Version Page 25
Table 6. OREC Purchase Price Summary51 *BC//EC*
Atlantic Shores Ocean Wind 2
C A B
First Energy Year 2028 2029
First Energy Year OREC
Purchase Price ($/MWh) $86.6254 $82.7156 $84.0357
Escalation Rate 2.50% 2.00%
LOPP ($/MWh)58
Base $106.18 $96.94 $98.49
TSUCPA
Total
Revenue Credits ($/MWh)59
Market Energy Value
Market Capacity Value
Avoided Class I REC Cost
LNOC ($/MWh) $58.81 $40.75 $42.30
2.1 LevelizedORECPurchasePrice
OREC quantities were calculated for each month of each Energy Year from the tables of generation and
energy delivery provided in the Application Forms. OREC purchase prices for each month were determined
from the First Energy Year OREC Purchase price and the proposed escalation rate. Monthly products of
OREC quantity and OREC Purchase Price were aggregated by calendar year. The annual totals were
discounted to present value (year‐end 2020) using a nominal discount rate of 7.0%. The OREC quantities
were similarly aggregated by calendar year and discounted at the same nominal discount rate to year‐end
2020. LOPP was calculated as the ratio of the present value of OREC Purchase Price payments to the
present value of the corresponding annual OREC quantities.
51 First Energy Year, First Energy Year OREC Purchase Price, and Escalation Rate were submitted in the OREC Purchase Price worksheet of the Application Form. Other values in this table were calculated by LAI. 52 *BC/
EC* 53 *BC/
EC* 54 *BC/
EC* 55 *BC/ /EC* 56 *BC
EC* 57 *BC/
/EC* 58 LOPP, revenue credits, and LNOC values are presented in levelized nominal $/MWh. 59 Calculated by LAI based on the forecasts presented in Section 2.2.1

May 25, 2021
Public Version Page 26
2.1.1 Transmission System Upgrade Cost Uncertainty and Reconciliation
The mechanism in the formulas below reflects the apportionment of risk between Buyer and Seller related
to higher‐than‐expected TSUC. The Buyer’s share of the TSUC is represented by the TSUCPA, calculated
as shown in the following equations:
𝑇𝑆𝑈𝐶𝑃𝐴𝐴𝑇𝑆𝑈𝐶𝑅𝐸𝐴𝑂𝑄
𝐴𝑇𝑆𝑈𝐶𝑅 𝐵𝑆𝑇𝑆𝑈𝐶 𝐴𝐹 𝑅𝑂𝑅, 20
𝐵𝑆𝑇𝑆𝑈𝐶 𝑇𝑆𝑈𝐶 𝑆𝑆𝑇𝑆𝑈𝐶
𝑆𝑆𝑇𝑆𝑈𝐶 min 𝑇𝑆𝑈𝐶,𝑇𝑖𝑒𝑟1 1.00
min max 0,𝑇𝑆𝑈𝐶 𝑇𝑖𝑒𝑟1 ,𝑇𝑖𝑒𝑟2 𝑇𝑖𝑒𝑟1 𝑆𝑆2
min max 0,𝑇𝑆𝑈𝐶 𝑇𝑖𝑒𝑟2 ,𝑇𝑖𝑒𝑟3 𝑇𝑖𝑒𝑟2 𝑆𝑆3
where:
TSUCPA = Transmission System Upgrade Cost Price Adder (Nominal $/MWh)
EAOQ = Expected Annual OREC Quantity (MWh/year) (P50 annual profile)
ATSUCR = Annual Transmission Upgrade Cost Recovery (Nominal $/year)
AF(ROR, 20) = Annuity factor at Rate of Return of ROR for 20‐year term
BSTSUC = Buyer Share of Transmission System Upgrade Cost (Nominal $)
TSUC = Transmission System Upgrade Cost (Nominal $)
SSTSUC = Seller Share of Transmission System Upgrade Cost (Nominal $)
Tier1 = Tier 1 Cost Limit absorbed 100% by Seller (Nominal $)
Tier2 = Tier 2 Cost Limit absorbed by Seller at rate SS2 (Nominal $)
SS2 = Seller Share of cost in Tier 2 above Tier 1 (fraction)
Tier3 = Tier 3 Cost Limit absorbed by Seller at rate SS3 (Nominal $)
SS3 = Seller Share of cost in Tier 3 above Tier 2 (fraction)
The OREC Purchase Price includes the Seller Share of TSUC Tiers 1, 2 and 3. TSUC above the Tier 3 limit is
fully allocable to Buyer. In addition to the OREC Purchase Price, Applicants were required to provide values
for Tier1, Tier2, Tier3, SS2, and SS3. Applicants were free to set these parameters in accord with their own
risk preference regarding with the allocation of transmission interconnection costs between Buyer and
Seller. These values were used to calculate the TSUCPA representing the Buyer’s Share of LAI’s estimated
TSUC.60 Applicant‐provided inputs to the TSUCPA calculation are summarized in Table 7. The Applicant‐
provided inputs to the TSUCPA calculation are the starting point, but not necessarily the same as the TSUC
inputs used by LAI to derive the TSUCPA used in the evaluation.
60 Applicants were free to set the SS2 and SS3 values at decreasing fractions solely at their discretion if they are unwilling to absorb all increases to the TSUC, thereby shifting all or a portion of the TSUC risk to Buyer. If Applicants are willing to absorb all increases to TSUC within the submitted OREC Purchase Price schedule, they were free to set the SS2 and SS3 values to 1.

May 25, 2021
Public Version Page 27
Table 7. Applicant TSUC Inputs61 *BC//EC*
Atlantic Shores62 Ocean Wind 263
C A B
Tier 1 Cost Limit ($MM) $239.4 $181.0 $181.0
Tier 2 Cost Limit ($MM) $266.0 $217.0 $217.0
Tier 2 Seller Share 100.0% 50.00% 50.0%
Tier 3 Cost Limit ($MM) $533.0 $250.0 $250.0
Tier 3 Seller Share 30.0% 25.0% 25.0%
Required Rate of Return64 6.5% 7.0% 7.0%
TSUC Estimate ($MM)
P50
P90
LAI determined the TSUC estimates to be used in the OREC Purchase Price evaluation, shown in Table 8,
based on the interconnection information provided by the Applicants. For evaluation purposes, the
resultant TSUCPA will be added to each Energy Year’s OREC Purchase Price.
Table 8. TSUC Calculation Results *BC//EC*
Atlantic Shores Ocean Wind 2
C A B
Applicant’s P50 TSUC ($MM)
SSTSUC ($MM)
BSTSUC ($MM)
TSUCPA (levelized $/MWh)
Applicant’s P90 TSUC ($MM)
SSTSUC ($MM)
BSTSUC ($MM)
TSUCPA (levelized $/MWh)
TSUC for evaluation ($MM)
SSTSUC ($MM)
BSTSUC ($MM)
TSUCPA (levelized $/MWh)
In conducting this evaluation, we have limited our analysis to the TSUC associated with the proposed
individual Projects. We have not considered the potential timing and interaction effects of interconnecting
61 TSUC Parameters were submitted in the OREC Purchase Price worksheet of the Application Form. 62 *BC/ /EC* 63 *BC
/EC*
64 *BC/ /EC* The specific 6.5% value was provided in the response to CQ2 #43.

May 25, 2021
Public Version Page 28
one or both Applicant’s Projects on the TSUC associated with transmission projects that the Board may
later select under the State Agreement Approach (“SAA”) presently before PJM.65,66
2.1.1.1 AtlanticShores
*BC
/EC*
Atlantic Shores’ four Project offers will use a combination of its existing PJM queue positions at Cardiff
230 kV *BC/ /EC* The PJM queue positions are as follows:*BC/
/EC*
The combinations of queue positions are shown in Table 9.
Table 9. Project Combinations of Queue Positions *BC//EC*
Project C
Total Project MW 1,509.6
Total Queue MW
All *BC/ /EC* queue positions have a completed PJM SIS and are now being studied at the Facilities
Study phase of the PJM interconnection process. For each queue position PJM estimated SIS costs as
shown in Table 10.
65 LAI notes, however, that the *BC/ /EC* points of interconnection proposed by the Applicants (Cardiff, *BC/ /EC* Smithburg *BC/ /EC*) are the same as the substations specifically designated by the Board in its Order requesting PJM to utilize the SAA for an open access offshore transmission facility./EC* Docket No. QO20100630 (https://www.nj.gov/bpu/pdf/boardorders/2020/20201118/8D%20‐%20ORDER%20Offshore%20Wind%20Transmission.pdf) 66 If New Jersey implements a SAA, potential economic benefits may materialize from a ratepayer perspective through a reduced TSUCPA that would apply at designated POIs. The likelihood and magnitude of such benefits are outside the scope of this evaluation, however. 67 ASOW’s interconnection plan is described in Section 12 of the Application narrative, beginning on page 311.

May 25, 2021
Public Version Page 29
Table 10. PJM SIS Costs for Atlantic Shores’ Queue Positions *BC//EC*
Project C
PJM SIS Costs PJM SIS Costs PJM SIS Costs PJM SIS Costs
*BC
68 *BC/
EC* 69 *BC
/EC* 70 *BC/
EC* 71 *BC/
/EC*
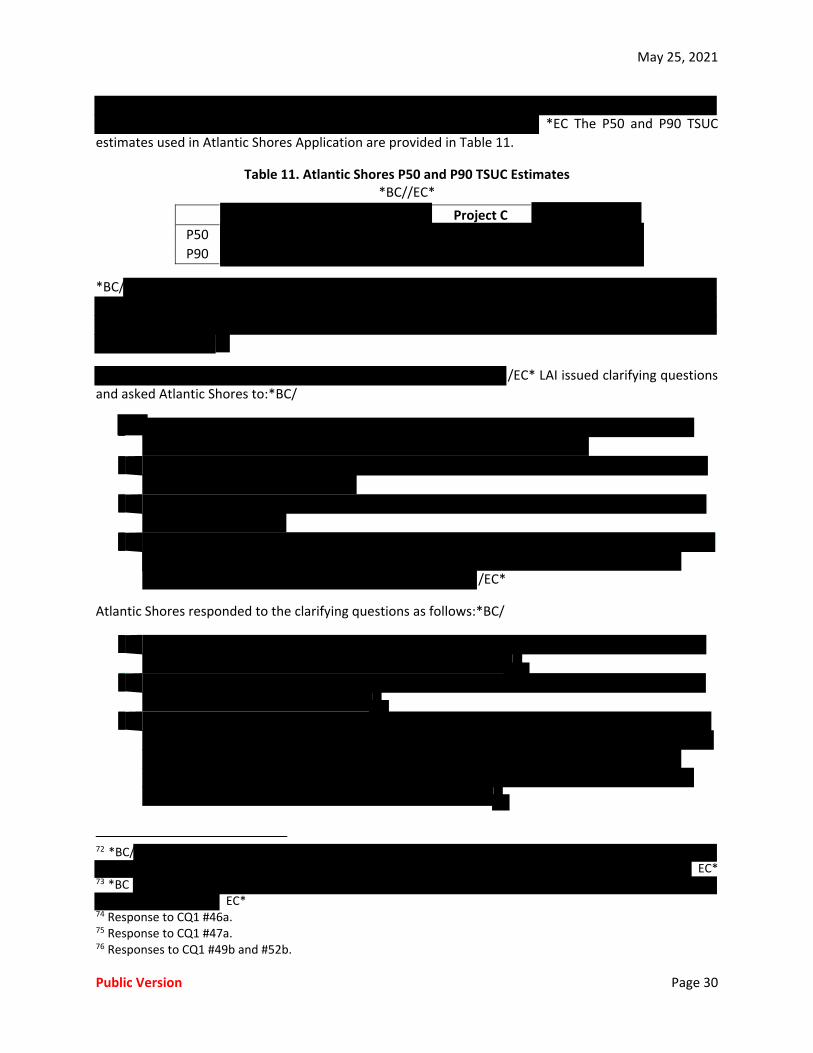
May 25, 2021
Public Version Page 30
*EC The P50 and P90 TSUC
estimates used in Atlantic Shores Application are provided in Table 11.
Table 11. Atlantic Shores P50 and P90 TSUC Estimates *BC//EC*
Project C
P50
P90
*BC/
/EC* LAI issued clarifying questions
and asked Atlantic Shores to:*BC/
/EC*
Atlantic Shores responded to the clarifying questions as follows:*BC/
72 *BC/
EC* 73 *BC
EC* 74 Response to CQ1 #46a. 75 Response to CQ1 #47a. 76 Responses to CQ1 #49b and #52b.

May 25, 2021
Public Version Page 31
EC*
LAI was not satisfied with Atlantic Shores responses to the first round of clarifying questions. *BC/
EC*
To get more clarification from Atlantic Shores, LAI issued a second round of clarifying questions (“CQ2”).
In CQ2 LAI asked Atlantic Shores to:*BC/
/EC*
Atlantic Shores responded to CQ2 as follows:*BC/
EC*
77 Response to CQ1 #47e. 78 Response to CQ2 #38b. 79 Response to CQ2 #38d. 80 Response to CQ2 #40a.

May 25, 2021
Public Version Page 32
LAI followed up with Atlantic Shores at their interview and got the following responses:*BC/
EC* Per the PJM Tariff, retired units are allowed to keep their CIRs for one year after which they
81 Interview transcript p. 76. *BC/
/EC* 82 Interview transcript p. 84. 83 Interview transcript p. 85.

May 25, 2021
Public Version Page 33
have to either sell/transfer them or they are released to the PJM transmission system for the creation of
system‐wide transmission headroom.84 *BC/
EC*
84 In an order dated November September 11, 2019, in Docket Q018121289, the Board approved Ocean Wind’s
purchase of the Oyster Creek CIRs. In an order dated March 27, 2020, in the same docket, the Board approved Ocean
Wind’s purchase of the BL England CIRs. 85 In its response to CQ2 #38d and in their Supplemental Interview Information (item #3), Atlantic Shores noted that *BC/
/EC* 86 ASOW Application Appendices 12‐8 through 12‐11. 87 See *BC/ /EC* in ASOW Appendix 12‐8. 88 See *BC/ /EC* in ASOW Appendix 12‐11. 89 See Appendix I of ASOW’s CQ2 responses.

May 25, 2021
Public Version Page 34
Table 12. *BC/ /EC* *BC//EC*
*BC/
/EC*
Table 13. *BC/ /EC* *BC//EC*
*BC

May 25, 2021
Public Version Page 35
/EC*
Table 14. *BC/ /EC* *BC//EC*
*BC
/EC*
Table 15. *BC/ /EC* *BC//EC*
Project C
Bid MW 1,509.6
POI MW
PJM SIS Cost
Evaluation TSUC

May 25, 2021
Public Version Page 36
*BC
/EC*
2.1.1.2 OceanWind2
*BC/
EC* The P50 and P90 TSUC estimates are presented in Table 16.

May 25, 2021
Public Version Page 37
Table 16. Ocean Wind 2’s P50 and P90 TSUC Estimates *BC//EC*
TSUC ($ MM)
P50
P90
LAI submitted some clarifying questions to Ocean Wind 2 to better understand their interconnection plan.
LAI was satisfied with the responses provided by Ocean Wind 2.
LAI also reviewed other queue positions in the PJM queue *BC/ /EC*
to get a sense of the reasonableness of the TSUC submitted by Ocean Wind 2. *BC/
/EC*
Table 17. Other PJM Queue Positions at *BC/ /EC* *BC//EC*
Project Name
Queue
Position
Capacity
(MW)
Study
Year
Feasibility Study
Upgrade Costs ($) Status
*BC
EC*
Based on the review of other queue positions *BC/ /EC* LAI finds
the Ocean Wind P50 and P90 TSUC *BC/ /EC* to be reasonable.
*BC/
90 The PJM study timeline should not be affected because Smithburg 500 kV would already have been studied as a Secondary POI in the Feasibility Study. *BC
/EC*

May 25, 2021
Public Version Page 38
EC*
Table 18. Ocean Wind 2 BAFO P50 and P90 TSUC for Smithburg 500 kV *BC//*EC*
P50 P90
*BC
/EC* Table 19 summarizes LAI’s estimated TSUC for use in the evaluation.
91 LAI used the same approach that Ocean Wind 2 used in its Application to convert real dollars to nominal dollars *BC/ /EC* The conversion methodology was provided as a spreadsheet by Ocean Wind 2 in their response to CQ1 #64a. *BC/
/EC* is probably attributable to rounding in the conversion from real dollars to nominal dollars, or the use of updated conversion parameters for the BAFO (inflation rate, expense timing etc.). 92 As noted earlier, LAI was able to benchmark *BC/ /EC* TSUC based on prior PJM interconnection requests.

May 25, 2021
Public Version Page 39
Table 19. LAI’s Evaluation TSUC Estimates for Smithburg 500 kV *BC//EC*
TSUC ($)
P50
P90
Evaluation TSUC
*BC
/EC*
2.2 NetORECCost
LNOC is calculated as the PVNOC divided by the same present value of annual OREC quantities used in the
calculation of LOPP.93 PVNOC is determined as the present value of OREC purchase payments less the
present value of the revenue credits associated with the sale of energy and capacity, and the avoided cost
of Tier 1 RECs. The basis for estimating these credits is presented below.
2.2.1 Market Price Projections
Quantitative evaluation of the Applications was completed using market price projections for energy,
capacity, and RECs developed by LAI.94 To simulate wholesale electric market dynamics in PJM, LAI used
Aurora, a chronological dispatch simulation model licensed by Energy Exemplar. The revenue credits for
energy were calculated using the applicable hourly zonal energy prices from the Offshore Wind case and
the expected hourly energy quantities used to calculate LOPP. The revenue credits for capacity were
calculated based on a proxy value reflective of the value of capacity over the last three years. The avoided
costs of RECs were calculated using LAI’s proprietary REC price model. The inputs and calculation methods
for these projections are described in Appendix A.95
2.2.1.1 EnergyPriceProjection
LAI’s projected prices are shown in Figure 12. Figure 13, Figure 14, and Figure 15 provide comparisons of
LAI’s projected zonal energy prices from Aurora for this solicitation (LAI S#2) to the projected prices
developed by LAI and BPU for the first solicitation (LAI S#1 and BPU S#1).96 Prices are shown in nominal
dollars per megawatt hour. The zonal and nodal points of interconnection for each Project are listed in
Table 20.
93 LNOC can also be calculated as LOPP less the levelized unit equivalents of revenue credits for energy, capacity, and avoided Tier 1 REC purchases. 94 The value of ancillary services is not included in the calculation of revenue credits for purposes of this evaluation. Ancillary services revenue will be credited against the OREC purchase price during the OREC term. 95 The REC price projection was based on equilibrium market assumptions and therefore does not address the potential impact of large increments of offshore wind added to the resource mix and resultant REC clearing prices in New Jersey over the OREC term. 96 The “BPU S#1” projection was included in the Solicitation Guidance Document for the first solicitation as guidance for the Applicants, and was based on NYMEX futures and the 2018 Annual Energy Outlook. The “LAI S#1” projection was developed as an independent assessment using Aurora.

May 25, 2021
Public Version Page 40
Table 20. Project Zonal and Nodal Points of Interconnection *BC//EC*
Project Zone Node
Atlantic Shores C AECO Cardiff
Ocean Wind 2 JCPL Smithburg
Figure 12. Energy Price Projections
$0
$10
$20
$30
$40
$50
$60
$70
2021
2022
2023
2024
2025
2026
2027
2028
2029
2030
2031
2032
2033
2034
2035
2036
2037
2038
2039
2040
2041
2042
2043
2044
2045
2046
2047
2048
2049
2050
Energy Price ($/M
Wh)
ACE JCPL PSEG RECO

May 25, 2021
Public Version Page 41
Figure 13. ACE Energy Price Projection Benchmark
Figure 14. PSEG Energy Price Projection Benchmark
$0
$10
$20
$30
$40
$50
$60
$70
2021
2022
2023
2024
2025
2026
2027
2028
2029
2030
2031
2032
2033
2034
2035
2036
2037
2038
2039
2040
2041
2042
2043
2044
2045
2046
2047
2048
2049
2050
Energy Price ($/M
Wh)
LAI S#2 LAI S#1 BPU S#1
$0
$10
$20
$30
$40
$50
$60
$70
2021
2022
2023
2024
2025
2026
2027
2028
2029
2030
2031
2032
2033
2034
2035
2036
2037
2038
2039
2040
2041
2042
2043
2044
2045
2046
2047
2048
2049
2050
Energy Price($/M
Wh)
LAI S#2 LAI S#1 BPU S#1

May 25, 2021
Public Version Page 42
Figure 15. JCPL Energy Price Projection Benchmark
Figure 16. RECO Energy Price Projection Benchmark
$0
$10
$20
$30
$40
$50
$60
$70
2021
2022
2023
2024
2025
2026
2027
2028
2029
2030
2031
2032
2033
2034
2035
2036
2037
2038
2039
2040
2041
2042
2043
2044
2045
2046
2047
2048
2049
2050
Energy Price ($/M
Wh)
LAI S#2 LAI S#1 BPU S#1
$0
$10
$20
$30
$40
$50
$60
$70
2021
2022
2023
2024
2025
2026
2027
2028
2029
2030
2031
2032
2033
2034
2035
2036
2037
2038
2039
2040
2041
2042
2043
2044
2045
2046
2047
2048
2049
2050
Energy Price ($/M
Wh)
LAI S#2 LAI S#1 BPU S#1

May 25, 2021
Public Version Page 43
The Aurora simulation model produces energy prices at the zonal level. The OREC contract price credits
ratepayers the actual market revenue for energy, capacity, and RECs. Because the project’s revenue from
energy sales in the PJM Day‐Ahead (“DA”) and Real‐Time (“RT”) markets are nodal based, LAI used a
statistical model to estimate the expected spread between nodal and zonal prices. Predicted nodal prices
for each proposed interconnection point are a function of zonal prices and chronological variables. This
statistical model is explained in Appendix A.
2.2.1.2 CapacityPriceProjection
LAI’s projected capacity prices for the relevant New Jersey capacity Local Deliverability Areas (“LDAs”) are
shown in Figure 17 alongside the projected prices from the Solicitation #1 BPU Guidance Document and
the capacity price projection produced by LAI using Aurora.97 As stated in the SGD, the capacity proxy
prices are based on the average of the previous three BRA resource clearing prices. The resource clearing
price for the 2022/23 delivery year is the three‐year average price, which is then escalated at a 2% annual
inflation rate each year thereafter. PSEG capacity prices are higher than those in the other New Jersey
LDAs as the PSEG LDA has recently been constrained and cleared higher than the EMAAC LDA in which it
is nested. Capacity prices used in this solicitation were projected using only resource clearing prices from
the Base Residual Auction (“BRA”) and did not incorporate adjustments from incremental auctions.
Figure 17. Capacity Price Projection98,99
97 The PSEG North LDA is not shown separately because it is not assumed to separate from PSEG. 98 LAI did not project a capacity price for PSEG separate from EMAAC in the first solicitation. 99 LAI’s EMAAC forecast in the first solicitation used Aurora modeling of supply and demand fundamentals rather than escalating a historical average as a proxy.
$0
$50
$100
$150
$200
$250
$300
$350
$400
2021
2022
2023
2024
2025
2026
2027
2028
2029
2030
2031
2032
2033
2034
2035
2036
2037
2038
2039
2040
2041
2042
2043
2044
2045
2046
2047
2048
2049
2050
Cap
acity Clearing Price ($/M
W‐day)
Delivery Year Beginning (June 1 ‐May 31)
EMAAC S#2 BPU EMAAC S#1 LAI EMAAC S#1
PSEG S#2 BPU PSEG S#1

May 25, 2021
Public Version Page 44
2.2.1.3 NewJerseyClassIRECPriceProjection
LAI’s projected New Jersey Class I REC Price projection is shown in Figure 18 alongside projected prices
from LAI and the BPU Guidance Document from Solicitation #1. Contributing factors to the decrease in
the REC price projection in this solicitation included updated economic and financial parameters, including
the lower capital cost for REC eligible technologies, the lower federal corporate income tax rate, and the
extension of the federal Production Tax Credit (“PTC”). A detailed description of the LAI’s REC price model
is provided in Appendix A.
Figure 18. New Jersey Class I REC Price Projection Benchmark
2.2.2 Present Value of Net OREC Cost
Annual and present values for total OREC Payments and market credits were calculated for each option.
The present values are summarized in Table 21. The same present value measures are also shown in Figure
19.
$0
$5
$10
$15
$20
$25
$30
$35
$40
2021
2022
2023
2024
2025
2026
2027
2028
2029
2030
2031
2032
2033
2034
2035
2036
2037
2038
2039
2040
2041
2042
2043
2044
2045
2046
2047
2048
2049
2050
Compliance REC
Price ($/M
Wh)
LAI S#2 LAI S#1 BPU S#1

May 25, 2021
Public Version Page 45
Table 21. Present Value of Net OREC Cost *BC//EC*
Atlantic Shores Ocean Wind 2
C A B
PV of OREC Quantity (GWh)
PV of OREC Payments ($MM)
Base OREC Purchase Price
TSUCPA
Total Payments
PV of Market Credits ($MM)
Energy
Capacity
Avoided Tier 1 RECs
Total Credits
PV of Net OREC Cost ($MM)
Figure 19. Present Value of Net OREC Cost *BC//EC*

May 25, 2021
Public Version Page 46
2.2.3 Levelized Net OREC Cost
LNOC can be presented either in levelized nominal dollars or in levelized real (constant date value) dollars.
The nominal levelized convention comports with the intended administration of OREC pricing as fixed
nominal prices, which, by definition, include inflation, by energy year. To promote standardization
between Applicants, the real levelized convention represents a fair basis for comparison of Projects with
different expected OREC term start dates or operational capacity schedules. The real LNOC is often used
by state entities to report the expected OREC Cost in current day dollars over the OREC term for a project
that will not start commercial operation for several years.
In general terms, the LNOC is equal to the Project’s OREC Purchase Price adjusted for the TSUCPA and the
value of capacity, energy, and RECs. The specific algebraic form is presented in Appendix B.
Nominal dollar LNOC results for each Project are shown in Table 22 and Figure 20.
Table 22. Levelized Net OREC Cost (Nominal $/MWh)
*BC//EC*
Atlantic Shores Ocean Wind 2
C A B
Levelized OREC Payments
Base OREC Purchase Price $106.18 $98.49
TSUCPA
Total Payments (LOPP)
Levelized Market Credits
Energy
Capacity
Avoided Tier 1 RECs
Total Credits
Levelized Net OREC Cost $58.81 $40.75 $42.30

May 25, 2021
Public Version Page 47
Figure 20. Levelized Net OREC Cost *BC//EC*
2.3 RatepayerImpacts
Ratepayer impacts, as a function of the Net OREC Cost and other factors, were also assessed for each
Project. PVNOC is an estimate of the costs which will be borne by ratepayers to allow New Jersey electric
distribution companies (“EDCs”) to recover the cost of the ORECs and the TSUCPA. Ratepayer impacts for
each Project are based on the PVNOC and a PV‐adjusted total New Jersey EDC retail load.100
To account for the time differences between a Project’s monthly delivery periods within its 20‐year
term(s) and the 2021 retail rate impact, the present value of the projected New Jersey retail load
quantities was calculated using the real discount rate. This allows for the determination of a real (constant
100 This calculation does not include any adjustments for indirect benefits associated with wholesale price effects in the energy, capacity, or REC markets. Likewise, it does not include adjustments for the avoidance of greenhouse gas (GHG) emissions or for the creation of economic activity benefits.

May 25, 2021
Public Version Page 48
base year) dollar levelized retail rate impact per MWh of retail load.101 Retail load for each year is based
on the U.S. Energy Information Agency (“EIA”) projections used in the Aurora simulation modeling.
The Net OREC cost will affect retail rates in two ways. First, the gross OREC cost and the energy and
capacity revenue credits will be included as a non‐bypassable component of the EDC delivery charges to
all classes of customers. This pass‐through is computed as a similar rate for all customer classes. Second,
the credit for avoided Class I REC purchases will be passed through to customers via the supply charge,
whether supply is provided directly by the EDCs or through competitive retail supplier. The levelized retail
rate impact in 2021 $/kWh, shown in Table 23, is calculated as the PVNOC divided by the present value of
retail load quantity.102
EIA data covering the 2019 calendar year was used to estimate average monthly usages and total bills for
residential, commercial, and industrial/transportation customers in New Jersey.103 All four NJ EDCs were
aggregated for this purpose. The monthly cost impact of an OREC purchase on the typical monthly bill for
each rate type was calculated as the product of the levelized retail rate impact (2021 $/kWh) and the
appropriate average monthly usage in kWh. The percentage change in the typical monthly bill was
calculated as the ratio of the monthly cost impact divided by the baseline average monthly bill.
Table 23. Retail Rate Impacts (Levelized 2021 $)
*BC//EC*
Atlantic Shores Ocean Wind 2
C A B
Average rate impact ($/MWh) $3.341 $1.867 $1.938 Residential Average per month ($) $2.21 $1.24 $1.28 % of Average Bill 2.02% 1.13% 1.17%
Commercial Average per month ($) $20.18 $11.27 $11.73 % of Average Bill 2.62% 1.47% 1.52%
Industrial/Transportation Average per month ($) $172.25 $96.26 $99.91 % of Average Bill 3.18% 1.78% 1.84%
101 Formula for present value of retail load quantity:
𝑃𝑉𝐸𝑅𝐿𝑄 𝑊𝐿𝑄 𝑅𝐿𝐿𝐹 𝐸𝐷𝐶𝐹/ 1 𝑅𝐷𝑅
WLQi is the New Jersey Wholesale Load for year i from simulation model (MWh) RLLF is the Retail Load Loss Factor for New Jersey load EDCF is the fraction of New Jersey retail load served by EDCs RDR is the Real Discount Rate = (1 + NDR) / (I + INF) – 1 NDR is the Nominal Discount Rate (7.00%) INF is the Inflation Rate (2.00%)
102 An adjustment from MWh to kWh is made. 103 https://www.eia.gov/electricity/data.php

May 25, 2021
Public Version Page 49
2.4 ComparisontoFirstNewJerseySolicitationandOtherStates
In Table 24, the Applicants’ proposed LOPPs are compared to the results of the first New Jersey solicitation
and to the results of selected solicitations that have been published by state authorities in Maryland, New
York, Massachusetts, Rhode Island, and Connecticut.104
Table 24. Levelized Pricing Comparison *BC//EC*
Year of Selection State Project
Capacity (MW)
Commercial Operation Year105
LOPP (Nominal $/MWh)
2016 MD Skipjack Wind 120 2023 $184.52106
U.S. Wind 248 2021 $179.56107
2017 NY South Fork Wind 130 2022 $186.07108
2018
MA Vineyard Wind 1 400 2022 $98.68109
Vineyard Wind 2 400 2023 $88.17109
RI Revolution Wind (RI) 400 2024 $107.08110
CT Revolution Wind (CT1) 200 2024 $108.15110
2019
CT Revolution Wind (CT2) 104 2024 $107.08110
NJ Ocean Wind 1 1,104 2024 $116.75111
NY Empire Wind 1 816 2024 $118.64112
Sunrise Wind 880 2024 $110.37112
2020 MA Mayflower Wind 804 2025 $88.13113
2020 MA Mayflower Wind 804 2025 $88.13114
2021 NJ ASOW C 1,510 2027 $106.18 (Base)
OW2 B 1,148 2028 $98.49 (Base)
104 Block Island Wind Farm, Bluewater Wind, Cape Wind, and Fishermen’s Energy have not been included in this comparison because they are not considered representative of the current offshore wind market. As of May 25, 2021, NYSERDA has not announced the prices for the awards to Equinor Wind for Empire Wind 2 (1,260 MW) and Beacon Wind (1,230 MW). 105 As announced at time of award. For the Applications in the current solicitation, the years represent the first phase where there are multiple phases. 106 Calculated from annual prices published in MD PSC Case No. 9431, Skipjack Offshore Wind Energy, LLC ‐ Letter accepting approval on Order No. 88192, May 24, 2017 (https://webapp.psc.state.md.us/newIntranet/Casenum/NewIndex3_VOpenFile.cfm?filepath=//Coldfusion/Casenum/9400‐9499/9431/Item_122\SkipjackLetterofAcceptance.PDF). 107 Calculated from annual prices published in MD PSC Case No. 9431, U.S. Wind, Inc. ‐ Notice of Acceptance of Conditions, May 25, 2017 (https://webapp.psc.state.md.us/newIntranet/Casenum/NewIndex3_VOpenFile.cfm?FilePath=//Coldfusion/Casenum/9400‐9499/9431/123.pdf). 108 Estimated by LAI based on limited public information available about the award.

May 25, 2021
Public Version Page 50
109 Calculated from MA DPU Docket Nos. 18‐76, 18‐77, and 18‐78, Vineyard Wind PPAs filed on August 1, 2018. LAI added in the expected value of capacity based on the 2017 RGGI Model Rule Price Scenario to facilitate price comparison. 110 RI PUC, Docket No. 4929, Direct Testimony of Jeffrey Grybowski on behalf of DWW Rev I LLC, April 5, 2019, p. 6. LAI added in the expected value of capacity based on the 2017 RGGI Model Rule Price Scenario to facilitate price comparison. 111 Calculated from annual prices published in the BPU’s Order in Docket No. QO18121289 (https://www.bpu.state.nj.us/bpu/pdf/boardorders/2019/20190621/6‐21‐19‐8D.pdf). 112 Calculated from annual prices published in NYSERDA’s Launching New York’s Offshore Wind Industry: Phase 1 Report (https://www.nyserda.ny.gov/‐/media/Files/Programs/offshore‐wind/osw‐phase‐1‐procurement‐report.pdf). 113 Calculated from Order in MA DPU Docket Nos. 20‐16, 20‐17, and 20‐18, Mayflower Wind PPAs, filed on February 10, 2020. LAI added in the expected value of capacity based on the 2017 RGGI Model Rule Price Scenario to facilitate price comparison. 114 Calculated from Order in MA DPU Docket Nos. 20‐16, 20‐17, and 20‐18, Mayflower Wind PPAs, filed on February 10, 2020. LAI added in the expected value of capacity based on the 2017 RGGI Model Rule Price Scenario to facilitate price comparison.

May 25, 2021
Public Version Page 51
3 ECONOMICIMPACTSANDSTRENGTHOFGUARANTEESFORECONOMICIMPACTS
Highlights
Project unitized economic benefits, which are the basis for assigning points in this category, are shown in Figure 21 *BC
EC*
Figure 21. Unitized Levelized Economic Impacts *BC//EC*
OW2 A and B are expected to result in 1,923 and 2,024 full‐time equivalent (“FTE”) job years, respectively, during the development and construction phases, and 52 FTE positions annually during the operation phase. *BC/
/EC*
The Applicants have made financial commitments to support construction of a monopile manufacturing facility in Paulsboro and *BC/ /EC* wind turbine generator assembly *BC/ /EC* facilities at the NJWP. Both Applicants would build O&M facilities in New Jersey and make substantial contributions for economic development related initiatives and grants. *BC

May 25, 2021
Public Version Page 52
/EC* Both Applicants intend to engage with union labor for project construction.
Both Applicants have provided financial commitments to invest in pilot energy technology programs. ASOW is committed to investment in an electrolyzer plant in South Jersey for hydrogen production. With an Application revision that could be requested by the BPU, ASOW would consider accelerating commercial development of the plant to enable demonstration of safe manufacturing and use of hydrogen in lieu of conventional methane. OW2 proposes to fund a pilot heavy truck electrification project at the Port of Newark/Elizabeth, which would help displace diesel emissions in conventional trucks.
Both Applicants indicate support for assisting environmental justice communities in multiple ways. Both Applicants commit to providing grants and funds for workforce training, educational, innovation, and other programs, including contributions to the NJ WIND Institute, with a focus on benefits to residents of environmental justice and low‐income communities. The OW2 truck electrification project would result in cleaner air in adjacent environmental justice communities. If the electric truck project is not practical, OW2 would alternatively allocate the funds for environmental justice purposes. Both Applicants would develop O&M facilities in Atlantic City, a low‐income community, and would work with supply‐chain firms to locate their activities in environmental justice and low‐income communities.
OW2 offered conditional in‐State direct expenditures guarantees for its Projects through three years after COD, *BC/
/EC* However, OW2’s minimum guaranteed spend commitment is riskier due to NJWP‐
related conditions.
ASOW offered firm O&M jobs guarantees over the 20‐year OREC term, while OW2 did not provide a jobs guarantee backed by financial penalties for any shortfall. *BC/
/EC* Although ASOW does not make a jobs guarantee for the development and construction
phases, the details of its expected in‐State activities and spending during those phases suggest that the number of in‐State jobs would be much less than the jobs commitments by OW2. *BC/
/EC*
N.J.A.C. 14:8‐6.5(a)(11)(i) requires the cost‐benefit analysis for the Project to include a “detailed input‐
output analysis of the impact of the Project on income, employment, wages, indirect business taxes, and
output in the State with particular emphasis on in‐State manufacturing employment.” N.J.A.C. 14:8‐
6.5(a)(11)(xiii) requires job totals to be reported as “full‐time equivalent (“FTE”) positions assuming 1,820
hours per FTE‐year.” The rules at N.J.A.C. 14:8‐6.5(a)(11)(ix) specify that the evaluation consider the
direct, indirect, and induced economic effects. These effects are reported below for the development,
construction, operation, and decommissioning phases of each Project.
More specifically, Applicants were required to provide values for their expected direct economic impacts
in terms of New Jersey expenditures and jobs during the development, construction, operation, and
decommissioning phases of the Project, including planned in‐State spending that will support

May 25, 2021
Public Version Page 53
environmental justice communities and other local economic development initiatives. Applicants were
requested to guarantee all or a portion of the expected in‐State direct expenditures and jobs attributable
to investment commitments in New Jersey’s infrastructure and related local spending during the
development, construction, operation, and decommissioning phases.115 Failure to meet the guaranteed
levels of economic impacts will require the Seller to reimburse New Jersey for any shortfalls according to
the Applicant’s proposed compensation mechanism. This guaranteed portion of the economic impacts
was given a higher weighting in the evaluation. Total expected direct impacts stated in the Application
Form were evaluated by LAI for credibility, likelihood, and consistency. Near‐term economic impacts were
given more weight than later impacts, based on use of the 7% nominal discount rate, as stated in the
Solicitation Guidance Document. Applicants were also required to include detailed input data on direct
expenditures and jobs by type of activity and its industry classification.
Guidance in the SGD indicated that only economic benefits incremental to those claimed in New Jersey’s
first offshore wind solicitation may be included in economic benefits claimed for this solicitation #2. No
explicit guidance was provided in the SGD regarding the earliest date for inclusion of in‐State expenditures
and jobs. From an award decision perspective, only going‐forward economic benefits after the award date
are relevant. Although both Applicants included some past expenditures, the amounts were too small to
warrant adjustments to exclude those early development expenditures.
To facilitate objectivity and standardization, LAI independently modeled the Applicants’ expected direct
spending and jobs with certain adjustments in the IMPLAN economic input‐output model to derive
consistent estimates of GDP and jobs benefits between Applications. A description and key assumptions
of IMPLAN and the modeling procedures used are presented in Appendix C.
Four types of data adjustments were made to promote consistency between Applicants for modeling
evaluation and reporting purposes:
Expenditures for construction of supply chain factories were transferred from an Applicant’s development or construction category to form a factory construction category, separate from offshore wind facility construction activities.
Expenditures for land purchase, leasing, and easements were excluded because they represent an exchange of money for existing land use rights rather than production of new goods or services.
Taxes and fees were excluded because they represent transfer payments rather than production of new goods or services.
Available direct jobs information provided by the Applicants were used as IMPLAN inputs for construction and operation activities.116
115 The Application Form included a specific template for how Applicants should enter their expected and guaranteed minimum in‐State expenditures and job creation by phase. 116 Although requested to provide direct jobs input data for their input‐output model in the Application Form’s Bill‐of‐Goods sheet, neither Applicant provided this information.

May 25, 2021
Public Version Page 54
Based on valuation weighting preferences stated in the SGD, LAI and Board Staff have specified a set of
valuation weights for the six categories shown in Table 25.117 The weighting factors were specified prior
to submission of the Applications based on the product of two assumptions.
By type of effect, indirect effects were weighted at 50% of direct effects, and induced effects at 40% of direct effects, to account for model limitations in the estimation of these diffuse local economy respending multiplier effects on production and consumption activities. The reason for these discount factors is to account for the static equilibrium assumptions and data limitations of the economic input‐output model to estimate these backward linkage effects of direct local expenditures more conservatively and accurately.118
By strength of each Applicant’s claims, expected non‐guaranteed effects were assumed to be worth 75% of guaranteed effects.
Table 25. Discount‐weighting Factors by Economic Effects Category and Guarantee *BC//EC*
Economic Effects Category Source Weighting Factor
Guaranteed direct economic effects Submitted by Applicant
Expected, but not guaranteed direct economic
effects
Submitted by Applicant, adjusted
by LAI for consistency and use of
supplemental Applicant jobs data
Indirect economic effects associated with the
guaranteed direct economic effects
Uniformly calculated
by LAI with its model and
consistent data assumptions
Indirect economic effects associated with the
expected, but not guaranteed direct economic
effects
Induced economic effects associated with the
guaranteed direct economic effects
Induced economic effects associated with the
expected, but not guaranteed direct economic
effects
While N.J.A.C. 14:8‐6.5(a)(11) indicates that several economic effects criteria are to be modeled and
reported by the Applicant, including income, wages, output, indirect business taxes, and jobs, for the
purposes of economic benefits scoring and cost‐benefit analysis, the value‐added or gross domestic
product (“GDP”) measure was used because it represents the net in‐State income and is the most
117 “In the evaluation of Economic Impacts and Strength of Guarantees for Economic Impacts, guaranteed employment impacts and in‐State spending will be given more weight than planned, but not guaranteed, employment and spending. Non‐guaranteed direct employment and spending will be given more weight than indirect and induced economic impacts” (Solicitation Guidance Document, p. 31). 118 A static equilibrium economic model assumes that all adjustments towards a new equilibrium state occur instantaneously. There is no concept of time dynamics or partial adjustment to an initial change or shock to the system in a static equilibrium model. In contrast, a dynamic equilibrium model includes partial, lagged adjustments over multiple future time periods.

May 25, 2021
Public Version Page 55
important single metric of economic development.119 For economic benefits scoring evaluation, total GDP
effects for each Project were calculated on an expected annual delivered energy unitized (levelized) real
(2020 $) value basis ($/MWh).120 For inclusion of economic development benefits in the cost‐benefit
analysis, the present value of total GDP effects for each Project were used.
3.1 EEWPhase2FactoryDevelopment
Both Applicants propose to use a new monopile fabrication facility that would be developed by EEW as a
Phase 2 facility at the Paulsboro site. Both Applicants assume that construction of EEW’s Phase 1 monopile
finishing facility to support the OW1 project will be completed in time to not delay the proposed schedule
for the Phase 2 monopile fabrication facility. *BC/
119 In contrast, output refers to the sales of sectors or industries that would be supplying the Project with materials (such as turbines, steel and cement for support structures, wire for transmission cables), and services (such as construction and installation services, as well as engineering, legal, finance, and other professional services). This is a less useful summary metric for State economic effects because it includes the value of purchases of goods and services from outside the State in addition to the value‐added in‐State. Wages and indirect business taxes are paid out of value‐added, so inclusion of either of those two metrics with gross domestic product would double‐count those effects in the overall economic benefits measure. 120 Real values instead of nominal values were used for economic benefits scoring primarily because the lifetime profiles of direct expenditures and jobs vary significantly by lifecycle phase.

May 25, 2021
Public Version Page 56
EC*

May 25, 2021
Public Version Page 57
Table 26. *BC/ /EC* *BC//EC*
*BC/
121 *BC/
EC* 122 *BC/ /EC* 123 *BC/
/EC*

May 25, 2021
Public Version Page 58

May 25, 2021
Public Version Page 59
EC*
3.1.1 Atlantic Shores
*BC
124 *BC/
EC*
125 *BC/
/EC*

May 25, 2021
Public Version Page 60
/EC*
Table 27. ASOW *BC/ /EC* *BC//EC*
*BC
/EC*
3.1.2 Ocean Wind 2
OW2 has a Preliminary Development Agreement (“PDA”) 2 with EEW, effective January 26, 2021.
*BC/
126 *BC
/EC*

May 25, 2021
Public Version Page 61
/EC*
Table 28. *BC/ /EC* *BC//EC*
*BC EC*
Table 29. *BC/ /EC* *BC//EC*
*BC/
EC*
127 *BC
/EC*
128 *BC/ /EC*

May 25, 2021
Public Version Page 62
3.2 OtherEconomicDevelopmentPlanActivities
3.2.1 Workforce and Community Development Initiatives
Both Applicants propose significant expenditures on workforce and community development initiatives.
A summary of each Applicant’s proposed initiatives is provided below in Table 30. The Applicants’ total
funding of initiatives and allocation of funding across three broad categories – support for new energy
technologies, education and research, and community economic assistance – are similar.
The Applicants each propose to provide support to some of the same organizations. Both Applicants
would contribute funding to the New Jersey WIND Institute and partner with Rowan College, Rutgers
University, or Rowan University. Specifics of the proposed initiatives for each Applicant are summarized
in the following two subsections.

May 25, 2021
Public Version Page 63
Table 30. Workforce and Community Development Initiatives (millions of nominal $)
*BC//EC*
Atlantic Shores Ocean Wind 2129
C A B
Innovative Technologies
SJI Hydrogen Plant 16
Zeem trucks / Environmental Justice 11
Education and Research
12
10.16 2
8
2.01
4
0.7
0.4 Unspecified
0.336
Wildlife Monitoring Fund
New Jersey WIND Institute130
Pro‐NJ Grantor Trust 2
Rutgers University EcoComplex131
Workforce Development Fund Seed132
Education and Community Center
Rowan College/University133
Rutgers Future Scholars
Boys and Girls Club STEAM 0.32
Community Economic Assistance
0.2
0.17
0.15
Electric bill assistance
Electric car chargers
Barnegat Bay Partnership134
Chambers of Commerce 0.017
Total 34.263 33.2 33.2
3.2.1.1 AtlanticShoresInitiatives
*BC
/EC* Atlantic Shores would commit $160,000 to serve as Lead
Sponsor for all WIND Institute events. Additionally, for Projects *BC/ /EC* C, *BC/ /EC* Atlantic
Shores would commit $10 million for workforce training and innovation activities of the WIND Institute.135
129 Ocean Wind 2 provided little information on its proposed expenditures timing. *BC
/EC* 130 *BC/
EC* 131 *BC/
EC* 132 This seed money into Atlantic Shores’ training fund would be paid regardless of whether there is an economic benefit shortfall. Additional contributions totaling up to *BC/ /EC* $36 million (Project C) *BC/ /EC* would be made if there is a shortfall. 133 Atlantic Shores’ proposed Rowan College/University expenditure occurs in 2021‐2028. 134 *BC/ /EC* 135 The alignment of this commitment with the structure of the WIND Institute has not been assessed.

May 25, 2021
Public Version Page 64
Atlantic Shores also proposes to partner with SJI to construct a hydrogen demonstration plant, partner
with Rutgers University to expand its EcoComplex, contribute seed funding to Atlantic Shores’ workforce
development fund, and invest in several smaller initiatives.
The goal of the hydrogen demonstration plant is to increase the use of hydrogen as a fuel source by using
an electrolyzer to produce green hydrogen for blending into natural gas. Atlantic Shores would commit
*BC/ /EC* $16 million for a 10 MW electrolyzer for
Projects C *BC/ /EC*
All Atlantic Shores projects would also include $400,000 to fund student scholarships in workforce training
programs at Rowan College.
The level of proposed Rutgers EcoComplex funding varies depending on the project selected. All Atlantic
Shores projects include a $10,000 commitment to sponsor and lead a series of introduction to offshore
wind seminars. Projects *BC/ /EC* C, *BC/ /EC* also include $1 million to sponsor 5+ minority or
women business enterprise offshore wind companies and $1 million to fund the purchase and
construction of offshore wind‐specific testing equipment. *BC
/EC*
As part of its economic benefit shortfall compensation mechanism, Atlantic Shores proposes to set up a
workforce development fund to invest in New Jersey workforce training to build skills and capabilities
necessary for the offshore wind industry. Atlantic Shores would seed *BC/ /EC* into this fund,
depending on the Project, regardless of whether there is a shortfall in economic benefit. If there is a
shortfall, Atlantic Shores would commit up to *BC/ /EC* of additional funding, depending
on the project and amount of the shortfall.
Atlantic Shores has also proposed several smaller initiatives that are included with all projects:
At least $700,000 would be spent over the first ten years of the lease to establish an Education
and Community Outreach (“ECO”) Center in partnership with Stockton University in Atlantic
City.
$336,000 would be used to provide summer programming in offshore wind for high school
students through the Rutgers University Future Scholars program, which provides college
preparation and a tuition‐free pathway to college for first‐generation students from low‐income
backgrounds.
$320,000 would be used to support the Boys & Girls Club of Atlantic City’s STEAM (science,
technology, engineering, arts, and mathematics) programming.
Up to $170,000 would be allocated to support expanding vehicle electrification in Atlantic City
by purchasing electric car chargers.
$150,000 would be used to expand communication and educational grants through the
Barnegat Bay Partnership.
$17,055 would be used to join regional or demographic‐focused chambers of commerce and
host “Meet and Greets” for members.
3.2.1.2 OceanWind2OtherInitiatives
Ocean Wind 2 proposes $2 million in funding for the New Jersey WIND Institute for its projects.

May 25, 2021
Public Version Page 65
Ocean Wind 2 proposes to partner with Zeem Solutions, Inc. on an electric truck initiative, contribute to
the Regional Wildlife Monitoring Fund and the Pro‐NJ Grantor Trust 2, and contribute funding to assist
those unable to pay their electricity or gas bills. These commitments would not differ between Projects A
and B.
Ocean Wind 2 proposes to support Zeem, a provider of e‐mobility logistics solutions for small, medium,
and large fleet operators across the U.S., to secure up to 50 Class 8 trucks and develop an electric truck
depot facility at the Port of Newark/Elizabeth. An executed MOU contemplates a three‐phased approach
to financial support for the vehicles to ensure that performance and utilization levels remain high. The
total financial support for this initiative would be capped at $11 million. If this pilot project cannot be
realized or is ultimately deemed poor value to ratepayers, Ocean Wind 2 would reallocate the unspent
portion of these funds “to deliver immediate benefits to Environmental Justice communities.”136
Proposed commitments of $12 million to the Regional Wildlife Monitoring Fund and $8 million to the to‐
be‐established NJ Grantor Trust 2 are also included. The Regional Wildlife Monitoring Fund would support
a robust research and monitoring program that, in tandem with data collected as part of surveys and
studies needed to secure state and federal permits, would provide a comprehensive picture of the
offshore, nearshore, and coastal environment in New Jersey. Section 9.3.1 of Ocean Wind 2’s Application
contains a detailed description of the proposed initiatives to be addressed by this fund. The key tenets of
the Pro‐NJ Grantor Trust 2 include supporting education and training of the workforce as it transitions to
increasingly support offshore wind and clean energy at large, supporting environmental justice initiatives
and empowering minority business enterprise, women business enterprise, veteran‐owned or small
business entry into the offshore wind industry. The fund would be run by trustees appointed by the project
to advise grant decisions.
Ocean Wind 2 proposes to partner with Rowan University to investigate options for the integration of
energy storage technologies in conjunction with offshore wind power plants in the New Jersey electric
grid, but does not specify what, if any, funding would be provided.
Ocean Wind 2 would contribute $200,000 to bolster Ocean Wind 1’s work with Ørsted Cares. This is a
grant program in collaboration with New Jersey Shares, Inc. (“NJ SHARES”) that is designed to assist
electric and gas utility customers who are in an emergent situation or facing imminent service termination
and need immediate utility bill payment assistance.
3.2.2 Economic Development Plan Phases
Both Applicants have provided information on their efforts to localize manufacturing of the wind turbine
generators, engage with union labor for project construction and localize project operation and
maintenance facilities. The following subsections contain summaries of each Applicant’s current progress
and plans in each of these areas.
136 OW2 Application, p. 8‐24. Neither the locations of the Environmental Justice communities to be benefited nor the types of immediate benefits to be provided absent the Zeem initiative were specifically described. However, if the Zeem initiative is realized, the low‐income communities adjacent to the Port of Newark/Elizabeth would be most benefitted by reduced air pollution from drayage trucks operating in and near the port.

May 25, 2021
Public Version Page 66
3.2.2.1 WindTurbineGeneratorManufacturingFacilities
If the WTG facilities proposed by the Applicants are established, the intent of the respective OEM partners
is for the facilities to provide long‐term jobs and other offshore wind supply chain economic benefits to
New Jersey. Most of the benefits would be in Salem County, if the WTG facilities are located, as planned,
at the NJWP.
Atlantic Shores proposes establishment of an MHI Vestas nacelle assembly facility *BC/
/EC* in the NJWP. The nacelle assembly facility is included with Projects C *BC/
/EC* and, in addition to NJWP site development and leasing, would bring $16.5‐24 million137 in in‐State
investment for buildings and tooling and create 50‐70 direct jobs during assembly of Atlantic Shores’
nacelles.138 The components for the module would be shipped from MHI Vestas’ global supply chain
(including potential local sourcing wherever applicable) and assembled, quality checked, and tested at the
site before installation in the final nacelle. The facility would be designed to manufacture 50 nacelles per
year and store them on site.139
*BC/
/EC*
For its Project B, Ocean Wind 2 has reached an agreement to partner with GE to jointly fund a nacelle
assembly facility at the NJWP. Modern WTG nacelles adopt a modularized manufacturing process where
modules and sub‐assemblies are sourced from GE’s global supply chain. It is envisaged that these essential
components will be transported to the New Jersey facility, where they will be incorporated into the
finished nacelle. In time, it is GE’s intention to explore the possibility of building a domestic supply chain
to enable components or subassemblies to be sourced from local suppliers. Due to its specific
requirements, this facility could only be located at the NJWP, according to OW2. As a result of the
uncertainty of the tenant selection process for land at the NJWP, the Applicant conditionally guarantees
a nacelle facility as subject to GE securing a lease at the NJWP. If Project B is chosen, Ocean Wind 2 would
provide $70 million of funding for GE to construct and commission the facility in time for the Project’s
production run.142 The cumulative direct statewide economic impact associated with this nacelle facility
would be 146 direct jobs created and a $20 million direct impact on GDP.143 If constructed, it is expected
137 This does not include an additional $10 million in‐State spend that is assumed for site preparation work not included in MHI Vestas’ scope estimates but likely to be spent to meet specific requirements for the facility. Long‐term lease costs at the NJWP would also be additional in‐State spend. ASOW Application, Section 8.4. 138 ASOW Application, Section 8.4 (page 167 of 436). 139 ASOW Application, Section 8.4.1.2. 140 *BC
EC* 141 ASOW Application, Section 8.4 (page 168 of 436). 142 OW2 Application, Section 8.2.3. 143 OW2 Application, Section 8.3.5.

May 25, 2021
Public Version Page 67
that this facility would serve the U.S. market for many years, extending the economic impact and jobs
created beyond those associated with the Ocean Wind 2 project.
3.2.2.2 UnionEngagementforProjectConstruction
Atlantic Shores has executed an MOU with the key New Jersey trade unions that will be involved in
offshore wind. The MOU contains provisions that Atlantic Shores and the appropriate union parties will
cooperate and collaborate to promote green economic growth and environmental sustainability while
increasing the participation of a unionized workforce in offshore windfarm construction. The Applicant
has begun initial discussions about training and is seeking ways to utilize both New Jersey and national
union training facilities. This work will also include supporting Helmets to Hardhats, which connects
retiring active‐duty military service members, veterans, National Guard and Reservists with skilled training
and quality career opportunities in the construction industry.144
In October 2020, Ørsted signed an agreement with North America’s Building Trades Unions (“NABTU”) for
the build‐out of its current and future portfolio of projects. The partnership will create a national
agreement designed to transition U.S. union construction workers into the offshore wind industry.
Through the partnership with NABTU, and in collaboration with local union leaders and Ørsted’s Tier 1
suppliers, Ørsted will develop specific programming for identified work scopes so that workers are
prepared when construction starts. The Applicant will build on the experience gained through the
construction of Ocean Wind 1, particularly in the unique offshore environment, to expand union work
opportunities for Ocean Wind 2.145
3.2.2.3 OperationandMaintenanceFacilities
Atlantic Shores would establish an O&M center in Atlantic City that would provide between *BC/
/EC* (depending on project size) permanent jobs in technical service, project planning, data analysis,
turbine preventative maintenance and repair, cable and foundation monitoring and substation
maintenance, as well as create economic activity for a wide range of subcontractors including shipyards,
spare part producers and vessel and harbor services. It is expected that these jobs would be filled by New
Jersey residents, with the existing local maritime and fishing industry supporting vessel needs. The O&M
facility would be built using local labor on an underutilized parcel in the city.146
Ocean Wind 2 would expand its base in Atlantic City for Ocean Wind 1 into a multi‐project facility for
O&M, becoming a focal point for long‐term job creation within offshore wind in the state. The Applicant
expects to spend $48 million in‐State and create 208 FTE‐years before and during the first three years of
project operations. This would be an average of 41 FTEs per year, including a two‐year ramp‐up period
before COD. For operation years *BC/ /EC* the Applicant expects to spend an additional $370
million and create *BC/ /EC* FTE‐years (average of 46 FTEs per year). Many of the jobs required for
the Project’s O&M are technical and require specialized skills and expertise, so the Applicant will seek
close cooperation with local training providers to ensure that skills and competencies can be sourced
locally to create an enduring economic boost for Atlantic City and the state overall.147
144 ASOW Application, Section 8.2.5. 145 OW2 Application, Section 8.5.2. 146 ASOW Application, Section 8.4.1.4. 147 OW2 Application, Section 8.4.1.

May 25, 2021
Public Version Page 68
3.2.2.4 Decommissioning
After a 30‐years or longer operational life, both Applicants would undertake decommissioning and removal of all offshore equipment and materials. Atlantic Shores assumes that by the time of decommissioning, a specialist industrial recycling firm will be established in New Jersey, which would cut up steel sections and extract copper and other valuable materials from the cables and turbine equipment.148 *BC
EC* Ocean Wind 2 included a much more detailed set of in‐State decommissioning activities
that are basically the reverse of its installation activities.
3.3 GuaranteedDirectEconomicDevelopmentEffects
Compared to the first offshore wind solicitation, the guaranteed in‐State spending and jobs packages
offered in this solicitation are *BC/ /EC* These outcomes
likely reflect the increased maturity of the developing offshore wind industry in New Jersey. Several
reasons may account for the improved quality of direct economic guarantees:
The nearly two years between the first‐round and this second‐round solicitation’s submission dates has provided more time for hardening proposed project supply chain plans, logistics plans, and relations with New Jersey business, labor, and educational constituencies.
The previous award to Ørsted for Ocean Wind 1 apparently provided EEW with sufficient inducement to begin development of its Phase 1 monopile finishing facility in Paulsboro. Based on that commitment by EEW, both Applicants in this solicitation have included firm spending commitments related to EEW’s proposed Phase 2 monopile fabrication facility.
3.3.1 Comparative Evaluation
Table 31 compares the six Project offers by the type of spending and/or jobs guarantees for key functional
drivers related to the scope and magnitude of in‐State expenditures and employment. The ASOW offers
consist of a firm NJ spending guarantee from 2019 until final COD and a 20‐year firm O&M jobs guarantee
over the OREC term. OW2 has in‐State spending and jobs guarantees from the OREC award date until
three years after final COD. The OW2 guarantees combine development and construction activities with
O&M activities, while ASOW has separate guarantees for the pre‐ and post‐COD periods. The OW2 jobs
guarantee is only used to decrease its spending guarantee if actual jobs exceed guaranteed jobs, and there
is no penalty for not meeting the jobs guarantee.
*BC
148 ASOW Application, Section 15.

May 25, 2021
Public Version Page 69
EC* ASOW’s Project C size and scope are similar to OW2 Project B, with ASOW proposing
that MHI Vestas would construct a nacelle assembly facility at the NJWP, while OW2 proposes that GE
would build a nacelle assembly facility at the NJWP. *BC
/EC*
The logistics plans of both Applicants include leasing of areas at the future NJWP for WTG marshalling.
OW2 makes its spending and jobs guarantees contingent on timely completion of the NJWP and obtaining
a reasonable cost lease, while ASOW’s spending guarantee for that activity is firm. OW2’s Project B also
makes construction of a nacelle assembly facility and in‐State supply of nacelles contingent on GE
obtaining a reasonable cost lease at the NJWP, while ASOW’s spending guarantee is firm regardless of
whether the MHI Vestas nacelle assembly *BC/ /EC* facilities are built and supply WTG
components for Projects C *BC/ /EC* OW2 proposes that its spending guarantee for network
upgrades will vary up or down, based on the final TSUC relative to the upgrade cost estimate in OW2’s
spending guarantee.149
Table 31. In‐State Spending and Jobs Key Drivers and Commitment Type *BC//EC*
Atlantic Shores Offshore Wind Ocean Wind 2
C A B
Nameplate capacity (MW) 1,509.6 1,148.0
Grants and funding of economic benefits Firm Firm
Foundation fabrication facility and supply Firm Firm
Firm Firm
WTG marshalling Firm 2 Conditions
Nacelle assembly facility and supply Firm 2 Conditions
‐‐ ‐‐
Onshore and offshore construction Firm Firm
Network upgrades Firm Variable
Operations and maintenance Firm Firm
ASOW proposes two independent NJ economic benefits guarantees while OW2 proposes a single, more
complex guarantee structure. ASOW offers an in‐State spending commitment that guarantees 100% of its
estimated in‐State spending from 2019 through COD, *BC/
/EC* ASOW suggests that the firm spending guarantee ensures
that many in‐State jobs will be created during the development and construction phases. Hence, ASOW
does not include a guarantee for the number of jobs prior to COD. For the operations phase, ASOW
149 *BC/
/EC*

May 25, 2021
Public Version Page 70
proposes only a jobs guarantee based on 100% of its estimated number of in‐State FTE positions in
operations and maintenance over the entire OREC term.
In contrast, OW2 makes a single guarantee that includes both spending and jobs components that cover
90% of its spending and jobs estimates during the post‐award development and construction period and
the first three years of operations after final COD. OW2 proposes that if it creates more jobs than its jobs
guarantee component requires, it will reduce the in‐State spending guarantee obligation at the rate of
$82/hour.
To facilitate comparison between the Applicants’ economic benefits guarantees with as much uniformity
as possible, the spending and jobs guarantees are summarized separately in Table 32 for spending and
Table 33 for jobs, although they are interrelated in the OW2 guarantee structure. Some calculated values
are also included in the two tables to provide additional comparability.

May 25, 2021
Public Version Page 71
Table 32. Expected and Guaranteed In‐State Spending by Applicant and Project *BC//EC*
Atlantic Shores Offshore Wind150 Ocean Wind 2151
C A B
Currency Unit Nominal $ Real 2020 $
Commitment Period 2019 to phase COD with pro rata
spend tracking for each phase Award date to final COD + 3 years
Expected Spend
Development and Construction
Conditions None
Network upgrade cost deviation;
NJWP timely completion;
Reasonable NJWP lease terms
Expected Spend ($MM) 848 ~1,193 (~ ) ~1,327 (~ )
Operations
Conditions None None
Expected Spend ($MM) 48 48
Total
To final COD ($MM) 848
To final COD+3y ($MM) ~1,241 (~ ) ~1,375 (~ )
Spend Guarantee
Type of Guarantee Firm Conditional
Deficiency Cure Rate 100% 90% 90%
Guaranteed Spend ($MM) 848 ~1,117 (~ ) ~1,237 (~ )
Deficiency Consequences
Additional contribution to a
workforce development fund for
any shortfall up to ($MM):
Additional contribution to Pro‐NJ
Grantor Trust 2.
Any spend shortfall is reduced by a
credit for any in‐State jobs greater
than guaranteed jobs at $82/hr
36
Reduce OREC price for any
additional shortfall over
remainder of OREC term
Both Applicants commit to providing grants and funds for several types of workforce training, educational,
innovation, and other programs, as well as contributions to the NJ WIND Institute, in their expenditures
covered by their respective spending guarantees. ASOW also includes funding for a small hydrogen plant
in its Projects *BC/ /EC* C, *BC/ /EC* in its project spend guarantee.
The spend values in Table 32 for ASOW and OW2 are not fully directly comparable due to differences in
their proposals. On one hand, the ASOW values would be smaller if they had also been provided in real
2020 dollars instead of nominal dollars spent from 2019 through 2028. On the other hand, the ASOW
values would be slightly larger if the commitment period had included in‐State operations expenditures
150 ASOW’s spend guarantee is for materials and services through COD (ASOW Application, p. 161). Guaranteed expenditures and maximum deficiency contribution to workforce development fund are provided in Application, Table 8‐6. *BC/ /EC* 151 OW2’s total expected spend values provided in Application Table 8.1 and expected spend for O&M until COD + 3 years provided in Table 8.9. Guaranteed expenditures are provided in Table 8.14. Lower values in parentheses are for when the conditions are not met. The tilde symbol represents final TSUC cost variation.

May 25, 2021
Public Version Page 72
for three years after final COD. *BC/
/EC*
Key conclusions in comparing Applicants’ spending guarantees:
1. OW2 proposes more contributions to various organizations and program activities than ASOW.*BC
/EC* The ASOW commitment toan unnamed workforce development fund appears to be at the early conceptual stage, butthere would be sufficient time to implement the program and strategy after an award.
2. Both Applicants have stated that their expenditure guarantees include recent developmentexpenditures. Although for comparative evaluation in Project selection, only going forwardexpenditures after the award date matter from the perspective of NJ residents and ratepayers,the size of sunk expenditures that would be claimed by each Applicant are similar and relativelysmall. Thus, the January 1, 2019 start date in ASOW’s guarantee and the mid‐2021 start date inOW2’s guarantee are not a material issue.
3. *BCEC* However, OW2’s minimum guaranteed spend
commitment is “softer” in that its proposed guarantee mechanism would credit the minimumspend obligation by $82/hour or $149,200 per FTE‐year for any FTEs created beyond its jobsguarantee.
4. OW2’s guaranteed spend for its larger expected in‐State economic impacts scope Project B willbe identical to its Project A guarantee if the three NJWP conditions are not met. *BC/
/EC*
5. The spend deficiency cure mechanism proposed by ASOW is marginally riskier than OW2’s inthat beyond a deficiency threshold for adding more funds to its proposed workforcedevelopment fund, any excess deficiency would be compensated by a reduction in OREC pricing.The reason the OREC pricing adjustment mechanism is slightly riskier is that it would be basedon a projection of future expected production per its one‐time reset mechanism.152
The guaranteed in‐State jobs commitments by the Applicants are more disparate than their in‐State
spending guarantees due to much different time periods for their respective jobs commitments and the
lack of a penalty mechanism by OW2 for a guaranteed jobs shortfall. ASOW’s jobs guarantee covers all 20
years of the OREC term while OW2’s time span is identical to that of its spending commitment, from award
date to three years after final COD. *BC/
152 If actual future delivered energy exceeds the forecast, ratepayers would receive extra deficiency compensation. If, on the other hand, actual future delivered energy is less than the forecast, ratepayers would not receive the full PV of the calculated deficiency value. In effect, some volume risk is passed through to ratepayers.

May 25, 2021
Public Version Page 73
EC* To facilitate comparison, the bracketed values in Table 33 are operations period FTE
values calculated from OW2’s post‐COD period.
Table 33. Expected and Guaranteed In‐State Jobs by Applicant and Project *BC//EC*
Atlantic Shores Offshore Wind Ocean Wind 2154
C A B
Jobs Scope and Commitment Period O&M jobs, verified every five
years during OREC 20‐year term
All jobs, from award date to
final COD + 3 years
Expected Jobs
Development and Construction
Conditions None NJWP timely completion and
reasonable NJWP lease costs
Employment (FTE‐years) Not available 2,137 ( ) 2,327 ( )
Operations
Conditions None None155
Duration (years)156 20 5 5
Annual Jobs (FTEs/year)157 88 [52] [52]
Jobs Guarantee
Type of Guarantee Firm Conditional
Deficiency Cure Rate 100% 90% 90%
Guaranteed Pre‐O&M Jobs (FTE‐years) 0 1,923 ( ) 2,094 ( )
Guaranteed O&M Jobs (FTE‐years) 1,760
Guaranteed Annual Average O&M Jobs
(FTEs/year) 88
Deficiency Consequence
Additional contribution to
workforce development fund for
any guaranteed shortfall, credited
at $50,000/FTE‐yr in the COD year
and escalated thereafter at 2.5%
per annum
None
Key conclusions in comparing the Applicants’ jobs guarantees:
153 *BC
EC*
154 OW2 values in parentheses are the values when the conditions are not met. 155 *BC/
/EC* 156 The ASOW guarantee period is for 20 years after final COD, while the OW2 five‐year period includes two years before final COD and the first three years after COD. 157 OW2 values in brackets assume one‐fourth of the stated 208 FTEs for a five‐year period, which includes ramping the operations workforce during the last two years prior to final COD as the equivalent annual post‐COD FTEs.

May 25, 2021
Public Version Page 74
1. ASOW does not make a jobs guarantee for the development and construction phases. However,the details of its expected in‐State activities and spending during those phases suggest that thenumber of in‐State jobs would be somewhat fewer than the jobs commitments by OW2, based onapproximate proportionality to their respective in‐State spending commitments in Table 32.158
2. *BC
/EC* Three reasons that account for much ofthe difference are (1) ASOW guarantees 100% of its expected jobs while OW2 guarantees 90%, (2)OW2 would have higher O&M labor productivity by expanding the same Atlantic City O&M baseas for OW1, so incremental labor needs are smaller than for ASOW’s initial project, and (3) OW2ramps up its O&M jobs over the three COD phases of OW2.
3. ASOW imposes a penalty on itself of $50,000/FTE‐year for any guaranteed jobs deficiency, whileOW2 imposes no penalty, under its assumption that its spending guarantee supersedes its jobsguarantee. Effectively, OW2 would not suffer any negative consequence for a shortfall below itsstated jobs guarantee level. OW2’s jobs guarantee is illusory in this regard.
4. OW2’s guaranteed jobs for its Project B will be identical to its Project A guarantee if the threeNJWP conditions are not met. *BC/
EC*
5. *BC
EC*
3.3.2 Atlantic Shores
ASOW stated that confidence in its economic development plan is the reason why it is offering a 100%
unconditional guarantee on its in‐State spending and jobs commitments.
To back the pre‐COD direct spending guarantee, ASOW proposes a two‐tier compensation mechanism for
any deficiencies in its verified actual performance:
1. The first compensation mechanism is to cover any shortfall with additional contributions to aworkforce development fund, such that the fund would be capped at *BC/
/EC* $40 million, or *BC/ /EC* for Projects *BC/ /EC* respectively. Theadditional contribution values shown in Table 32 are 90% of the workforce development fundcap values because ASOW commits to making initial “seed” contributions of 10% of the capvalues in its grants and funding commitments. Thus, the incremental contribution tocompensate for a deficiency would be limited to the remaining 90% of the maximum potentialcontribution to the workforce development fund.
158 The lack of a specific pre‐COD jobs commitment by ASOW may in part reflect that it is dependent on third‐party EPC contractors for some in‐State supply chain and logistics activities, while OW2 relies on Ørsted for self‐provision of EPC services and/or that Ørsted has been able to harden its supply chain procurements for OW1, which would likely be leveraged for OW2.

May 25, 2021
Public Version Page 75
2. Above the workforce development fund caps, ASOW would return to NJ ratepayers “dollar for dollar” a reduction in the OREC price. The true‐up OREC price discount per MWh would be calculated by dividing the remaining guarantee shortfall by the expected production of the wind farm project over the remainder of the OREC term.
Calculation of the verified direct spend would be done by an independent consultant selected by ASOW
and approved by the BPU. The independent consultant and Atlantic Shores will agree on the calculation
method and “will evaluate actual local content spend from 2019 to COD + 1 year pertaining to the selected
Project” (p. 162). *BC/
/EC*
ASOW also makes an operations period jobs guarantee that spans the entire 20‐year OREC term. Jobs
covered include technicians, non‐technicians, and indirect staff. An independent consultant selected by
ASOW and approved by the BPU will verify the direct jobs FTEs every five years. Any shortfall would be
made up by an additional contribution to the workforce development fund at an initial rate of
$50,000/FTE‐year of O&M jobs shortfall. *BC/
EC* ASOW agreed in CQ2 #13b to escalate the $50,000/FTE
penalty rate, starting at COD, at a nominal annual rate of 2.5% to account for increases in worker training
costs. *BC/
EC*

May 25, 2021
Public Version Page 76
3.3.3 Ocean Wind 2
OW2 proposes a single combined in‐State spend and jobs guarantee. The expected in‐State spend and
jobs commitments are stated in its Table 8.12 for Project A and Table 8.13 for Project B’s incremental
commitments related to in‐State nacelle assembly.
For each in‐State direct economic activity listed in the two tables, OW2 characterizes its type of
commitment as firm, variable, or conditional. The two activities labeled as “variable” commitments,
network upgrades and operations, need elaboration here:
For network upgrades, OW2 proposes to adjust up or down the stated expected in‐State spend in proportion to OW2’s total expected spend to final TSUC cost.159
*BC/
EC*
Timely completion of the NJWP is a necessary condition and obtaining a timely lease at the NJWP at
“commercially reasonable terms” by OW2 for WTG marshalling in both projects, and by GE for the nacelle
facility in Project B are contingent conditions. Each Project’s planned schedule will determine the limit of
“timely” and OW2 will have “sole discretion” of those conditions precedent on behalf of GE for its lease.
*BC/
EC* For the expected
project budget items of WTG marshalling, nacelle facility construction, and nacelle assembly services, if
the NJWP completion and lease conditions are not met, then the expected in‐State spend and jobs values
for these three items fall to zero. OW2 states that it will reconfirm the local economic content
commitments for these three items when the NJEDA concludes the tenant selection process, expected Q1
of 2022. Backup or contingency plans are discussed in Section 2, Project Description.
OW2 proposes to allow for budgeting uncertainties by guaranteeing 90% of the expected spend and jobs
commitments. To consolidate into a single combined guarantee, OW2 proposes to monetize any
guaranteed jobs exceedence at (real 2020) $82/hour, based on average compensation for five union
trades in Salem County, where the NJWP will be located and much of the NJ work performed.160 OW2
would select an independent expert to verify direct in‐State spend and jobs within six months after final
COD plus three years. OW2 does not propose any penalty for a shortfall in meeting its jobs guarantee.
Any expenditure shortfall compensation would be made as additional funding of an equal amount to the
Pro‐NJ Grantor Trust 2 for the purpose of supporting workforce development in disadvantaged
communities in NJ, in addition to other foci of the Trust.
The guarantee mechanism proposed by OW2 allows for cross‐subsidization between the in‐State spend
and jobs guarantees, as illustrated in the Application’s Table 8.16 matrix of guarantees and compensation,
159 OW2 does not include any in‐State jobs for network upgrades, so no jobs commitment adjustment is specified. 160 At the NJ standard of 1,820 hours per FTE‐year, the jobs value is equivalent to $149,240 per FTE‐year.

May 25, 2021
Public Version Page 77
replicated here in Table 34 due to its importance in understanding the strength and flexibility of the
guarantee mechanism for an outcome in which either the expenditure guarantee or the employment
guarantee is not met:
If the in‐State spend guarantee is met or exceeded, then no compensation is needed for any shortfall in guaranteed jobs (upper right quadrant).
If the in‐State spend guarantee is not met, then the compensation needed is reduced by the equivalent value of any exceedance in guaranteed jobs (lower left quadrant).
If neither the in‐State expenditure guarantee or the in‐State employment guarantee is met, then the compensation needed is equal to the shortfall in “actual” in‐State expenditure (lower right quadrant).
Thus, despite stating an employment guarantee, OW2 would not pay financial compensation for not
meeting the guaranteed number of in‐State FTE job‐years. Its employment guarantee only serves as a
threshold towards reducing the expenditure guarantee based on an excess in actual FTEs minus
guaranteed FTEs, times the product of $82/hour and 1,820 hours/FTE‐year. This asymmetric structure is
the reason why OW2 states that the focus of the mechanism is on in‐State spend, which takes precedence
over the jobs guarantee component of the combined guarantee.
Table 34. Ocean Wind 2 Matrix of Guarantees and Compensation
In‐State Direct Employment
Guarantee Met or Exceeded
In‐State Direct Employment
Guarantee Not Met
In‐State Expenditure
Guarantee Met or Exceeded No compensation needed
Applicant assumes that indirect
and induced jobs exceed the in‐
State direct employment
guarantee.
No compensation needed
In‐State Expenditure
Guarantee Not Met
If equivalent in‐State expenditure
≥ in‐State expenditure guarantee,
No compensation needed
Applicant assumes that indirect
and induced jobs exceed the in‐
State direct employment
guarantee.
Compensation needed =
guaranteed in‐State expenditure
– actual in‐State expenditure
If equivalent in‐State expenditure
< in‐State expenditure guarantee,
Compensation needed =
guaranteed in‐State expenditure
– equivalent in‐State expenditure
3.4 LAIEvaluationofExpectedIn‐StateEconomicDevelopmentEffects
This section compares economic development effects over the project lifecycle with results from the
IMPLAN model, applied with several data and model procedure adjustments from the Applicants’
proposals to achieve consistency in the evaluation. LAI used the IMPLAN 2019 New Jersey state database
because the more recent 2020 databases reflect temporary changes in economic patterns resulting from
the COVID‐19 mitigation measures affecting the economy.

May 25, 2021
Public Version Page 78
Results of the evaluation are summarized in sets of six tables for (1) modeled, (2) discount‐weighted, and
(3) present value of discount‐weighted effects, presented separately for total values and for project
capacity‐unitized values. Each table has the same format, showing the effects by lifecycle phase and
overall, and by direct, indirect, induced, and total economic spending and respending (or multiplier)
effects. The first set of six tables summarizes the in‐State GDP (“value‐added” in IMPLAN) effects (or
changes). The GDP effects metric encompass the employment effects because labor compensation is
included in the economic value‐added by production of goods and services. The numbers of jobs added
(in FTE‐years) is also a key economic benefits metric by focusing on the breadth and distribution of new
employment opportunities. The second set of six tables summarizes in‐State job creation effects.
Results of the IMPLAN analysis for lifecycle phase and total expected in‐State GDP effects are summarized
in Table 35. The ASOW Projects appear to result in more in‐State GDP growth than for the OW2 Projects.
For ASOW, the 30‐year operations phase produces the largest contribution to GDP, while for OW2, the
construction phase leads in GDP expansion. Some of this difference may be attributable to operations
economies of scale for OW2, by expanding the operations base and sharing resources with OW1.
The static model bias discount weights for indirect and induced economic flows and the discount weight
for the non‐guaranteed portion of direct expenditures by project phase are then applied to calculate the
discount‐weighted expected GDP effects presented in Table 36. In addition to the discount weights
specified in Table 25, the discount‐weighted GDP effects are weighted by the following guarantee share
assumption, based on each Applicant’s guarantee mechanism for its project direct expenditures. All or
100% of ASOW expected direct expenditures before final COD and 90% of OW2 expected direct
expenditures through three years after final COD are presumed to be guaranteed, although OW2 allows
for jobs creation beyond its guaranteed number to reduce its guaranteed expenditures. The reason for
extrapolating the end of their expenditure guarantees is that the independent verification of in‐State
expenditures must be completed before the end of the OREC term or operating life.
Finally, using the same present value date and real intertemporal discount rate parameters as elsewhere
in this report, the PV of the discount‐weighted lifetime expected GDP effects are shown in Table 37.

May 25, 2021
Public Version Page 79
Table 35. Modeled Lifetime Expected NJ GDP Effects (Million 2020 $)
*BC//EC*
Atlantic Shores Ocean Wind 2
C A B
Development Direct 50 20 20 Indirect 33 12 12 Induced 31 7 7 Total 114 39 39 EEW Factory Direct 43 38 38 Indirect 21 22 22 Induced 27 25 25 Total 91 85 85 WTG Facility Direct 12 6 Indirect 6 13 Induced 8 7 Total 27 25 Construction Direct 307 356 370 Indirect 145 207 220 Induced 147 169 178 Total 599 731 768 Operations Direct 581 210 210 Indirect 231 77 77 Induced 327 98 98 Total 1,139 386 386 Decommissioning Direct 46 13 13 Indirect 34 6 6 Induced 26 7 7 Total 106 26 26 Lifetime Direct 1,038 637 657 Indirect 471 324 349 Induced 566 306 322 Total 2,075 1,267 1,329

May 25, 2021
Public Version Page 80
Table 36. Discount‐weighted Lifetime Expected NJ GDP Effects (Million 2020 $)
*BC//EC*
Atlantic Shores Ocean Wind 2
C A B
Development
Direct 50 19 19
Indirect 17 6 6
Induced 12 3 3
Total 79 28 28
EEW Factory
Direct 43 37 37
Indirect 11 11 11
Induced 11 10 10
Total 64 58 58
WTG Facility
Direct 12 5
Indirect 3 6
Induced 3 3
Total 19 14
Construction
Direct 307 347 361
Indirect 72 101 107
Induced 59 66 69
Total 438 514 537
Operations
Direct 581 205 205
Indirect 115 38 38
Induced 131 38 38
Total 827 281 281
Decommissioning
Direct 35 10 10
Indirect 13 2 2
Induced 8 2 2
Total 55 14 14
Lifetime
Direct 1,027 618 638
Indirect 231 157 170
Induced 224 119 125
Total 1,482 894 933

May 25, 2021
Public Version Page 81
Table 37. PV of Discount‐weighted Lifetime Expected NJ GDP Effects (Million 2020 $)
*BC//EC*
Atlantic Shores Ocean Wind 2
C A B
Development
Direct 40 16 16
Indirect 13 5 5
Induced 10 2 2
Total 63 23 23
EEW Factory
Direct 34 28 28
Indirect 8 8 8
Induced 9 7 7
Total 50 43 43
WTG Facility
Direct 10 4
Indirect 2 5
Induced 2 2
Total 15 11
Construction
Direct 230 247 257
Indirect 54 72 76
Induced 44 47 50
Total 329 366 383
Operations
Direct 295 133 133
Indirect 60 25 25
Induced 66 25 25
Total 422 182 182
Decommissioning
Direct 6 1 1
Indirect 2 0 0
Induced 1 0 0
Total 9 2 2
Lifetime
Direct 614 425 439
Indirect 141 110 119
Induced 133 82 86
Total 888 616 644
Table 38 shows how the projects compare per unit of offshore wind capacity for the PV of discount‐
weighted expected NJ GDP effects. This table also aggregates all the non‐operations GDP effects. The
results are interesting because the larger projects are coupled with more supply chain investments in WTG
assembly *BC/ /EC* while having offsetting scale economies. The net change in GDP
effects per MW of capacity are mixed due to these offsetting influences.

May 25, 2021
Public Version Page 82
Table 38. PV of Discount‐weighted Lifetime Expected NJ GDP Effects per Unit Capacity (2020 $1,000 per MW)
*BC//EC*
Atlantic Shores Ocean Wind 2
C A B
Non‐Operations
Direct 211 255 267
Indirect 53 74 82
Induced 44 49 53
Total 309 378 402
Operations
Direct 196 116 116
Indirect 40 21 21
Induced 44 22 22
Total 279 159 159
Lifetime
Direct 407 370 382
Indirect 93 95 103
Induced 88 71 75
Total 588 537 561
Results of the IMPLAN analysis for lifecycle phase and total expected State employment effects are
summarized in Table 39. The ASOW projects appear to result in more in‐State employment than for the
OW2 projects. For ASOW, the 30‐year operations phase produces the most jobs, while for OW2, the
construction phase leads in jobs creation. Some of this difference may be attributable to operations labor
economies of scale for OW2, by expanding the operations base and sharing resources with OW1.
The discount weights for model bias in estimated indirect and induced economic flows and the discount
weight for the non‐guaranteed portion of direct expenditures by Project phase are then applied to
calculate the discount‐weighted expected employment effects presented in Table 40. The results in Table
40 are deemed to be more realistic estimates of expected jobs effects. In addition to the discount weights
specified in Table 25 above, the discount‐weighted job effects are weighted by the following guarantee
share assumptions, based on each Applicant’s guarantee mechanism for its Project direct expenditures.
ASOW fully guaranteed its expected operations jobs over the 20‐year OREC term, so 0% of its non‐
operation jobs and 100% of its operation jobs for 30 years are guaranteed FTE‐years for evaluation. OW2
guaranteed 90% of its expected in‐State jobs through three years beyond final COD. LAI assumed that 90%
of its expected operation period jobs over the following 27 years are equivalent to guaranteed jobs for
the purpose of discounted FTEs evaluation purposes because about the same number of in‐State
operations jobs would be sustained over the entire operational life. None of the decommissioning jobs
for the Applicants were guaranteed. The reason for extrapolating the COD plus three years end of OW2’s
jobs guarantee is that the independent verification of in‐State expenditures must be completed before
the end of the OREC term or operating life. While OW2 would not pay a penalty for creating too few jobs,
its jobs FTEs must be independently verified for the sake of adjusting downward its guaranteed
expenditures by the amount of any over‐performance in its guaranteed jobs threshold.
Finally, the PV of discount‐weighted lifetime expected employment effects are shown in Table 41.

May 25, 2021
Public Version Page 83
Table 39. Modeled Lifetime Expected NJ Employment Effects (Jobs FTE‐years)
*BC//EC*
Atlantic Shores Ocean Wind 2
C A B
Development
Direct 264 118 118
Indirect 362 129 129
Induced 326 77 77
Total 952 323 323
EEW Factory
Direct 606 526 526
Indirect 156 163 163
Induced 250 227 227
Total 1,011 916 916
WTG Facility
Direct 55 90
Indirect 52 107
Induced 83 73
Total 190 269
Construction
Direct 3,151 2,874 2,974
Indirect 1,371 2,054 2,159
Induced 1,543 1,768 1,868
Total 6,065 6,695 7,001
Operations
Direct 2,700 1,577 1,577
Indirect 2,416 780 780
Induced 3,427 1,030 1,030
Total 8,543 3,387 3,387
Decommissioning
Direct 446 104 104
Indirect 344 58 58
Induced 270 73 73
Total 1,060 236 236
Lifetime
Direct 7,222 5,199 5,389
Indirect 4,702 3,183 3,395
Induced 5,899 3,176 3,349
Total 17,822 11,558 12,133

May 25, 2021
Public Version Page 84
Table 40. Discount‐weighted Lifetime Expected NJ Employment Effects (Jobs FTE‐years)
*BC//EC*
Atlantic Shores Ocean Wind 2
C A B
Development
Direct 198 89 89
Indirect 136 48 48
Induced 98 23 23
Total 432 160 160
EEW Factory
Direct 454 395 395
Indirect 59 61 61
Induced 75 68 68
Total 588 524 524
WTG Facility
Direct 41 67
Indirect 20 40
Induced 25 22
Total 86 129
Construction
Direct 2,363 2,155 2,230
Indirect 514 770 810
Induced 463 530 560
Total 3,340 3,456 3,600
Operations
Direct 2,700 1,183 1,183
Indirect 1,208 292 292
Induced 1,371 309 309
Total 5,279 1,784 1,784
Decommissioning
Direct 334 78 78
Indirect 129 22 22
Induced 81 22 22
Total 544 122 122
Lifetime
Direct 6,091 3,899 4,042
Indirect 2,065 1,194 1,273
Induced 2,112 953 1,005
Total 10,269 6,046 6,320

May 25, 2021
Public Version Page 85
Table 41. PV of Discount‐weighted Lifetime Expected NJ Employment Effects (Jobs FTE‐years)
*BC//EC*
Atlantic Shores Ocean Wind 2
C A B
Development
Direct 160 71 71
Indirect 110 39 39
Induced 79 19 19
Total 348 129 129
EEW Factory
Direct 358 296 296
Indirect 46 46 46
Induced 59 51 51
Total 463 393 393
WTG Facility
Direct 33 51
Indirect 15 30
Induced 20 16
Total 68 97
Construction
Direct 1,773 1,536 1,589
Indirect 386 549 577
Induced 347 378 399
Total 2,507 2,462 2,565
Operations
Direct 1,414 772 772
Indirect 627 192 192
Induced 696 202 202
Total 2,737 1,166 1,166
Decommissioning
Direct 54 12 12
Indirect 21 3 3
Induced 13 3 3
Total 87 19 19
Lifetime
Direct 3,790 2,687 2,791
Indirect 1,205 828 887
Induced 1,214 653 691
Total 6,210 4,169 4,369
As for the GDP per unit capacity values, the capacity‐unitized PV of lifetime employment effects in Table
42 shows that roughly half of all PV of discounted FTE‐years are long‐term positions created at the start
of operations, and that scale economies of labor requirements are not fully offset by the addition of supply
chain investments for the larger ASOW projects.

May 25, 2021
Public Version Page 86
Table 42. PV of Discount‐weighted Lifetime Expected NJ Employment Effects (Jobs FTE‐years per MW)
*BC//EC*
Atlantic Shores Ocean Wind 2
C A B
Non‐Operations
Direct 1.6 1.7 1.8
Indirect 0.4 0.6 0.6
Induced 0.3 0.4 0.4
Total 2.3 2.6 2.8
Operations
Direct 0.9 0.7 0.7
Indirect 0.4 0.2 0.2
Induced 0.5 0.2 0.2
Total 1.8 1.0 1.0
Lifetime
Direct 2.5 2.3 2.4
Indirect 0.8 0.7 0.8
Induced 0.8 0.6 0.6
Total 4.1 3.6 3.8
3.5 Applicant‐ProvidedIMPLANInputsandResults
Both Applicants provided inputs that they used to conduct IMPLAN modeling of their Projects’ economic
development benefits. Although the Application Form’s Bill‐of‐Goods tables had requested IMPLAN inputs
for in‐State direct expenditures, in‐State direct jobs (FTE‐years) and in‐State direct labor compensation,
the Applicants only used in‐State direct expenditures in their respective IMPLAN analyses. This deficiency
means that IMPLAN’s default, average labor time and labor cost data for each IMPLAN sector that was
included in the production activity were used, which tends to over‐estimate the number of jobs associated
with expenditures. This in‐State expenditures and jobs information is summarized below in Table 43 and
Table 44, respectively. Blank cells indicate a value that is not applicable to a project and “NP” indicates a
value that was not provided by an Applicant.
3.5.1 Estimated In-State Direct Spending
In each of Atlantic Shores’ Projects, the Operation phase is the largest, containing roughly half of all
expected in‐State direct spending. Both Ocean Wind 2 projects have identical direct spending except for
the addition of spending for WTG facility construction in Project B. For Ocean Wind 2, construction is the
most expensive project phase, accounting for nearly half of all direct spending. *BC/
/EC* Many non‐disclosed differences
in the Applicants’ sourcing of materials and services account for disparities between their in‐State
expenditures. One reason for more operation spending by ASOW is that its project would be the first
phase of BOEM site development, while OW2 is able to realize economies of scale in its O&M costs. One
reason why OW2 estimates more in‐State construction spending is that it plans to procure relatively more
construction services from NJ sources.

May 25, 2021
Public Version Page 87
ASOW provided total direct expenditures for operations for two 15‐year periods while OW2 provided an
annual average budget. In Table 43, LAI expanded the OW2 annual O&M expenditures to include 30 years
of post‐COD operation, for consistency with the operation period budgeted by ASOW.
Table 43. Applicant‐Provided Expected In‐State Direct Spending (2020 $ millions)
*BC//EC*
Atlantic Shores161 Ocean Wind 2162
C A B
Development 49 49
EEW Factory
WTG Facility
Construction
Operation 1,192
Decommissioning 120
Lifetime 2,334
While total direct spending by project is commensurate with project size for both Applicants, each
distributed this spending differently across the project phases as shown below in Figure 22. *BC/
EC* Total spending, however, is
consistent and reasonable for all projects based on the different capacities proposed.
161 ASOW Application Form, Bills‐of‐Goods worksheet. 162 OW2 Application Form, Bills‐of‐Goods worksheet.

May 25, 2021
Public Version Page 88
Figure 22. Applicant‐Provided Expected Allocation Shares of In‐State Direct Spending *BC//EC*
3.5.2 Estimated Direct Jobs Created
The Applicants provided only sparse data on estimated direct jobs created as shown in Table 44. Atlantic
Shores provided direct jobs by position for the operating and maintenance phase. *BC/
/EC* MHI Vestas also
provided a letter of support which gives jobs values for the nacelle and *BC/blade finishing/EC* facilities
for the applicable Projects.164
Ocean Wind 2 has provided estimated in‐State direct job creation for the development, construction, and
part of the operation phase.165
163 ASOW Application, Table 14‐2. 164 ASOW Application, Appendix 2‐16. A range of 50‐70 direct jobs is given for the nacelle assembly facility. LAI assumed Project C would be at the low end of this range *BC/
/EC*
165 OW2 Application, Tables 8.12 and 8.13.

May 25, 2021
Public Version Page 89
Table 44. Applicant‐Provided Expected Direct Jobs (FTE‐years) *BC//EC*
Atlantic Shores Ocean Wind 2
C A B
Development NP 118 118
EEW Factory NP 500 500
WTG Facility 50 190
Construction NP 1,311 1,311
Operation166 2,700 208
(partial) 208
(partial)
Decommissioning NP NP NP
Lifetime NP NP NP
3.5.3 Applicant-Provided IMPLAN Results
Atlantic Shores presented results of its IMPLAN modeling in Section 16 of its Application. Section 8 of its
Application also presents results on employment effects and increased in‐State activity. *BC/
/EC* Direct employment effects make up nearly
half of Total employment effects. The SGD instructed Applicants to calculate discounted values using a 7%
nominal discount rate. In this table, value added is equivalent to the impact on GDP. *BC/
/EC* Table 47 summarizes Total (Direct, Indirect, and Induced) GDP impact by
Project phase. *BC
EC*
Table 45. Lifetime Direct, Indirect and Induced Employment Impacts for Atlantic Shores Projects167 (FTE‐years) *BC//EC*
Type of Effects Project C
Direct 18,550
Indirect 9,843
Induced 12,350
Total 40,744
166 Atlantic Shores operation jobs for 30 years and Ocean Wind 2 operation jobs for five years, including two years before final COD. 167 ASOW Application, Table 8‐3.

May 25, 2021
Public Version Page 90
Table 46. Atlantic Shores Lifetime Increased In‐State Activity by Project168 ($ million) *BC//EC*
Project C
Total spend (nominal) 2,334
Total spend (discounted) 1,057
Output (discounted) 3,796
Value‐added (discounted) 1,869
Labor income (discounted) 1,369
Table 47. Atlantic Shores Total (Direct, Indirect, Induced) GDP Effects by Project and Phase169 (2020 $ million discounted at 7% from year of activity)
*BC//EC*
Phase Project C
DEVEX
CAPEX
OPEX1
OPEX2
DECOM
Total
Ocean Wind 2 presented similar information in Sections 8 and 16 of its Application. The most relevant
information from these results is summarized below in Table 48. The discounted GDP effects for Project
A and Project B are $958 and $1,045 million 2020 dollars, respectively. The incremental economic effect
associated with EEW Phase 2, as modeled by IMPLAN, is 683 direct and 1,645 total FTE‐years created and
direct and total GDP effects of $57.7 and $159.4 million 2020 dollars, respectively.170 EEW management
estimates 500 direct FTE‐years. These effects are associated with the incremental construction
expenditure to realize the Phase 2 facility and do not include the economic effects of the continued
operation of the facility over time. Project B also includes the GE nacelle assembly facility. The cumulative
economic effects of the Project’s nacelle assembly scope, as modeled by IMPLAN, are 146 direct and 371
total FTE‐years created and direct and total GDP increases of $20.0 and $44.8 million 2020 dollars,
respectively.171 GE estimates 100‐150 FTEs.
168 ASOW Application, Table 8‐5. 169 ASOW Application, Tables 16‐6, 16‐7, 16‐8 and 16‐9. The total row values differ slightly from the sum of the five project phases, likely due to rounding. 170 OW2 Application, Table 8.2. 171 OW2 Application, Table 8.8.

May 25, 2021
Public Version Page 91
Table 48. Ocean Wind 2 Lifetime Economic Effects of In‐State Spending by Project172 *BC//EC*
Project A Project B
Employment (FTEs)
GDP Impact (2020 $ million)
Employment (FTEs)
GDP Impact (2020 $ million)
Direct 6,501 767 7,105 827
Indirect 3,244 349 3,457 375
Induced 4,279 425 4,597 456
Total 14,023 1,540 15,159 1,657
Total PV (discounted at 7%) 958 1,045
3.5.4 Comparison of Applicant-Provided IMPLAN Results
Comparisons of the estimated employment and GDP effects from each Applicant’s IMPLAN results are
provided in Table 49 and Table 50, respectively.
For each Project of both Applicants, the Direct employment effect is just under half of the Total
employment effect. The Indirect employment effect is less than the Induced employment effect. Even
after accounting for differences in Project size, the Atlantic Shores employment effect is not
commensurate with that of Ocean Wind 2. *BC/
/EC* In LAI’s
judgment, Atlantic Shores estimated jobs effects are unreasonably high.
Table 49. Applicant‐Provided IMPLAN Employment Effects (FTE‐years) *BC//EC*
Atlantic Shores Ocean Wind 2
C A B
Direct 18,550 6,501 7,105
Indirect 9,843 3,244 3,457
Induced 12,350 4,279 4,597
Total 40,744 14,023 15,159
Only the Total GDP effect was provided by both Applicants. The values are reasonably commensurate
after considering Project size. For Ocean Wind 2, the Direct GDP impact is almost half the Total GDP effect.
As with the employment impacts, the Indirect effect is less than the Induced effect.
172 OW2 Application, Tables 16.2 and 16.3.

May 25, 2021
Public Version Page 92
Table 50. Applicant‐Provided IMPLAN GDP Effects (2020 $ million)
*BC//EC*
Atlantic Shores Ocean Wind 2
C A B
Direct NP 767 827
Indirect NP 349 375
Induced NP 425 456
Total 1,869 1,540 1,657

May 25, 2021
Public Version Page 93
4 ENVIRONMENTALANDFISHERIESIMPACTS
Highlights
Project raw scores based on qualitative assessment, which are the basis for assigning points in this category, are shown in Figure 25. *BC
/EC*
Figure 23. Total Raw Environmental and Fisheries Impacts Scores *BC//EC*
ASOW’s EPP reasonably characterizes the environmental resources and habitats. The ASOW EPP includes sufficiently detailed descriptions of potential impacts based on site‐specific data and available published studies. Among many other things, DEP reports that some residents of Long Beach Island have voiced concerns about the visual impact of the project, suggesting that there may be some community opposition, *BC/
/EC*
OW2’s EPP reasonably characterizes the environmental resources and habitats and includes generic descriptions of potential impacts and mitigation options, but it is based primarily on desk‐top studies and field data obtained through preparation of the COP for OW1. The export cable to Smithburg, which would have a total length of about *BC/ /EC* is proposed to be HVDC, which would require fewer separate circuits and cable trenches than HVAC. The length of the offshore segments of the cables would be significantly longer than any other export cables considered in the New Jersey offshore wind program.

May 25, 2021
Public Version Page 94
ASOW’s FPP is comprehensive. It covers both recreational and commercial fishing interests. There is, however, a significant density of fishing activity in the lease area. *BC/
/EC*
OW2’s FPP is detailed and comprehensive, and demonstrates a good understanding of potential adverse impacts to commercial and recreational fishing over the lease area, which has a lower density of fishing activity.
The Social Cost of Carbon (“SCC”) was used based on the 2016 US Interagency Working Group value to monetize net emission impacts. Health effects associated with direct NOx, SO2, and PM2.5 emissions were also monetized. *BC
EC*
4.1 RegionalAirQualityImpacts
As part of the cost‐benefit analysis, the rules at N.J.A.C. 14:8‐6.5(a)(11)(xiv)(1) and (3) require Applicants
to document the environmental impacts of the Project, from pre‐construction through decommissioning.
Air impacts include “emissions of combustion by‐products,” and “direct emissions impacts of the Project,
including carbon dioxide, sulfur dioxide, [and] particulate emissions.” N.J.A.C. 14:8‐6.5(a)(8) also requires
Applicants to provide “[t]he anticipated carbon dioxide emissions impact of the Project.” In accordance
with N.J.A.C 14:8‐6.5(a)(11)(xiv), Applicants were required to provide analyses of the anticipated
environmental benefits and impacts associated with each Project. Applicants also provided annual values
of direct emissions of CO2, NOx, SO2, and PM2.5 during the development, construction, operation, and
decommissioning of the Project. Avoided emissions displaced from fossil‐fired generation by offshore
wind were also submitted, along with the monetization of net emissions impacts.
For purposes of the evaluation, emissions were quantified in two categories: (1) emissions directly related
to operation of equipment (marine vessels, on‐road trucks, non‐road equipment such as excavators,
stationary generators, worker transportation, and other machinery) during construction, operation, and
decommissioning of the Project; and (2) the emissions avoided through the displacement of fossil‐fueled
generation ascribable to the operation of the Project. Emissions from vessels, vehicles and machinery
represent a very small offset to the avoided stack emissions from fossil generation and may not be fully
incremental, that is, vessels, vehicles, and other equipment used for construction could be used otherwise
on other construction Projects in the region.
4.1.1 Direct Emissions
The Applicants were required to provide supporting information for the estimates of category 1 emissions
from vessels, vehicles and machinery that describes how they were calculated. The quality and
completeness of the emissions estimate is included as a metric in the qualitative assessment of
environmental impacts as discussed in Section 4.1.4. Unadjusted, annual category 1 emissions as provided
by each Applicant were used in the cost‐benefit analysis. Values in short tons (“ST”) per year are
summarized in Table 51 and further discussed in Section 4.1.4. *BC

May 25, 2021
Public Version Page 95
/EC*173
Table 51. Average Annual Direct Emissions by Proposed Project by Phase (ST/yr)
*BC//EC*
Atlantic Shores Ocean Wind 2
C A B
Development
CO2
NOx
SO2
PM2.5
Construction
CO2
NOx
SO2
PM2.5
Operation CO2
NOx
SO2
PM2.5
Decommissioning
CO2
NOx
SO2
PM2.5
4.1.2 Avoided Emissions
Each Applicant was also required to provide a forecast of the annual emissions from fossil generation that
would be avoided by operation of the Project. Each Applicant used a different method and assumptions
to estimate avoided emissions, and therefore the results are not reasonably comparable. Therefore, to
compare the category 2 avoided emissions across Projects on a consistent basis, LAI independently
estimated the avoided emissions ascribable to each Project using a “but for” test. Applying the Aurora
model as described in Appendix A, LAI modeled the regional electric system as an Offshore Wind case and
a No New Offshore Wind Case:
173 *BC
EC*

May 25, 2021
Public Version Page 96
The Offshore Wind case included the full New Jersey planned buildout of 7,500 MW of offshorewind capacity by 2035.
The No New Offshore Wind case included only the 1,100 MW Ocean Wind 1 Project that wasselected in the first solicitation. It does not include any offsetting development of RPS‐eligibleresources such as land‐based wind or solar.
LAI calculated the annual differences in CO2 between the Offshore Wind case and the No New Offshore
Wind case across the model footprint, which covered PJM, NYISO, and ISO‐NE. Monthly differences in
emissions of NOx, SO2, and PM2.5 were calculated over the MAAC portion of PJM in order to account for
in‐State and upwind sources that contribute to air quality and health outcomes in New Jersey.174 The
avoided emissions were assigned pro rata to each proposed Project by multiplying the expected MWh by
a unitized annual emission factor for each pollutant, expressed as avoided tons per MWh of offshore wind.
Emission factors were computed annually for CO2 and monthly for NOx, SO2 and PM2.5. The same emissions
factors were applied to all Projects. The modeled annual average avoided emissions ascribable to each
proposed Project, assuming a project life of 30 years, are summarized in Table 52.
Table 52. Average Annual Avoided Emissions by Proposed Project *BC//EC*
Atlantic Shores Ocean Wind 2 C A B
Average Annual
Delivered Energy (MWh)
Avoided Emissions (ST)
Study Area CO2 2,968,006 2,560,522 2,560,522
MAAC NOx 732.9 629.3 629.3
MAAC SO2 203.3 180.4 180.4
MAAC PM2.5 84.5 72.4 72.4
Avoidance Rate per MWh
Study Area CO2 (ST)
MAAC NOx (lb)
MAAC SO2 (lb)
MAAC PM2.5 (lb)
4.1.3 Monetization of Net Emissions Impacts
As an input to the cost‐benefit analysis in Section 6, LAI derived annual monetized values of net emission
impacts.
Avoided CO2 emissions were monetized by applying the social cost of carbon (“SCC”) from the US
Government’s Interagency Working Group, which monetizes damages associated with an incremental
increase in carbon emissions in a given year.175 The average case estimated using a 3% discount rate was
used and converted to dollars per short ton.
174 Monthly values allow separate calculation of avoided emissions for ozone season versus non‐ozone season. 175 “Technical Support Document: Technical Update of the Social Cost of Carbon for Regulatory Impact Analysis Under Executive Order 12866,” Interagency Working Group on Social Cost of Greenhouse Gases, United States

May 25, 2021
Public Version Page 97
Health effects associated with direct PM2.5 emissions and for NOx and SO2 as precursors to PM2.5 were
monetized using EPA’s Technical Support Document (“TSD”) Estimating the Benefit per Ton of Reducing
PM2.5 Precursors from 17 Sectors for NOx, SO2, and direct PM2.5.176 The TSD presented dollar values in terms
of mortality and morbidity per short ton of avoided NOx, SO2, and direct PM2.5 for different industrial
sectors, for the years 2016, 2020, 2025, and 2030.177 LAI used the $/short ton values cited in the TSD and
extrapolated them beyond 2030 for this analysis.
For CO2, NOx, and SO2 the generation‐weighted average market emission allowance costs used in the
Aurora simulations were netted against the $/short ton social cost associated with avoided emissions
from fossil generation to calculate the net externality values per ton.178 The per ton externality value was
multiplied by the annual change in emissions derived from the Aurora model to derive the annual net
benefit ascribable to the avoided emissions. Finally, for each Project, the annual monetized cost for
category 1 emissions using the TSD values and the Applicants’ annual values was subtracted from the
annual net benefit ascribable to avoided emissions. The present value of the net benefit for each Project
is illustrated in Figure 24. Results on a per MWh unitized basis are illustrated in Figure 25.
Government, August 2016. https://19january2017snapshot.epa.gov/climatechange/social‐cost‐carbon‐technical‐documentation. This document was recently updated and issued in February 2021 as “Technical Support Document: Social Cost of Carbon, Methane, and Nitrous Oxide Interim Estimates under Executive Order 13990” (https://www.whitehouse.gov/wp‐content/uploads/2021/02/TechnicalSupportDocument_SocialCostofCarbonMethaneNitrousOxide.pdf). The SCC values were escalated to 2020$ but otherwise unchanged from the 2016 issuance. 176 U.S. EPA, “Technical Support Document Estimating the Benefit per Ton of Reducing PM2.5 Precursors from 17 Sectors,” February 2018. https://www.epa.gov/sites/production/files/2018‐02/documents/sourceapportionmentbpttsd_2018.pdf. This metastudy provides values from two different data sources. For consistency with Round 1, values from Krewski et al were applied. 177 For category 1 emissions from vessels, vehicles and machinery during construction, operation, and decommissioning, LAI used the TSD values for “aircraft, locomotives and marine vessels” as a proxy for all direct emissions sources. For category 2 avoided emissions, LAI used the TSD values for “electricity generating units.” 178 Since there is no emission allowance program for PM2.5, the value for PM2.5 emissions did not need to be adjusted to compute the externality cost.

May 25, 2021
Public Version Page 98
Figure 24. Present Value of Net Emissions Benefit *BC//EC*

May 25, 2021
Public Version Page 99
Figure 25. Levelized Net Emissions Benefit *BC//EC*
Because the same emissions factors were applied to all Projects, on a MWh‐unitized basis the avoided
emissions for all Projects are very similar. The direct (category 1) emissions are a small offset to the
emissions benefit, but the impact of OW2’s relatively higher values of direct emissions during
development, construction and decommissioning is apparent in Figure 25. Net avoided emissions is
therefore not used as a differentiator in the comparison between Applications or ranking of Projects. The
absolute magnitude of avoided emissions among Projects is directly related to the expected annual output
– larger Projects displace more fossil generation over the evaluation period. The present value of the net
avoided emissions is an input to the benefit‐cost ratio of individual Projects in Section 5.8 and for the
portfolio analysis in Section 8.
4.1.4 Emissions Accounting
Applicants were required to include data related to direct emissions (category 1) produced from vehicles,
vessels, and machinery during construction, operation, and decommissioning of the Project as part of the
Application Form. Projects were assigned a rating from Table 53 based on:
Completeness of the data provided, the level of detail, and the extent of documentation supporting the assumptions used to develop the estimated emissions;

May 25, 2021
Public Version Page 100
Applications that specify use of low‐emissions equipment or propose any other measures to reduce emissions during construction, operation, or decommissioning, if any, will be rated more favorably than Applications that do not make such representations.
Color‐coding can be raised one level (e.g., Yellow to Green) for Projects that propose a feasible method
for mitigating emissions during construction, operation, or decommissioning.
As illustrated in Table 51, direct emissions from vessels, vehicles and equipment during project operations
are reasonably consistent between projects of similar installed capacities proposed by both ASOW and
OS2. Direct emissions during other project phases are not consistent between the two bidders. Emissions
estimated by ASOW during development, construction, and decommissioning are significantly lower than
the estimates provided by OW2.
Table 53. Emissions Accounting Evaluation Criteria
Green
Application provides detailed and complete information on the assumptions and methods
used to compute the category 1 emissions and bases the evaluation on Project‐specific
conditions.
Yellow Application lacks sufficient information on the assumptions and methods used to compute
category 1 emissions, and/or uses generic rather than site‐specific information.
Orange Application provides no backup information or documentation.
Red Application provides information that is patently inconsistent with proposed Project plan.
Table 54 summarizes the ratings assigned to each Project in this category.
Table 54. Emissions Accounting Ratings *BC//EC*
Atlantic Shores Ocean Wind 2
C A B
Emissions
Accounting
Green: Emissions accounting is
detailed and includes supporting data
and assumptions
Green: Emissions accounting is detailed
and includes supporting data and
assumptions
4.1.4.1 AtlanticShores
In its application, Atlantic Shores provided a detailed, well‐documented analysis of annual emissions
during construction, operations, and decommissioning for each Project. Emissions were calculated from
fuel usage, based on frequency, duration, loading, and/or travel distance for different types of vessels and
engines during each type of activity. Estimated annual emissions of relevant priority pollutants (NOx, SO2,
and PM2.5) and greenhouse gases (CO2 equivalent) were differentiated based on activity (development,
construction, operation, decommissioning). The analysis included both offshore and onshore sources and
activities.
Atlantic Shores is scored Green for its accounting of category 1 emissions because the analysis is detailed
and includes supporting data and assumptions.
Atlantic Shores also provided an estimate of the emissions from the fleet of fossil‐fired generation within
New Jersey that would be avoided by the operation of the Atlantic Shores project, based on historical
plant operating data from the EPA Air Markets Program database. Because LAI considered a larger

May 25, 2021
Public Version Page 101
footprint in its analysis the avoided emissions reported by ASOW for New Jersey alone are consistently
lower. As noted previously, for consistency LAI’s analysis of avoided emissions was used in the cost‐benefit
analysis rather than the Applicant’s.
4.1.4.2 OceanWind2
Ocean Wind 2 provided a tabulation of annual category 1 emissions of NOx, SO2, PM2.5 and CO2 during
development, construction, operations, and decommissioning of the Project. The Application states that
these direct emissions are largely from ocean‐faring vessels used to construct and maintain the Project
over its lifetime.179 Emissions were not broken out by source, and no backup documentation supporting
the analysis was provided in the Application or in response to the first round of CQs. OW2 subsequently
provided the documentation as part of its post‐interview supplemental information. The documentation
revealed that the direct emissions for OW2 were estimated by scaling the detailed emissions tabulations
prepared for the OW1 analysis based on project size and duration of construction.
OW2 is scored Green for its accounting of category 1 emissions because the analysis is detailed and
includes supporting data and assumptions.
OW2 also provided an estimate of the emissions from fossil‐fired generation in New Jersey that would be
avoided by the operation of the OW2 Project. The quantity of avoided emissions expressed in tons was
estimated using marginal emission rates from EPA’s eGRID database. *BC/
EC* OW2’s avoided CO2 estimate is lower than LAI’s values. OW2’s avoided
NOx, SO2 and PM2.5 emissions estimates are higher than LAI’s values. The Applicant’s forecast of avoided
emissions was not used in the cost‐benefit analysis.
4.2 EnvironmentalandFisheriesProtectionandPermittingPlans
NJDEP and LAI reviewed the EPPs, FPPs, and permitting plans submitted by each Applicant. Overall ratings
were determined for each Project based on NJDEP’s and LAI’s review and scoring.
4.2.1 Feasibility and Strength of Environmental Protection Plan
The EPPs submitted by Applicants were evaluated to assess the level of detail contained in each
Applicant’s identification of potential environmental impacts and the extent and feasibility of proposed
mitigation associated with Project construction and operation, including the installation of the turbine
foundations, installation of array and export cables, and construction of the onshore cable and substation.
Identification and description of anticipated stressors, receptors, effects, and mitigation during
construction, operations, and decommissioning of the proposed Project were evaluated. Offshore
resources and receptors include avian and bat species, marine mammals, sea turtles, benthic populations,
fish, submerged aquatic vegetation, threatened and endangered species, sea‐bed disruption, and water
quality. Onshore resources and receptors may include terrestrial mammals, amphibians, reptiles, birds,
bats, threatened and endangered species, preserved land, and wetlands. Depending on the onshore cable
route, not all of these receptors may be present. Cultural resources include visual impacts and aesthetics,
tourism, sand borrow areas, archaeological sites (wrecks), solid waste management, and shipping
179 OW2 Application p. 9‐22. 180 OW2 Attachment 16.1 p. 21.

May 25, 2021
Public Version Page 102
channels. The rating levels in this category are defined as shown in Table 55. Subject matter experts from
New Jersey DEP contributed to the review of the EPPs submitted by the Applicants.
Table 55. Feasibility and Strength of Environmental Protection Plan Evaluation Criteria
Green
Characterization of biological resources and receptors includes detailed descriptions of
species, geographic range, general habitat, temporal changes, listed species, mortality, and
relies on up‐to‐date source data. Applicant incorporates NJDEP Ecological Baseline and other
applicable studies. Discussion of effects includes specific direct physical impacts, indirect
physical impacts, behavioral impacts, and cumulative impacts to biological receptors, water
quality, and sediments. Applicant identifies field studies completed, underway, or planned.
EPP outlines feasible modification of Project design and/or innovative measures to avoid,
minimize, or mitigate environmental impacts.
Yellow
Characterization of biological receptors, impacts, proposed mitigation, and/or plans for
additional field studies lacks some detail, is not site‐specific, and/or relies primarily on desk‐
top studies. EPP describes feasible measures to avoid, minimize, or mitigate environmental
impacts.
Orange
Characterization of biological receptors, impacts, proposed mitigation, and/or plans for
additional field studies lacks considerable detail and/or is based entirely on desk‐top studies.
EPP lacks detail on measures to avoid, minimize, or mitigate environmental impacts.
Red EPP fails to characterize biological receptors, is not based on studies, does not address
mitigation measures, or proposes mitigation measures that do not appear to be feasible.
Table 56 summarizes the ratings assigned to each Project in this category.
Table 56. Feasibility and Strength of Environmental Protection Plan Ratings *BC//EC*
Atlantic Shores Ocean Wind 2
C A B
Feasibility and
Strength of EPP
Green: The EPP reasonably characterizes the
environmental resources and habitats and includes
sufficiently detailed descriptions of potential
impacts, based on site‐specific data and available
published studies.
Yellow: The EPP relies
primarily on data collected
for OW1 and does not
address site‐specific issues.
4.2.1.1 AtlanticShores
Since Atlantic Shores submitted its Application in New Jersey’s first offshore wind solicitation, it reports
that it has commissioned extensive field studies to further develop and support its Application in this
second solicitation. Atlantic Shores reports that it has spent approximately $30 million in technical studies
to build upon the New Jersey Ecological Baseline Studies, including avian and bat surveys, Essential Fish
Habitat surveys, benthic grab sampling, and marine mammal and sea turtle studies.181 These studies will
inform the COP submitted to BOEM and support permitting.
Atlantic Shores has been meeting with DEP on a regular basis as it has advanced development of its
project. The export cable routes and on‐shore rights of way have been refined based on input from the
181 ASOW Application pp. 196‐197.

May 25, 2021
Public Version Page 103
DEP. As shown in the maps provided in Appendix C, D and E of the first set of CQ responses, the export
cable routes have been laid out to avoid mapped artificial reefs, marine protected areas, and seagrass
beds.
The proposed landfall for the export cables to the Cardiff POI is Atlantic City. *BC/
/EC* At both landfall
locations, horizontal directional drilling (“HDD”) will be used to avoid disturbing the shoreline habitat.
The onshore cable routes to both Cardiff *BC/ /EC* are almost entirely within public roads
and utility rights of way, *BC/
EC*
The distance from the closest turbine to shore is *BC/ /EC* For Projects *BC/
/EC* C, the distances are *BC/ /EC* 10.5 miles, respectively.182 LAI understands that the
only legal framework that may apply to regulating distance from shore is through potential visual impact
to historic districts, determined by consultation with the State Historic Preservation Office and required
under Section 106 of the National Historic Preservation Act during the BOEM COP review. ASOW is
conducting a Historic Resources Visual Effects Assessment and “expects that Project related effects on
[historic structures]...can and will be successfully avoided or mitigated.”183 Results of this Assessment are
not yet available. However, DEP reports that some residents of Long Beach Island have voiced concerns
about the visual impact of the proposed Atlantic Shores Project, suggesting that there may be some
community opposition, *BC/
/EC*
182 Response to CQ1 #1. 183 ASOW Application p. 232.

May 25, 2021
Public Version Page 104
Atlantic Shores proposes to use monopile foundations, *BC/
/EC* Installation of monopile foundations requires lifting or floating the structures into
position and then driving the piles into the seabed. ASOW states that equipment operating procedures
such as “soft starts” to gradually increase sound levels will be implemented (Application p. 267). Atlantic
Shores proposes to test the use of “blue piling” and other sound attenuation technologies to minimize
acoustic impacts to marine mammals, sea turtles, and fisheries (Application p. 214). Blue piling utilizes
hydraulic pressure rather than pile driving to sink the monopile foundations. This is not yet a proven
technology. Atlantic Shores may also deploy a bubble curtain to insulate the work area and mitigate
acoustic impacts.185
The EPP reasonably characterizes the environmental resources and habitats and includes sufficiently
detailed descriptions of potential impacts, based on site‐specific data and available published studies.
Based on the completeness and responsiveness of the EPP, Atlantic Shores is assigned a Green.
4.2.1.2 OceanWind2
Ocean Wind 2’s EPP is based largely on information obtained as part of the development of the Ocean
Wind 1 project and preparation of the Ocean Wind 1 COP.186 Because Ocean Wind 2 is at the early stage
of development, it has not yet undertaken any field data collection or investigation specific to the Ocean
Wind 2 project, and quantification of Project impacts has not been completed. Identification of potential
impacts during different phases of the project, identification of habitats and biological receptors, and
proposed mitigation methods are not based on site‐ or project‐specific information. OW2 commits to
using best management practices and states that, “[a]ppropriate mitigation measures will be developed
after the proper investigatory process and upon appropriate engagement with the relevant stakeholder
groups and the communities of New Jersey”.187
The proposed turbine grid array for Ocean Wind 2 is an extension of the Ocean Wind 1 grid layout *BC/
EC* OW2 proposes to use monopile foundations, and will use a noise dampening technology
*BC/ /EC* to mitigate acoustic impacts. OW2 is also in the process of developing
a low‐noise alternative to pile‐driving. *BC/
EC*
Indicative export cable routes for HVDC cables to two potential interconnection points on the 500 kV
transmission system, Deans and Smithburg, are shown in Figure 9 on page 21. The cable to Smithburg,
which is now designated as the primary POI as discussed in Section 2.1.1.2, would come ashore at Asbury
184 *BC/
/EC* 185 ASOW Application p. 267. 186 OW2 Application p. 9‐9. 187 OW2 Application p. 9‐9. 188 OW2 Application p. 2‐23. 189 OW2 Application p. 2‐32. 190 OW2 Interview Transcript, pp. 85‐86.

May 25, 2021
Public Version Page 105
Park, and have a total length of about *BC/ /EC* miles. The export cable is proposed to be HVDC, which
would require fewer separate circuits and cable trenches than HVAC. The length of the offshore segments
of the cables would be significantly longer than any other export cables considered in the NJ offshore wind
program. State permit agencies will need to consider tradeoffs between longer cable routes with more
offshore disturbance versus the advantages of interconnecting on the 500 kV AC transmission backbone
at a POI that is comparatively robust.
The export cable route, landfall, and POI for OW2 have not been finalized. *BC/
/EC* OW2 proposes to use trenchless technology, i.e., HDD, to
avoid impacts to sensitive habitats such as the coastal habitat and wetlands, and will restore or replace
disturbed wetlands. No project‐ or site‐specific plans have yet been developed.
The EPP reasonably characterizes the environmental resources and habitats and includes generic descriptions of potential impacts and mitigation options, but it is based primarily on desk‐top studies and field data obtained through preparation of the COP for OW1. Locations of Project features are indicative only, so site‐specific impacts and mitigation strategies are not identified. OW2 is assigned a Yellow for this criterion.
4.2.2 Feasibility and Strength of Fisheries Protection Plan
Applicants were required to provide an FPP that demonstrates a complete understanding of the potential
impact of the Project on commercial and recreational fishing and provides a feasible plan to mitigate such
impacts. The rating levels in this category are defined as shown in Table 57.
191 Attachment to response to CQ2 #20. 192 OW2 Application Attachment 9.1, Figures 2.2‐11 and 2.2‐12

May 25, 2021
Public Version Page 106
Table 57. Feasibility and Strength of Fisheries Protection Plan Evaluation Criteria
Green
The FPP is detailed and comprehensive, demonstrates a superior understanding of potential
adverse impacts to commercial and recreational fishing specific to the proposed location of
the proposed Project based on recent and appropriate data, and provides a comprehensive,
thoughtful and feasible mitigation plan based on robust stakeholder engagement. FPP
describes an approach to continued commercial and recreational stakeholder engagement
and incorporation of that feedback into the final mitigation plans.
Yellow
The FPP demonstrates a reasonable understanding of potential adverse impacts to
commercial and recreational fishing and provides a feasible mitigation plan. FPP describes
approach to continued commercial or recreational stakeholder engagement, but not both,
and incorporation of that feedback into the final mitigation plans.
Orange
The FPP demonstrates a fair understanding of potential adverse impacts to commercial and
recreational fishing, provides mitigations that would only be minimally effective or may be
impractical to implement. FPP describes an approach to continued stakeholder engagement,
but is not specific about which stakeholders will be involved, and/or does not explain how
stakeholder feedback will be incorporated into the final mitigation plan.
Red
The FPP demonstrates an incomplete understanding of potential adverse impacts to
commercial and recreational fishing. The mitigation plan is incomplete or of questionable
value. The plan does not allow for ongoing stakeholder engagement and/or does not allow for
stakeholder feedback to be incorporated into the final mitigation plan.
Table 58 summarizes the ratings assigned to each Project in this category.
Table 58. Feasibility and Strength of Fisheries Protection Plan Ratings *BC//EC*
Atlantic Shores Ocean Wind 2
C A B
Feasibility and
Strength of FPP
Yellow: FPP is detailed,
comprehensive, and covers
both recreational and
commercial fishing
interests, however there is
significant density of fishing
activity in the lease area.
Orange: Score is
differentiated
based on
Green: The FPP is detailed and
comprehensive, and
demonstrates a good
understanding of potential
adverse impacts to commercial
and recreational fishing over
the lease area, which has a
lower density of fishing activity.
4.2.2.1 AtlanticShores
The FPP provides a good summary of the finfish and invertebrate resources within the lease area, based
on project‐specific habitat surveys that build upon the DEP Ecological Baseline Studies and other publicly
available fisheries data. The extent and duration of potential impacts to sensitive marine habitats and
fisheries resources during construction and operation are reasonably characterized. As discussed for the
EPP, the FPP also addresses project‐specific design modifications and mitigation to minimize disturbance
of the seabed, benthic habitats, shellfish, and finfish. ASOW’s FPP includes a strong stakeholder
engagement program, including both an active commercial and recreational fishing liaison.

May 25, 2021
Public Version Page 107
Atlantic Shores reports that most of the marine traffic within the lease area is commercial fishing vessels.
Based on ASOW’s study of vessel transits, large passenger vessels, cargo vessels, tankers, tugs, and barges
tend to travel around the outskirts of the lease area.193
Surf clam and ocean quahog dredging is the primary fishing activity in the lease area.194 Although surf clam
dredging occurs throughout the lease area, the northern portion has been more productive in recent
years.195 The turbine layouts for Projects *BC/ /EC* C *BC/ /EC* are located in the
southern portion of the lease area, *BC/
/EC* The proposed turbine grid is oriented along a E/NE (80 degree) axis,
based on consultation with the surf clam industry and the USCG, to accommodate the primary direction
of vessel traffic.196 Grid spacing is proposed to be 1 x 0.6 NM. Atlantic Shores states they are committed
to ensuring a safe and navigable project area that is compatible with continued fishing activities and
navigation.197 However, fishing industry representatives have communicated to DEP that one nautical mile
grid spacing is not adequate for safe fishing operations and navigation. *BC/
EC*
Atlantic Shores has committed to a cable burial depth of 6 feet below the mudline to minimize the risk of
cable snags.199 The FPP provides for compensation for any loss or damage to fishing gear or vessels
ascribable to entanglement on project structures or cables.200 Atlantic Shores does not propose an
industry compensation program that would compensate operators for lost catch.201
Atlantic Shores is scored Yellow for Projects *BC/ /EC* C, and Orange *BC/
/EC* Although ASOW’s FPP is detailed, comprehensive, and
covers both recreational and commercial fishing interests, the score reflects the higher degree of potential
adverse impact arising from the significant density of fishing activity in the ASOW lease area and ASOW
not fully addressing the concerns expressed by fishermen.
4.2.2.2 OceanWind2
As noted for the EPP, OW2’s FPP is primarily based on data collection and fisheries outreach undertaken
for Ocean Wind 1. OW2 has not yet developed a Project‐specific Fisheries Outreach Plan. However, the
OW1 research and industry engagement appears to broadly cover the entire lease area and areas outside
of the lease area as well. The FPP includes extensive and detailed information on the New Jersey
193 ASOW Application p. 38. 194 ASOW Application p. 267. 195 ASOW Application p. 268. 196 ASOW Application p. 39. 197 ASOW Application p. 276. 198 ASOW Interview Transcript, pp. 95‐97. 199 ASOW Application p. 274. 200 ASOW Application p. 258. 201 A fisheries compensation program is not currently a requirement for offshore wind projects. The DEP has been working with stakeholders to develop a program, which may be rolled out next year.

May 25, 2021
Public Version Page 108
commercial and recreational fishing industry, commercially important finfish and shellfish species,
quantity and value of catches of different commercial species, and various state and federally protected
marine areas.
The turbine grid orientation and spacing is proposed to be a continuation of the 1x0.8nm grid layout that
is being proposed for the Ocean Wind 1 project. OW2 acknowledges that the turbine layout is essential
for safe navigation and fishing (see p. 2‐23), but the FPP is silent on the basis for selection of the grid
spacing. Figures 10.4 through 10.10 illustrate the fishing density of the commercially important species of
finfish and shellfish. The data indicate that quahog and surf clam dredging activity has historically (2012 ‐
2016) been significantly less dense within the OW2 lease area relative to the Atlantic Shores lease area
and other surrounding areas. During the interview, OW2 reported that based on outreach to stakeholders,
OW2 understands that the main issue for the fishing community is transit through the lease area to fishing
grounds further offshore and to New Bedford, MA, to unload their catch, and that there is relatively little
fishing within the lease area.202 The export cable routes traverse regions of higher shellfishing activity.
Since the marine environment is dynamic, shellfish habitats and areas of fishing density may migrate over
time, however. OW2 reports in its response to CQ2 #17, that it will undertake a Navigational Safety Risk
Assessment as part of the COP development.
The target cable burial depth for export and array cables is provided as a range: 1.5 to 2 meters. OW2
intends to perform a cable burial risk assessment to determine burial depths, but it will not be initiated
until 2Q2021. The long distance traversed by the export cables will necessitate crossing multiple existing
telecom cables, which may increase the risk of interference with shellfishing activities. This is not
addressed in the FPP, but will need to be addressed in a future COP.
The FPP is detailed and comprehensive, and demonstrates a good understanding of potential adverse
impacts to commercial and recreational fishing over the lease area. Ocean Wind 2 scores a Green for this
factor, reflecting the lower potential for adverse impact due to the lower density of fishing activity in the
lease area and the completeness of the FPP.
4.2.3 Completeness of Permitting Plan and Reasonableness of Timelines and Milestones
Applicants were required to provide a complete list of all required Federal, State, and local permits and
authorizations, identifying the activity requiring the permit and the jurisdictional agency. Permitting Plans
were evaluated to assess the Applicant’s understanding of all Federal, State, and local permits and
authorizations that would be required to develop and operate the Project. Applicants were required to
provide a permitting timeline that indicates the milestones for submitting each permit and the anticipated
timeframe for agency approval, and that is consistent with the overall development schedule. Copies of all submitted permit applications and any issued approvals and permits, submitted per N.J.A.C. 14:8‐
6.5(a)(10) were reviewed in support of evaluating these metrics where necessary. The rating levels in this
category are defined as shown in Table 59.
202 OW2 Interview Transcript, p. 81.

May 25, 2021
Public Version Page 109
Table 59. Completeness of Permitting Plan and Reasonableness of Timelines and Milestones Evaluation Criteria
Green
Permit plan and timeline demonstrate a thorough understanding of the required Federal,
State, and local permits and authorizations, and identify the jurisdictional agency and activity
requiring the permit or authorization. The timeline for obtaining permits is consistent with the
overall development milestones and allows for reasonable delays and contingencies.
Yellow
Applicant’s plan for obtaining the required Federal, State, and local permits and
authorizations identifies the jurisdictional agency and activity requiring the permit or
authorization. Applicant’s milestone schedule does not allow for potential delays or
contingencies.
Orange Applicant’s permit plan is incomplete or not sufficiently detailed and/or timeline is overly
optimistic and may jeopardize the expected commercial operation date.
Red
Applicant’s permit plan is generic and indicates a lack of understanding of Federal, State,
and/or local requirements and/or timeline is inconsistent with the overall development
schedule.
Table 60 summarizes the ratings assigned to each Project in this category.
Table 60. Completeness of Permitting Plan and Reasonableness of Timelines and Milestones Ratings *BC//EC*
Atlantic Shores Ocean Wind 2
C A B
Permitting Plan
and Timelines
Green: Applicant has provided a
satisfactorily complete list of required
federal, state, and local permits.
Green: Applicant has provided a
satisfactorily complete list of required
federal, state, and local permits.
4.2.3.1 AtlanticShores
Atlantic Shores has provided a satisfactorily complete list of required federal, state, and local permits. DEP
reports that one minor permit may be missing from the permit plan, but this is not a significant defect.
Atlantic Shores scores Green for this factor.
4.2.3.2 OceanWind2
Ocean Wind 2 has provided a satisfactorily complete list of required federal, state, and local permits. DEP
reports that one minor permit may be missing from the permit plan, but this is not a significant defect.
Ocean Wind 2 scores Green for this factor.
4.2.4 Permit Status and Potential Obstacles to Obtaining Permits
Each Application was reviewed to evaluate the overall status and inherent risks of the Permitting Plan.
Projects which have already secured key initial permits received higher ratings. The proposed turbine
arrays, export cable routes and landfall locations, onshore rights of way and substation locations were
reviewed to analyze whether the Applicant would be likely to encounter significant obstacles in obtaining
certain permits, potentially jeopardizing development milestones, and/or causing additional mitigation /
compliance costs. The rating levels in this category are defined as shown in Table 61.

May 25, 2021
Public Version Page 110
Table 61. Permit Status and Potential Obstacles to Obtaining Permits Evaluation Criteria
Green
Applicant has prepared a Site Assessment Plan or a Construction and Operations Plan and/or
applied for one or more permits that are required to begin Project development. It is
reasonably expected that there will not be significant obstacles in obtaining permits in time to
meet the expected commercial operation date, as long as complete applications are
submitted with adequate time for review, and any additional mitigation or compliance costs
are not expected to be significant.
Yellow
Applicant has begun preparation of one or more permit applications required to begin Project
development. Some permitting risks are identified but can be addressed with feasible
modifications to the Project and/or additional mitigation or compliance costs that will not
jeopardize Project viability or the proposed commercial operation date.
Orange
Applicant has not initiated any permits or approvals. Permitting risks appear to be significant
and there is a risk of significant delay in the expected commercial operation date, but the
project is still considered viable.
Red Project contains significant permitting risks that cannot be remedied without jeopardizing the
viability of the Project.
Table 62 summarizes the ratings assigned to each Project in this category.
Table 62. Permit Status and Potential Obstacles to Obtaining Permits Ratings *BC//EC*
Atlantic Shores Ocean Wind 2
C A B
Permit Status and
Obstacles
Green: No specific obstacles to
permitting have been identified, SAP
and COP have been submitted.
Yellow: Potential
risk of permitting
delay due to local
opposition.
Orange: Site‐specific
permitting has not
been initiated.
4.2.4.1 AtlanticShores
Atlantic Shores received its Site Assessment Survey Plan approval from BOEM in September 2019, and has
obtained other federal approvals to conduct field surveys.203 Atlantic Shores submitted its Site Assessment
Plan (“SAP”) to BOEM in December 2019 and will need to receive approval in order to begin geotechnical
and geophysical surveys and to deploy a second metocean buoy in 2021.204 Atlantic Shores submitted a
COP for the southern portion of the lease area covering the location for Projects *BC/ /EC* C *BC/
/EC* on March *BC/ /EC* 2021, and anticipates submitting a COP for the
northern portion of the lease area *BC/ /EC* Submission of
the COP initiates review of other federal permits.
The Cardiff onshore cable route and onshore substation occurs within the Pinelands Commission
jurisdictional boundary.206 The right of way crosses areas designated as “Regional Growth Area” and
203 ASOW Application, p. 384. 204 ASOW Application, p. 299. 205 ASOW Application, p. 299‐300. 206 ASOW Application, p. 371.

May 25, 2021
Public Version Page 111
“Rural Development Area”, so it is expected that the proposed development would be determined to be
consistent with the Pinelands Comprehensive Management Plan.207
As noted under Section 4.2.1.1, the proximity of the closest turbines of *BC/ /EC* to shore has
triggered some local community concerns about visual impacts. Local community opposition may create
potential obstacles or delays.
Atlantic Shores Projects *BC/ /EC* C are scored Green because no specific obstacles to permitting
have been identified and the SAP and COP have been submitted to BOEM. *BC/ /EC* scored
Yellow due to *BC/ /EC* and potential for obstacles or delays due to
local opposition related to visual impacts.
4.2.4.2 OceanWind2
Ørsted has been focusing on advancing Ocean Wind 1 and has not initiated site‐specific permitting for
Ocean Wind 2. Ørsted expects to leverage its experience from Ocean Wind 1 to facilitate permitting for
Ocean Wind 2,208 but has not identified any strategy for securing permits for Ocean Wind 2, in particular,
the offshore export cable route or the on‐shore right‐of‐way.
The SAP, which was approved by BOEM on May 17, 2018, covers site activities over the entire Ørsted lease
area, including Ocean Wind 2. A COP has been submitted and deemed sufficient to begin environmental
review for Ocean Wind 1,209 but a COP has not yet been submitted for Ocean Wind 2. Ørsted expects to
submit the COP for OW2 in Q3 2022, *BC/
/EC*
Ocean Wind 2 scores Orange for this factor since it has not initiated any project‐specific permitting, and
groundwork for Ocean Wind 1 does not address the specific conditions surrounding the Ocean Wind 2
turbine array or the proposed offshore and on‐shore cable route.
4.2.5 POI Future-Proofing
Applicants were required to provide a description of design elements in their Projects that will
accommodate future expansion of offshore wind delivery capability and avoid or minimize incremental
environmental impact. If the Project does not include design elements, a rationale for exclusion must be
provided. The objective is not to encourage or require Applicants to overbuild export cable transmission
capacity, but to “future‐proof” the Project in order to avoid or minimize the area of seafloor or shoreline
disturbance, the number of cable landfalls, or the footprint of the onshore right‐of‐way or interconnection
facilities.
207 State of New Jersey, Pinelands Commission, Pinelands Interactive Map, https://www.nj.gov/pinelands/home/maps/interactivemap/ 208 OW2 Application, p. 13‐8. 209 BOEM, “Notice of Intent To Prepare an Environmental Impact Statement for Ocean Wind, LLC's Proposed Wind Energy Facility Offshore New Jersey” March 30, 2021, https://www.federalregister.gov/documents/2021/03/30/2021‐06520/notice‐of‐intent‐to‐prepare‐an‐environmental‐impact‐statement‐for‐ocean‐wind‐llcs‐proposed‐wind 210 OW2 Application, p. 11‐2.

May 25, 2021
Public Version Page 112
Table 63. POI Future‐Proofing Evaluation Criteria
Green Applicant proposes future‐proof design elements that are highly likely to avoid or minimize
future environmental impacts.
Yellow Applicant proposes future‐proof design elements that may avoid or minimize future
environmental impacts.
Orange Applicant does not propose any future‐proof design elements but includes a reasonable
rationale for not including such elements.
Red
Applicant does not address POI future‐proofing and does not include a reasonable rationale
for not including such elements, or proposes future‐proof design elements that may increase
environmental impacts.
Table 64 summarizes the ratings assigned to each Project in this category.
Table 64. POI Future‐Proofing Ratings *BC//EC*
Atlantic Shores Ocean Wind 2
C A B
POI Future‐
Proofing
Green: Future‐proof design elements are
proposed and highly likely to reduce future
environmental impacts.
Orange: Future‐proof design
elements are not proposed in order
to avoid potentially stranded assets.
4.2.5.1 AtlanticShores
Atlantic Shores proposes to install extra conduits in the onshore portion of the rights‐of‐way to Cardiff
*BC
EC* It would avoid future onshore civil work, including digging
and trenching, from the transition vault at the beach landing to the point of interconnection, *BC/
/EC*
Atlantic Shores also intends to expand its baseline studies over the entire lease area to avoid the
environmental impact (and, presumably cost) of a future field mobilization.212
Atlantic Shores scores a Green for this factor because the proposed design elements are highly likely to
reduce future environmental impacts. LAI notes, however, that if installation of the extra conduits creates
incremental environmental impact without being necessary for the completion of the project at hand,
then the expanded civil work may not be readily permitted. *BC/
EC* The assigned score assumes based on
this context that the proposed future‐proofing will not create significant incremental impact.
211 ASOW Application, p. 346. 212 ASOW Application, p. 253. 213 ASOW Interview Transcript, pp. 115‐118.

May 25, 2021
Public Version Page 113
4.2.5.2 OceanWind2
OW2 acknowledges that it sees value in “strategic deployment of shared facilities and continues to explore
opportunities for these to be delivered in a commercially competitive manner.” However, OW2 does not
propose any specific design elements to avoid or minimize future environmental impacts because
“inclusion of elements to support future expansion, while desirable, would result in unnecessary
ratepayer costs for potentially stranded assets.”214
Ocean Wind 2 is scored Orange for this factor since the Application does not include any future‐proof
design element but provides a reasonable rationale for not including such an element.
4.3 SummaryofQualitativeScoring
Each Project is assigned a score from zero to three for each metric based on the color‐coding described
above. Those raw scores are then multiplied by the weighting factor assigned to each of the qualitative
metrics, as shown in Table 65.
Table 65. Environmental and Fisheries Impacts Weighting Factors and Total Scores *BC//EC*
Metric
Weighting
Factor
Atlantic Shores Ocean Wind 2
C A B
Feasibility and strength of EPP
Feasibility and strength of FPP
Completeness of Permitting Plan
and reasonableness of timelines
and milestones
Permit status and potential
obstacles to obtaining permits
POI future‐proofing
Emissions accounting
Total Weighted Score
214 OW2 Application, p. 9‐24.

May 25, 2021
Public Version Page 114
5 LIKELIHOODOFSUCCESSFULCOMMERCIALOPERATION
Highlights
Project raw scores based on qualitative assessment, which are the basis for assigning points in this category, are shown in Figure 25. *BC
EC*
Figure 26. Total Raw Likelihood of Successful Commercial Operation Scores *BC//EC*
Both Ocean Wind 2 and Atlantic Shores are backed by global energy companies with strong balance sheets. Each company has demonstrated the management expertise needed to facilitate successful commercial development, although ASOW does have less corporate offshore wind experience. Preliminary identification of GE and MHI Vestas as the WTG suppliers and foundation design follow industry standards, with the caveat that Ørsted does not have experience with the specific foundation type proposed by OW2, but do not preclude changes if technology progress merits design modifications in the years ahead. Importantly, such changes will not trigger an OREC price increase.
Certain components of the Projects’ scores are differentiated based on development status, scheduling and environmental considerations. These identified differentiating factors do not rise to the level of risk that could impede project commercialization.
Both Applicants are highly likely to successfully develop their respective Projects as there are no known obstacles that constitute fatal flaws. Energizing their respective supply chains to support

May 25, 2021
Public Version Page 115
rapid advancement in light of Governor Murphy’s accelerated carbon reduction goals should strengthen each Applicant’s ability to meet scheduled milestones.
5.1 ProjectDesign
N.J.A.C. 14:8‐6.5(a)(2)(i)(2) requires a demonstration by Applicants that “the wind technology is viable,
cost competitive, and suitable for use in New Jersey's offshore environment under varying and expected
meteorological and climate conditions…” In support of this requirement, Applicants were required to
provide a description of each of the major types of equipment that is planned to be installed as part of
the Project, including specifications, warranties, commercial operating history and the ability of the
equipment to work in New Jersey's offshore and near shore climates. Major types of equipment include
wind turbine generators, foundations, offshore substations, and inter‐array and export cables.
5.1.1 Wind Turbine Generator Suitability
Table 66. Wind Turbine Generator Suitability Evaluation Criteria
Green
The proposed WTG is commercially available or can reasonably be expected to become
commercially available prior to commencement of Project construction, and similar equipment
by the same supplier has been used successfully in one or more areas similar to New Jersey’s
offshore environment.
Yellow
The proposed WTG can reasonably be expected to become commercially available during
Project construction without significant anticipated delays in commercial operation, and
Applicant has provided specifications, warranties and/or characteristics for the proposed WTG
that indicate its ability to work successfully in New Jersey’s offshore environment.
Orange
There is some risk that there will be a delay in availability of the proposed WTG that significantly
affects the Project commercial operation date, or the Applicant has provided specifications,
warranties and/or characteristics for the proposed WTG indicating that it may not work
successfully in New Jersey’s offshore environment.
Red Applicant has not provided information to support the use of the proposed WTG in New Jersey’s
offshore environment, or the proposed manufacturer has not previously supplied similar WTGs.
Table 67 summarizes the ratings assigned to each Project in this category.
Table 67. Wind Turbine Generator Suitability Ratings *BC//EC*
Atlantic Shores Ocean Wind 2
C A B
WTG Suitability Green: WTG certification timeline is consistent
with Project development schedule, and
similar equipment from the same supplier has
been used successfully in other locations.
Green: The design basis WTG is
reasonably expected to become
commercially available prior to
the start of construction
5.1.1.1 AtlanticShores
According to ASOW, the V236‐13.6 MW turbine from MHI Vestas is *BC/
EC* ASOW provided a certification

May 25, 2021
Public Version Page 116
commitment letter from DNV‐GL stating that the “aim is to complete the Type Certification Rotor Nacelle
Assembly in Q3 2023” (Appendix 2‐17). ASOW further states that they will “ensure that the new model is
certified specifically for the Project site conditions and for the entire operating lifetime before the start of
fabrication” (Application p. 77). *BC/
EC*
ASOW is rated Green for this criterion because the WTG certification timeline is consistent with the Project
development schedule and similar equipment from the same supplier has been used successfully in other
locations.
5.1.1.2 OceanWind2
The GE Haliade‐X 12 MW turbine achieved final type certification in November 2020.216 Ocean Wind 2 has
not provided documentation of the certification plan or timeline, but reports that the 14 MW turbine will
be ready for the Dogger Bank C project in the UK.217 For that project, WTG installation is set to begin in
2025, *BC/
EC* The Haliade‐X platform has not yet been deployed, but comparable equipment “is currently
successfully off the cost of Rhode Island in Ørsted’s Block island Wind Farm” and also in the North Sea
(Application p. 2‐20). The platform is being designed to meet a certification standard that it can operate
in an offshore marine environment and survive loads and hurricanes.220 *BC
/EC* the timeline for the 14 MW
design basis WTG is consistent with the Project schedule.
OW2 is rated Green for this criterion because the design basis WTG is reasonably expected to become
commercially available prior to the start of construction.
215 ASOW Application, pp. 77‐78. 216 OW2 Application, p. 2‐7. 217 https://doggerbank.com/press‐releases/ges‐haliade‐x‐14mw‐turbine‐to‐debut‐at‐dogger‐bank‐c/ 218 OW2 Application, p. 11‐4. 219 OW2 Application, p. 2‐7. 220 OW2 Application, p. 2‐20.

May 25, 2021
Public Version Page 117
5.1.2 Foundation Suitability
Table 68. Foundation Suitability Evaluation Criteria
Green The proposed foundation has an established history of use in locations similar to the offshore
environment of New Jersey.
Yellow Applicant has provided specifications, warranties and/or characteristics for the proposed
foundation that indicate its ability to work successfully in New Jersey’s offshore environment.
Orange Applicant has provided specifications, warranties and/or characteristics for the proposed
foundation indicating that it may work successfully in New Jersey’s offshore environment.
Red Applicant has not provided information to support the use of the proposed foundation in New
Jersey’s offshore environment.
Table 69 summarizes the ratings assigned to each Project in this category.
Table 69. Foundation Suitability Ratings *BC//EC*
Atlantic Shores Ocean Wind 2
C A B
Foundation
Suitability
Green: Primary (monopile)
have
previously been used in locations
similar to the offshore environment of
New Jersey.
Yellow: Monopile technology has
previously been used in locations similar
to the offshore environment of New
Jersey,
5.1.2.1 AtlanticShores
Atlantic Shores’ primary project design involves the use of monopile foundations with transition pieces
(“TPs”). *BC/
/EC* Monopiles are the most widely used type of foundation for offshore wind farms, with
more than 7,000 foundations installed worldwide, representing over 34 GW of capacity (Application p.
53).221 Monopiles are especially suitable for water depths of 40 meters or less, which is consistent with
the water depth in the lease area, and the soft soil that is generally prevalent on the seabed off the coast
of New Jersey.
*BC
EC*
221 The “2018 Offshore Wind Technologies Market Report” published by the U.S. DOE Office of Energy and Efficiency and Renewable Energy reports that monopiles represent 73.5% of the offshore wind market as of year end 2018. https://www.energy.gov/sites/prod/files/2019/09/f66/2018%20Offshore%20Wind%20Technologies%20Market%20Report.pdf, p. 45.

May 25, 2021
Public Version Page 118
ASOW is scored Green for this criterion because it proposes to use technology that has been widely used
in locations similar to the offshore environment of New Jersey.
5.1.2.2 OceanWind2
Based on preliminary site data, Ocean Wind 2 also proposes to use monopile foundations, *BC/
/EC* OW2 states that Ørsted has been responsible for installing approximately 1,500 monopile
foundations, and that the design ensure “suitability with the local marine and ocean environment”
(Application p. 2‐20). OW2 has also stated, however, that it plans to use a relatively new technology, the
TP‐less monopile.222 *BC/
/EC* OW2 identified two non‐Ørsted projects in the Netherlands where a total
of 120 foundations of this type have been installed. *BC/
EC*
OW2 is scored Yellow for this criterion because it proposes to use a new technology with which the
Applicant has limited experience.
5.1.3 Inter-array and Export Cables Suitability
Table 70. Inter‐array and Export Cables Suitability Evaluation Criteria
Green The proposed undersea cables have an established history of use in locations similar to the
offshore environment of New Jersey.
Yellow
Applicant has provided specifications, warranties and/or characteristics for the proposed
undersea cables that indicate their ability to work successfully in New Jersey’s offshore
environment.
Orange
Applicant has provided specifications, warranties and/or characteristics for the proposed
undersea cables indicating that they may work successfully in New Jersey’s offshore
environment.
Red Applicant has not provided information to support the use of the proposed undersea cables in
New Jersey’s offshore environment.
Table 71 summarizes the ratings assigned to each Project in this category.
Table 71. Inter‐array and Export Cables Suitability Ratings *BC//EC*
Atlantic Shores Ocean Wind 2
C A B
Cables
Suitability
Green: Proposed technology is
standard for offshore wind farms.
Green: Proposed technology is standard for
offshore wind farms.
5.1.3.1 AtlanticShores
ASOW is planning to utilize a *BC/ /EC* cable system for the Cardiff interconnection, *BC/
/EC* The inter‐array cables will
operate at 66 kV. *BC/
222 Response to CQ1 #2.

May 25, 2021
Public Version Page 119
/EC*
ASOW is scored Green for this criterion because the proposed technology is standard for offshore wind
farms and has previously been used in locations substantially similar to the offshore waters of New Jersey.
5.1.3.2 OceanWind2
*BC
/EC*
OW2 is scored Green for this criterion because the proposed technology is standard for offshore wind
farms and has previously been used in locations substantially similar to the offshore waters of New Jersey.
5.1.4 Offshore Substations Suitability
Table 72. Offshore Substations Suitability Evaluation Criteria
Green The proposed equipment has an established history of use in locations similar to the offshore
environment of New Jersey.
Yellow Applicant has provided specifications, warranties and/or characteristics for the proposed
equipment that indicate its ability to work successfully in New Jersey’s offshore environment.
Orange Applicant has provided specifications, warranties and/or characteristics for the proposed
equipment indicating that they may work successfully in New Jersey’s offshore environment.
Red Applicant has not provided information to support the use of the proposed equipment in New
Jersey’s offshore environment.
Table 73 summarizes the ratings assigned to each Project in this category.
Table 73. Offshore Substations Suitability Ratings *BC//EC*
Atlantic Shores Ocean Wind 2
C A B
Offshore
Substations
Suitability
Green: Proposed technology is in use
for global offshore applications.
Green: Proposed technology is in use for
global offshore applications.
5.1.4.1 AtlanticShores
*BC
223 ASOW Application, p. 59. 224 OW2 Application, p. 2‐17 225 OW2 Application, pp. 2‐5 and 2‐10. 226 *BC/
/EC* (ASOW Application p. 68).

May 25, 2021
Public Version Page 120
EC* ASOW states that the equipment to be installed in the
offshore substations “is currently being used in most North American utilities’ substations” (Application
p. 71). Depending on the specific ASOW Project, the specifications for offshore substation size or cable
voltage may be incrementally larger than technology currently in use for offshore wind, but not to a
degree that represents technology risk. The selected offshore substation supplier, Rosetti Marino has
“extensive offshore experience in the offshore market” (Application p. 71).227
ASOW is scored Green for this criterion because the proposed technology is currently in use for global
offshore applications.
5.1.4.2 OceanWind2
Ocean Wind 2’s offshore substation will consist of a topside structure and foundation substructure.
*BC
/EC* OW2 reports that the
equipment is being used successfully in the North Sea, and also that comparable equipment is being used
at the Block Island Wind Farm.
OW2 is scored Green for this criterion because the proposed technology is currently in use for global
offshore applications.
5.1.5 Storage and Innovative Technologies
Applicants were encouraged to utilize new and innovative technologies, including storage, that contribute
to reducing the demand for peak electric generation, improve the reliable operation of the electric system,
reduce the emissions of greenhouse gases from electric generation, and/or minimize environmental
and/or fisheries impacts.
Table 74. Storage and Innovative Technologies Evaluation Criteria229
Green Applicant proposes to utilize storage or innovative technology that will contribute to reducing
peak demand, increase system reliability, and/or reduce emissions of greenhouse gases
Yellow Applicant proposes to utilize storage or innovative technology that may contribute to reducing
peak demand, increase system reliability, and/or reduce emissions of greenhouse gases.
Red
Applicant does not propose the use of storage or innovative technologies, or proposes the use
of storage or innovative technologies that may increase peak demand, impair system
reliability, or increase emissions of greenhouse gases.
227 ASOW notes that currently “offshore substations are constructed and in operation in sizes up to 1,000 MW/ *BC
EC* (ASOW Application p. 71). 228 OW2 Application, pp. 2‐13 to 2‐14. 229 There is no Orange rating for this criterion.

May 25, 2021
Public Version Page 121
Table 75 summarizes the ratings assigned to each Project in this category.
Table 75. Storage and Innovative Technologies Ratings *BC//EC*
Atlantic Shores Ocean Wind 2
C A B
Storage and
Innovative
Technologies
Green: The proposed pilot hydrogen
demonstration project will reduce
greenhouse gas emissions in New Jersey
including potential decarbonization of
the gas grid.
Green: The truck electrification project
will reduce greenhouse gas emissions in
New Jersey.
5.1.5.1 AtlanticShores
Atlantic Shores’ innovation plan consists of two elements: developing a hydrogen demonstration plant,
and collaborating with academia to explore commercial pathways for battery storage and hydrogen. The
hydrogen demonstration plant would be sized at *BC/ /EC* 10 MW for Projects C
*BC/ /EC* The electrolyzer will convert generation from the offshore wind facility into green
hydrogen by using the renewable electricity to make hydrogen from water. The hydrogen generated by
the electrolyzer will then be blended with natural gas in SJI’s gas distribution system and used to fuel
residential, commercial, and industrial customers. The pilot project will support SJI’s efforts to reduce
greenhouse gas emissions.
*BC
/EC*
ASOW is scored Green for this criterion because the proposed pilot hydrogen demonstration project will
reduce greenhouse gas emissions in New Jersey including potential decarbonization of the gas grid.
5.1.5.2 OceanWind2
*BC/Ocean Wind 2’s innovation plan consists of two primary components: powering electric drayage
trucks at the Port of New York and New Jersey using offshore wind, and researching options for the
integration of energy storage technologies in conjunction with offshore wind power plants in the New
Jersey electricity grid. The truck electrification project is designed to deliver emissions reductions and air
quality improvements in one of New Jersey’s most overburdened communities. Ocean Wind 2 will provide
financial support to Zeem “to support the deployment of zero‐emission Class 8 freight transport such that
the operating cost matches that of more mature fossil‐fuel technology” (Application p. 8‐22). The project
will include up to fifty Class 8 trucks and development of an electric truck depot facility. The depot and
trucks are intended to be configured with vehicle‐to‐grid capabilities to provide energy storage to the PJM
grid.
OW2 notes that it has not included storage in the Project because “significant technical challenges still
prevent the deployment of storage at the scale needed” (Application p. 8‐24) *BC
/EC*
OW2 is scored Green for this criterion because the truck electrification project will reduce greenhouse gas
emissions in New Jersey.

May 25, 2021
Public Version Page 122
5.2 Transmission
5.2.1 Interconnection Plan
The Project’s PJM interconnection request, study schedule and the schedule for construction of the
required transmission system upgrades are also an important consideration in determining the Likelihood
of Successful Commercial Operation, per N.J.A.C. 14:8‐6.5(a)(14) et seq. All Applicants were required to
submit a proposed Project schedule and milestones that includes the necessary transmission
interconnection studies and approvals. The schedule for transmission interconnection studies is
influenced by the transmission POI and the required transmission system upgrades.
Table 76. Interconnection Plan Evaluation Criteria
Green
The proposed Project schedules are detailed, complete, and include feasible timelines,
providing reasonable assurance that the Project will meet the proposed in‐service date.
Applicant provides a clear and reasonable justification for selection of the POI that considers
cable distance, scope of transmission system upgrade requirements, ability to work
synergistically with the future offshore transmission grid, environmental impacts, and impacts
on PJM current and future load pocket and transmission constraints, and compares these
factors favorably to other potential POIs.
Yellow
The proposed Project schedules include sufficient detail to demonstrate the feasibility of
achieving the Proposed in‐service date. Applicant provides a justification for selection of the
POI that considers cable distance, scope of transmission system upgrade requirements, ability
to work synergistically with the future offshore transmission grid, and impacts on PJM current
and future load pocket and transmission constraints, and compares these factors to other
potential POIs.
Orange
The proposed Project schedule is complete and aligned with the proposed in‐service date, but
the level of detail provided is not sufficient to demonstrate the feasibility of the proposed in‐
service date. Applicant provides information regarding the POI including cable distance, scope
of transmission system upgrade requirements, ability to work synergistically with the future
offshore transmission grid, and impacts on PJM current and future load pocket and
transmission constraints, but does not compare these factors to other potential POIs.
Red The proposed Project schedule indicates significant risk of delay. Applicant does not explain
why the selected POI was chosen.
Table 77 summarizes the ratings assigned to each Project in this category.

May 25, 2021
Public Version Page 123
Table 77. Interconnection Plan Ratings *BC//EC*
Atlantic Shores Ocean Wind 2
C A B
Interconnection
Plan
Green:
would result in
timely completion.
Relative benefits of POIs
are stated. Environmental
impacts and mitigation
measures are addressed.
Yellow:
would result in
timely completion, but
would not. Relative
benefits of POIs are stated.
Environmental impacts and
mitigation measures are
addressed.
Orange: The basis for
the construction
duration of the system
upgrades is not
provided. Cable length
presents environmental
challenges. The landfall
and onshore cable
routes have not been
finalized, therefore
permitting challenges
cannot be assessed.
5.2.1.1 AtlanticShores
The Feasibility Study and System Impact Study have been completed for each of the queue positions
*BC/
EC*
230 *BC/
/EC*

May 25, 2021
Public Version Page 124
Table 78. Interconnection Work Completion Dates Relative to Project CODs *BC//EC*
Environmental considerations related to the export cable are described in Section 4.2.1.1. *BC
EC* The offshore cable routes avoid
artificial reefs, and HDD will be used to avoid shoreline disturbances.
ASOW supports the selection of the Cardiff POI by noting that it is 12 miles from the cable landfall location
and can be accessed primarily by existing transportation rights‐of‐way. The substation was upgraded after
Hurricane Sandy and is one of the largest substations in South Jersey. *BC/
/EC*
ASOW notes that multiple POIs had initially been selected for study, and that list was refined to the
proposed *BC/ /EC* POIs in part because they are “*BC/ /EC* the electrically strongest locations
on the 230 kV system of New Jersey’s Atlantic coast” (Application p. 333).
Based on studies conducted by a third‐party consultant, ASOW “is expected to reduce the need to import
power from western supply sources to serve the New Jersey load centers and neighboring load zones in
231 *BC/ /EC* 232 *BC/ /EC* 233 *BC/
EC* 234 *BC/ /EC* 235 *BC/ /EC*

May 25, 2021
Public Version Page 125
eastern PJM and thereby reduce congestion on some of the constrained lines in the region” (Application
p. 334).
ASOW *BC/ /EC* scored Green for this criterion because *BC/
/EC* would allow for timely completion of the interconnection work. Projects C
*BC/ /EC* scored Yellow for this criterion because *BC/
/EC* would allow for timely completion of the interconnection work. The rationale for selecting
the POIs is provided, and environmental impacts and mitigation measures are addressed for all Projects.
5.2.1.2 OceanWind2
Ocean Wind 2 filed an interconnection request with PJM in *BC/ /EC* Feasibility Study
results are expected from PJM in *BC/ /EC* The System Impact Study will be completed by PJM
around *BC/ /EC* The Facilities Study is expected to be completed in 2024, with the Interconnection
Service Agreement also executed in 2024. The OW2 summary project schedule (Application p. 11‐5)
indicates that the system upgrades and interconnection facilities will be completed in *BC/ /EC*
which represents an approximately *BC/ /EC* buffer beyond the completion date for grid
improvement works shown in the project construction schedule (Attachment 11.1). *BC
/EC*
As discussed in Section 2.1.1.2, OW2 changed its primary POI during the evaluation window from Deans
to Smithburg. OW2 has indicated that it plans to officially change the primary POI with PJM after the
Feasibility Study for Deans 500 kV is completed. PJM will then study Smithburg 500 kV as the primary POI
in the System Impact Study. OW2 stated in the Application that the Project’s final POI will be definitively
established only after the Project has been selected by the Board, all site control and permits have been
achieved, and actual upgrade costs have been determined by PJM.236
OW2 stated in its Application that Deans was selected as the initial primary POI *BC/
/EC* Smithburg was selected as the secondary POI as “a mitigation of any challenges with the
proposed cable route to Deans” (Application p. 12‐6). OW2 describes Smithburg as a strong
interconnection point because it is connected to Deans 500 kV, Larrabee 230 kV, and Oceanview 230 kV.
OW2 explained it had chosen to change to Smithburg as the primary POI in order to *BC
EC*
As discussed in Section 4.2.1.2, the length of the export cable, *BC/
/EC* would be significantly longer than any other
export cables considered in the NJ offshore wind program. The cable route and landfall have not been
finalized. *BC/
236 OW2 Application, pp. 12‐2 to 12‐3. 237 OW2 Application, p. 12‐5. 238 Response to CQ2 #20.

May 25, 2021
Public Version Page 126
/EC* OW2 proposes to use trenchless technology,
i.e., HDD, to avoid impacts to sensitive habitats such as the coastal habitat and wetlands, and will restore
or replace disturbed wetlands.
*BC
EC*
OW2 is scored Orange for this category because the basis for the construction duration of the system
upgrades is not provided. Cable length presents environmental challenges. In addition to uncertainty
about the POI, the landfall and onshore cable routes have not been finalized, therefore permitting
challenges cannot be assessed.
5.2.2 Site Control of Onshore Locations
Land Acquisition Plans were evaluated to assess the Applicant’s ability to secure all property and rights of
way to construct the land‐based interconnection facilities consistent with the Project development
milestones.
Table 79. Site Control of Onshore Locations Evaluation Criteria
Green
Applicant (a) identified all properties and rights of way needed for the onshore substations
and land‐based portions of cable rights of way, (b) obtained site control through ownership
rights, lease, or an irrevocable option to purchase or lease for substation locations and for
rights of way through non‐public roadways or thoroughfares, (c) delineated the route for
rights of way through public roadways or thoroughfares, and (d) addressed whether there are
any constraints or limitations with siting an energy facility at that location or locations.
Yellow
Applicant identified the general locations of properties and rights of way needed for the
onshore substations and land‐based portions of rights of way and provided a feasible plan for
finalizing the route and properties, and for obtaining site control.
Orange
The proposed locations of onshore rights of way and substations are incomplete and/or
Applicant did not provide a plan for finalizing the route and properties and for obtaining site
control.
Red The proposed locations of onshore rights of way and substations are not provided, or there
are known obstacles to securing the sites needed.
Table 80 summarizes the ratings assigned to each Project in this category.
Table 80. Site Control of Onshore Locations Ratings *BC//EC*
Atlantic Shores Ocean Wind 2
C A B
Onshore
Site
Control
Yellow: Applicant identified the properties and rights
of way needed for the onshore substations and ROW
and provided a feasible plan for finalizing the route
and properties, and for obtaining site control.
Orange: Applicant has
not determined the
specific cable landfall
or onshore cable ROW.
239 OW2 Application Attachment 9.1, Figures 2.2‐11 and 2.2‐12 240 OW2 Application p. 12‐12.

May 25, 2021
Public Version Page 127
5.2.2.1 AtlanticShores
Atlantic Shores has identified the specific parcels that are required for the onshore components of the
Project’s interconnection to Cardiff *BC/ /EC* including beach landings, rights‐of‐way,
onshore substations, and points of interconnection.241 *BC/
EC*
Maps have been provided for the onshore cable routes, including identification of environmental
considerations.243/EC*
ASOW is scored Yellow for this criterion because it has identified the properties and rights of way needed
for the onshore substations and ROW and provided a feasible plan for finalizing the route and properties,
and for obtaining site control.
5.2.2.2 OceanWind2
Ocean Wind 2 has not confirmed the cable landfall locations. It states that it has identified potential
property for the onshore substations for each of the potential POIs and likely cable landfalls and terrestrial
cable routes, but has not included information regarding the parcels in the Application. OW2 also states
that it is continuing to undertake *BC/
/EC* (Application p. 12‐17). A plan for securing land ownership and leases
is provided in the Application.
OW2 is scored Orange for this criterion because it has not determined the specific cable landfall or
onshore cable ROW.
5.3 PortsandInfrastructureDevelopment
Each Applicant’s prospects for timely commercial success through port restoration, development, and
staging for construction were evaluated separately for the construction and operations phases.
Underlying each rating are considerations regarding level of effort expended by the Applicant to address
port and infrastructure development. LAI considered what steps have already been taken or accomplished
toward achievement. This consideration included recognition of steps, measures, and financial
commitments the Applicant is prepared to take that are deemed to be incremental to any prior steps,
measures, and financial commitments that have been recognized by the Board in the previous solicitation.
241 ASOW Appendix 12‐1 242 ASOW Application, p. 332. 243 ASOW Application, pp. 330‐331; CQ1 response Appendix D and Appendix E.

May 25, 2021
Public Version Page 128
5.3.1 Construction Phase Ports and Infrastructure Development
Table 81. Construction Phase Ports and Infrastructure Development Evaluation Criteria
Green
Applicant proposes to use a port that already has planned offshore wind infrastructure
development during the construction phase and has accomplished certain initial milestones,
for example, signed an MOU for use of the port and the schedule for port development is
consistent with the overall project schedule, with reasonable allowances for delays. If the
Applicant would otherwise qualify for a Yellow rating because it proposes a port that does not
already have planned offshore wind infrastructure development, but has supplemented its
plans with a backup option in the event that the primary port falls through, it may be eligible
for a Green rating.
Yellow
Applicant proposes to use a port that does not already have planned offshore wind
infrastructure development during the construction phase and has accomplished certain
initial milestones, for example, signed an LOI or MOU for use of the port and the schedule for
port development is consistent with the overall project schedule, with reasonable allowances
for delays. If the Applicant would otherwise qualify for a Green rating but the port
development schedule does not make reasonable allowances for delays, it may still qualify for
a Yellow, if sufficient support for the schedule is provided. If the Applicant would otherwise
qualify for an Orange because it proposes a port that it has not yet initiated a relationship
with, but has supplemented its plans with a backup option in the event that the primary port
falls through, it may be eligible for a Yellow rating.
Orange
Applicant proposes to use one or more specific ports during the construction phase but has
not initiated a relationship with the port(s). Applicant has demonstrated the suitability of the
space(s) for the proposed use and identified any existing uses or conflicts. If the Applicant
would otherwise qualify for a Green or Yellow rating, but the port development schedule is
inconsistent with the overall project schedule, or does not make reasonable allowances for
delays and does not justify this exclusion, it will be reduced to an Orange rating.
Red Applicant does not propose to use any specific ports during the construction phase.
Table 82 summarizes the ratings assigned to each Project in this category.

May 25, 2021
Public Version Page 129
Table 82. Construction Phase Ports and Infrastructure Development Ratings *BC//EC*
Atlantic Shores Ocean Wind 2
C A B
Construction
Phase Ports
and
Infrastructure
Green: Applicant
has an
arrangement in
place with EEW
at Paulsboro and
has established a
relationship with
NJEDA at NJWP.
A backup plan is
in place in the
event that NJWP
is not available.
Yellow: It
is unclear
whether
the backup
plan
covers the
nacelle
assembly
facility.
Orange:
Green:
Applicant has an
arrangement in
place with EEW
at Paulsboro
and has
established a
relationship
with NJEDA at
NJWP. A backup
plan is in place
in the event
that NJWP is
not available.
Yellow: It is
unclear
whether
the backup
plan covers
the nacelle
assembly
facility.
5.3.1.1 AtlanticShores
Atlantic Shores proposes to conduct construction activity at Paulsboro and the NJWP, both of which
already have planned offshore wind infrastructure development. ASOW has signed a letter of intent with
EEW to purchase foundations produced at the Paulsboro facility *BC/
/EC* and the Project’s foundations are scheduled to be the first produced out of the EEW Phase 2
facility.244 *BC/
/EC*
NJWP is expected to be used for marshalling, *BC/ /EC* and final assembly,
nacelle assembly (Projects C *BC/ /EC* ASOW has
identified the parcels they propose to use and reports that they have “established a strong relationship”
with NJ EDA (Application p. xi). A formal agreement with NJEDA will not be set up until after an award in
this solicitation is announced. ASOW has aligned its project schedule with the current expected schedule
for NJWP development, *BC/
/EC*
ASOW *BC/ /EC* scored Green for this criterion because ASOW has an arrangement
in place with EEW at Paulsboro and has established a relationship with NJEDA at NJWP. A backup plan is
in place in the event that NJWP is not available. ASOW Project C is scored Yellow because it is unclear
244 See Section 3.1 for information regarding ASOW’s agreement with EEW. 245 ASOW Application, p. 300 246 ASOW interview transcript, p. 30.

May 25, 2021
Public Version Page 130
whether the backup plan includes the nacelle assembly facility. ASOW *BC/ /EC* scored Orange
because *BC
/EC*
5.3.1.2 OceanWind2
Monopile foundations are expected to be manufactured and loaded out from the proposed EEW facility
in Paulsboro. OW2 has executed a Pre‐Development Agreement with EEW, and the schedule is aligned
with the project’s overall construction schedule. OW2 is planning for WTG assembly and load‐out to
happen out of the NJWP, but this is conditional upon NJEDA’s successful realization of the facility and
OW2 securing a tenancy in accord with the Project’s schedule. If OW2 is not able to use the NJWP for WTG
assembly, it will conduct this activity out of *BC/ /EC* For Project B, GE would build a
nacelle assembly facility at the NJWP, also conditional on obtaining a timely lease with terms and
conditions acceptable to GE. OW2 has not reported a backup plan for the nacelle assembly facility if NJWP
is not available. Port Elizabeth is intended to be used for *BC
EC* The Project’s O&M facility at Atlantic City (see Section 5.3.2.2) will
be used as the construction base as well.
OW2 Project A is scored Green for this criterion because OW2 has an arrangement in place with EEW at
Paulsboro and has established a relationship NJEDA at NJWP. A backup plan is in place in the event that
NJWP is not available. OW2 Project B is scored Yellow because it is unclear whether the backup plan
includes the nacelle assembly facility.

May 25, 2021
Public Version Page 131
5.3.2 Operations Phase O&M Facilities and Related Logistics
Table 83. Operations Phase O&M Facilities and Related Logistics Evaluation Criteria
Green
Applicant proposes to use a port that already has planned offshore wind infrastructure
development during the operations phase and has accomplished certain initial milestones, for
example, signed an MOU for use of the port and the schedule for port development is
consistent with the overall project schedule, with reasonable allowances for delays. If the
Applicant would otherwise qualify for a Yellow rating because it proposes a port that does not
already have planned offshore wind infrastructure development, but has supplemented its
plans with a backup option in the event that the primary port falls through, it may be eligible
for a Green rating.
Yellow
Applicant proposes to use a port that does not already have planned offshore wind
infrastructure development during the operations phase and has accomplished certain initial
milestones, for example, signed an LOI or MOU for use of the port and the schedule for port
development is consistent with the overall project schedule, with reasonable allowances for
delays. If the Applicant would otherwise qualify for a Green rating but the port development
schedule does not make reasonable allowances for delays, it may still qualify for a Yellow
rating, if sufficient support for the schedule is provided. If the Applicant would otherwise
qualify for an Orange rating because it proposes a port that it has not yet initiated a
relationship with, but has supplemented its plans with a backup option in the event that the
primary port falls through, it may be eligible for a Yellow rating.
Orange
Applicant proposes to use one or more specific ports during the operations phase but has not
initiated a relationship with the port(s). Applicant has demonstrated the suitability of the
space(s) for the proposed use and identified any existing uses or conflicts. If the Applicant
would otherwise qualify for a Green or Yellow rating, but the port development schedule is
inconsistent with the overall project schedule, or does not make reasonable allowances for
delays and does not justify this exclusion, it will be reduced to an Orange rating.
Red Applicant does not propose to use any specific ports during the operations phase.
Table 84 summarizes the ratings assigned to each Project in this category.
Table 84. Operations Phase O&M Facilities and Related Logistics Ratings *BC//EC*
Atlantic Shores Ocean Wind 2
C A B
Operations
Phase O&M
Facilities and
Logistics
Yellow: Applicant has identified an
appropriate port for its O&M base,
The schedule
aligns with the overall project schedule.
Green: Applicant has identified an
appropriate port for its O&M base
and has secured rights to the site.
The schedule aligns with the overall
project schedule
5.3.2.1 AtlanticShores
*BC/Atlantic Shores proposes to base its O&M activities at the Atlantic City port, which already has
planned offshore wind development.247 *BC/
247 ASOW Application, p. 396.

May 25, 2021
Public Version Page 132
/EC* The O&M base will include
quayside infrastructure to support CTV operations, a warehouse for spare parts and equipment, windfarm
remote monitoring, space and equipment for marine vessel coordination, waste management, offices,
meeting rooms, a break room for meals, and changing rooms. The facility will be designed to be a net‐
zero energy building (“NZEB”), incorporating features such as energy efficient office and warehouse
design with passive heating and cooling, efficient HVAC, LED lighting, and a solar PV plant. Atlantic Shores
does not provide a specific timeline for O&M facility development and construction, but given the current
development status and site needs, port development is not an area of concern from a schedule
perspective.
ASOW has been scored Yellow for this criterion because it has identified a site that meets the
requirements for Green, *BC/ /EC*
5.3.2.2 OceanWind2
Ørsted has signed two Option to Purchase Agreements for parcels in Atlantic City that will be used as the
O&M facility for Ocean Wind 1. OW2 proposes to expand this facility to also support OW2, including an
“extension of the planned Ocean Wind 1 office and warehouse facilities, as well as crew transfer vessel
berthing facilities” (Application p. 2‐24). A redevelopment plan was submitted to the Atlantic City Planning
Board in August 2020.249 The use of this land is subject to Exxon’s remediation of the site following its
former use as a petroleum and fuel storage depot and tank farm.250 OW2 has not provided a specific
timeline for construction of the O&M base, but the scope of development indicates that this will not be a
source of risk to the overall Project schedule, particularly given its planned use to support OW1.251
OW2 has been scored Green for this criterion because it has identified and secured site control, in the
form of Option to Purchase Agreements, for the proposed location of the O&M base.
5.4 Experience
5.4.1 Developer Offshore Wind Experience
The evaluation of corporate offshore wind experience was based on the number and size of offshore wind
projects developed by the Applicant, as well as the roles for which the Applicant has been responsible.
While the number and size of the Applicant’s projects are relatively easy to confirm, the roles for which
the Applicant has been responsible are not as easy to confirm. Relevant offshore experience with oil and
natural gas exploration and production (“E&P”) is a secondary positive factor considering the strong
similarities in environmental permitting, design, engineering, construction techniques, and operating
environment. These priorities are reflected in the rating definitions shown in Table 85.
248 ASOW Application, p. 397. 249 OW2 Application, pp. ES‐8, 14‐3. 250 OW2 Application, p. 13‐5. 251 *BC
/EC*

May 25, 2021
Public Version Page 133
Table 85. Developer Offshore Wind Experience Evaluation Criteria
Green Applicant has significant offshore wind experience that is consistent with the proposed role(s)
for this solicitation.
Yellow Applicant has limited offshore wind experience but significant offshore oil & gas experience that
is consistent with the proposed role(s) for this solicitation.
Orange Applicant has limited offshore experience of any kind.
Red Applicant has no offshore experience of any kind.
Table 86 summarizes the ratings assigned to each Project in this category.
Table 86. Developer Offshore Wind Experience Ratings *BC//EC*
Atlantic Shores Ocean Wind 2
C A B
Developer
Offshore Wind
Experience
Yellow: ASOW’s parent companies have limited
experience in offshore wind development and
operation. Most prior offshore experience is
related to oil and gas E&P operations.
Green: OW2’s parent company
has a clear record of
performance success in the
global offshore wind market.
5.4.1.1 AtlanticShores
ASOW’s shareholder EDFR Offshore is indirectly owned by EDF Renewables, which is in turn owned by
EDF Renouvelables S.A. EDF Renewables and its affiliates make up the EDF Renewables Group. ASOW’s
shareholder Shell New Energies is owned by Royal Dutch Shell. These parent organizations have
experience in operating almost 15 GW of renewable power projects. Roughly one‐half of this amount,
about 7 GW are offshore wind projects installed, under construction, or in development.
The EDF Renewables Group has 729 MW of offshore wind projects in operation, including the 325‐MW
Thornton Bank (aka C‐Power), the 62‐MW Teesside, the 40‐MW Blyth, and the 302‐MW Dongtai IV. The
EDF Renewables Group additionally has 1,630 MW of offshore wind projects under construction in China
and Europe, including the 500‐MW Fécamp project in France, and 2,274 MW of projects in development
in Europe, including the 1,200 Codling project in Ireland. The EDF Renewables Group has had and plans to
have a variety of roles for these projects, including development, planning, financing, construction, and
O&M. EDF Renewables additionally has a substantial onshore wind and solar portfolio in the U.S.,
including solar projects in New Jersey.
The Shell Group has a 108 MW offshore project in operation (NordZee Wind), a 731.5 MW project under
construction (Borssele 3&4) and 1,563 MW of projects in development, including the 804‐MW Mayflower
project in the U.S. (its largest project to‐date) and the 759‐MW Hollandse Kust North project in Europe.
The Shell Group plans to have roles including development, planning, financing, construction, and O&M
for these projects. The Shell Group additionally has onshore wind experience in the U.S., including eight
operating projects. For many decades the Shell Group developed significant expertise in the offshore oil
and gas industry.
ASOW is scored Yellow for this criterion because its parent companies have limited experience in offshore
wind development and operation. Most prior offshore experience is related to oil and gas E&P operations.

May 25, 2021
Public Version Page 134
5.4.1.2 OceanWind2
Ørsted has 25 years of global experience developing offshore wind. It has constructed 26 projects
representing 6.8 GW, approximately 29% of total global offshore wind. Ørsted has an additional 3.1 GW
under construction and 4.9 GW in development.252 *BC/
/EC* Ørsted also reports that it has conducted the first and only major offshore wind
farm decommissioning.254
Ørsted’s current U.S. portfolio includes the projects listed in Table 87.
Table 87. Ørsted Offshore Wind projects in the U.S.255
Project Capacity (MW) State Status (COD)
Block Island Wind Farm 30 Rhode Island Operating (2016)
Revolution Wind 704 Connecticut / Rhode Island
Development (2024)
South Fork Wind 130 New York Development (2022
Skipjack Wind Farm 120 Maryland Development (2023)
Coastal Virginia Offshore Wind
12 Virginia Operating (2020)
Ocean Wind 1,100 New Jersey Development (2024)
Sunrise Wind 1 880 New York Development (2024)
OW2 is scored Green for this criterion because its parent company has a clear record of performance
success in the global offshore wind market.
5.4.2 Key Personnel Offshore Wind Experience
Per N.J.A.C. 14:8‐6.5(a)(1), Applicants were required to submit information on key personnel, specifically
regarding offshore wind project development experience.256 The evaluation of personnel offshore wind
experience was based on experience in the offshore wind industry, supplemented by onshore wind and
offshore oil and gas experience. In relation to offshore wind development, offshore oil and gas E&P
experience is relevant but has been assigned less weight as described in the rating definitions in Table 88.
Table 88. Key Personnel Offshore Wind Experience Evaluation Criteria
Green Project team has significant offshore wind experience in the roles they will fill for the proposed
project.
Yellow Project team has limited offshore wind experience but significant offshore oil & gas experience
in substantially similar roles to what they will be responsible for in the proposed project.
Orange Project team has limited offshore experience of any kind.
Red Project team has no offshore experience of any kind.
252 OW2 Application, p. 1‐11. 253 OW2 Application, p. 1‐8. 254 OW2 Attachment, p. 1‐12. 255 OW2 Application Attachment 1.2. 256 Per N.J.A.C. 14:8‐6.1, a key employee is “any individual employed by the applicant in a supervisory capacity or empowered to make discretionary decisions with respect to the project.”

May 25, 2021
Public Version Page 135
Table 89 summarizes the ratings assigned to each Project in this category.
Table 89. Key Personnel Offshore Wind Experience Ratings *BC//EC*
Atlantic Shores Ocean Wind 2
C A B
Key Personnel
Offshore Wind
Experience
Green: Identified Key Employees
have significant experience in the
development of offshore wind.
Green: Identified Key Employees have
significant experience in the development of
offshore wind, and other employees have
significant experience with offshore wind
projects that are in operation.
5.4.2.1 AtlanticShores
Atlantic Shores reported that their hiring strategy has been focused on “securing team members with
experience in delivering projects of similar size and scope, in offshore wind, onshore wind and offshore
oil and gas” (Application p. 17). Atlantic Shores identified eight individuals as key employees. LAI reviewed
the qualifications for these individuals who are expected to have critical roles in project development and
construction based on the information provided in the Application, including their resumes.
Joris Veldhoven, President and Commercial and Finance Director, previously led a Shell New Energies supply chain team supporting large‐scale project development from project initiation to operations, including for five Shell onshore wind farms in the U.S. His resume indicates that he was also involved in all Shell offshore wind deals and bids in the period from 2017 to 2019.
Jennifer Daniels. Vice President and Development Director has been “actively supporting the development of US offshore wind projects since 2008” (Application p. 20). While working previously for TetraTech, she managed environmental teams supporting Bay State Wind, the Block Island Wind Farm, and the Coastal Virginia Offshore Wind Project.
Rain Byars, Vice President and Technical Director, has “experience in technically managing 4.6 GW of offshore wind projects globally during design, manufacturing, and construction phases, including leading the verification of the first offshore windfarm in the US, the Block Island Wind Farm” (Application p. 20).
Doug Copeland, Development Manager, has prior experience in leading development efforts for onshore and offshore wind, solar, and energy storage projects on behalf of EDF Renewables.
Paul Phifer, Permitting Manager, worked in environmental conservation and permitting for the US government prior to joining Atlantic Shores. His responsibilities included overseeing permitting projects related to onshore and offshore wind energy, and he has experience in assessing and permitting large‐scale infrastructure projects from the regulator’s side that will inform Atlantic Shores’ efforts in that area.
Antoine Cognard, Delivery Manager, “spearheaded the planning, construction, and commissioning of EDF Renewables’ 1.3 GW Canadian and Northeast US portfolio, including the Blackspring Ridge (300 MW) wind farm in Alberta” (Application p. 22).
Michael Garrity, New Jersey Permitting and Development, has previous experience in the siting, permitting, and licensing of electrical substations and transmission facilities in the Atlantic City Electric service territory. He also has prior experience as a Principal Environmental Specialist with NJDEP where he was responsible for reviewing and rendering decisions on large‐scale coastal projects in New Jersey.

May 25, 2021
Public Version Page 136
Julia Petit, Secretary and General Counsel, has previous experience in renewable energy project finance on behalf of independent power producers and sponsors developing utility scale wind and solar energy projects. While working for EDF Renewables, she has provided legal support for the acquisition, development, construction, financing and/or operation of over 800 MW of onshore wind projects and over 1 GW of solar projects.
ASOW is scored Green for this criterion because the Key Employees have significant experience in the
development of offshore wind.
5.4.2.2 OceanWind2
Ocean Wind 2’s Project team has “substantial experience in offshore wind project development, including
origination, permitting, interconnection, engineering, financing, procurement, construction, and
operations” (Application p. 1‐3). OW2 has identified six key employees. LAI reviewed the qualifications for
these individuals who are expected to have critical roles in project development and construction based
on the information provided in the Application, including their resumes.
Marc Reimer, Project Development Director, *BC/
EC*
Christian Bjøl, Bid Development Manager, *BC
EC*
Maddi Urbish, Head of Government Affairs and Policy for New Jersey, joined Ørsted in March 2021.257 She was previously a senior associate at River Crossing Strategy Group working in the areas of New Jersey state politics and policies, environmental protection, and stakeholder engagement. She also has prior experience working for New Jersey Audubon.258
Simon Chignell, Program Commercial Manager, *BC/ /EC*
Anthony Vachez, Technical Program Manager, *BC/
EC*
Pilar Patterson, Permitting Manager, *BC
/EC*
*BC
257 Maddi Urbish was introduced as a new member of the team at the interview, replacing Sunny Gupta. 258 Source: Press Release: Ørsted Names Madeline Urbish as Head of Government Affairs and Policy in New Jersey, https://us.orsted.com/news‐archive/2021/03/orsted‐names‐madeline‐urbish‐as‐head‐of‐government‐affairs‐and‐policy‐in‐new‐jersey.

May 25, 2021
Public Version Page 137
/EC*
OW2 is scored Green for this criterion because the Key Employees have significant experience in the
development of offshore wind, and other employees have significant experience with offshore wind
projects that are in operation.
5.5 SuppliersandLabor
5.5.1 Supplier Arrangements
Applications were evaluated to determine whether they include a reasonable plan to procure the primary
equipment and components, including the WTGs, foundations, and undersea cables, in a timeframe
necessary to meet the targeted schedule. Documentation of commitments from the manufacturer or
supplier of each component was required as part of the Application. The rating definitions listed in Table
90 are based on the commitments included in the Application. Each Project received a rating based on the
lowest rating among all three components.259
Table 90. Supplier Arrangements Evaluation Criteria
Green
Letter of intent, MOU or declaration from the manufacturer/supplier stating their ability to
manufacture and deliver all components within the targeted schedule is provided for the WTGs,
foundations, and undersea cables. Applicant has an established relationship with at least one
of the manufacturers.
Yellow
Letter of intent or similar statement from a manufacturer/supplier with an established history
of providing the components to similar projects was submitted for the WTGs, foundations and
undersea cables, but at least one does not include specific reference to the scope of supply or
targeted schedule.
Orange At least one letter of intent or similar statement was submitted from a manufacturer/supplier
that does not have an established history of providing the components to similar projects.
Red Supply plan does not include a letter of intent or similar statement from a
manufacturer/supplier for the WTGs, foundations, or undersea cables.
Table 91 summarizes the ratings assigned to each Project in this category.
259 For example, if the WTGs and foundations receive a Green rating, and the undersea cables receive a Yellow rating, the Project will receive a Yellow rating for this metric.

May 25, 2021
Public Version Page 138
Table 91. Supplier Arrangements Ratings *BC//EC*
Atlantic Shores Ocean Wind 2
C A B
Supplier
Arrangements
Green: Provided supporting
documentation from the WTG,
foundation, and cable suppliers, each
of which references being able to
meet the targeted schedule. ASOW
has an established relationship with
at least one of the suppliers.
Green: Provided supporting
documentation from the WTG,
foundation, and cable suppliers, each
of which references being able to
meet the targeted schedule. OW2 has
an established relationship with at
least one of the suppliers.
5.5.1.1 AtlanticShores
Atlantic Shores has identified suppliers for each of the major project components, but notes that its
supplier selection will continue to be refined, and that these suppliers are not yet final. *BC/
/EC* ASOW notes that “selection of a supplier for the purpose of [the] Application is
not binding upon Atlantic Shores” (Application p. 49). *BC
EC*
Atlantic Shores submitted a letter of intent from MHI Vestas Offshore Wind (“MVOW”) for the provision
of V236‐13.6 MW WTGs to the project (Appendix 2‐16). The letter includes a statement that the WTG is
expected to be IEC Type Verified by *BC/ /EC* and that MVOW is technically and financially able
to deliver all components within the targeted schedule. *BC/
EC* ASOW reports that
“Vestas also has excellent relationships with Atlantic Shores’ parent companies; EDF Renewables, for
example, has installed *BC/ /EC* of Vestas turbines globally, including *BC/ /EC* MW in
Canada and *BC/ /EC* in the US alone” (Application p.75).
Atlantic Shores provided a letter of intent from EEW American Offshore Structures Inc. to provide
monopile foundations for up to 1,204 MW of capacity from EEW’s facility to be located at the Port of
Paulsboro (Appendix 2‐5). Atlantic Shores has indicated in their Application and CQ1 responses that if
Project C *BC/ /EC* is selected they expect to be able to negotiate an agreement with EEW to
provide monopile foundations out of the Paulsboro Phase 2 facility for the full Project. However, in the
event that Atlantic Shores is not able to reach agreement with EEW to provide monopiles for the full scope
of Project C *BC/ /EC* additional monopiles may be imported from EEW’s factory in Germany
or by Bladt Industries, an alternative foundation supplier.260 Monopiles supplied by Bladt would be
260 *BC/
EC*

May 25, 2021
Public Version Page 139
manufactured in Denmark. ASOW has provided a letter of support from Bladt Industries (Appendix 2‐7).
*BC
EC*
Atlantic Shores has identified LS Cable Systems America, Inc. as the supplier of the export cables, and B.V.
Twentsche Kabelfabriek as the supplier of the inter‐array cables. Letters of support from these suppliers
that reference being able to meet the targeted schedule are provided in Appendix 2‐10 and 2‐11,
respectively.
ASOW has provided supporting documentation from the proposed WTG, foundation, and cable suppliers,
each of which references being able to meet the targeted schedule.
5.5.1.2 OceanWind2
*BC
EC* OW2 has entered into an agreement with GE that provides an option
for the Haliade‐X 14 MW, and provided a letter of support to supply WTGs consistent with the project
schedule. *BC/ /EC*
OW2 has executed a PDA with EEW to provide monopile foundations for the Project. The PDA includes a
schedule that is consistent with the offshore wind facility’s construction schedule. *BC/
/EC*
OW2 has provided letters of support from several potential cable manufacturers, including Hellenic
Cables, LS Cable and System, Nexans, Prysmian Group, and Siemens Energy. Only the LS Cable and System,
Nexans, and Prysmian Group specifically reference timely delivery to meet the schedule.
OW2 has provided supporting documentation from proposed suppliers of WTGs, foundations, and cables
referencing the ability to meet the proposed schedule.
5.5.2 EPC Contractor and Union Engagement
Applications were evaluated to determine whether they include a reasonable plan to engage construction
and operations personnel.
Table 92. EPC Contractor and Union Engagement Evaluation Criteria
Green EPC contractor is identified and a definite plan to engage organized labor is provided.
Yellow EPC contractor is identified and a preliminary plan to engage organized labor is provided.
Orange Applicant describes its process for selecting an EPC contractor and provides a preliminary plan
to engage organized labor.
Red Applicant does not describe a process for selecting an EPC contractor or does not provide a plan
to engage organized labor.
Table 93 summarizes the ratings assigned to each Project in this category.

May 25, 2021
Public Version Page 140
Table 93. EPC Contractor and Union Engagement Ratings *BC//EC*
Atlantic Shores Ocean Wind 2
C A B
EPC Contractor
and Union
Engagement
Green: Identified EPC contractor and
provided a plan for union engagement.
Green: Identified EPC contractor and
provided a plan for union engagement.
5.5.2.1 AtlanticShores
Atlantic Shores has identified *BC/ /EC* the offshore installation EPC contractor, subject to final
supplier determinations as described in Section 5.5.1.1. *BC/ /EC* is identified as
the contractor for the onshore export cable civil works. *BC/
/EC*
ASOW has executed an MOU with five New Jersey trade unions that will be involved in offshore wind,
*BC
EC* The MOU “contains provisions that Atlantic Shores and the
appropriate union parties will cooperate and collaborate to promote green economic growth and
environmental sustainability while increasing the participation of a unionized workforce in offshore
windfarm construction” (Application p. 161).
ASOW is scored Green for this criterion because it has identified the EPC contractor and provided a
definite plan for union engagement.
5.5.2.2 OceanWind2
Ocean Wind 2 will reply on Ørsted’s EPC organization to acquire the necessary equipment for staging and
deployment of major Project components and to install the Project.261 The coordination and management
of the offshore construction work will be performed under the Ørsted Project Director with dedicated
construction site staffing.
Because the EPC contractor function will be internal, Ocean Wind 2 “will be able to manage and direct its
work with unions over the life of the Project” (Application p. 8‐17). OW2 reports that Ørsted’s team has
signed an agreement with NABTU for the buildout of Ørsted’s current and future portfolio of U.S. offshore
wind projects.262
OW2 is scored Green for this criterion because it has identified the EPC contractor and provided a definite
plan for union engagement.
5.5.3 Training Programs and University Partnerships
Applications were evaluated to determine whether they include a reasonable plan to develop
construction and operations personnel.
261 OW2 Application, p. 2‐30. 262 OW2 Application, p. 8‐5.

May 25, 2021
Public Version Page 141
Table 94. Training Programs and University Partnerships Evaluation Criteria
Green Definite plan for engagement with training programs and/or university partnerships is
provided and partners are identified.
Yellow Plan is described on a preliminary basis and Applicant has begun discussion with partners.
Orange Plan is described on a preliminary basis.
Red No plan mentioned.
Table 95 summarizes the ratings assigned to each Project in this category.
Table 95. Training Programs and University Partnerships Ratings *BC//EC*
Atlantic Shores Ocean Wind 2
C A B
Training
Programs and
University
Partnerships
Green: ASOW has identified specific
partners and funding commitments.
Green: OW2 has identified specific
partners and funding commitments.
5.5.3.1 AtlanticShores
For Projects *BC/ /EC* C, *BC/ /EC* Atlantic Shores will commit $10 million and long‐term
engagement to establish and support the New Jersey WIND Institute. ASOW has also partnered with
Rowan College at Burlington County’s Workforce Development Institute to provide $400,000 in
scholarships for students enrolling in four programs: the Energy Industry Fundamentals Program, the
Supply Chain, Transportation, Logistics, and Distribution Program, the Manufacturing Machinist Program,
and the Industrial Maintenance Program Atlantic Shores has developed agreements with the Rutgers
Future Scholars Program and the Atlantic City Boys and Girls Club to fund programming around pre‐college
workforce training initiatives.
ASOW is scored Green for this criterion because it has identified specific partners and funding
commitments.
5.5.3.2 OceanWind2
Ocean Wind 2 will support the WIND Institute with $2 million in funding from the Project. Ørsted will also
work with NABTU to develop an apprentice training program. OW2 reports that it has also decided to
allocate $1.5 million from the Pro‐New Jersey Grantor Trust 2 to a 10‐year scholarship opportunity
program in collaboration with the New Jersey Institute of Technology.
OW2 is scored Green for this criterion because it has identified specific partners and funding
commitments.

May 25, 2021
Public Version Page 142
5.6 FinancialStrengthandFinancingPlan
5.6.1 Ownership and Financial Strength
Ownership defines the Projects’ owners during development, accounting for 100% ownership interest in
the Project entity.263 Ratings were assigned as defined in Table 96 based on the owner’s commitment to
pursue development and construction under the Board’s commercial structure whereby the Project
receives payment only for generation delivered to the POI. This take‐if‐tendered structure leaves all
production and transmission delivery risk with seller, thereby requiring the Project’s owners to commit
capital and expertise to address development, construction, and operational risk. Financial strength
reflects the financial capability of the Project’s owners to raise all required funds for the Project without
subjecting the owner(s) to financial stress, subject to satisfaction that the Applicant’s balance sheet
strength is adequate to support the requisite financial guarantees to third‐party financing. Thus, it is a
function of the parent company size (revenues and assets), profitability (net income), funding capability
(cash, cash equivalents, and market valuation), and ability to raise debt (debt‐to‐capitalization and credit
rating). The financial strength of the Applicant was assessed in the broader context of the parent
company’s debt to equity ratio, long term credit rating, and market valuation, among other relevant
financial metrics.
Table 96. Ownership and Financial Strength Evaluation Criteria
Green Financial entities responsible for capital formation for the project have made significant
corporate commitments to the Project and are profitable with large and strong balance sheets.
Yellow The financial entities have made restricted corporate commitments to the Project or have
financial challenges and limited balance sheet strength.
Orange The financial entities have made weak commitments to the Project or have serious financial
weaknesses, such as a material ratings reduction or credit impairment.
Red Ownership is incompletely defined, or the entities have provided inadequate financial
information or have not explained how credit will be restored to investment quality.
Table 97 summarizes the ratings assigned to each Project in this category.
Table 97. Ownership and Financial Strength Ratings *BC//EC*
Atlantic Shores Ocean Wind 2
C A B
Ownership and
Financial
Strength
Green: Atlantic Shores should be able
to finance its Project based on the
financial strength of its ultimate
parent companies, and receipt of a
binding Order from the Board.
Green: Ørsted has a solid history of
financing offshore wind projects and
should be able to finance Ocean Wind 2
based on its financial strength and receipt
of a binding Order from the Board.
5.6.1.1 AtlanticShores
The Atlantic Shores application was submitted by Atlantic Shores Offshore Wind Project 1, LLC, a special
purpose entity comprised of a single member, Atlantic Shores Offshore Wind LLC. Atlantic Shores Offshore
263 Later investors, e.g., tax equity, may acquire equity interests.

May 25, 2021
Public Version Page 143
Wind LLC is a JV between EDF‐RE Offshore Development, LLC and Shell New Energies (collectively “the
Parents”).
EDFR Offshore is an indirect 100% subsidiary of EDF Renewables , a 100% subsidiary of EDF Renouvelables
SA, which itself is an indirect 100% subsidiary of Électricité de France S.A. (“EDF”), a global energy company
with nuclear, renewable, and other generation assets. EDF Renewables, Inc. has a strong presence in
North America with ownership, O&M, and third‐party O&M services. As of September 30, 2020, the
Government of France owned 83.7% of EDF, institutional shareholders 12.8%, individual shareholders
2.1%, employees 1.3%, and treasury shares were under 0.1%. LAI notes that partial ownership by a foreign
sovereign does not weaken EDF’s financing capability and it may enhance it.
Shell New Energies is an indirect 100% subsidiary of Royal Dutch Shell (“Shell”), a global oil & gas
exploration, development, production, refining, and marketing company with a growing portfolio of
renewable energy projects. Shell is a 50% owner in one operating offshore wind project and has interests
in a few other offshore wind projects and numerous onshore wind projects. Shell’s largest shareholders
are institutional investors.
*BC
/EC*
Atlantic Shores provided 2019 EOY financial statements for Atlantic Shores, EDF Renewables, and Shell Oil
Company (a 100% indirectly‐owned subsidiary of Shell). *BC
/EC*
EDF Renewables had negative net income of $(82.2) million, total assets of $5.7 billion, and a 94%/6%
debt/equity ratio as of year‐end 2019. Such thin capitalization is normal for project development. LAI
reviewed EDF’s 2019 financial statement. EDF had positive net income of income of €5.2 billion, total
assets of €303.3 billion, and a high 78%‐22% debt/equity ratio. EDF has investment‐grade long‐term credit
ratings of A3 (with negative outlook) by Moody’s, BBB+ by S&P, and A‐ by Fitch. EDF continues to
experience financial difficulties from the ongoing nuclear repair and completion work at the Flamanville
3 (one unit delayed until 2022) and Hinkley Point C (two units delayed until 2026). Two similar nuclear
units at Taishan China commenced commercial operation in December 2018 and September 2019.
Shell Oil Company had negative net income of $(208) million, total assets of $92.8 billion, and a 40%/60%
debt/equity ratio as of year‐end 2019. In order to get a better picture of Shell New Energies’ ultimate
source of financing, LAI reviewed the 2019 financial statement of Shell. Shell had net income of $25.5
billion, total assets of $404.3 billion, and close to a 42%‐58% debt/equity ratio as of year‐end 2019. Shell
has investment‐grade long‐term credit ratings of AA‐ (with negative outlook) from S&P and Aa2 (with
negative outlook) from Moody’s.
Atlantic Shores is scored Green for this criterion because it should be able to finance its project based on
the financial strength of its ultimate parent companies, and receipt of a binding Order from the Board.

May 25, 2021
Public Version Page 144
5.6.1.2 OceanWind2
The Ocean Wind 2 application was submitted by Ocean Wind II, LLC, a direct 100% subsidiary of Ørsted
Offshore North America, Inc. and an indirect 100% subsidiary of Ørsted, the ultimate parent. Ørsted was
created when DONG Energy divested its oil and gas assets in 2017 to focus on renewable energy. Ørsted
continues to be a leading global developer of offshore wind projects. Ørsted is 50.1% owned by the
Government of Denmark and 5% owned by SEAS‐NVE (Denmark’s second‐largest cooperatively‐owned
energy company).264 LAI notes that partial ownership by a foreign sovereign does not weaken EDF’s
financing capability and it may enhance it.
According to Ocean Wind 2’s Application, Ørsted has successfully financed and has equity interests in 24
offshore wind partnerships around the world. One of them is the Block Island Wind Farm, which was
financed by Deepwater Wind and later acquired by Ørsted. Construction has not commenced on Ørsted’s
other U.S. offshore wind projects, which have not yet been financed. Ocean Wind 2 highlighted Hornsea
1, a 1,218 MW offshore wind project 120 km (about 75 miles) off the English coast that Ørsted completed
in early 2020. “Hornsea 1 is the largest single‐project financing to date in the global renewable energy
sector, which was structured and led by Ørsted” (Application p. 5‐3).
Ørsted provided hyperlinks to its 2019 and 2018 annual reports. Ørsted had net income of DKK 7.2 billion
($1.2 billion), total assets of DKK 192.9 billion ($31.4 billion), and 42%/58% debt/equity ratio as of year‐
end 2019.265 Ørsted has investment‐grade long‐term credit ratings of BBB+ from S&P, Baa1 from Moody’s,
and BBB+ from Fitch, all with stable outlooks.
OW2 is scored Green for this criterion because Ørsted has a solid history of financing offshore wind
projects and should be able to finance Ocean Wind 2 based on its financial strength and receipt of a
binding Order from the Board.
5.6.2 Financing Plan
The Applicant’s financing plans, required by rules at N.J.A.C. 14:8‐6.5(a)(4)(iv), were evaluated based on
the reasonableness and completeness of each plan proposed by the Project’s owners. Offshore wind
projects can and have been financed on‐balance sheet, i.e., with project debt and equity funding provided
by the parent, or at the project level with third‐party construction debt, tax equity, and permanent
operating period debt (also referred to as back‐leverage). In either case, LAI determined whether the
Applicant fully considered the potential availability of the ITC for Projects that meet IRS qualification
requirements to offset federal income taxes or to facilitate a tax equity investment.
Table 98. Financing Plan Evaluation Criteria
Green Realistic financing plan clearly specifies the source of equity / debt funds and addresses the
potential of qualifying for the ITC, if available.
Yellow Financing plan fails to fully specify funding sources or address qualifying for ITC, if available.
Orange Financing plan is unrealistic.
Red Financing plan is incomplete or does not demonstrate access to global debt and equity
markets in light of credit impairment.
264 In addition to its cooperative power activities, SEAS‐NVE purchased Ørsted’s Danish power distribution, residential customer, and City Light businesses in late 2019. 265 These values utilize a DKK to US$ exchange rate of 0.16 and may not exactly match the values in the Ocean Wind 2 Application.

May 25, 2021
Public Version Page 145
Table 99 summarizes the ratings assigned to each Project in this category.
Table 99. Financing Plan Ratings *BC//EC*
Atlantic Shores Ocean Wind 2
C A B
Financing
Plan
Green: The plan to finance Atlantic
Shores utilizing the balance sheets of
EDF and Shell is reasonable and
should be achievable.
Green: Ocean Wind 2’s plan to utilize its
balance sheet and pre‐structured
partnership arrangement to finance the
Project is reasonable and should be
achievable.
5.6.2.1 AtlanticShores
According to Section 5.2 of the Application, the parent companies intend to finance Atlantic Shores on‐
balance sheet based on their considerable financial size and strength. *BC/
/EC* The Application did not specifically address securing funding
through the New Jersey Economic Development Authority or utilizing New Jersey’s Offshore Wind
Economic Development Tax Credit Program.
*BC/
266 *BC/
EC*

May 25, 2021
Public Version Page 146
/EC* In addition to project equity
to be provided by the parent companies, letters of support from six international banks expressing interest
in financing the project were provided in Appendices 5‐2 through 5‐7, including *BC/
/EC*
ASOW is scored Green for this criterion because its plan to finance Atlantic Shores utilizing the balance
sheets of EDF and Shell is reasonable and should be achievable.
5.6.2.2 OceanWind2
Ørsted intends to finance Ocean Wind 2 using a structure it has utilized for virtually all previous projects.
Ørsted will fund 100% of the construction costs from its parent company balance sheet and arrange to
sell a 50% equity interest in the completed project via a pre‐structured partnership arrangement just prior
to commercial operation. *BC/
/EC*
Ørsted retains financing flexibility to take advantage of changing market conditions. For example, Ørsted
has issued green hybrid capital securities and green senior bonds totaling about $2.5 billion. Based on the
information provided in the Application, Ørsted has demonstrated its ability to finance construction of
Ocean Wind 2.
Ørsted did not provide letters of support from potential equity investors or lenders because it intends to
provide the necessary construction period capital. Moreover, it is self‐guaranteeing Ocean Wind 2’s
financing. External financing is not anticipated to enable successful project development and
construction. Ørsted did not address financing Ocean Wind 2 through the New Jersey Economic
Development Authority. If Ørsted pursues alternative financing options with outside investors, it may hire
external advisors. No names of financial or legal advisors were provided.
Ocean Wind 2 committed to “working with the NJBPU on determining the best approach to passing the
net benefit (i.e., the gross benefit arising from such newly implemented Tax Incentive less all costs and
negative impacts on the Project’s economics” following the reinstatement of the ITC for offshore wind
(Application p. 6‐1). *BC/
/EC*
OW2 addressed New Jersey’s Offshore Wind Economic Development Tax Credit Program that can grant
tax credits for offshore wind developers who (i) invest at least $50 million and (ii) employ at least 300
new, full‐time employees. Ocean Wind 2 does not anticipate fulfilling the employment requirement.
OW2 is scored green for this criterion because its plan to utilize its balance sheet and pre‐structured
partnership arrangement to finance the Project is reasonable and should be achievable.
5.7 DefaultRisk
While the metrics in the above sections contribute to an overall assessment of default risk, this metric
specifically addresses potential Project default risks, if any, that have not been assessed in other metrics.

May 25, 2021
Public Version Page 147
Table 100. Other Project Default Risk Factors Evaluation Criteria
Green No risk factors identified.
Yellow Mitigable risk factors identified.
Orange Potentially unmitigable risk factors identified.
Red Unmitigable risk factors identified.
Table 101 summarizes the ratings assigned to each Project in this category. No default risks have been
identified for either Project beyond those discussed in the prior categories.
Table 101. Other Project Default Risk Factors Ratings *BC//EC*
Atlantic Shores Ocean Wind 2
C A B
Default Risk Green: No additional default risk factors
identified.
Green: No additional default risk
factors identified.
5.8 SummaryofQualitativeScoring
A weighting factor is assigned to each of the qualitative metrics, as shown in Table 65.
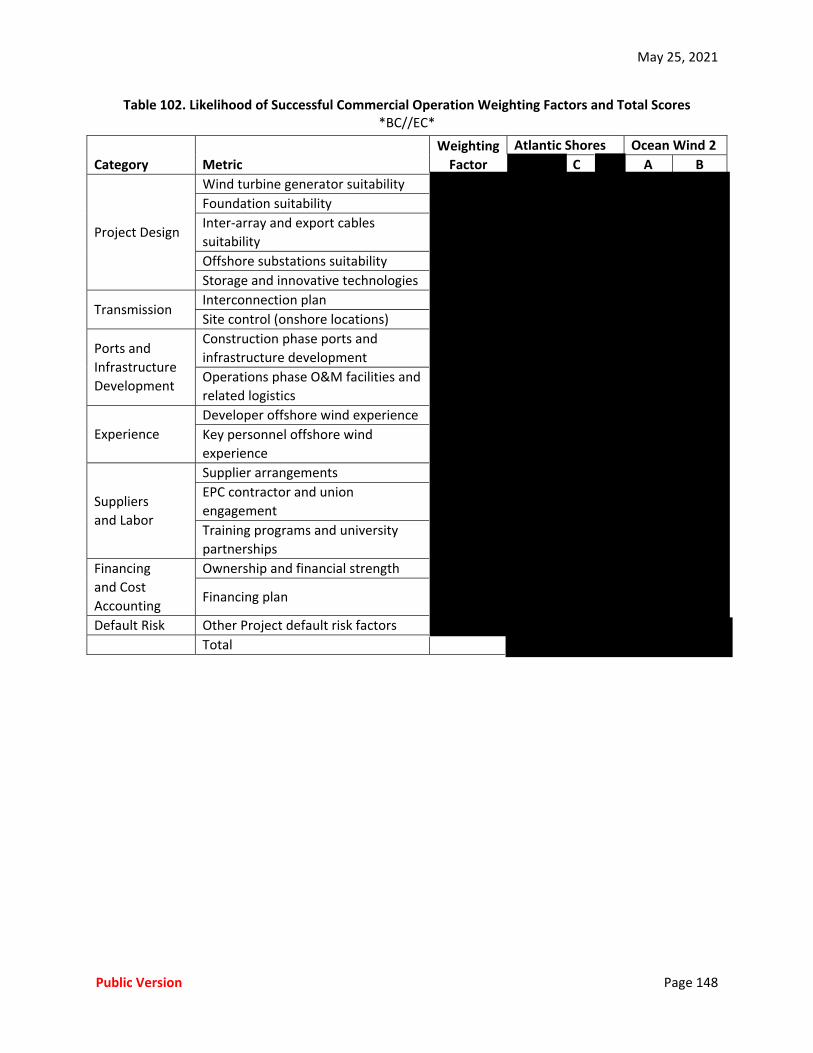
May 25, 2021
Public Version Page 148
Table 102. Likelihood of Successful Commercial Operation Weighting Factors and Total Scores *BC//EC*
Category Metric
Weighting
Factor
Atlantic Shores Ocean Wind 2
C A B
Project Design
Wind turbine generator suitability
Foundation suitability
Inter‐array and export cables
suitability
Offshore substations suitability
Storage and innovative technologies
Transmission Interconnection plan
Site control (onshore locations)
Ports and
Infrastructure
Development
Construction phase ports and
infrastructure development
Operations phase O&M facilities and
related logistics
Experience
Developer offshore wind experience
Key personnel offshore wind
experience
Suppliers
and Labor
Supplier arrangements
EPC contractor and union
engagement
Training programs and university
partnerships
Financing
and Cost
Accounting
Ownership and financial strength
Financing plan
Default Risk Other Project default risk factors
Total

May 25, 2021
Public Version Page 149
6 COST‐BENEFITANALYSIS
The cost‐benefit analysis (“CBA”) represents a consolidation of the quantitative economic components of
the evaluation, including OREC Purchase Price, ratepayer impact offsets, in‐State economic development
effects, and environmental impacts.267 Each Applicant submitted a CBA as part of the Application as
required by N.J.A.C. 14:8‐6.5(a)(11). LAI conducted an independent CBA to ensure that Projects are
compared on a consistent basis. Content provided by the Applicants helped inform LAI’s independent
CBA. LAI’s values differ significantly, however. The calculations described in this section were conducted
based on LAI’s independent CBA method and data. The individual components that were included in LAI’s
CBA are shown in Table 103.
Table 103. CBA Components
Category Component
OREC Costs OREC Purchase Price TSUC Price Adder
Ratepayer Impact Offsets Value of energy revenue credit Value of capacity revenue credit Value of ancillary services revenue credit Value of avoided REC purchases Value of change in retail electric rates268
Environmental Impacts Value of net avoided CO2 emissions Value of net avoided NOx emissions Value of net avoided SO2 emissions Value of net avoided PM2.5 emissions Ecosystem Enhancement Value269
Economic Impacts Value of development phase spending Value of construction phase spending Value of operation phase spending
OREC Costs include all costs associated with OREC purchases over the 20‐year OREC term and Buyer’s
share of TSUC.
267 Local secondary economic impacts refer here to the direct, indirect, and induced economic effects in New Jersey resulting from project expenditures that benefit New Jersey workers, businesses, government, and community economic and environmental justice organizations. Secondary effects only have additional economic value to the extent that local labor and business establishment resources would otherwise be under‐employed or under‐utilized. Secondary economic impacts may also include economic justice or equity distributional considerations. 268 The relationship between retail electric rates and impact on the diverse economic sectors in New Jersey is subject to much uncertainty. Considering this uncertainty, the change in the retail electric rates component is assigned zero value in the CBA. 269 The term “Ecosystem Enhancement Value” is used to represent impacts and benefits to environmental media and resources other than air emissions. Ecosystem resources are “natural capital” which provide long‐term benefits to society in terms of both goods (i.e., timber, fish, and minerals) and services (i.e., flood control, carbon storage, and ecotourism). Published in 2007, NJDEP studied the economic values of the State’s diverse natural resources. For purposes of offshore wind evaluation in this second procurement round, NJDEP and LAI agreed that it is not feasible to rely on this study to derive the Ecosystem Enhancement Value. This component therefore has a value of zero in the CBA.

May 25, 2021
Public Version Page 150
Ratepayer impact offsets will include the Applicant’s expected revenues from the sale of energy, capacity,
and any ancillary services that are credited to ratepayers, as well as the avoided cost of New Jersey Class
I RECs over the 20‐year OREC term. These calculations are described in Section 2. As described in Appendix
A, the Aurora simulation model was used to forecast wholesale energy prices assuming the full 7,500 MW
offshore wind buildout by 2035 in the Offshore Wind case.
The calculation of local secondary economic impacts is described in Section 2.4. Only the aggregate, macro
quantitative effects resulting from the IMPLAN regional economic model are included in the CBA.
Economic justice considerations are deferred to the post‐scoring decision‐making. Apart from harbor and
ports‐related expenditures in New Jersey that will be included in the model‐based projection of local
economic impacts contribution to the CBA score, other policy‐based preferences for Applicants proposing
to develop or utilize New Jersey harbor and port facilities during the construction and operation phases
may be considered during the post‐scoring decision‐making.
The calculation of environmental impacts is described in Section 4.1. Only the quantitative component,
which represents the monetization of net avoided emissions, is included in the CBA. N.J.A.C. 14:8‐
6.5(a)(11)(xiv) requires that the CBA include “an analysis of the anticipated environmental benefits and
environmental impacts” and that “the comparative environmental impacts shall be monetized, to the
extent possible.” A “but‐for” test performed in Aurora includes the 1,100 MW Ocean Wind 1 project in
the No New Offshore Wind case. This but‐for test is the basis for the estimation of emissions displaced by
incremental offshore wind.
Net benefits in the CBA were calculated as the present value of the net OREC costs over the 20‐year OREC
term using LAI’s market price forecasts, local secondary economic impacts, and emissions impacts over a
30‐year operation period.270
𝑁𝑒𝑡 𝐵𝑒𝑛𝑒𝑓𝑖𝑡𝑠 𝑅𝑎𝑡𝑒𝑝𝑎𝑦𝑒𝑟 𝐼𝑚𝑝𝑎𝑐𝑡 𝑂𝑓𝑓𝑠𝑒𝑡𝑠 𝑂𝑅𝐸𝐶 𝐶𝑜𝑠𝑡𝑠 𝐸𝑐𝑜𝑛𝑜𝑚𝑖𝑐 𝐼𝑚𝑝𝑎𝑐𝑡𝑠 𝐸𝑛𝑣𝑖𝑟𝑜𝑛𝑚𝑒𝑛𝑡𝑎𝑙 𝐼𝑚𝑝𝑎𝑐𝑡𝑠
The benefit‐cost ratio is calculated as the sum of ratepayer impact offsets over the 20‐year OREC term,
economic impacts over a 30‐year operation period, and environmental impacts over a 30‐year operation
period. The sum of these benefits is divided by the OREC costs over the 20‐year OREC term. The present
value of all costs and benefits was used in computing the ratio.
𝐵𝑒𝑛𝑒𝑓𝑖𝑡–𝐶𝑜𝑠𝑡 𝑅𝑎𝑡𝑖𝑜𝑅𝑎𝑡𝑒𝑝𝑎𝑦𝑒𝑟 𝐼𝑚𝑝𝑎𝑐𝑡 𝑂𝑓𝑓𝑠𝑒𝑡𝑠 𝐸𝑐𝑜𝑛𝑜𝑚𝑖𝑐 𝐼𝑚𝑝𝑎𝑐𝑡𝑠 𝐸𝑛𝑣𝑖𝑟𝑜𝑛𝑚𝑒𝑛𝑡𝑎𝑙 𝐼𝑚𝑝𝑎𝑐𝑡𝑠
𝑂𝑅𝐸𝐶 𝐶𝑜𝑠𝑡𝑠
Because the CBA is a consolidation of the other evaluation criteria, it does not contribute to the ranking
of Projects, which is discussed in Section 7. In order to be selected as a Qualified Offshore Wind Project,
a Project must have a benefit‐cost ratio greater than one, representing a positive net benefit.
Table 104 summarizes the expected benefits and costs of each of the Project options as sole awards. These
values include certain LAI adjustments to foster consistency between Applicants as described in the
previous sections. With one exception, they do not further discount any of the expected benefits for the
credibility or firmness of the information provided by the Applicant. The exception pertains to economic
development benefits.
270 A standard 30‐year expected operational life is used for all Projects for purposes of the CBA.

May 25, 2021
Public Version Page 151
For economic development benefits, the values represent expected New Jersey GDP growth effects,
discounted for the strength of the guarantees on expected direct in‐State expenditures and for the
uncertainty and upward bias of the prediction of indirect and induced GDP growth effects. For example,
ASOW provides firm guarantees on 100% of its expected in‐State expenditures prior to COD and 100% of
its expected permanent jobs during the first 20 years of operation, while OW2 has a conditional guarantee
related to NJWP parcel leasing for a variable portion of its expected in‐State expenditures from the OREC
award date through the first three years of operation, and no cost penalty for failure to meet its direct
jobs guarantee. All Projects demonstrate positive net benefits and are thus eligible for selection.
Table 104. Expected Cost‐Benefit Analysis Comparison (NPV MM 2020 $)
*BC//EC*
Applicant Project Ratepayer Benefits
Environmental Benefits
Economic Benefits
OREC Costs
Net Benefits
B/C Ratio
ASOW ASOW ASOW C 1.246 ASOW OW2 A 1.375 OW2 B 1.363
The relative contributions of each component are illustrated in Figure 27. *BC/
/*EC would still have positive net benefits even if no weight is given to the economic benefits.

May 25, 2021
Public Version Page 152
Figure 27. Project Benefit‐to‐Cost Ratios *BC//EC*

May 25, 2021
Public Version Page 153
7 PROJECTRANKING
Projects were awarded points (up to the listed maximum) within each of the four scored categories based
on the analysis described in the previous sections:
OREC Purchase Price and Ratepayer Impacts (Section 2): 50 points o Quantitative LNOC analysis
Economic Impacts and Strength of Guarantees for Economic Impacts (Section 3): 20 points o Quantitative economic benefits analysis
Environmental and Fisheries Impacts (Section 4): 20 points o Qualitative review of environmental and fisheries considerations
Likelihood of Successful Commercial Operation (Section 5): 10 points o Qualitative review of project design and development considerations
The points awarded to each Project were summed across the four categories and ranked in descending
order.
7.1 ORECPurchasePriceandRatepayerImpacts
In this category, the Project with the lowest LNOC was awarded 50 points. Projects with higher LNOCs
received points based on a linear scaling between the lowest LNOC and *BC/
/EC* which represents the value receiving zero points.271 LNOCs and category points are shown in
Table 105 and the scores are illustrated in Figure 28.
This category has the largest point spread between the highest‐ and lowest‐scoring Projects. This is in part
explained by the specific “yardstick” used to allocate points to Projects. Had a different “yardstick” been
used for the assignment of points, the resultant Project scores would have been more tightly distributed,
but the relative ranking would not change.
Table 105. OREC Purchase Price and Ratepayer Impacts Scores *BC//EC*
Atlantic Shores Ocean Wind 2
C A B
LNOC (Nominal $/MWh) $58.81 $40.75 $42.30
Points
271 This linear scaling approach was designed to introduce a spread among the price scores, while not penalizing higher‐priced projects in the event of LNOC compression.

May 25, 2021
Public Version Page 154
Figure 28. OREC Purchase Price and Ratepayer Impacts Scores *BC//EC*
7.2 EconomicImpactsandStrengthofGuaranteesforEconomicImpacts
In this category, the Project with the highest unitized economic impacts was awarded 20 points. Projects
with lower unitized economic impacts received points based on a linear scaling between the highest
unitized economic impacts and zero. Levelized economic impacts and category points are shown in Table
106 and the scores are illustrated in Figure 29.
Table 106. Economic Impacts and Strength of Guarantees for Economic Impacts Scores *BC//EC*
Atlantic Shores Ocean Wind 2
C A B
Levelized Economic Impacts
(2020 $/MWh)
Points

May 25, 2021
Public Version Page 155
Figure 29. Economic Impacts and Strength of Guarantees Scores *BC//EC*
7.3 EnvironmentalandFisheriesImpacts
In this category, the Project with the highest raw score for environmental and fisheries impacts based on
the qualitative metrics was awarded 20 points. Projects with lower raw scores received points based on a
linear scaling between the highest raw score and zero. Raw scores and category points are shown in Table
107 and the scores are illustrated in Figure 30.
Table 107. Environmental and Fisheries Impacts Scores *BC//EC*
Atlantic Shores Ocean Wind 2
C A B
Raw Score
Points

May 25, 2021
Public Version Page 156
Figure 30. Environmental and Fisheries Impacts Scores *BC//EC*
7.4 LikelihoodofSuccessfulCommercialOperation
In this category, the Project with the highest raw score for likelihood of successful commercial operation
based on the qualitative metrics was awarded 10 points. Projects with lower raw scores received points
based on a linear scaling between the highest raw score and zero. Raw scores and category points are
shown in Table 108 and the scores are illustrated in Figure 31.
Table 108. Likelihood of Successful Commercial Operation Scores *BC//EC*
Atlantic Shores Ocean Wind 2
C A B
Raw Score
Points

May 25, 2021
Public Version Page 157
Figure 31. Likelihood of Successful Commercial Operation Scores *BC//EC*
7.5 ConsolidatedScores
The total points awarded to each Project are shown in Figure 32. Quantification of Project scores provides useful data on the overall relative Project merit reflecting the four categories that have been explicitly weighted in the evaluation of all Projects. While the Project scores should not be misconstrued as governing the selection process, they do signify overall comparative merit in regard to price, economic benefits, environmental and fisheries impacts, and the likelihood of commercial success.
Based on the metrics for assigning points that were described in the previous sections, *BC/
/EC*

May 25, 2021
Public Version Page 158
Figure 32. Project Scores *BC//EC*
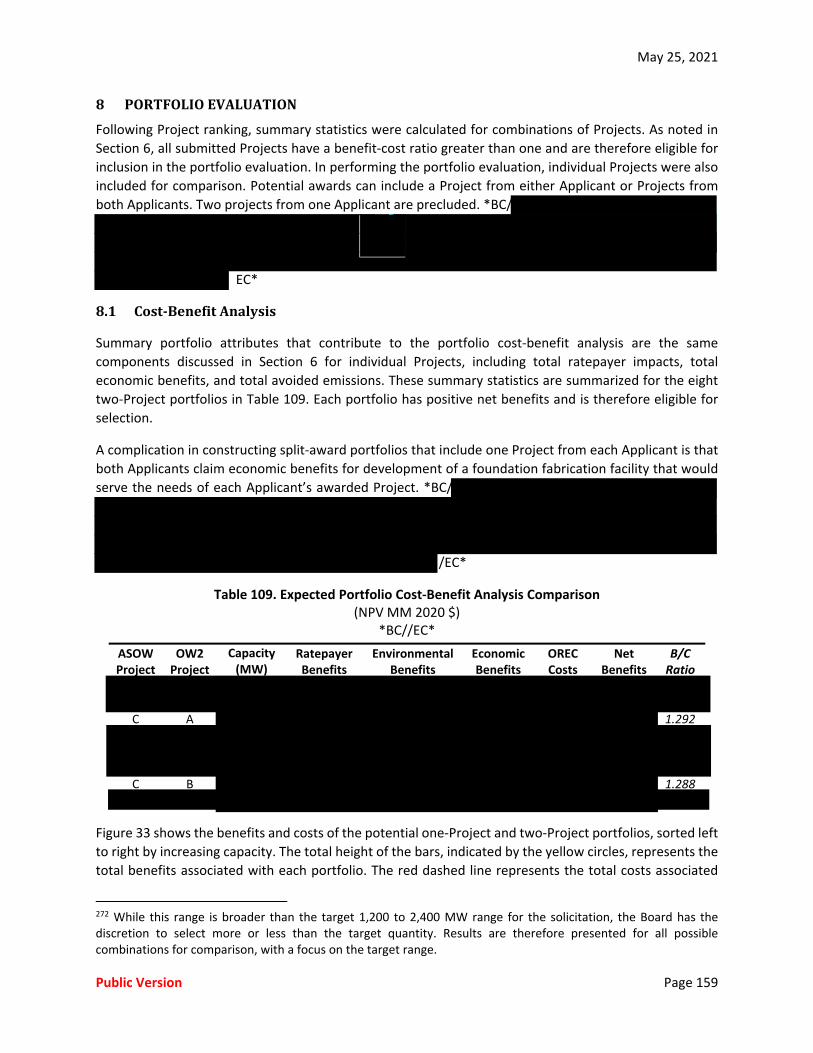
May 25, 2021
Public Version Page 159
8 PORTFOLIOEVALUATION
Following Project ranking, summary statistics were calculated for combinations of Projects. As noted in
Section 6, all submitted Projects have a benefit‐cost ratio greater than one and are therefore eligible for
inclusion in the portfolio evaluation. In performing the portfolio evaluation, individual Projects were also
included for comparison. Potential awards can include a Project from either Applicant or Projects from
both Applicants. Two projects from one Applicant are precluded. *BC/
EC*
8.1 Cost‐BenefitAnalysis
Summary portfolio attributes that contribute to the portfolio cost‐benefit analysis are the same
components discussed in Section 6 for individual Projects, including total ratepayer impacts, total
economic benefits, and total avoided emissions. These summary statistics are summarized for the eight
two‐Project portfolios in Table 109. Each portfolio has positive net benefits and is therefore eligible for
selection.
A complication in constructing split‐award portfolios that include one Project from each Applicant is that
both Applicants claim economic benefits for development of a foundation fabrication facility that would
serve the needs of each Applicant’s awarded Project. *BC/
/EC*
Table 109. Expected Portfolio Cost‐Benefit Analysis Comparison (NPV MM 2020 $)
*BC//EC*
ASOW Project
OW2 Project
Capacity (MW)
Ratepayer Benefits
Environmental Benefits
Economic Benefits
OREC Costs
Net Benefits
B/C Ratio
C A 1.292
C B 1.288
Figure 33 shows the benefits and costs of the potential one‐Project and two‐Project portfolios, sorted left
to right by increasing capacity. The total height of the bars, indicated by the yellow circles, represents the
total benefits associated with each portfolio. The red dashed line represents the total costs associated
272 While this range is broader than the target 1,200 to 2,400 MW range for the solicitation, the Board has the discretion to select more or less than the target quantity. Results are therefore presented for all possible combinations for comparison, with a focus on the target range.

May 25, 2021
Public Version Page 160
with each portfolio. In all cases, as noted above, the total benefits are greater than the total costs, with
both benefits and costs generally increasing with capacity. Net benefits, shown by the dashed purple line
closest to the x‐axis, also generally increase with capacity, *BC
/EC* The magnitude of the net benefit, the purple dashed line, relative to the direct cost borne by
ratepayers, the red‐dashed line, is a useful metric regarding ratepayer capital at‐risk.
Figure 33. Portfolio Benefit and Cost Present Value *BC//EC*
Figure 34 shows the benefit‐cost ratios for the two‐Project portfolios relative to the individual Projects,
again sorted by total capacity. For each two‐Project portfolio, the benefit‐cost ratio is between the ratios
for the corresponding single Projects. For example, *BC/
/EC*

May 25, 2021
Public Version Page 161
Figure 34. Portfolio Benefit‐Cost Ratios *BC//EC*
Figure 35 shows the incremental present value of the component benefits and costs associated with
portfolios relative to *BC/ /EC* For purposes of this figure,
the two‐Project portfolios include *BC/
/EC*

May 25, 2021
Public Version Page 162
Figure 35. Incremental Benefits and Costs of Portfolios Relative to *BC/ /EC* *BC//EC*
8.2 PreliminaryPortfolioEvaluationwithAggregateProjectScores
Using the same valuation weights as for the individual Project scoring, LAI evaluated the same set of
numerical criteria and attributes for each eligible two‐Project portfolio. This was done by using simple
linear aggregation rules of additivity or proportionality, depending on the criterion. The OREC Purchase
Price and Ratepayer Impacts scores are based on the delivered energy‐weighted average of the LNOCs for
the component Projects. The Economic Impacts and Strength of Guarantees for Economic Impacts are the
total levelized economic impacts, adjusted to avoid double‐counting where appropriate, as discussed in
Section 8.1, unitized on a per MWh basis. Environmental and fisheries impacts and likelihood of successful
commercial operation for the two‐Project portfolio values are the capacity‐weighted average of the
attribute points for the individual component Projects. These aggregation rules are designed to maintain
the same relative weights across the criteria for a portfolio as for an individual Project. For one‐Project
portfolios, the Project and portfolio scores are identical.
To have project and portfolio scores adhere closely to the 50:20:20:10 criteria weights across the four
categories, each criterion’s metric was converted into a score. The scoring metric expressed in either
dollars or points is based on each Project’s or portfolio’s value relative to the best realized value across all
projects and portfolios using the same methodology described in Section 7. Essentially, this applies the
same multi‐objective optimization model approach that was used for individual Project scoring to

May 25, 2021
Public Version Page 163
portfolio evaluation. The scores for all individual Projects and two‐Project portfolios that have a BCR
greater than one are shown in Figure 36, again sorted left‐to‐right by increasing capacity.*BC/
/EC*
Figure 36. Portfolio Scores *BC//EC*
Figure 37 illustrates the scores relative to capacity. The green line shows the scoring frontier, connecting
the highest scores at each capacity level.

May 25, 2021
Public Version Page 164
Figure 37. Project and Portfolio Scores Relative to Capacity *BC//EC*
Figure 38 and Figure 39 similarly show the efficient frontiers for PVNOC (total expected net spending) and
LNOC (expected net spending per OREC), respectively, relative to total capacity. For these charts, lower
prices are preferred, so the efficiency frontier is represented by the lowest values – as compared to Figure
37 where the highest scores are preferred. These figures represent only information relevant to the OREC
Purchase Price and Ratepayer Impacts category. They do not incorporate other considerations central to
the evaluation regarding economic benefits, environmental impacts, or likelihood of successful
commercial operation.

May 25, 2021
Public Version Page 165
Figure 38. PVNOC Relative to Capacity *BC//EC*
Figure 39. LNOC Relative to Capacity *BC//EC*

May 25, 2021
Public Version Page 166
Further comparisons of the OREC Purchase Price and Ratepayer Impacts among the portfolios are shown
in the following series of figures. Figure 40 and Figure 41 show PVOPP vs. PVNOC and LOPP vs. LNOC,
respectively, for the portfolios in increasing capacity order. In these figures, the blue bars represent the
total spend and per‐OREC spend based on the Applicants’ pricing plus the TSUCPA. The red bars represent
the total spend and per‐OREC spend after reducing the value of the blue bar to account for LAI’s estimated
revenue offsets for energy, capacity, and avoided REC costs.
Figure 40. Total Spend Comparison by Portfolio *BC//EC*

May 25, 2021
Public Version Page 167
Figure 41. Unit OREC Cost Comparison by Portfolio *BC//EC*
Figure 42 and Figure 43 show the same data sets calibrated relative to *BC/ /EC* the highest
scoring option. Positive values represent portfolios with higher costs than *BC/ /EC* and negative
values represent portfolios with lower costs than *BC/ /EC* The blue bars again show the
Applicants’ pricing, and the red bars reflect the Applicants’ pricing less revenue offsets. The unit OREC
cost comparison is levelized over the 20‐year OREC term in nominal dollars.

May 25, 2021
Public Version Page 168
Figure 42. Total Spend Comparison by Portfolio Relative to *BC/ /EC* *BC//EC*
Figure 43. Unit OREC Cost Comparison by Portfolio Relative to *BC/ /EC* *BC//EC*

May 25, 2021
Public Version Page 169
The retail rate impacts associated with each portfolio are shown in Figure 44. Retail rate impact is directly
proportional to PVNOC. It is driven primarily by portfolio capacity, and to a lesser extent by OREC price.
Figure 44. Retail Rate Impact by Portfolio – All NJ EDC Load *BC//EC*
The impact on a typical residential electric customer monthly bill is based on an average usage of 662 kWh
per month and is also proportional to PVNOC. This is shown for each portfolio in Figure 45.

May 25, 2021
Public Version Page 170
Figure 45. NJ Residential Electric Bill Impact by Portfolio *BC//EC*
8.3 FinalPortfolioEvaluationwithAdditionalDiversificationCriteria
Portfolio diversification considerations were not part of the quantitative scoring and ranking procedures
described above. Therefore, portfolio diversity and composition considerations are addressed in
qualitative terms.
Potential award portfolios that include Projects from each Applicant are worthwhile to the extent that
they: (1) diversify the risk of successful commercial project completion; (2) strengthen New Jersey’s
likelihood of success as a regional manufacturing center supporting the nascent offshore wind industry
along the Atlantic seaboard; (3) incorporate alternative construction methods and/or technology
selection (4) provide economic benefits to more communities around different ports and manufacturing
facilities; (5) diversify the injection of offshore wind energy at different POIs; and, (6) heighten the
prospect of more robust wholesale competition in subsequent procurement rounds. LAI has not
attempted to weigh the relative importance of these six criteria. Each criterion is deemed important in
the examination of portfolio evaluation. Moreover, a decision to select one project from each Applicant
need not be considered in a favorable light for each of six criteria.
While not explicitly part of the final portfolio evaluation that recognizes the additional six criteria, LAI is
aware of the nexus between the size of a potential award and New Jersey’s effort through the PJM RTEP
process to implement an SAA that fosters the creation of a coordinated transmission solution. A

May 25, 2021
Public Version Page 171
coordinated transmission solution may combine an ocean grid solution with a power corridor to PJM’s
500 kV backbone transmission system to support New Jersey’s Round 3 through 6 offshore wind
solicitations. If the Board were to determine that the potential award portfolio would likely derail the
Board’s interest in SAA implementation, then the Board may choose to instead award less capacity. If, on
the other hand, the potential award portfolio is deemed either neutral or favorable in regard to SAA
implementation then the Board may not have any misgivings in its support of a split award.
The scope and rationales for these criteria are outlined in the following sections.
8.3.1 Economic Development Diversification
Diversification of economic development benefits is considered the top priority category for three
reasons. First, multiple communities, businesses, and labor occupations will desire a share of the benefits.
Second, environmental justice requires commitments to communities and economic interests that have
been under‐developed or under‐served in New Jersey. Third, in addition to the contribution of the
development and utilization of harbor and ports infrastructure towards diversification of economic
development benefits and economic justice, there are considerations regarding longer‐term leveraging
and utilization of New Jersey’s ports infrastructure. Mid‐Atlantic and Northeast coastal states have
intensified efforts to become regional manufacturing hubs, thereby supporting strategic positioning of
New Jersey’s expansive port infrastructure to facilitate the increased penetration of offshore wind to meet
coastal states’ accelerated decarbonization goals.
Both ASOW and OW2 are proposing to utilize monopile foundations manufactured in Paulsboro. Both
developers are also proposing to stage construction out of the NJWP and manage operations out of
Atlantic City. NJWP site utilization logistics to accommodate simultaneous stage construction have not
been adequately addressed, however. Provided steady progress is made by New Jersey entities to support
the timely development of the NJWP, LAI believes that the economic development benefits associated
with utilization of the NJWP should be achievable on a timely basis to support the Project schedules.
8.3.2 Technology Diversification
Diversification of generation technologies and performance can help future‐proof the transmission grid
while also improving environmental mitigation related to the offshore transmission segment from
individual collector arrays to landfall. The future‐proof grid will be smart (digital) and based on a mix of
technologies for generation, transmission and controlled end uses. The scope of this solicitation is limited
to offshore wind generation technology paired with radial export cables. Hence, future‐proofing
attributes of portfolios in this procurement round will likely consist of efficient utilization of the limited
number of POIs without compromising the Board’s interest in a SAA under PJM’s RTEP.
Both Applicants are proposing to utilize monopile foundations, ASOW with a TP and OW2 without a TP.
The Applicants propose to use WTGs from different manufacturers, ASOW from MHI Vestas and OW2
from GE. While the lease areas are both offshore of New Jersey, they are spatially distinct and non‐
contiguous, and plan to utilize different POIs. ASOW proposes to interconnect at Cardiff, *BC/
/EC* while OW2 proposes to interconnect at
Smithburg. Neither Applicant has proposed the use of energy storage.

May 25, 2021
Public Version Page 172
8.3.3 Applicant Diversification
Diversity in selected Applicants has been considered in the evaluation. The Board may wish to retain the
flexibility to award two Projects with different technical aspects, for example, different turbine
manufacturers, or different foundation types even though the selection of a second Project has a lower
total score. The benefits of Applicant diversity may be considered relative to potential negative
decremental BCRs associated with buying more offshore wind now versus later. How best to assess the
benefits of selecting two Applicants to meet the Board’s Round 2 offshore wind solicitation target range
with the additional considerations pertaining to the diversity of technical aspects and economic benefits
remains subject to the Board’s discretion.
8.4 Strengths,Weaknesses,Opportunities,andThreats
LAI has considered the strengths, weaknesses, opportunities, and threats (“SWOT”) for the Projects and
portfolios. While Project scores are informative, they are not dispositive. Hence the SWOT analysis is
designed to facilitate the Board’s basis for decision‐making by summarizing the qualitative factors that
supplement quantitative scores.
The SWOT framework is presented in a 2‐by‐2 matrix that locates each category in a quadrant according
to two dimensions, positive or negative expected outcomes, and internal or external uncertainties:
Strengths represent the positive features pertaining to the Applicant’s experience and likelihood of commercial success. Strengths represent features over which the Applicant exhibits a high degree of control.
Weaknesses represent negative economic and environmental attributes that hinder the Applicant’s prospects of commercial success. Weaknesses represent features over which the Applicant exhibits a moderate or low degree of control.
Opportunities represent positive features regarding technology, environmental mitigation, environmental justice, and prospects for economic growth attributable to offshore wind development in New Jersey. Opportunities represent potential upside benefits to New Jersey that are controllable in part or in full by the Applicant.
Threats represent hazards that can block or delay the Board’s realization of the solicitation goal or otherwise diminish the anticipated economic “benefit of the bargain.” Therefore, strategic considerations associated with the selection of one or more Projects that have the potential to weaken prospects for success are categorized as threats. Threats are largely outside the control of the Applicant.
Positive strengths and opportunities are shaded green and light green, respectively, depending on
whether uncertainties or risks are internal or external. Weaknesses are shaded yellow because specific
project weaknesses may be mitigated or remedied post award through engineering design, environmental
mitigation measures, or completion of permitting and supplier agreements. Threats are red because the
negative aspects are outside the direct control of both the Applicant and the State of New Jersey.
Portfolio options that fall within the Board’s procurement target range of 1,200 MW to 2,400 MW are
considered here. Because the Board has the discretion to select a portfolio that exceeds 2,400 MW, we
have also presented the distinct SWOT attributes for a portfolio of 2,658 MW, about 11% higher than the
2,400 MW upper procurement target. We also include the slightly smaller award option of an 1,148 MW
OW2 Project. *BC/

May 25, 2021
Public Version Page 173
EC*
A SWOT matrix for Atlantic Shores *BC/ /EC* C, *BC/ /EC* as sole awards is presented in Figure 46.
Strengths include a relatively firm design plan and firm economic development benefits guarantees. The
major weakness is that Atlantic Shores has comparatively limited experience in developing and operating
offshore wind projects. Any Project award would likely provide ASOW with the development experience
and add‐on economies to bid more competitively in future procurements. Projects C *BC/ /EC*
include a path for an alliance with MHI Vestas to establish a WTG nacelle assembly at the NJWP or, if need
be, elsewhere in New Jersey. *BC
/EC*
Figure 46. SWOT for Atlantic Shores *BC/ /EC* *BC//EC*

May 25, 2021
Public Version Page 174
The Ocean Wind 2 SWOT analysis is shown in Figure 47 for both Projects. The 500 kV POI at Smithburg is
considered a strength based on the robust transmission system capability on the 500 kV AC backbone
system *BC
EC* Remaining technical design uncertainties include lack of final cable route and
landfall plan, *BC/ /EC* and the plan to use a foundation design
without a transition piece. While OW2’s Project B offers the opportunity to further build NJ’s offshore
wind industry with establishment of a GE nacelle assembly facility, its realization is contingent on timely
completion of the NJWP as the site for the GE facility and GE’s satisfaction regarding lease terms.
Figure 47. SWOT for Ocean Wind 2 Projects A and B *BC//EC*
For split awards with a Project from each Applicant, some additional SWOT attributes beyond those of
the pair of individual Projects arise in the portfolio of two projects. *BC

May 25, 2021
Public Version Page 175
/EC*
Figure 48. Incremental SWOT for *BC/ /EC* *BC//EC*
The SWOT assessment for portfolios that combine ASOW C with either of the OW2 Projects is summarized
in Figure 49. These larger MW portfolios may increase the likelihood that EEW would establish the Phase
2 facility by having the opportunity to immediately produce more monopiles. However, even with the
earliest possible Phase 2 plant completion date and a longer work week, ASOW may need to supplement
monopiles produced at Paulsboro with the remainder produced outside New Jersey. A larger MW
portfolio than the BPU’s upper end of its initial target procurement range poses a threat of ratepayer
resistance to procuring more than the minimum procurement goal of 1,200 MW as well as more than the
initial target upper goal of 2,400 MW. While there is always uncertainty surrounding the relative merit of
buying more offshore wind now versus later, New Jersey’s ability to position the Garden State favorably
as a regional manufacturing hub is well‐served by accelerating New Jersey’s decarbonization objectives.
Other benefits supporting the decision to award a portfolio that is greater 2,400 MW enter into the
decision calculus. Moreover, as other mid‐Atlantic and Northeast states raise and accelerate their
respective offshore wind procurement targets LAI believes there is a significant chance of upward, not
sustained downward, OREC Purchase Prices in subsequent offshore wind procurement rounds.

May 25, 2021
Public Version Page 176
For ASOW C combined with OW2 B, the plan would be establishment of nacelle assembly operations by
both MHI Vestas and GE. While realizing both facilities would provide possibly more competitive WTG
pricing to future offshore wind project developers, *BC/
/EC* An opportunity of a split award for the portfolios that include one
or two nacelle facilities is that the NJWP may become more of a hub for nacelle component manufacturing
nearby. A split award has the added strength of diversification of the locations of economic activity,
developers, suppliers, and points of interconnection. This added strength of diversification incorporates
heightened environmental justice goals as well as innovative pilot programs in synchrony with New
Jersey’s decarbonization objectives.
Figure 49. Incremental SWOT for Atlantic Shores Project C and Ocean Wind 2 Project A or B *BC//EC*

May 25, 2021
Public Version Page A1
APPENDIXA:LAICOMMODITYPRICEFORECASTINGMODELSANDKEYASSUMPTIONSANDDATA
InputAssumptions
LAI utilizes Aurora, a chronological dispatch simulation model licensed from Energy Exemplar, to forecast
power market outcomes, including energy prices, capacity prices, power plant emissions, and natural gas
requirements for electric generation. LAI utilized energy and emissions output from Aurora in its
evaluation of Solicitation #2. LAI used the default database provided by Energy Exemplar as a foundation,
augmenting it with extensive customization based on public data sources, proprietary calculations, and
LAI’s professional judgment based on experience in PJM and neighboring RTOs.
According to the statute, selected OSW projects will be funded through the OREC mechanism for 20 years.
To cover the 20‐year contract term, LAI ran Aurora from 2021 through 2050.
LAI prepared two Aurora simulation projections in support of BPU’s economic and environmental goals:
The base scenario included the full 7,500 MW of New Jersey’s OSW goal, constructed in six tranches consistent with the Offshore Wind Strategic Plan.273 Offshore wind projects were injected into New Jersey zones consistent with substation locations identified in the Board’s State Agreement Approach study request.274 This forecast was used to estimate net OREC cost and ratepayer impacts under expected (baseline) market conditions by providing prices for energy products to compare against bid prices. REC prices were forecasted using the output of the AURORA model together with LAI’s proprietary model of the all‐in net cost of land‐based wind energy located in the RTO West portion of PJM.
To estimate the avoided emissions in New Jersey, a “but‐for” case was configured as an excursion of the base scenario. The excursion assumption was that no OSW is built in New Jersey after the contracted Ocean Wind project. The purpose of this case was solely to estimate the CO2, NOX, SO2, and PM2.5 emissions avoided within New Jersey by the procurement of OSW. No replacement energy was procured to meet New Jersey RPS in the No Additional OSW case. We compared plant emissions (CO2, SO2, NOX, PM2.5) from the 7,500 MW OSW case to the No Additional OSW case to determine the tons of avoided emissions for each year of the study period.
The assumptions utilized represent “known and knowable” expectations for New Jersey and other states’
energy policies. LAI did not model an assumed energy future that meets states’ long‐term decarbonization
targets, as the approaches that various states will take and their abilities to meet targets and standards
are uncertain. LAI did model specific policy measures and goals that states have announced, such as
procurement targets for large‐scale clean energy technologies and settled state procurements. For New
Jersey, this approach reflected policy assumptions from the “Reference 2” case shown in the Energy
Master Plan and Integrated Energy Plan,275 which includes the following measures in addition to offshore
wind development:
273 https://www.nj.gov/bpu/pdf/Final_NJ_OWSP_9‐9‐20.pdf See figure 1‐8. The Solicitation 6 solicitation quantity was reduced to 1,400 MW in order to match the 7,500 MW goal. 274 Page 7, November 18, 2020 BPU Order Docket No. QO20100630. https://publicaccess.bpu.state.nj.us/DocumentHandler.ashx?document_id=1230026 Solicitation 2 was assumed to interconnect via a radial line to Larrabee; subsequent solicitations would be part of a network which would inject into Cardiff, Smithburg, and Deans substations. 275 IEP Public Webinar, page 36.

May 25, 2021
Public Version Page A2
2 GW of storage by 2030
330k Electric Vehicles (EVs) on the road by 2025
50% Class 1 RPS by 2030
Improvements in Energy Efficiency (EE)
400 MW per year of Behind‐the‐Meter (BTM) Solar PV through 2030
StudyRegion
Aurora was utilized in a zonal configuration with the study region modeled to include PJM, NYISO, and
ISO‐NE. Boundary flows to other regions (including MISO, TVA, IESO, and Quebec) were modeled based
on an average weekly profile for each month using three years of historical flow data (168 hours by 12
months, 2017‐2019). Imports into New York from Ontario were throttled down to reflect the impending
refurbishment schedule of IESO’s nuclear units.
The three ISOs were further divided into zones to capture the key transmission constraints within each.
LAI modeled all load zones within MAAC and aggregated the western portion of the PJM footprint into a
“Rest of RTO” zone. NYISO was divided into seven load zones (A through K, with some aggregation
upstate). ISO‐NE was divided into the 13 sub‐areas identified in the Regional System Plan (“RSP”).
TransferLimits
Inter‐zonal transmission transfer limits were defined using several publicly available data sources:
• PJM BRA Planning Parameters
• NYISO Reliability Needs Assessment
• NYSRC Installed Capacity Requirement (“ICR”) Report
• ISO‐NE Forward Capacity Market (“FCM”) Tie Benefits Study
• ISO‐NE CONE and ORTP Analysis
• ISO‐NE Economic Studies
In cases where data were not available or data sources conflict, the analysis relied on the default settings
provided by Energy Exemplar, as well as professional judgment, to determine appropriate limits. Energy
Exemplar performs a nodal power flow simulation that informs the zonal transmission limits in the default
database.
DemandForecast
LAI relied on RTO planning documents such as PJM’s Load Forecast Report, NYISO’s Gold Book, and ISO‐
NE’s Capacity, Energy, Loads, and Transmission (“CELT”) Report as the basis for peak and annual energy
forecasts. RTO forecasts that include EE were utilized. BTM solar, which is also forecasted in planning
documents, is defined as a supply‐side resource to allow reflecting the changes to hourly shape of net
load that solar creates, as solar generation have the same hourly shape as energy demand.
PJM’s 2020 Load Forecast Report data included monthly metered and peak load values by zone through
2035. LAI extrapolated the load forecast for the rest of the study period by reconstituting the net energy
for load through adding back in BTM solar generation. LAI then extrapolated those values forward
assuming exponential growth consistent with the Combined Annual Growth Rate (“CAGR”) over the
forecast period. BTM solar generation was assumed to grow at a constant MWh rate per the last year’s
forecasted growth rate. Figure A1 shows the forecasted energy load in PJM and New Jersey net of BTM

May 25, 2021
Public Version Page A3
PV and EE. Figure A2 shows the forecasted net summer peak net of BTM PV and EE for PJM and New
Jersey.
The 2020 Load Forecast Report also included Plug‐in Electric Vehicles (“PEVs”). LAI adjusted the PEV
forecast to reflect the 330,000 vehicles by 2025 goals set by New Jersey as part of the Multi‐State ZEV
Task Force. LAI also adjusted New Jersey summer peak and energy load forecasts to reflect targets set in
the 2019 Energy Efficiency Potential in New Jersey study.276 The study provided statewide annual energy
and peak savings targets through 2024 meant to comply with the Clean Energy Act. These targets are
consistent with the BPU’s June 10, 2020 Order directing utilities to achieve savings equivalent to 2.15% of
electricity usage. We assumed these savings persist throughout the study period.
Figure A1. Forecasted Net Energy for Load
276 https://www.njleg.state.nj.us/OPI/Reports_to_the_Legislature/energyefficiencystudy5.24.19.pdf
0
10,000
20,000
30,000
40,000
50,000
60,000
70,000
80,000
90,000
100,000
0
100,000
200,000
300,000
400,000
500,000
600,000
700,000
800,000
900,000
1,000,000
2020 2025 2030 2035 2040 2045 2050NJ Net Energy for Load
(GWh)
PJM Net Energy for Load (GWh)
PJM Forecast PJM Extrapolated NJ Forecast NJ Extrapolated

May 25, 2021
Public Version Page A4
Figure A2. PJM Non‐Coincident Net Summer Peak Forecast
NYISO’s 2020 Load Forecast Report (“Gold Book”) had four load scenarios that forecasted load through
2050. LAI used the Baseline Forecast, which represents a middle path for various load modifying activities
such as EE, BTM solar, and new sources of demand through electrification.
ISO‐NE’s 2020 CELT report forecasted load through 2029. LAI extrapolated gross load (prior to netting out
EE and BTM PV) per the CAGR of the forecast period and extrapolates EE and PDR based on a constant
MWh growth rate per the last forecasted year’s values. The 2020 CELT forecast of gross load included EVs
and Air Source Heat Pumps (“ASHPs”).
FuelPriceForecast
Fuel prices, as delivered to generators, were forecasted for natural gas, oil products, and coal. Nuclear
generators are price takers and do not have much dispatch flexibility. We therefore ignored nuclear fuel
prices and assume that nuclear plants run fully loaded aside from scheduled refueling.
Natural Gas Price Forecast
The Henry Hub commodity price projection from EIA’s 2020 Annual Energy Outlook (“AEO”) was used as
the starting point for the forecast of delivered natural gas prices. Historically, the AEO Reference Case has
overestimated the trajectory of natural gas prices. We therefore used a simple average of the AEO
Reference Case and the AEO High Oil and Gas Supply Case, as illustrated in Figure A3, consistent with the
Solicitation #1 forecast calculation. Based on the average monthly profile of historic Henry Hub prices
observed over the last ten years, monthly shaping of natural gas prices into‐the‐pipe in Louisiana was
applied to the annual prices over the study period.
0
2,000
4,000
6,000
8,000
10,000
12,000
14,000
16,000
0
20,000
40,000
60,000
80,000
100,000
120,000
140,000
160,000
2020 2025 2030 2035 2040 2045 2050
NJ Peak Load
(MW)
PJM Peak Load
(MW)
PJM Forecast PJM Extrapolated NJ Forecast NJ Extrapolated

May 25, 2021
Public Version Page A5
Figure A3: Annual Average Natural Gas Commodity Price Projections
Use of the average of the AEO Reference and High Oil and Gas Supply Cases is supported by a comparison
to Henry Hub futures prices. Figure A4 overlays the June 17, 2020 New York Mercantile Exchange (NYMEX)
settled prices against the 2020 AEO Henry Hub forecasts after monthly shaping was applied. The AEO
Reference Case is consistently higher than the market perspective represented by NYMEX.
0.0
0.5
1.0
1.5
2.0
2.5
3.0
3.5
4.0
2020 2025 2030 2035 2040 2045 2050
Henry Hub Gas Price (2020 $/M
MBtu)
LAI Reference Case
AEO Reference Case
AEO High Oil and Gas Supply Case

May 25, 2021
Public Version Page A6
Figure A4: Natural Gas Commodity Price Projection Comparisons
To reflect the value of gas delivered across the study region, basis adjustments for pricing points of
relevance were made to the cost of natural gas into‐the‐pipe at the Henry Hub. Regional basis and the
resultant delivered natural gas prices were based on the latest available OTC Global Holdings natural gas
forward prices. This forward pricing data is available for a ten‐year forecast period. The forecast to 2050
was therefore extrapolated based on the available pricing data. Delivered gas prices to New Jersey,
including Texas Eastern M3 and Transco Z6 Non‐New York, are shown in Figure A5.
0.0
0.5
1.0
1.5
2.0
2.5
3.0
3.5
4.0
4.5
2020 2025 2030 2035 2040 2045 2050
Henry Hub Gas Price (2020$/M
MBtu)
AEO Reference Case
AEO High Oil and Gas Supply Case
LAI Reference Case
NYMEX Futures (6/17/2020)

May 25, 2021
Public Version Page A7
Figure A5: Monthly Delivered Gas Prices in New Jersey
Other Fuel Price Forecasts
Delivered oil products prices were forecasted based on the 2020 AEO, consistent with the Henry Hub
forecast.
Coal prices were forecasted using the 2020 AEO prices for delivered coal to electric generators as a
commodity price. These prices were then adjusted on a unit and state level to reflect local price adders
based on basin sourcing and transportation costs. These adders are developed by Energy Exemplar and
are primarily based on a review of EIA‐923 fuel receipts data.
CarbonAllowancePrice
For CO2 allowance prices, the carbon allowance price projection relied on final RGGI Model Rule Policy
Scenario forecast prices that were prepared on behalf of the 2017 RGGI Program Review conducted by
the RGGI Stakeholder Group. LAI assumed that Virginia would join RGGI by the beginning of 2021.277 In
Solicitation #1, LAI assumed that following the end of the current program period, the RGGI real price
stays constant. LAI changed the extrapolation assumption for Solicitation #2 to grow the RGGI real price
annually throughout the study period by applying the CAGR from the program period to each year beyond
it. LAI assumed carbon emissions allowance prices of $0/ton for resources located outside of the RGGI
states.
277 The RGGI Model Rule forecast did not include New Jersey or Virginia. We assume that the inclusion of New Jersey and Virginia will increase the cap accordingly, and therefore will have no direct impact on the allowance prices.
0
1
2
3
4
5
6
2020
2021
2022
2023
2024
2025
2026
2027
2028
2029
2030
2031
2032
2033
2034
2035
2036
2037
2038
2039
2040
2041
2042
2043
2044
2045
2046
2047
2048
2049
2050
Gas Price (2020$/D
th)
Henry Hub
Texas Eastern M3
Transco Z6 Non‐NY
Basis from Forwards Basis Extrapolated from Forwards

May 25, 2021
Public Version Page A8
Figure A6. RGGI Allowance Price Forecast
FirmResourceAdditions
LAI assumed that any resource cleared in a capacity auction such as the PJM BRA or ISO‐NE FCM will be
built and was therefore included as scheduled addition in Aurora. LAI has found that about 6 GW of new
combined cycle projects in PJM have commenced construction despite the uncertainty surrounding the
BRA.278
In NYISO there is no three‐year forward capacity auction. We assumed that the Berrians East Replacement
Project will be built as it has accepted an interconnection cost allocation and executed its interconnection
agreement.
ScheduledRenewableandCleanEnergyResourceAdditions
For renewable resources, our forecast generally assumed that projects with signed Interconnection
Service Agreements in PJM or ISO‐NE or accepted interconnection cost allocations in NYISO will be built.279
The projections also included all renewable and clean energy projects, including OSW, that have approved
contracts and/or which have been selected for long‐term contract under a state‐mandated procurement:
US Wind and Skipjack OSW projects, with a combined 368 MW of capacity, will deliver into EMAAC (DPL). Anticipated in‐service dates are in late 2024 and late 2023, respectively. These contracts have been approved by the Maryland PSC.
278 Identified projects are Guernsey, Indeck Niles Energy Center, Jackson Generation, Hannibal Port Power Project, and South Field. All the projects are in the western half of the RTO. 279 Some exceptions were made for suspended, withdrawn, and indefinitely delayed projects.
$0
$5
$10
$15
$20
$25
$30
2020 2025 2030 2035 2040 2045 2050
RGGI A
llowan
ce Price (2020 $/short ton)
Model Rule Forecast Round 1 Extrapolation Round 2 Extrapolation

May 25, 2021
Public Version Page A9
The 130 MW Deepwater Wind’s South Fork OSW project will deliver into NY Zone K, with an anticipated in‐service date of 2023. The Long Island Power Authority approved the PPA.
The Vineyard Wind 800 MW OSW project is assumed to have an in‐service date of October 2023. Vineyard Wind will deliver into SEMA (Barnstable, MA).
Deepwater’s 700 MW Revolution Wind project was selected by NGrid Rhode Island (400 MW), the CT Clean Energy RFP (200 MW), and the CT Zero Carbon RFP (100 MW). Revolution Wind will deliver into the Rhode Island Zone and is expected to be placed in service in late 2023.
The 1,200 MW New England Clean Energy Connect project, selected by the Massachusetts EDCs under the 83D procurement and submitted to the MA DPU for PPA approval. LAI assumes a 2023 in‐service date, with scheduled annual energy delivery profile similar to that of HQ imports on the Phase II HVDC tie.
The 880 MW Sunrise Wind and 816 MW Equinor Empire Wind projects were selected in NYSERDA’s first offshore wind procurement. Both projects are assumed to be in service in late 2024.280
The New Jersey BPU awarded Ørsted a contract for its 1,100 MW Ocean Wind project. Ocean Wind is expected to be operational in 2024 and assumed to deliver into the Atlantic City Electric zone.
In October 2019, the Massachusetts EDCs selected the Mayflower Wind 804 MW project This project is expected to be operational in 2025/2026 and is assumed to deliver into SEMA.
Section 1 of Connecticut Public Act 19‐71 directed CT DEEP to solicit offers for up to 2,000 MW of OSW. In December 2019, DEEP selected Vineyard Wind’s 804 MW Park City Wind project which was assumed to be delivered into SEMA and will achieve commercial operation in 2025.
NYSERDA held clean energy procurements for onshore wind and grid‐scale solar in 2017, 2018, and 2019 for a total of 4,025 MW of Tier 1 renewables. The procurements also called for a total of 65 MW of paired energy storage.
In addition, the projection included generic OSW projects to fulfill policy goals in other states of the study
region:
New York State passed legislation that calls for 9,000 MW of offshore wind built by 2035.
Maryland passed the Clean Energy Jobs Act of 2019 which calls for the development of 1,200 MW of offshore wind by 2030.
Virginia passed legislation establishing an offshore wind target of 5,200 MW by 2034 for Dominion Energy, and Dominion has announced plans to bring a 2,640 MW offshore project online by 2026.
Connecticut passed legislation for 2,000 MW of offshore wind by 2030.
Massachusetts passed legislation authorizing an additional 1,600 MW of offshore wind procurement, which was formalized by the Department of Energy Resources in summer of 2019.
Generic land‐based wind capacity was added to make up Class I energy deficits. Land‐based wind additions
were sited in “rest of RTO” in proportion to the capacity listed in PJM’s interconnection queue that was
280 At the time of modeling, NYSERDA’s selections of Empire Wind 2 and Beacon Wind in the 2020 Offshore Wind Solicitation had not yet been announced.

May 25, 2021
Public Version Page A10
not already scheduled for addition. New Jersey’s solar goals were met only by in‐state solar resources and
did not require generic additions. We made the simplifying assumption that RECs are fungible in PJM. The
projected energy from generators with the potential of producing Class I RECs281 in any PJM state was
included as Class I existing or planned supply. The addition of Class I generic onshore wind resources in
PJM started in 2023 and ended in 2030, in order to meet the most ambitious states’ targets in 2030.282
From 2030 to 2050, the growing REC production of planned Class I resources, namely offshore wind
procurements, kept pace with the growing Class I REC demand. Hence, no generic Class I additions were
needed in this period to meet Class I requirements in PJM. The PJM Class I supply and demand after
generic additions from 2021 to 2050 with and without NJ OSW are shown below in Figure A7 and Figure
A8.
Figure A7. PJM Class I Supply and Demand 2021 – 2050, with NJ OSW
281 The GATS database lists all renewable generators and where they are registered as Class I. 282 New Jersey and Maryland have each oriented their RPS goals around 50% Tier 1 by 2030.
0
20,000
40,000
60,000
80,000
100,000
120,000
140,000
160,000
180,000
200,000
2021
2022
2023
2024
2025
2026
2027
2028
2029
2030
2031
2032
2033
2034
2035
2036
2037
2038
2039
2040
2041
2042
2043
2044
2045
2046
2047
2048
2049
2050
Generation and Deman
d (GWh)
Other Hydro Land‐Based WindBTM Solar Grid Solar Other States' Offshore WindNJ Offshore Wind Generic Additions RPS Demand

May 25, 2021
Public Version Page A11
Figure A8. PJM Class I Supply and Demand 2021 – 2050, without NJ OSW
Utility‐scale solar and onshore wind additions in NYISO and ISO‐NE were distributed to zones in proportion
to zonal queued capacity.
Firm(Scheduled)Retirements
The scenarios included retirements documented by the ISOs in planning documents and notices. PJM’s
deactivations list was reflected in the resource mix. NYISO retirement notices and ISO‐NE permanent de‐
list bids and non‐price retirements through Forward Capacity Auction (FCA) 15 were also integrated into
the retirement assumptions.
LAI did not retire the PSEG nuclear fleet (Hope Creek, Salem) until their respective NRC licenses expired.
LAI also assumed that Ohio would provide some subsidy to the FirstEnergy units that have requested
deactivations (Perry, Davis‐Besse), and therefore those units will operate until their licenses expire. Per
New York State’s mandate, Indian Point units 2 and 3 were retired in 2020 and 2021, respectively. Other
nuclear units in the study region were retired according to their license expirations, which generally
amount to 60 in‐service years.283 Several nuclear units in PJM (Beaver Valley, Davis‐Besse, and Perry) have
withdrawn from the deactivation list with the expectation that subsidies will keep them viable.
The remaining coal units in New York were assumed to retire by 2020 per Governor Cuomo’s mandate.
LAI also assumed significant attrition of downstate New York peaking resources resulting from expected
more restrictive NOx regulation, on the order of about 3,000 MW.
283 Several nuclear units in PJM have applied for or intend to apply for NRC certification to run for 80 years, such as Peach Bottom, Surry, and North Anna.
0
20,000
40,000
60,000
80,000
100,000
120,000
140,000
160,000
180,000
200,000
2021
2022
2023
2024
2025
2026
2027
2028
2029
2030
2031
2032
2033
2034
2035
2036
2037
2038
2039
2040
2041
2042
2043
2044
2045
2046
2047
2048
2049
2050
Generation and Demand (GWh)
Other Hydro Land‐Based WindBTM Solar Grid Solar Other States' Offshore WindNJ Offshore Wind Generic Additions RPS Demand

May 25, 2021
Public Version Page A12
CapacityExpansionModeling
The capacity expansion forecast utilized Aurora’s Long Term Capacity Expansion functionality to
determine an equilibrium path of annual resource additions and retirements beyond scheduled additions
and retirements. Under this functionality, Aurora calculates the present value of all existing resources and
determines which generators are candidates for retirement based on lowest present value over the
forecast period.
The model iterates to an equilibrium solution given potential candidate new resource options and
retirements. In each iteration, an updated set of candidate new resource options and retirements is placed
into the system and the model performs its chronological commitment and dispatch logic for those
resources. The model tracks the economic performance of all new resource options and resources
available for retirement based on market prices developed in the iteration. At the end of each iteration
the long‐term logic decides how to adjust the current set of new builds and retirements, or it determines
that the model has converged on an optimal solution.
The capacity proxy prices are based on the average of the previous three BRA resource clearing prices.
The resource clearing price for the 2022/23 delivery year is the three‐year average price, which was then
escalated at a 2% annual inflation rate each year thereafter. This method is consistent with the projected
capacity prices provided by BPU with the SGD for the first offshore wind solicitation and was relayed to
Applicants in the SGD for this solicitation. PSEG has binding constraints in one out of the last three BRAs
that led higher resource clearing prices in PSEG than in the rest of EMAAC and New Jersey. Projected PSEG
capacity proxy prices are therefore slightly higher than those in ACE, HCPL, and RECO.
Capacity Demand Curve Forecast
LAI implemented its projection of the PJM demand curve, the Variable Resource Requirement (VRR), in
the Aurora model to forecast PJM capacity prices. PJM’s BRA planning parameters for the 2022/2023
Delivery Year served as the foundation of the VRR forecast.284 Parameters were adjusted to reflect updates
to Net Cost of New Entry (CONE), expected energy efficiency levels, and to incorporate the 2020 PJM Load
Forecast Report. Adjustments to the points on the VRR curve were made for the ISO and each LDA based
on a ratio of the forecasted peak demand net BTM solar to the reported BRA peak for the 2022/2023
Delivery Year.
Addition/AttritionForecasting
Candidate Additions
LAI created candidate resources which Aurora considered for new additions. CONE study CC and CT units
were modeled as candidate resources.
Candidate Retirements
LAI restricted the candidates for retirement to coal and oil‐fired steam and combustion turbines.
284 https://pjm.com/‐/media/markets‐ops/rpm/rpm‐auction‐info/2022‐2023/2022‐2023‐bra‐planning‐period‐parameters.ashx

May 25, 2021
Public Version Page A13
NodalPriceRegression
A regression analysis was used to convert forecasted energy prices from zonal to nodal resolution for each
interconnection point proposed by the applicants, except for one node that had an incomplete price
history for the historical period and was not needed for the financial analysis. Six years of historical hourly
day‐ahead PJM LBMP price data from June 1, 2014 to May 31, 2020 were downloaded for each relevant
zone and node. The historical spread between each node and its corresponding zone was then regressed
against that zone’s historical prices while controlling for month, day of week and hour. These regressions
were then used to predict hourly nodal prices using hourly zonal prices from Aurora for the forecast
period. To control for the effects of inflation over time, all prices were deflated to the base year before
the analysis was performed. The predicted real nodal‐zonal spreads were inflated into nominal spreads
for adding to the simulated zonal nominal prices.
NewJerseyClassIRECPrices
LAI forecasted annual New Jersey Class I REC prices using LAI’s proprietary in‐house model of the missing
money, absent REC revenue, for onshore wind resources. The model used onshore wind firm capital and
operating costs and financial parameters for a representative generic marginal supply wind farm in the
PJM area, together with zonal hourly energy prices and annual capacity prices forecast using the Aurora
model. The primary source for capital and operating cost and operating performance data is the Lawrence
Berkeley National Laboratory (“LBNL”) 2020 Wind Energy Technology Data report.285 The REC model
simultaneously solves for a time‐series of annual REC prices for annual vintages of wind farms as a
mathematical programming model that minimizes REC prices while satisfying a minimum target internal
rate‐of‐return (IRR) for each vintage. Capital and operating costs are projected to decrease over time in
the model as the technology improves, with each subsequent vintage embodying improved cost
performance. An output degradation function is applied over the 30‐year operating life of each vintage’s
marginal resource. The full (without degradation) capacity factor (“CF”) assumed for the marginal wind
resources is 34.9%, equal to the average CF of recent (2014‐2018) projects in Ohio. While some onshore
wind resources in PJM have qualified to receive capacity market revenue, LAI projects that future marginal
wind projects will not qualify. Thus, no capacity market revenue was assigned to any of the 30 resource
vintages. The December 2020 re‐extension of the federal PTC allows the 2021 to 2025 vintages to qualify
for the PTC. Primarily because wind farm capital and operating costs have continued to fall, the 2021 to
2025 vintages receiving the PTC would not need any REC revenue to meet the model’s minimum IRR
constraint. Because the current futures price for vintage 2021 NJ Class I RECs is about $11.50, that price
was linearly interpolated as a “bridge” from that price for 2021 to 2026, the first post‐PTC vintage’s model
result.
285 Ryan Wiser et al., Wind Energy Technology Data Update: 2020 Edition, Lawrence Berkeley National Laboratory, August 2020.

May 25, 2021
Public Version Page B1
APPENDIXB:LEVELIZEDNETORECCOSTCALCULATION
Nominal LNOC for a project p is PVANCp divided by 𝑃𝑉𝐴𝑄 , where PVANC is the Present Value of Annual
Net Cost, discounted at the nominal discount rate, NDR, and 𝑃𝑉𝐴𝑄 is the Present Value of Annual OREC
Quantity, discounted at the nominal discount rate. Annual Net Cost and Annual OREC Quantity are
discounted to 2021 from the first OREC contract delivery year, yf, to the last delivery year, yl.
𝐿𝑁𝑂𝐶 𝑃𝑉𝐴𝑁𝐶 𝑃𝑉𝐴𝑄
𝑃𝑉𝐴𝑁𝐶 𝑂𝑃 , 𝐸𝑅 , 𝐶𝑅 , 𝑅𝑅 , 1 𝑁𝐷𝑅
𝑃𝑉𝐴𝑄 𝑂𝑄 , 1 𝑁𝐷𝑅
Real LNOC for a project p is PVANCp divided by 𝑃𝑉𝐴𝑄 , where 𝑃𝑉𝐴𝑄 is the Present Value of Annual OREC
Quantity, discounted at the real discount rate, RDR.
𝐿𝑁𝑂𝐶 𝑃𝑉𝐴𝑁𝐶 𝑃𝑉𝐴𝑄
𝑃𝑉𝐴𝑄 𝑂𝑄 , 1 𝑅𝐷𝑅
𝑅𝐷𝑅 1 𝑁𝐷𝑅 1 𝐼𝑛𝑓𝑙𝑎𝑡𝑖𝑜𝑛𝑅𝑎𝑡𝑒 1
OQy,p is the total OREC quantity (MWh) for project p in calendar year y:
𝑂𝑄 , 𝑀𝑂𝑄 , ,
MOQm,y,p is the monthly OREC quantity (MWh) for project p in month m of calendar year y:
𝑀𝑂𝑄 , , 𝐻𝑂𝑄 , , , ,
,
HOQh,d,m,y,p is the hourly OREC quantity (MWh) for hour h of day d of month m of calendar year y for project
p, and DIMm,y is the number of days in month m of calendar year y.
OPy,p is the OREC Payment amount for project p in calendar year y:
𝑂𝑃 , 𝑀𝑂𝑄 , ,
𝑂𝐵𝑃 , ,
OBPm,y,p is the OREC bid price of the energy year applicable to month m of calendar year y for project p. It
may be adjusted for transmission system upgrade cost sharing if appropriate.
ERy,p is the annual market energy revenue for project p in calendar year y.

May 25, 2021
Public Version Page B2
HEPh,d,m,y,l is the hourly market energy price ($/MWh) in hour h of day d of month m in calendar year y at
location l, where location l is determined by the project interconnection point.
𝐸𝑅 . 𝐻𝑂𝑄 , , , , 𝐻𝐸𝑃 , , , ,
,
CRy,p is the annual market capacity revenue for project p in calendar year y.
𝐶𝑅 , 𝑈𝐶𝐴𝑃 , , 𝐷𝐼𝑀 , 𝑃𝐶 , .
UCAPm,y,p is the amount of project p UCAP recognized by PJM for month m of calendar year y (MW).
PCm,y,l is the PJM capacity price applicable to the project location l for month m of calendar year y ($/MW‐
day).
RRy,p is the annual market REC revenue (avoided cost) for project p in calendar year y.
RPy is the New Jersey Class I REC price ($/MWh) for calendar year y.
𝑅𝑅 , 𝑅𝑃 𝑂𝑄 ,
To compare portfolios of projects with roughly the same total nominal capacity, first the present value
measures PVANCp, 𝑃𝑉𝐴𝑄 , and 𝑃𝑉𝐴𝑄 are summed for the np included projects. Then, portfolio nominal
and real LNOC, and are calculated for each portfolio in the same manner as for individual projects:
𝑃𝐿𝑁𝑂𝐶 𝑃𝑉𝐴𝑁𝐶 𝑃𝑉𝐴𝑄
𝑃𝐿𝑁𝑂𝐶 𝑃𝑉𝐴𝑁𝐶 𝑃𝑉𝐴𝑄

May 25, 2021
Public Version Page C1
APPENDIXC:INPUT‐OUTPUTMODELDESCRIPTIONANDASSUMPTIONS
LAI first reviewed the information submitted by each Applicant, and then conducted independent analysis
using the IMPLAN input‐output model to support a standard and consistent basis for evaluation.
The purpose of this appendix is to provide a high‐level description and key assumptions of the economic
input‐output model that LAI used to evaluate the economic impacts of Project submissions. We first
provide background on the conceptual framework of input‐output modeling. Then we discuss aspects of
IMPLAN and input assumptions relevant to applying it as a standard framework for all project evaluations.
Finally, we describe the procedures for preparing project‐specific inputs to IMPLAN and for reporting
results of the IMPLAN analysis.
EconomicInput‐OutputModelingOverview
Input‐output analysis is a form of economic analysis based on the interdependencies among economic
sectors. Input‐output analysis is commonly used to estimate the effects of new or incremental project or
program spending to a local economy.
An economic input‐output (“IO”) model contains an inter‐industry and inter‐institutions matrix of inputs
and outputs representing current account flows of economic activity within a defined geographic region.
Figure C1 is a schematic of an input‐output model matrix of flows. The core of the IO model is the inter‐
industry matrix, where each column represents an industry’s activity and each row represents outputs of
goods or services by the industry. Institutional sectors of households, businesses, and government
represent expenditure activities in the right‐hand columns, plus next exports as a balancing account. Final
demand (use or consumption) in the region is the sum of household personal consumption expenditures
(“PCE”), private fixed investment (“PFI”), government spending, and net exports. The bottom rows
represent the income or receipts by the institutional sectors. Labor compensation includes employee
compensation and proprietor income paid by businesses. Indirect business taxes include excise, sales, and
property taxes, and various fees. Property income includes rents, royalties, dividends, and corporate
profits. Total value‐added equals total expenditures for final use, and gross regional product is equivalent
to either measure.286 In Figure C1, the value added, final use, and gross regional product blocks have the
same color to make the point that they are equivalent in total value. Their value does not include the
value of intermediate products and services. Rather, gross output value, shown at the bottom of the
schematic, does include the value of intermediate production.
286 The equivalent gross regional product term is often called GDP because the latter is a familiar term and the local or regional footprint under study is understood.

May 25, 2021
Public Version Page C2
Figure C1. Schematic Structure of an Input‐Output Model
Value added is a measure of new economic activity in each stage of production beyond the value of
intermediate products and services already produced. Total gross output is a measure of total revenue or
sales, which includes the value of intermediate goods and services from earlier stages of production as
well as newly created economic value. Hence, for reporting the regional economic impacts of a project,
value‐added is a more appropriate measure than gross output for representing new economic activity.
Economic effects (impacts) of project expenditures are analyzed in a regional IO model with respect to
their local economic interactions in three categories:
Direct effects are the spending or production changes in the industry (industries) used to
characterize the events under analysis.
Indirect effects reflect the backward linkage changes in inter‐industry purchases in response to
the new demands of the directly affected industry (industries).
Induced effects reflect the backward linkage changes in household purchases of goods and
services out of the additional income of employees and proprietors that is created by the changes
in direct and indirect expenditures.
Total effects are the sum of the direct, indirect, and induced effects.287
287 Indirect effects are sometimes described as “supply chain” effects but that simple metaphor does not fully reflect the dense, recursive network of multiple rounds of inter‐industry purchases. Induced effects are sometimes referred to as “respending” effects, but they arise from increased household income while businesses and governments also respend higher revenues.
Agricul‐
ture
Construc‐
tion
Manufac‐
turing
Transpor‐
tation Trade Services PCE PFI
Net
Exports
Govern‐
ment Total
Agriculture
Construction
Manufacturing
Transportation
Trade
Services
Labor
Compensation
Indirect
Business Taxes
Property
Income
Total
Final Use
Gross Regional Product
Gross
Output
Final Expenditures
Income
Products
Industries
Intermediate Inputs / Outputs
Value Added
Gross Output
May 25, 2021
Public Version Page C3
IMPLANModelOverview
Due to its minimal project‐specific data requirements, ease‐of‐use, and moderate licensing costs, IMPLAN
(IMpact PLANning) is the predominant tool used to estimate project specific local economic impacts.288
The IMPLAN tool is a general input‐output model comprised of software and regional data sets.289
IMPLAN Model Assumptions
The IMPLAN model estimates sector and total impacts assuming that the relationships of the current base
data year are maintained. IMPLAN datasets and the model’s equations are used to provide a static analysis
or snapshot in time (a single year) of the local economy. While estimates of economic activity related to
specific demand changes and their associated supply linkages can be estimated with IMPLAN, the model
cannot predict the dynamic effects on the local economy in future years. The economy of even a small
region is constantly in flux, affected by decisions made by businesses, households, and by local, state, and
federal government policies. Uncertainties surrounding technical and demographic changes and the local
environmental impacts of climate change further limits the ability to model long‐run local economy
effects.
IMPLAN also has several other limitations which must be recognized to properly apply the tool and
appropriately interpret or adjust its results. IMPLAN’s static, single‐period model assumes that
adjustments in the local economy resulting from the direct project expenditures under consideration
occur fully and instantly (within the same year), rather than partially with a multi‐period distributed time
lag. Also, IMPLAN uses fixed proportions production coefficients (the inputs recipe for making the
products of an industry), so it has no factor or product substitution, and assumes constant returns to scale,
fixed prices, and unlimited supply availability of inputs (labor, products, capital).
Press releases often report the numbers of “jobs” created without referring to the duration of the jobs.
IMPLAN models annual flows of economic activity, so it uses the definition of a “job‐year” as one FTE job
at 40 hours per week. This FTE job‐years definition allows temporary jobs created during the
development, construction, and decommissioning phases of a project to be aggregated with the longer‐
lived jobs created during the operational phase.
IMPLAN Database
A major strength of the IMPLAN database is that it has substantial geographic detail, including state,
county, and zip code levels. This allows it to be configured to the desired local study region and to capture
product imports and exports between the study region and elsewhere. Inter‐area trade is accounted for
with regional purchase coefficients that represent the proportion of each dollar of local demand for a
given commodity that is purchased from local producers.
IMPLAN data sets are constructed annually by IMPLAN, Inc. Regional data are obtained from many
sources, primarily federal agencies responsible for data collection. IMPLAN data contains 546 sectors
representing all private industries in the United States, as aggregations of industries defined by the North
American Industry Classification System (“NAICS”), plus construction, household, and government
288 IMPLAN has been used for numerous local area evaluations of OSW projects by LAI and other consultants on behalf of both project applicants and state procurement or economic development agencies.
289 More background information on IMPLAN and its databases is available at www.implan.com.

May 25, 2021
Public Version Page C4
sectors. Employment, employee compensation, industry expenditures, commodity demands, and other
information are collected to form IMPLAN’s database.
The primary sources for data include:
U.S. Bureau of Labor Statistics (“BLS”) Covered Employment and Wages (“CEW”) program
U.S. Bureau of Economic Analysis (“BEA”) Regional Economic Information System (“REA”)
program
U.S. Bureau of Economic Analysis Benchmark I/O Accounts of the U.S.
BEA Output estimates
BLS Consumer Expenditure Survey
U.S. Census Bureau County Business Patterns (“CBP”) program
U.S. Census Bureau Decennial Census and Population Surveys
U.S. Census Bureau Economic Censuses and Surveys
U.S. Department of Agriculture Census.
OffshoreWindProjectEvaluationwithIMPLAN
Applicant Project Data Review
Applicants were requested to provide information regarding local (in‐state) expenditures for labor and in
total for each item during the development, construction, operations, and decommissioning phases. LAI
vetted this information for completeness, consistency, and realism. LAI prepared two sets of CQs to the
Applicants to clarify issues related to the input‐output model inputs used by the Applicants and other
information related to the technical and commercial aspects of the Applicants’ projects that would affect
estimation of economic development effects. The main objective of the examination of Applicant
information is to promote standardization across rival project submissions and to have a firm basis for
LAI’s independent modeling with IMPLAN.
Sanity checks during the vetting process included, among others:
Share of locally supplied labor for a direct labor expenditure category, i.e., share of local
construction workers engaged in the temporary construction activities
Share of locally supplied good/service within an industry expenditure category
Average labor compensation per FTE worker by occupational category relative to that for the
current local labor force.
Preparing Project Data Inputs to IMPLAN
As a small, emerging industry, IMPLAN does not have industry sectors specific to offshore wind facility
construction or operations. To surmount this limitation, shared with other I‐O models, LAI applied the
standard Analysis‐by‐Parts (“ABP”) method of formulating composite industry activities to represent in‐
state expenditures for labor, procurement of materials, products, and services, and transfer payments to
organizations that will implement workforce development and other economic development initiatives.290
The ABP method is basically a budget expenditures recipe to construct the inter‐sector economic linkages
290 The ABP method is also known as the Bill‐of‐Goods method, but that term does not reflect the fact that labor and other services are also part of the recipe for developing and operating a project.

May 25, 2021
Public Version Page C5
of a customized industry, such as offshore wind.291 The four lifecycle phases for an offshore wind project
may be thought of as a combination of the offshore wind development, offshore wind construction,
offshore wind generation, and offshore wind decommissioning industries. Hence, these four customized
industries define the extent of direct effects during the respective project phase.
Direct effects result from project‐centric expenditures associated with the development, construction,
operations, and decommissioning phases of the project. “Project‐centric” expenditures include
contracted services that could be provided by offshore wind project employees in addition to those
performed by internal employees. For example, WTG maintenance and inspection activities may be done
by local workers that are either direct employees of the offshore wind resource owner or by the original
equipment manufacturer (“OEM”) service and maintenance contract provider. Another example is that
operation and maintenance of a vessel for ferrying workers to the offshore wind site could be done by a
subcontractor or by the owner.
The Applicants were requested to specify local expenditures by budget item, and to also provide estimates
for labor FTE‐years and labor compensation used in their modeling of Project economic effects. The local
materials and services expenses were provided separately for the project development, construction,
operation, and decommissioning phases. Applicants were required to map the expenditure line items to
the appropriate NAICS industry. LAI used the IMPLAN mappings of these detailed NAICS expenditure
categories into the much more aggregated IMPLAN industry sectors. In a few cases, LAI used its judgment
based on knowledge of the production technology underlying the product procured, to reassign the
expenditure to a different NAICS category, but that only resulted in a few instances that altered the
IMPLAN industry used for the expenditure item.
291 IMPLAN does not have a sufficiently specific industry for its representation.