Evaluation Report for the South-Central Area Horizontal...
61
FINAL REPORT Evaluation Report for the South-Central Area Horizontal Biosparge Pilot Test SFPP Norwalk Pump Station Norwalk, California Prepared for Kinder Morgan Energy Partners, L.P. August 2017 CH2M HILL Engineers, Inc. 6 Hutton Centre Drive Suite 700 Santa Ana, California 92707
Transcript of Evaluation Report for the South-Central Area Horizontal...

F I N A L R E P O R T
Evaluation Report for the South-Central Area Horizontal Biosparge Pilot Test SFPP Norwalk Pump Station Norwalk, California
Prepared for
Kinder Morgan Energy Partners, L.P.
August 2017
CH2M HILL Engineers, Inc. 6 Hutton Centre Drive Suite 700 Santa Ana, California 92707

PR0426170600SCO III
Contents Section Page
Acronyms and Abbreviations ............................................................................................................... v
1 Introduction ......................................................................................................................... 1-1 1.1 Overview .......................................................................................................................... 1-1 1.2 Site Description ................................................................................................................ 1-1
2 Background .......................................................................................................................... 2-1 2.1 Hydrogeologic Conditions ................................................................................................ 2-1 2.2 Remediation Systems ...................................................................................................... 2-2
2.2.1 Soil Vapor Extraction System .............................................................................. 2-2 2.2.2 Groundwater Treatment System ........................................................................ 2-2 2.2.3 Horizontal Biosparge System .............................................................................. 2-3
3 Horizontal Well Biosparge Pilot Testing ................................................................................ 3-1 3.1 Pilot Test Objectives ........................................................................................................ 3-1 3.2 Pilot Test Methodology .................................................................................................... 3-1
3.2.1 Zone of Influence Evaluation .............................................................................. 3-1 3.2.2 Soil Vapor Monitoring and Analysis .................................................................... 3-2 3.2.3 Groundwater Monitoring ................................................................................... 3-3
4 Results .................................................................................................................................. 4-1 4.1 Down-well Probe and Manual Water Level Data ............................................................ 4-1 4.2 Biosparge Well Zone of Influence – DO and SF6 Tracer Data ........................................... 4-1 4.3 Soil Vapor Monitoring ...................................................................................................... 4-2
4.3.1 SVE Influent Monitoring...................................................................................... 4-2 4.3.2 Field PID and Vacuum Monitoring ...................................................................... 4-2 4.3.3 Mobile Laboratory Monitoring ........................................................................... 4-2
4.4 Groundwater Monitoring ................................................................................................ 4-3 4.4.1 LNAPL Thickness ................................................................................................. 4-3 4.4.2 Dissolved-Phase Hydrocarbons .......................................................................... 4-4
5 Summary and Recommendations ......................................................................................... 5-1
6 References ............................................................................................................................ 6-1
Appendixes
A Well Gauging and Sampling Records for Tracer Study B Well Gauging and Sampling Records for Routine Groundwater Monitoring C Laboratory Analytical Reports for Tracer Study D Summary of Mobile Laboratory Analytical Results for Soil Vapor E Mobile Laboratory Analytical Reports for Soil Vapor F Laboratory Analytical Reports for Routine Groundwater Monitoring G Groundwater Elevation and Light Non-aqueous Phase Liquid Thickness Time Series Charts H Dissolved-Phase Hydrocarbon Time Series Charts

CONTENTS
IV PR0426170600SCO
Tables
1 Maximum Water Level Rise Observed in Selection Monitoring Wells at 120 scfm 2 SF6 Tracer Test Water Quality Results 3 Extracted Vapor Analytical Results for Select VOCs 4 Soil Vapor Probe Field PID and Vacuum Readings 5 Soil Vapor Probe VOCs Detection and Screening Level Exceedance Summary 6 Gauging Data for Select Wells in South-Central Area – March 2016 to October 2016 7 TPH and Select VOCs Analytical Summary – March 2016 to October 2016 8 Reduction in Product Thickness for Select South-Central Area Wells 9 TPH-g Reduction in Select South-Central Area Wells 10 TPH-d Reduction in Select South-Central Area Wells 11 Benzene Reduction in Select South-Central Area Wells 12 MTBE Reduction in Select South-Central Area Wells 13 TBA Reduction in Select South-Central Area Wells
Figures
1 Site Location Map 2 Hydrographs for Select Groundwater Monitoring Wells 3 Remediation System Layout 4 Horizontal Biosparge Well Completion Diagram 5 Biosparge Well and Soil Vapor Monitoring Probe Locations 6 Typical Nested Soil Vapor Monitoring Probe Completion Diagram 7 DO, pH, ORP and Water Level Plot for GMW-1 8 DO, pH, ORP and Water Level Plot for GMW-26 9 DO, pH, ORP and Water Level Plot for GMW-28 10 DO, pH, ORP and Water Level Plot for GMW-O-10 11 DO, pH, ORP and Water Level Plot for MW-SF-5 12 DO, pH, ORP and Water Level Plot for MW-SF-6 13 Rise in Water Levels with Distance from Biosparge Well Screen – 120 scfm 14 Dissolved Oxygen and SF6 Isoconcentrations in Groundwater 15 Dissolved Oxygen Concentration with Distance from Biosparge Well Screen – 480 scfm 16 SF6 Concentration with Distance from Biosparge Well Screen – 480 scfm 17 PID and Total VOCs Influent Concentrations for SVE System 18 Soil Vapor Concentrations – All Probes 19 Soil Vapor PID Concentration with Distance from Biosparge Well Screen – All Probes 20 Distribution of Measurable LNAPL in Uppermost Groundwater Zone

PR0426170600SCO V
Acronyms and Abbreviations µg/L microgram(s) per liter
1,2-DCA 1,2-dichloroethane
ASTM ASTM International
bgs below ground surface
BTEX benzene, toluene, ethylbenzene, and total xylenes
BTS Blaine Tech Services
CH2M CH2M HILL Engineers, Inc.
COPC chemical of potential concern
DFSP Defense Fuel Support Point
DO dissolved oxygen
DTSC Department of Toxic Substances Control
EPA U.S. Environmental Protection Agency
FBBR fluidized bed bioreactor
ft/day feet per day
ft/ft foot per foot
GWE groundwater extraction
GWTS groundwater treatment system
HHRA Human Health Risk Assessment
JP-4 jet propellant number 4
JP-5 jet propellant number 5
JP-8 jet propellant number 8
Kinder Morgan Kinder Morgan Energy Partners, L.P.
LGAC liquid-phase granular activated carbon
LNAPL light non-aqueous phase liquid
mg/L milligram(s) per liter
MRP Monitoring and Reporting Program
MTBE methyl tertiary butyl ether
ORP oxidation-reduction potential
OWS oil-water separator
PID photoionization detector
psi pounds per square inch
PVC polyvinyl chloride
RTO regenerative thermal oxidizer

ACRONYMS AND ABBREVIATIONS
VI PR0426170600SCO
RWQCB Regional Water Quality Control Board
scfm standard cubic feet per minute
SF6 sulfur hexafluoride
SFPP SFPP, L.P., an operating partnership of Kinder Morgan Energy Partners, L.P.
site SFPP Norwalk Pump Station, 15306 Norwalk Boulevard, Norwalk, California
SVE soil vapor extraction
TBA tertiary butyl alcohol (also known as tert-butanol)
TFE total fluids extraction
TPH total petroleum hydrocarbons
TPH-d total petroleum hydrocarbons, quantified as diesel
TPH-g total petroleum hydrocarbons, quantified as gasoline
VOC volatile organic compound
ZOI zone of influence

SECTION 1
PR0426170600SCO 1-1
Introduction 1.1 Overview This evaluation report was prepared by CH2M HILL Engineers, Inc. (CH2M) on behalf of SFPP, L.P. (SFPP), an operating partnership of Kinder Morgan Energy Partners, L.P. (Kinder Morgan), to summarize data collected during the first year of horizontal well biosparge pilot test operation at the SFPP Norwalk Pump Station, located at 15306 Norwalk Boulevard, Norwalk, California (the site) (Figure 1).
Pilot test data include groundwater chemistry, soil vapor, and groundwater sample analytical results from January 2016 (startup) through October 2016. The following sections summarize background information, objectives, methodology, and results of the pilot test, as well as recommendations for system expansion.
1.2 Site Description The Defense Fuel Support Point (DFSP) facility located at 15306 Norwalk Boulevard in Norwalk, California is currently owned by the U.S. Air Force. DLA Energy (formerly Defense Energy Support Center) performs remediation activities at the site on behalf of the Air Force. The facility was formerly occupied by 12 inactive aboveground fuel storage tanks and associated piping and facilities. The tanks were used to store and distribute refined petroleum products, including jet propellant numbers 5 and 8 (JP-5 and JP-8), and had a maximum capacity of 35 million gallons. They reportedly also stored aviation gasoline and jet propellant number 4 (JP-4). In addition, DLA Energy previously operated truck fill stands and various fuel transfer systems. The facility was decommissioned in 2001 and is no longer used to store fuel. The aboveground tanks and the main infrastructure were demolished in 2011; demolition of the subsurface piping was completed in 2012.
SFPP maintains remediation equipment within 2 acres at the DFSP facility and easements for its pipelines along the southern and eastern boundaries of the facility. Previously, SFPP operated a pump station near the south-central area of the site. The pump station was used to transfer fuel to and from the DFSP facility, and as an in-line pumping station for portions of the SFPP pipeline network. The pump station was decommissioned in 2001, but three pipelines heading eastward along the southern boundary of the DFSP facility (one of which bends at the southeastern corner of the facility and continues northward within the eastern easement) remain in service and continue to convey refined petroleum fuels including gasoline, diesel, and jet fuel. The pipelines were fitted with block valves, two of which are located along a 24-inch diameter pipeline, within areas currently undergoing remediation. One block valve, located in the south-central portion of the site, is referred to as the intermediate 24-inch block valve. The other block valve, located offsite to the southeast, is referred to as the southeastern 24-inch block valve. SFPP removed these block valves in 2017 as part of their pipeline relocation project.
Subsurface assessments have been performed at the DFSP facility since 1986. The investigations characterized the nature and extent of fuel-related hydrocarbons in the shallow water-bearing zone related to historical releases from SFPP’s pipelines at the DFSP facility. Based on these assessments, fuel was released from the block valves and migrated vertically to the water table. Separate-phase floating product, or light non-aqueous phase liquid (LNAPL), as well as sorbed-phase and dissolved-phase fuel hydrocarbons were delineated in areas beneath the DFSP facility and at offsite properties to the south, west, and east. Site assessments indicated that the chemicals of potential concern (COPCs) are total petroleum hydrocarbons (TPH), including TPH quantified as gasoline (TPH-g), diesel fuel (TPH-d), JP-4, JP-5, and JP-8; benzene, toluene, ethylbenzene, and total xylenes (BTEX); 1,2-dichloroethane (1,2-DCA);

SECTION 1 – INTRODUCTION
1-2 PR0426170600SCO
methyl tertiary butyl ether (MTBE); and tertiary butyl alcohol (TBA [also known as tert-butanol]). A groundwater Monitoring and Reporting Program (MRP) has been in effect at the site since 1995. The current groundwater MRP is specified in the Revised Groundwater Sampling and Analysis Plan, SFPP Norwalk Pump Station (CH2M, 2013).

SECTION 2
PR0426170600SCO 2-1
Background This section presents a summary of hydrogeologic conditions, and a description of SFPP’s remediation systems at the site.
2.1 Hydrogeologic Conditions The hydrogeologic units underlying the site consist of the following:
• Shallow water-bearing zone • Bellflower aquitard • Exposition aquifer
The shallow semiperched water-bearing zone extends from approximately 25 to 50 feet below ground surface (bgs). Lithology within this zone consists of sand, silty sand, clayey sand, and sandy silt. In general, the lower 20 feet (30 to 50 feet bgs) consists of poorly sorted fine to medium sand, while the upper 30 feet (ground surface to 30 feet bgs) consists of interbedded fine sand, silty sand, clayey sand, and sandy silt.
Groundwater flow within the shallow water-bearing zone, as interpreted during previous assessments and monitoring at DFSP, is generally toward the north, with a horizontal gradient of approximately 0.002 foot per foot (ft/ft). Hydraulic conductivity ranges from 12 to 73 feet per day (ft/day) in the south-central area to 20 to 60 ft/day in the southeastern area (AMEC, 2010).
The shallow water-bearing zone is underlain by the Bellflower aquitard of the Lakewood Formation. Based on lithologic logs from previous assessments at and near DFSP, the depth of the Bellflower aquitard ranges from approximately 50 to 80 feet bgs beneath the site and consists of predominantly clay, silty clay, and sandy clay with some interbedded sand with silt.
The regional water-bearing zone, the Exposition aquifer, underlies the Bellflower aquitard and ranges in depth from approximately 80 to 220 feet bgs. The horizontal hydraulic gradient in the Exposition aquifer is approximately 0.0004 ft/ft and the direction of groundwater flow is to the southeast, opposite the direction of the shallow water-bearing zone. Distinct hydraulic conditions above and below the Bellflower aquitard support the interpretation that the Bellflower aquitard is laterally continuous, with a relatively low vertical hydraulic conductivity.
Figure 2 provides a hydrograph with representative wells from the shallow water-bearing zone in the SFPP remediation areas and all wells within the Exposition aquifer. The hydrograph on Figure 2 shows the following:
• Groundwater elevations in the shallow water-bearing zone are approximately 20 feet higher than the Exposition aquifer, demonstrating that the Bellflower aquitard impedes vertical groundwater flow between the two units.
• Groundwater elevations in the shallow water-bearing zone fluctuate seasonally and over the long term in response to recharge by precipitation and extraction from the DLA and SFPP remediation systems. Annually, groundwater elevations increase during the winter rainy season and decrease during the summer dry season. Groundwater elevations in the shallow water-bearing zone are at historical lows since groundwater monitoring began in the mid-1990s.
• Groundwater elevations in the Exposition aquifer also fluctuate seasonally and over the long term in response to recharge by precipitation, and in response to regional water supply pumping in the Central Basin.

SECTION 2 – BACKGROUND
2-2 PR0426170600SCO
2.2 Remediation Systems SFPP operates remediation systems consisting of soil vapor extraction (SVE), biosparging, total fluids extraction (TFE; extraction of free product and/or groundwater using a top-loading pump), and groundwater extraction (GWE; extraction of groundwater using a bottom-loading pump) within the following two areas:
• South-Central Area. LNAPL and dissolved-phase hydrocarbons occur in the south-central area beneath the DFSP facility and offsite beneath the residential area to the south. These impacts occurred from a historical release from the intermediate 24-inch block valve and potentially other unidentified sources at the former pump station.
• Southeastern Area. LNAPL and dissolved-phase hydrocarbons occur in the southeast area beneath the DFSP facility and offsite in the Holifield Park area. These impacts occurred from a historical release from the southeastern 24-inch block valve in this area.
Remediation in the south-central and southeastern areas consists of SVE and TFE (GWE is also performed at one location in the southeastern area). At several locations, SVE is coupled with TFE (or GWE) in a process referred to as dual-phase extraction. Biosparging is also employed in the south-central area to enhance mass removal of hydrocarbon constituents.
The objectives of the remediation systems are to contain and control the migration of hydrocarbon constituents in groundwater and soil vapor and to remove hydrocarbon mass from soil and groundwater. The remediation systems include the following:
• South-Central Area − 20 TFE wells − 24 onsite and 6 offsite SVE wells (most collocated with TFE wells) − 2 horizontal SVE wells − 1 horizontal biosparge well
• Southeast Area − 4 TFE wells (GMW-O-15, GMW-O-18, GMW-36, and GMW-SF-9) − 3 SVE wells (collocated with TFE wells) − 1 GWE well (GMW-SF-10)
The remediation system layout is shown on Figure 3. A brief description of each system is provided below.
2.2.1 Soil Vapor Extraction System SVE is performed using a blower to remove soil vapors from the south-central and southeastern areas. The extracted vapors are conveyed to a knock-out tank that separates entrained moisture from the soil vapors. Accumulated moisture in the knock-out tank is treated by the main groundwater treatment system (GWTS) described below. The soil vapors are then treated in a regenerative thermal oxidizer (RTO) where volatile organic compounds (VOCs) are converted to carbon dioxide and water prior to being discharged to the atmosphere. Operation of the GWTS and SVE system is conducted in accordance with Permits to Construct (Application Nos. 569588 and 567723, respectively; ID 110835) issued by the South Coast Air Quality Management District.
2.2.2 Groundwater Treatment System The main GWTS receives free product and groundwater recovered from the south-central and southeastern parts of the site. Free product and groundwater recovered by pneumatically operated top-loading total fluids pumps and bottom-loading groundwater pumps is routed to an oil-water

SECTION 2 – BACKGROUND
PR0426170600SCO 2-3
separator (OWS). Any free product retained in the OWS is collected in a storage tank and recycled at an offsite location. Groundwater from the OWS is subsequently routed through an onsite 3,000-gallon equalization tank, two fluidized bed bioreactors (FBBRs; used to treat fuel oxygenates such as TBA and MTBE), and finally through two liquid-phase granular activated carbon (LGAC) beds prior to discharge in accordance with a National Pollutant Discharge Elimination System permit (Permit No. CA0063509; Order No. R4-2016-0309).
2.2.3 Horizontal Biosparge System The horizontal biosparge well was drilled and installed in August of 2014. The well is constructed of 4-inch-diameter Schedule 80 polyvinyl chloride (PVC), including 600 feet of slotted pipe (“screen”) at 45 feet bgs and 250 feet of riser. The screen section is centered below the central portion of the south-central area hydrocarbon plume, as shown on Figure 3. A completion diagram of the well is shown on Figure 4. The depth of the screen interval was selected to be as close as practicable to the bottom of the shallow water-bearing zone, to maximize the zone of influence (ZOI).
Additional details regarding construction of the horizontal biosparge well are documented in the report titled, Horizontal Biosparge Well and Soil Vapor Monitoring Probe Completion Report (CH2M, 2015).
The aboveground system includes the following components:
• 100-horsepower rotary screw air compressor, supplying approximately 500 standard cubic feet per minute (scfm) and 100 pounds per square inch (psi)
• 8-foot by 20-foot system enclosure with ventilation, noise suppression, ducting, and lighting
• 200-gallon air receiver
• Condensate treatment system including 300-gallon treated water storage tank
• Air sparge manifold with five legs, each with solenoid valves with timers to facilitate cycling of air flow
Compressed air is injected into the horizontal biosparge well, BS-01, at a maximum rate of approximately 500 scfm. SFPP’s SVE system has an interlock, which ensures the biosparge system cannot operate unless the SVE system is operating. Operation of the SVE system controls vapor migration during biosparge system operation.
SECTION 3
PR0426170600SCO 3-1
Horizontal Well Biosparge Pilot Testing 3.1 Pilot Test Objectives The objectives of the biosparge pilot test were as follows:
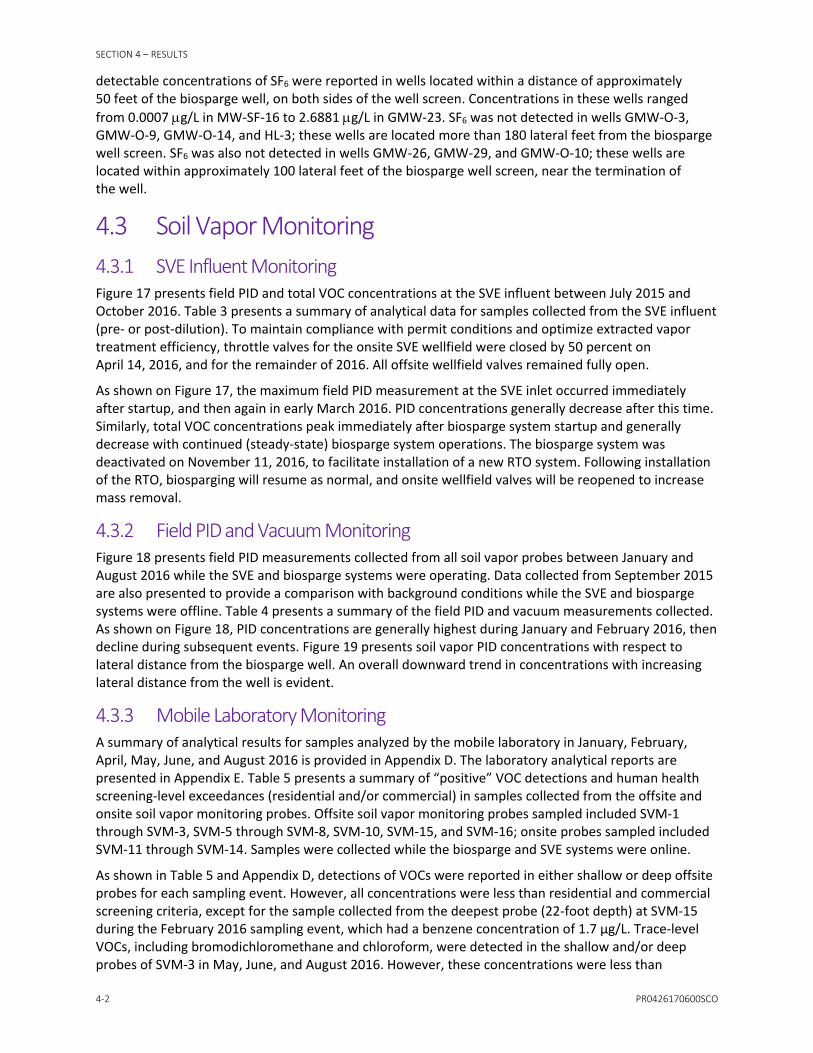
1. Evaluate the effectiveness of biosparge technology to enhance petroleum mass removal in the south-central area of the site. This objective was accomplished based on measurements of LNAPL in monitoring wells screened in the shallow water-bearing zone, as well as dissolved-phase concentrations in monitoring wells without LNAPL. In addition, SFPP will compare LNAPL saturation and LNAPL chemistry in soil cores collected before, and 2 to 3 years after, commencement of biosparging to further evaluate mass removal, and specifically the change in LNAPL saturation and composition.
2. Evaluate the potential for vapor migration beneath the offsite residential areas located immediately south of the site. This objective was accomplished by conducting routine sampling of the new and previously installed soil vapor monitoring probes.
3. Evaluate the feasibility of system expansion to other portions of the south-central area and southeastern area. Data collected from the above activities were used to meet this objective.
3.2 Pilot Test Methodology Pilot test activities in the south-central area included the following primary components:
1. ZOI Evaluation – collection of water level and field water quality data during the flow ramp-up period, in conjunction with injection of sulfur hexafluoride (SF6) tracer gas into the biosparge well at peak flow to estimate the ZOI.
2. Soil Vapor Monitoring – collection of routine soil vapor monitoring data during biosparge system operations.
3. Groundwater Monitoring – collection of routine groundwater monitoring data during biosparge system operations.
3.2.1 Zone of Influence Evaluation The biosparge system was activated on January 7, 2016, at an initial flow rate of 60 scfm. System flow was gradually increased at a rate of 60 scfm per week over a period of approximately 7 weeks to achieve the maximum design flow rate of 480 scfm (0.8 scfm per foot of screen) as follows:
• January 7, 2016: 60 scfm • January 9, 2016: 120 scfm • January 15, 2016: 180 scfm • January 20, 2016: 240 scfm • January 25, 2016: 300 scfm • January 27, 2016: 360 scfm • January 29, 2016: 420 scfm • February 4, 2016: 480 scfm
Down-well probes with pressure transducers and dissolved oxygen (DO), pH, temperature, conductivity, and oxidation-reduction potential (ORP) sensors were placed in the six monitoring/remediation wells in the south-central area (GMW-1, GMW-26, GMW-28, GMW-O-10, MW-SF-5, and MW-SF-6) on

SECTION 3 – HORIZONTAL WELL BIOSPARGE PILOT TESTING
3-2 PR0426170600SCO
December 29, 2015, to continuously measure water levels and field water quality throughout the flow ramp up period. Replacement probes were installed in MW-SF-6 on January 7, 2016, and GMW-1 on January 18, 2016, because of a faulty sensor with previously installed probes. Manual water level measurements were conducted using an interface probe, and visual observations of bubbling from select monitoring wells were also noted. Water level changes were measured to determine the time required for peak water table displacement to occur, which can be used to evaluate pulsed operation scenarios.
An SF6 tracer gas injection event was conducted from February 16 to 18, 2016. It included injection of ambient air and SF6 tracer, blended at approximately 0.1 percent by volume, into the biosparge well at the maximum design flow rate (480 scfm), with subsequent collection of groundwater samples from select wells for SF6 analysis. The lateral extent of the ZOI was subsequently based on detection of SF6 in groundwater samples and/or increases in DO concentrations.
Groundwater samples were collected on February 17 and 18, 2016, and submitted for laboratory analysis to confirm the presence of SF6 tracer in surrounding observation wells. Wells sampled are as follows: GMW-1, GMW-9, GMW-23, GMW-26, GMW-28, GMW-29, GMW-30, GMW-O-3, GMW-O-9, GMW-O-10, GMW-O-14, HL-3, MW-18 (MID), PZ-2, MW-SF-13, MW-SF-14, MW-SF-16, and PZ-10. Groundwater samples were collected by Blaine Tech Services (BTS) using low-flow methods and shipped to CH2M’s Applied Sciences Laboratory in Corvallis, Oregon, for SF6 analysis. Well gauging and sampling records for the tracer study are provided in Appendix A.
3.2.2 Soil Vapor Monitoring and Analysis 3.2.2.1 SVE System Influent Sampling Field total VOC (as hexane) measurements were collected from the SVE influent at approximately weekly intervals during pilot testing activities using a photoionization detector (PID). In addition, approximately once per month, a sample was submitted to an offsite laboratory (Air Technology Laboratory) for the following analyses: VOCs using U.S. Environmental Protection Agency (EPA) Method TO-3 and TO-15, and fixed gases (methane, carbon dioxide, and oxygen) using ASTM International (ASTM) D-1946. These activities were performed to monitor fluctuations in hydrocarbon constituents in extracted soil vapor.
3.2.2.2 Soil Vapor Monitoring Probe Sampling Collection of soil vapor samples from the onsite and offsite nested soil vapor monitoring probes was conducted to monitor for potential off-gassing of volatile hydrocarbon constituents during pilot testing activities. CH2M field staff performed weekly PID monitoring of the south-central area soil vapor monitoring network (SVM-1 through SVM-3, SVM-5 through SVM-8, and SVM-10 through SVM-16) during the initial 2 months of biosparge operations, then monthly thereafter. Figure 5 shows the location of soil vapor monitoring probes. Figure 6 shows the construction details for a typical nested probe.
CH2M retained American Analytics of Chatsworth, California, to collect and analyze soil vapor samples from the same probes at approximately monthly intervals. A mobile laboratory was used by American Analytics for onsite laboratory analysis of soil vapor samples.
PID and Vacuum Measurements
Approximately once per week in January and February 2016, a CH2M field technician collected field VOC measurements from the south-central area soil vapor probe network using a PID calibrated against hexane. Subsequent field VOC measurements were collected during mobile laboratory monitoring events as described below. Field readings were collected after each probe was purged approximately three system volumes using a hand-held portable vacuum pump. A vacuum measurement was also collected from each probe using a digital manometer.

SECTION 3 – HORIZONTAL WELL BIOSPARGE PILOT TESTING
PR0426170600SCO 3-3
Vapor Sample Analysis Using Mobile Laboratory
Monthly soil vapor samples were collected from probes SVM-1 through SVM-3, SVM-5 through SVM-8, and SVM-10 through SVM-16 by American Analytics and analyzed onsite using its mobile laboratory under the direction of CH2M. Sampling was conducted on the following dates:
• January 27 to 29, 2016 • February 24 to 26, 2016 • April 27 to 29, 2016 • May 25 to 27, 2016 • June 22 to 24, 2016 • August 29 to 31, 2016
The soil vapor probes at each monitoring location were purged and sampled in accordance with the recommended guidelines in the Department of Toxic Substances Control (DTSC) Advisory for Active Soil Gas Investigations (the Advisory), dated July 2015 (DTSC, 2015). The analytical results were evaluated by comparing the results to soil gas screening levels based on the most current DTSC guidance (Human Health Risk Assessment [HHRA] Note 3; DTSC, 2016). The soil gas screening levels are calculated from indoor air screening levels published by DTSC (2016) using the default attenuation factors presented in DTSC’s vapor intrusion guidance (DTSC, 2011).
Soil vapor samples were not collected at the deep probe of SVM-2 and shallow probe of SVM-10 due to flow restrictions (excessive vacuum) observed during purging activities with a hand-held sampling pump. Soil vapor samples also were not collected from the shallow or deep probes of SVM-4 due to property access restrictions. SVM-9 was not sampled during routine monitoring events because of its location in the southeastern area; however, it was sampled in August 2016 as part of the requirements to sample this probe on an annual basis.
Vapor samples were collected using 1.4-liter Summa canisters and glass syringes, and analyzed by the American Analytics onsite mobile laboratory for VOCs using EPA Method TO-15, TPH-g using EPA Method TO-3, and fixed gases (carbon dioxide, methane, and oxygen) using EPA Method 3C. Included in the TO-15 analyte list were BTEX, MTBE, naphthalene, TBA, 1,2-DCA, 1,2,4-trimethylbenzene, 1,3,5-trimethylbenzene, n-butylbenzene, sec-butylbenzene, isopropylbenzene, n-propylbenzene, and 2-propanol (the leak test compound). These constituents were identified as COPCs based on the results of the 2006 soil gas investigation and HHRA (Geomatrix, 2006).
In accordance with the Advisory (DTSC, 2015), field duplicate samples were collected at a minimum frequency of 1 per every 20 primary samples collected. The duplicate samples were collected and analyzed in the same manner as the primary samples.
Ambient air samples were also collected each day of sampling and analyzed by the mobile laboratory for VOCs and TPH-g. The purpose of the ambient air samples was to quantify background concentrations of COPCs near select sampling locations.
3.2.3 Groundwater Monitoring Selected monitoring and remediation wells were gauged and sampled during March, June, and August 2016 as part of the pilot testing activities to evaluate the effect on free-phase and dissolved-phase hydrocarbons in the south-central area. Groundwater sampling and analysis was also performed for a broader number of wells in April and October 2016 as part of the monitoring that is conducted by DLA Energy and Kinder Morgan on a semiannual basis. Groundwater samples were collected by BTS using low-flow methods and shipped to Alpha Analytical in Sparks, Nevada, for the following analyses: VOCs including fuel oxygenates using EPA Method 8260B, and TPH-g and TPH-d using EPA Method 8015M.

SECTION 3 – HORIZONTAL WELL BIOSPARGE PILOT TESTING
3-4 PR0426170600SCO
Prior to starting gauging, purging, or sampling activities, SFPP remediation systems were deactivated for several days to allow water levels to recover to near-static conditions. Subsequently, BTS measured depth to water in each well using a water level meter, or depth to water and free product thickness using an interface probe. Field instruments used to gauge the wells were cleaned with a laboratory-grade, non-detergent cleaner, then rinsed successively in two containers with distilled water before each use.
Before sampling, each well was purged by using low-flow purge techniques at a rate of approximately 200 to 500 milliliters per minute. During purging, groundwater field parameters consisting of temperature, pH, electrical conductivity, turbidity, DO, and ORP were monitored. Water levels also were monitored during low-flow purging to verify minimal drawdown. Samples were collected using a 2-inch-diameter submersible Grundfos pump with new or dedicated tubing. Well gauging and sampling records for monitoring performed in March, June, and August 2016 are provided in Appendix B. Well gauging and sampling records for April and October 2016 are provided in the routine semiannual monitoring reports submitted to the Regional Water Quality Control Board (RWQCB) under separate cover.
Groundwater field parameters were allowed time to stabilize, before collecting the sample. Water samples analyzed for TPH-g, TPH-d, and VOCs were collected in 40-milliliter volatile organic analysis vials containing hydrochloric acid preservative, filled to zero headspace, and sealed with Teflon septa and airtight caps. The samples were labeled and placed on ice for transport to the laboratory following proper chain-of-custody procedures.

SECTION 4
PR0426170600SCO 4-1
Results 4.1 Down-well Probe and Manual Water Level Data DO, pH, ORP and water level plots for data recorded by the down-well probes in wells GMW-1, GMW-26, GMW-28, GMW-O-10, MW-SF-5, and MW-SF-6 are presented on Figures 7 through 12. DO data were not available for well MW-SF-6 due to equipment (sensor) failure.
Manual water level measurements were also collected from the wells noted above and other wells, including MW-18 (MID), MW-SF-3, and PZ-10, during the flow ramp-up period to evaluate water table displacement in the general vicinity of the biosparge well. Table 1 and Figure 13 provide a summary of maximum water level increases (or rise) observed during ZOI evaluation. With exception of wells GMW-28 and PZ-10, maximum water table displacement corresponded to the period immediately following startup, after 2 days of operation. Figure 13 presents water table displacement in select monitoring wells versus lateral distance from the biosparge well at a flow rate of 120 scfm. Water table displacement generally decreased with increasing lateral distance from the biosparge well. A maximum water level rise of 13.1 feet was observed in remediation well MW-SF-3, located approximately 10 feet from the biosparge well.
Water table displacement is not used to determine the ZOI because it extends beyond the zone of air contact. However, it can be used to determine optimum cycle time for pulsed system operation. Based on review of the data, an optimum cycle time (if used for pulsed operation in the future) of 48 to 72 hours is recommended.
4.2 Biosparge Well Zone of Influence – DO and SF6 Tracer Data
Table 2 provides a summary of DO, pH, and ORP field data and SF6 analytical results from the tracer test conducted on February 16, 2016, corresponding to the maximum air sparge rate of 480 scfm. The laboratory analytical report for the SF6 data is provided in Appendix C. An isoconcentration contour map of field DO data and laboratory SF6 data is shown on Figure 14. Figure 15 presents field DO concentrations with respect to lateral distance from the biosparge well. As shown on the figures, maximum DO concentrations (greater than 6 milligrams per liter [mg/L]), were reported in wells located within approximately 50 lateral feet and on both sides of the biosparge well screen, including the following:
• GMW-9 (7.48 mg/L), MW-SF-13 (7.84 mg/L), and PZ-10 (7.34 mg/L) to the north
• and MW-SF-14 (6.36 mg/L) and MW-SF-16 (6.96 mg/L) to the south
DO concentrations in GMW-23 and GMW-29 approached 2 mg/L, which is above the average DO concentration (0.55 mg/L) reported in in 2015. The field DO concentration in PZ-2 (2.33 mg/L), located approximately 214 feet north of the biosparge well screen, was also above the average background DO concentration. Field DO concentrations in the remaining wells were generally less than 1 mg/L, near background concentrations.
Figure 16 presents a plot of SF6 concentrations with respect to lateral distance from the biosparge well screen. The maximum SF6 concentration was reported at PZ-2 (3.1096 micrograms per liter [µg/L]). Relatively high concentrations of SF6 were also reported in wells GMW-1 and MW-18 (MID), located within a distance of approximately 100 feet from the biosparge well. However, the majority of
SECTION 4 – RESULTS
4-2 PR0426170600SCO
detectable concentrations of SF6 were reported in wells located within a distance of approximately 50 feet of the biosparge well, on both sides of the well screen. Concentrations in these wells ranged from 0.0007 µg/L in MW-SF-16 to 2.6881 µg/L in GMW-23. SF6 was not detected in wells GMW-O-3, GMW-O-9, GMW-O-14, and HL-3; these wells are located more than 180 lateral feet from the biosparge well screen. SF6 was also not detected in wells GMW-26, GMW-29, and GMW-O-10; these wells are located within approximately 100 lateral feet of the biosparge well screen, near the termination of the well.
4.3 Soil Vapor Monitoring 4.3.1 SVE Influent Monitoring Figure 17 presents field PID and total VOC concentrations at the SVE influent between July 2015 and October 2016. Table 3 presents a summary of analytical data for samples collected from the SVE influent (pre- or post-dilution). To maintain compliance with permit conditions and optimize extracted vapor treatment efficiency, throttle valves for the onsite SVE wellfield were closed by 50 percent on April 14, 2016, and for the remainder of 2016. All offsite wellfield valves remained fully open.
As shown on Figure 17, the maximum field PID measurement at the SVE inlet occurred immediately after startup, and then again in early March 2016. PID concentrations generally decrease after this time. Similarly, total VOC concentrations peak immediately after biosparge system startup and generally decrease with continued (steady-state) biosparge system operations. The biosparge system was deactivated on November 11, 2016, to facilitate installation of a new RTO system. Following installation of the RTO, biosparging will resume as normal, and onsite wellfield valves will be reopened to increase mass removal.
4.3.2 Field PID and Vacuum Monitoring Figure 18 presents field PID measurements collected from all soil vapor probes between January and August 2016 while the SVE and biosparge systems were operating. Data collected from September 2015 are also presented to provide a comparison with background conditions while the SVE and biosparge systems were offline. Table 4 presents a summary of the field PID and vacuum measurements collected. As shown on Figure 18, PID concentrations are generally highest during January and February 2016, then decline during subsequent events. Figure 19 presents soil vapor PID concentrations with respect to lateral distance from the biosparge well. An overall downward trend in concentrations with increasing lateral distance from the well is evident.
4.3.3 Mobile Laboratory Monitoring A summary of analytical results for samples analyzed by the mobile laboratory in January, February, April, May, June, and August 2016 is provided in Appendix D. The laboratory analytical reports are presented in Appendix E. Table 5 presents a summary of “positive” VOC detections and human health screening-level exceedances (residential and/or commercial) in samples collected from the offsite and onsite soil vapor monitoring probes. Offsite soil vapor monitoring probes sampled included SVM-1 through SVM-3, SVM-5 through SVM-8, SVM-10, SVM-15, and SVM-16; onsite probes sampled included SVM-11 through SVM-14. Samples were collected while the biosparge and SVE systems were online.
As shown in Table 5 and Appendix D, detections of VOCs were reported in either shallow or deep offsite probes for each sampling event. However, all concentrations were less than residential and commercial screening criteria, except for the sample collected from the deepest probe (22-foot depth) at SVM-15 during the February 2016 sampling event, which had a benzene concentration of 1.7 µg/L. Trace-level VOCs, including bromodichloromethane and chloroform, were detected in the shallow and/or deep probes of SVM-3 in May, June, and August 2016. However, these concentrations were less than

SECTION 4 – RESULTS
PR0426170600SCO 4-3
residential and commercial screening criteria. VOCs were also detected in the deepest probe (22-foot depth) at SVM-16 at concentrations less than screening criteria.
In the onsite area, VOCs were detected most frequently during the February 2016 sampling event, then declined over subsequent sampling events. In February 2016, detections exceeded screening levels in the deepest probe (22-foot depth) of SVM-12 and SVM-14. Screening levels were also exceeded in the shallow probe (7-foot depth) and middle probe (15-foot depth) of SVM-14. However, during subsequent sampling events, concentrations only exceeded screening criteria in the deepest probe of SVM-14. Elevated VOC concentrations in SVM-14 were not unexpected given its relatively close lateral proximity (11 feet) to the biosparge well and the hydrocarbon smear zone, which occurs at an average depth of approximately 27 to 31 feet bgs in the south-central area.
4.4 Groundwater Monitoring Selected monitoring and remediation wells were gauged and sampled during March, June, and August 2016 as part of the pilot testing activities to evaluate the effect on free-phase and dissolved-phase hydrocarbons in the south-central area. Groundwater sampling and analysis was also performed for a broader number of wells in April and October 2016 as part of the monitoring that is conducted by DLA Energy and Kinder Morgan on a semiannual basis. Gauging data collected between March and October 2016 at select wells in the south-central area monitored as part of the pilot study are presented in Table 6. Analytical data for samples collected from the same wells during this timeframe are presented in Table 7. Laboratory analytical reports for samples collected in March, June, and August 2016 are presented in Appendix F. Analytical reports for samples collected during routine semiannual events (April and October 2016) have been previously submitted to the RWQCB in DLA Energy and Kinder Morgan’s combined semiannual groundwater monitoring reports.
LNAPL thickness data and dissolved-phase analytical results collected during the pilot test are discussed in the following subsections.
4.4.1 LNAPL Thickness Measured LNAPL in monitoring wells in the south-central area as of October 2016 is shown on Figure 20. Table 8 presents a summary of LNAPL thickness data collected from the fourth quarter 2015 (baseline) through October 2016. Time series charts showing groundwater elevation and product thickness data collected from 2011 to 2016 are presented in Appendix G.
LNAPL was measured in a total of 21 monitoring or remediation wells in the south-central area during the baseline gauging event. After 10 months of biosparging (October 2016), only six wells had measurable LNAPL. It should be noted that TFE or manual bailing of product occurred in some remediation wells during this timeframe. TFE was performed in wells GMW-9, GMW-10, GMW-22, GMW-25, GMW-O-20, GMW-O-23, MW-SF-2, MW-SF-11, and MW-SF-12. Manual bailing was performed in GMW-O-12, GMW-O-21, MW-SF-9, and MW-SF-13. Total volumes of LNAPL bailed from these wells were 17, 12.5, 0.05, and 12 gallons, respectively. Active remediation methods were not employed in wells GMW-23, GMW-29, GMW-30, GMW-O-11, GWR-3, MW-O-2, MW-SF-4, and MW-SF-15.
The average decrease in measured LNAPL thickness from October 2015 to October 2016 with TFE/manual bailing was 2.42 feet; the average decrease in wells without TFE/manual bailing was 1.19 feet; the average decrease in all wells was 1.95 feet. The maximum LNAPL thickness measured during the October 2016 gauging event was 1.45 feet in GMW-10 and 2.3 feet in GMW-O-12, both of which are located over 200 feet from the biosparge well, and on opposite sides. Based on the data collected, the magnitude and extent of measureable LNAPL thickness in monitoring wells in the south-central area was significantly reduced after 1 year of biosparging.

SECTION 4 – RESULTS
4-4 PR0426170600SCO
4.4.2 Dissolved-Phase Hydrocarbons Dissolved-phase TPH-g, TPH-d, benzene, MTBE, and TBA concentrations from baseline (baseline is considered to be pre-biosparge conditions between 2011 and 2015, depending on when the well was last sampled) through the pilot study period are summarized in Tables 9 through 13, and presented graphically in Appendix H. Groundwater samples were not collected from wells containing LNAPL. As shown in these tables and graphs, trends for TPH-g, TPH-d, benzene, and MTBE show decreasing concentrations from baseline through the study period for monitoring wells located within approximately 100 feet of the biosparge well (the outer extreme of the ZOI). TPH-d shows an overall decreasing trend from baseline, but a stable or slightly increasing trend in some wells (GMW-28, GMW-O-23, and GMW-1) during the study period. Diesel-range organics are relatively slow to degrade aerobically, especially in zones with historical and/or residual LNAPL. There were insufficient TBA detections during pre-biosparge conditions to show definitive trends with this constituent during the pilot test period. Average reductions from baseline through October 2016 for TPH-g, TPH-d, benzene, and MTBE (all wells sampled) were 82 percent, 70 percent, 87 percent, and 98 percent, respectively.

SECTION 5
PR0426170600SCO 5-1
Summary and Recommendations This section presents a summary of the biosparging pilot test results and recommendations for future operations at the site:
• The horizontal biosparge well installed in the south-central area is constructed of 4-inch-diameter Schedule 80 PVC, with 600 feet of screen at 45 feet bgs and 250 feet of riser pipe. Sparging was initiated in January 2016, and continued through October 2016 (the pilot study period). The maximum flow rate was 480 scfm.
• Based on DO and SF6 tracer data, the ZOI of the sparge well at the maximum flow rate of 480 scfm is approximately 50 feet on both sides of the horizontal biosparge well. Reductions in measured thickness of LNAPL in wells and dissolved hydrocarbon concentrations suggest a more expansive influence zone of up to 100 feet on both sides of the well in some areas; however, the 50 foot ZOI is supported by all data collected during the pilot study.
• During the baseline gauging event (October 2015), LNAPL was measured in 21 monitoring or remediation wells in the south-central area. After 10 months of biosparging, only six wells contained measurable LNAPL. The average reduction in LNAPL thickness in all wells was 1.95 feet. Dissolved-phase TPH-g, TPH-d, benzene, and MTBE concentrations also showed significant reductions during the test period.
• Testing data indicate minimal risk for vapor intrusion, with VOC concentrations detected in offsite soil vapor monitoring probes below the residential or commercial screening criteria in all cases, except for one sample collected from the deepest probe of SVM-15 (1.7 µg/L benzene) in February 2016. A new RTO system has been brought online, which will further enhance SVE performance.
• Based on the favorable results of the pilot study, CH2M recommends continued operation of the south-central system and expansion of biosparging to the southeastern area, which will include a second horizontal well scheduled to be installed in the third or fourth quarter of 2017. Dual-nested soil vapor monitoring probes were recently installed in the southeastern area to facilitate shallow soil closure in the eastern 15-acre parcel. These probes will be utilized for monitoring soil vapors during future pilot testing and long-term operation of the southeastern biosparge system. Prior to construction, a biosparge system expansion work plan will be prepared and submitted to the RWQCB.
• An additional laser-induced fluorescence study, with pore fluid saturation sampling and analysis, is recommended for the south-central area after 2 to 3 years of biosparging to further characterize changes in LNAPL saturation and composition.
• CH2M also recommends continuing soil vapor monitoring of onsite and offsite probes in the south-central area on a quarterly basis; groundwater monitoring should continue to be performed on a semiannual basis in accordance with the current groundwater MRP.

SECTION 6
PR0426170600SCO 6-1
References AMEC Geomatrix, Inc. (AMEC). 2010. Summary of Capture Zone Analysis for Southeastern and South-Central Areas, Defense Fuel Support Point Norwalk, 15306 Norwalk Boulevard, Norwalk, California (SCP No. 0286B). July 8.
CH2M HILL (CH2M). 2013. Revised Groundwater Sampling and Analysis Plan, SFPP Norwalk Pump Station, 15306 Norwalk Boulevard, Norwalk, California. May 30.
CH2M HILL (CH2M). 2015. Horizontal Biosparge Well and Soil Vapor Monitoring Probe Completion Report, SFPP Norwalk Pump Station, 15306 Norwalk Boulevard, Norwalk, California. February 18.
Department of Toxic Substances Control (DTSC). 2011. Guidance for the Evaluation and Mitigation of Subsurface Vapor Intrusion to Indoor Air (Vapor Intrusion Guidance). October. http://www.dtsc.ca.gov/AssessingRisk/upload/Final_VIG_Oct_2011.pdf
Department of Toxic Substances Control (DTSC). 2015. Advisory for Active Soil Gas Investigations (the Advisory). July.
Department of Toxic Substances Control (DTSC). 2016. Human Health Risk Assessment (HHRA) Note Number 3: DTSC Recommended Methodology for use of U.S. EPA Regional Screening Levels (RSLs) in the Human Health Risk Assessment Process at Hazardous Waste Sites and Permitted Facilities. https://www.dtsc.ca.gov/AssessingRisk/upload/HHRA-Note-3-2016-01.pdf
Geomatrix Consultants, Inc. (Geomatrix). 2006. Vapor Intrusion Sampling and Human Health Risk Assessment, DFSP Norwalk Facility, Norwalk, California. December 15.

Tables
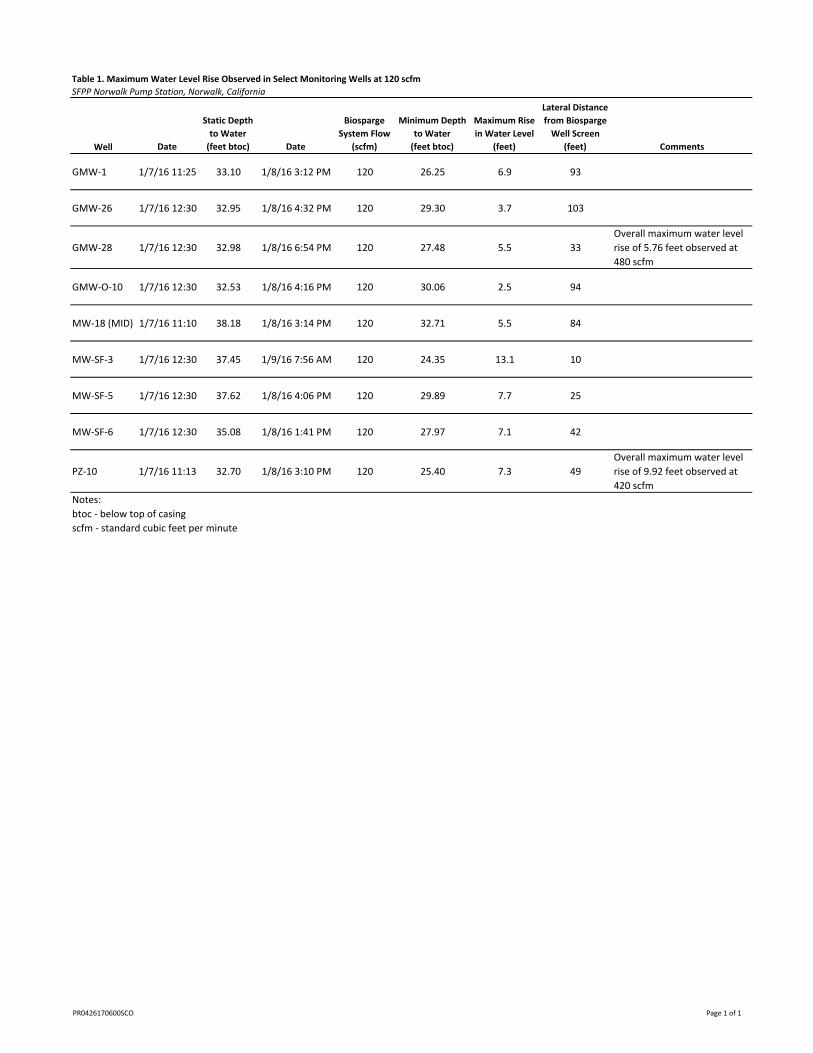
Table 1. Maximum Water Level Rise Observed in Select Monitoring Wells at 120 scfm
SFPP Norwalk Pump Station, Norwalk, California
Well Date
Static Depth
to Water
(feet btoc) Date
Biosparge
System Flow
(scfm)
Minimum Depth
to Water
(feet btoc)
Maximum Rise
in Water Level
(feet)
Lateral Distance
from Biosparge
Well Screen
(feet) Comments
GMW‐1 1/7/16 11:25 33.10 1/8/16 3:12 PM 120 26.25 6.9 93
GMW‐26 1/7/16 12:30 32.95 1/8/16 4:32 PM 120 29.30 3.7 103
GMW‐28 1/7/16 12:30 32.98 1/8/16 6:54 PM 120 27.48 5.5 33
Overall maximum water level
rise of 5.76 feet observed at
480 scfm
GMW‐O‐10 1/7/16 12:30 32.53 1/8/16 4:16 PM 120 30.06 2.5 94
MW‐18 (MID) 1/7/16 11:10 38.18 1/8/16 3:14 PM 120 32.71 5.5 84
MW‐SF‐3 1/7/16 12:30 37.45 1/9/16 7:56 AM 120 24.35 13.1 10
MW‐SF‐5 1/7/16 12:30 37.62 1/8/16 4:06 PM 120 29.89 7.7 25
MW‐SF‐6 1/7/16 12:30 35.08 1/8/16 1:41 PM 120 27.97 7.1 42
PZ‐10 1/7/16 11:13 32.70 1/8/16 3:10 PM 120 25.40 7.3 49
Overall maximum water level
rise of 9.92 feet observed at
420 scfm
Notes:
btoc ‐ below top of casing
scfm ‐ standard cubic feet per minute
PR0426170600SCO Page 1 of 1

Table 2. SF6 Tracer Test Water Quality Results
SFPP Norwalk Pump Station, Norwalk, California
DO pH ORP SF6
Well Date (mg/L) (s.u.) (mV) (µg/L)
GMW‐1 2/17/2016 0.91 7.41 127.5 0.4723
GMW‐9 2/18/2016 7.48 8 23.4 0.0089
GMW‐23 2/18/2016 1.99 7.66 3.7 2.6881
GMW‐26 2/17/2016 0.54 6.54 ‐59.4 <0.0007
GMW‐28 2/17/2016 0.62 6.36 ‐54 0.1058
GMW‐29 2/17/2016 1.97 6.76 130.2 <0.0007
GMW‐30 2/18/2016 0.18 7.16 ‐88.5 1.3116
GMW‐O‐3 2/17/2016 1.19 6.85 ‐81.7 <0.0007
GMW‐O‐9 2/17/2016 1.15 6.77 156.7 <0.0007
GMW‐O‐10 2/18/2016 0.59 7.22 ‐111.3 <0.0007
GMW‐O‐14 2/18/2016 0.36 7.17 ‐136.5 <0.0008
HL‐3 2/17/2016 0.79 6.72 101.1 <0.0007
MW‐18 (MID) 2/17/2016 0.86 7.54 122.2 0.0478
MW‐SF‐13 2/18/2016 7.84 8.22 49 0.0044
MW‐SF‐14 2/18/2016 6.36 8.05 81.6 0.0038
MW‐SF‐16 2/18/2016 6.96 7.83 74.4 0.0007
PZ‐2 2/17/2016 2.33 7.19 ‐14 2.9962
PZ‐2 (FD) 2/17/2016 2.33 7.19 ‐14 3.1096
PZ‐10 2/18/2016 7.34 8.13 59.1 0.0109
Notes:
<0.0007 = less than laboratory minimum reporting limit
µg/L = micrograms per liter
DO = dissolved oxygen
mg/L = milligrams per liter
mV = millivolt(s)
ORP = oxidation‐reduction potential
s.u. = standard units
SF6 = sulfur hexafluoride
PR0426170600SCO Page 1 of 1

TVOCs TGNMOC Benzene Ethylbenzene Toluene Xylenes MTBE(ppmv) (ppmv) (ppbv) (ppbv) (ppbv) (ppbv) (ppbv)
7/14/2015 Pre‐dilution ‐‐‐ 650 7,000 950 7,900 6,100 <200
8/4/2015 Pre‐dilution ‐‐‐ 560 6,200 710 7,700 4,800 <0.097
8/17/2015 Post‐dilution ‐‐‐ 480 5,200 580 6,300 4,100 <0.099
9/1/2015 Post‐dilution ‐‐‐ 930 12,000 1,500 14,000 11,400 <0.140
10/6/2015 Post‐dilution ‐‐‐ 960 14,000 3,100 25,000 15,900 <200
11/10/2015 Post‐dilution 860 ‐‐‐ 9,100 1,800 15,000 9,400 <97
12/10/2015 Post‐dilution 580 ‐‐‐ 6,400 1,200 10,000 7,600 <120
1/4/2016 Post‐dilution 750 ‐‐‐ 9,600 2,400 20,000 13,500 <220
2/4/2016 Post‐dilution 2,000 ‐‐‐ 16,000 2,600 29,000 19,300 <610
3/3/2016 Post‐dilution 1,200 ‐‐‐ 11,000 3,000 27,000 27,500 <130
4/5/2016 Post‐dilution 760 ‐‐‐ 6,600 1,300 14,000 11,800 <95
5/13/2016 Post‐dilution 500 ‐‐‐ 4,100 850 9,400 6,900 <55
6/7/2016 Post‐dilution 480 ‐‐‐ 3,600 520 7,300 3,800 <79
7/7/2016 Post‐dilution 210 ‐‐‐ 1,100 73 1,500 460 <40
8/2/2016 Post‐dilution 270 ‐‐‐ 2,700 1,400 7,600 13,600 <40
9/7/2016 Post‐dilution 360 ‐‐‐ 2,400 970 6,000 9,800 <40
10/13/2016 Post‐dilution 320 ‐‐‐ 2,600 720 5,500 8,800 <38
Notes:
‐‐‐ = data not available
<38 = not detected at or above the laboratory reporting limit shown
ASTM = ASTM International
EPA = U.S. Environmental Protection Agency
MTBE = methyl tertiary butyl ether
ppbv = parts per billion by volume
ppmv = parts per million by volume
SCAQMD = South Coast Air Quality Management District
TGNMOC = total gaseous non‐methane organic carbon
TVOC = total volatile organic compound
Table 3. Extracted Vapor Analytical Results for Select VOCs
SFPP Norwalk Pump Station, Norwalk, California
Date
Sampled Location
EPA TO‐3 SCAQMD 25.1 EPA TO‐15
PR0426170600SCO Page 1 of 1

Table 4. Soil Vapor Probe Field PID and Vacuum Readings SFPP Norwalk Pump Station, Norwalk, California
9/23/2015
Off
Off
0
From To
SVM‐1 Offsite Shallow 5 5.5 0 0 0 0 0 0 0 0 0 0 0 0 0 0 0 0 0 0 ‐0.5 0.4 0 0 0 0 0 0 ‐0.5
SVM‐1 Offsite Deep 14.5 15 0 0 ‐2.7 0 ‐1.9 0 ‐2.2 0 ‐2 0 ‐2.3 0 ‐1.7 0 ‐1.9 0 ‐2.2 0 ‐1.8 0 ‐1.6 0 ‐1.7 0 ‐1.9 0 ‐1.8
SVM‐2 Offsite Shallow 5 5.5 0 0 0 0 0 0 0 0 0 0 0 0 0 0 0 0 0 0 0 0 0 0 0 0 0 0 ‐0.5
SVM‐3 Offsite Shallow 5 5.5 0 0 0 0 0 0 0 0.4 0 0 0 0 0 0 0 0 0 0 0 0.2 0 0 0 0 0 0 0
SVM‐3 Offsite Deep 15 15.5 4.3 0 0 0 0 0 0 1.4 0 0 ‐0.5 0 ‐0.5 0 ‐0.7 0 0 0 0 0.2 ‐0.8 1.1 ‐0.7 0 ‐0.7 0 ‐0.7
SVM‐5 Offsite Shallow 5 5.5 0.2 0.2 ‐0.5 0 0 0 ‐0.8 0 0 0 0 0 0 0 ‐0.6 0 ‐0.8 0 0 0 ‐0.6 0 0 0 0 0 ‐0.7
SVM‐5 Offsite Deep 15.5 16 0.2 0.1 ‐5.8 0 ‐5.8 0 ‐6.4 0 ‐5.2 0 0 0 ‐4.4 0 ‐5 0 ‐7.3 0 ‐3.7 0 ‐4.9 0 ‐4.6 0 ‐4.2 0 ‐4.4
SVM‐6 Offsite Shallow 6.5 7 0 0 0 0 0 0 0 1.7 0 0 0 0 0 0 0 0 0 0 0 0 0 0.4 0 0 0 0 ‐0.5
SVM‐6 Offsite Deep 15.5 16 0 0 ‐3.2 0 ‐2.6 0 ‐3.1 0 ‐1.9 0 ‐0.8 520 0 153 ‐0.8 47 0 0 ‐2.5 0 0 1 ‐2.7 0 ‐1.8 0 ‐4
SVM‐7 Offsite Shallow 7 7.5 0 0 0 0 0 0 0 0.7 0 0 0 0 0 0 0 0 0 0 0 0 ‐0.5 0 0 0 0 0 0
SVM‐7 Offsite Deep 13.25 13.75 0 0 0.6 0 0 0 0 0.3 0 0 0 0 0 0 0 0 0 0 ‐0.5 0 ‐0.5 0 ‐0.5 0 0 0 ‐0.8
SVM‐8 Offsite Shallow 5 5.5 0 0 0 0 0 0 ‐0.5 0.3 0 0 0 0 0 0 0 0 0 0 0 0 0 1.5 0 0 0 0 ‐0.5
SVM‐8 Offsite Deep 15 15.5 0.5 0.5 ‐1.9 0 ‐2 0 ‐2.2 4.4 ‐1.8 0 ‐1.7 0 ‐1.4 0 ‐1.7 0 ‐1.2 0 ‐1.1 0 ‐1.8 0 ‐1.6 0 ‐1.1 0 ‐1.7
SVM‐9 Offsite Shallow 5 5.5 1.1 ‐‐ ‐‐ ‐‐ ‐‐ ‐‐ ‐‐ ‐‐ ‐‐ ‐‐ ‐‐ ‐‐ ‐‐ ‐‐ ‐‐ ‐‐ ‐‐ ‐‐ ‐‐ ‐‐ ‐‐ ‐‐ ‐‐ ‐‐ ‐‐ 0 0
SVM‐9 Offsite Deep 14.5 15 0 ‐‐ ‐‐ ‐‐ ‐‐ ‐‐ ‐‐ ‐‐ ‐‐ ‐‐ ‐‐ ‐‐ ‐‐ ‐‐ ‐‐ ‐‐ ‐‐ ‐‐ ‐‐ ‐‐ ‐‐ ‐‐ ‐‐ ‐‐ ‐‐ 0 0
SVM‐10 Offsite Deep 15.5 16 0.5 0 0.5 0 0 0 0 0.4 0 0 0 0 0 0 0 0 0 0 0 0 0 0 0 0 0 0 0
SVM‐11 Onsite Shallow 7 7.5 0 0.5 0 0 0 0 0 5.1 0 0 0 97 0 348 0 3.6 0 0 0 ‐‐ ‐‐ ‐‐ ‐‐ 2.2 0 0 0
SVM‐11 Onsite Middle 15 15.5 0 0.5 0 0 ‐0.5 0 0 6 0 0 0 305 0 378 0 13.2 0 0 0 ‐‐ ‐‐ ‐‐ ‐‐ 57.4 0 0 ‐0.5
SVM‐11 Onsite Deep 21 21.5 0 0.2 0 0 0 0 0 ‐‐ ‐‐ ‐‐ ‐‐ 128 0 >2000 0 0 0 0 0 ‐‐ ‐‐ ‐‐ ‐‐ >15000 0 27.4 ‐0.6
SVM‐12 Onsite Shallow 7 7.5 0 0.2 0 0 0 0 0 0 0 0 0 0 0 0 0 0 0 0 0 0 0 0 0 0 0 0 0
SVM‐12 Onsite Middle 15 15.5 0 0.3 0 0.1 0 0 0 0 0 0 0 0 0 9.2 0 16.3 0 0 0 0 0 0 0 0 0 0 0
SVM‐12 Onsite Deep 22 22.5 0 0.8 0 0.1 0 0 0 0 0 0 0 0 0.5 1266 0 2770 0 0 0 0 0 0 0 0 0 0 0
SVM‐13 Onsite Shallow 7 7.5 2.3 1.4 ‐0.9 0 ‐1.2 0 0 0 0 0 0 0 ‐4.1 >2000 ‐5.8 0 ‐5.1 0 ‐2.1 0 ‐2.4 0 ‐2 0 ‐1.8 0 ‐1.5
SVM‐13 Onsite Middle 15.5 16 0.8 1.2 ‐5 0 ‐6.2 0 ‐5.5 0 ‐3.4 0 ‐2.9 0 ‐18.1 >2000 ‐19.7 0 ‐17.2 0 ‐14.2 2.3 ‐14.7 2 ‐14.7 0 ‐13.9 0 ‐12.8
SVM‐13 Onsite Deep 22.5 23 0 >15000 ‐6.1 1500 ‐8.8 100.3 ‐8.9 >2000 ‐3.5 353 ‐2.6 1111 ‐16 554 ‐17.4 145 ‐16.1 0 ‐18.6 0.6 ‐19.7 2 ‐19.2 0 ‐17.5 0 ‐16.1
SVM‐14 Onsite Shallow 7 7.5 0 >15000 0 160 0 1491 0 >2000 34.4 710 0 >2000 0.7 >2000 0 13000 0 0 0 1.2 0 3.8 0 0 0 0 0
SVM‐14 Onsite Middle 15 15.5 0 >15000 0.5 341.2 ‐0.6 3772 0 945 6 1471 0.9 >2000 1.4 >2000 0.8 >15000 1 2.6 1 0.8 0 3.1 0 0 0.5 0 1
SVM‐14 Onsite Deep 22 22.5 >2999 4195 6.6 >15000 1 >15000 7.5 >2000 0 >2000 45.7 >2000 55.5 >2000 53.2 >15000 52.4 >15000 25.2 >2000 20.6 2427 26.2 >15000 45.9 >15000 41.6
SVM‐15 Offsite Shallow 7 7.5 0 0 0 0 0 0 0 2.6 0 0 0 0 0 0 0 0 0 0 0 0 0 0 0 0 0 0 ‐0.5
SVM‐15 Offsite Middle 15 15.5 0 0 0 0 0 0 0 1.1 0 0 0 0 0 0 0 0 0 0 0 0 ‐0.5 0 0 0 0 0 ‐0.5
SVM‐15 Offsite Deep 22 22.5 0 0 ‐8.2 0 ‐8.9 0 ‐9.1 8.5 ‐3.8 82.3 ‐2.6 0 ‐2.7 20.48 ‐2.9 524 ‐2.9 0 ‐8.5 0 ‐7.5 0 ‐7.3 0 ‐3.5 0 ‐5.4
SVM‐16 Offsite Shallow 7 7.5 2.2 0 0 0 0 0 0 3.3 0 0 0 0 0 0 0 0 0 0 0 0 0 2.4 0 0 0 0 0
SVM‐16 Offsite Middle 15.5 16 0.2 0.2 ‐1.1 0 ‐1.2 0 ‐1 0 ‐1.1 0 ‐1 0 ‐0.6 0 ‐1 0 0 0 ‐0.6 0 ‐1.3 1.5 ‐1.1 0 ‐0.9 0 ‐1.2
SVM‐16 Offsite Deep 22 22.5 1300 1.1 ‐1.8 8 0 7.6 ‐1.6 0 ‐1.7 0 ‐1.7 0 ‐1.2 0 1.6 2.3 ‐0.7 5.8 ‐1.1 0.2 ‐1.8 2.2 ‐1.5 4.2 ‐1.5 0 ‐1.6
Notes:
Field PID readings collected using MiniRae 3000 or MultiRae IR 4‐gas meter, calibrated to 50 ppm hexane
‐‐ data not available
bgs = below ground surface
BS = Biosparge
in. H2O = inches of water
PID = photoionization detector
ppmv = parts per million by volume
scfm = standard cubic feet per minute
SVE = soil vapor extraction
VOC = volatile organic compound
6/22/16 to 6/24/16Date 1/9/16 1/15/16 1/22/16 1/27/16 to 1/29/16 2/5/16
On
7/29/2016 8/29/16 to 8/31/16
SVE System On On On On On On On
2/12/16 2/19/16 2/24/16 to 2/26/16 4/27/16 to 4/29/16 6/17/2016
On On On On On
OnBS System On On On On On
110‐360
On On
BS Flow Rate (scfm) 120 180 240 360 500 500 500
On On On On On
500 240 420 420 460
PID
(ppmv)Probe Location Zone
Screen Interval
(feet bgs)PID
(ppmv)
PID
(ppmv)
Vacuum
(in. H2O)PID
(ppmv)
Vacuum
(in. H2O)PID
(ppmv)
Vacuum
(in. H2O)PID
(ppmv)
Vacuum
(in. H2O)PID
(ppmv)
Vacuum
(in. H2O)PID
(ppmv)
Vacuum
(in. H2O)PID
(ppmv)
Vacuum
(in. H2O)PID
(ppmv)
Vacuum
(in. H2O)PID
(ppmv)
Vacuum
(in. H2O)
Vacuum
(in. H2O)
Vacuum
(in. H2O)PID
(ppmv)
Vacuum
(in. H2O)PID
(ppmv)
Vacuum
(in. H2O)PID
(ppmv)
PR0426170600SCO Page 1 of 1

Table 5. Soil Vapor Probe VOCs Detection and Screening Level Exceedance SummarySFPP Norwalk Pump Station, Norwalk, California
From To VOCsa
Exceeds
SLb
VOCs
Exceeding
SL VOCsa
Exceeds
SLb
VOCs
Exceeding
SL VOCsa
Exceeds
SLb
VOCs
Exceeding
SL VOCsa
Exceeds
SLb
VOCs
Exceeding
SL VOCsa
Exceeds
SLb
VOCs
Exceeding
SL VOCsa
Exceeds
SLb
VOCs
Exceeding
SL
SVM‐1 Shallow 5 5.5 157 O ‐‐‐ ‐‐‐ O ‐‐‐ ‐‐‐ O ‐‐‐ ‐‐‐ O ‐‐‐ ‐‐‐ O ‐‐‐ ‐‐‐ O ‐‐‐ ‐‐‐
SVM‐1 Deep 14.5 15 157 O ‐‐‐ ‐‐‐ O ‐‐‐ ‐‐‐ O ‐‐‐ ‐‐‐ O ‐‐‐ ‐‐‐ O ‐‐‐ ‐‐‐ O ‐‐‐ ‐‐‐
SVM‐2 Shallow 5 5.5 252 O ‐‐‐ ‐‐‐ O ‐‐‐ ‐‐‐ O ‐‐‐ ‐‐‐ O ‐‐‐ ‐‐‐ O ‐‐‐ ‐‐‐ O ‐‐‐ ‐‐‐
SVM‐3 Shallow 5 5.5 190 O ‐‐‐ ‐‐‐ O ‐‐‐ ‐‐‐ O ‐‐‐ ‐‐‐ O ‐‐‐ O ‐‐‐ O ‐‐‐
SVM‐3 Deep 15 15.5 190 O ‐‐‐ O ‐‐‐ ‐‐‐ O ‐‐‐ ‐‐‐ O ‐‐‐ O ‐‐‐ O ‐‐‐
SVM‐5 Shallow 5 5.5 98 O ‐‐‐ ‐‐‐ O ‐‐‐ ‐‐‐ O ‐‐‐ ‐‐‐ O ‐‐‐ ‐‐‐ O ‐‐‐ ‐‐‐ O ‐‐‐ ‐‐‐
SVM‐5 Deep 15.5 16 98 O ‐‐‐ O ‐‐‐ ‐‐‐ O ‐‐‐ ‐‐‐ O ‐‐‐ ‐‐‐ O ‐‐‐ ‐‐‐ O ‐‐‐ ‐‐‐
SVM‐6 Shallow 6.5 7 139 O ‐‐‐ ‐‐‐ O ‐‐‐ O ‐‐‐ ‐‐‐ O ‐‐‐ ‐‐‐ O ‐‐‐ ‐‐‐ O ‐‐‐ ‐‐‐
SVM‐6 Deep 15.5 16 139 O ‐‐‐ ‐‐‐ O ‐‐‐ O ‐‐‐ ‐‐‐ O ‐‐‐ ‐‐‐ O ‐‐‐ ‐‐‐ O ‐‐‐ ‐‐‐
SVM‐7 Shallow 7 7.5 209 O ‐‐‐ ‐‐‐ O ‐‐‐ ‐‐‐ O ‐‐‐ ‐‐‐ O ‐‐‐ ‐‐‐ O ‐‐‐ ‐‐‐ O ‐‐‐
SVM‐7 Deep 13.25 13.75 209 O ‐‐‐ ‐‐‐ O ‐‐‐ ‐‐‐ O ‐‐‐ ‐‐‐ O ‐‐‐ ‐‐‐ O ‐‐‐ ‐‐‐ O ‐‐‐ ‐‐‐
SVM‐8 Shallow 5 5.5 202 O ‐‐‐ ‐‐‐ O ‐‐‐ ‐‐‐ O ‐‐‐ ‐‐‐ O ‐‐‐ ‐‐‐ O ‐‐‐ ‐‐‐ O ‐‐‐ ‐‐‐
SVM‐8 Deep 15 15.5 202 O ‐‐‐ O ‐‐‐ ‐‐‐ O ‐‐‐ ‐‐‐ O ‐‐‐ ‐‐‐ O ‐‐‐ ‐‐‐ O ‐‐‐ ‐‐‐
SVM‐10 Deep 15.5 16 343 O ‐‐‐ ‐‐‐ O ‐‐‐ ‐‐‐ O ‐‐‐ ‐‐‐ O ‐‐‐ ‐‐‐ O ‐‐‐ ‐‐‐ O ‐‐‐ ‐‐‐
SVM‐15 Shallow 7 7.5 71 O ‐‐‐ ‐‐‐ O ‐‐‐ ‐‐‐ O ‐‐‐ ‐‐‐ O ‐‐‐ ‐‐‐ O ‐‐‐ ‐‐‐ O ‐‐‐ ‐‐‐
SVM‐15 Middle 15 15.5 71 O ‐‐‐ ‐‐‐ O ‐‐‐ ‐‐‐ O ‐‐‐ ‐‐‐ O ‐‐‐ ‐‐‐ O ‐‐‐ ‐‐‐ O ‐‐‐ ‐‐‐
SVM‐15 Deep 22 22.5 71 O ‐‐‐ ‐‐‐ benzene O ‐‐‐ ‐‐‐ O ‐‐‐ ‐‐‐ O ‐‐‐ ‐‐‐ O ‐‐‐ ‐‐‐
SVM‐16 Shallow 7 7.5 279 O ‐‐‐ ‐‐‐ O ‐‐‐ ‐‐‐ O ‐‐‐ ‐‐‐ O ‐‐‐ ‐‐‐ O ‐‐‐ ‐‐‐ O ‐‐‐ ‐‐‐
SVM‐16 Middle 15.5 16 279 O ‐‐‐ ‐‐‐ O ‐‐‐ ‐‐‐ O ‐‐‐ ‐‐‐ O ‐‐‐ ‐‐‐ O ‐‐‐ ‐‐‐ O ‐‐‐ ‐‐‐
SVM‐16 Deep 22 22.5 279 O ‐‐‐ O ‐‐‐ ‐‐‐ O ‐‐‐ O ‐‐‐ O ‐‐‐ O ‐‐‐ ‐‐‐
SVM‐11 Shallow 7 7.5 129 O ‐‐‐ ‐‐‐ O ‐‐‐ O ‐‐‐ ‐‐‐ O ‐‐‐ ‐‐‐ NS ‐‐‐ ‐‐‐ O ‐‐‐ ‐‐‐
SVM‐11 Middle 15 15.5 129 O ‐‐‐ ‐‐‐ O ‐‐‐ O ‐‐‐ ‐‐‐ O ‐‐‐ ‐‐‐ NS ‐‐‐ ‐‐‐ O ‐‐‐ ‐‐‐
SVM‐11 Deep 21 21.5 129 O ‐‐‐ ‐‐‐ O ‐‐‐ ‐‐‐ O ‐‐‐ ‐‐‐ O ‐‐‐ ‐‐‐ NS ‐‐‐ ‐‐‐ O ‐‐‐
SVM‐12 Shallow 7 7.5 31 O ‐‐‐ ‐‐‐ O ‐‐‐ ‐‐‐ O ‐‐‐ ‐‐‐ O ‐‐‐ ‐‐‐ O ‐‐‐ ‐‐‐ O ‐‐‐ ‐‐‐
SVM‐12 Middle 15 15.5 31 O ‐‐‐ ‐‐‐ O ‐‐‐ O ‐‐‐ ‐‐‐ O ‐‐‐ ‐‐‐ O ‐‐‐ ‐‐‐ O ‐‐‐ ‐‐‐
SVM‐12 Deep 22 22.5 31 O ‐‐‐ ‐‐‐ TPH‐g,
benzene O ‐‐‐ O ‐‐‐ ‐‐‐ O ‐‐‐ ‐‐‐ O ‐‐‐ ‐‐‐
SVM‐13 Shallow 7 7.5 19 O ‐‐‐ ‐‐‐ O ‐‐‐ ‐‐‐ O ‐‐‐ ‐‐‐ O ‐‐‐ ‐‐‐ O ‐‐‐ ‐‐‐ O ‐‐‐ ‐‐‐
SVM‐13 Middle 15.5 16 19 O ‐‐‐ ‐‐‐ O ‐‐‐ ‐‐‐ O ‐‐‐ ‐‐‐ O ‐‐‐ ‐‐‐ O ‐‐‐ ‐‐‐ O ‐‐‐ ‐‐‐
SVM‐13 Deep 22.5 23 19
TPH‐g,
benzene,
ethylbenzene O ‐‐‐ O ‐‐‐ ‐‐‐ O ‐‐‐ ‐‐‐ O ‐‐‐ ‐‐‐ O ‐‐‐ ‐‐‐
SVM‐14 Shallow 7 7.5 11 TPH‐g TPH‐g O ‐‐‐ ‐‐‐ O ‐‐‐ ‐‐‐ O ‐‐‐ ‐‐‐ O ‐‐‐ ‐‐‐
SVM‐14 Middle 15 15.5 11 O ‐‐‐
TPH‐g,
toluene,
xylenes O ‐‐‐ O ‐‐‐ O ‐‐‐ O ‐‐‐
SVM‐14 Deep 22 22.5 11
TPH‐g,
benzene,
toluene, xylenes,
n‐hexane
TPH‐g,
1,2,4‐TMB,
ethylbenzene,
toluene, xylenes
TPH‐g,
1,2,4‐TMB,
ethylbenzene,
xylenes TPH‐g,
1,2,4‐TMB TPH‐g,
1,2,4‐TMB 1,2,4‐TMB
Notes:
= one or more VOCs were positively detected
O = VOCs were not detected
= one or more VOCs were detected above the residential and/or commercial screening level
O = one or more VOCs were positively detected
‐‐‐ = not available or applicable
1,2,4‐TMB = 1,2,4‐trimethylbenzene
feet bgs = feet below ground surface
NS = not sampled
SL = residential or commercial screening level
TPH‐g = total petroleum hydrocarbons, quantified as gasoline
VOC = volatile organic compound
June 22 to 24, 2016 August 29 to 31, 2016
Onsite Probes
Lateral Distance
to Biosparge
Well Screen
(feet)Offsite Probes
April 27 to 29, 2016 May 25 to 27, 2016
b Exceeds SL
Screen Interval
(feet bgs)
a VOCs
January 27 to 29, 2016 February 24 to 26, 2016
PR0426170600SCO Page 1 of 1

Table 6. Gauging Data for Select Wells in the South‐Central Area ‐ March 2016 to October 2016SFPP Norwalk Pump Station, Norwalk, California
Well Date
Top of Casing
Elevation
(feet amsl)
Depth to
Product
(feet btoc)
Depth to
Water
(feet btoc)
Apparent
Product
Thickness
(feet)
Groundwater
Elevation
(feet amsl)
GMW‐1 03/14/16 74.77 ‐‐‐ 36.16 ‐‐‐ 38.61
GMW‐1 04/11/16 74.77 ‐‐‐ 34.00 ‐‐‐ 40.77
GMW‐1 06/29/16 74.77 ‐‐‐ 35.12 ‐‐‐ 39.65
GMW‐1 08/22/16 74.77 ‐‐‐ 35.06 ‐‐‐ 39.71
GMW‐1 10/03/16 74.77 ‐‐‐ 35.80 ‐‐‐ 38.97
GMW‐9 03/14/16 77.16 ‐‐‐ 36.10 ‐‐‐ 41.06
GMW‐9 04/11/16 77.16 ‐‐‐ 36.20 ‐‐‐ 40.96
GMW‐9 06/30/16 77.16 ‐‐‐ 31.02 ‐‐‐ 46.14
GMW‐9 08/22/16 77.16 ‐‐‐ 37.27 ‐‐‐ 39.89
GMW‐9 10/03/16 77.16 ‐‐‐ 38.02 ‐‐‐ 39.14
GMW‐10 03/16/16 73.35 33.42 34.47 1.05 39.74
GMW‐10 04/11/16 73.35 32.10 33.70 1.60 40.95
GMW‐10 06/29/16 73.35 ‐‐‐ 33.02 ‐‐‐ 40.33
GMW‐10 08/22/16 73.35 32.93 33.82 0.89 40.26
GMW‐10 10/03/16 73.35 33.65 35.10 1.45 39.43
GMW‐22 03/16/16 77.24 37.61 39.73 2.12 39.24
GMW‐22 04/11/16 77.24 35.50 38.59 3.09 41.17
GMW‐22 06/30/16 77.24 ‐‐‐ 36.55 ‐‐‐ 40.69
GMW‐22 08/22/16 77.24 ‐‐‐ NM ‐‐‐ NC
GMW‐22 10/03/16 77.24 ‐‐‐ 37.70 ‐‐‐ 39.54
GMW‐23 03/14/16 74.85 ‐‐‐ 36.35 ‐‐‐ 38.50
GMW‐23 04/11/16 74.85 34.10 34.12 0.02 40.75
GMW‐23 06/29/16 74.85 ‐‐‐ 35.25 ‐‐‐ 39.60
GMW‐23 08/22/16 74.85 ‐‐‐ 35.58 ‐‐‐ 39.27
GMW‐23 10/03/16 74.85 ‐‐‐ 36.15 ‐‐‐ 38.70
GMW‐24 03/16/16 77.48 ‐‐‐ 38.83 ‐‐‐ 38.65
GMW‐24 04/11/16 77.48 ‐‐‐ 37.10 ‐‐‐ 40.38
GMW‐24 06/29/16 77.48 ‐‐‐ 38.20 ‐‐‐ 39.28
GMW‐24 08/22/16 77.48 ‐‐‐ 38.40 ‐‐‐ 39.08
GMW‐24 10/03/16 77.48 ‐‐‐ 39.31 ‐‐‐ 38.17
GMW‐25 03/16/16 78.14 ‐‐‐ 38.99 ‐‐‐ 39.15
GMW‐25 04/12/16 78.14 ‐‐‐ 37.15 ‐‐‐ 40.99
GMW‐25 06/29/16 78.14 ‐‐‐ 38.40 ‐‐‐ 39.74
GMW‐25 08/22/16 78.14 ‐‐‐ 38.44 ‐‐‐ 39.70
GMW‐25 10/03/16 78.14 ‐‐‐ 38.70 ‐‐‐ 39.44
GMW‐26 03/14/16 74.52 ‐‐‐ 34.56 ‐‐‐ 39.96
GMW‐26 04/11/16 74.52 ‐‐‐ 35.55 ‐‐‐ 38.97
GMW‐26 06/29/16 74.52 ‐‐‐ 34.45 ‐‐‐ 40.07
GMW‐26 08/22/16 74.52 ‐‐‐ 34.58 ‐‐‐ 39.94
GMW‐26 10/03/16 74.52 ‐‐‐ 35.12 ‐‐‐ 39.40
GMW‐28 03/14/16 74.68 ‐‐‐ 35.66 ‐‐‐ 39.02
GMW‐28 04/11/16 74.68 ‐‐‐ 34.10 ‐‐‐ 40.58
GMW‐28 06/29/16 74.68 ‐‐‐ 34.95 ‐‐‐ 39.73
GMW‐28 08/22/16 74.68 ‐‐‐ 35.33 ‐‐‐ 39.35
GMW‐28 10/03/16 74.68 ‐‐‐ 35.81 ‐‐‐ 38.87
GMW‐29 03/14/16 77.57 ‐‐‐ 36.15 ‐‐‐ 41.42
GMW‐29 04/11/16 77.57 33.55 34.95 1.40 43.74
GMW‐29 06/29/16 77.57 34.50 37.82 3.32 42.41
GMW‐29 08/22/16 77.57 35.16 35.67 0.51 42.31
GMW‐29 10/03/16 77.57 35.75 36.00 0.25 41.77
GMW‐30 03/14/16 74.91 ‐‐‐ 36.22 ‐‐‐ 38.69
PR0426170600SCO Page 1 of 5

Table 6. Gauging Data for Select Wells in the South‐Central Area ‐ March 2016 to October 2016SFPP Norwalk Pump Station, Norwalk, California
Well Date
Top of Casing
Elevation
(feet amsl)
Depth to
Product
(feet btoc)
Depth to
Water
(feet btoc)
Apparent
Product
Thickness
(feet)
Groundwater
Elevation
(feet amsl)
GMW‐30 04/11/16 74.91 ‐‐‐ 34.01 ‐‐‐ 40.90
GMW‐30 06/29/16 74.91 ‐‐‐ 35.28 ‐‐‐ 39.63
GMW‐30 08/22/16 74.91 ‐‐‐ 35.40 ‐‐‐ 39.51
GMW‐30 10/03/16 74.91 ‐‐‐ 36.30 ‐‐‐ 38.61
GMW‐O‐2 03/14/16 72.54 ‐‐‐ 30.44 ‐‐‐ 42.10
GMW‐O‐2 04/11/16 72.54 ‐‐‐ 30.20 ‐‐‐ 42.34
GMW‐O‐2 06/29/16 72.54 ‐‐‐ 30.77 ‐‐‐ 41.77
GMW‐O‐2 08/22/16 72.54 ‐‐‐ 30.79 ‐‐‐ 41.75
GMW‐O‐2 10/03/16 72.54 ‐‐‐ 31.30 ‐‐‐ 41.24
GMW‐O‐3 03/14/16 72.19 ‐‐‐ 30.60 ‐‐‐ 41.59
GMW‐O‐3 04/11/16 72.19 ‐‐‐ 30.51 ‐‐‐ 41.68
GMW‐O‐3 06/29/16 72.19 ‐‐‐ 31.10 ‐‐‐ 41.09
GMW‐O‐3 08/22/16 72.19 ‐‐‐ 31.02 ‐‐‐ 41.17
GMW‐O‐3 10/03/16 72.19 ‐‐‐ 31.45 ‐‐‐ 40.74
GMW‐O‐4 03/14/16 71.95 ‐‐‐ 30.55 ‐‐‐ 41.40
GMW‐O‐4 04/11/16 71.95 ‐‐‐ 29.80 ‐‐‐ 42.15
GMW‐O‐4 06/29/16 71.95 ‐‐‐ 30.30 ‐‐‐ 41.65
GMW‐O‐4 08/22/16 71.95 ‐‐‐ 30.34 ‐‐‐ 41.61
GMW‐O‐4 10/03/16 71.95 ‐‐‐ 30.90 ‐‐‐ 41.05
GMW‐O‐4 (MID) 08/22/16 72.24 ‐‐‐ 37.57 ‐‐‐ 34.67
GMW‐O‐5 03/14/16 72.36 ‐‐‐ 30.98 ‐‐‐ 41.38
GMW‐O‐5 04/11/16 72.36 ‐‐‐ 30.30 ‐‐‐ 42.06
GMW‐O‐5 06/29/16 72.36 ‐‐‐ 30.13 ‐‐‐ 42.23
GMW‐O‐5 08/22/16 72.36 ‐‐‐ 31.01 ‐‐‐ 41.35
GMW‐O‐5 10/03/16 72.36 ‐‐‐ 31.43 ‐‐‐ 40.93
GMW‐O‐9 03/14/16 73.50 ‐‐‐ 31.88 ‐‐‐ 41.62
GMW‐O‐9 04/11/16 73.50 ‐‐‐ 31.62 ‐‐‐ 41.88
GMW‐O‐9 06/29/16 73.50 ‐‐‐ 31.41 ‐‐‐ 42.09
GMW‐O‐9 08/22/16 73.50 ‐‐‐ 32.66 ‐‐‐ 40.84
GMW‐O‐9 10/03/16 73.50 ‐‐‐ 33.03 ‐‐‐ 40.47
GMW‐O‐1 03/14/16 71.45 ‐‐‐ 30.66 ‐‐‐ 40.79
GMW‐O‐1 04/11/16 71.45 ‐‐‐ 29.71 ‐‐‐ 41.74
GMW‐O‐1 06/29/16 71.45 ‐‐‐ 30.50 ‐‐‐ 40.95
GMW‐O‐1 08/22/16 71.45 ‐‐‐ 30.61 ‐‐‐ 40.84
GMW‐O‐1 10/03/16 71.45 ‐‐‐ 31.20 ‐‐‐ 40.25
GMW‐O‐10 03/14/16 73.98 ‐‐‐ 32.65 ‐‐‐ 41.33
GMW‐O‐10 04/11/16 73.98 ‐‐‐ 32.23 ‐‐‐ 41.75
GMW‐O‐10 06/29/16 73.98 ‐‐‐ 32.20 ‐‐‐ 41.78
GMW‐O‐10 08/22/16 73.98 ‐‐‐ 34.18 ‐‐‐ 39.80
GMW‐O‐10 10/03/16 73.98 ‐‐‐ 33.13 ‐‐‐ 40.85
GMW‐O‐11 03/16/16 74.17 33.16 33.39 0.23 40.96
GMW‐O‐11 04/12/16 74.17 33.12 33.33 0.21 41.01
GMW‐O‐11 06/30/16 74.17 ‐‐‐ 31.50 ‐‐‐ 42.67
GMW‐O‐11 08/22/16 74.17 32.74 32.75 0.01 41.43
GMW‐O‐11 10/06/16 74.17 32.71 32.72 0.01 41.46
GMW‐O‐12 03/14/16 73.49 31.60 32.40 0.80 41.73
GMW‐O‐12 04/11/16 73.49 26.86 33.35 6.49 45.30
GMW‐O‐12 06/29/16 73.49 33.10 33.90 0.80 40.23
GMW‐O‐12 08/22/16 73.49 31.07 33.56 2.49 41.91
GMW‐O‐12 10/03/16 73.49 31.90 34.20 2.30 41.12
GMW‐O‐14 03/14/16 74.08 ‐‐‐ 32.62 ‐‐‐ 41.46
PR0426170600SCO Page 2 of 5

Table 6. Gauging Data for Select Wells in the South‐Central Area ‐ March 2016 to October 2016SFPP Norwalk Pump Station, Norwalk, California
Well Date
Top of Casing
Elevation
(feet amsl)
Depth to
Product
(feet btoc)
Depth to
Water
(feet btoc)
Apparent
Product
Thickness
(feet)
Groundwater
Elevation
(feet amsl)
GMW‐O‐14 04/11/16 74.08 ‐‐‐ 32.34 ‐‐‐ 41.74
GMW‐O‐14 06/29/16 74.08 ‐‐‐ 32.08 ‐‐‐ 42.00
GMW‐O‐14 08/22/16 74.08 ‐‐‐ 33.44 ‐‐‐ 40.64
GMW‐O‐14 10/03/16 74.08 ‐‐‐ 34.08 ‐‐‐ 40.00
GMW‐O‐20 03/16/16 73.32 ‐‐‐ 32.54 ‐‐‐ 40.78
GMW‐O‐20 04/12/16 73.32 ‐‐‐ 32.48 ‐‐‐ 40.84
GMW‐O‐20 06/29/16 73.32 ‐‐‐ 32.50 ‐‐‐ 40.82
GMW‐O‐20 08/22/16 73.32 ‐‐‐ 32.18 ‐‐‐ 41.14
GMW‐O‐20 10/03/16 73.32 ‐‐‐ 33.12 ‐‐‐ 40.20
GMW‐O‐21 03/14/16 71.43 33.17 33.20 0.03 38.25
GMW‐O‐21 04/11/16 71.43 31.84 32.17 0.33 39.52
GMW‐O‐21 06/29/16 71.43 32.83 33.03 0.20 38.56
GMW‐O‐21 08/22/16 71.43 ‐‐‐ 33.72 ‐‐‐ 37.71
GMW‐O‐21 10/03/16 71.43 ‐‐‐ 33.45 ‐‐‐ 37.98
GMW‐O‐23 03/16/16 73.63 ‐‐‐ 34.43 ‐‐‐ 39.20
GMW‐O‐23 04/12/16 73.63 ‐‐‐ 32.59 ‐‐‐ 41.04
GMW‐O‐23 06/29/16 73.63 ‐‐‐ 33.90 ‐‐‐ 39.73
GMW‐O‐23 08/22/16 73.63 ‐‐‐ 33.89 ‐‐‐ 39.74
GMW‐O‐23 10/03/16 73.63 ‐‐‐ 34.90 ‐‐‐ 38.73
GWR‐3 03/16/16 77.60 ‐‐‐ 38.60 ‐‐‐ 39.00
GWR‐3 04/11/16 77.60 ‐‐‐ 36.90 ‐‐‐ 40.70
GWR‐3 06/29/16 77.60 ‐‐‐ 37.77 ‐‐‐ 39.83
GWR‐3 08/22/16 77.60 ‐‐‐ 38.24 ‐‐‐ 39.36
GWR‐3 10/03/16 77.60 39.15 39.20 0.05 38.44
HL‐3 03/14/16 76.86 ‐‐‐ 36.84 ‐‐‐ 40.02
HL‐3 04/11/16 76.86 ‐‐‐ 36.03 ‐‐‐ 40.83
HL‐3 06/29/16 76.86 ‐‐‐ 36.60 ‐‐‐ 40.26
HL‐3 08/22/16 76.86 ‐‐‐ 36.53 ‐‐‐ 40.33
HL‐3 10/03/16 76.86 ‐‐‐ 37.22 ‐‐‐ 39.64
MW‐18 (MID) 03/14/16 75.67 ‐‐‐ 40.70 ‐‐‐ 34.97
MW‐18 (MID) 04/11/16 75.67 ‐‐‐ 38.89 ‐‐‐ 36.78
MW‐18 (MID) 06/29/16 75.67 ‐‐‐ 39.94 ‐‐‐ 35.73
MW‐18 (MID) 08/22/16 75.67 ‐‐‐ 40.14 ‐‐‐ 35.53
MW‐18 (MID) 10/03/16 75.67 ‐‐‐ 40.93 ‐‐‐ 34.74
MW‐19 (MID) 04/11/16 78.14 ‐‐‐ 32.97 ‐‐‐ 45.17
MW‐19 (MID) 10/03/16 78.14 ‐‐‐ 40.60 ‐‐‐ 37.54
MW‐O‐1 03/14/16 75.48 ‐‐‐ DRY ‐‐‐ NC
MW‐O‐1 04/11/16 75.48 ‐‐‐ DRY ‐‐‐ NC
MW‐O‐1 06/29/16 75.48 ‐‐‐ DRY ‐‐‐ NC
MW‐O‐1 08/22/16 75.48 ‐‐‐ DRY ‐‐‐ NC
MW‐O‐1 10/03/16 75.48 ‐‐‐ DRY ‐‐‐ NC
MW‐O‐2 03/14/16 71.90 34.86 35.49 0.63 36.91
MW‐O‐2 04/11/16 71.90 32.54 33.03 0.49 39.26
MW‐O‐2 06/30/16 71.90 33.80 34.20 0.40 38.02
MW‐O‐2 08/22/16 71.90 ‐‐‐ 33.93 ‐‐‐ 37.97
MW‐O‐2 10/03/16 71.90 34.22 34.30 0.08 37.66
MW‐SF‐1 03/14/16 78.93 ‐‐‐ 40.40 ‐‐‐ 38.53
MW‐SF‐1 04/11/16 78.93 ‐‐‐ 37.96 ‐‐‐ 40.97
MW‐SF‐1 06/29/16 78.93 ‐‐‐ 39.05 ‐‐‐ 39.88
MW‐SF‐1 08/22/16 78.93 ‐‐‐ 39.04 ‐‐‐ 39.89
MW‐SF‐1 10/03/16 78.93 ‐‐‐ 39.20 ‐‐‐ 39.73
PR0426170600SCO Page 3 of 5

Table 6. Gauging Data for Select Wells in the South‐Central Area ‐ March 2016 to October 2016SFPP Norwalk Pump Station, Norwalk, California
Well Date
Top of Casing
Elevation
(feet amsl)
Depth to
Product
(feet btoc)
Depth to
Water
(feet btoc)
Apparent
Product
Thickness
(feet)
Groundwater
Elevation
(feet amsl)
MW‐SF‐2 03/16/16 78.53 ‐‐‐ 39.27 ‐‐‐ 39.26
MW‐SF‐2 04/11/16 78.53 ‐‐‐ 37.47 ‐‐‐ 41.06
MW‐SF‐2 06/29/16 78.53 ‐‐‐ 38.08 ‐‐‐ 40.45
MW‐SF‐2 08/22/16 78.53 ‐‐‐ 38.83 ‐‐‐ 39.70
MW‐SF‐2 10/03/16 78.53 ‐‐‐ 39.60 ‐‐‐ 38.93
MW‐SF‐3 03/14/16 78.12 39.40 39.43 0.03 38.71
MW‐SF‐3 04/11/16 78.12 ‐‐‐ 37.17 ‐‐‐ 40.95
MW‐SF‐3 06/30/16 78.12 ‐‐‐ 38.28 ‐‐‐ 39.84
MW‐SF‐3 08/23/16 78.12 ‐‐‐ 38.33 ‐‐‐ 39.79
MW‐SF‐3 10/03/16 78.12 ‐‐‐ 39.40 ‐‐‐ 38.72
MW‐SF‐4 03/14/16 79.38 ‐‐‐ 40.80 ‐‐‐ 38.58
MW‐SF‐4 04/11/16 79.38 ‐‐‐ 37.76 ‐‐‐ 41.62
MW‐SF‐4 06/29/16 79.38 ‐‐‐ 39.54 ‐‐‐ 39.84
MW‐SF‐4 08/22/16 79.38 ‐‐‐ 39.76 ‐‐‐ 39.62
MW‐SF‐4 10/03/16 79.38 ‐‐‐ 41.05 ‐‐‐ 38.33
MW‐SF‐5 03/14/16 79.74 ‐‐‐ DRY ‐‐‐ NC
MW‐SF‐5 04/11/16 79.74 ‐‐‐ DRY ‐‐‐ NC
MW‐SF‐5 06/29/16 79.74 ‐‐‐ DRY ‐‐‐ NC
MW‐SF‐5 08/22/16 79.74 ‐‐‐ DRY ‐‐‐ NC
MW‐SF‐5 10/03/16 79.74 ‐‐‐ DRY ‐‐‐ NC
MW‐SF‐6 03/14/16 76.80 38.08 38.10 0.02 38.72
MW‐SF‐6 04/11/16 76.80 ‐‐‐ 35.83 ‐‐‐ 40.97
MW‐SF‐6 06/29/16 76.80 ‐‐‐ 36.89 ‐‐‐ 39.91
MW‐SF‐6 08/22/16 76.80 ‐‐‐ 37.11 ‐‐‐ 39.69
MW‐SF‐6 10/03/16 76.80 ‐‐‐ 38.45 ‐‐‐ 38.35
MW‐SF‐9 03/14/16 74.10 ‐‐‐ 34.14 ‐‐‐ 39.96
MW‐SF‐9 04/11/16 74.10 ‐‐‐ 32.89 ‐‐‐ 41.21
MW‐SF‐9 06/29/16 74.10 ‐‐‐ 34.00 ‐‐‐ 40.10
MW‐SF‐9 08/22/16 74.10 ‐‐‐ NM ‐‐‐ NC
MW‐SF‐10 03/14/16 76.53 ‐‐‐ DRY ‐‐‐ NC
MW‐SF‐10 04/11/16 76.53 ‐‐‐ DRY ‐‐‐ NC
MW‐SF‐10 06/29/16 76.53 ‐‐‐ DRY ‐‐‐ NC
MW‐SF‐10 08/22/16 76.53 ‐‐‐ DRY ‐‐‐ NC
MW‐SF‐10 10/03/16 76.53 ‐‐‐ DRY ‐‐‐ NC
MW‐SF‐11 03/16/16 78.56 ‐‐‐ 39.56 ‐‐‐ 39.00
MW‐SF‐11 04/11/16 78.56 ‐‐‐ 37.62 ‐‐‐ 40.94
MW‐SF‐11 06/29/16 78.56 ‐‐‐ 37.06 ‐‐‐ 41.50
MW‐SF‐11 08/22/16 78.56 ‐‐‐ 39.25 ‐‐‐ 39.31
MW‐SF‐11 10/03/16 78.56 ‐‐‐ 40.05 ‐‐‐ 38.51
MW‐SF‐12 03/16/16 78.07 ‐‐‐ 39.03 ‐‐‐ 39.04
MW‐SF‐12 04/11/16 78.07 ‐‐‐ 37.13 ‐‐‐ 40.94
MW‐SF‐12 06/29/16 78.07 38.28 38.34 0.06 39.78
MW‐SF‐12 08/22/16 78.07 ‐‐‐ 38.60 ‐‐‐ 39.47
MW‐SF‐12 10/03/16 78.07 ‐‐‐ 39.45 ‐‐‐ 38.62
MW‐SF‐13 03/14/16 73.40 ‐‐‐ 34.72 ‐‐‐ 38.68
MW‐SF‐13 04/11/16 73.40 ‐‐‐ 32.28 ‐‐‐ 41.12
MW‐SF‐13 06/29/16 73.40 ‐‐‐ 33.62 ‐‐‐ 39.78
MW‐SF‐13 08/22/16 73.40 ‐‐‐ 33.66 ‐‐‐ 39.74
MW‐SF‐13 10/03/16 73.40 ‐‐‐ 34.20 ‐‐‐ 39.20
MW‐SF‐14 03/14/16 78.16 ‐‐‐ 36.21 ‐‐‐ 41.95
MW‐SF‐14 04/11/16 78.16 ‐‐‐ 37.14 ‐‐‐ 41.02
PR0426170600SCO Page 4 of 5

Table 6. Gauging Data for Select Wells in the South‐Central Area ‐ March 2016 to October 2016SFPP Norwalk Pump Station, Norwalk, California
Well Date
Top of Casing
Elevation
(feet amsl)
Depth to
Product
(feet btoc)
Depth to
Water
(feet btoc)
Apparent
Product
Thickness
(feet)
Groundwater
Elevation
(feet amsl)
MW‐SF‐14 06/29/16 78.16 ‐‐‐ 37.36 ‐‐‐ 40.80
MW‐SF‐14 08/22/16 78.16 ‐‐‐ DRY ‐‐‐ NC
MW‐SF‐14 10/03/16 78.16 ‐‐‐ DRY ‐‐‐ NC
MW‐SF‐15 03/14/16 78.27 ‐‐‐ 39.70 ‐‐‐ 38.57
MW‐SF‐15 04/11/16 78.27 ‐‐‐ 37.24 ‐‐‐ 41.03
MW‐SF‐15 06/29/16 78.27 ‐‐‐ 38.70 ‐‐‐ 39.57
MW‐SF‐15 08/22/16 78.27 ‐‐‐ 38.78 ‐‐‐ 39.49
MW‐SF‐15 10/03/16 78.27 ‐‐‐ 39.56 ‐‐‐ 38.71
MW‐SF‐16 03/14/16 78.21 ‐‐‐ 39.60 ‐‐‐ 38.61
MW‐SF‐16 04/11/16 78.21 ‐‐‐ 37.15 ‐‐‐ 41.06
MW‐SF‐16 06/29/16 78.21 ‐‐‐ 38.35 ‐‐‐ 39.86
MW‐SF‐16 08/22/16 78.21 ‐‐‐ 38.51 ‐‐‐ 39.70
MW‐SF‐16 10/03/16 78.21 ‐‐‐ 39.35 ‐‐‐ 38.86
PZ‐2 03/14/16 73.96 ‐‐‐ 34.72 ‐‐‐ 39.24
PZ‐2 04/11/16 73.96 ‐‐‐ 32.97 ‐‐‐ 40.99
PZ‐2 06/29/16 73.96 ‐‐‐ 34.04 ‐‐‐ 39.92
PZ‐2 08/22/16 73.96 ‐‐‐ 33.95 ‐‐‐ 40.01
PZ‐2 10/03/16 73.96 ‐‐‐ 34.67 ‐‐‐ 39.29
PZ‐3 04/11/16 76.17 ‐‐‐ 34.07 ‐‐‐ 42.10
PZ‐10 03/14/16 74.34 ‐‐‐ DRY ‐‐‐ NC
PZ‐10 04/11/16 74.34 ‐‐‐ 33.37 ‐‐‐ 40.97
PZ‐10 06/29/16 74.34 ‐‐‐ DRY ‐‐‐ NC
PZ‐10 08/22/16 74.34 ‐‐‐ DRY ‐‐‐ NC
PZ‐10 10/03/16 74.34 ‐‐‐ DRY ‐‐‐ NC
Notes:
‐‐‐ = not detected or applicable
feet amsl = feet above mean sea level, based on Los Angeles County Datum, 1980
feet btoc = feet below top of casing
NC = not calculated
NM = not measured
PR0426170600SCO Page 5 of 5

Table 7. TPH and Select VOCs Analytical Summary ‐ March 2016 to October 2016
SFPP Norwalk Pump Station, Norwalk, California
Well Date TPH‐g TPH‐d Benzene Toluene Ethylbenzene Xylenes 1,2‐DCA MTBE TBA DIPE ETBE TAME
GMW‐1 03/15/16 <50 180 <0.50 <0.50 <0.50 <0.50 <0.50 0.85 <10 <1 <1 <1
GMW‐1 04/14/16 55 70 <0.50 <0.50 <0.50 7.7 <0.50 2.9 22 <1 <1 <1
GMW‐1 06/29/16 <50 69 <0.50 <0.50 <0.50 2.3 <0.50 2.9 16 <1 <1 <1
GMW‐1 08/23/16 <50 68 0.09 0.11 0.19 1.4 <0.50 1.8 12 0.12 <1 0.19
GMW‐1 10/06/16 57 150 0.56 <0.50 <0.50 2.9 <0.50 2.0 13 <1 <1 <1
GMW‐9 08/23/16 94 1700 0.71 <0.50 <0.50 3.4 <0.50 2.3 80 4.7 <1 <1
GMW‐9 10/06/16 67 140 4.6 <0.50 <0.50 <0.50 0.64 0.84 110 13 <1 <1
GMW‐23 03/15/16 540 13,000 4.6 <0.50 <0.50 2.4 <1 2.1 42 12 <1 <1
GMW‐23 06/30/16 120 23,000 2.7 <0.50 <0.50 2.1 <0.50 0.52 <10 <1 <1 <1
GMW‐23 08/23/16 59 730 0.08 0.03 0.09 <0.50 0.18 0.76 42 13 0.20 <1
GMW‐23 10/06/16 130 6,100 2.9 <0.50 <0.50 <0.50 <0.50 <0.50 14 4.8 <1 <1
GMW‐25 06/30/16 90 480 <0.50 <0.50 <0.50 3.2 <0.50 1.7 22 2.3 <1 <1
GMW‐25 08/23/16 <50 1,300 0.09 0.08 0.11 <0.50 0.73 0.82 160 6.4 0.20 <1
GMW‐25 10/06/16 70 780 <0.50 <0.50 <0.50 1.1 0.88 0.50 18 1.2 <1 <1
GMW‐26 03/15/16 <50 <100 <0.50 <0.50 <0.50 <0.50 1.5 1.2 <10 2.3 <1 <1
GMW‐26 04/14/16 <50 76 <0.50 <0.50 <0.50 <0.50 1.1 0.72 <10 1.4 <1 <1
GMW‐26 06/29/16 <50 <50 <0.50 <0.50 <0.50 <0.50 1.4 0.59 <10 1.5 <1 <1
GMW‐26 08/23/16 <50 77 0.01 0.01 0.09 <0.50 2.4 0.65 1.3 1.9 <1 <1
GMW‐26 10/06/16 <50 <50 <0.50 <0.50 <0.50 <0.50 2.3 0.64 <10 2.0 <1 <1
GMW‐28 03/15/16 520 390 230 1.9 2.2 6.5 <3 25 <30 11 <3 <3
GMW‐28 04/15/16 600 89 370 <2 4.5 <2 <4 25 <40 8.6 <4 <4
GMW‐28 06/30/16 230 540 3.5 <0.50 1.6 7.2 <0.50 16 <10 <1 <1 <1
GMW‐28 08/23/16 88 490 0.43 0.02 0.20 4.7 0.04 5.1 5.8 3.4 <1 0.21
GMW‐28 10/06/16 <50 <50 <0.50 <0.50 <0.50 <0.50 <0.50 1.6 46 19 <1 <1
GMW‐29 03/15/16 74,000 65,000 260 320 540 6,000 <40 <20 <400 <40 <40 <40
GMW‐30 03/15/16 9,100 3,500 1,100 20 33 920 <10 <5 <100 <10 <10 <10
GMW‐30 04/15/16 14,000 2,400 3,600 16 85 860 <30 <15 <300 <30 <30 <30
GMW‐30 06/30/16 1,600 6,400 34 0.88 1.5 6.7 1.4 3.4 33 8.6 <1 <1
GMW‐30 08/23/16 400 1,400 41 0.20 0.22 3.1 0.24 2.1 60 4.0 0.39 0.39
GMW‐30 10/07/16 360 3,600 24 0.60 2.6 3.0 1.2 2.3 27 6.0 <1 <1
GMW‐O‐2 03/14/16 <50 <100 <0.50 <0.50 <0.50 <0.50 <0.50 <0.50 <10 <1 <1 <1
GMW‐O‐2 04/12/16 <50 <50 <0.50 <0.50 <0.50 <0.50 <0.50 <0.50 <10 <1 <1 <1
GMW‐O‐2 06/29/16 <50 <50 <0.50 <0.50 <0.50 <0.50 <0.50 <0.50 <10 <1 <1 <1
GMW‐O‐2 10/04/16 <50 <50 <0.50 <0.50 <0.50 <0.50 <0.50 <0.50 <10 <1 <1 <1
GMW‐O‐3 03/14/16 <50 <100 <0.50 <0.50 <0.50 <0.50 <0.50 <0.50 <10 <1 <1 <1
GMW‐O‐3 04/12/16 <50 <50 <0.50 <0.50 <0.50 <0.50 <0.50 <0.50 <10 <1 <1 <1
GMW‐O‐3 06/29/16 <50 <50 <0.50 <0.50 <0.50 <0.50 <0.50 <0.50 <10 <1 <1 <1
GMW‐O‐3 08/22/16 <50 <50 <0.50 <0.50 <0.50 <0.50 <0.50 <0.50 <10 <1 <1 <1
GMW‐O‐3 10/05/16 <50 <50 <0.50 <0.50 <0.50 <0.50 <0.50 <0.50 <10 <1 <1 <1
PR0426170600SCO Page 1 of 3

Table 7. TPH and Select VOCs Analytical Summary ‐ March 2016 to October 2016
SFPP Norwalk Pump Station, Norwalk, California
Well Date TPH‐g TPH‐d Benzene Toluene Ethylbenzene Xylenes 1,2‐DCA MTBE TBA DIPE ETBE TAME
GMW‐O‐4 03/14/16 <50 <50 <0.50 <0.50 <0.50 <0.50 <0.50 <0.50 <10 <1 <1 <1
GMW‐O‐4 04/13/16 <50 <50 <0.50 <0.50 <0.50 <0.50 <0.50 <0.50 <10 <1 <1 <1
GMW‐O‐4 06/29/16 <50 <50 <0.50 <0.50 <0.50 <0.50 <0.50 <0.50 <10 <1 <1 <1
GMW‐O‐4 08/23/16 <50 <50 0.01 <0.50 0.08 <0.50 <0.50 0.12 1.9 <1 <1 <1
GMW‐O‐4 10/05/16 <50 <50 <0.50 <0.50 <0.50 <0.50 <0.50 <0.50 <10 <1 <1 <1
GMW‐O‐5 03/14/16 <50 <50 <0.50 <0.50 <0.50 <0.50 <0.50 <0.50 <10 <1 <1 <1
GMW‐O‐5 04/13/16 <50 <50 <0.50 <0.50 <0.50 <0.50 <0.50 <0.50 <10 <1 <1 <1
GMW‐O‐5 06/29/16 <50 <50 <0.50 <0.50 <0.50 <0.50 <0.50 <0.50 <10 <1 <1 <1
GMW‐O‐5 10/04/16 <50 <50 <0.50 <0.50 <0.50 <0.50 <0.50 <0.50 <10 <1 <1 <1
GMW‐O‐9 03/15/16 <50 <50 <0.50 <0.50 <0.50 <0.50 <0.50 <0.50 <10 <1 <1 <1
GMW‐O‐9 04/13/16 <50 59 <0.50 <0.50 <0.50 <0.50 <0.50 <0.50 <10 <1 <1 <1
GMW‐O‐9 06/29/16 <50 <50 <0.50 <0.50 <0.50 <0.50 <0.50 <0.50 <10 <1 <1 <1
GMW‐O‐9 08/22/16 <50 <50 <0.50 <0.50 <0.50 <0.50 <0.50 <0.50 <10 <1 <1 <1
GMW‐O‐9 10/05/16 <50 <50 <0.50 <0.50 <0.50 <0.50 <0.50 <0.50 <10 <1 <1 <1
GMW‐O‐1 03/14/16 <50 <100 <0.50 <0.50 <0.50 <0.50 <0.50 <0.50 <10 <1 <1 <1
GMW‐O‐1 04/12/16 <50 <50 <0.50 <0.50 <0.50 <0.50 <0.50 <0.50 <10 <1 <1 <1
GMW‐O‐1 06/29/16 <50 <50 <0.50 <0.50 <0.50 <0.50 <0.50 <0.50 <10 <1 <1 <1
GMW‐O‐1 08/22/16 <50 100 <0.50 <0.50 <0.50 <0.50 <0.50 <0.50 <10 <1 <1 <1
GMW‐O‐1 10/04/16 <50 <50 <0.50 <0.50 <0.50 <0.50 <0.50 <0.50 <10 <1 <1 <1
GMW‐O‐10 03/15/16 91 75 16 <0.50 3.4 <0.50 <0.50 <0.50 <10 <1 <1 <1
GMW‐O‐10 04/14/16 910 89 430 12 16 <2.5 <5 <2.5 <50 <5 <5 <5
GMW‐O‐10 06/29/16 87 <50 <0.50 <0.50 <0.50 <0.50 <0.50 <0.50 <10 <1 <1 <1
GMW‐O‐10 08/23/16 <50 52 0.05 0.05 0.12 <0.50 2.6 0.19 1.3 0.18 <1 <1
GMW‐O‐10 10/04/16 <50 <50 <0.50 <0.50 <0.50 <0.50 <0.50 <0.50 <10 <1 <1 <1
GMW‐O‐14 03/15/16 21,000 440 11,000 <50 240 250 <100 <50 <1000 240 <100 <100
GMW‐O‐14 04/15/16 3,200 930 1,300 <10 <10 <10 <20 13 <200 100 <20 <20
GMW‐O‐14 06/29/16 13,000 430 6,300 80 270 200 <40 30 <400 230 <40 <40
GMW‐O‐14 08/23/16 6,000 380 3,100 18 36 46 13 19 150 130 <60 12
GMW‐O‐14 10/07/16 30,000 640 12,000 72 390 290 <100 <50 <1000 220 <100 <100
GMW‐O‐20 06/29/16 23,000 7,500 6,800 560 370 1,300 <40 51 <400 <40 <40 <40
GMW‐O‐20 08/23/16 13,000 31,000 2,600 260 150 1,300 1.6 27 79 5.8 <60 <60
GMW‐O‐20 10/07/16 35,000 95,000 2,700 930 230 4,200 <40 38 <400 <40 <40 <40
GMW‐O‐21 10/07/16 18,000 2,000 2,900 21 280 1,600 <40 <20 <400 <40 <40 <40
GMW‐O‐23 06/29/16 17,000 120,000 250 89 88 1,700 <10 20 <100 <10 <10 <10
GMW‐O‐23 08/23/16 8,700 160,000 81 13 16 620 0.26 8.2 81 0.47 <20 <20
GMW‐O‐23 10/07/16 2,800 170,000 15 <4 9.3 110 <8 5.0 <80 <8 <8 <8
HL‐3 03/14/16 130 130 1.1 2.8 7.1 27 <0.50 <0.50 <10 <1 <1 <1
HL‐3 04/13/16 <50 100 <0.50 <0.50 0.80 3.0 <0.50 <0.50 <10 <1 <1 <1
HL‐3 06/29/16 <50 <50 <0.50 <0.50 <0.50 <0.50 <0.50 0.58 <10 <1 <1 <1
PR0426170600SCO Page 2 of 3

Table 7. TPH and Select VOCs Analytical Summary ‐ March 2016 to October 2016
SFPP Norwalk Pump Station, Norwalk, California
Well Date TPH‐g TPH‐d Benzene Toluene Ethylbenzene Xylenes 1,2‐DCA MTBE TBA DIPE ETBE TAME
HL‐3 10/06/16 <50 <50 <0.50 <0.50 <0.50 <0.50 <0.50 <0.50 <10 <1 <1 <1
MW‐18 (MID) 03/15/16 390 390 120 1.3 <0.50 0.91 <0.50 5.0 28 5.9 <1 <1
MW‐18 (MID) 04/13/16 390 440 65 1.4 <0.50 2.0 <1 4.7 74 1.5 <1 <1
MW‐18 (MID) 08/23/16 150 330 12 0.28 0.17 1.7 0.23 7.7 46 4.4 <1 0.20
MW‐18 (MID) 10/06/16 200 490 6.1 <0.50 <0.50 1.5 <1 2.7 55 1.3 <1 <1
MW‐O‐2 08/23/16 73,000 81,000 3,400 510 410 9,700 0.46 410 680 30 <80 16
MW‐SF‐1 06/30/16 260 760 0.69 <0.50 0.50 0.98 <1 1.6 19 <1 <1 <1
MW‐SF‐1 08/23/16 <100 920 0.89 0.31 0.32 1.6 0.02 0.76 9.9 0.21 <2 0.39
MW‐SF‐1 10/07/16 55 1,200 <0.50 <0.50 <0.50 <0.50 <0.50 0.57 <10 <1 <1 <1
MW‐SF‐4 06/30/16 540 20,000 2.3 <0.50 0.75 20 <0.50 <0.50 <10 <1 <1 <1
MW‐SF‐4 08/23/16 <100 5,000 0.57 0.13 0.27 2.2 <1 0.28 6.5 0.08 0.41 <2
MW‐SF‐4 10/07/16 <500 4,700 <2.5 <2.5 <2.5 <2.5 <5 <2.5 <50 <5 <5 <5
MW‐SF‐6 08/23/16 13,000 2,700 2,400 <10 66 1,300 <20 58 510 <20 <20 <20
MW‐SF‐6 10/07/16 8,400 10,000 430 <5 35 640 <10 53 390 <10 <10 <10
MW‐SF‐9 04/14/16 2,300 5,100 96 1.8 64 170 <3 1.7 130 3.4 <3 <3
MW‐SF‐13 08/23/16 790 2,600 2.6 1.2 8.2 24 <2 <1 <20 <2 <2 <2
MW‐SF‐13 10/07/16 5,300 4,400 <5 <5 200 350 <10 <5 <100 <10 <10 <10
MW‐SF‐14 04/15/16 370 17,000 4.7 <0.50 <0.50 39 <0.50 63 500 <1 <1 <1
MW‐SF‐15 08/23/16 300 1,400 5.2 0.57 3.0 23 0.04 38 440 5.2 0.78 1.4
MW‐SF‐15 10/07/16 <500 16,000 7.1 <2.5 <2.5 3.5 <5 26 720 12 <5 <5
PZ‐2 03/15/16 1,200 1,800 150 16 32 72 <2 4.0 <20 <2 <2 <2
PZ‐2 04/13/16 2,300 1,300 110 20 120 390 <2 1.3 <20 <2 <2 <2
PZ‐2 06/30/16 790 550 77 3.0 21 43 <0.50 1.2 <10 1.0 <1 <1
PZ‐2 08/23/16 590 570 62 7.9 12 37 0.55 1.3 11 1.4 <2 0.38
PZ‐2 10/06/16 410 550 3.5 0.84 8.2 22 <0.50 1.7 23 <1 <1 <1
PZ‐10 04/14/16 <200 240 <1 <1 <1 <1 <2 <1 <20 <2 <2 <2
Notes:
Results are expressed in units of micrograms per liter (µg/L)
‐‐‐ = not analyzed
< = not detected at or above the laboratory reporting limit shown
1,2‐DCA = 1,2‐dichloroethane
DIPE = di‐isopropyl ether
ETBE = ethyl tertiary butyl ether
MTBE = methyl tertiary butyl ether
TAME = tertiary amyl methyl ether
TBA = tertiary butyl alcohol
TPH‐d = total extractable petroleum hydrocarbons, quantified using a diesel standard
TPH‐g = total purgeable petroleum hydrocarbons, quantified using a gasoline standard
Xylenes = total of m,p‐xylene and o‐xylene when detected
PR0426170600SCO Page 3 of 3
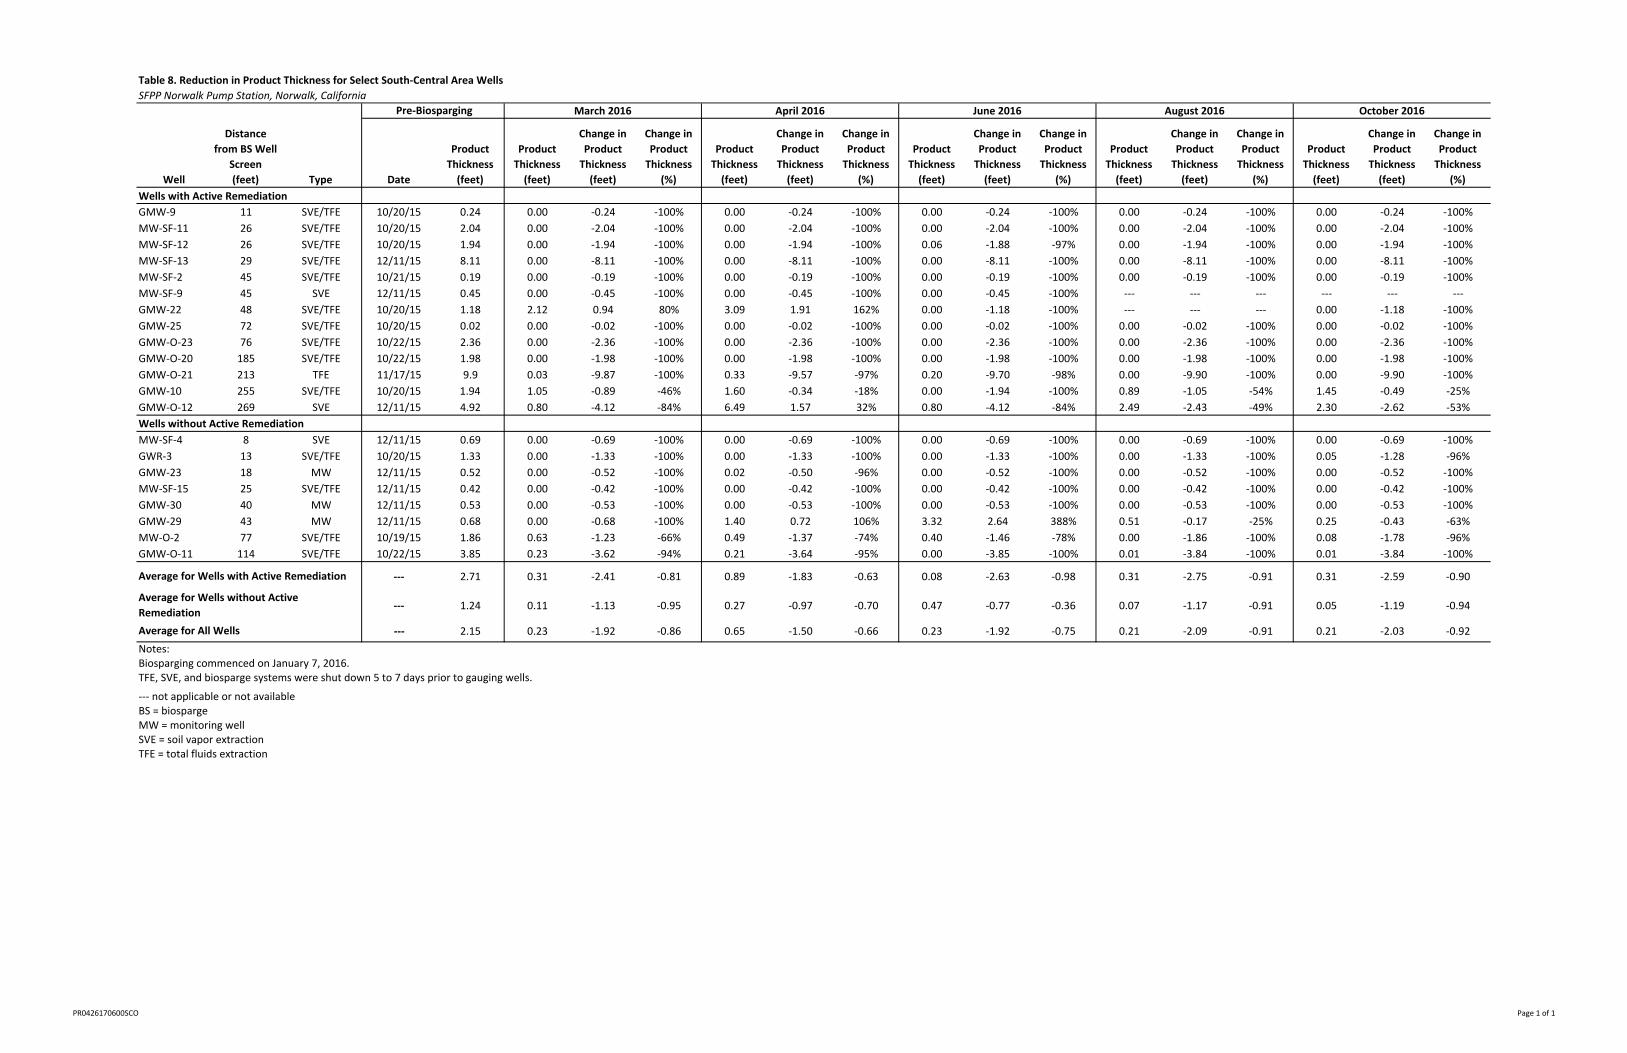
Table 8. Reduction in Product Thickness for Select South‐Central Area Wells
SFPP Norwalk Pump Station, Norwalk, California
Well
Distance
from BS Well
Screen
(feet) Type Date
Product
Thickness
(feet)
Product
Thickness
(feet)
Change in
Product
Thickness
(feet)
Change in
Product
Thickness
(%)
Product
Thickness
(feet)
Change in
Product
Thickness
(feet)
Change in
Product
Thickness
(%)
Product
Thickness
(feet)
Change in
Product
Thickness
(feet)
Change in
Product
Thickness
(%)
Product
Thickness
(feet)
Change in
Product
Thickness
(feet)
Change in
Product
Thickness
(%)
Product
Thickness
(feet)
Change in
Product
Thickness
(feet)
Change in
Product
Thickness
(%)
Wells with Active Remediation
GMW‐9 11 SVE/TFE 10/20/15 0.24 0.00 ‐0.24 ‐100% 0.00 ‐0.24 ‐100% 0.00 ‐0.24 ‐100% 0.00 ‐0.24 ‐100% 0.00 ‐0.24 ‐100%
MW‐SF‐11 26 SVE/TFE 10/20/15 2.04 0.00 ‐2.04 ‐100% 0.00 ‐2.04 ‐100% 0.00 ‐2.04 ‐100% 0.00 ‐2.04 ‐100% 0.00 ‐2.04 ‐100%
MW‐SF‐12 26 SVE/TFE 10/20/15 1.94 0.00 ‐1.94 ‐100% 0.00 ‐1.94 ‐100% 0.06 ‐1.88 ‐97% 0.00 ‐1.94 ‐100% 0.00 ‐1.94 ‐100%
MW‐SF‐13 29 SVE/TFE 12/11/15 8.11 0.00 ‐8.11 ‐100% 0.00 ‐8.11 ‐100% 0.00 ‐8.11 ‐100% 0.00 ‐8.11 ‐100% 0.00 ‐8.11 ‐100%
MW‐SF‐2 45 SVE/TFE 10/21/15 0.19 0.00 ‐0.19 ‐100% 0.00 ‐0.19 ‐100% 0.00 ‐0.19 ‐100% 0.00 ‐0.19 ‐100% 0.00 ‐0.19 ‐100%
MW‐SF‐9 45 SVE 12/11/15 0.45 0.00 ‐0.45 ‐100% 0.00 ‐0.45 ‐100% 0.00 ‐0.45 ‐100% ‐‐‐ ‐‐‐ ‐‐‐ ‐‐‐ ‐‐‐ ‐‐‐
GMW‐22 48 SVE/TFE 10/20/15 1.18 2.12 0.94 80% 3.09 1.91 162% 0.00 ‐1.18 ‐100% ‐‐‐ ‐‐‐ ‐‐‐ 0.00 ‐1.18 ‐100%
GMW‐25 72 SVE/TFE 10/20/15 0.02 0.00 ‐0.02 ‐100% 0.00 ‐0.02 ‐100% 0.00 ‐0.02 ‐100% 0.00 ‐0.02 ‐100% 0.00 ‐0.02 ‐100%
GMW‐O‐23 76 SVE/TFE 10/22/15 2.36 0.00 ‐2.36 ‐100% 0.00 ‐2.36 ‐100% 0.00 ‐2.36 ‐100% 0.00 ‐2.36 ‐100% 0.00 ‐2.36 ‐100%
GMW‐O‐20 185 SVE/TFE 10/22/15 1.98 0.00 ‐1.98 ‐100% 0.00 ‐1.98 ‐100% 0.00 ‐1.98 ‐100% 0.00 ‐1.98 ‐100% 0.00 ‐1.98 ‐100%
GMW‐O‐21 213 TFE 11/17/15 9.9 0.03 ‐9.87 ‐100% 0.33 ‐9.57 ‐97% 0.20 ‐9.70 ‐98% 0.00 ‐9.90 ‐100% 0.00 ‐9.90 ‐100%
GMW‐10 255 SVE/TFE 10/20/15 1.94 1.05 ‐0.89 ‐46% 1.60 ‐0.34 ‐18% 0.00 ‐1.94 ‐100% 0.89 ‐1.05 ‐54% 1.45 ‐0.49 ‐25%
GMW‐O‐12 269 SVE 12/11/15 4.92 0.80 ‐4.12 ‐84% 6.49 1.57 32% 0.80 ‐4.12 ‐84% 2.49 ‐2.43 ‐49% 2.30 ‐2.62 ‐53%
Wells without Active Remediation
MW‐SF‐4 8 SVE 12/11/15 0.69 0.00 ‐0.69 ‐100% 0.00 ‐0.69 ‐100% 0.00 ‐0.69 ‐100% 0.00 ‐0.69 ‐100% 0.00 ‐0.69 ‐100%
GWR‐3 13 SVE/TFE 10/20/15 1.33 0.00 ‐1.33 ‐100% 0.00 ‐1.33 ‐100% 0.00 ‐1.33 ‐100% 0.00 ‐1.33 ‐100% 0.05 ‐1.28 ‐96%
GMW‐23 18 MW 12/11/15 0.52 0.00 ‐0.52 ‐100% 0.02 ‐0.50 ‐96% 0.00 ‐0.52 ‐100% 0.00 ‐0.52 ‐100% 0.00 ‐0.52 ‐100%
MW‐SF‐15 25 SVE/TFE 12/11/15 0.42 0.00 ‐0.42 ‐100% 0.00 ‐0.42 ‐100% 0.00 ‐0.42 ‐100% 0.00 ‐0.42 ‐100% 0.00 ‐0.42 ‐100%
GMW‐30 40 MW 12/11/15 0.53 0.00 ‐0.53 ‐100% 0.00 ‐0.53 ‐100% 0.00 ‐0.53 ‐100% 0.00 ‐0.53 ‐100% 0.00 ‐0.53 ‐100%
GMW‐29 43 MW 12/11/15 0.68 0.00 ‐0.68 ‐100% 1.40 0.72 106% 3.32 2.64 388% 0.51 ‐0.17 ‐25% 0.25 ‐0.43 ‐63%
MW‐O‐2 77 SVE/TFE 10/19/15 1.86 0.63 ‐1.23 ‐66% 0.49 ‐1.37 ‐74% 0.40 ‐1.46 ‐78% 0.00 ‐1.86 ‐100% 0.08 ‐1.78 ‐96%
GMW‐O‐11 114 SVE/TFE 10/22/15 3.85 0.23 ‐3.62 ‐94% 0.21 ‐3.64 ‐95% 0.00 ‐3.85 ‐100% 0.01 ‐3.84 ‐100% 0.01 ‐3.84 ‐100%
‐‐‐ 2.71 0.31 ‐2.41 ‐0.81 0.89 ‐1.83 ‐0.63 0.08 ‐2.63 ‐0.98 0.31 ‐2.75 ‐0.91 0.31 ‐2.59 ‐0.90
‐‐‐ 1.24 0.11 ‐1.13 ‐0.95 0.27 ‐0.97 ‐0.70 0.47 ‐0.77 ‐0.36 0.07 ‐1.17 ‐0.91 0.05 ‐1.19 ‐0.94
‐‐‐ 2.15 0.23 ‐1.92 ‐0.86 0.65 ‐1.50 ‐0.66 0.23 ‐1.92 ‐0.75 0.21 ‐2.09 ‐0.91 0.21 ‐2.03 ‐0.92
Notes:Biosparging commenced on January 7, 2016.TFE, SVE, and biosparge systems were shut down 5 to 7 days prior to gauging wells.
‐‐‐ not applicable or not availableBS = biospargeMW = monitoring wellSVE = soil vapor extractionTFE = total fluids extraction
Average for All Wells
April 2016 June 2016 August 2016 October 2016
Average for Wells with Active Remediation
Pre‐Biosparging March 2016
Average for Wells without Active
Remediation
PR0426170600SCO Page 1 of 1

Table 9. TPH‐g Reduction in Select South‐Central Area Wells
SFPP Norwalk Pump Station, Norwalk, California
Well Type
Distance
from BS
Well Screen
(feet) Date
TPH‐g
(µg/L)
TPH‐g
(µg/L)
Reduction
(%)
TPH‐g
(µg/L)
Reduction
(%)
TPH‐g
(µg/L)
Reduction
(%)
TPH‐g
(µg/L)
Reduction
(%)
TPH‐g
(µg/L)
Reduction
(%)
MW‐SF‐4 SVE 8 01/15/13 13000 ns ‐‐‐ ns ‐‐‐ 540 ‐96% 50 ‐100% 250 ‐98%
GMW‐9 SVE/TFE 11 10/13/11 61000 ns ‐‐‐ ns ‐‐‐ ns ‐‐‐ 94 ‐100% 67 ‐100%
GMW‐23 MW 18 04/23/15 37000 540 ‐99% ns ‐‐‐ 120 ‐100% 59 ‐100% 130 ‐100%
MW‐SF‐15 SVE/TFE 25 10/14/11 35000 ns ‐‐‐ ns ‐‐‐ ns ‐‐‐ 300 ‐99% 250 ‐99%
MW‐SF‐1 SVE 26 01/15/13 8500 ns ‐‐‐ ns ‐‐‐ 260 ‐97% 50 ‐99% 55 ‐99%
MW‐SF‐13 SVE/TFE 29 10/14/11 42000 ns ‐‐‐ ns ‐‐‐ ns ‐‐‐ 790 ‐98% 5300 ‐87%
GMW‐28 MW 33 10/26/15 280 520 Increase 600 Increase 230 ‐18% 88 ‐69% 25 ‐91%
MW‐SF‐6 SVE/TFE 42 10/13/11 40000 ns ‐‐‐ ns ‐‐‐ ns ‐‐‐ 13000 ‐68% 8400 ‐79%
PZ‐10 MW 49 10/26/15 340 ns ‐‐‐ 100 ‐71% ns ‐‐‐ ns ‐‐‐ ns ‐‐‐
GMW‐O‐23 SVE/TFE 76 10/19/12 29000 ns ‐‐‐ ns ‐‐‐ 17000 ‐41% 8700 ‐70% 2800 ‐90%
GMW‐1 MW 93 10/23/15 110 25 ‐77% 55 ‐50% 25 ‐77% 25 ‐77% 57 ‐48%
GMW‐O‐10 MW 94 10/26/15 160 91 ‐43% 910 Increase 87 ‐46% 25 ‐84% 25 ‐84%
GMW‐O‐20 SVE/TFE 185 10/19/12 36000 ns ‐‐‐ ns ‐‐‐ 23000 ‐36% 13000 ‐64% 35000 ‐3%
GMW‐O‐14 MW 189 10/26/15 24000 21000 ‐13% 3200 ‐87% 13000 ‐46% 6000 ‐75% 30000 Increase
PZ‐2 MW 214 10/27/15 210 1200 Increase 2300 Increase 790 Increase 590 Increase 410 Increase
‐‐‐ ‐58% ‐‐‐ ‐69% ‐‐‐ ‐62% ‐‐‐ ‐85% ‐‐‐ ‐82%
Notes:Biosparging commenced on January 7, 2016TFE, SVE, and biosparge systems were shut down 5 to 7 days prior to sampling wells.Baseline samples for some wells could not be collected in October 2015 due to the presence of free product. The latest analytical results for these wells are provided above for comparisoto post‐biosparge conditions.Wells sampled as part of the pilot test evaluation that had nondetect concentrations during the background (October 2015) sampling event are not provided aboveWells with increases in concentrations during pilot testing (March through October 2016) are not included in the average TPH‐g reduction calculationBold and italic values indicate that the result was nondetect. One half of the reporting limit is listed for reduction calculation purposes
‐‐‐ not applicableµg/L = micrograms per literBS = biospargeMW = monitoring wellns = not sampledSVE = soil vapor extractionTFE = total fluids extractionTPH‐g = total petroleum hydrocarbons. quantified as gasoline (C4‐C13)
Average TPH‐g Reduction
October 2016Baseline March 2016 April 2016 June 2016 August 2016
PR0426170600SCO Page 1 of 1

Table 10. TPH‐d Reduction in Select South‐Central Area Wells
SFPP Norwalk Pump Station, Norwalk, California
Well Type
Distance
from BS
Well Screen
(feet) Date
TPH‐d or
TPH‐fp
(µg/L)
TPH‐d
(µg/L)
Change
(%)
TPH‐d
(µg/L)
Change
(%)
TPH‐d
(µg/L)
Change
(%)
TPH‐d
(µg/L)
Change
(%)
TPH‐d
(µg/L)
Change
(%)
MW‐SF‐4 SVE 8 01/15/13 3700 ns ‐‐‐ ns ‐‐‐ 20000 Increase 5000 Increase 4700 Increase
GMW‐9 SVE/TFE 11 10/13/11 7600 ns ‐‐‐ ns ‐‐‐ ns ‐‐‐ 1700 ‐78% 140 ‐98%
GMW‐23 MW 18 04/23/15 240000 13000 ‐95% ns ‐‐‐ 23000 ‐90% 730 ‐100% 6100 ‐97%
MW‐SF‐15 SVE/TFE 25 10/14/11 39000 ns ‐‐‐ ns ‐‐‐ ns ‐‐‐ 1400 ‐96% 16000 ‐59%
MW‐SF‐1 SVE 26 01/15/13 4100 ns ‐‐‐ ns ‐‐‐ 760 ‐81% 920 ‐78% 1200 ‐71%
MW‐SF‐13 SVE/TFE 29 10/14/11 13000 ns ‐‐‐ ns ‐‐‐ ns ‐‐‐ 2600 ‐80% 4400 ‐66%
GMW‐28 MW 33 10/26/15 360 390 Increase 89 ‐75% 540 Increase 490 Increase 25 ‐93%
MW‐SF‐6 SVE/TFE 42 10/13/11 11000 ns ‐‐‐ ns ‐‐‐ ns ‐‐‐ 2700 ‐75% 10000 ‐9%
PZ‐10 MW 49 10/26/15 1200 ns ‐‐‐ 240 ‐80% ns ‐‐‐ ns ‐‐‐ ns ‐‐‐
GMW‐25 SVE/TFE 72 10/13/11 31000 ns ‐‐‐ ns ‐‐‐ 480 ‐98% 1300 ‐96% 780 ‐97%
GMW‐O‐23 SVE/TFE 76 10/19/12 31000 ns ‐‐‐ ns ‐‐‐ 120000 Increase 160000 Increase 170000 Increase
GMW‐1 MW 93 10/23/15 140 180 Increase 70 ‐50% 69 ‐51% 68 ‐51% 150 Increase
GMW‐O‐10 MW 94 10/26/15 180 75 ‐58% 89 ‐51% 25 ‐86% 52 ‐71% 25 ‐86%
GMW‐O‐20 SVE/TFE 185 10/19/12 340000 ns ‐‐‐ ns ‐‐‐ 7500 ‐98% 31000 ‐91% 95000 ‐72%
GMW‐O‐14 MW 189 10/26/15 890 440 ‐51% 930 Increase 430 ‐52% 380 ‐57% 640 ‐28%
PZ‐2 MW 214 10/27/15 460 1800 Increase 1300 Increase 550 Increase 570 Increase 550 Increase
HL‐3 MW 284 10/23/15 60 130 Increase 100 Increase 25 ‐58% ns ‐‐‐ 25 ‐58%
‐‐‐ ‐68% ‐‐‐ ‐64% ‐‐‐ ‐77% ‐‐‐ ‐79% ‐‐‐ ‐70%
Notes:Biosparging commenced on January 7, 2016.TFE, SVE, and biosparge systems were shut down 5 to 7 days prior to sampling wells.Baseline samples for some wells could not be collected in October 2015 due to the presence of free product. The latest analytical results for these wells are provided above for comparisoto post‐biosparge conditions.Wells sampled as part of the pilot test evaluation that had nondetect concentrations during the background (October 2015) sampling event are not provided aboveWells with increases in concentrations during pilot testing (March through October 2016) are not included in the average TPH‐d reduction calculationBold and italic values indicate that the result was nondetect. One half of the reporting limit is listed for reduction calculation purposesFor wells GMW‐9, GMW‐25, MW‐SF‐6, MW‐SF‐13, and MW‐SF‐15, baseline TPH‐fp results are provided in lieu of TPH‐d results since TPH‐d results were unavailable
‐‐‐ not applicableµg/L = micrograms per literBS = biospargeMW = monitoring wellns = not sampledSVE = soil vapor extractionTFE = total fluids extractionTPH‐d = total petroleum hydrocarbons, quantified as diesel (C14‐C22)TPH‐fp = total petroleum hydrocarbons, quantified as fuel product (C8‐C22)
August 2016 October 2016
Average TPH‐d Reduction
Baseline March 2016 April 2016 June 2016
PR0426170600SCO Page 1 of 1

Table 11. Benzene Reduction in Select South‐Central Area Wells
SFPP Norwalk Pump Station, Norwalk, California
Well Type
Distance
from BS
Well Screen
(feet) Date
Benzene
(µg/L)
Benzene
(µg/L)
Change
(%)
Benzene
(µg/L)
Change
(%)
Benzene
(µg/L)
Change
(%)
Benzene
(µg/L)
Change
(%)
Benzene
(µg/L)
Change
(%)
MW‐SF‐4 SVE 8 01/15/13 5000 ns ‐‐‐ ns ‐‐‐ 2.3 ‐100% 0.57 ‐100% 1.25 ‐100%
GMW‐9 SVE/TFE 11 10/13/11 18000 ns ‐‐‐ ns ‐‐‐ ns ‐‐‐ 0.71 ‐100% 4.6 ‐100%
GMW‐23 MW 18 04/23/15 2100 4.6 ‐100% ns ‐‐‐ 2.7 ‐100% 0.08 ‐100% 2.9 ‐100%
MW‐SF‐15 SVE/TFE 25 10/14/11 11000 ns ‐‐‐ ns ‐‐‐ ns ‐‐‐ 5.2 ‐100% 7.1 ‐100%
MW‐SF‐1 SVE 26 01/15/13 4500 ns ‐‐‐ ns ‐‐‐ 0.69 ‐100% 0.89 ‐100% 0.25 ‐100%
MW‐SF‐13 SVE/TFE 29 10/14/11 12000 ns ‐‐‐ ns ‐‐‐ ns ‐‐‐ 2.6 ‐100% 2.5 ‐100%
GMW‐28 MW 33 10/26/15 3.3 230 Increase 370 Increase 3.5 Increase 0.43 ‐87% 0.25 ‐92%
MW‐SF‐6 SVE/TFE 42 10/13/11 14000 ns ‐‐‐ ns ‐‐‐ ns ‐‐‐ 2400 ‐83% 430 ‐97%
GMW‐25 SVE/TFE 72 10/13/11 9700 ns ‐‐‐ ns ‐‐‐ 0.25 ‐100% 0.09 ‐100% 0.25 ‐100%
GMW‐O‐23 SVE/TFE 76 10/19/12 7000 ns ‐‐‐ ns ‐‐‐ 250 ‐96% 81 ‐99% 15 ‐100%
GMW‐O‐20 SVE/TFE 185 10/19/12 6100 ns ‐‐‐ ns ‐‐‐ 6800 Increase 2600 ‐57% 2700 ‐56%
GMW‐O‐14 MW 189 10/26/15 12000 11000 Increase 1300 ‐89% 6300 ‐48% 3100 ‐74% 12000 0%
PZ‐2 MW 214 10/27/15 1.2 150 Increase 110 Increase 77 Increase 62 Increase 3.5 Increase
‐‐‐ ‐100% ‐‐‐ ‐89% ‐‐‐ ‐91% ‐‐‐ ‐92% ‐‐‐ ‐87%
Notes:Biosparging commenced on January 7, 2016.TFE, SVE, and biosparge systems were shut down 5 to 7 days prior to sampling wells.Baseline samples for some wells could not be collected in October 2015 due to the presence of free product. The latest analytical results for these wells are provided above for comparisoto post‐biosparge conditions.Wells sampled as part of the pilot test evaluation that had nondetect concentrations during the background (October 2015) sampling event are not provided aboveWells with increases in concentrations during pilot testing (March through October 2016) are not included in the average benzene reduction calculationBold and italic values indicate that the result was nondetect. One half of the reporting limit is listed for reduction calculation purposes
‐‐‐ not applicableµg/L = micrograms per literBS = biospargeMW = monitoring wellns = not sampledSVE = soil vapor extractionTFE = total fluids extraction
August 2016 October 2016
Average Benzene Reduction
Baseline March 2016 April 2016 June 2016
PR0426170600SCO Page 1 of 1

Table 12. MTBE Reduction in Select South‐Central Area Wells
SFPP Norwalk Pump Station, Norwalk, California
Well Type
Distance
from BS
Well Screen
(feet) Date
MTBE
(µg/L)
MTBE
(µg/L)
Change
(%)
MTBE
(µg/L)
Change
(%)
MTBE
(µg/L)
Change
(%)
MTBE
(µg/L)
Change
(%)
MTBE
(µg/L)
Change
(%)
MW‐SF‐4 SVE 8 01/15/13 380 ns ‐‐‐ ns ‐‐‐ 0.25 ‐100% 0.28 ‐100% 1.25 ‐100%
GMW‐9 SVE/TFE 11 10/13/11 2100 ns ‐‐‐ ns ‐‐‐ ns ‐‐‐ 2.3 ‐100% 0.84 ‐100%
MW‐SF‐15 SVE/TFE 25 10/14/11 780 ns ‐‐‐ ns ‐‐‐ ns ‐‐‐ 38 ‐95% 26 ‐97%
MW‐SF‐1 SVE 26 01/15/13 110 ns ‐‐‐ ns ‐‐‐ 1.6 ‐99% 0.76 ‐99% 0.57 ‐99%
MW‐SF‐13 SVE/TFE 29 10/14/11 580 ns ‐‐‐ ns ‐‐‐ ns ‐‐‐ 0.5 ‐100% 2.5 ‐100%
GMW‐28 MW 33 10/26/15 73 25 ‐66% 25 ‐66% 16 ‐78% 5.1 ‐93% 1.6 ‐98%
MW‐SF‐6 SVE/TFE 42 10/13/11 570 ns ‐‐‐ ns ‐‐‐ ns ‐‐‐ 58 ‐90% 53 ‐91%
GMW‐O‐23 SVE/TFE 76 10/19/12 400 ns ‐‐‐ ns ‐‐‐ 20 ‐95% 8.2 ‐98% 5 ‐99%
GMW‐1 MW 93 10/23/15 1.9 0.85 ‐55% 2.9 Increase 2.9 Increase 1.8 ‐5% 2 Increase
PZ‐2 MW 214 10/27/15 0.56 4 Increase 1.3 Increase 1.2 Increase 1.3 Increase 1.7 Increase
‐‐‐ ‐61% ‐‐‐ ‐66% ‐‐‐ ‐93% ‐‐‐ ‐87% ‐‐‐ ‐98%
Notes:Biosparging commenced on January 7, 2016.TFE, SVE, and biosparge systems were shut down 5 to 7 days prior to sampling wells.Baseline samples for some wells could not be collected in October 2015 due to the presence of free product. The latest analytical results for these wells are provided above for comparisoto post‐biosparge conditions.Wells sampled as part of the pilot test evaluation that had nondetect concentrations during the background (October 2015) sampling event are not provided aboveWells with increases in concentrations during pilot testing (March through October 2016) are not included in the average MTBE reduction calculationBold and italic values indicate that the result was nondetect. One half of the reporting limit is listed for reduction calculation purposes
‐‐‐ not applicableµg/L = micrograms per literBS = biospargeMTBE = methyl tertiary butyl etherMW = monitoring wellns = not sampledSVE = soil vapor extractionTFE = total fluids extraction
Average MTBE Reduction
August 2016 October 2016Baseline March 2016 April 2016 June 2016
PR0426170600SCO Page 1 of 1

Table 13. TBA Reduction in Select South‐Central Area Wells
SFPP Norwalk Pump Station, Norwalk, California
Well Type
Distance
from BS
Well Screen
(feet) Date
TBA
(µg/L)
TBA
(µg/L)
Change
(%)
TBA
(µg/L)
Change
(%)
TBA
(µg/L)
Change
(%)
TBA
(µg/L)
Change
(%)
TBA
(µg/L)
Change
(%)
GMW‐23 MW 18 04/23/15 360 42 ‐88% ns ‐‐‐ 5 ‐99% 42 ‐88% 14 ‐96%
MW‐SF‐15 SVE/TFE 25 10/14/11 2300 ns ‐‐‐ ns ‐‐‐ ns ‐‐‐ 440 ‐81% 720 ‐69%
GMW‐28 MW 33 10/26/15 20 15 ‐25% 20 0% 5 ‐75% 5.8 ‐71% 46 Increase
PZ‐10 MW 49 10/26/15 140 ns ‐‐‐ 10 ‐93% ns ‐‐‐ ns ‐‐‐ ns ‐‐‐
GMW‐1 MW 93 10/23/15 13 5 ‐62% 22 Increase 16 Increase 12 ‐8% 13 0%
PZ‐2 MW 214 10/27/15 42 10 ‐76% 10 ‐76% 5 ‐88% 11 ‐74% 23 ‐45%
‐‐‐ ‐63% ‐‐‐ ‐56% ‐‐‐ ‐87% ‐‐‐ ‐64% ‐‐‐ ‐53%
Notes:Biosparging commenced on January 7, 2016.TFE, SVE, and biosparge systems were shut down 5 to 7 days prior to sampling wells.Baseline samples for some wells could not be collected in October 2015 due to the presence of free product. The latest analytical results for these wells are provided above for comparisoto post‐biosparge conditions.Wells sampled as part of the pilot test evaluation that had nondetect concentrations during the background (October 2015) sampling event are not provided aboveWells with increases in concentrations during pilot testing (March through October 2016) are not included in the average TBA reduction calculationBold and italic values indicate that the result was nondetect. One half of the reporting limit is listed for reduction calculation purposes
‐‐‐ not applicableµg/L = micrograms per literBS = biospargeMW = monitoring wellns = not sampledSVE = soil vapor extractionTBA = tertiary butyl alcoholTFE = total fluids extraction
August 2016 October 2016
Average TBA Reduction
Baseline March 2016 April 2016 June 2016
PR0426170600SCO Page 1 of 1

Figures

North
0 24001200
Approximate scale in feet
Figure 1Site Loca on Map SFPP Norwalk Pump Sta onNorwalk, California
Site
EN1014151027SCO figure1.pdf 10/15
BASEMAP MODIFIED FROM U.S.G.S. 7.5 MINUTE QUADRANGLE MAPLOS ALAMITOS 1964, CALIFORNIA. PHOTO-REVISED 1981.WHITTIER 1965, CALIFORNIA. PHOTO-REVISED 1981.

SCO684731.PM.01 norwalk_fig2.ai 4/17
Figure 2
Hydrographs for Select Groundwater Monitoring Wells
SFPP Norwalk Pump Sta onNorwalk, California
0
20
40
60
80
100
120
140
15
20
25
30
35
40
45
50
55
60
1993 1996 1999 2002 2005 2008 2011 2014 2017
Pre
cip
ita
on
(in
ches
)
Gro
un
dw
ater
Ele
vao
n (
am
sl)
EXP-1 EXP-2 EXP-3 EXP-4 EXP-5
WCW-1 WCW-6 GMW-O-1 GMW-O-7 GMW-O-17
GMW-1 GMW-39 MW-12 PPT
Exposi on
UpperAquifer
Precipita on
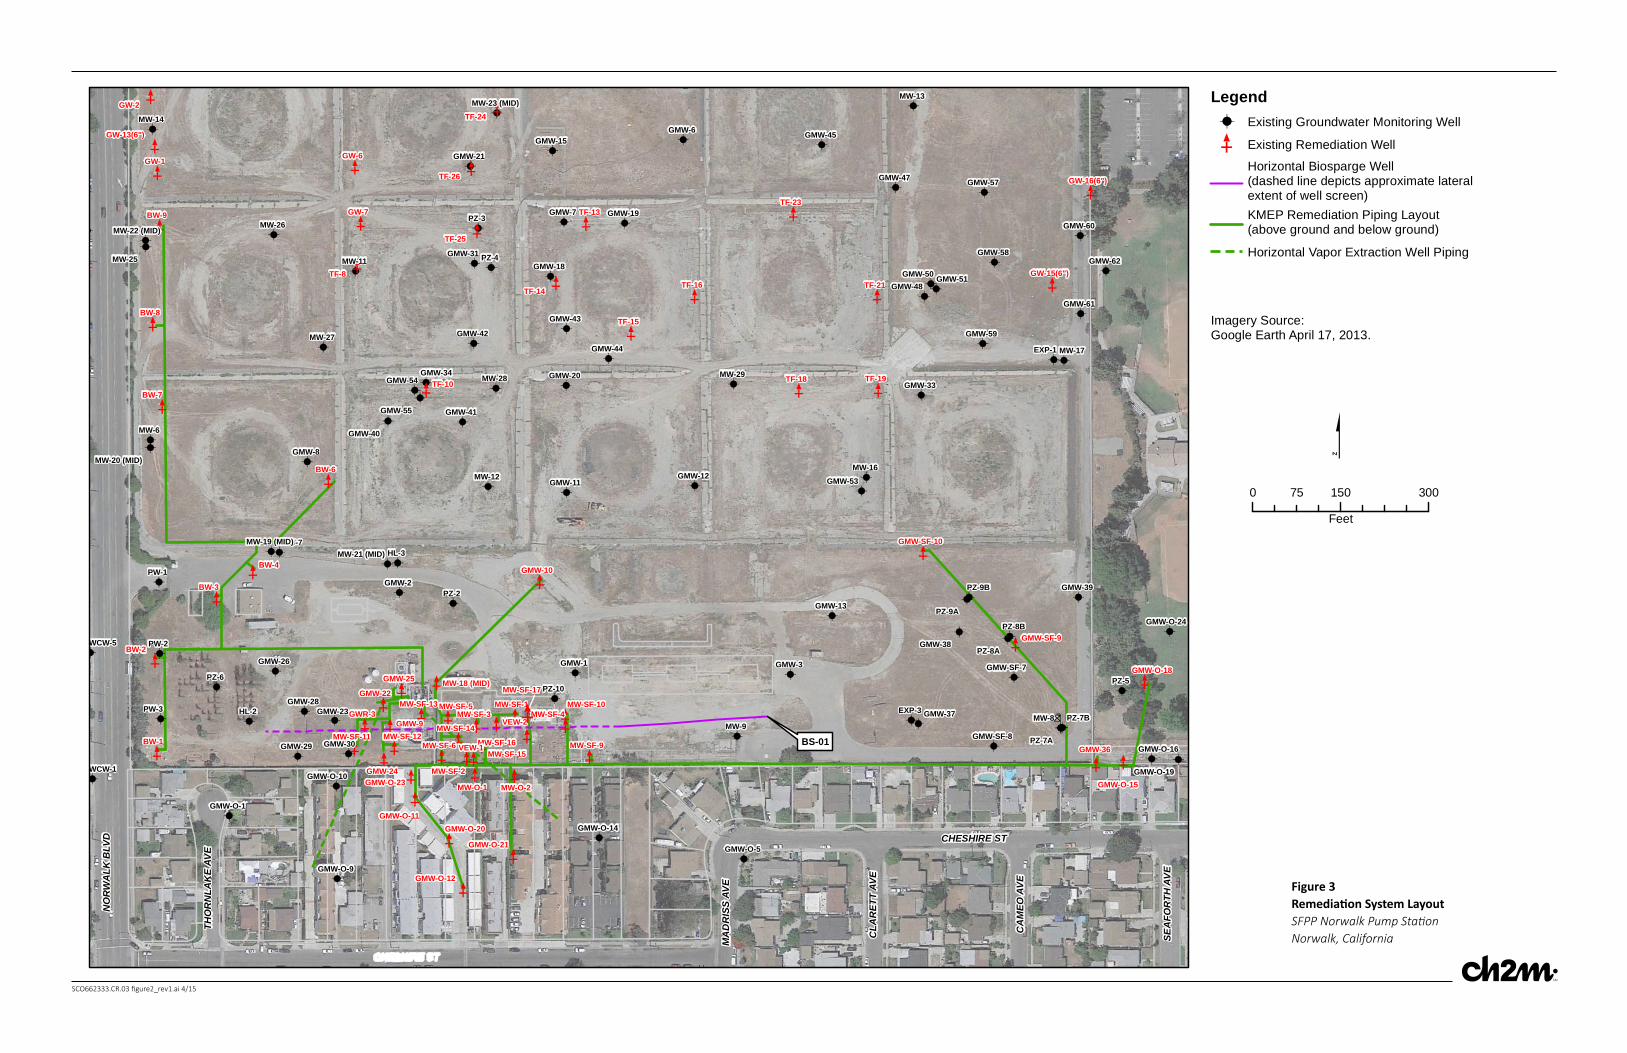
E
E
E
E
E
E
E
E
!A
!A
!A
!A
!A
!A
!A
!A
E
E
!A!A
!A
!A
!A
!A
!A
!A
E!A
E
E
!A
!A
!A !A
!A
!A!A
E
!A
!A
!A
!A !A
!A
!A
!A
!A
!A
!A!A!A
!A
!A!A
!A
!A
!A
!A
!A
!A
!A
A A !A
!A
!A
!A
E
E
!A
E!A
A
E
!A
E
E
E
E
E
!A
!A
E
E
E
E
E
E
E!A
!A
!A
!A
!A!A
!A
!A
!A
!A
!A
!A
E
!A
!A
!A
!A
!A
!A!A
!A
!A!A
E E
E
E
E EE
E E
E
E E
E
EE
E
!A
!A
!A
!A
!A
!A
!A!A
!A!A
!A
E
E
E
E
E
E
E E
E
E
E
E
E
E
E
!A
!A
!A
E
!A
!A!A!A
!A!ABS-01
PZ-6 PZ-5
PZ-4
PZ-3
PZ-2
PW-3
PW-2
PW-1
MW-9MW-8
MW-7
MW-6
HL-3
HL-2
PZ-7A
PZ-7B
PZ-8A
PZ-8B
WCW-5
WCW-1
PZ-10
PZ-9B
PZ-9A
MW-29MW-28
MW-27
MW-26
MW-25
MW-17
MW-16
MW-14
MW-13
MW-12
MW-11
GMW-8
GMW-7
GMW-6
GMW-3
GMW-2
GMW-1
EXP-3
EXP-1
GMW-62
GMW-61
GMW-60
GMW-59
GMW-58
GMW-57
GMW-55
GMW-54
GMW-53
GMW-51GMW-50GMW-48
GMW-47
GMW-45
GMW-44
GMW-43
GMW-42
GMW-41
GMW-40
GMW-39
GMW-38
GMW-37
GMW-34GMW-33
GMW-31
GMW-30GMW-29
GMW-28
GMW-26
GMW-23
GMW-21
GMW-20
GMW-19
GMW-18
GMW-15
GMW-13
GMW-12GMW-11
GMW-O-9
GMW-O-5
GMW-O-1
GMW-O-24
GMW-SF-8
GMW-SF-7
GMW-O-19
GMW-O-16
GMW-O-14
GMW-O-10
MW-23 (MID)
MW-22 (MID)
MW-21 (MID)
MW-20 (MID)
MW-19 (MID)
TF-8
GW-7
GW-6
GW-2
GW-1
BW-9
BW-8
BW-7
BW-6
BW-4
BW-3
BW-2
BW-1
VEW-2
TF-26
TF-25
TF-24
TF-23
TF-21
TF-19TF-18
TF-16
TF-15
TF-14
TF-13
TF-10
GMW-9
MW-O-2MW-O-1
GMW-36
GMW-25
GMW-24
GMW-22
GMW-10
MW-SF-9
MW-SF-5M
MW-SF-17MW-SF-17MW-SF-17
W-SF-4MW-SF-1
MW-SF-16MW-SF-15
MW-SF-12
MW-SF-10
GMW-SF-9
GMW-O-23
GMW-O-21
GMW-O-20
GMW-O-18
GMW-O-12
GMW-O-11
GW-16(6")
GW-15(6")
GW-13(6")
GMW-SF-10
MW-18 (MID)
VEW-1
GWR-3
MW-SF-6
MW-SF-3
MW-SF-2
MW-SF-14
MW-SF-13
MW-SF-11
GMW-O-15
NO
RW
ALK
BLV
D
CA
MEO
AVE
MA
DR
ISS
AVE
CLA
RET
T AV
E
SEA
FOR
TH A
VE
THO
RN
LAK
E AV
E
CHESHIRE ST
Legend!A Existing Groundwater Monitoring Well
E Existing Remediation Well
Horizontal Biosparge Well(dashed line depicts approximate lateralextent of well screen)KMEP Remediation Piping Layout(above ground and below ground)
Horizontal Vapor Extraction Well Piping
0 150 30075
Feet
$
Imagery Source:Google Earth April 17, 2013.
E
SCO662333.CR.03 figure2_rev1.ai 4/15
Figure 3Remedia on System Layout SFPP Norwalk Pump Sta on Norwalk, California

SCO684731.PM.01 norwalk_fig4.ai 4/17
Figure 4
Horizontal Biosparge Well Comple on Diagram
SFPP Norwalk Pump Sta onNorwalk, California
70
EastWest
60
50
40
30
20
10
0-250 -300 -350-200-150-100-500
Ele
vatio
n (fe
et a
bove
mea
n se
a le
vel)
70
60
50
40
30
20
10
0
Ele
vatio
n (fe
et a
bove
mea
n se
a le
vel)
50100150200250300350400450500550600650700750800850900
TreatmentCompound
AccessRoad
BS-01
Well BoringEntry
4” SCH80PVC Casing
Lateral Distance from Entry Point (feet)
4” SCH80PVC Screen(0.010 inch)
Uppermost Groundwater Zone
Bellflower Aquitard
VadoseZone
MW-SF-11SFPP Active
Fuel Pipelines
GMW-29(projected 10')
MW-SF-16(projected 10')
MW-SF-6(projected 10')
MW-SF-9(projected 10') MW-9
GroundSurface
GMW-24(projected 10')
MW-SF-12 MW-SF-15
Inferred HistoricalExtent of LNAPL Zone
(Smear Zone)
Inferred HistoricalExtent of LNAPL Zone
(Smear Zone)
Inferred HistoricalExtent of LNAPL Zone
(Smear Zone)
LEGEND
Monitoring or TFE/SVE Well Screen
Horizontal Biosparge Well Screen
Approximate Groundwater Eleva onin Uppermost Groundwater Zone (April 2013)
Note:Top of the Bellfower Aquitard was interpretedbased on (1) review of the lithological descrip onsprovided on the select well and boring logs(Preliminary Conceptual Site Model, AMECGeomatrix, Inc., February 13, 2009) and (2)Conceptual Site Model and Proposed AlternateInterim Remedy for Soil, Groundwater, and LNAPL(CH2M HILL, September 3, 2013)

SCO684731.PM.01 norwalk_fig5.ai 4/17
Figure 5
Biosparge Well and
Soil Vapor Monitoring Probe Loca ons
SFPP Norwalk Pump Sta onNorwalk, California
E
E
E
E
E
E
E
E
E
!A
!A
!A
!A
!A
!A
!A
!A
!A
E
E
!A!A
!A
!A
!A
!A
!A
!A
!A
!A
E!A
E
E
!A !A
!A
!A !A
!A
!A
!A!A
!A
E
!A
!A
!A
!A !A
!A
!A
!A
!A
!A
!A!A!A
!A!A
!A!A
!A
!A
!A
!A
!A
!A
!A
A A !A
!A
!A
!A
E
E
!A
E!A
A
E
!A
E
E
E
E
E
!A
!A
E
EE
E
E
E
EE
!A
E!A
!A
!A
!A
!A!A
!A
!A
!A
!A
!A
!A
!A
E
!A
!A
!A
!A
!A
!A!A
!A
!A!A
E E
E
E
E EE
E E
E
E E
E
EE
E
!A
!A
!A
!A
!A
!A
!A!A
!A!A
!A
E
E
E
E
E
E
E
E
E
E E
E
E
E
E
E
E
E
E
E
!A
!A
!A
!A
E
!A
!A!A!A
!A!A!(
!(
!( !(
!(
!(
!(
!(!(
!(
!(
!( !(
!(
!(
!(
!(
!(
PZ-6 PZ-5
PZ-4
PZ-3
PZ-2
PW-3
PW-2
PW-1
MW-9MW-8
MW-7
MW-6
HL-3
HL-2
PZ-7APZ-7B
PZ-8A
PZ-8BWCW-5
WCW-1
PZ-10
PZ-9B
PZ-9A
MW-29MW-28
MW-27
MW-26MW-25
MW-17
MW-16
MW-15
MW-14
MW-13
MW-12
MW-11
GWR-1
GMW-8
GMW-7
GMW-6
GMW-4
GMW-3
GMW-2
GMW-1
EXP-3
EXP-1
GMW-66
GMW-62
GMW-61
GMW-60
GMW-59
GMW-58
GMW-57
GMW-55
GMW-54
GMW-53
GMW-52
GMW-51
GMW-50GMW-48
GMW-47
GMW-45
GMW-44
GMW-43
GMW-42
GMW-41
GMW-40
GMW-39
GMW-38
GMW-37
GMW-35
GMW-34GMW-33
GMW-32
GMW-31
GMW-30GMW-29
GMW-28
GMW-27GMW-26
GMW-23
GMW-21
GMW-20
GMW-19
GMW-18
GMW-17
GMW-15
GMW-14
GMW-13
GMW-12GMW-11
GMW-O-9
GMW-O-5
GMW-O-1
GMW-O-24
GMW-SF-8
GMW-SF-7
GMW-O-19GMW-O-16
GMW-O-14
GMW-O-10
MW-23 (MID)
MW-22 (MID)
MW-21 (MID)
MW-20 (MID)
MW-19 (MID)
TF-9
TF-8
GW-7
GW-6
GW-5GW-2
GW-1
BW-9
BW-8
BW-7
BW-6
BW-5
BW-4
BW-3
BW-2
BW-1
TF-26
TF-25
TF-24
TF-23
TF-22
TF-21
TF-20
TF-19TF-18
TF-17
TF-16
TF-15
TF-14
TF-13
TF-11
GMW-36
GMW-10
GMW-SF-9
GMW-O-21
GMW-O-20
GMW-O-18
GMW-O-15
GMW-O-12
GW-16(6")
GW-15(6")GW-14(6")
GW-13(6")
GMW-SF-10
TF-10
SVM-9
SVM-5
SVM-3
SVM-4
SVM-8
SVM-7
SVM-2
SVM-1SVM-6
SVM-10
BS-01
SVM-16
SVM-15
SVM-14
SVM-13SVM-12
SVM-11
DVLB
KLA
WR
ON
CHESHIRE ST
EVA OE
MA
C
EVA SSIR
DA
M
EVA TTER
ALC
EVA HT
ROF
AES
EVA EK
ALN
RO
HT
CHESHIRE ST
Legend!( New Soil Vapor Monitoring Probes
!( Previously Installed Soil Vapor Monitoring Probes
!( Horizontal Biosparge Well Entry Point!A Existing Groundwater Monitoring Well
E Existing Remediation Well
Horizontal Biosparge Well(dashed line depicts approximate lateralextent of well screen)KMEP Remediation Piping Layout(above ground and below ground)
Horizontal Vapor Extraction Well Piping
0 150 30075
Feet
$
Imagery Source:Google Earth April 17, 2013.

5.5'
1.5'
6.5'
7.5'7.0'
13.5'
14.5'
15.5'15.0'
18.5'
19.5'
22.5'22.0'
New, Disposable 1/4” Teflon Tubing
Ground Surface
Hydrated Granular Bentonite
Dry Granular Bentonite (~1 Foot in Thickness)
No. 3 Filter Pack Sand (~1 Foot Thickness)
6” Screen (Stainless Steel or Equivalent)
Cement
Sampling Valves
Traffic-Rated Completion
Nominal 8" borehole Hydrated Granular Bentonite
Dry Granular Bentonite (~1 Foot in Thickness)
No. 3 Filter Pack Sand (~1 Foot Thickness)
6” Screen (Stainless Steel or Equivalent)
Hydrated Granular Bentonite
Dry Granular Bentonite (~1 Foot in Thickness)
No. 3 Filter Pack Sand (~1 Foot Thickness)
6” Screen (Stainless Steel or Equivalent)
Not to Scale
SCO660076.a1.03 norwalk_fig3.ai 12/15
Figure 6Typical Nested Soil Vapor Monitoring Probe Comple on Diagram SFPP Norwalk Pump Sta onNorwalk, California

SCO684731.PM.01 norwalk_fig7.ai 4/17
Figure 7
DO, pH, ORP and Water Level Plot for GMW-1
SFPP Norwalk Pump Sta onNorwalk, California
BiospargeRamp up on
01/20/16 @ 12:25Q=240 SCFM
Biosparge SystemRestart on
01/22/16 @ 08:03Q=240 SCFM
BiospargeRamp up on
01/25/16 @ 12:30Q=300 SCFM
BiospargeRamp up on
01/27/16Q=360 SCFM
BiospargeRamp up on
01/29/16Q=420 SCFM
BiospargeShutdown due toSVE shutdown on01/31/16 @ 13:10
Biosparge SystemRestart on
02/01/16 @ 11:12Q=420 SCFM
BiospargeRamp up on
02/04/16Q=480 SCFM
Biosparge System Startup on
01/07/16 @ 12:37Q= 60 SCFM
Biosparge System Ramp up on
01/08/16 @ 10:30Q = 120 SCFM
Biosparge System Shutdown on
01/08/16 @19:00 Biosparge Sytem Restart on
01/11/16 @1300Q= 120 SCFM
Biosparge System Ramp Up on
01/15/16 @08:35Q=180 SCFM
24
26
28
30
32
34
36
38
40-1
0
1
2
3
4
5
6
7
8
9
1/6/2016 1/11/2016 1/16/2016 1/21/2016 1/26/2016 1/31/2016 2/5/2016
WL
( b
toc)
DO
, pH
, & O
RP
Date
GMW-1
DO (mg/L) pH ORP (Volts) Troll WL ( btoc) Manual WL ( btoc)

SCO684731.PM.01 norwalk_fig8.ai 4/17
Figure 8
DO, pH, ORP and Water Level Plot for GMW-26
SFPP Norwalk Pump Sta onNorwalk, California
Biosparge SystemStartup on
01/07/16 @ 12:37Q=60 SCFM
Biosparge SystemRamp up on
01/08/16 @ 10:30Q=120 SCFM
Biosparge Shutdown due toSVE Shutdown on 01/10/16 @ 19:00
Biosparge SystemRestart on
01/11/16 @ 13:00Q=120 SCFM
BiospargeShutdown due to SVE Shutdown on01/14/16 @ 08:00
Biosparge SystemRestart on
1/14/16 @ 13:05Q=120 SCFM
BiospargeRamp up on
01/15/16 @ 08:35Q=180 SCFM
BiospargeShutdown due to SVE shutdown on 01/18/16 @ 07:40
Biosparge SystemRestart on
01/18/16 @ 09:04Q=180 SCFM
Biosparge Ramp up on
01/20/16 @ 12:25Q=240 SCFM
Biosparge SystemRestart on
01/22/16 @ 08:03Q=240 SCFM
BiospargeRamp up on
01/25/16 @ 12:30Q=300 SCFM
BiospargeRamp up on
01/27/16Q=360 SCFM
BiospargeRamp up on
01/29/16Q=420 SCFM
BiospargeShutdown due to SVE shutdown on 01/31/16 @ 13:10
Biosparge SystemRestart on
02/01/16 @ 11:12Q=420 SCFM
Biosparge Ramp up on
02/04/16Q=480 SCFM
28
29
30
31
32
33
34
35
36-1
0
1
2
3
4
5
6
7
8
12/29/2015 1/3/2016 1/8/2016 1/13/2016 1/18/2016 1/23/2016 1/28/2016 2/2/2016 2/7/2016
WL
( b
toc)
DO
, pH
, & O
RP
Date
GMW-26
DO (mg/L) pH ORP (Volts) Troll WL ( btoc)

SCO684731.PM.01 norwalk_fig9.ai 4/17
Figure 9
DO, pH, ORP and Water Level Plot for GMW-28
SFPP Norwalk Pump Sta onNorwalk, California
Biosparge SystemStartup on
01/05/16 @ 14:20Q=60 SCFM
Biosparge shut off
Biosparge SystemStartup on
01/07/16 @12:37Q=60 SCFM
Biosparge SystemRamp up on
01/08/16 @ 10:30Q=120 SCFM
Biosparge Shutdown due toSVE shutdown on01/10/16 @ 19:00
Biospargeshutdown due toSVE shutdown on01/14/16 @ 08:00
Biosparge SystemRestart on
01/14/16 @ 13:05Q=120 SCFM
Biosparge SystemRamp up on
01/15/16 @ 08:35Q=180 SCFM
BiospargeShutdown due toSVE shutdown on01/18/16 @ 07:40
Biosparge SystemRestart on
01/18/16 @ 09:04Q=180 SCFM
BiospargeRamp up on
01/20/16 @ 12:25Q=240 SCFM
Biosparge SystemRestart on
01/22/16 @ 08:03Q=240 SCFM
BiospargeRamp up on
01/25/16 @ 12:30Q=300 SCFM
BiospargeRamp up on
01/27/16Q=360 SCFM
BiospargeRamp up on
01/29/16Q=420 SCFM
BiospargeShutdown due toSVE shutdown on01/31/16 @ 13:10
Biosparge SystemRestart on
02/01/16 @ 11:12Q=420 SCFM
BiospargeRamp up on
02/04/16Q=480 SCFM
23
25
27
29
31
33
35
37-1
0
1
2
3
4
5
6
7
8
12/29/2015 1/3/2016 1/8/2016 1/13/2016 1/18/2016 1/23/2016 1/28/2016 2/2/2016 2/7/2016
WL
( b
toc)
DO
, pH
, & O
RP
Date
GMW-28
DO (mg/L) pH ORP (Volts) Troll WL ( btoc)

SCO684731.PM.01 norwalk_fig10.ai 4/17
Figure 10
DO, pH, ORP and Water Level Plot for GMW-O-10
SFPP Norwalk Pump Sta onNorwalk, California
Biosparge SystemStartup on
01/05/16 @ 14:20Q=60 SCFM
Bisoparge shut off
Biosparge SystemStartup on
01/07/16 @ 12:37Q=60 SCFM
Biospare SystemRamp up on
01/08/16 @ 10:30Q=120 SCFM
Biosparge Shutdown due toSVE Shutdown on01/10/16 @ 19:00
Biosparge SystemRestart on
01/11/16 @ 13:00Q=120 SCFM
BiospargeShutdown due to SVE shutdown on01/14/16 @ 08:00
Biosparge SystemRestart on
01/14/16 @ 13:05Q=120 SCFM
Biosparge SystemRamp up on
01/15/16 @ 08:35Q=180 SCFM
Biosparge SystemRestart on
01/18/16 @ 09:04Q=180 SCFM
BiospargeRamp up on
01/20/16 @ 12:25Q=240 SCFM
Biosparge SystemRestart on
01/22/16 @ 08:03Q=240 SCFM
BiospargeRamp up on
01/25/16 @ 12:30Q=300 SCFM
BiospargeRamp up on
01/27/16Q=360 SCFM
BiospargeRamp up on
01/29/16Q=420 SCFM
BiospargeShutdown due toSVE shutdown on01/31/16 @ 13:10
Biosparge SystemRestart on
02/01/16 @ 11:12Q=420 SCFM
BiospargeRamp up on
02/04/16Q=480 SCFM
27
28
29
30
31
32
33
34
35
36
37-1
0
1
2
3
4
5
6
7
8
12/29/2015 1/3/2016 1/8/2016 1/13/2016 1/18/2016 1/23/2016 1/28/2016 2/2/2016 2/7/2016
WL
( b
toc)
DO
, pH
, & O
RP
Date
GMW-O-10
DO (mg/L) pH ORP (Volts) Troll WL ( btoc)

SCO684731.PM.01 norwalk_fig11.ai 4/17
Figure 11
DO, pH, ORP and Water Level Plot for MW-SF-5
SFPP Norwalk Pump Sta onNorwalk, California
Biosparge systemstartup on
01/07/16 @ 12:37Q=60 SCFM
Biosparge systemRamp up on
01/08/16 @ 10:30 Q=120 SCFM
Biosparge Shutdown due to SVE shutdown on01/10/16 @ 19:00
Biosparge SystemRestart on
01/11/16 @ 13:00Q=120 SCFM
Biosparge Shutdown due toSVE shutdown on01/14/16 @ 08:00
Biosparge systemRestart on
01/14/16 @ 13:05Q=120 SCFM
Biosparge SystemRamp up on
01/15/16 @ 08:35Q=180 SCFM
Biosparge Shutdown due toSVE shutdown on01/18/16 07:40
Biosparge SystemRestart on
01/18/16 @ 09:04Q=180 SCFM
Biosparge SystemRestart on
01/22/16 @ 08:03Q=240 SCFM
BiospargeRamp up on
01/25/16 @ 12:30Q=300 SCFM
BiospargeRamp up on
01/27/16Q=360 SCFM
BiospargeRamp up on
01/29/16Q=420 SCFM
BiospargeShutdown due toSVE shutdown on01/31/16 @ 13:10
Biosparge SystemRestart on
02/01/16 @ 11:12Q=420 SCFM
BiospargeRamp up on
02/04/16Q=480 SCFM
27
29
31
33
35
37
39
41
43
45-1
0
1
2
3
4
5
6
7
8
9
10
12/29/2015 1/3/2016 1/8/2016 1/13/2016 1/18/2016 1/23/2016 1/28/2016 2/2/2016 2/7/2016
WL
( b
toc)
DO
, pH
, & O
RP
Date
MW-SF-5
DO (mg/L) pH ORP (Volts) Troll WL ( btoc) Manual WL ( btoc)

SCO684731.PM.01 norwalk_fig12.ai 4/17
Figure 12
DO, pH, ORP and Water Level Plot for MW-SF-6
SFPP Norwalk Pump Sta onNorwalk, California
Biosparge SystemStartup on
01/07/16 @ 12:37Q=60 SCFM
Biosparge SystemRamp up on
01/08/16 @ 10:30Q=120 SCFM
BiosparageShutdown due to SVE shutdown on01/10/16 @ 19:00
Biosparge SystemRestart on
01/11/16 @ 13:00Q=120 SCFM
BiospargeRamp up on
01/15/16 @ 08:35Q=180 SCFM
BiospargeShutdown due toSVE shutdown on01/18/16 @ 07:40
27
29
31
33
35
37
39
41-2
0
2
4
6
8
10
12
14
16
1/7/2016 1/9/2016 1/11/2016 1/13/2016 1/15/2016 1/17/2016 1/19/2016
WL
( b
toc)
pH
& O
RP
Date
MW-SF-6
pH ORP (Volts) Troll WL ( btoc) Manual WL ( btoc)
* DO data are not available due to sensor failure

SCO684731.PM.01 norwalk_fig13.ai 4/17
GMW-16.9
GMW-263.7
GMW-285.5
GMW-O-102.5
MW-18 (MID)5.5
MW-SF-313.1
MW-SF-57.7
MW-SF-67.1
PZ-107.3
0
1
2
3
4
5
6
7
8
9
10
11
12
13
14
-120 -110 -100 -90 -80 -70 -60 -50 -40 -30 -20 -10 0 10 20 30 40 50 60 70 80 90 100 110 120
Max
imu
m R
ise
in W
ater
Lev
el (
feet
)
Lateral Distance from Biosparge Well Screen (feet)
Rise in Water Levels with Distance from Biosparge Well Screen - 120 scfm
Water Level Rise Generally Decreases with Distance from Biosparge Well
Biosparge Well Screen
South North
Figure 13
Rise in Water Levels with Distance from
Biosparge Well Screen – 120 scfm
SFPP Norwalk Pump Sta onNorwalk, California

SCO684731.PM.01 norwalk_fig14.ai 4/17
Figure 14
Dissolved Oxygen and SF6 Isoconcentra ons
in Groundwater
SFPP Norwalk Pump Sta onNorwalk, California
!A
E
E
E
!A
E
E
!A
!A
!A!A
!A
!A !A !A
!A
!A
!A
!A
E
E
!AE
E
E
E!A
!A
!A
!A
E
!A
!A
E E
E
E
E EE
E E
E
E E
E
EE
E
!A
!A
E
E
E
E
!(
!A
!(
!(
!(
!(
!(
!A
!A
!(
!(!(
!(
!(
!(
!(
!(
!(
!(
!(!(
!(
!(
!(
!(
!(
CHESHIRE ST
EVA SSIR
DA
M
EVA EK
ALN
RO
HT
CHESHIRE ST
GMW-97.480.0089
MW-SF-166.960.0007
MW-18 (MID)0.860.0478
PZ-22.333.1096/2.9962
HL-30.79<0.0007
PZ-107.340.0109
GMW-10.910.4723
GMW-300.181.3116
GMW-291.97<0.0007
GMW-280.620.1058
GMW-260.54<0.0007
GMW-231.992.6881
GMW-O-91.15<0.0007
GMW-O-8
GMW-O-31.19<0.0007
GMW-O-140.36<0.0008
GMW-O-100.59<0.0007
MW-SF-146.360.0038
MW-SF-137.840.0044
BS-01
0.0007
2.0
Legend!( Horizontal Biosparge Well Entry Point!( Destroyed Well!( Soil Vapor Monitoring Probes!A Monitoring Well
E Remediation WellHorizontal Biosparge Well(dashed line depicts approximate lateralextent of well screen)KMEP Remediation Piping Layout(above ground and below ground)
Horizontal Vapor Extraction Well PipingDissolved Oxygen Isoconcentration (mg/L)SF-6 Isoconcentration (μg/L)Combined Extent of SF-6 and DO Concentrations
0 16080
Feet
$
Imagery Source: Google Earth April 17, 2013.
Well DataGMW-1 - Well ID0.91 - DO Result (mg/L)0.4723 - SF-6 Result (μg/L)
Notes:1. SF-6 samples and DO data collected onFebruary 17 and 18, 2016.2. SF-6 samples analyzed by CH2M AppliedSciences Laboratory.

SCO684731.PM.01 norwalk_fig15.ai 4/17
Figure 15
Dissolved Oxygen Concentra on with Distance
from Biosparge Well Screen – 480 scfm
SFPP Norwalk Pump Sta onNorwalk, California
GMW-1
GMW-9
GMW-23
GMW-26GMW-28
GMW-29
GMW-30
GMW-O-3 GMW-O-9GMW-O-10
GMW-O-14
HL-3MW-18 (MID)
MW-SF-13
MW-SF-14
MW-SF-16
PZ-2
PZ-10
0
1
2
3
4
5
6
7
8
9
-450 -400 -350 -300 -250 -200 -150 -100 -50 0 50 100 150 200 250 300
Dis
solv
ed O
xyge
n C
on
cen
tra
on
(m
g/L)
Lateral Distance from Biosparge Well Screen (feet)
Dissolved Oxygen Concentra on with Distance from Biosparge Well Screen - 480 scfm
Average 2015 DO Concentra ons(Background Condi ons)
South North
Biosparge Well Screen

SCO684731.PM.01 norwalk_fig16.ai 4/17
Figure 16
SF6 Concentra on with Distance from Biosparge
Well Screen – 480 scfm
SFPP Norwalk Pump Sta onNorwalk, California
GMW-1
GMW-9
GMW-23
* GMW-26
GMW-28
* GMW-29
GMW-30
* GMW-O-3 * GMW-O-9 * GMW-O-10* GMW-O-14* HL-3
MW-18 (MID)
MW-SF-13
MW-SF-14
MW-SF-16
PZ-2
PZ-10
0.0001
0.001
0.01
0.1
1
10
-450 -400 -350 -300 -250 -200 -150 -100 -50 0 50 100 150 200 250 300
SF6
Co
nce
ntr
ao
n (
ug/
L)
Lateral Distance from Biosparge Well Screen (feet)
SF6 Concentra on with Distance from Biosparge Well Screen - 480 scfm
* Well sample was nondetect for SF6
South North
Biosparge Well Screen

SCO684731.PM.01 norwalk_fig17.ai 4/17
Figure 17
PID and Total VOCs Influent Concentra ons for SVE System
SFPP Norwalk Pump Sta onNorwalk, California
0
100
200
300
400
500
600
700
0
1,000
2,000
3,000
4,000
5,000
6,000
7,000
8,000
9,000
10,000
Jul-15 Jul-15 Aug-15 Sep-15 Oct-15 Nov-15 Dec-15 Jan-16 Feb-16 Mar-16 Apr-16 May-16 Jun-16 Jul-16 Aug-16 Sep-16 Oct-16 Nov-16 Dec-16
Bio
spar
ge S
yste
m F
low
Rat
e (s
cfm
)
PID
an
d T
VO
Cs
Influ
ent
Co
nce
ntr
ao
n (
pp
m)
PID and Total VOCs Influent Concentra ons for SVE System
PID Measurement TVOCs Biosparge Flow
Biosparge System Flow
Startup Ini atedon 1/7/16
Biosparge System Online with Periodic Shutdowns
Shut down on 11/1/16for RTO Install

SCO684731.PM.01 norwalk_fig18.ai 4/17
Figure 18
Soil Vapor Concentra ons – All Probes
SFPP Norwalk Pump Sta onNorwalk, California
0
100
200
300
400
500
600
0.1
1
10
100
1000
10000
100000
9/3/2015 10/23/2015 12/12/2015 1/31/2016 3/21/2016 5/10/2016 6/29/2016 8/18/2016 10/7/2016
Bio
spar
ge S
yste
m F
low
Rat
e (s
cfm
)
PID
Co
nce
ntr
ao
n (
pp
m)
Date
Soil Vapor Concentra ons - All Probes
SVM-1 S SVM-1 D SVM-2 S SVM-2 D SVM-3 S SVM-3 D SVM-5 SSVM-5 D SVM-6 S SVM-6 D SVM-7 S SVM-7 D SVM-8 S SVM-8 DSVM-10 S SVM-10 D SVM-11 S SVM-11 M SVM-11 D SVM-12 S SVM-12 MSVM-12 D SVM-13 S SVM-13 M SVM-13 D SVM-14 S SVM-14 M SVM-14 DSVM-15 S SVM-15 M SVM-15 D SVM-16 S SVM-16 M SVM-16 D Flow
Background Biosparge System Online
Biosparge System Flow
Startup Ini atedon 1/7/16
* Concentra ons less than 0.1 ppm are not shown
SVM-14 (onsite deep probe) PID concentra onsremain high during background and biosparge opera ons

SCO684731.PM.01 norwalk_fig19.ai 4/17
Figure 19
Soil Vapor PID Concentra on with Distance
from Biosparge Well Screen – All Probes
SFPP Norwalk Pump Sta onNorwalk, California
0.1
1
10
100
1000
10000
100000
-400 -350 -300 -250 -200 -150 -100 -50 0 50 100 150 200 250 300 350 400
PID
Co
nce
ntr
ao
n (
pp
m)
Lateral Distance from Biosparge Well Screen (feet)
Soil Vapor PID Concentra on with Distance from Biosparge Well Screen - All Probes
23-Sep-15
9-Jan-16
15-Jan-16
22-Jan-16
27-Jan-16
5-Feb-16
12-Feb-16
19-Feb-16
24-Feb-16
27-Apr-16
17-Jun-16
22-Jun-16
29-Jul-16
31-Aug-16
* Concentra ons less than 0.1 ppmare not shown
South North
Biosparge Well Screen
SVM-10
SVM-16
SVM-7
SVM-8
SVM-3
SVM-1
SVM-6
SVM-15
SVM-5
SVM-14SVM-13
SVM-12
SVM-11

SCO684731.PM.01 norwalk_fig20.ai 4/17
Figure 20
Distribu on of Measurable LNAPL in
Uppermost Groundwater Zone
SFPP Norwalk Pump Sta onNorwalk, California
!A !A
E
E
!A
!A
E
!A
E
E
!A
!A
!A!A
!A
!A !A !A
!A
!A
!A
!A
E
E
!AE
E
E
E!A
!A
!A
!A
!A
E
!A
!A
E E
E
E
E E
E
E E
E
E E
E
E
E
E
!A
!A
!A
!A
!A
E
E
!A
E
E
E
E
!(
E
!A
!(
!(
!(
!(
!(
!A
!A
!(
!(
BS01
CHESHIRE ST
HSLEB
EVA ERI
NR
OHT
EVA E
KAL
RD
AM
SIS
EVA
WR
ON
LB
KLA
DV
CHESHIRE ST
BW-5
GMW-4
GMW-14
GWR-1
MW-15
HL-4
GMW-9
GMW-10
GMW-22
GMW-24
GMW-25
GMW-O-11
GMW-O-12
GMW-O-20
GMW-O-21
GMW-O-23
GWR-3
MW-18(MID)
MW-O-1MW-O-2
MW-SF-1
MW-SF-2
MW-SF-3
MW-SF-4MW-SF-5
MW-SF-6MW-SF-9
MW-SF-10
MW-SF-11 MW-SF-12
MW-SF-13
MW-SF-14MW-SF-15
MW-SF-16
VEW-1
VEW-2
BW-1
BW-2
BW-3
BW-4
BW-6
GMW-1 GMW-3
GMW-11GMW-12
GMW-23
GMW-26
GMW-28
GMW-29 GMW-30
GMW-O-1
GMW-O-2 GMW-O-3
GMW-O-4
GMW-O-5
GMW-O-8
GMW-O-9
GMW-O-10
GMW-O-14
HL-2
HL-3
MW-7
MW-9
MW-12
MW-19(MID)
MW-21 (MID)
PW-1
PW-2
PW-3
PZ-2
PZ-10
GMW-2
PZ-6
GMW-O-4 (MID)
Legend
!AMonitoring well used for sample collection and/or waterlevel measurement
EVapor extraction, groundwater extraction, total fluids, orfree product extraction well used for site remediation
!( Decommissioned Well
Estimated extent of measurable light nonaqueousphase liquid (LNAPL, free product) on groundwater,October 2016; dashed where inferredHorizontal Biosparge Well(dashed line depicts approximate lateralextent of well screen)KMEP Remediation Piping Layout(above ground and below ground)Horizontal Vapor Extraction Well Piping
0 100 200
Feet
$
Imagery Source:Google Earth April 17, 2013.
12/15 0.53
3/16 0.00
4/16 0.00
6/16 0.00
8/16 0.00
10/16 0.00
GMW-30
10/15 3.85
3/16 0.23
4/16 0.21
6/16 0.00
8/16 0.01
10/16 0.01
GMW-O-11
10/15 0.19
3/16 0.00
4/16 0.00
6/16 0.00
8/16 0.00
10/16 0.00
MW-SF-2
10/15 1.94
3/16 0.00
4/16 0.00
6/16 0.06
8/16 0.00
10/16 0.00
GMW-O-20
12/15 4.92
3/16 0.80
4/16 6.49
6/16 0.80
8/16 2.49
10/16 2.30
GMW-O-12
11/15 9.90
3/16 0.03
4/16 0.33
6/16 0.20
8/16 0.00
10/16 0.00
GMW-O-21
12/15 1.86
3/16 0.63
4/16 0.49
6/16 0.40
8/16 0.00
10/16 0.08
MW-O-2
12/15 0.52
3/16 0.00
4/16 0.02
6/16 0.00
8/16 0.00
10/16 0.00
MW-SF-15
12/15 0.69
3/16 0.00
4/16 0.00
6/16 0.00
8/16 0.00
10/16 0.00
MW-SF-4
10/15 1.94
3/16 0.00
4/16 0.00
6/16 0.06
8/16 0.00
10/16 0.00
MW-SF-12
10/15 0.02
3/16 0.00
4/16 0.00
6/16 0.00
8/16 0.00
10/16 0.00
GMW-25
10/15 1.18
3/16 2.12
4/16 3.09
6/16 0.00
8/16 ---
10/16 0.00
GMW-22
10/15 1.94
3/16 1.05
4/16 1.60
6/16 0.00
8/16 0.89
10/16 1.45
GMW-10
10/15 0.24
3/16 0.00
4/16 0.00
6/16 0.00
8/16 0.00
10/16 0.00
GMW-9
10/15 1.33
3/16 0.00
4/16 0.00
6/16 0.00
8/16 0.00
10/16 0.05
GWR-3
10/15 2.36
3/16 0.00
4/16 0.00
6/16 0.00
8/16 0.00
10/16 0.00
GMW-23
10/15 2.04
3/16 0.00
4/16 0.00
6/16 0.00
8/16 0.00
10/16 0.00
MW-SF-11
12/15 0.68
3/16 0.00
4/16 1.40
6/16 3.32
8/16 0.51
10/16 0.25
GMW-29
10/15 2.36
3/16 0.00
4/16 0.00
6/16 0.00
8/16 0.00
10/16 0.00
GMW-O-23
12/15 8.11
3/16 0.00
4/16 0.00
6/16 0.00
8/16 0.00
10/16 0.00
MW-SF-13
12/15 0.45
3/16 0.00
4/16 0.00
6/16 0.00
8/16 ---
10/16 ---
MW-SF-9
12/15 0.52
3/16 0.00
4/16 0.02
6/16 0.00
8/16 0.00
10/16 0.00
MW-SF-15
Measured LNAPL thickness in feet for sixmost recent gauging events.